Article

Characterization of Dislocation Rearrangement in FCC Metals during Work Hardening Using X-ray Diffraction Line-Profile Analysis

1
Graduate School of Science and Engineering, Ibaraki University, 4-12-1 Nakanarusawa, Hitachi, Ibaraki 316-8511, Japan
2
Central Research Institute, Mitsubishi Materials Corporation, 7-147 Shimoishido, Kitamoto, Saitama 364-0028, Japan
3
Frontier Research Center for Applied Atomic Sciences, Ibaraki University, 162-1 Shirakata, Tokai, Ibaraki 319-1106, Japan
4
Micro System Integration Center, Tohoku University, 2-1-1 Katahira, Sendai, Miyagi 980-8577, Japan
*
Author to whom correspondence should be addressed.
Quantum Beam Sci. 2020, 4(4), 36; https://0-doi-org.brum.beds.ac.uk/10.3390/qubs4040036
Submission received: 14 September 2020 / Revised: 9 October 2020 / Accepted: 9 October 2020 / Published: 11 October 2020
(This article belongs to the Special Issue Analysis of Strain, Stress and Texture with Quantum Beams)

Abstract

:
Multiplication and rearrangement of dislocations in face-centered cubic (FCC) metals during tensile deformation are affected by grain size, stacking fault energy (SFE), and solute elements. X-ray diffraction (XRD) line-profile analysis can evaluate the dislocation density ( ρ ) and dislocation arrangement (M) from the strength of the interaction between dislocations. However, the relationship between M and ρ has not been thoroughly addressed. In this study, multiplication and rearrangement of dislocations in FCC metals during tensile deformation was evaluated by XRD line-profile analysis. Furthermore, the effects of grain size, SFE, and solute elements on the extent of dislocation rearrangement were evaluated with varying M values during tensile deformation. M decreased as the dislocation density increased. By contrast, grain size and SFE did not exhibit a significant influence on the obtained M values. The influence of solute species and concentration of solute elements on M changes were also determined. In addition, the relationship between dislocation substructures and M for tensile deformed metals were also explained. Dislocations were loosely distributed at M > 1, and cell walls gradually formed by gathering dislocations at M < 1. While cell walls became thicker with decreasing M in metals with low stacking fault energy, thin cell walls with high dislocation density formed for an M value of 0.3 in metals with high stacking fault energy.

Graphical Abstract

1. Introduction

The extent of dislocation rearrangement during plastic deformation in face-centered cubic (FCC) metallic materials is affected by stacking fault energy (SFE) and solute elements interaction [1,2,3]. Shockley partial dislocations in FCC metals occurring at low SFE can suppress cross slips, and solute atoms can reduce dislocation rearrangement, resulting in the formation of different dislocation substructures. Therefore, characterization of the dislocation motion and substructure formation is one of the fundamental steps to understand the role of microstructures on the mechanical properties of metallic materials. Transmission electron microscopy (TEM) is generally used to observe dislocations [3,4,5]. The distribution and morphology of dislocations can be directly observed using TEM. However, since the observation area of TEM is localized, the quantitative analysis of dislocation parameters, such as dislocation density and dislocation arrangement, may be difficult. Thus, discussion on the influence of SFE and solid solution elements on the dislocation variables is frequently derived qualitatively.
Dislocation density ρ can be evaluated using X-ray diffraction (XRD) line-profile analysis [6,7,8,9,10,11,12,13]. Line broadening of Bragg diffraction peaks occurs due to the multiplication of dislocations and refinement of the crystallite. Recently, a modified line-profile-analysis method that corrects the elastic anisotropy of crystal orientation has been proposed, and the accuracy of the dislocation density calculations has been enhanced. The radius of the strain field of dislocations, Re, can also be analyzed using the modified method [10,11,12,13]. The strength of the interaction between dislocations can be expressed by defining the dislocation arrangement parameter, M, as follows: M = R e ρ . When M > 1, the interaction between dislocations is weak. By contrast, M < 1 indicates a stronger interaction between dislocations.
Typically, the interaction between dislocations becomes stronger during plastic deformation to reduce the elastic strain energy of dislocations per unit length, as given by:
E = μ b 2 4 π u ln ( R e r 0 ) ,
where μ is the stiffness, b is the size of Burgers vector, and r 0 is the radius of the dislocation core, and u is a constant depending on the dislocation character. The elastic strain energy decreases as Re decreases by forming dislocation dipoles, tangles, and cell structures. Therefore, the dislocation states and substructures can be deduced from the value of M, which comprise Re.
In this study, the multiplication and rearrangement of dislocations in FCC metals during tensile deformation was evaluated using XRD line-profile analysis. The effect of grain size, SFE, and solute elements on the extent of dislocation rearrangement was evaluated by variations in M during tensile deformation. In addition, the relationship between M variables and dislocation substructures was investigated.

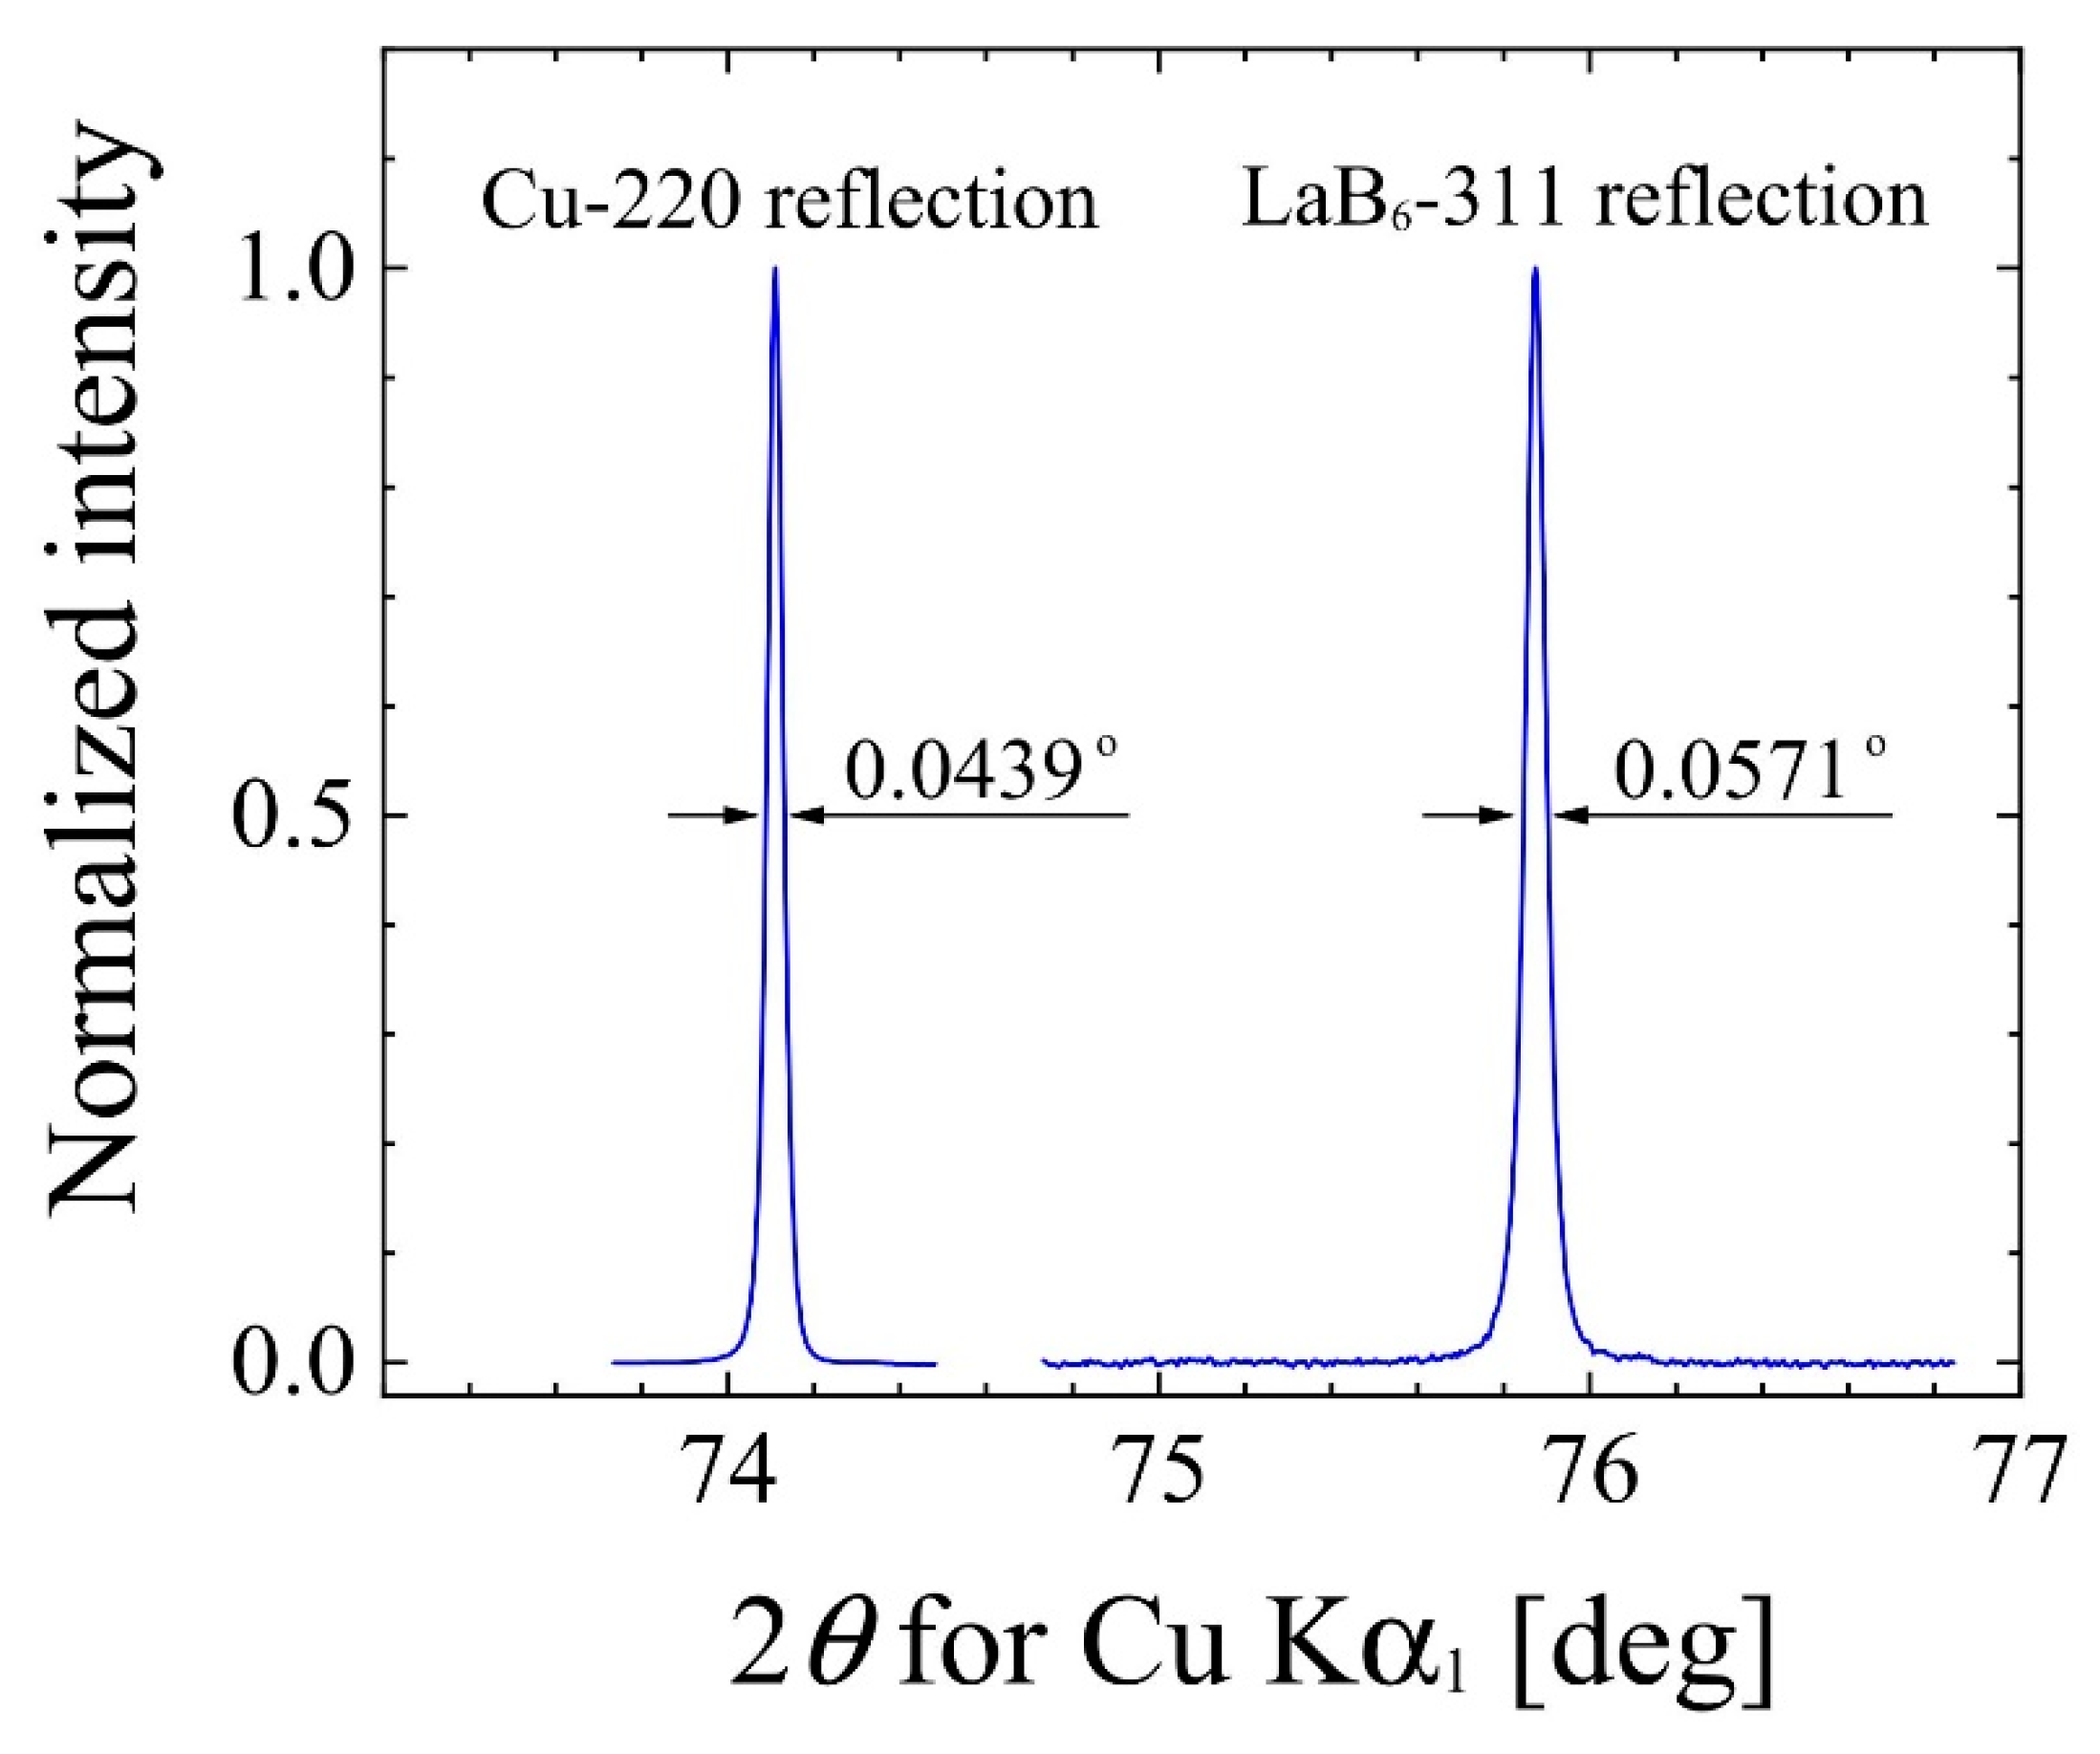
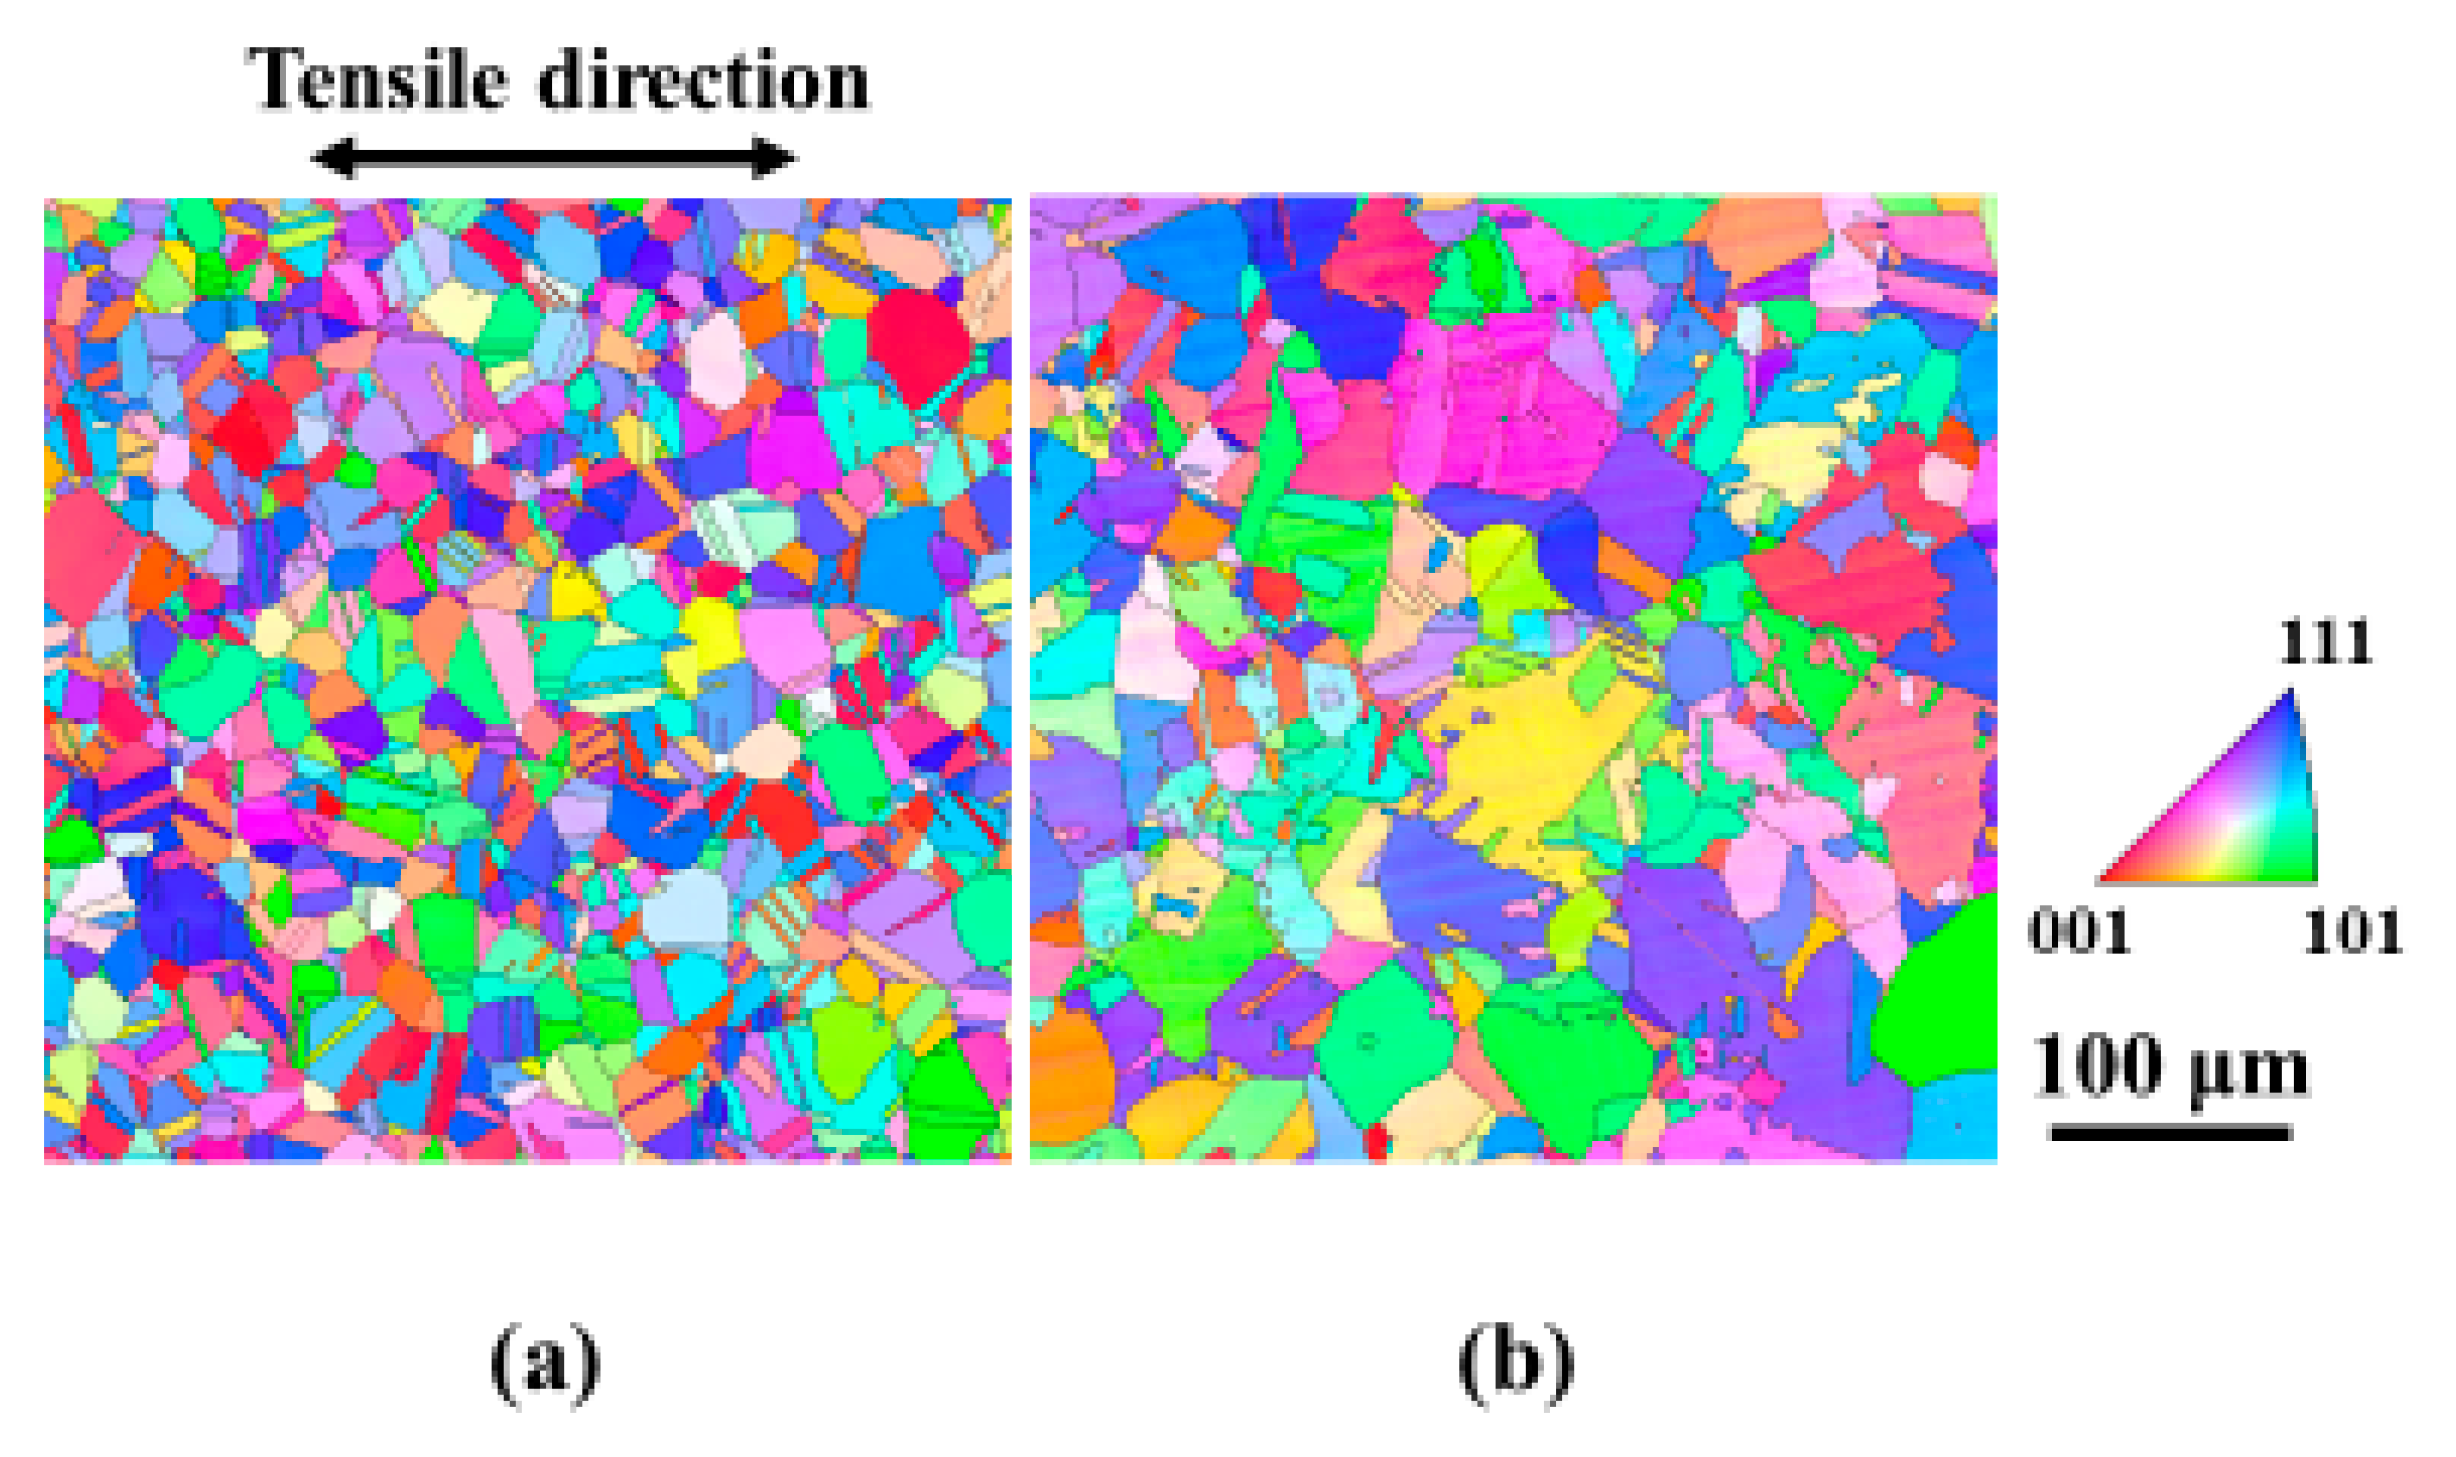
2. Materials and Methods

The dislocation character of fully recrystallized FCC metals comprising nickel, copper, copper–zinc alloys, and austenitic stainless steel was determined via X-ray diffraction line-profile analysis. The sheet specimens (0.4–0.7 mm in thickness) were deformed via tensile testing. The gauge of the tensile specimens was 3.0 mm in width and 20 mm in length, and the tensile tests were performed at a strain rate of 4.2 × 10⁻⁴ s−1 at room temperature.
XRD was conducted on tensile-deformed specimens using Cu Kα1 radiation, which was monochromatic (Johansson monochromator). Generally, an instrumental broadening correction was made using the diffraction pattern of LaB6 powder (NIST SRM 660 series) or fully recrystallized metals [14,15]. According to the certificate of SRM 660 series, the diffraction peaks of SRM 660 are slightly broadened due to the domain size of approximately 0.7 μm. While the full width at half maximum (FWHM) of the 220 reflection of a fully recrystallized copper was 0.0439° for Cu Kα1, the 311 reflection of the LaB6 powder (SRM 660b), which appeared near the 220 reflection of copper, exhibited a larger FWHM of 0.0571°, as shown in Figure 1. To avoid the effect of the domain size on the line-profile broadening, the diffraction pattern of the fully recrystallized copper was used for the standard line profile.
The convolutional multiple whole profile (CMWP) method [16,17] was used for line-profile analysis. A theoretical line profile, which is a product of the convolution of lattice strain broadening, crystallite-size broadening, and instrumental broadening, was fitted to the experimental line profile by the CMWP method. Details of the CMWP method have been previously reported [16]. Figure 2 shows an example of the CMWP fitting, carried out on XRD pattern of the tensile-deformed Cu-30% Zn specimen at a true strain of 0.34. In the CMWP method, the dislocation density and M values were evaluated by fitting the theoretical profile to the X-ray diffraction pattern. Microstructural parameters derived from this analysis are presented in Figure 2. Fitting accuracy was achieved with smaller S ( = R wp / R exp ) less than 3. High intensity of 220 reflection indicates {110}-oriented microstructure. It should be mentioned that in microstructures with texture, there could be slight inhomogeneities in dislocation density and crystallite size depending on the crystal orientation. Therefore, these analytical values can be regarded as the average of grains observed in the diffraction pattern.
It is well known that line broadening in XRD is enhanced with an increase in the dislocation density. However, the relationship between M and the line profile is not evident. To investigate the effect of M on the line profile analysis, the theoretical 220 reflection of Cu at a dislocation density of 2 × 10¹⁵ m−2 was simulated by varying the value of M from 2 to 0.2. As shown in Figure 3a, the FWHM decreased with decreasing M values, and the Gaussian-like peak shifted to a Lorentzian-like peak. Thus, M could be evaluated from the Gaussian width (WG) and the Lorentzian width (WL) by the Voigt function. Figure 3b shows the variations in FWHM and W L / W G as a function of M. A relationship between M and W L / W G was observed. It should be mentioned that M decreased with increasing plastic strain as a result of dislocation rearrangement. Consequently, W L / W G increased with increasing the plastic strain. On the other hand, FWHM increased with increasing the plastic strain as a result of an increase in dislocation density.
The initial microstructure was examined using electron backscatter diffraction (EBSD). EBSD was performed at 15 kV with a beam step size of 1–3 μm on the ND (normal direction) surface of the sheet specimens. TEM was conducted to observe the dislocation substructures at 200 kV using an incident electron beam in the <110> direction.

3. Results and Discussion

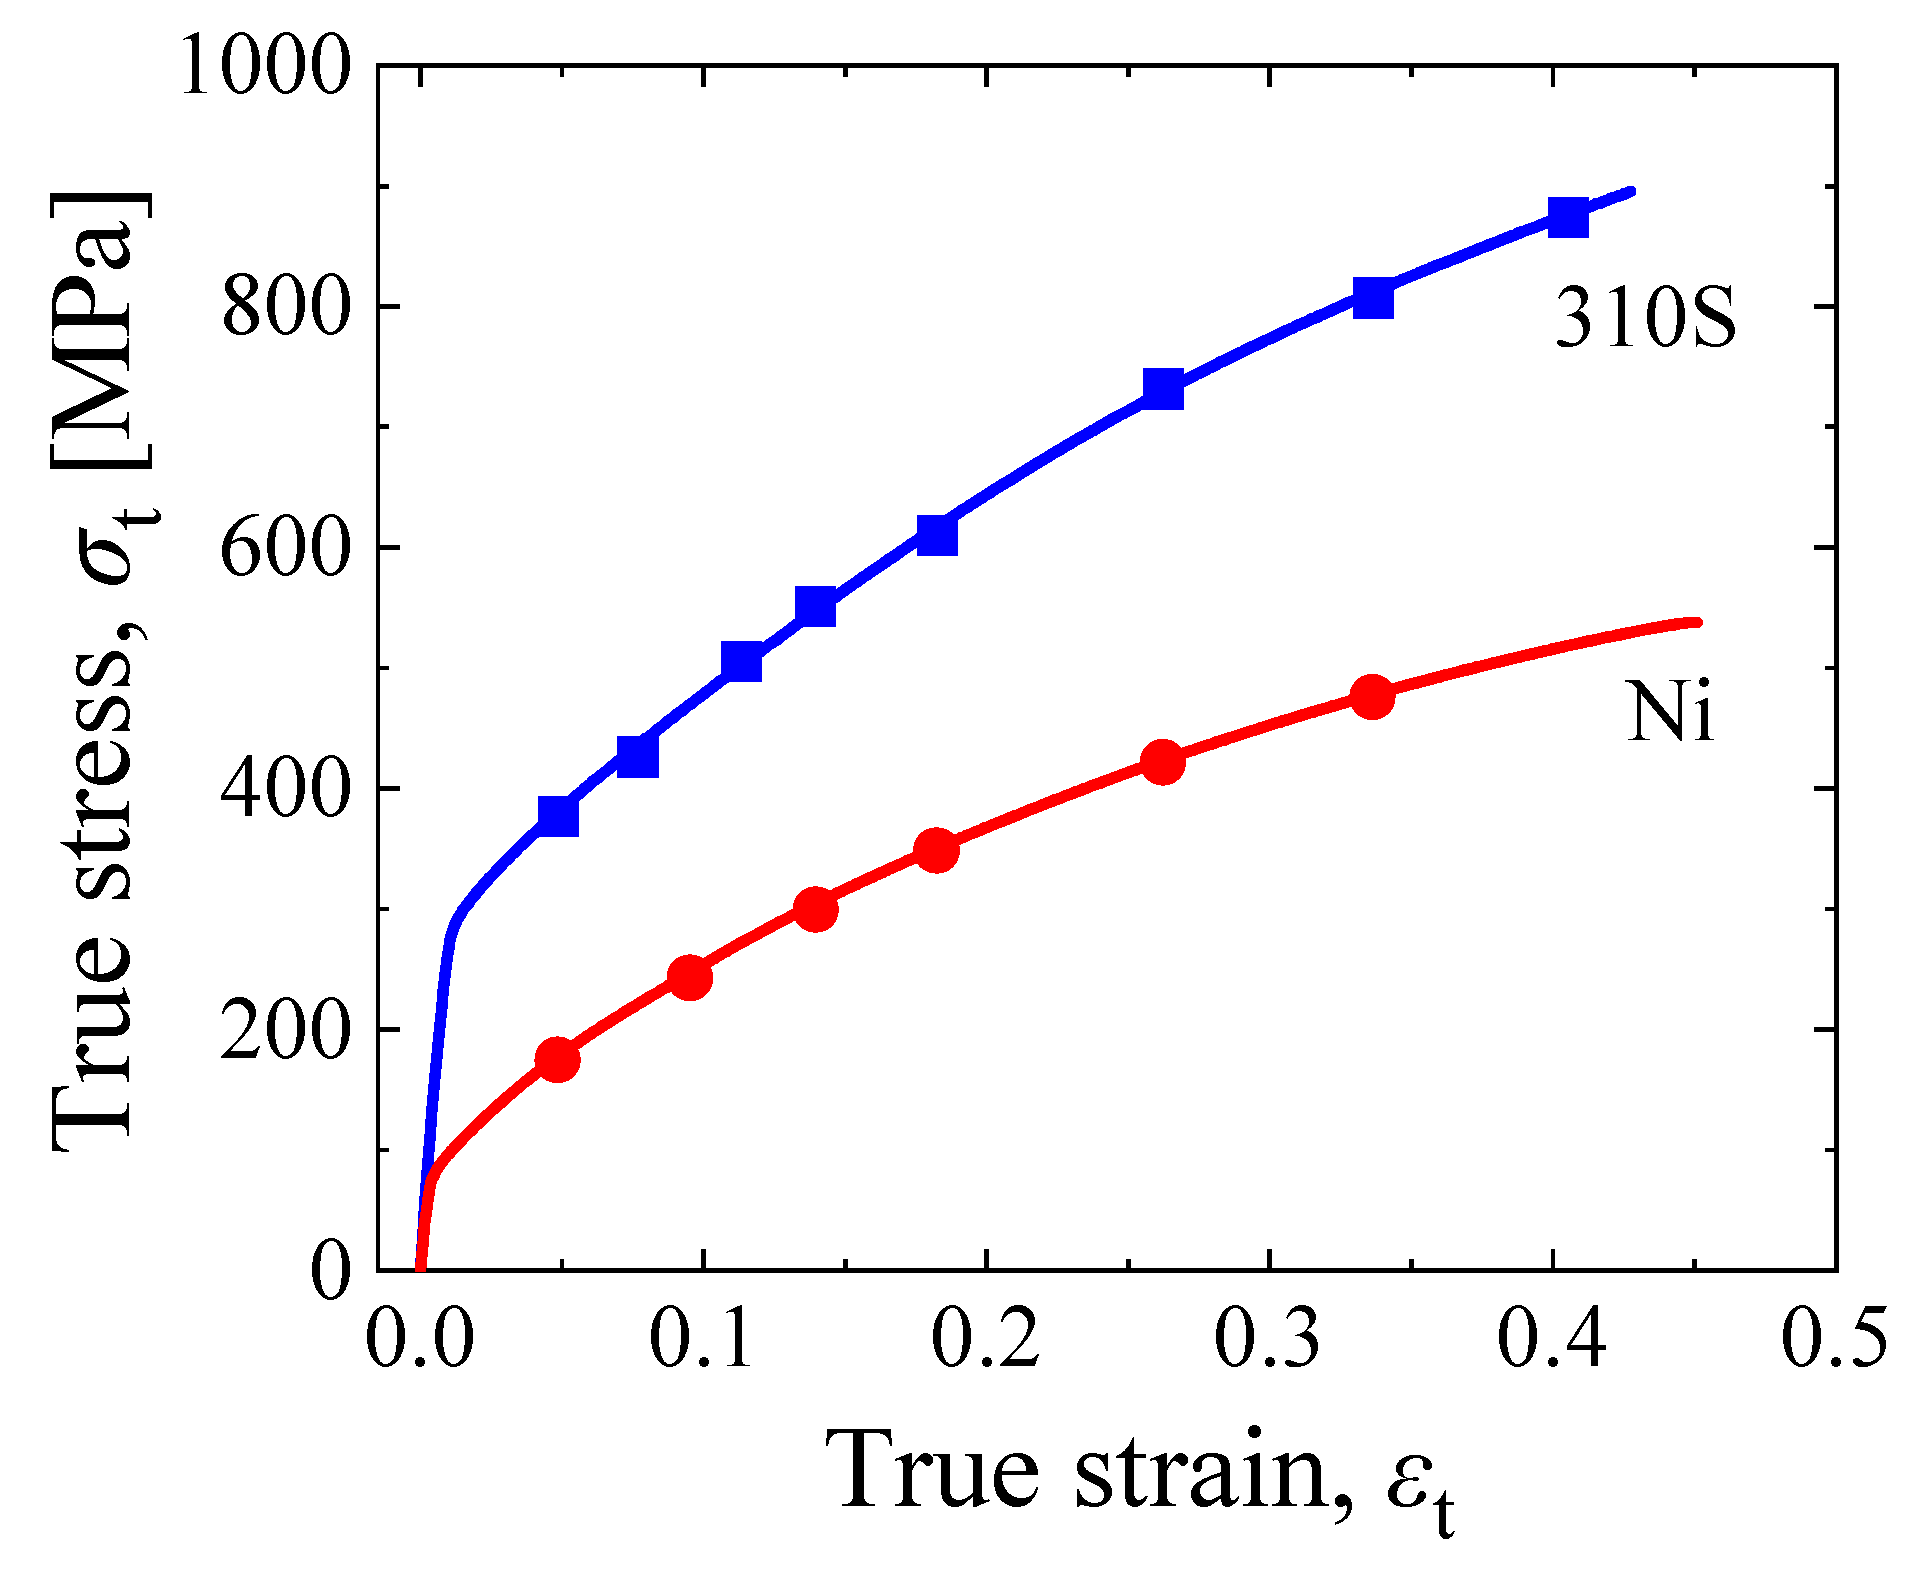
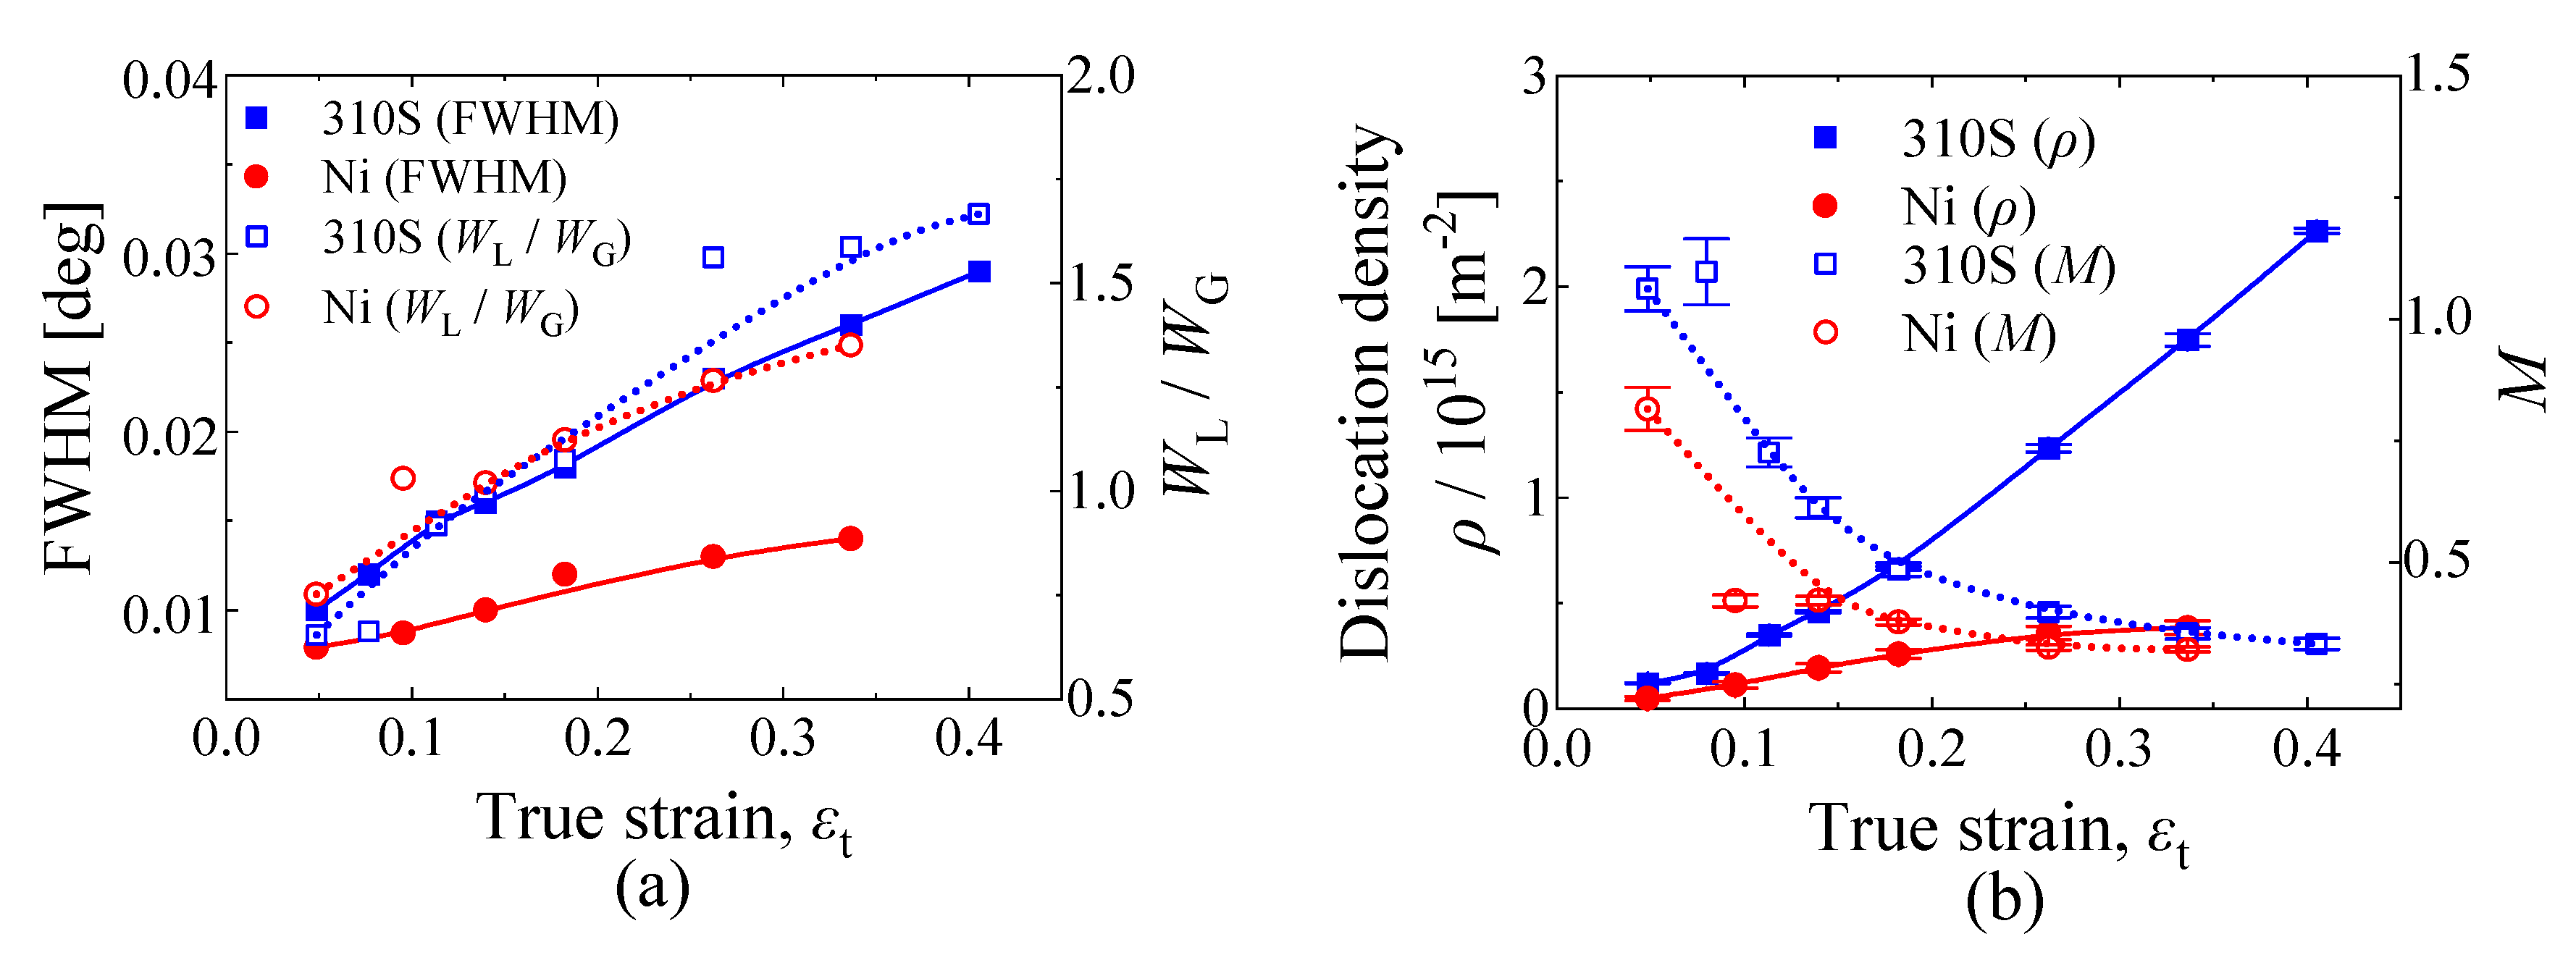
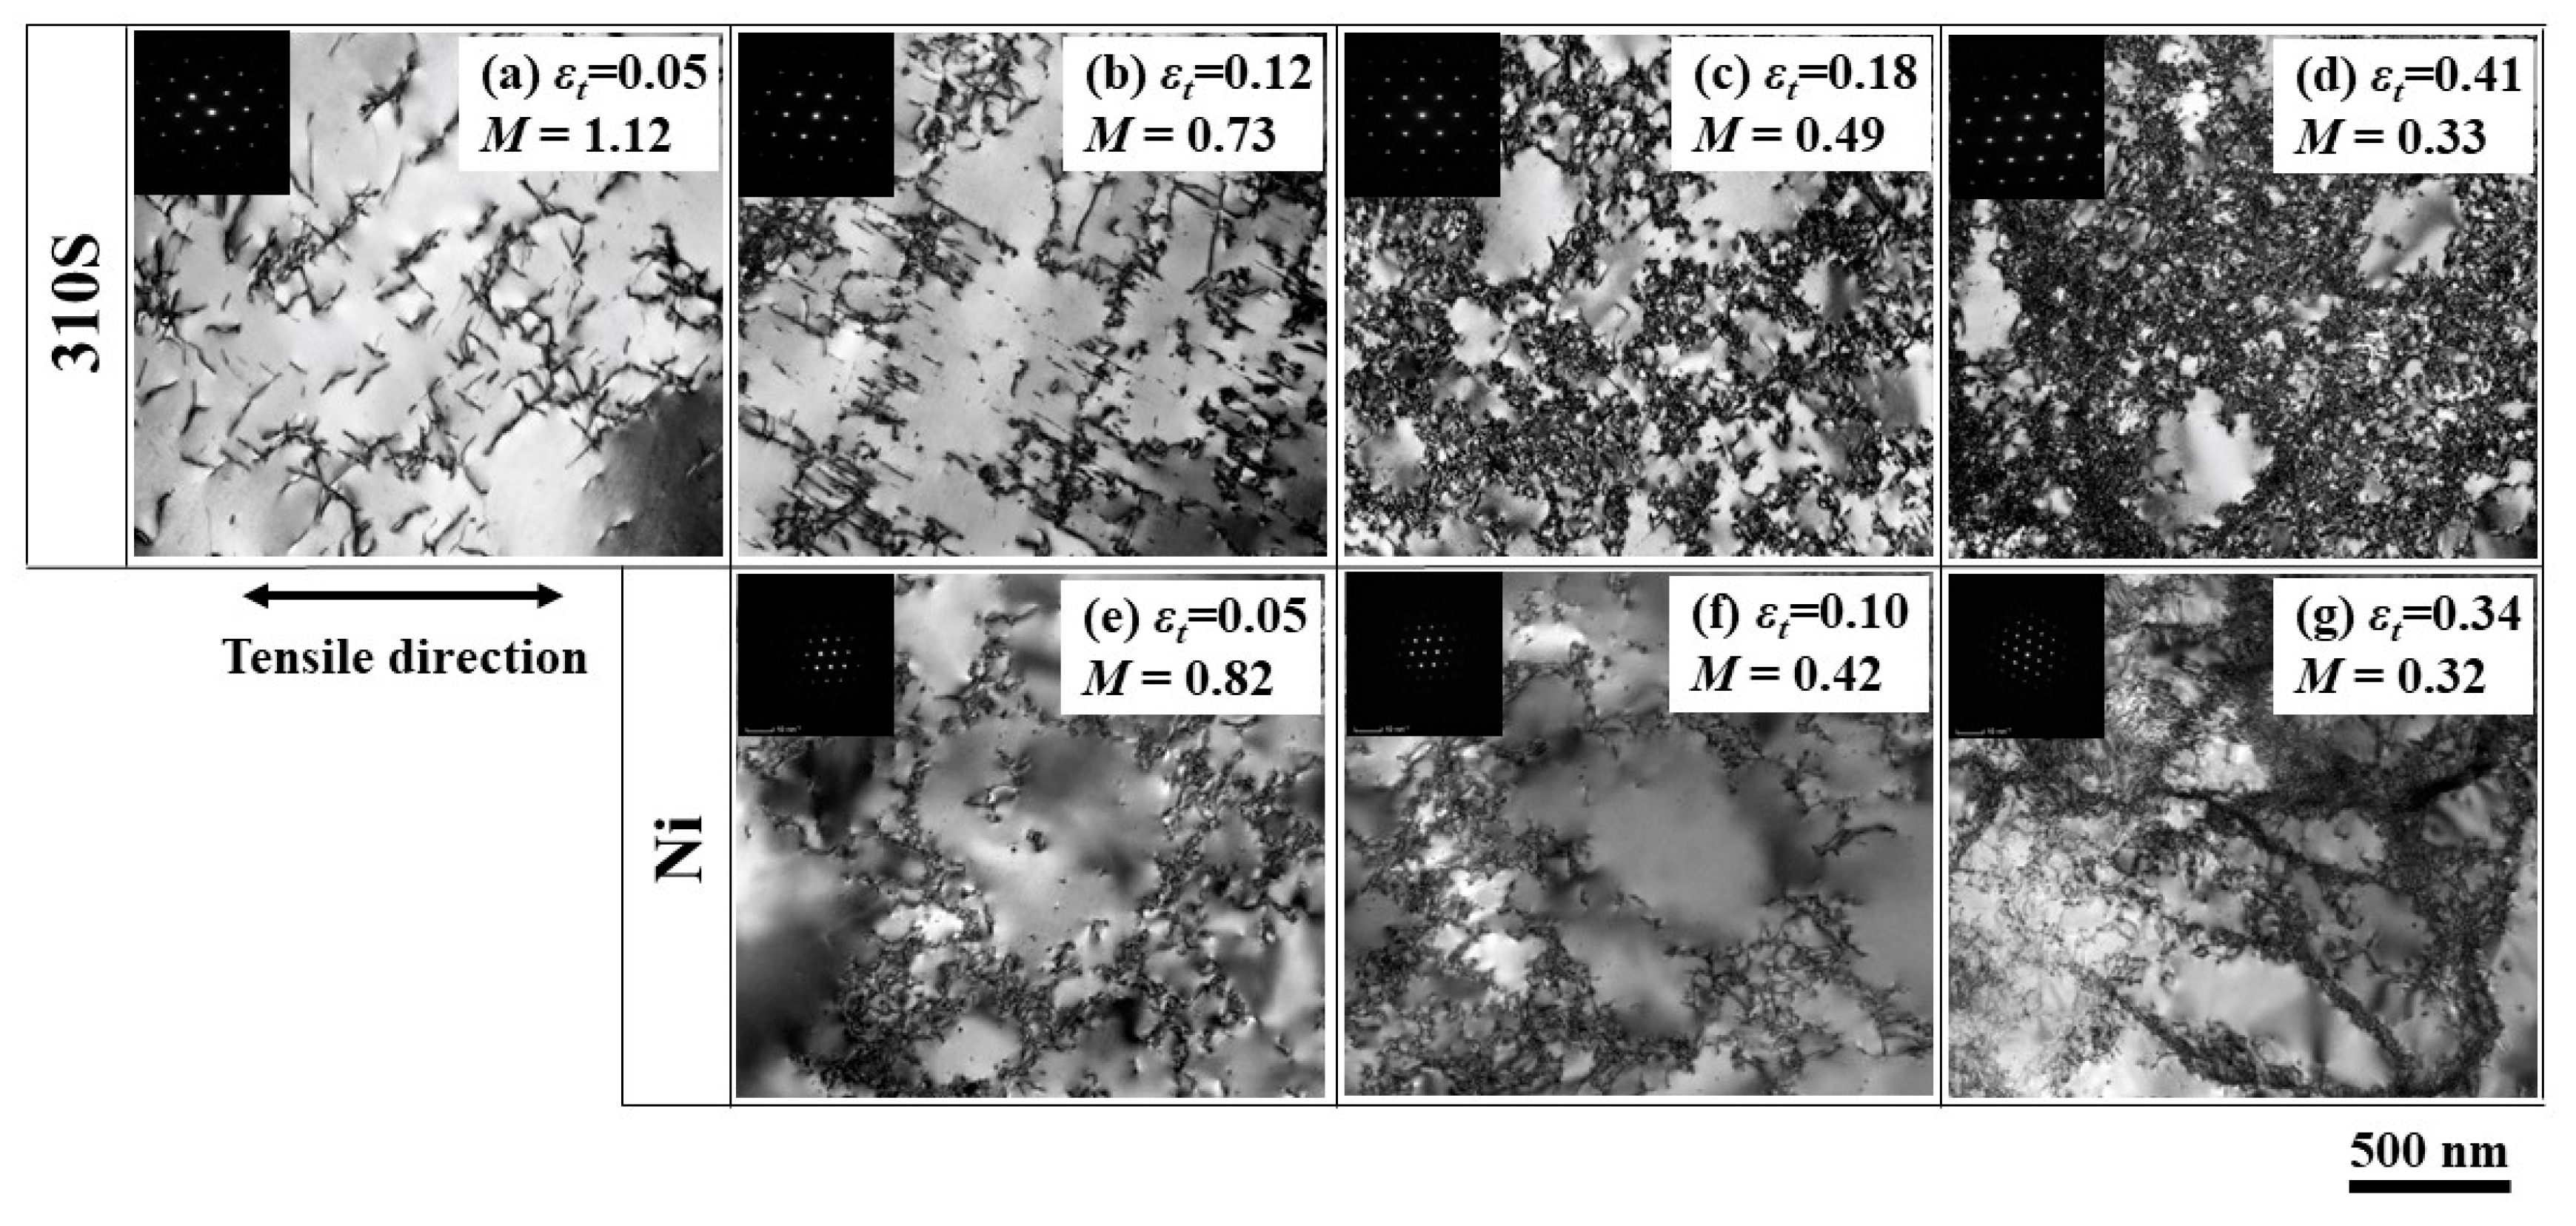
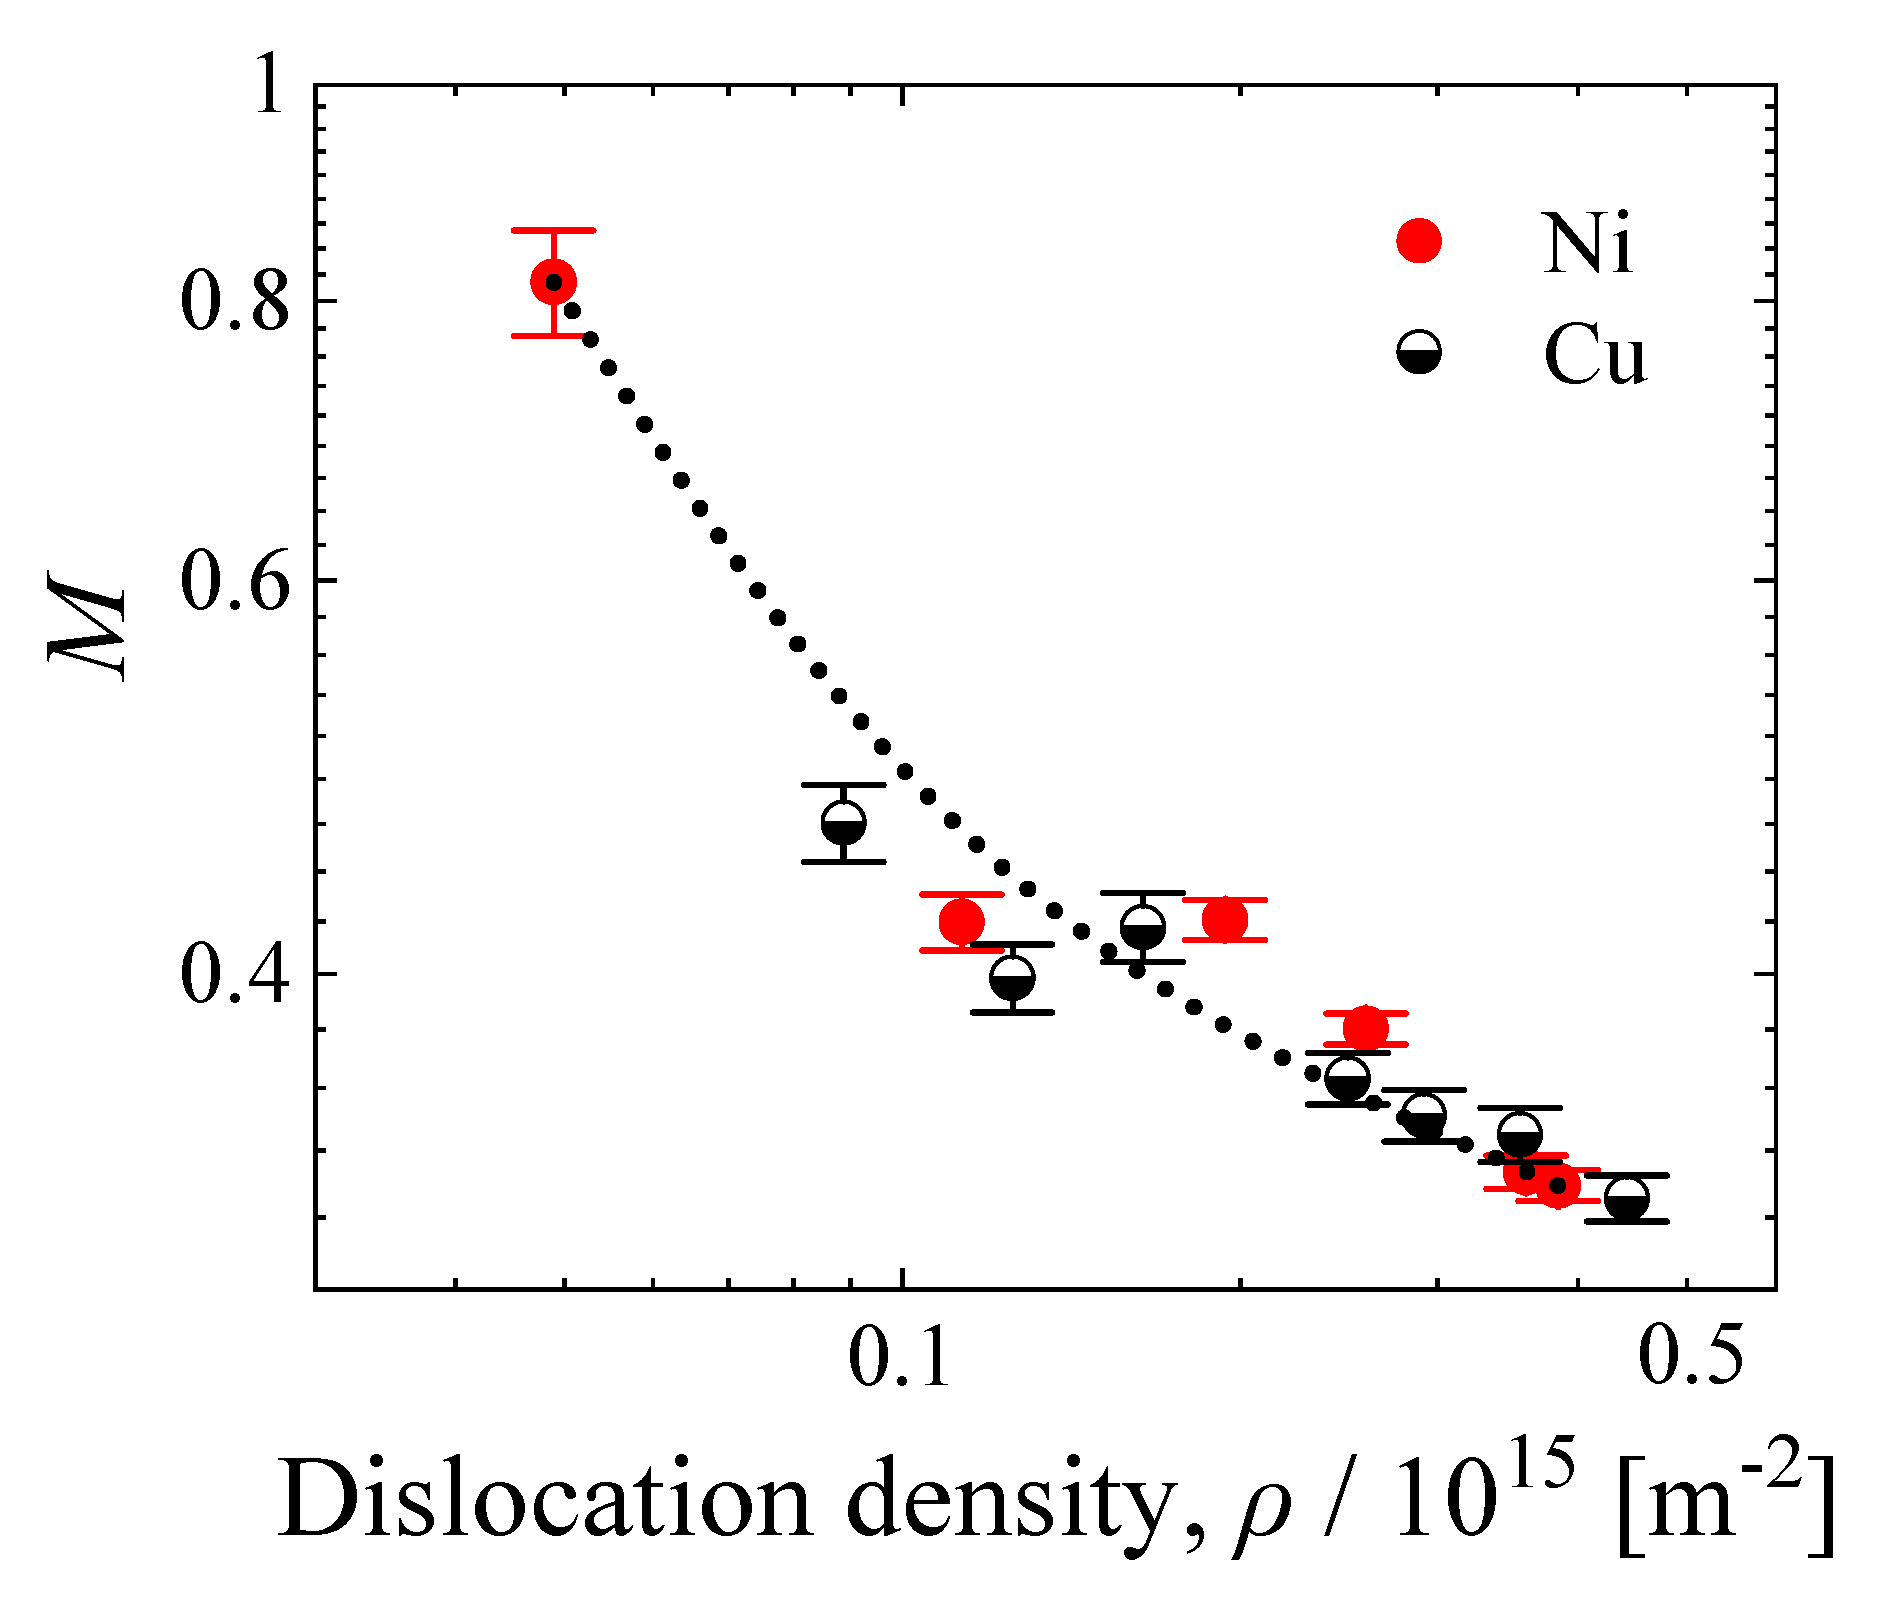
3.1. Variations in M Values during Tensile Deformation in Nickel and AISI 310S Stainless Steel

Pure nickel and AISI 310S stainless steel (Fe-19Ni-25Cr-1Mn-0.7Si-0.046C, in mass%) were used as the test specimens (AISI 310S SS labeled as 310S). The SFE of Ni is approximately 149 mJ/m2 [18] and that of 310S is 86 mJ/m2, which was calculated through the following expression [19]:
SFE (mJ/m2) = −5.3 + 6.2 (%Ni) + 0.7 (%Cr) + 3.2 (%Mn) + 9.3 (%Mo)
Figure 4 shows the grain morphology of each specimen before deformation through inverse pole figure (IPF) maps. The mean grain sizes of 310S and Ni were approximately 20 and 40 μm, respectively. Figure 5 presents the true stress-strain curves of 310S and Ni.
Figure 6a shows the variations of FWHM and W L / W G ratio of 220 reflection of 310S and Ni as a function of true strain. FWHM increased with increasing true strain, which may imply an increase in dislocation density. The increases in FWHM for 310S were larger than those for Ni. In addition, W L / W G also increased with increasing values of true strain. The interaction between dislocations may be enhanced by true strain, resulting in a decrease in M. W L / W G increased with decreasing M, as suggested from Figure 3b. Figure 6b illustrates the changes in dislocation density and M as a function of true strain. Similar to the data presented in Figure 6a, the increase in dislocation density of 310S was significant compared to that of Ni. M decreased at a larger true strain, which was consistent with the variations in W L / W G . This represented an enhancement of the interaction between dislocations. It may be noticed that the M values for 310S were larger than those for Ni.
The evolution at various true strains of the dislocation substructures of 310S and Ni was observed using TEM (Figure 7). The corresponding M values are presented in Figure 7a–g. As shown in Figure 7a, dislocations in 310S were loosely distributed for an M value of 1.12. Cell walls gradually formed by gathering dislocations for an M value of 0.73 (Figure 7b), and they became thicker at smaller M values (Figure 7c,d). Cell walls in Ni also formed at M < 1, and they were thicker at an M value of 0.42. It can be noticed that at M ~0.3, broad cell walls were formed in 310S but were quite sharp in Ni. This may be due to the difference in SFE between Ni and 310S. Thus, the correlation between the dislocation substructures and M may be explained based on the SFE.
The interaction between dislocations can be affected by the distance between them, i.e., by the dislocation density. Considering that the dislocation densities of Ni and 310S differed significantly, their M values were compared as a function of dislocation density (Figure 8). M values for 310S were larger than those for Ni, which may indicate that 310S exhibited relatively weak interaction between dislocations. Smaller M values, indicating suppression in the strain field of dislocations, were caused by the rearrangement of dislocations. Therefore, the larger M values for 310S may have originated from a lower extent of dislocation rearrangement.
310S differed from Ni in grain size, SFE, and solute elements. Grain size influences the fraction of geometrically necessary (GN) dislocations [20,21]. Cross slip is difficult for extended dislocations at low SFE. The size effect of the solute elements could lower the dislocation rearrangement; this may have caused the observed differences between 310S and Ni for the latter parameter. However, it is not evident which of those parameters had a stronger influence on the variation of M values. Therefore, the effect of grain size, SFE, and solute elements on M values was investigated.

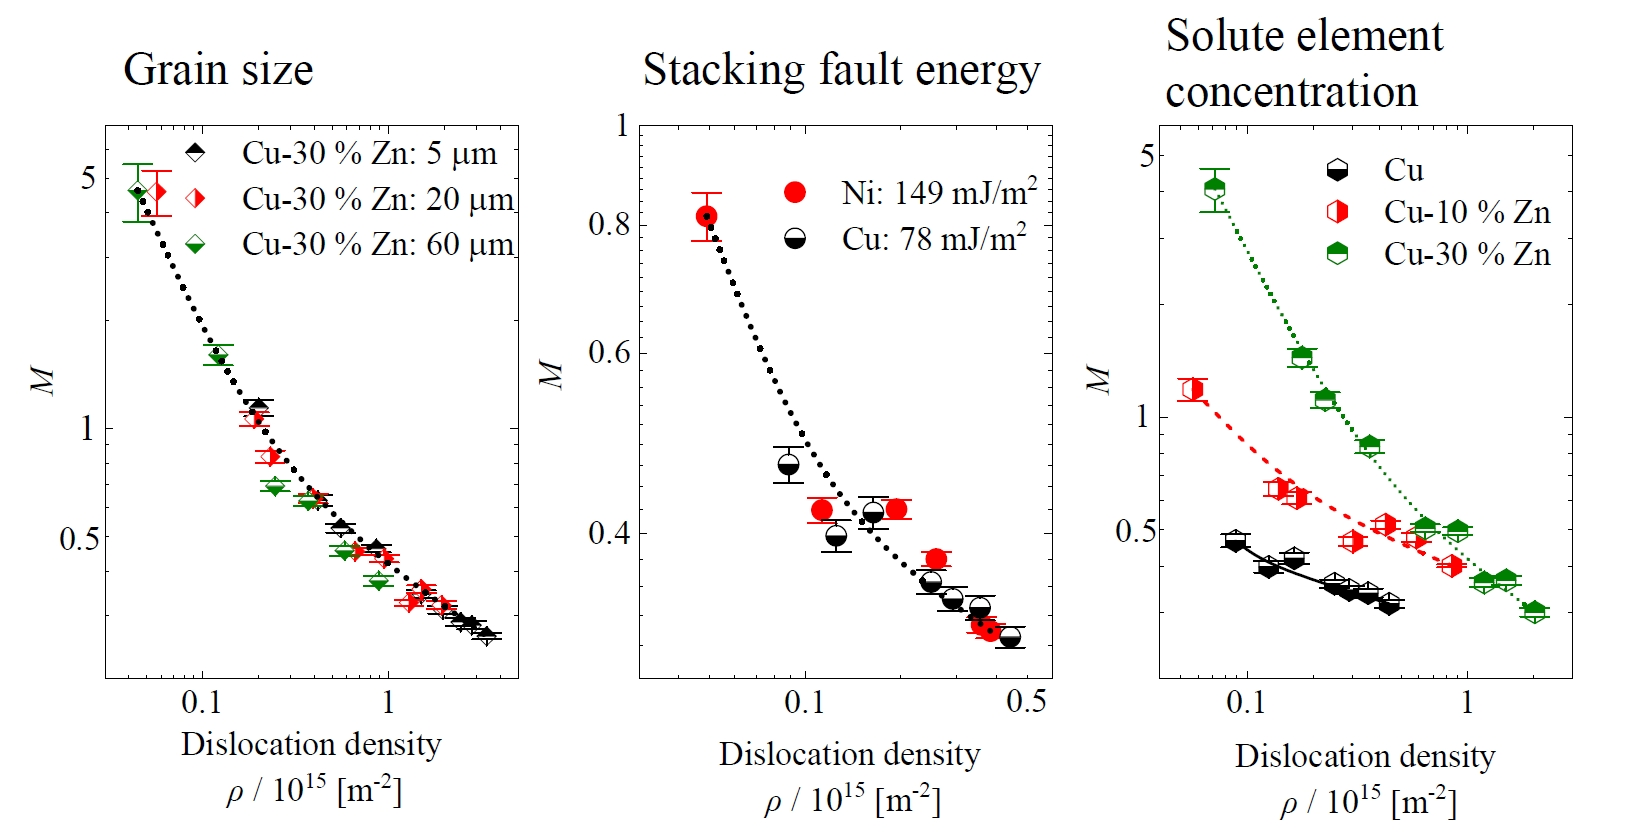
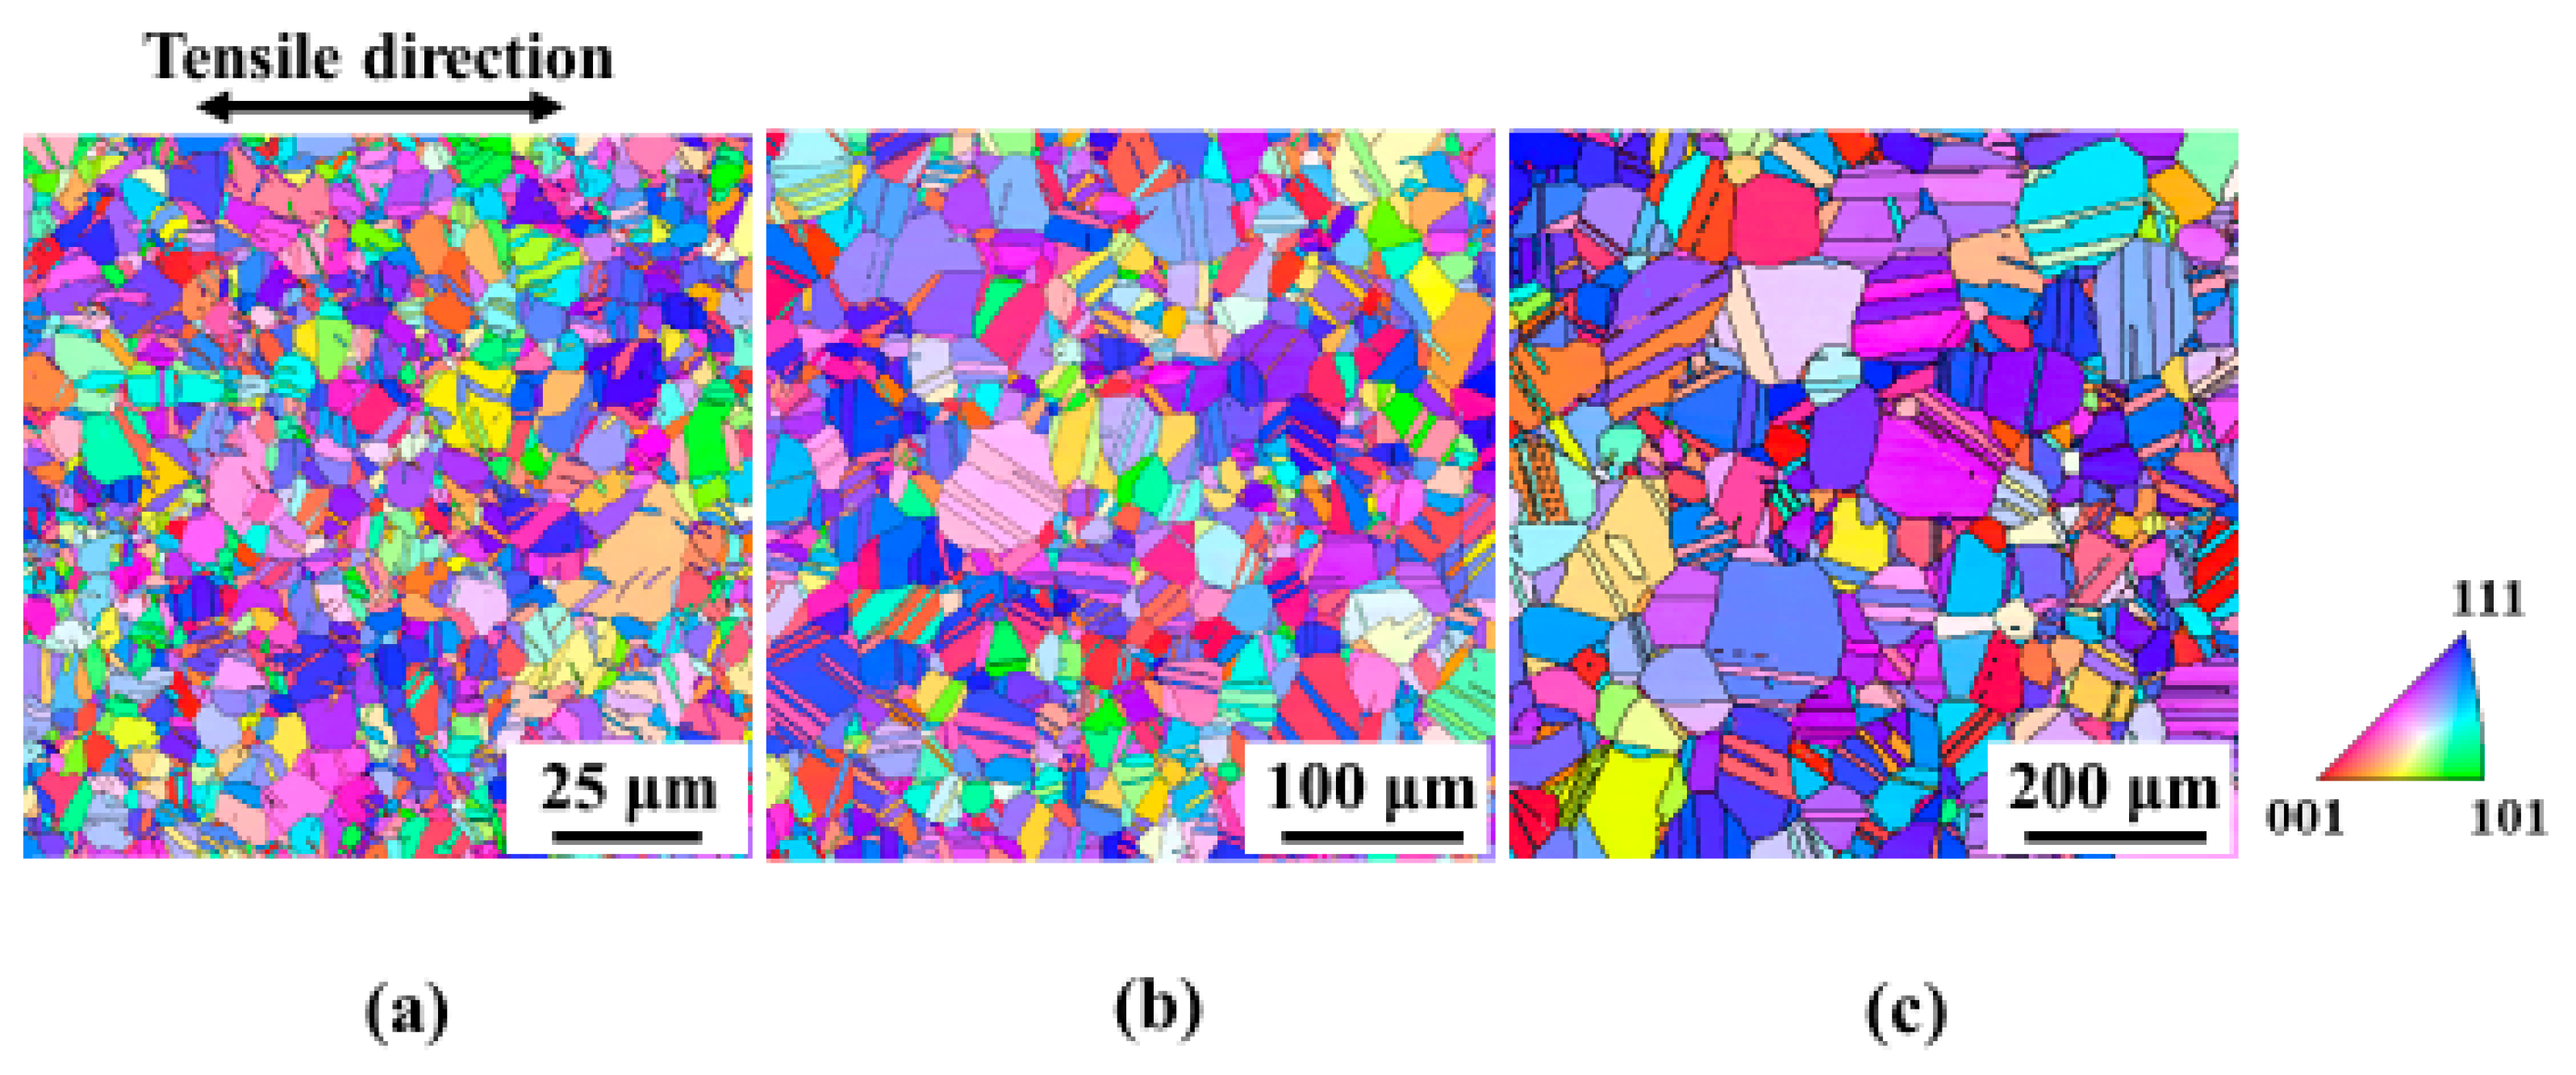
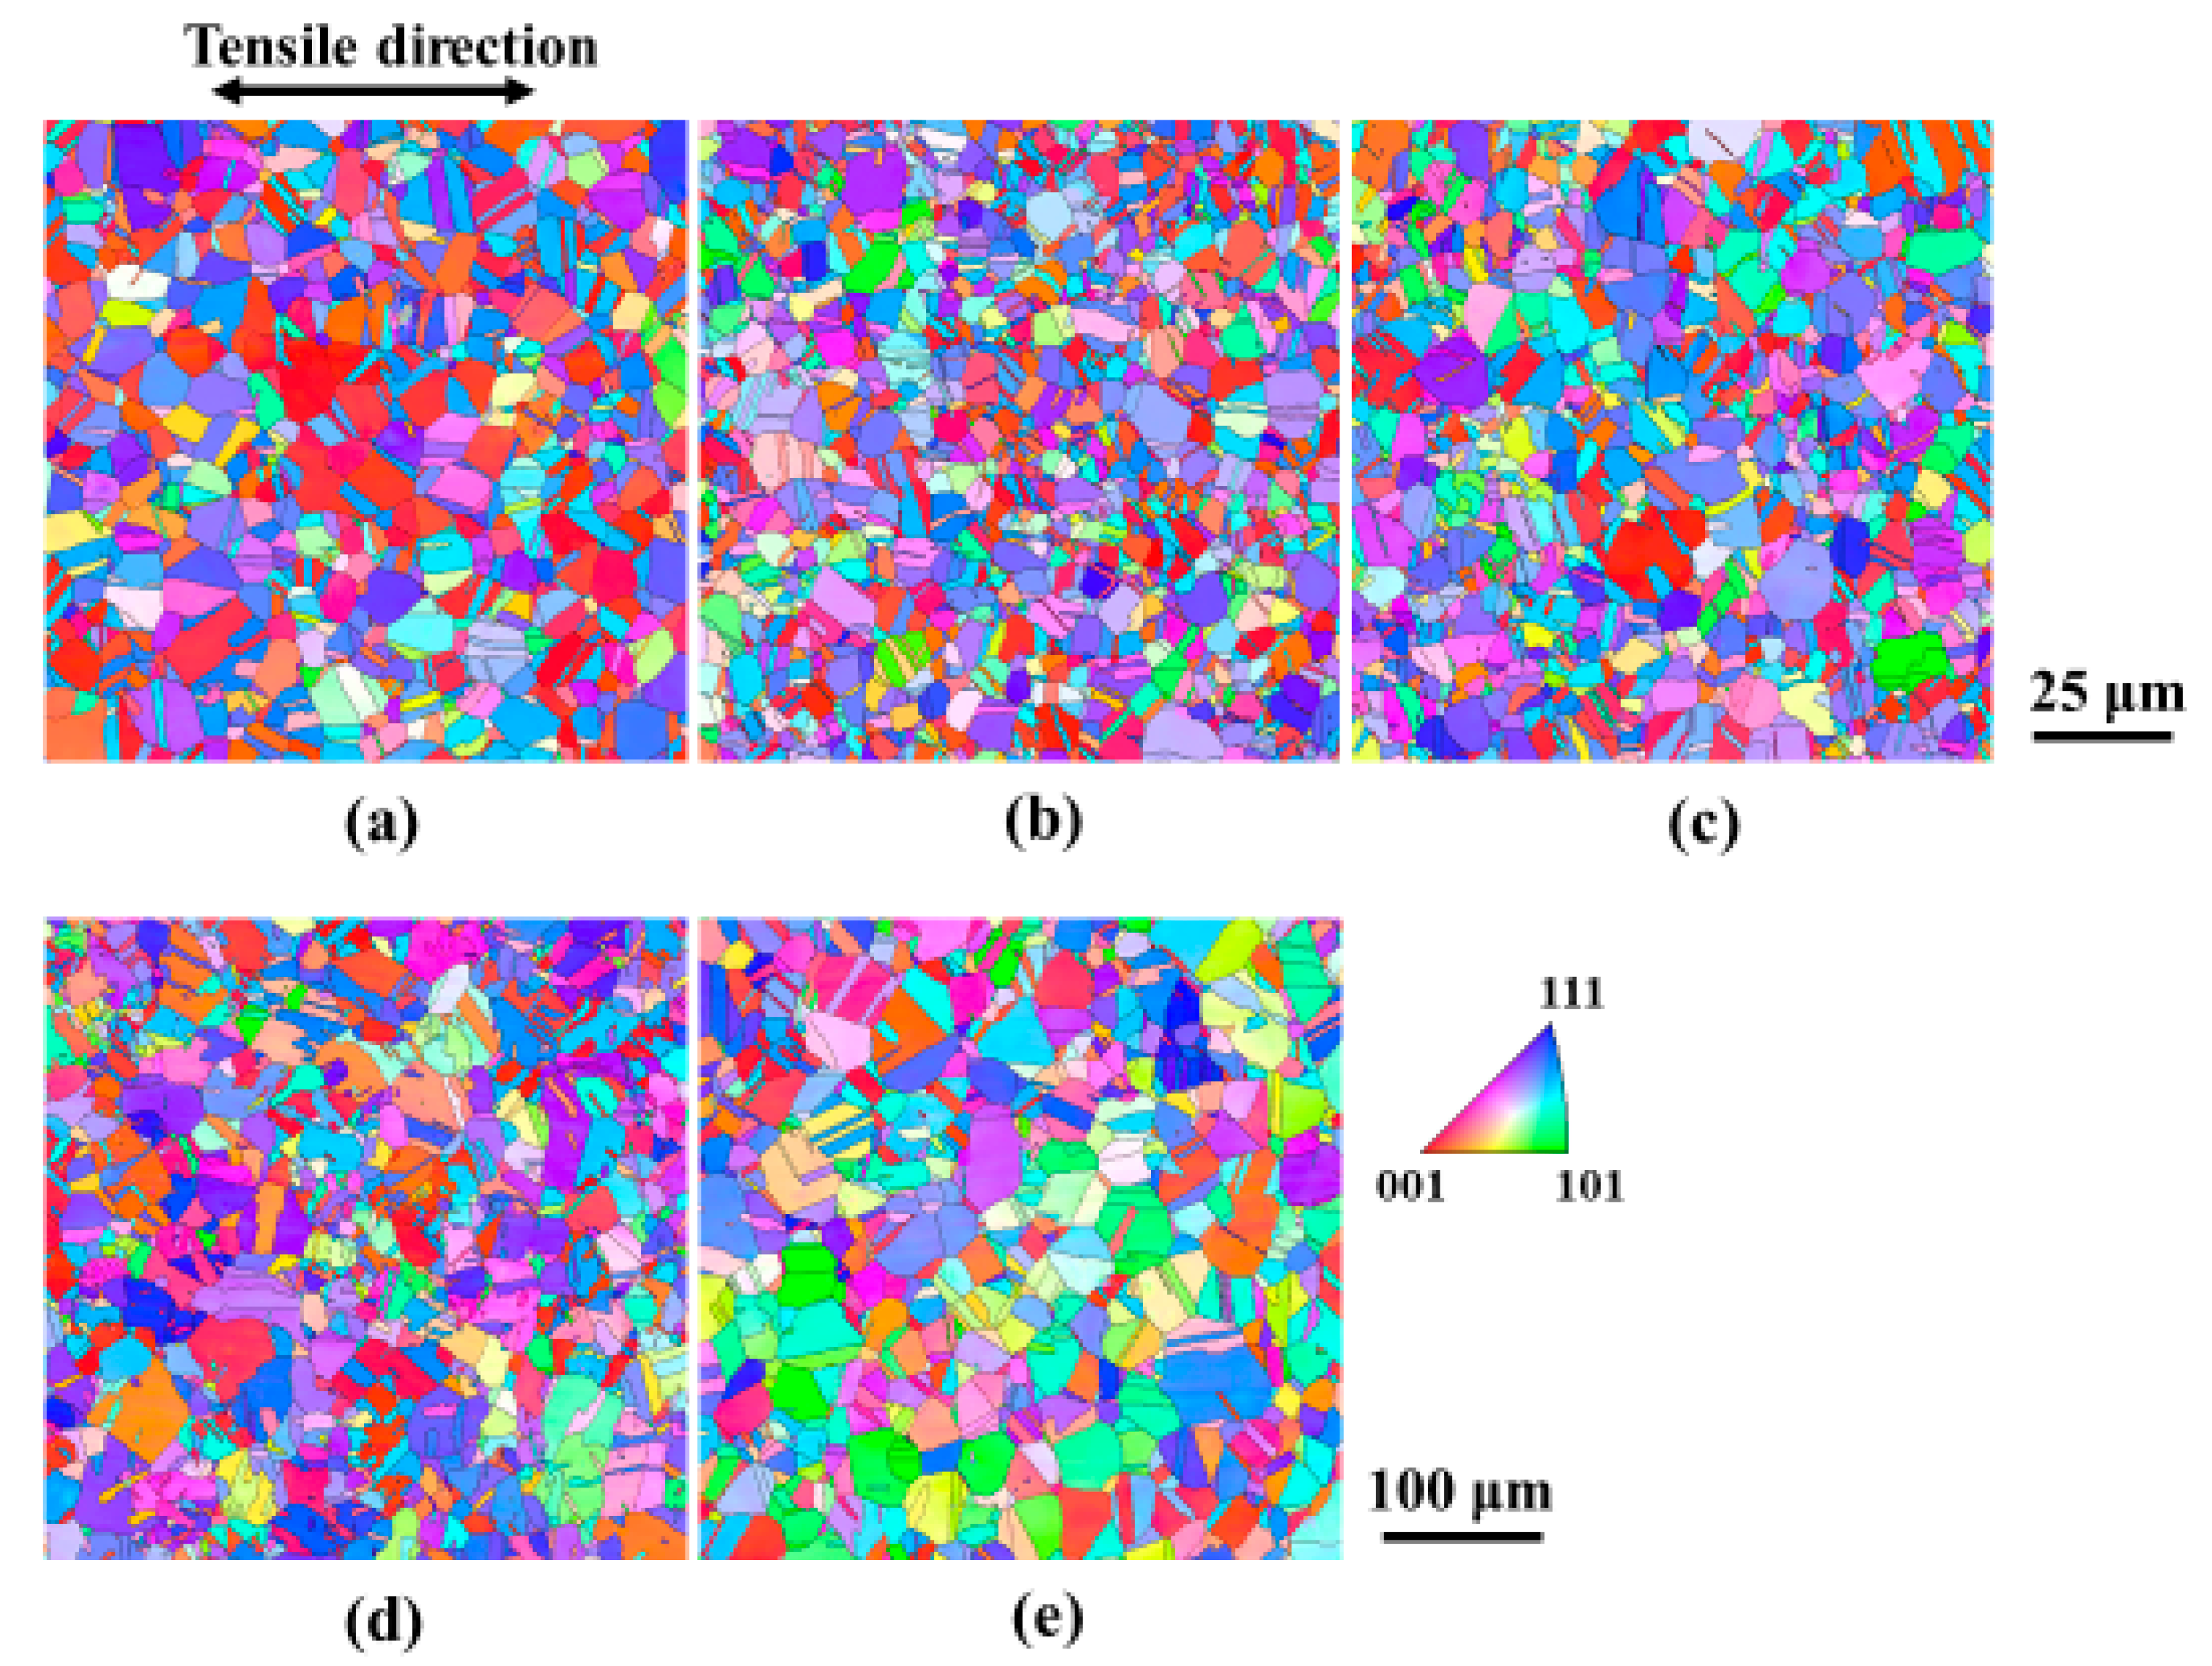
3.2. Effect of Grain Size on M Values

Three Cu-30 mass% Zn specimens with different grain sizes were prepared to investigate the effect of grain size on the extent of dislocation rearrangement during tensile deformation. They were fully recrystallized, and their mean grain sizes were 5, 20, and 60 μm (specimens denoted as Cu-30Zn_5, Cu-30Zn_20, and Cu-30Zn_60, respectively). Figure 9 shows the IPF maps of the alloy specimens before deformation. True stress–strain curves of the Cu-30Zn specimens [22] are presented in Figure 10. It can be observed that the yield stress increased with a decrease in the grain size based on the Hall–Petch relationship [23].
Figure 11a illustrates the variations of dislocation density and M with respect to true strain [22]. The rate of increase in dislocation density was more significant as the grain size was smaller. Because dislocation density increases to compensate for lattice misfit at the grain boundaries, smaller grains at the grain boundaries accumulate more dislocations. Figure 11b shows the variation in M values as a function of dislocation density. M values decreased on a curve, irrespective of the grain size of the specimen. Thus, it was confirmed that grain size had a negligible influence on the extent of dislocation rearrangement during plastic deformation.

3.3. Effect of SFE on the Variation in M Value

To investigate the effect of SFE on the extent of dislocation rearrangement, recrystallized pure Cu (SFE = 78 mJ/m2 [24]) was tensile deformed, and the variation in the obtained M values was compared with those of Ni (SFE = 149 mJ/m2 [18]) in Figure 8. The mean grain size of the Cu specimen was approximately 20 μm, which is half of that for the Ni specimen. However, the difference in grain size did not influence the dislocation rearrangement, as demonstrated in Section 3.2. Therefore, we may assume that the difference in M values between Ni and Cu specimens only represents the effect of the corresponding SFEs.
Figure 12 shows the variations in the M values of the Ni and Cu specimens with respect to the dislocation density. The M values of Ni and Cu specimens fitted the same curve despite the large difference between their SFEs. Thus, the difference in SFE also had a negligible influence on the extent of dislocation rearrangement.

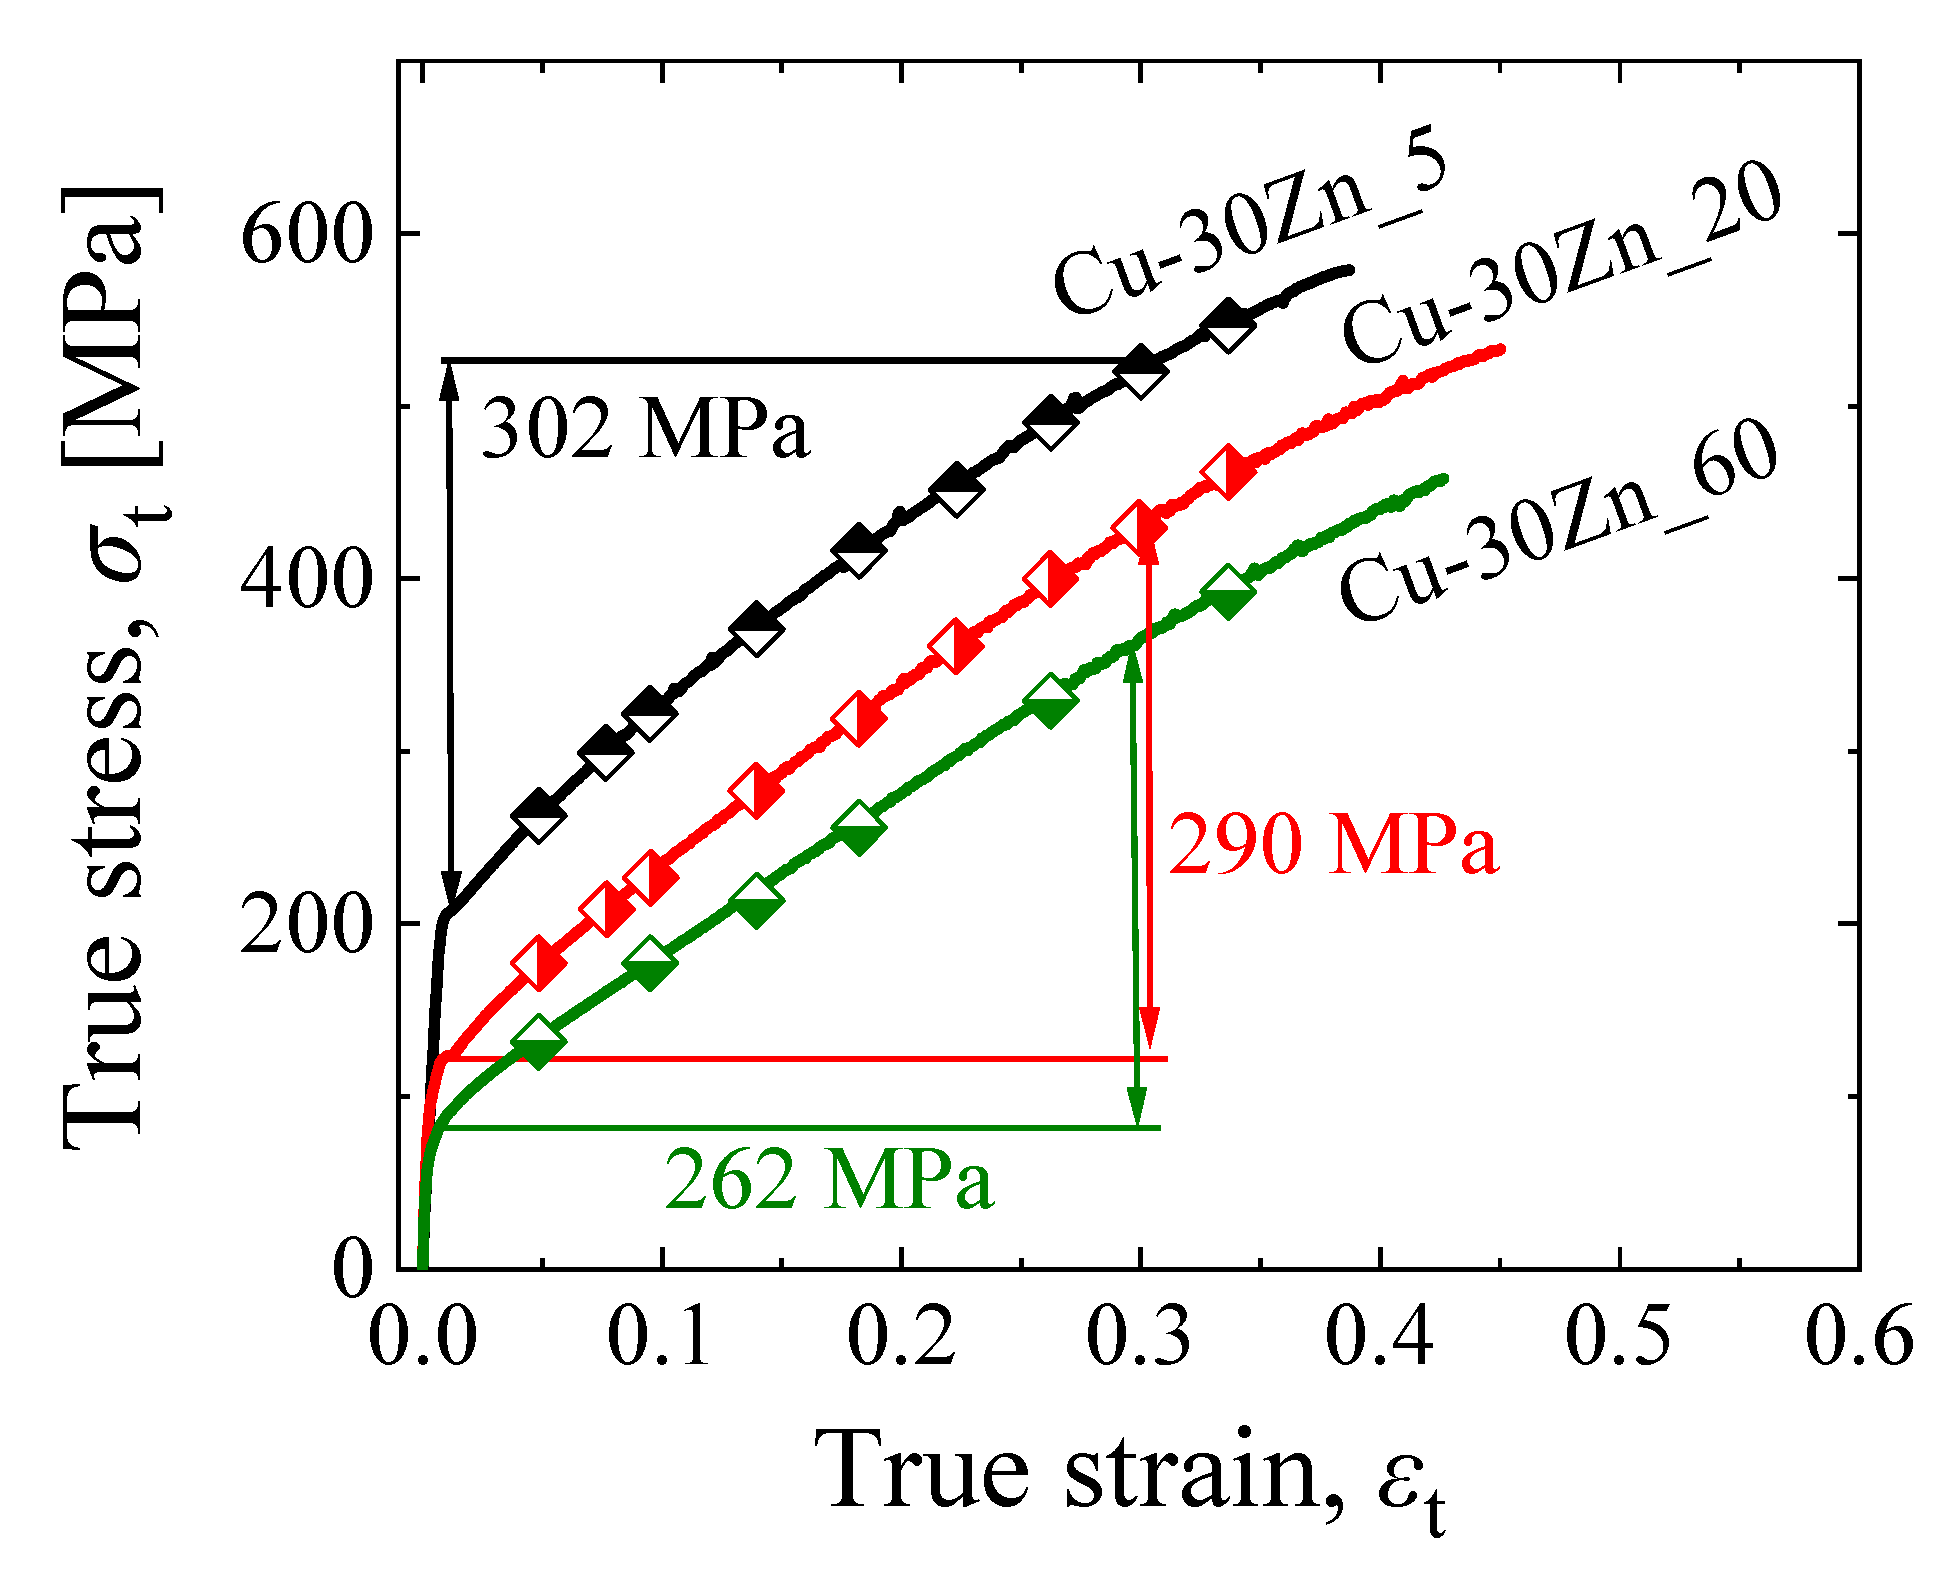
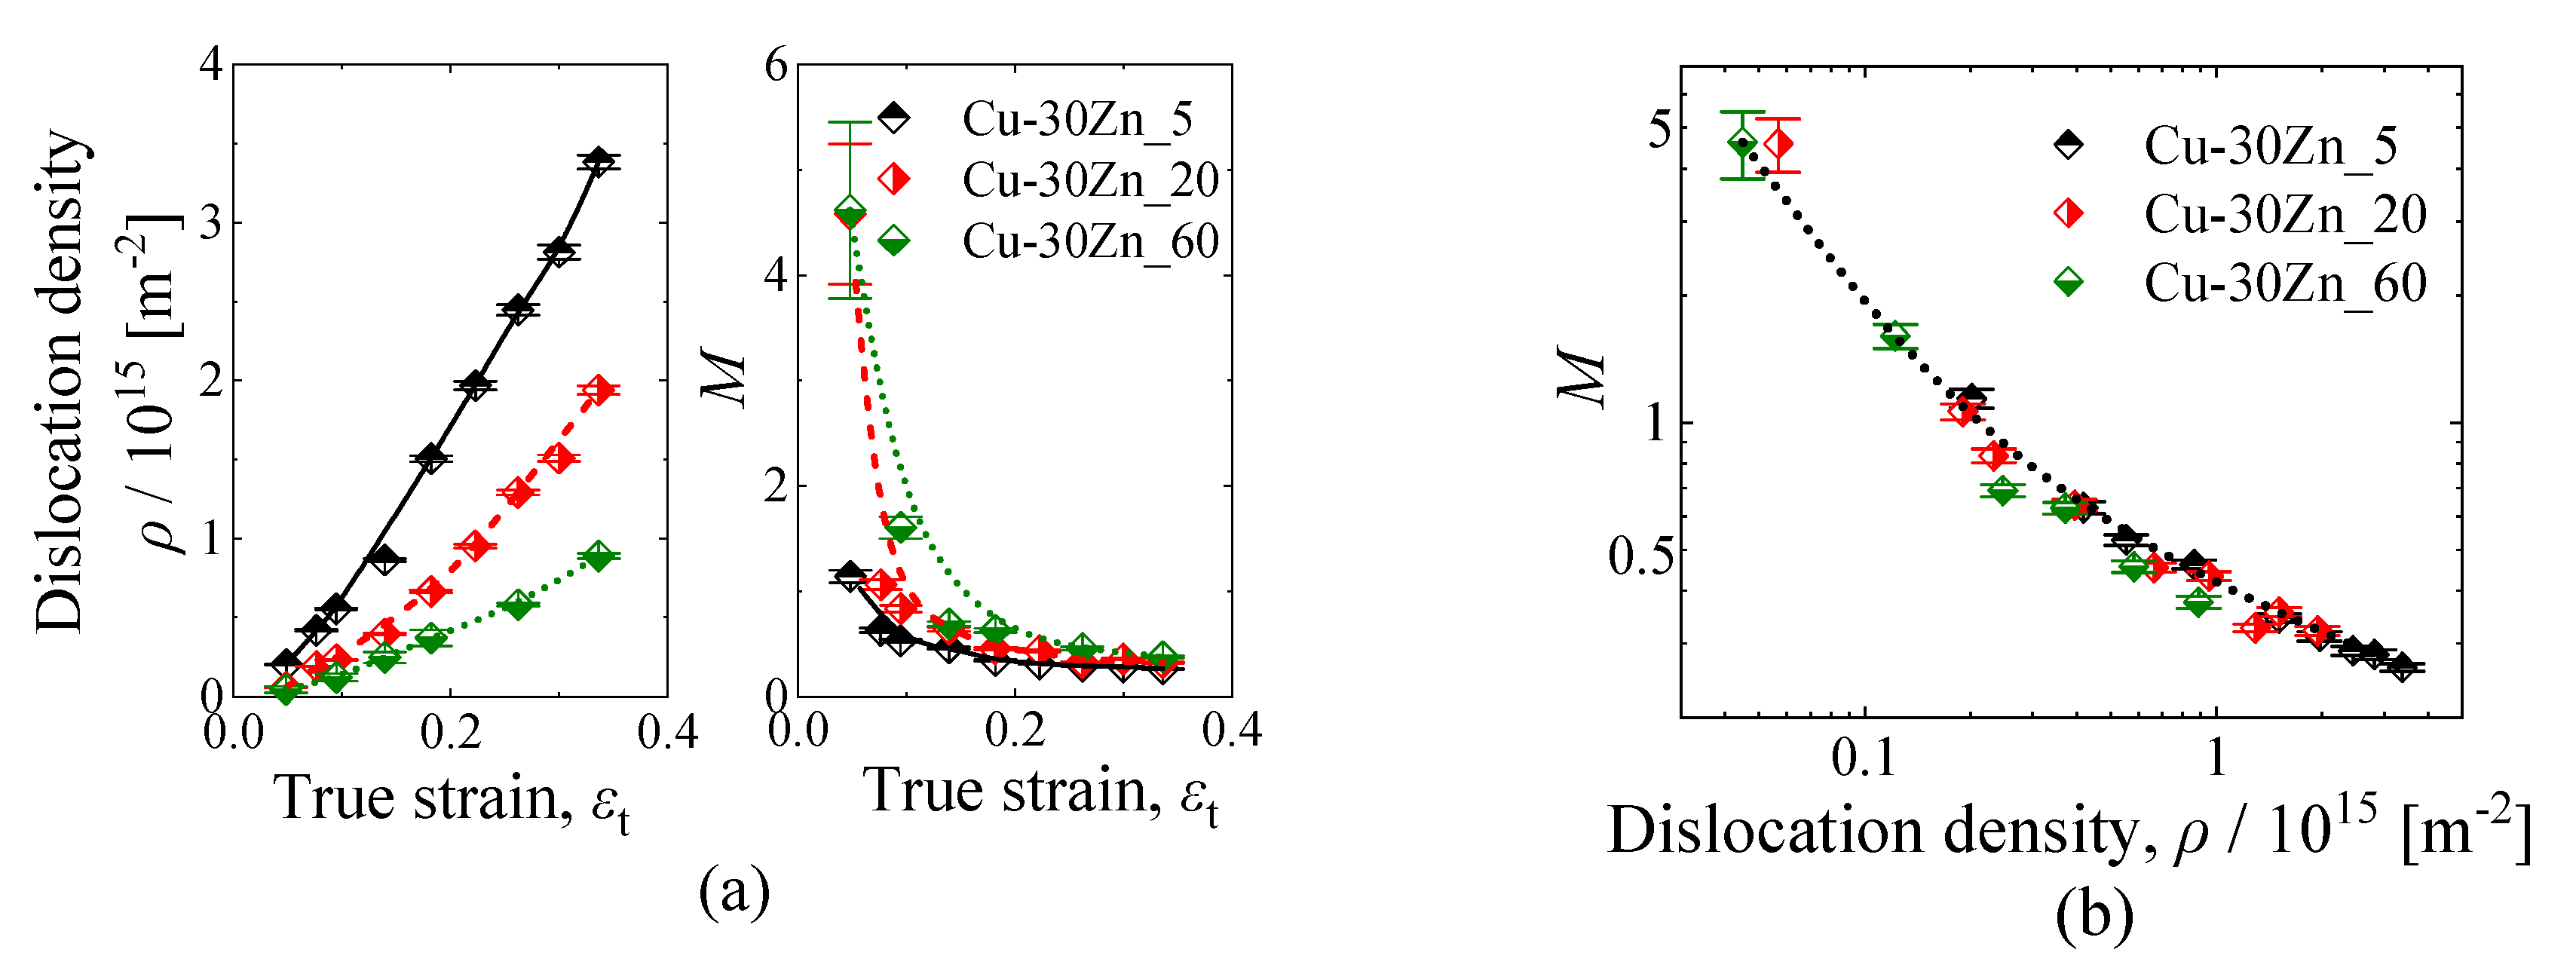
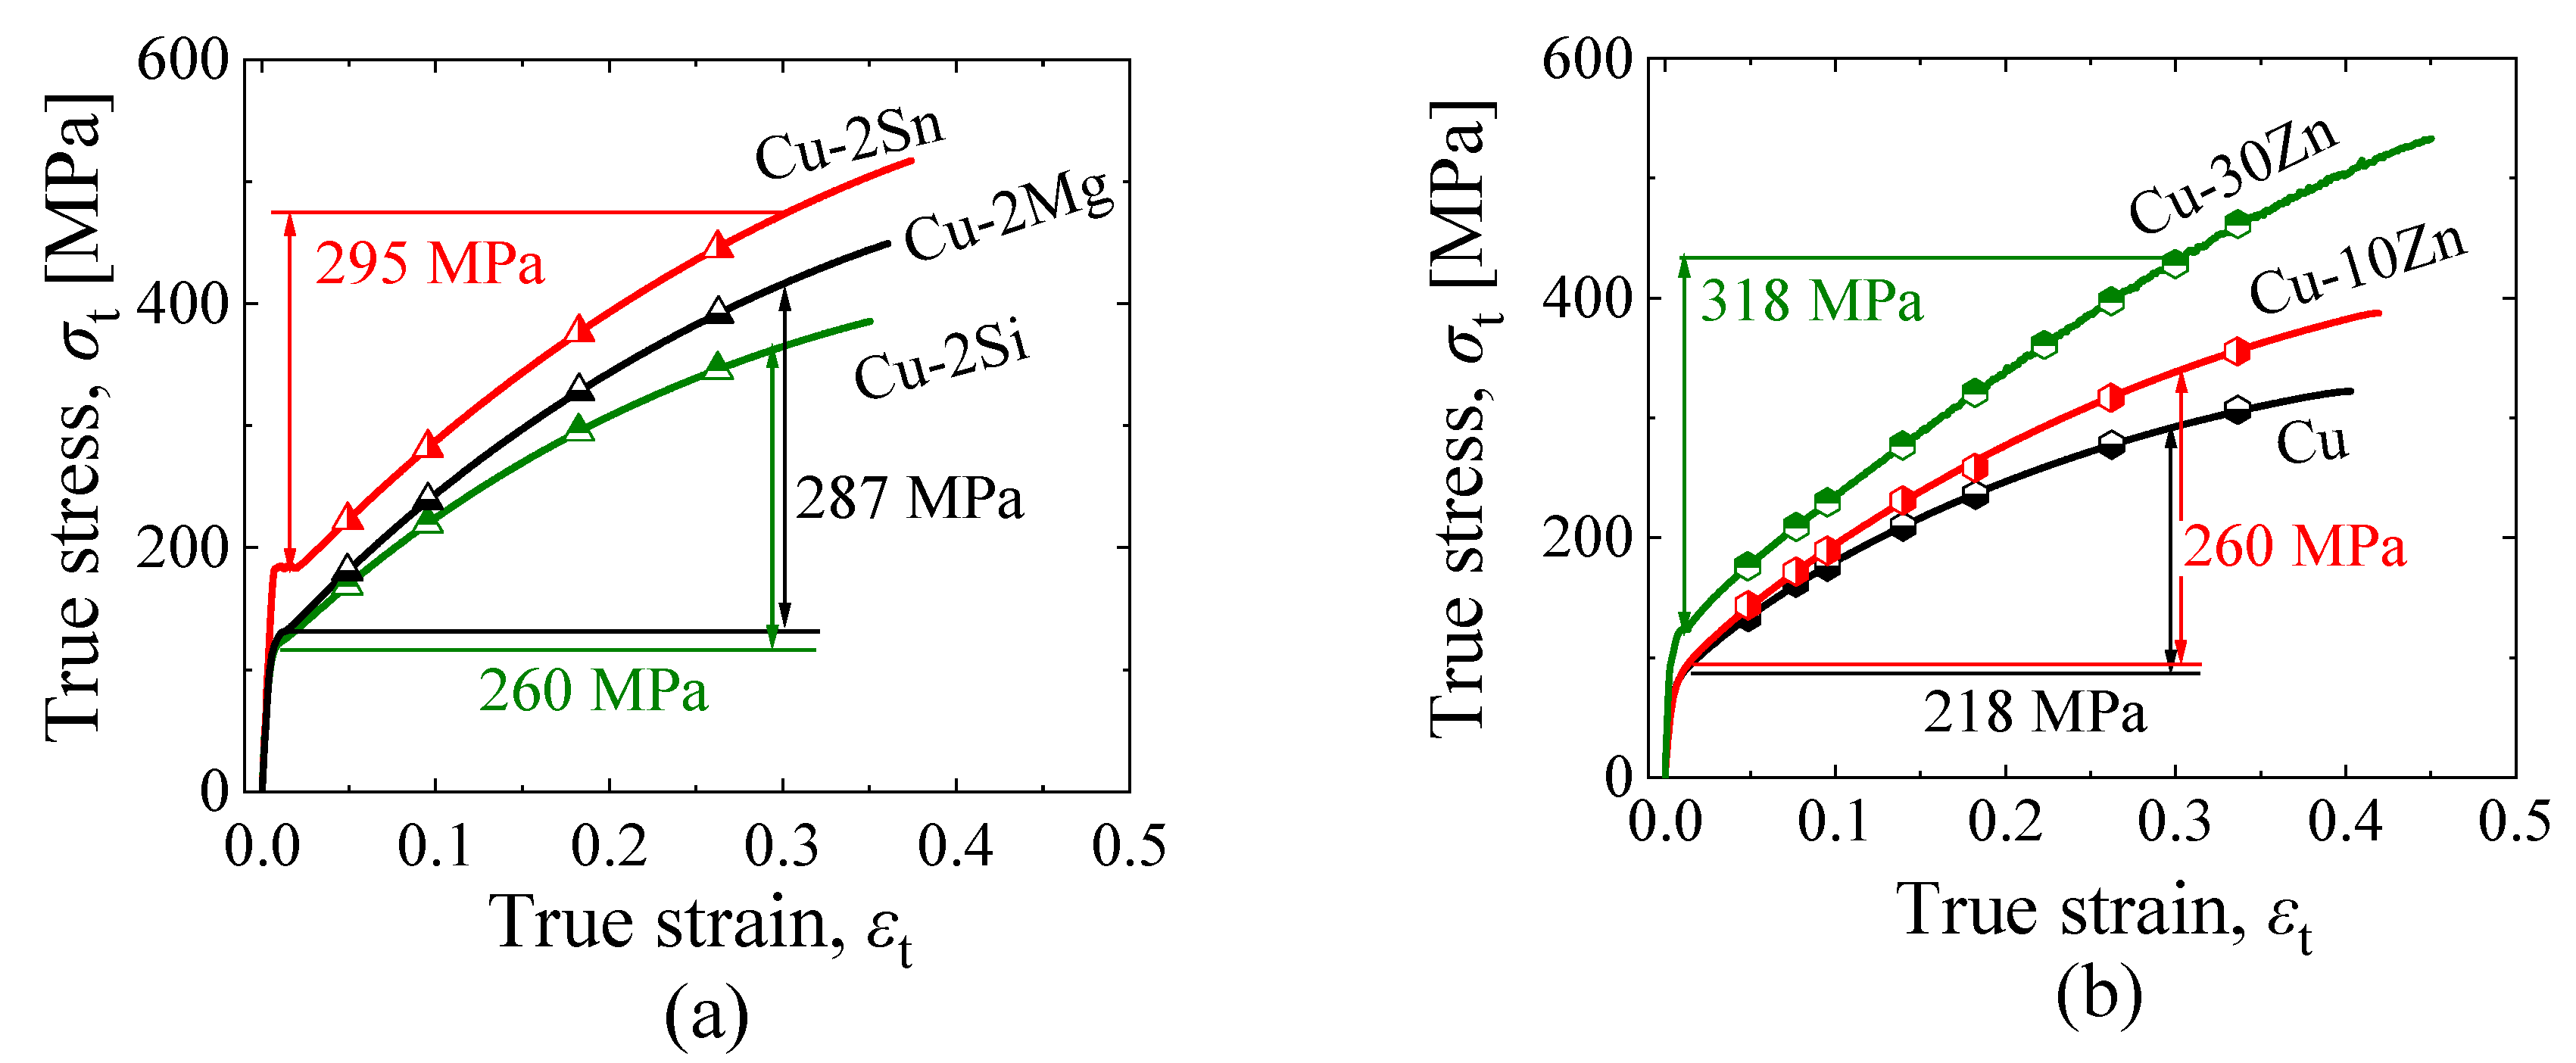
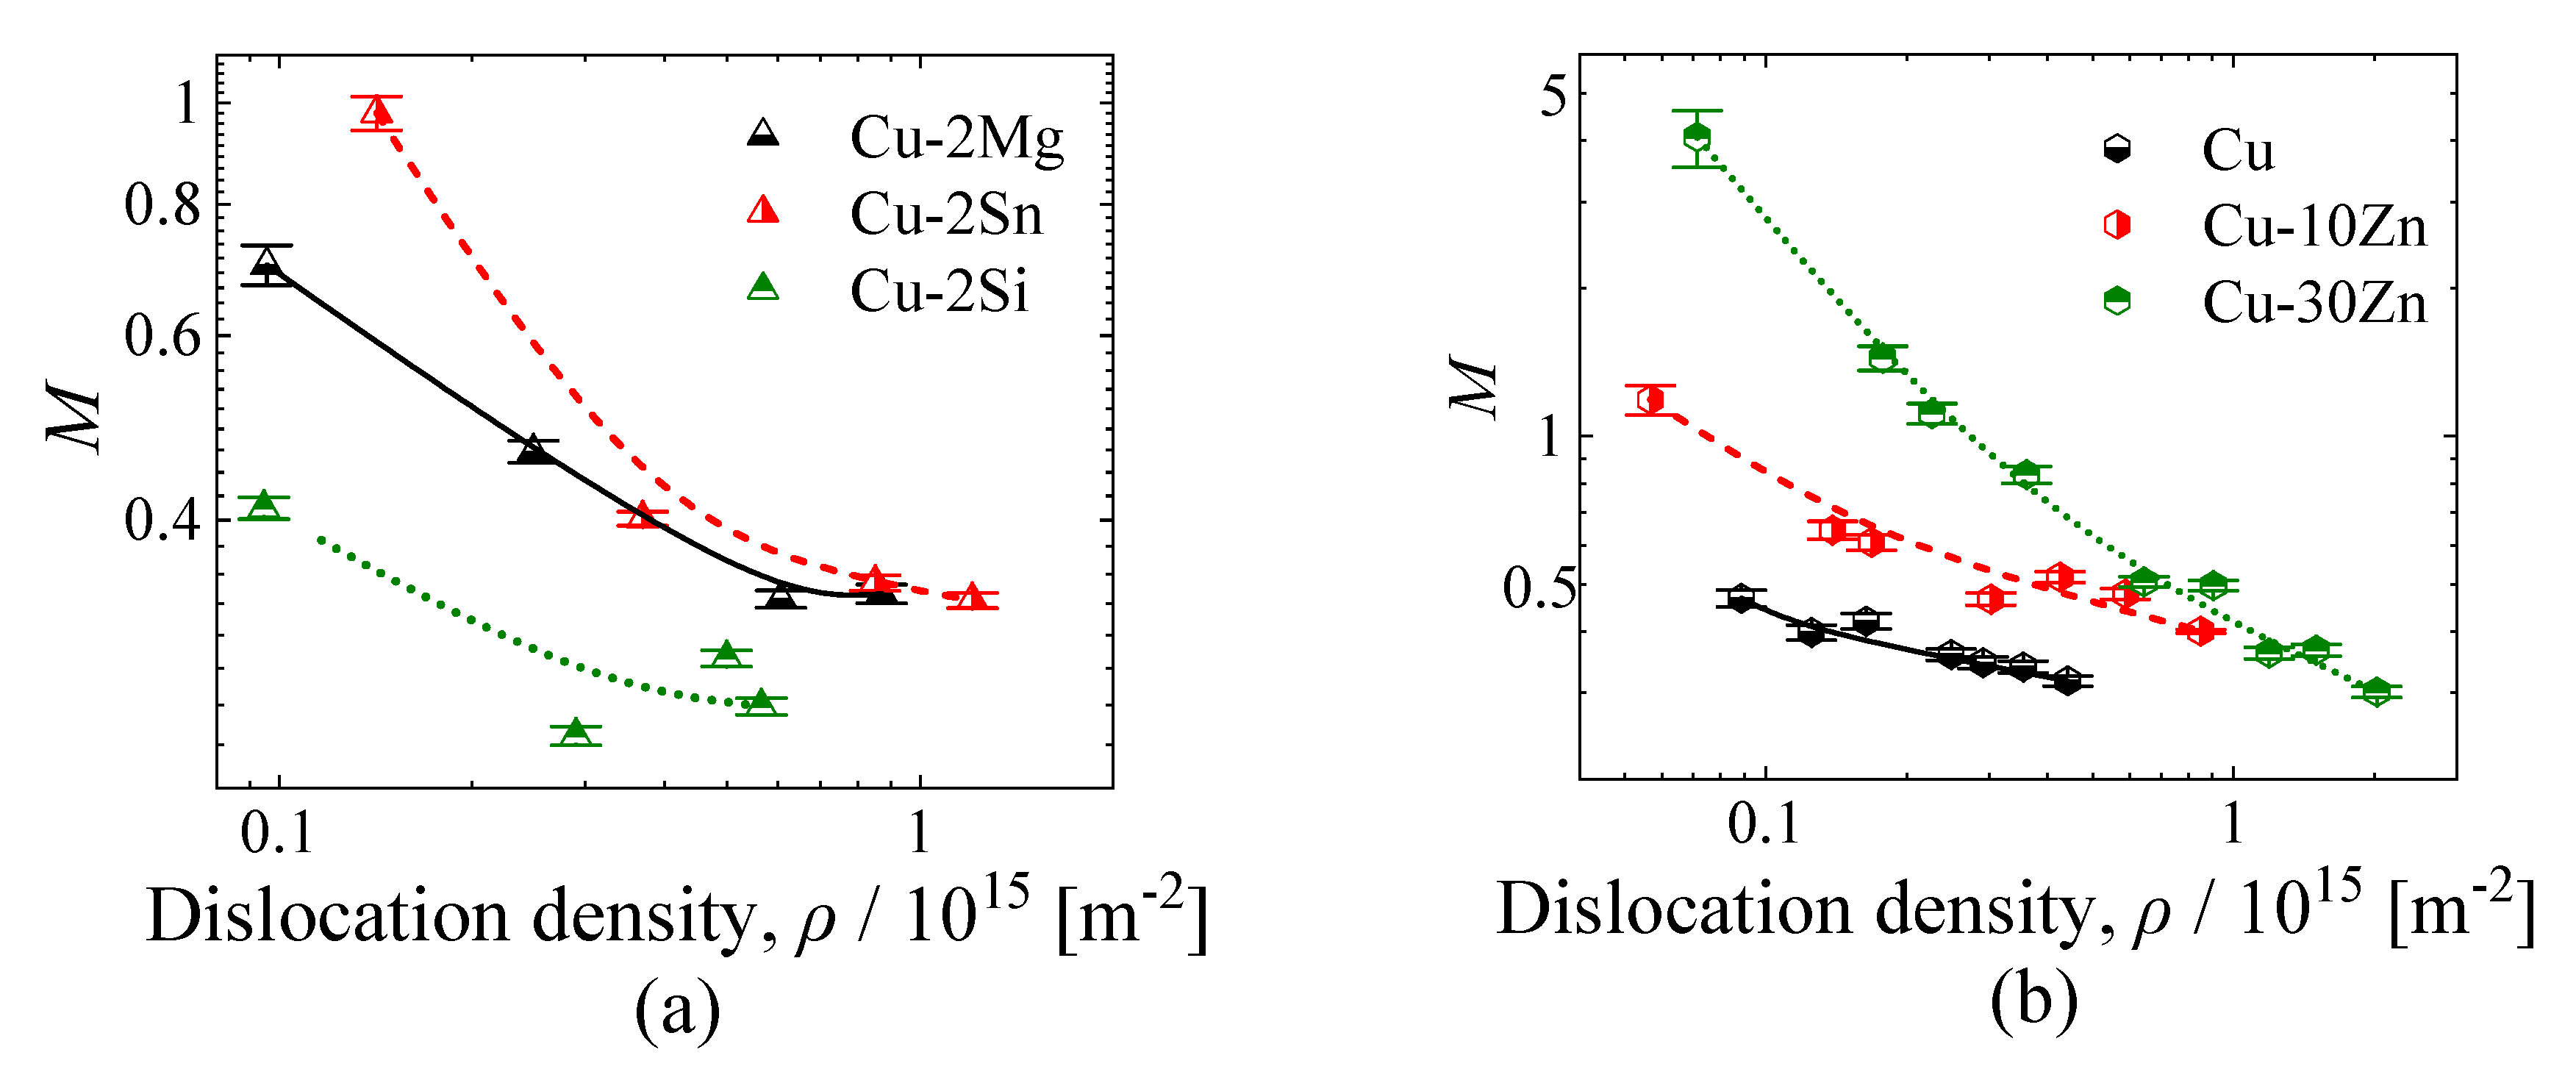
3.4. Effects of Solute Elements on the Variation in M Values

Cu-2 at% X (X = Mg, Sn, Si) alloy specimens (denoted as Cu-2Mg, Cu-2Sn, Cu-2Si, respectively) and Cu-x mass% Zn (0, 10 and 30 mass%) alloy specimens (named as Cu, Cu-10Zn, and Cu-30Zn, respectively) were prepared to investigate the effects of the species and the concentration of solute elements on the extent of dislocation rearrangement. Figure 13 shows the IPF maps obtained for the Cu-2X and Cu-x Zn alloys before deformation. The IPF map of Cu-30Zn is shown in Figure 9b. The mean grain sizes of the Cu-2Mg, -2Sn, and -2Si alloys were in the range of 4 to 6 μm, and those of Cu, Cu-10Zn, and -30Zn alloys were approximately 20 μm.
Figure 14 shows the true stress-strain curves of Cu-2X [1] and the Cu-x Zn alloys [2]. The work hardening at a true strain of 0.3 is also denoted in the figure. In the case of the Cu-2X alloys, the work hardening of Cu-2Sn and Cu-2Mg was higher than that of Cu-2Si. This relationship was consistent with the effect of the solute element size (obtained from lattice constants), which were 0.3615, 0.3616, 0.3628, and 0.3637 nm for Cu, Cu-2Si, Cu-2Mg, and Cu-2Sn, respectively [1]. Although the atomic size of Si is similar to that of Cu, the atomic size of Sn is larger than that of Cu. Similarly, work hardening increased in the Cu-x Zn alloys at higher zinc concentrations. Higher work hardening implies a stronger effect of solute elements on the multiplication of dislocations. The plastic shear strain, γ, has a simple and well-known relationship with the dislocation density and the mean travel distance of dislocations, x ¯ , which is expressed as [25]:
γ = ρ b x ¯ .
According to Equation (3), a high dislocation density is required to compensate for small x ¯ values, which could be induced by solute elements. Therefore, it can be derived that the extent of dislocation rearrangement is influenced by the size effect.
Figure 15a shows the variations in M values with respect to the dislocation density for the Cu-2X alloys. M decreased with increasing dislocation density values in all tested Cu-2X alloys, which indicated that the interaction between dislocations became stronger. Cu-Si alloys exhibited the lowest M values with increasing dislocation density. By contrast, M values for the Cu-Mg and Cu-Sn alloys had smaller decrease. Figure 15b shows the variations in M values with respect to the dislocation density for the Cu-x Zn alloys. It can be observed that the extent of dislocation rearrangement could be reduced based on the size effect and concentration of solute elements.
It should be mentioned that considering the difference in SFEs for the Cu-2X and Cu-x Zn alloys due to the involved species and concentration of solute elements, SFE might have a negligible influence on the extent of dislocation rearrangement as described in Section 3.3. Therefore, the large variations in the M values of Ni and 310S (Figure 8) were caused by the content of solute elements in 310S specimen.
Simm et al., have applied the line-profile analysis methods to investigate the dislocation character in FCC and hexagonal closed-packed alloys [26,27,28]. The results showed that heterogeneous microstructures were formed during plastic deformation in FCC nickel and stainless steel. It was also confirmed that the applied analytical methods provide important details on the microstructure, such as the relative amount of different dislocation types and the number of planar faults. Although the analytical methods conducted in the current study are not the same as the ones reported in the literature, it may be derived that the line-profile analysis is effective to investigate plastic deformation processes in FCC alloys containing different solute elements. These processes were discussed based on crystal plasticity mechanisms along with work-hardening models.

4. Conclusions

1. The relationship between dislocation substructures and dislocation arrangement parameters (M), expressed as M = R e ρ (where R e is the radius of the strain field of dislocations and ρ is the dislocation density), was investigated in tensile-deformed FCC metals using X-ray diffraction line-profile analysis. Dislocations were loosely distributed at M values > 1. When the M value was smaller than 1, the cell walls gradually formed. The cell walls increased in thickness with decreasing M values. While the thickness of the cell walls was larger in AISI 310S steel at low SFE (<100 mJ/m2), the cell walls of Ni (exhibiting a high SFE of 149 mJ/m2), were sharply formed at an approximate M value of 0.3. Thus, based on obtained M values and SFEs, the dislocation substructures were observed.
2. Dislocations rearrange when the dislocation density increases during tensile deformation, and consequently, the strain field of dislocations is reduced. M values decreased with increasing dislocation rearrangement. The extent of dislocation rearrangement was estimated by varying the M value with respect to the dislocation density. It was derived that the variation in the M value is not dependent on grain size and SFE.
3. The variation in M values with respect to the dislocation density was influenced by the elemental species as solute elements. The extent of dislocation rearrangement decreased with increasing size effect and concentration of the solute elements.

Author Contributions

Conceptualization, K.N. and S.S. (Shigeo Sato); methodology and experiments, K.N., M.H., Y.O. and S.S. (Shigeo Sato); sample preparation, K.T.-S., H.M. (Hirotaka Matsunaga) and H.M. (Hiroyuki Mori); validation, all authors; data analysis, K.N.; supervision, S.S. (Shigeru Suzuki), K.M.; writing—original draft preparation, K.N. and S.S. (Shigeo Sato); All authors have read and agreed to the published version of the manuscript.

Funding

This research received no external funding.

Conflicts of Interest

The authors declare no conflict of interest.

References

  1. Hayashi, M.; Ito, Y.; Takano, K.; Mori, H.; Matsunaga, H.; Onuki, Y.; Suzuki, S.; Sato, S. Effect of kinds of alloying elements in solid-solution copper alloys on dislocation evolution. J. Jpn. Inst. Copper 2020, 59, 70–75. [Google Scholar]
  2. Nakagawa, K.; Takano, K.; Matsunaga, H.; Mori, H.; Kitahara, A.; Onuki, Y.; Suzuki, S.; Sato, S. Variation in dislocation-strengthening factors of Cu-Zn alloys with solid-solute zinc contents. J. Jpn. Inst. Copper 2020, 59, 59–63. [Google Scholar]
  3. Li, P.; Li, S.X.; Wang, Z.G.; Zhang, Z.F. Fundamental factors on formation mechanism of dislocation arrangements in cyclically deformed fcc single crystals. Prog. Mater. Sci. 2011, 56, 328–377. [Google Scholar] [CrossRef]
  4. Zhang, J.; Jiang, Y. An experimental study of the formation of typical dislocation patterns in polycrystalline copper under cyclic shear. Acta Mater. 2007, 55, 1831–1842. [Google Scholar] [CrossRef]
  5. Kashyap, B.P.; Tangri, K. On the Hall-Petch relationship and substructural evolution in type 316L stainless steel. Acta Metall. Mater. 1995, 43, 3971–3981. [Google Scholar] [CrossRef]
  6. Ungár, T.; Dragomir-Cernatescu, I.; Louër, D.; Audebrand, N. Dislocations and crystallite size distribution in nanocrystalline CeO2 obtained from an ammonium cerium (IV)-nitrate solution. J. Phys. Chem. Solids 2001, 62, 1935–1941. [Google Scholar] [CrossRef]
  7. Ito, M.; Sato, S.; Ito, Y.; Mori, H.; Matsunaga, H.; Maki, K.; Suzuki, S. Effects of microstructural characteristics on stress relaxation resistance of solid-solution hardened copper alloys. J. Jpn. Inst. Copper 2017, 56, 45–50. [Google Scholar]
  8. Sato, S.; Shobu, T.; Satoh, K.; Ogawa, H.; Wagatsuma, K.; Kumagai, M.; Imafuku, M.; Tashiro, H.; Suzuki, S. Distribution and anisotropy of dislocations in cold-drawn pearlitic steel wires analyzed using micro-beam X-ray diffraction. ISIJ Int. 2015, 55, 1432–1438. [Google Scholar] [CrossRef] [Green Version]
  9. Sato, S.; Wagatsuma, K.; Ishikuro, M.; Kwon, E.P.; Tashiro, H.; Suzuki, S. Precise characterization of dislocations and cementite in pearlitic steels at different drawing strains using X-ray diffraction. ISIJ Int. 2013, 53, 673–679. [Google Scholar] [CrossRef] [Green Version]
  10. Ungár, T.; Borbély, A. The effect of dislocation contrast on x-ray line broadening: A new approach to line profile analysis. Appl. Phys. Lett. 1996, 69, 3173–3175. [Google Scholar] [CrossRef]
  11. Ungár, T.; Ott, S.; Sanders, P.G.; Borbély, A.; Weertman, J.R. Dislocations, grain size and planar faults in nanostructured copper determined by high resolution X-ray diffraction and a new procedure of peak profile analysis. Acta Mater. 1998, 46, 3693–3699. [Google Scholar] [CrossRef]
  12. Ungár, T.; Dragomir, I.; Révész, Á.; Borbély, A. The contrast factors of dislocations in cubic crystals: The dislocation model of strain anisotropy in practice. J. Appl. Cryst. 1999, 32, 992–1002. [Google Scholar] [CrossRef] [Green Version]
  13. Ungár, T.; Tichy, G. The effect of dislocation contrast on x-ray line profiles in untextured polycrystals. Phys. Stat. Solidi A 1999, 171, 425–434. [Google Scholar] [CrossRef]
  14. Stokes, A.R. A numeridal Fourier-analysis method for the correction of widths and shapes of lines on X-ray powder photographs. Proc. Phys. Soc. 1948, 61, 382–391. [Google Scholar] [CrossRef]
  15. Dey, S.N.; Chatterjee, P.; Sen Gupta, S.P. Study of deformation stacking faults and dislocation microstructures in Cu–1Sn–Zn alloys. Acta Mater. 2005, 53, 4635–4642. [Google Scholar] [CrossRef]
  16. Ribárik, G.; Gubicza, J.; Ungár, T. Correlation between strength and microstructure of ball-milled Al–Mg alloys determined by X-ray diffraction. Mater. Sci. Eng. A 2004, 387, 343–347. [Google Scholar] [CrossRef]
  17. Balogh, L.; Ribárik, G.; Ungár, T. Stacking faults and twin boundaries in fcc crystals determined by x-ray diffraction profile analysis. J. Appl. Phys. 2006, 100, 023512. [Google Scholar] [CrossRef]
  18. Narita, N.; Hatano, A.; Takamura, J.; Yoshida, M.; Sakamoto, H. Stacking Fault Energy of Pure Nickel Evaluated from the Twinning Stress of Nickel-Based Alloys. J. Jpn. Inst. Met. Mater. 1978, 42, 533–541. [Google Scholar] [CrossRef] [Green Version]
  19. Schramm, R.E.; Reed, R.P. Stacking fault energies of seven commercial austenitic stainless steels. Metall. Trans. A 1975, 6, 1345–1351. [Google Scholar] [CrossRef]
  20. Narutani, T.; Takamura, J. Grain-size strengthening in terms of dislocation density measured by resistivity. Acta Metall. Mater. 1991, 39, 2037–2049. [Google Scholar] [CrossRef]
  21. Umezaki, S.; Murata, Y.; Nomura, K.; Kubushiro, K. Quantitative analysis of dislocation density in an austenitic steel after plastic deformation. J. Jpn. Inst. Met. Mater. 2014, 78, 218–224. [Google Scholar] [CrossRef] [Green Version]
  22. Nakagawa, K.; Hayashi, M.; Takano-Satoh, K.; Matsunaga, H.; Mori, H.; Kitahara, A.; Onuki, Y.; Suzuki, S.; Sato, S. Effect of grain size of Cu-Zn alloys on dislocation-strengthening factors. J. Jpn. Inst. Met. Mater. To be published.
  23. Hall, E.O. The deformation and ageing of mild steel: III Discussion of results. Proc. Phys. Soc. Sec. B 1951, 64, 747–753. [Google Scholar] [CrossRef]
  24. Zhao, Y.H.; Horita, Z.; Langdon, T.G.; Zhu, Y.T. Evolution of defect structures during cold rolling of ultrafine-grained Cu and Cu-Zn alloys: Influence of stacking fault energy. Mater. Sci. Eng. A 2008, 474, 342–347. [Google Scholar] [CrossRef]
  25. Taylor, G. The mechanism of plastic deformation of crystals. Patr I-Theoretical. Proc. R. Soc. 1934, 145, 362–387. [Google Scholar]
  26. Simm, T.H. Peak broadening anisotropy and the contrast factor in metal alloys. Crystals 2018, 8, 212. [Google Scholar] [CrossRef] [Green Version]
  27. Simm, T.H.; Withers, P.J.; Quinta da Fonseca, J. Peak broadening anisotropy in deformed face-centered and hexagonal closed-packed alloys. J. Appl. Cryst. 2014, 47, 1535–1551. [Google Scholar] [CrossRef]
  28. Simm, T.H.; Withers, P.J.; Quinta da Fonseca, J. An evaluation of diffraction peak profile analysis (DPPA) methods to study plastically deformed metals. Mater. Design 2016, 111, 331–341. [Google Scholar] [CrossRef] [Green Version]
Figure 1. Comparison of diffraction peaks of the Cu-220 reflection and LaB6-311 reflection.
Qubs 04 00036 g001
Figure 2. Convolutional multiple whole profile (CMWP) fitting for XRD patterns of the Cu-30% Zn specimen at a true strain of 0.34.
Qubs 04 00036 g002
Figure 3. (a) Simulation of the 220 Cu reflection at a dislocation density of 2 × 10¹⁵ m−2, with varying M values from 2 to 0.2; (b) variations in full width at half maximum (FWHM) of the 220 reflection for Cu Kα1 and W L / W G as a function of M.
Qubs 04 00036 g003
Figure 4. Inverse pole figure (IPF) maps before tensile deformation of the specimens: (a) 310S and (b) Ni.
Qubs 04 00036 g004
Figure 5. True stress-strain curves for 310S and Ni. Specimens were deformed at the strains denoted by each curve marks to conduct XRD measurements.
Qubs 04 00036 g005
Figure 6. Variations due to true strain for the 310S and Ni specimens in (a) FWHMs and W L / W G of 220 reflection; (b) dislocation density and M.
Qubs 04 00036 g006
Figure 7. TEM images of tensile-deformed 310S (ad) and Ni (eg) at true strains (εt) of 0.05, 0.12, 0.18, 0.41, 0.05, 0.10, and 0.34, respectively.
Qubs 04 00036 g007
Figure 8. Influence of varying dislocation density on M values.
Qubs 04 00036 g008
Figure 9. IPF maps for (a) Cu-30Zn_5, (b) Cu-30Zn_20, and (c) Cu-30Zn_60 specimens before tensile deformation.
Qubs 04 00036 g009
Figure 10. True stress–strain curves for Cu-30Zn_5, Cu-30Zn_20, and Cu-30Zn_60 [22]. Specimens were deformed at the strains denoted by each curve marks to conduct XRD measurements.
Qubs 04 00036 g010
Figure 11. (a) Variations of dislocation density and M with respect to true strain [22]; (b) M as a function of dislocation density.
Qubs 04 00036 g011
Figure 12. Influence of varying dislocation density on M values for Ni and Cu specimens.
Qubs 04 00036 g012
Figure 13. IPF maps for (a) Cu-2Mg, (b) Cu-2Sn, (c) Cu-2Si, (d) Cu, and (e) Cu-10Zn specimens before tensile deformation.
Qubs 04 00036 g013
Figure 14. True stress–strain curves for: (a) Cu-2Mg, Cu-2Sn, and Cu-2Si [1]; (b) Cu, Cu-10Zn, and Cu-30Zn [2]. Specimens were deformed at the strains denoted by curve marks to conduct XRD measurements.
Qubs 04 00036 g014
Figure 15. Influence of varying dislocation density on M values for (a) Cu-2X and (b) Cu-x Zn specimens (X = Mg, Sn, Si; x, in mass% = 0, 10, 30.).
Qubs 04 00036 g015

