1. Introduction
With the recent growth of health care organizations, it is not uncommon for interpreting radiologists to be geographically remote from the sites of image acquisition. Direct supervision and/or communication with the technologists becomes challenging due to geographic separation and increasing imaging volumes. The need to maintain quality assurance and control, however, remains.
In the past, it was possible to address individual quality events through direct communication between the radiologists and technologists. Suboptimal collimation with resultantly too-large or too-small fields of view, suboptimal positioning, artifacts and misplaced or incorrect markers could all be evaluated, discussed and addressed between radiologists and technologists who worked very closely with each other. With the advent of picture archiving and communication systems (PACS) and teleradiology and increased workloads, such direct communication has become more difficult.
However, technology has also brought to light new solutions that allow the automatic processing of a large number of images. One such technology is convolutional neural networks (CNN). Automatic detection of objects on images using this technology is now commonplace, with several applications in various industries including the online commerce, motion pictures, gaming and automotive industries. Some of this technological development is based on publicly available neural network detectors which were pre-trained on large number of different images. Using transfer learning techniques, these networks are re-trained for specific applications.
Radiographs are high-contrast greyscale images that are ideal for projects that explore the utility of CNN in performing mundane computationally intensive tasks in radiology. While the use of automatic quality assessment and deep learning has been reported previously in the context of MR imaging [
1] and video endoscopy [
2], we are not aware of any reported projects that have utilized deep learning in radiography quality improvement and assurance processes. In this pilot quality management project, we evaluated the feasibility of a computer vision AI algorithm to classify hand radiographs into indirect collimation quality categories and compared them to the collimation quality assessed by radiologists.
We hypothesized that a higher metric based on the automated calculation of unused air space in hand radiographs would correlate with a lower radiographic collimation quality score assigned by the radiologists.
2. Methods and Materials
This study was a cross-sectional, retrospective, Health Insurance Portability and Accountability Act (HIPAA)-compliant evaluation, following the institutional review board guidelines. The informed consent requirement was waived.
2.1. Radiograph Preparation
A bounding box was placed over the hand anatomy in 300 random hand radiographs by a trained medical student. The 300 images with bounding boxes included frontal, oblique and lateral views of single hand radiographs. The student was trained on 5 images by a musculoskeletal faculty member with 11 years of experience. The student worked closely with the faculty member and sought guidance for difficult cases throughout the project. The boundaries of the hand included the anatomy from the metaphysis of the radius to the fingertips and the most medial and most lateral aspects of the thumb/small fingers on the frontal views, and similar boundaries modified to outline the anatomy on oblique and lateral views. Radiographs that included both hands in one image were excluded from the training set. The random 300-radiograph sample was selected from radiographs obtained on four different sets of various manufacturers’ acquisition equipment at two outpatient sites that predominantly imaged adults referred from primary care and orthopedic clinics.
2.2. CNN Training and Image Analysis
The labeled images were used as inputs for training a CNN detector using the transfer learning technique to automatically detect hand anatomy boundaries on radiographs. The publicly available Faster R-CNN network was used with a pre-trained feature extraction network, ResNet50, in this project. We selected this model as we achieved good results using this architecture in other similar projects at our institution.
The images were pre-processed in the Matlab 2019b (The MathWorks, Inc, Natick, MA, USA) environment to match the input requirements of the ResNet50 architecture. Since the ResNet50 architecture requires the input of three channel color images, each greyscale radiograph was converted into a three-channel matrix by triplicating the greyscale input image. The usual dataset augmentation techniques were employed in the pipeline, which included randomly flipping input images and corresponding bounding boxes, rescaling input images and bounding boxes, and changing the contrast and brightness of each image by ±20%. The input dataset was randomly split into 60% training and 40% validation datasets. The ResNet50 CNN was re-trained using an Nvidia GeForce RTX 2060 Super GPU. The accuracy of the CNN was calculated for each training epoch. Training was stopped after six epochs, after which no further improvements in accuracy could be achieved.
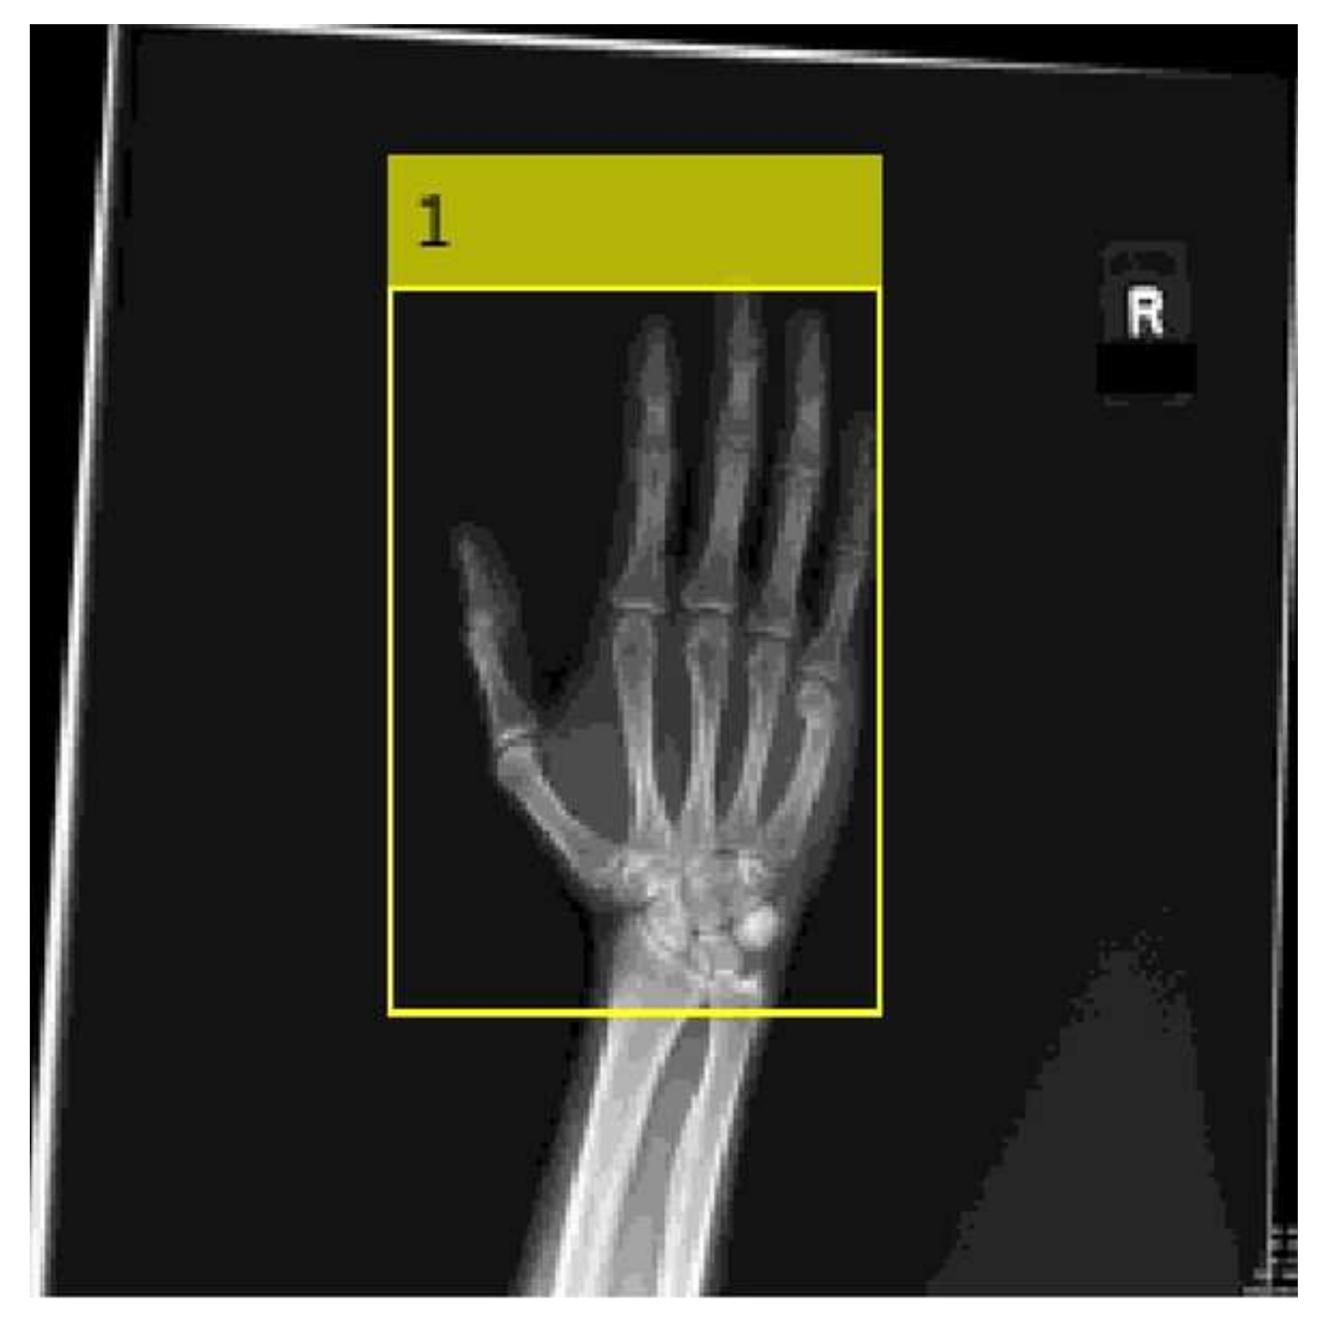
The trained CNN detector (
Figure 1) was used to automatically place a bounding box over the hand anatomy on an additional 100 frontal, oblique and lateral hand radiographs, which were not used for training or validation. A computer algorithm further processed each output image to calculate top, bottom, right and left air density spaces on the radiographs.
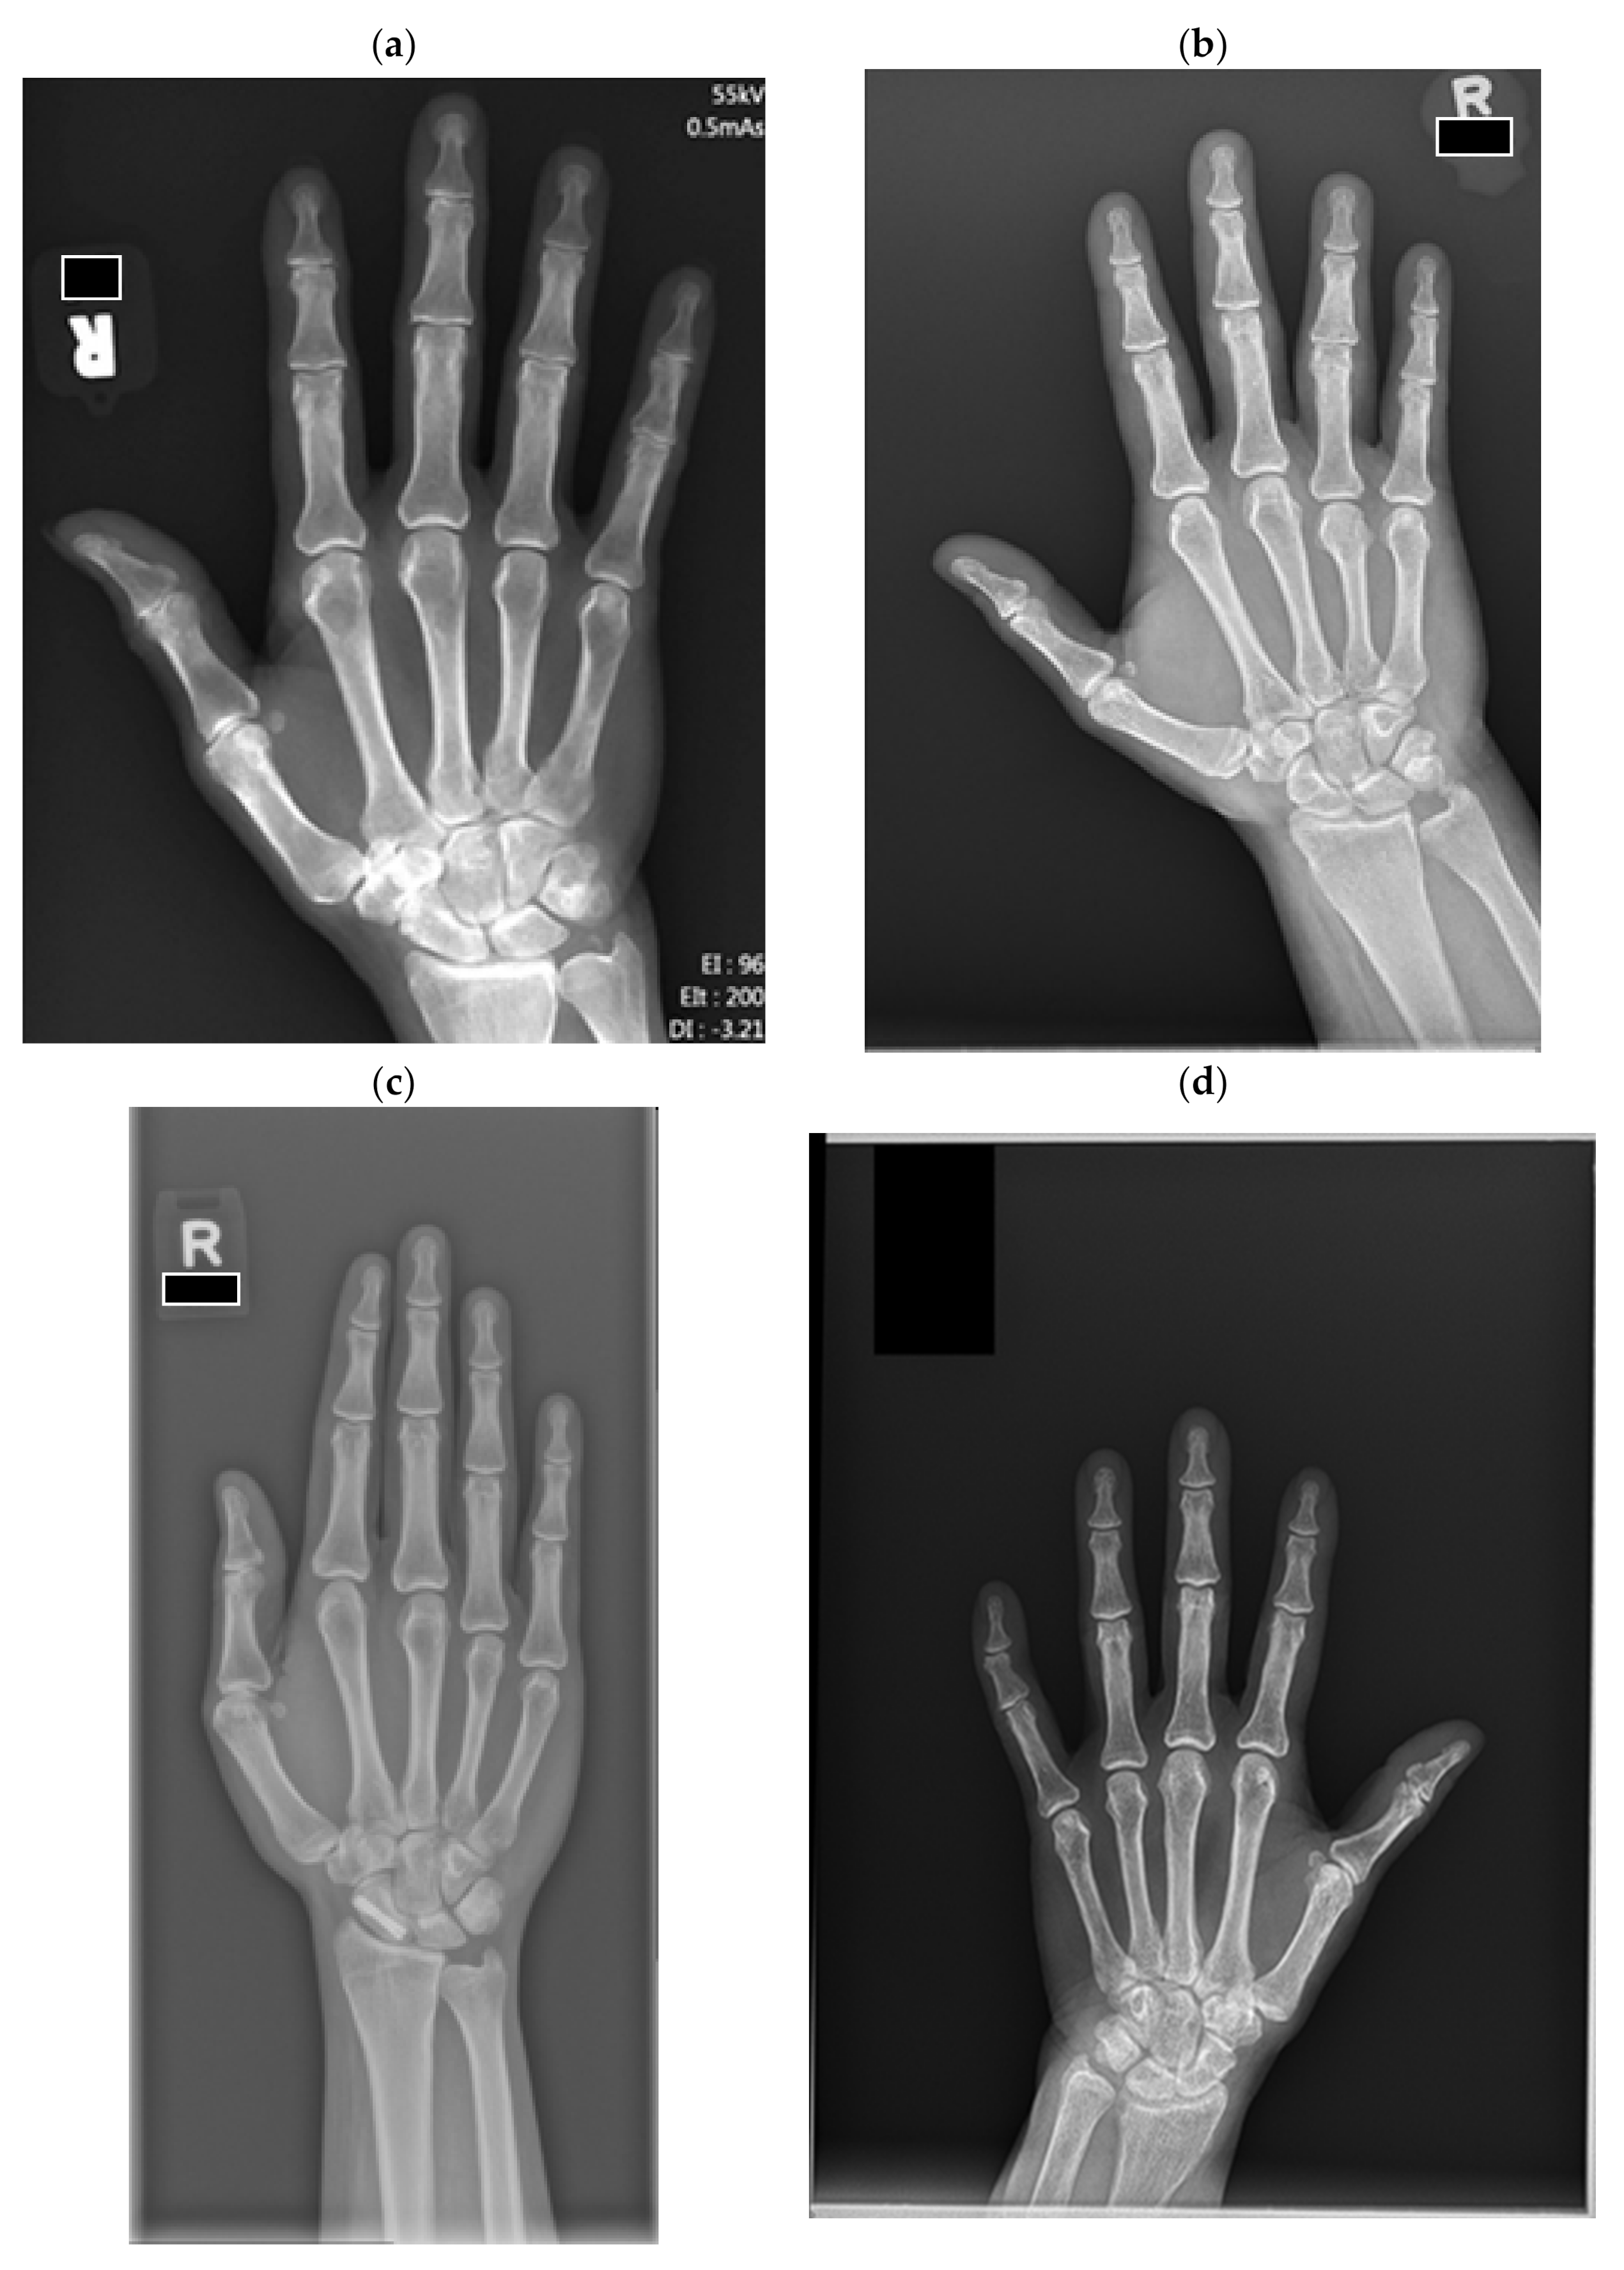
The same 100 images were classified by two experienced musculoskeletal radiologists into four quality categories (
Figure 2) ranging from category 1, “substantially limited”, to category 4, “excellent”. The radiologists were given guiding metric definitions and examples as described in
Figure 2. Two images were excluded as they contained radiographs of bilateral hands.
2.3. Statistical Analysis
The kappa interrater correlation coefficient was used to calculate the correlation score between the two radiologists. The Spearman correlation coefficient was used to calculate the correlation of the AI-determined percentage of air density spaces at the top, bottom, right and left edges of the hand anatomy on radiographs to the quality scores assigned by radiologists.
3. Results
The kappa score for the agreement between the two radiologists in assigning the radiograph quality scores was 0.61 (0.50–0.74 95%CI).
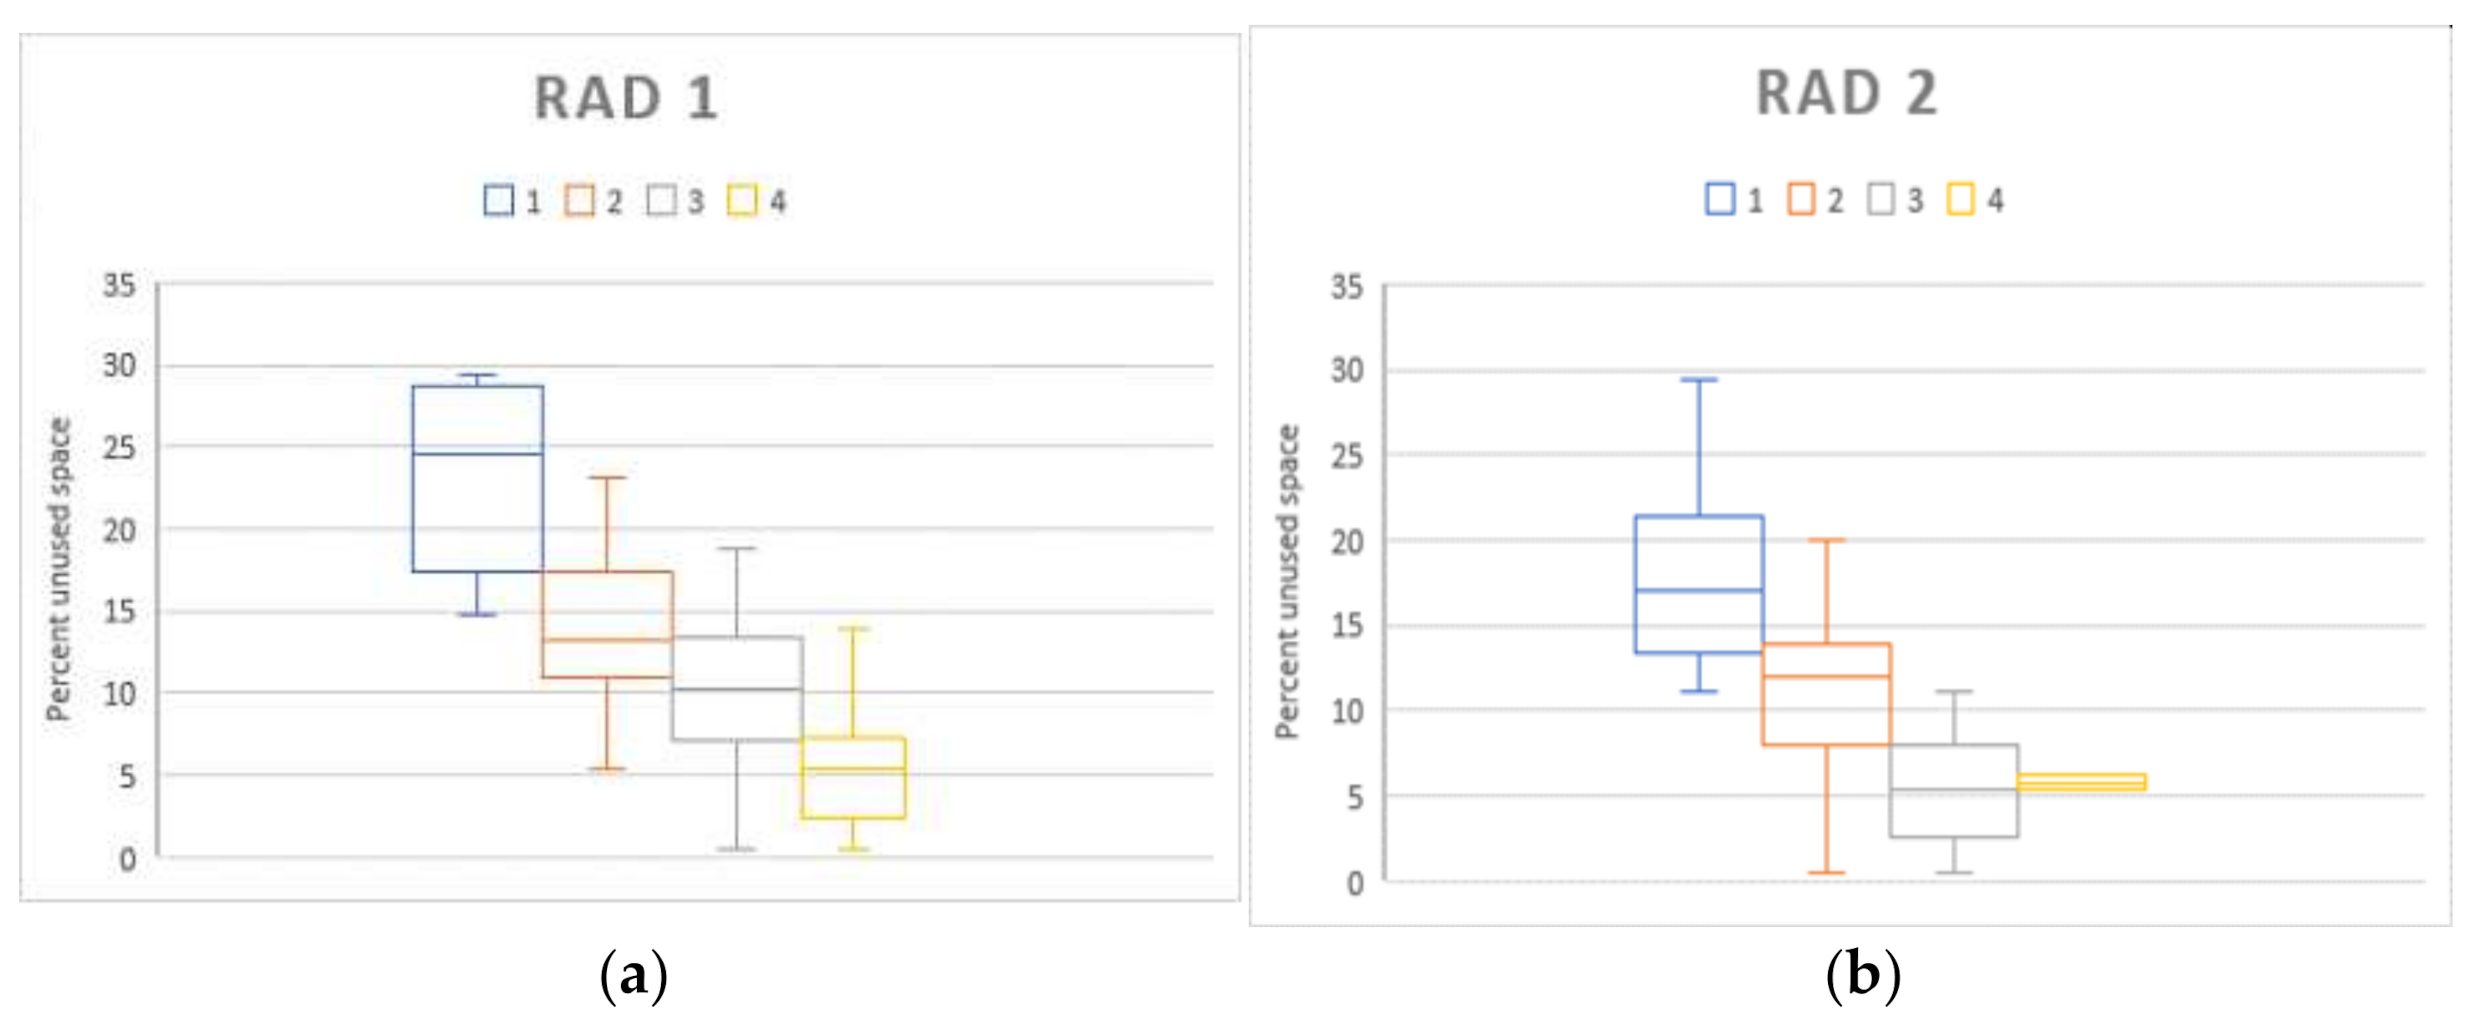
Table 1 summarizes the Spearman correlation coefficients of top, bottom, right and left unused radiograph space metrics to ranked categories assigned by radiologists. The best correlations were achieved for the calculation of the top unused space.
Table 2 describes the average radiograph “top unused space percentages” corresponding to the quality scores assigned by radiologists. Boxplots of percentages of unused space calculated by the AI algorithm, organized by corresponding radiograph scores assigned by the two radiologists, are displayed in
Figure 3.
4. Discussion
In this project, we trained and validated an AI algorithm which can be used in the evaluation of the quality of hand radiographs without a human input. The primary benefits of this method are its use for quality control and assurance with automation, increased efficiency and standardization. It has the ability to process a large number of images and to output a standardized quality metric that indirectly describes collimation. All unilateral hand radiographs from a given health care enterprise or random samples of radiographs can be evaluated and reports can be generated to address areas requiring continuous quality improvement in a system-wide fashion. Currently, we are using this tool for ongoing QI/QA projects at our institution, since it is scalable to a wide variety of radiographs.
One of the primary goals of quality assurance processes in radiology includes radiation reduction using the concept of “as low as reasonably achievable (ALARA)” [
3]. Inappropriate collimation usually results in a large field of view and can lead to unnecessary patient radiation exposure. For example, exposure of the upper abdomen in chest radiography [
4] results in exposure to the vital visceral organs. Exposure of the periphery of the abdomen or pelvis in lumbar spine radiography [
5] similarly leads to an unnecessary dose to many abdominal and pelvic organs and a cumulative dose to the patient. These effects are magnified even further by the necessity of increasing X-ray tube source power to penetrate the overlying soft tissues [
5]. The adverse effects of inappropriate collimation with higher exposure dose calculation by various manufactures have also been previously discussed [
6]. Though extremities are relatively radioresistant and the radiation exposure in hand radiography is minimal, this pilot study introduces the concept of using AI, which is scalable to many other sites for the patients’ benefit and technologist training and feedback. In addition, based on the ALARA principles, unnecessary exposure should be avoided as there are no benefits to justify the risk, however minimal it may be.
Other important clinical benefits of improving collimation quality that are relevant to the radiologists evaluating hand radiographs include better delineation of fine osseous anatomy and potential time savings. To our knowledge, the effect of suboptimal collimation (field of view) on radiological interpretation has not been formally studied. In the current digital environment, the resolution may be markedly limited by larger fields of view. The images are encoded into digital matrices and each pixel size is directly dependent on the original acquired field size. There are physical limitations of displaying original images that were acquired with too large of a field of view and it can result in pixelation artifacts on the zoomed anatomy. The contrast of the image may also be affected as automatic exposure controls may lead to underpenetrated, overpenetrated or unevenly penetrated parts of the anatomy. Suboptimal collimation may require radiologists to adjust the size or contrast of the image, which increases the amount of time needed for interpretations and may lead to possibly missed pathology.
Among many recent changes in the practice of radiology, the transition from an analog to a digital environment has been the fastest. Semi-automatic and automatic digital post-processing of the images encompasses many benefits. However, new challenges frequently arise that are unique to quality assurance (QA) and improvement processes. In the past, technically unacceptable films were evident as soon as analog image processing was complete. Radiologists practiced in close proximity to the technologists and were able to provide immediate feedback in person. It is now possible to digitally correct suboptimal images [
7] and send those over the internet to radiologists who may be working in distant or remote locations. With increasing volumes of examinations, problems with the original acquisition may not be immediately obvious and direct radiologist–technologist communication and correction of quality issues is difficult or sometimes impossible to achieve. Among the previously-cited limitations of current QA practices are the underreporting of QA deficiencies and the lack of supporting data to direct technologist education [
8].
Our method differs from the previously described software-assisted technologist peer review process. Previous work by Hsiao et al. [
9] described standardized reporting of quality metrics using software assistance. Manual input of data into standardized spreadsheets was required in their work. The process used in the current study can be used for the automatic generation of reports, without the need to manually input data.
We acknowledge some limitations in our study. There were no images that required call-back at our institution or repeat imaging. We did not evaluate whether images were electronically collimated prior to transmission to the reading PACS stations. We did not evaluate whether automatic collimation or manual collimation was used by the technologists. In our opinion, these limitations do not significantly affect our primary goal, i.e., to train and develop a tool that can be used to automatically grade collimation quality using an indirect collimation metric.
5. Conclusions
An AI-generated metric that calculates the percentage of unused radiographic space in hand radiographs correlates moderately well with radiographic quality assessed by expert radiologists. The unused space at the top of the hand image demonstrated the best correlation. Implications of this approach include the automation, standardization and scalability of the QA process; decreased radiation doses to patients; and increased efficiency for radiologists, possibly with enhanced diagnostic accuracy.
Author Contributions
Conceptualization, O.A. and A.C.; methodology, O.A., D.C., D.S.M., U.T. and A.C.; software, O.A. and D.C.; validation, O.A. and A.C.; formal analysis, O.A. and A.C.; investigation, O.A., D.C., D.S.M., U.T. and A.C.; resources, O.A., D.C., D.S.M., U.T. and A.C.; data curation, O.A. and A.C.; writing—original draft preparation, O.A.; writing—review and editing, O.A., D.C., D.S.M., U.T. and A.C.; visualization, O.A; supervision, A.C.; project administration, O.A. All authors have read and agreed to the published version of the manuscript.
Funding
This research received no external funding.
Institutional Review Board Statement
The study was conducted according to the guidelines of the Declaration of Helsinki, and approved by the Institutional Review Board of UT Southwestern (STU 112017-003 11 June 2020).
Informed Consent Statement
Patient consent was waived due to retrospective nature of this records review project.
Data Availability Statement
The data presented in this study are available in the article.
Conflicts of Interest
The authors declare no conflict of interest.
References
- Obuchowicz, R.; Oszust, M.; Bielecka, M.; Bielecki, A.; Piórkowski, A. Magnetic Resonance Image Quality Assessment by Using Non-Maximum Suppression and Entropy Analysis. Entropy 2020, 22, 220. [Google Scholar] [CrossRef] [PubMed] [Green Version]
- Ali, S.; Zhou, F.; Bailey, A.; Braden, B.; East, J.E.; Lu, X.; Rittscher, J. A deep learning framework for quality assessment and restoration in video endoscopy. Med. Image Anal. 2021, 68, 101900. [Google Scholar] [CrossRef] [PubMed]
- European Society of Radiology (ESR). White paper on radiation protection by the European Society of Radiology. Insights Imaging 2011, 2, 357–362. [Google Scholar] [CrossRef] [PubMed] [Green Version]
- Stollfuss, J.; Schneider, K.; Krüger-Stollfuss, I. A comparative study of collimation in bedside chest radiography for preterm infants in two teaching hospitals. Eur. J. Radiol. Open 2015, 2, 118–122. [Google Scholar] [CrossRef] [PubMed] [Green Version]
- Karami, V.; Zabihzadeh, M. Beam Collimation during Lumbar Spine Radiography: A Retrospective Study. J. Biomed. Phys. Engl. 2017, 7, 101–106. [Google Scholar]
- Krupinski, E.A.; Williams, M.B.; Andriole, K.; Strauss, K.J.; Applegate, K.; Wyatt, M.; Bjork, S.; Seibert, J.A. Digital radiography image quality: Image processing and display. J. Am. Coll. Radiol. 2007, 4, 389–400. [Google Scholar] [CrossRef] [PubMed]
- Bomer, J.; Wiersma-Deijl, L.; Holscher, H.C. Electronic collimation and radiation protection in paediatric digital radiography: Revival of the silver lining. Insights Imaging 2013, 4, 723–727. [Google Scholar] [CrossRef] [PubMed] [Green Version]
- Reiner, B.I. Automating quality assurance for digital radiography. J. Am. Coll. Radiol. 2009, 6, 486–490. [Google Scholar] [CrossRef] [PubMed]
- Hsiao, A.M.; Budau-Bymoen, A.; Seslija, P.; Yong-Hing, C.J.; Thakur, Y. Peer Review Tool for General Radiography Technologists Improves Image Quality. Can. Assoc. Radiol. J. 2020, 71, 48–57. [Google Scholar] [CrossRef] [PubMed] [Green Version]
| Publisher’s Note: MDPI stays neutral with regard to jurisdictional claims in published maps and institutional affiliations. |
© 2021 by the authors. Licensee MDPI, Basel, Switzerland. This article is an open access article distributed under the terms and conditions of the Creative Commons Attribution (CC BY) license (https://creativecommons.org/licenses/by/4.0/).


