
Fischer–Tropsch Synthesis: Effect of the Promoter’s Ionic Charge and Valence Level Energy on Activity


 ,
, 
Abstract
:1. Introduction
2. Materials and Methods
2.1. Catalyst Preparation
2.2. BET Surface Area and Porosity Measurements
2.3. In Situ Synchrotron X-ray Diffraction
2.4. Temperature Programmed Reduction (TPR)
2.5. Hydrogen Temperature Programmed Desorption (TPD)
2.6. CO-Temperature Programmed Carburization/Mass Spectrometry (TPC-MS)
2.7. Catalytic Activity
3. Results
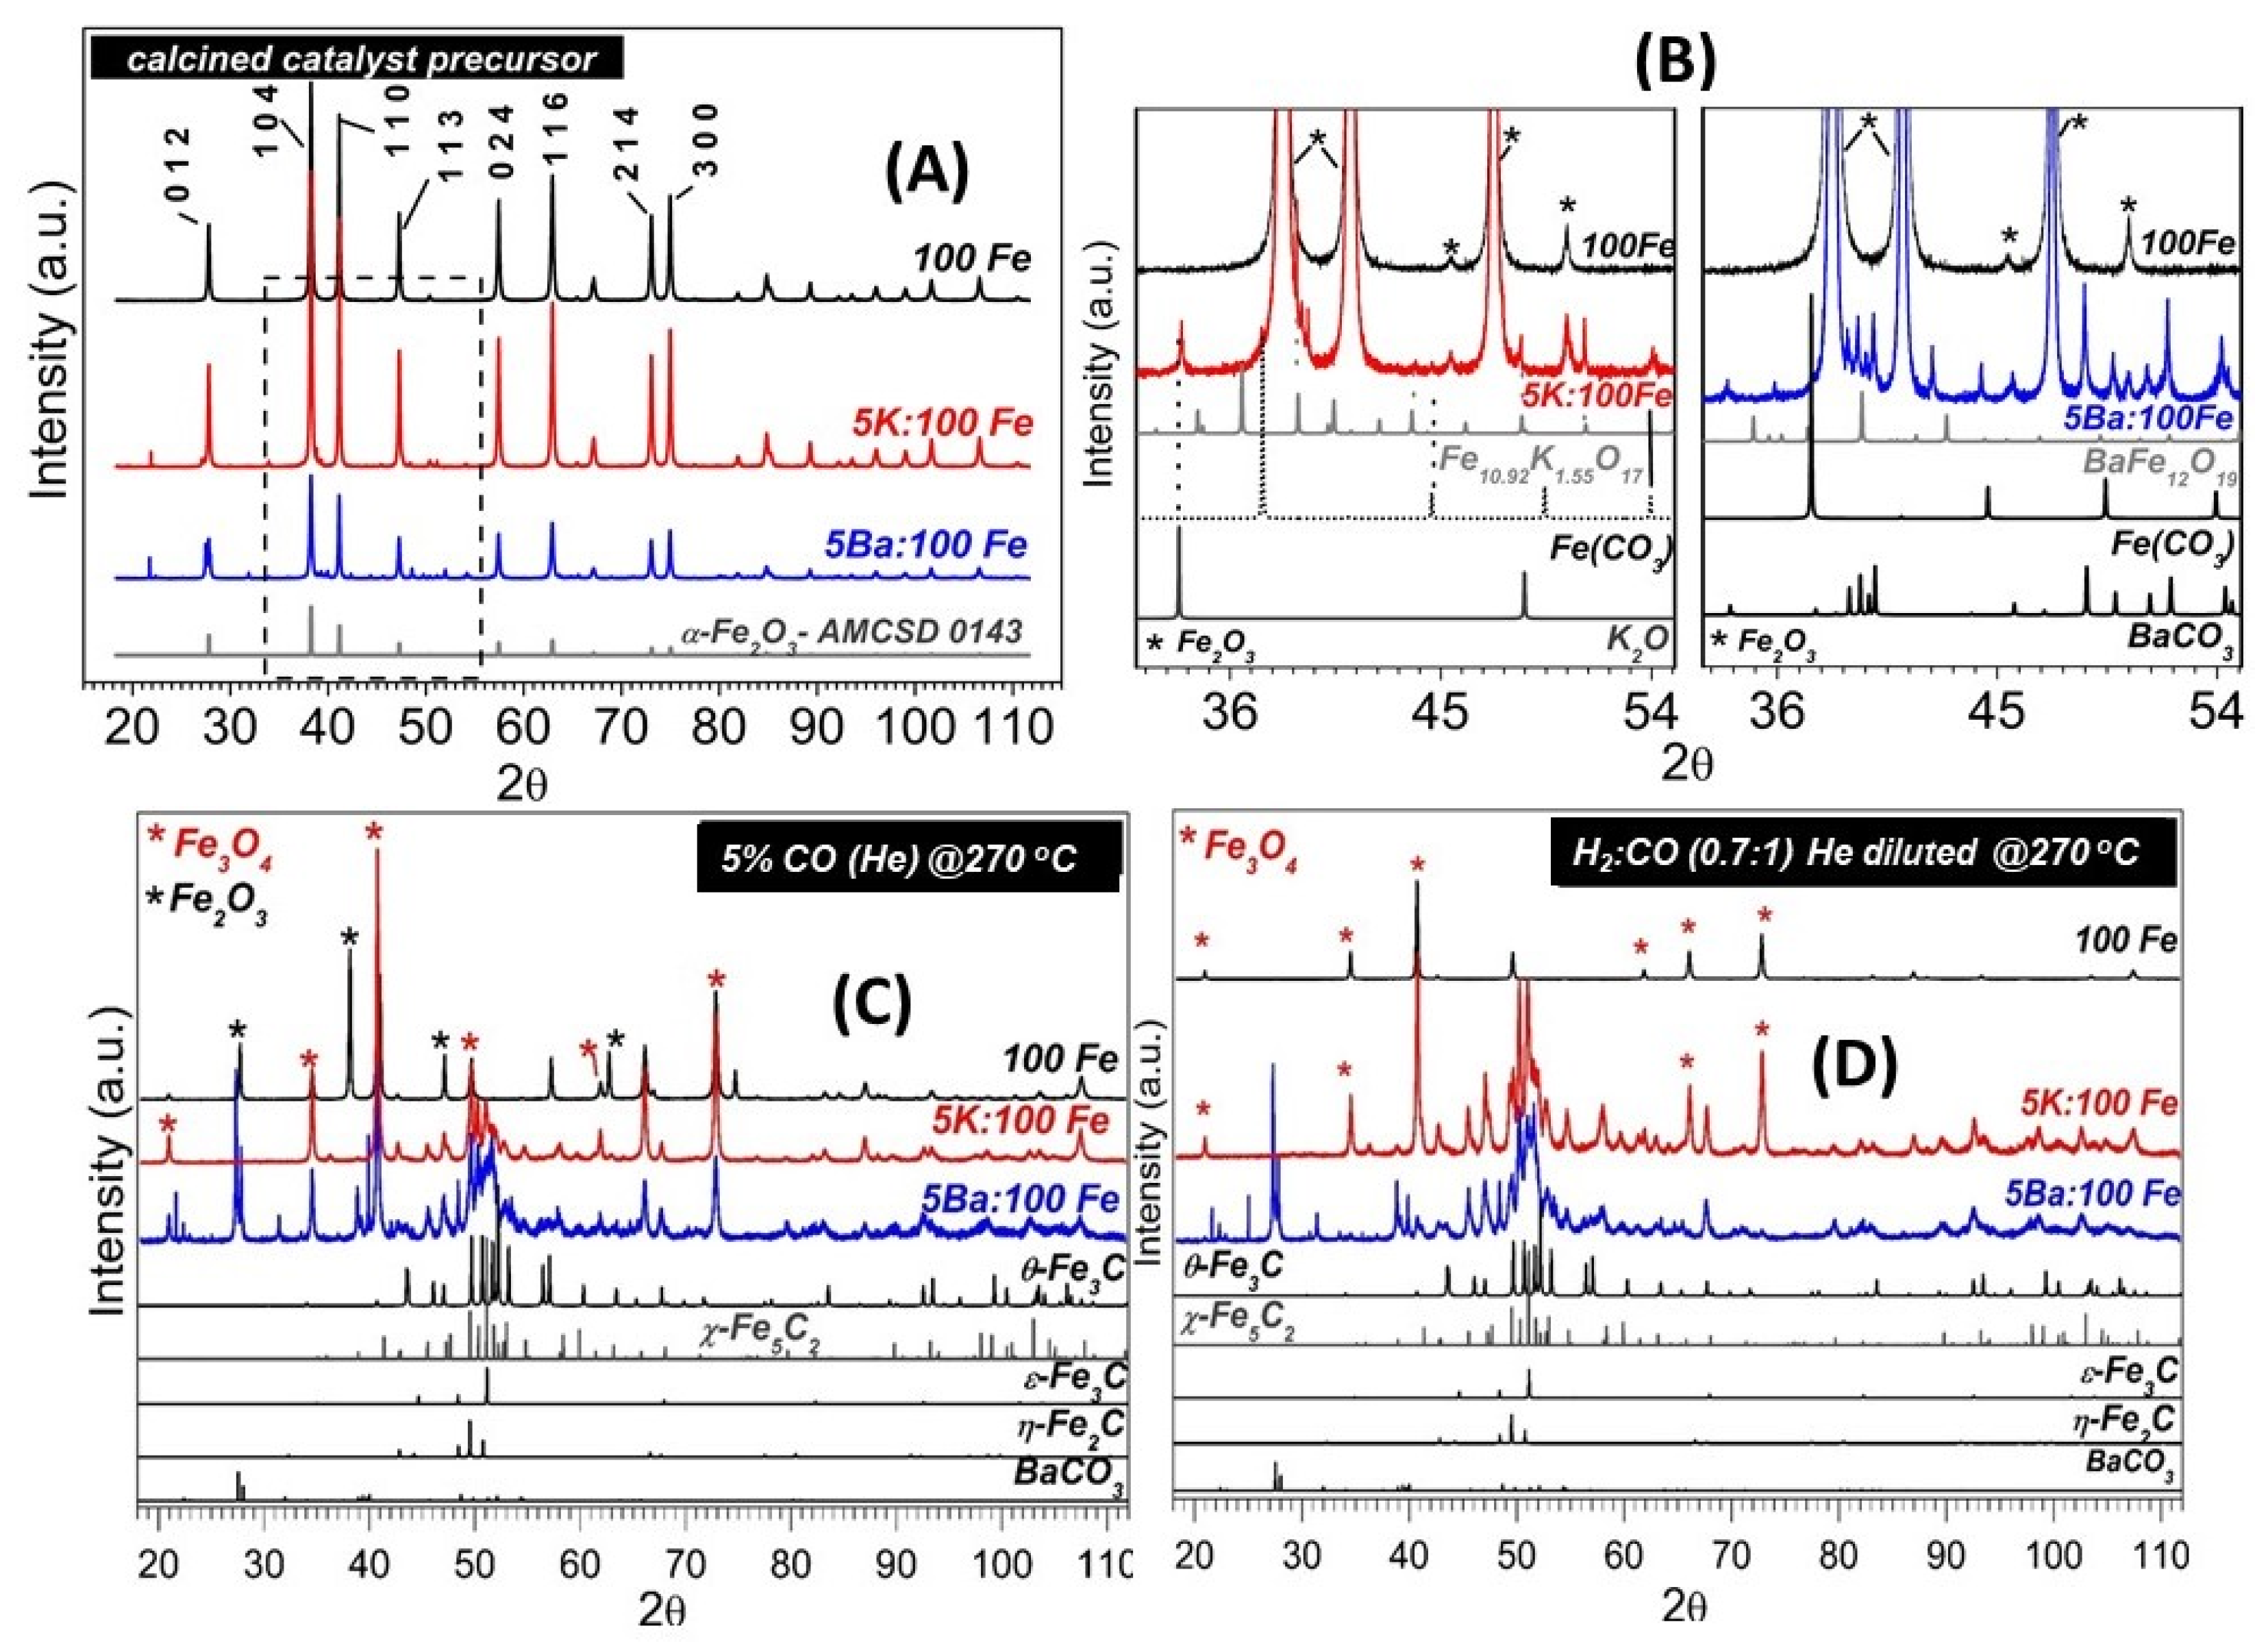
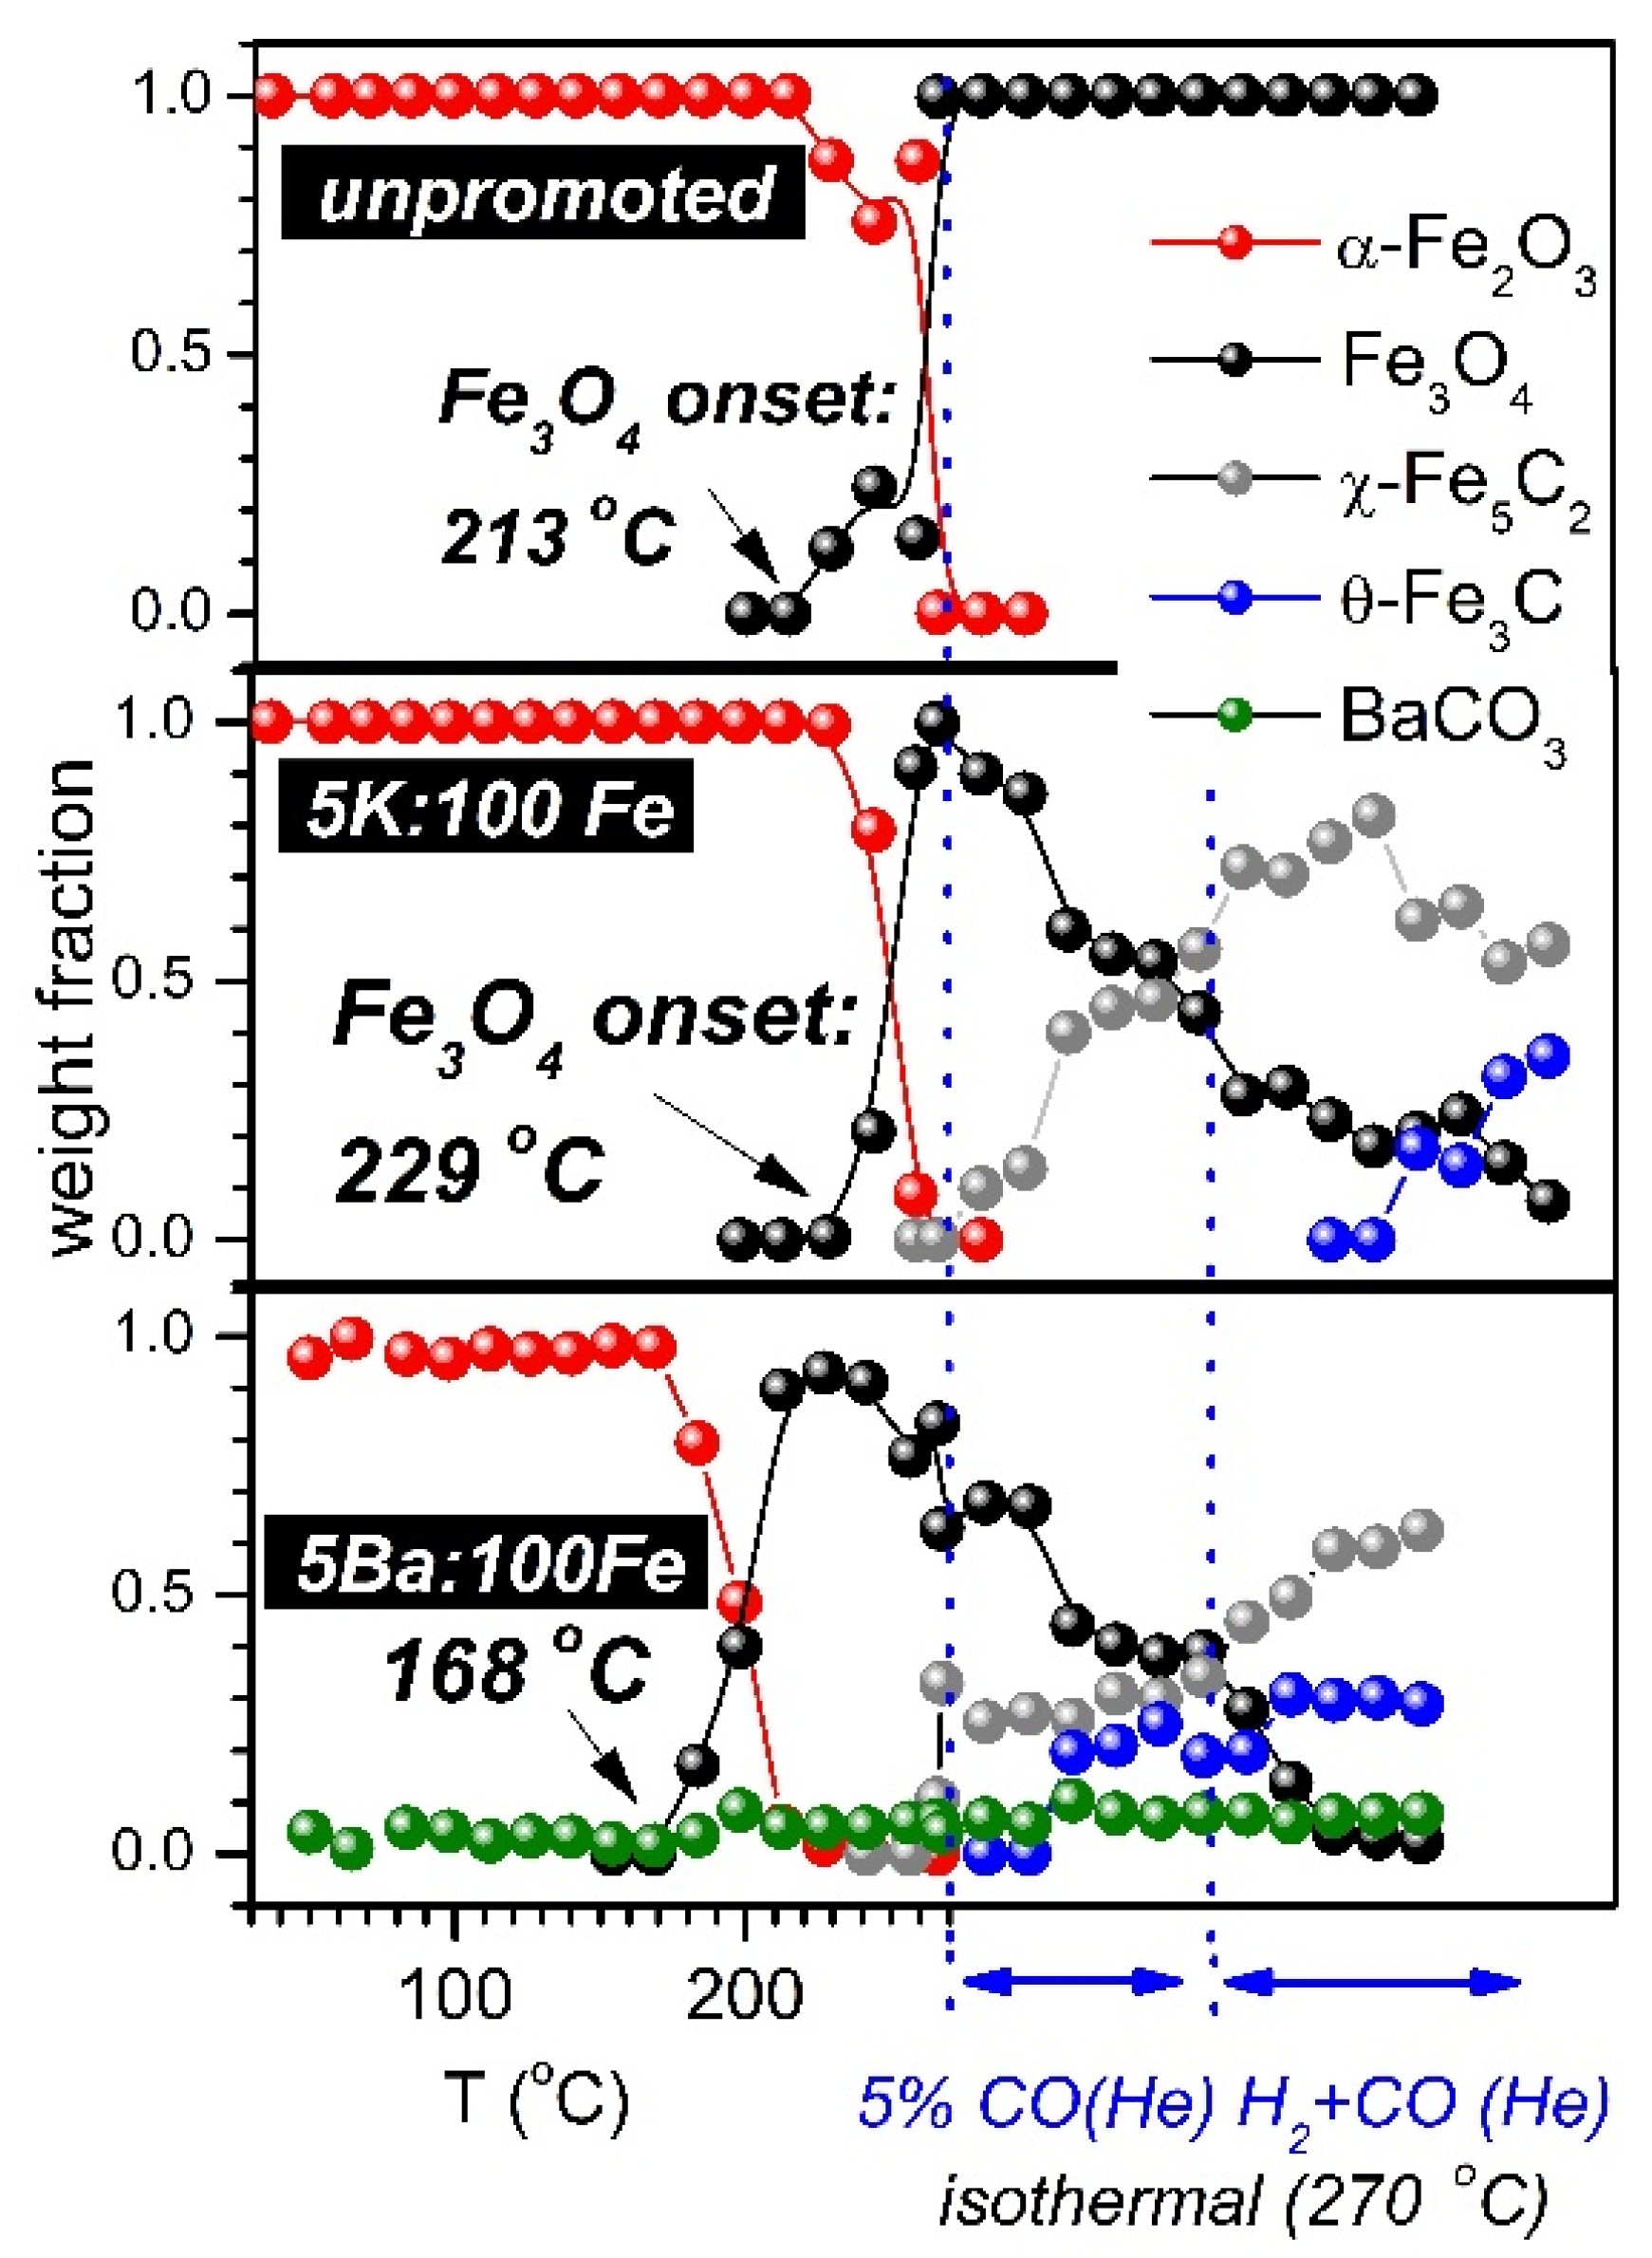
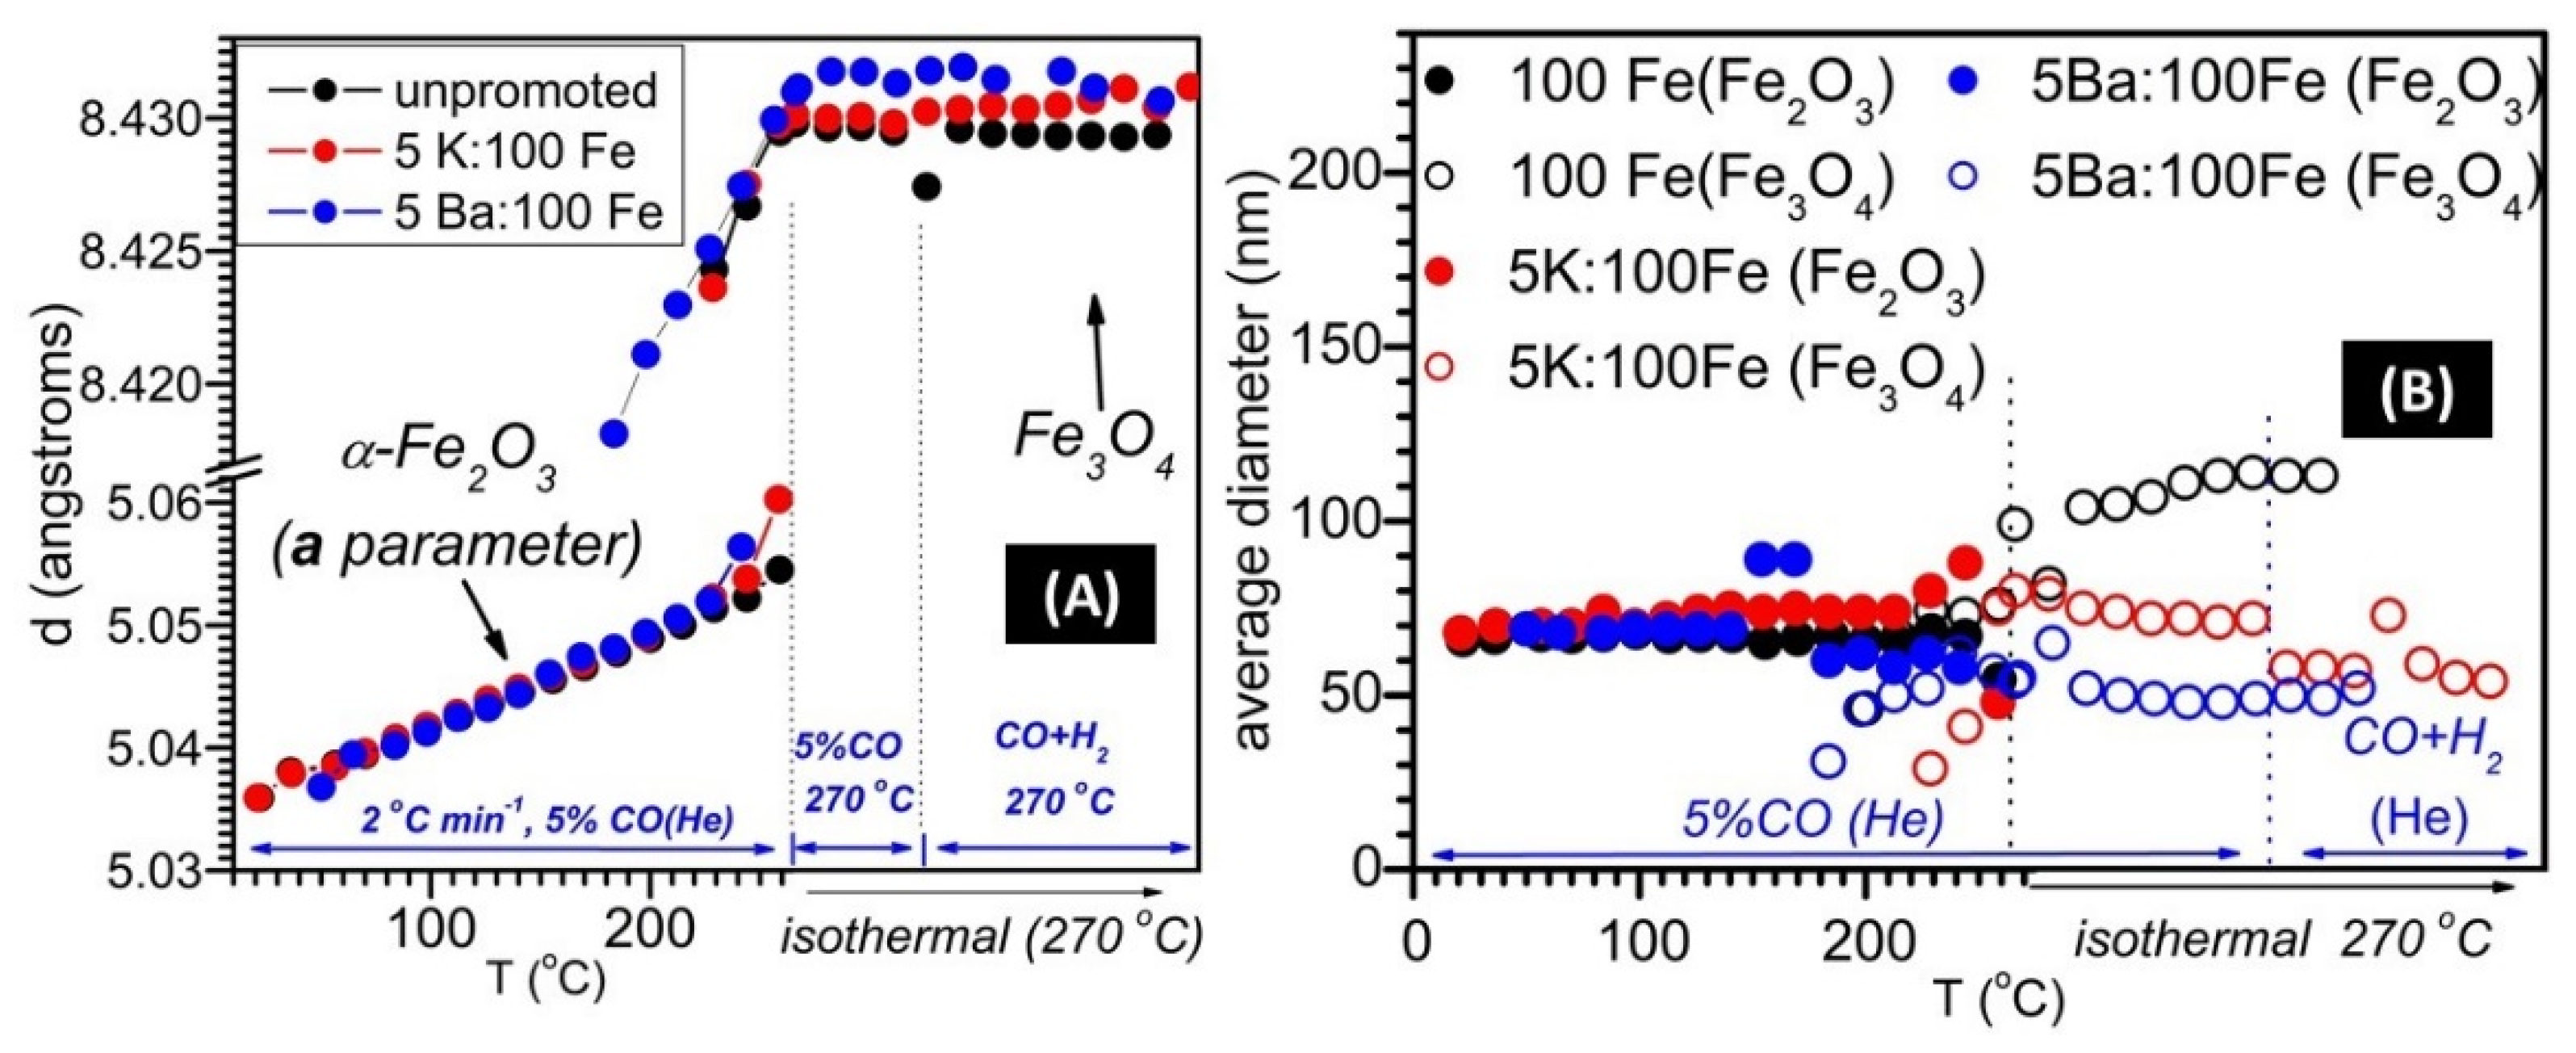
3.1. SXRPD Studies
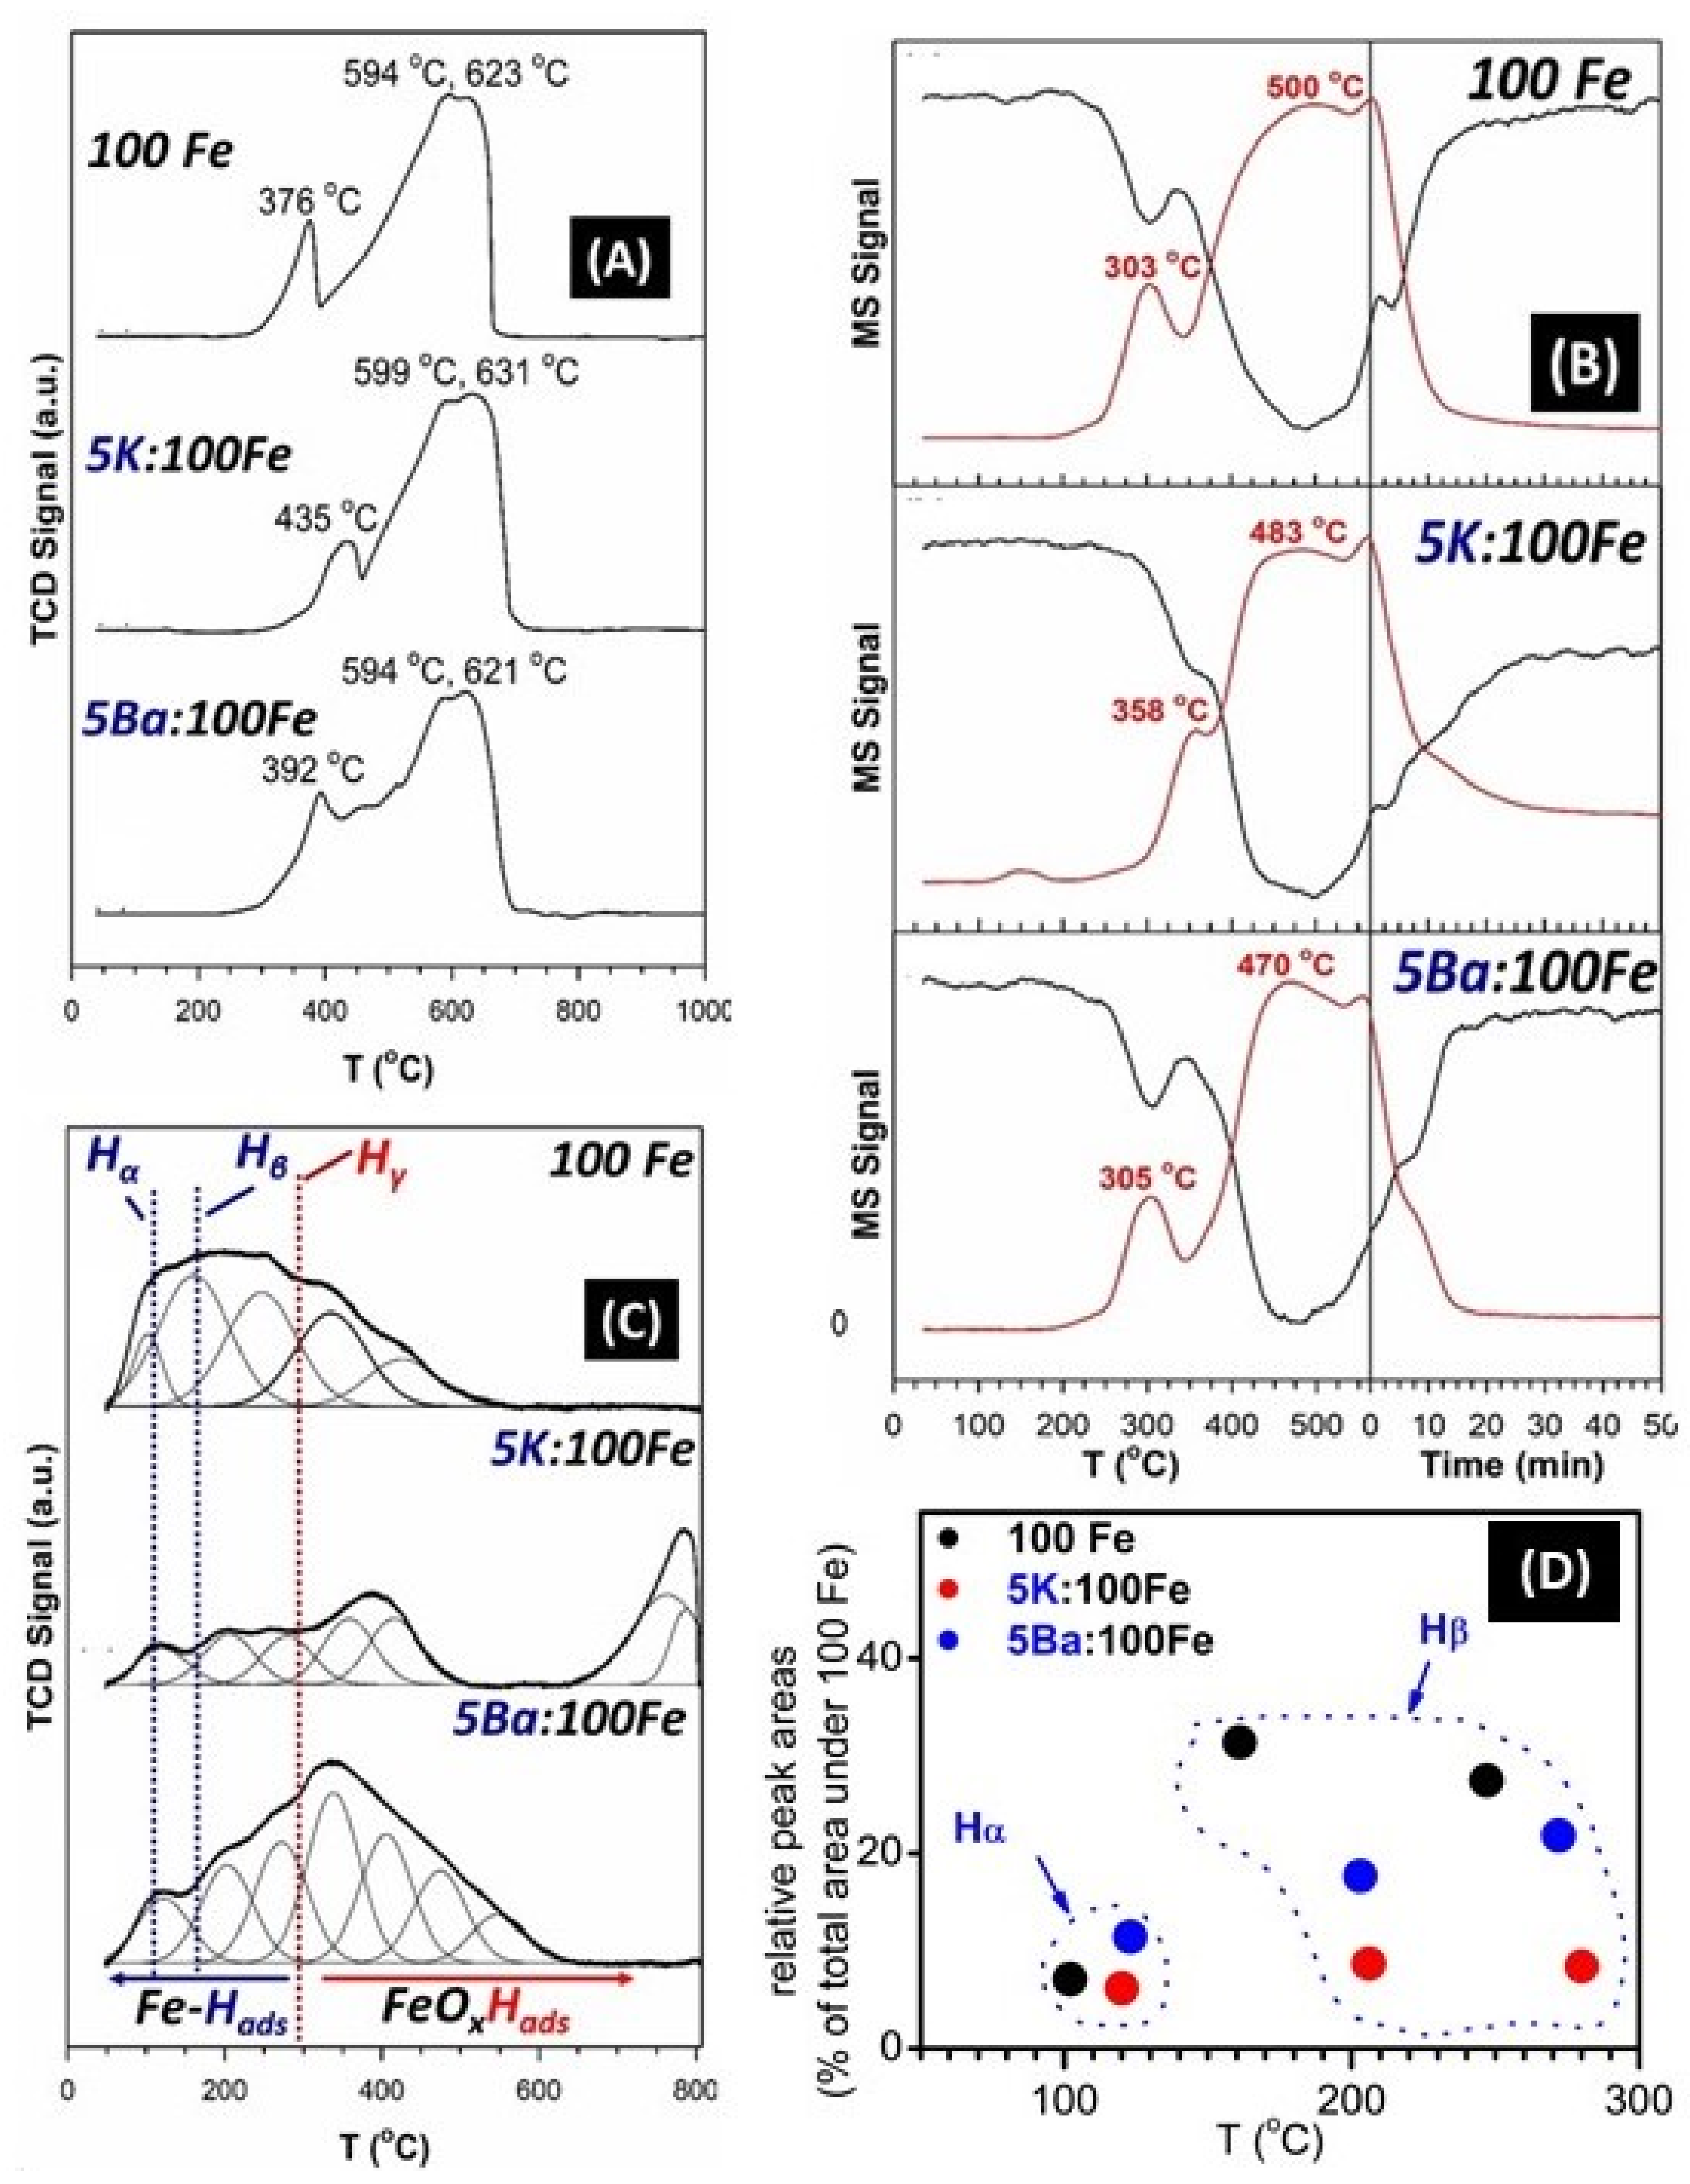
3.2. Temperature-Programmed Studies
3.3. BET Results
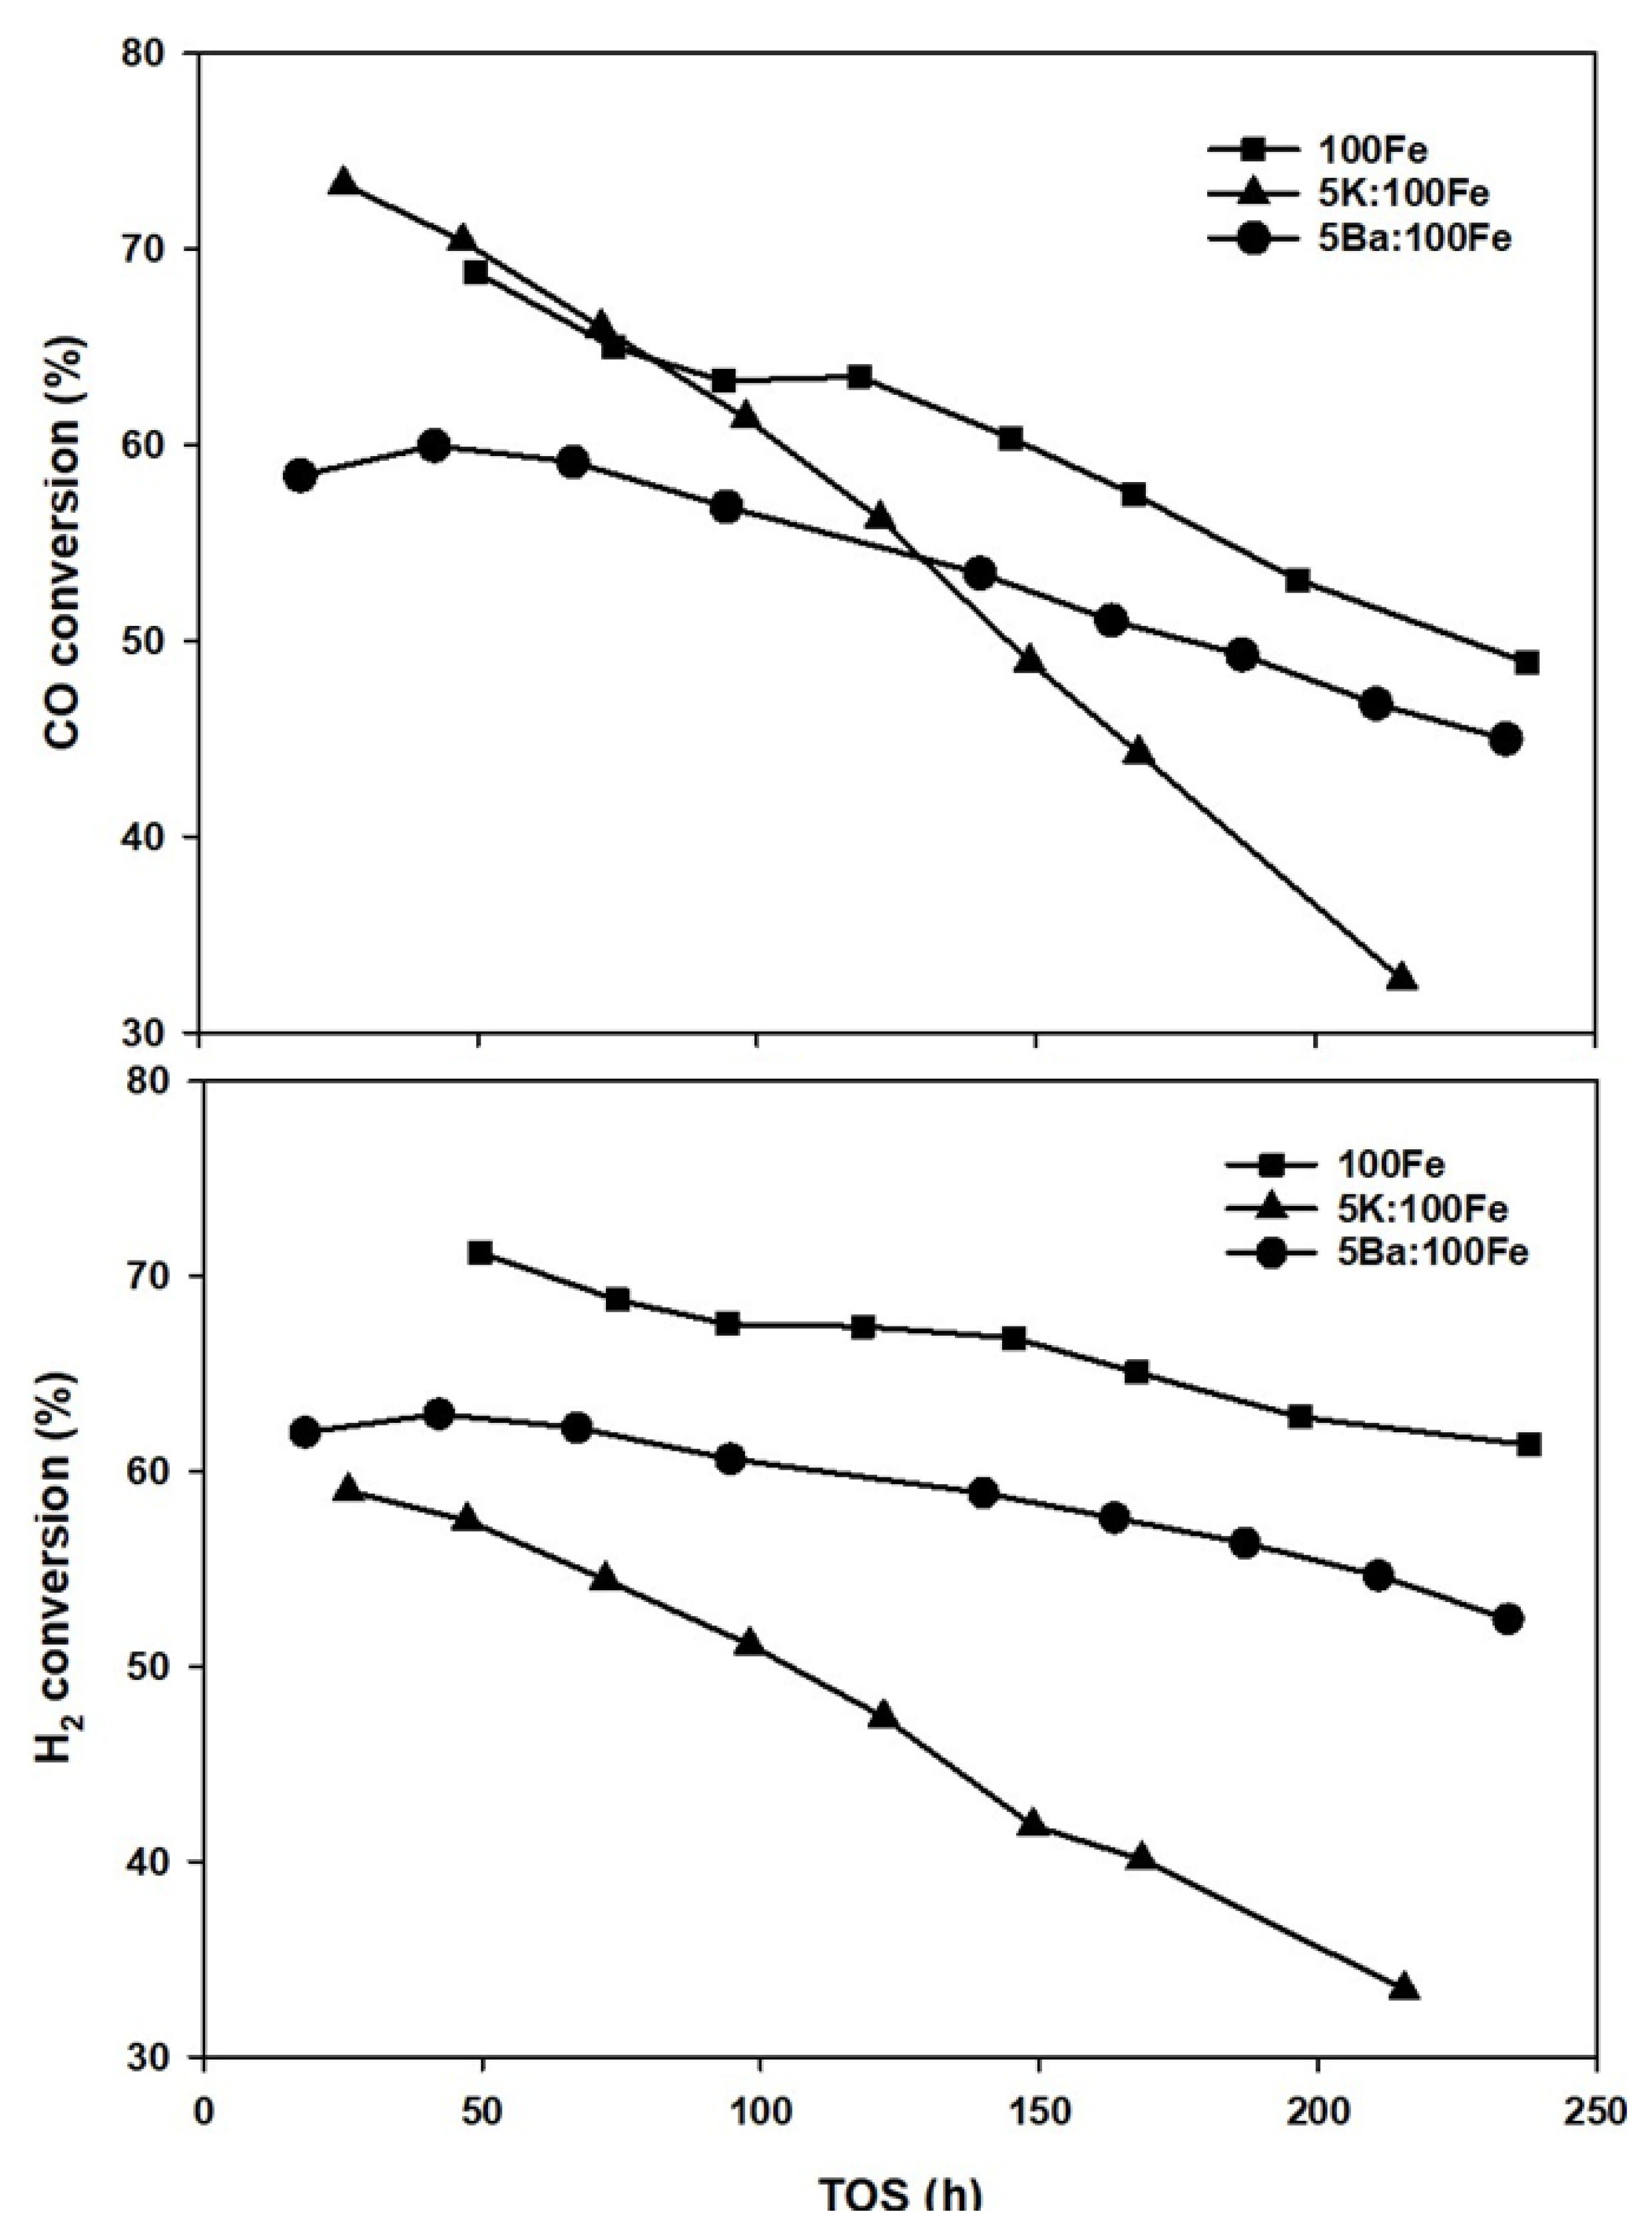
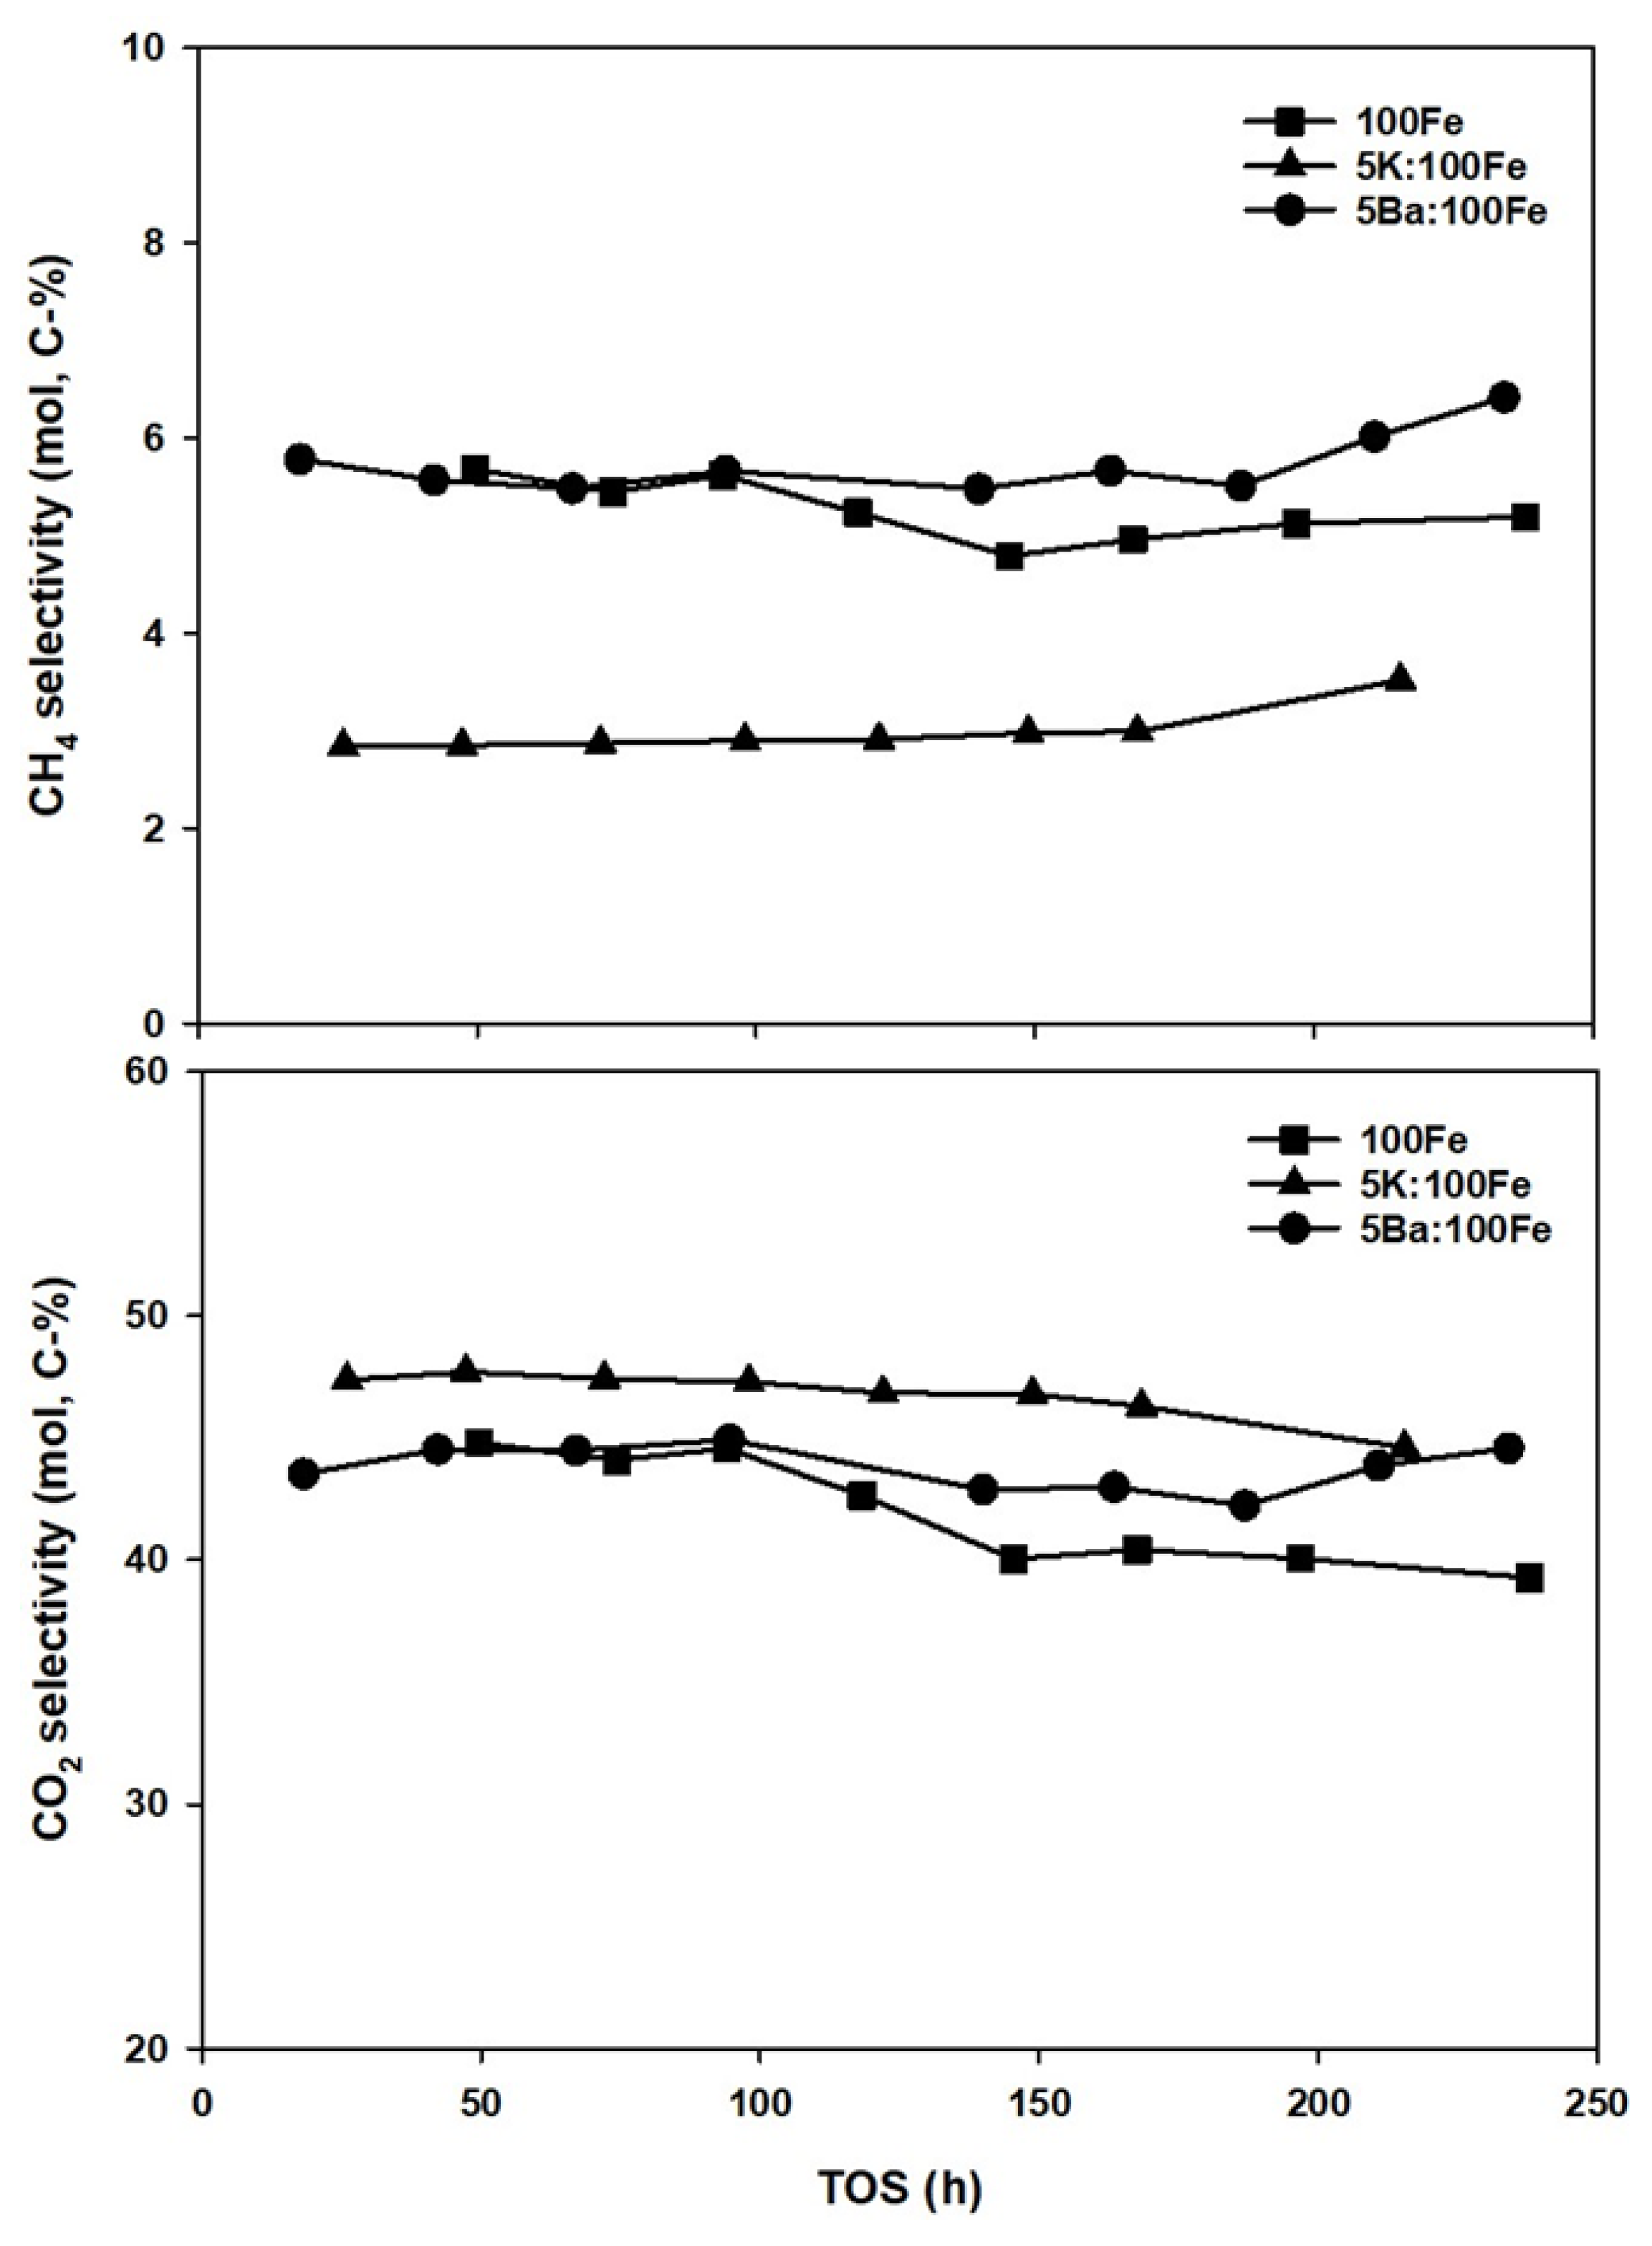
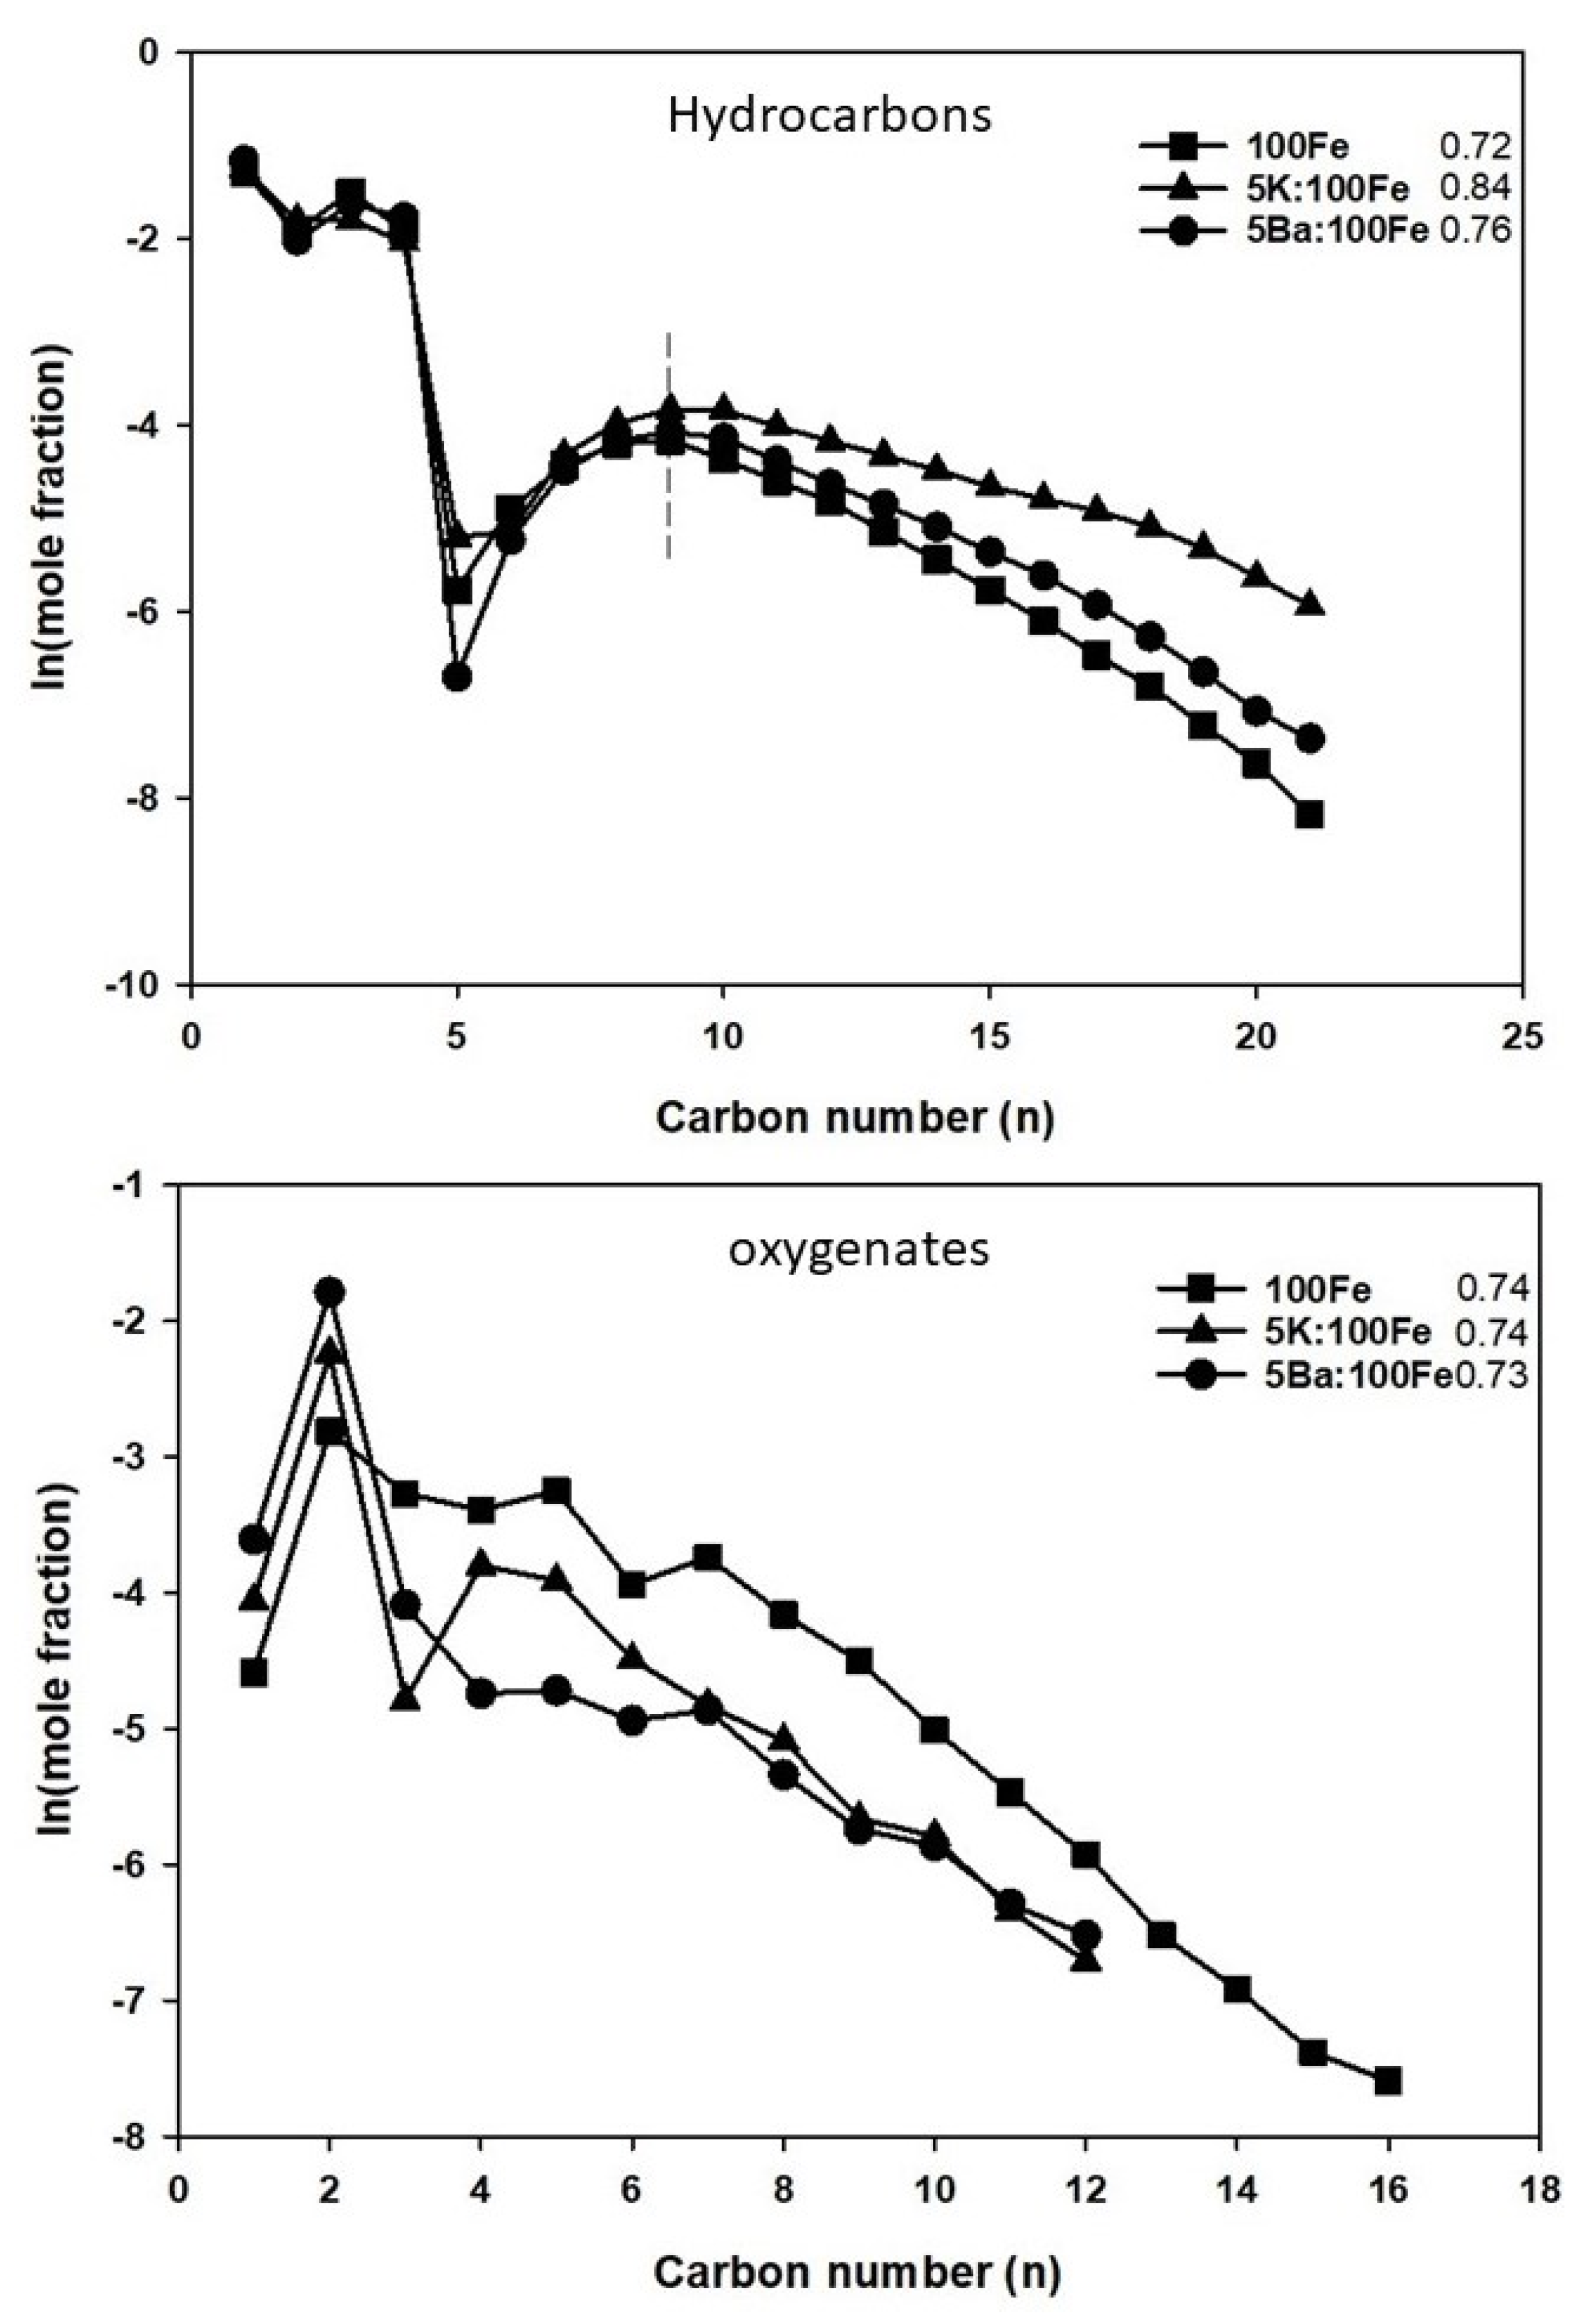
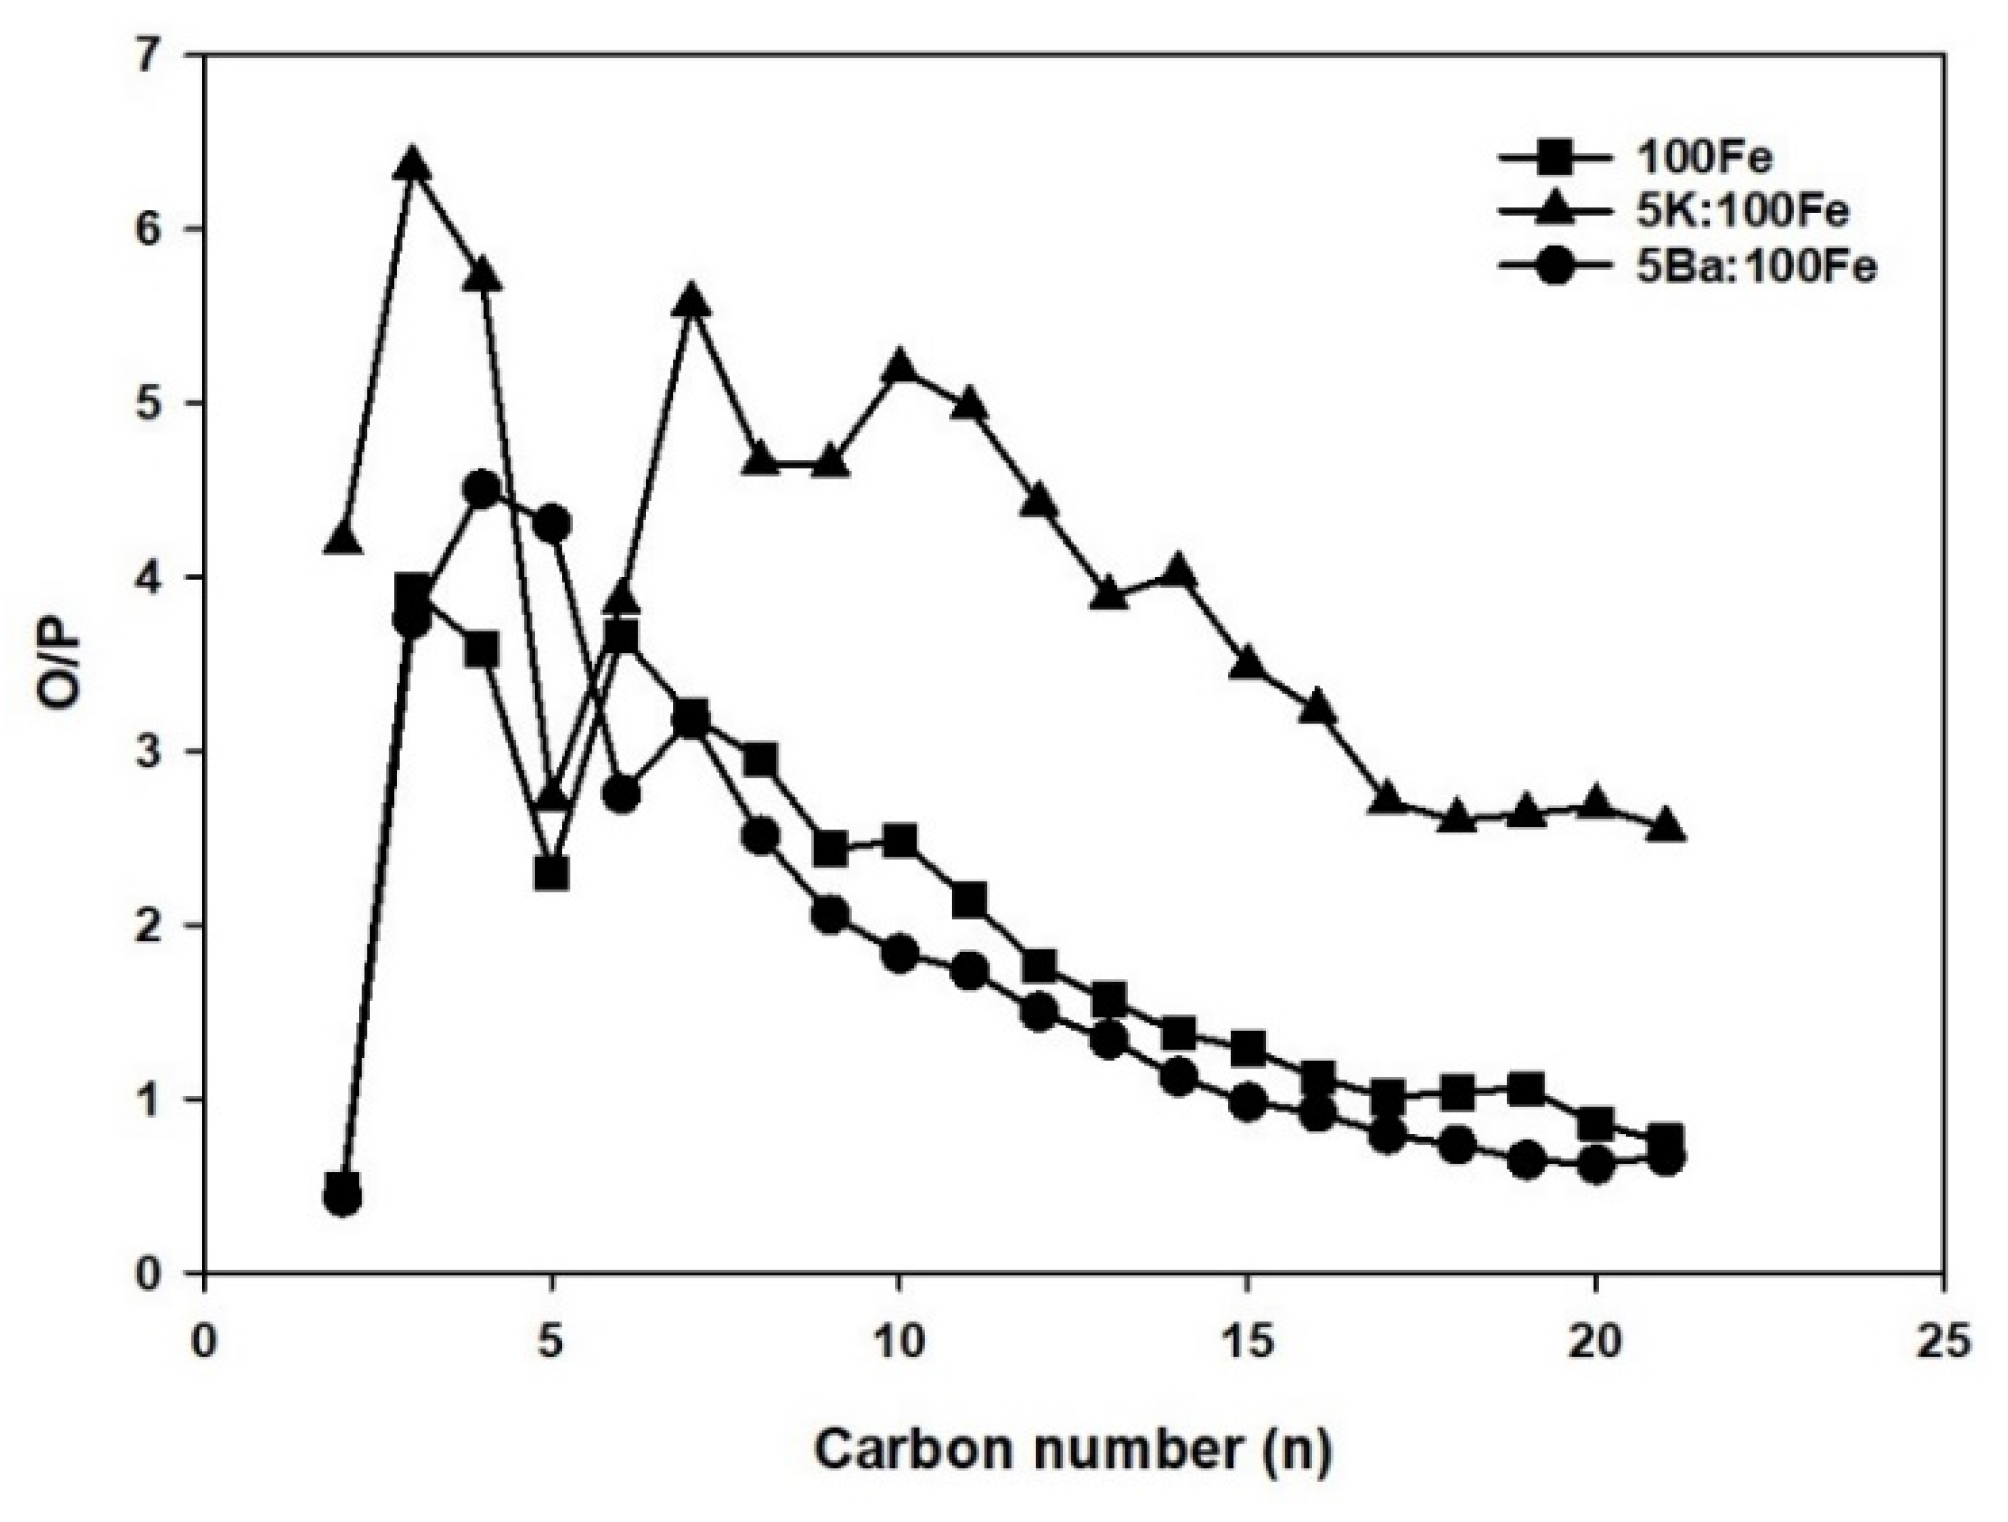
3.4. FTS Catalyst Testing
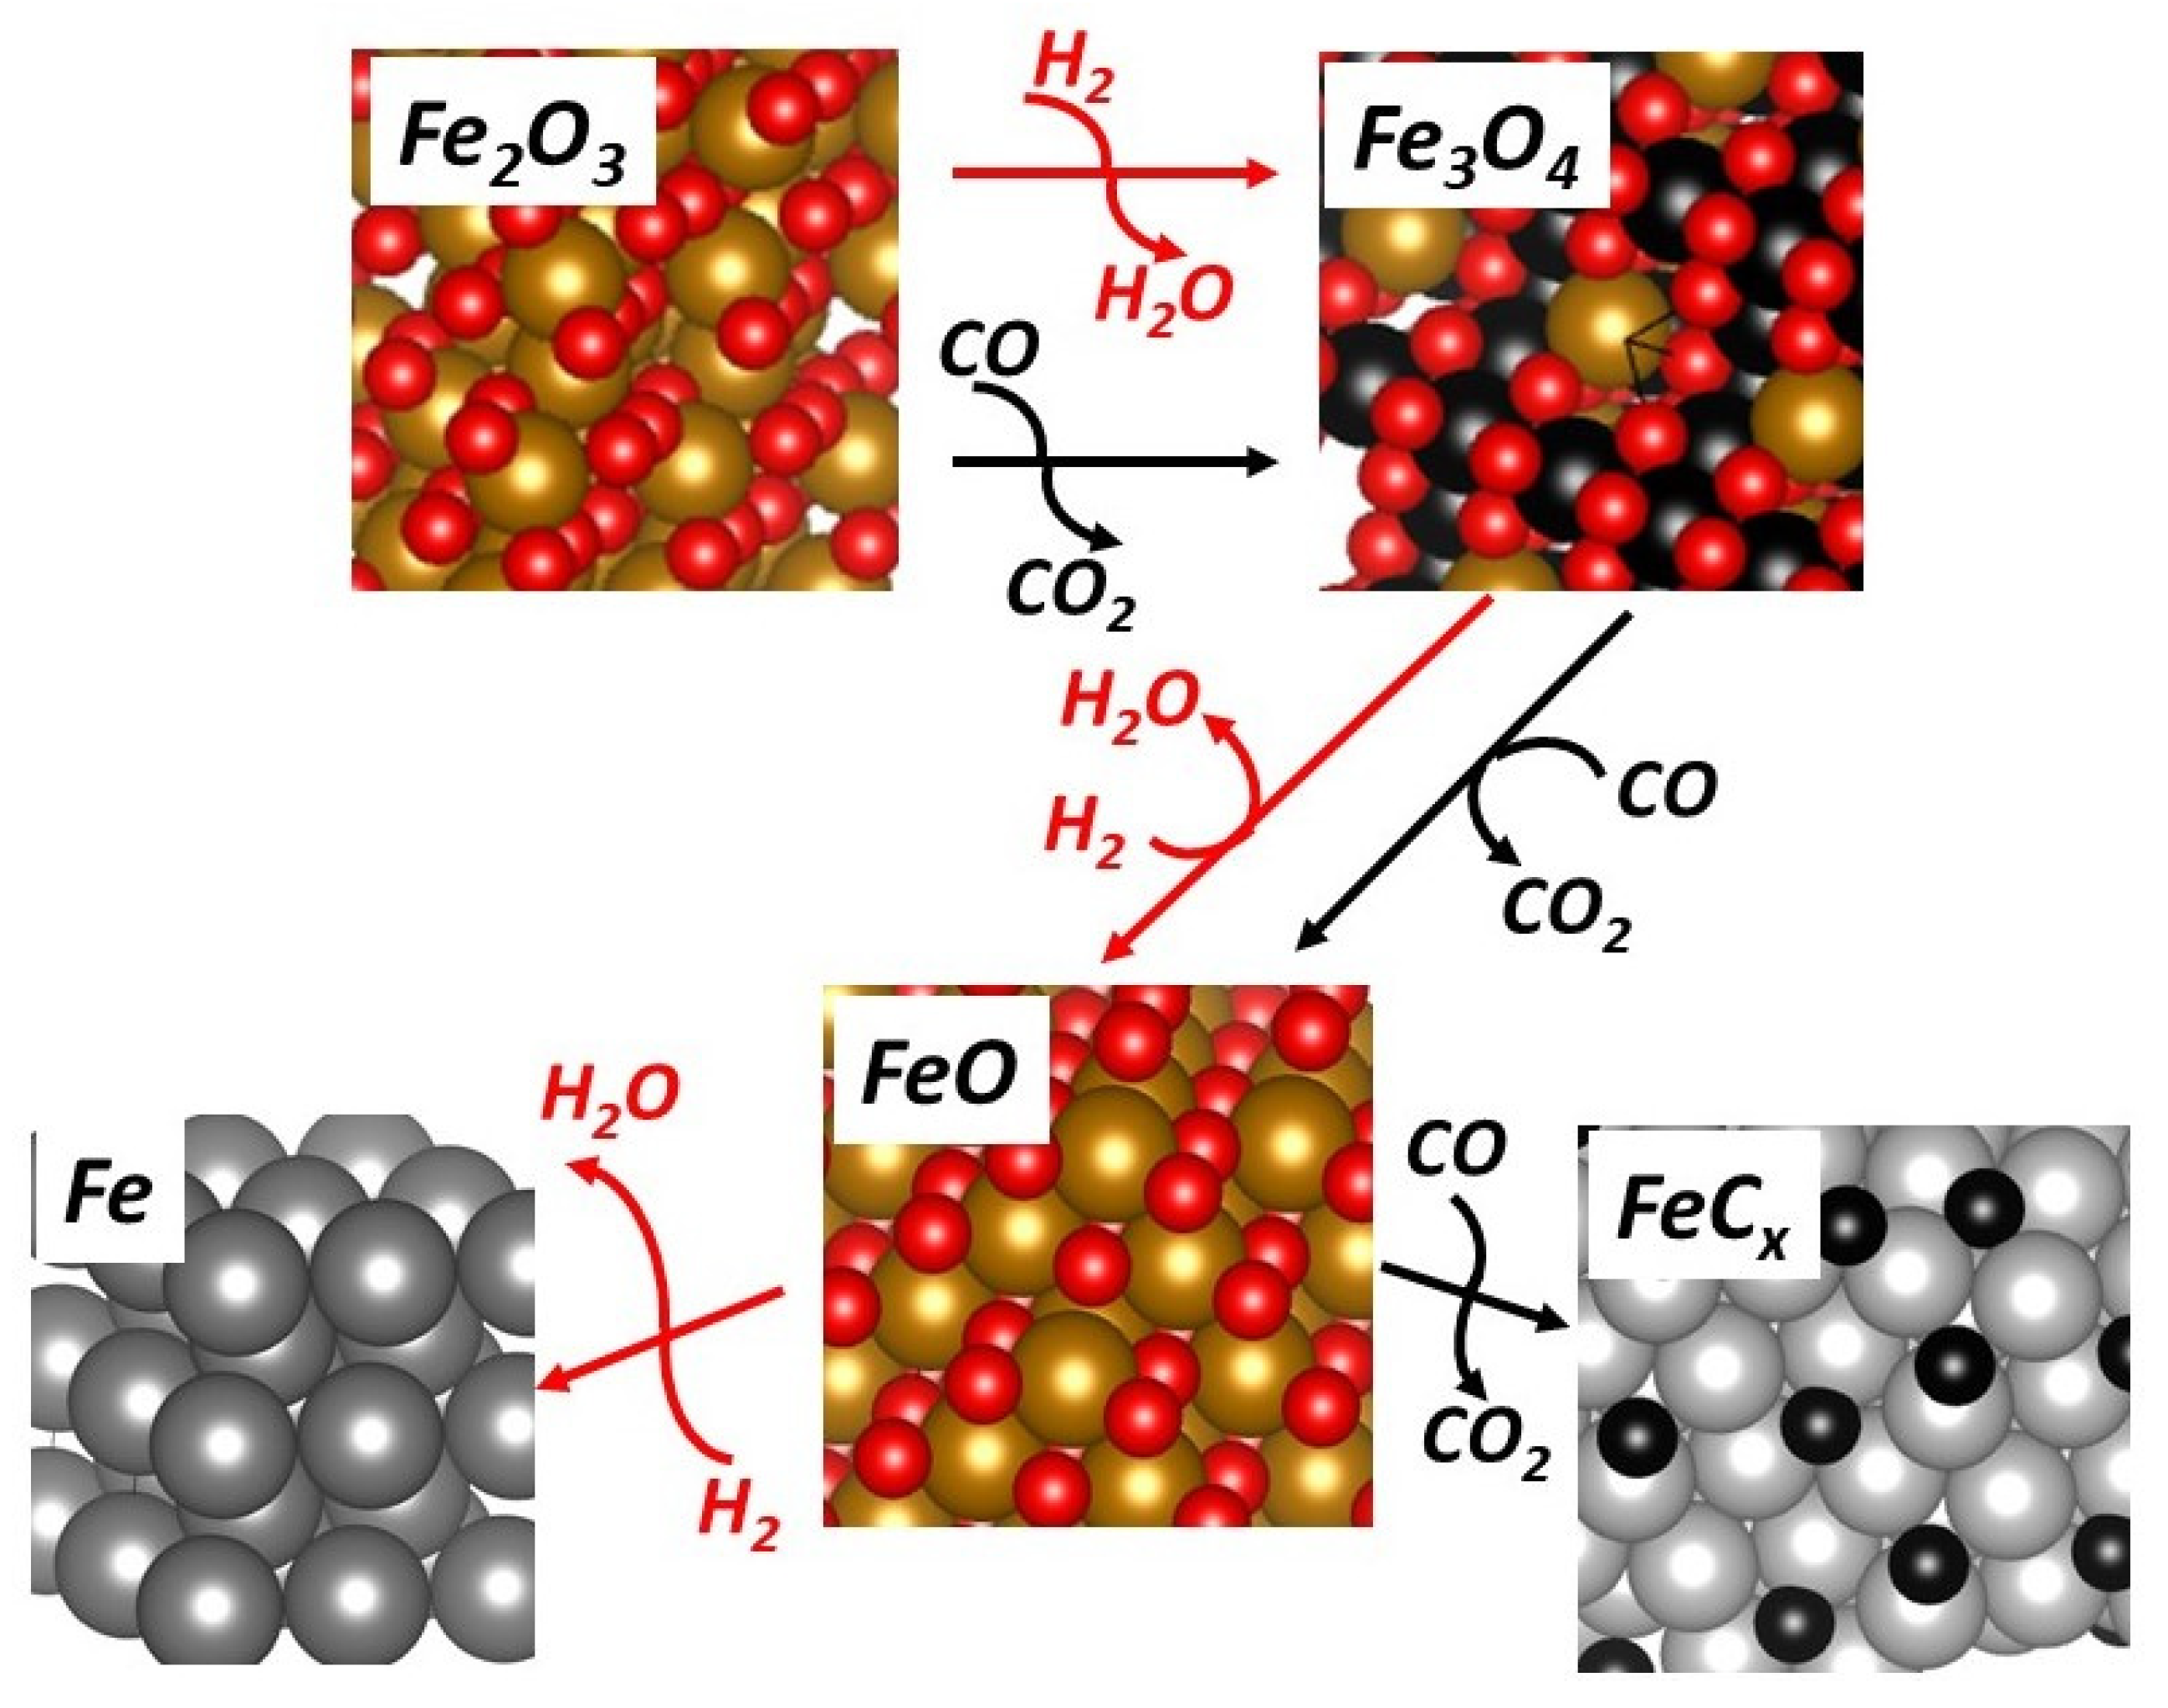
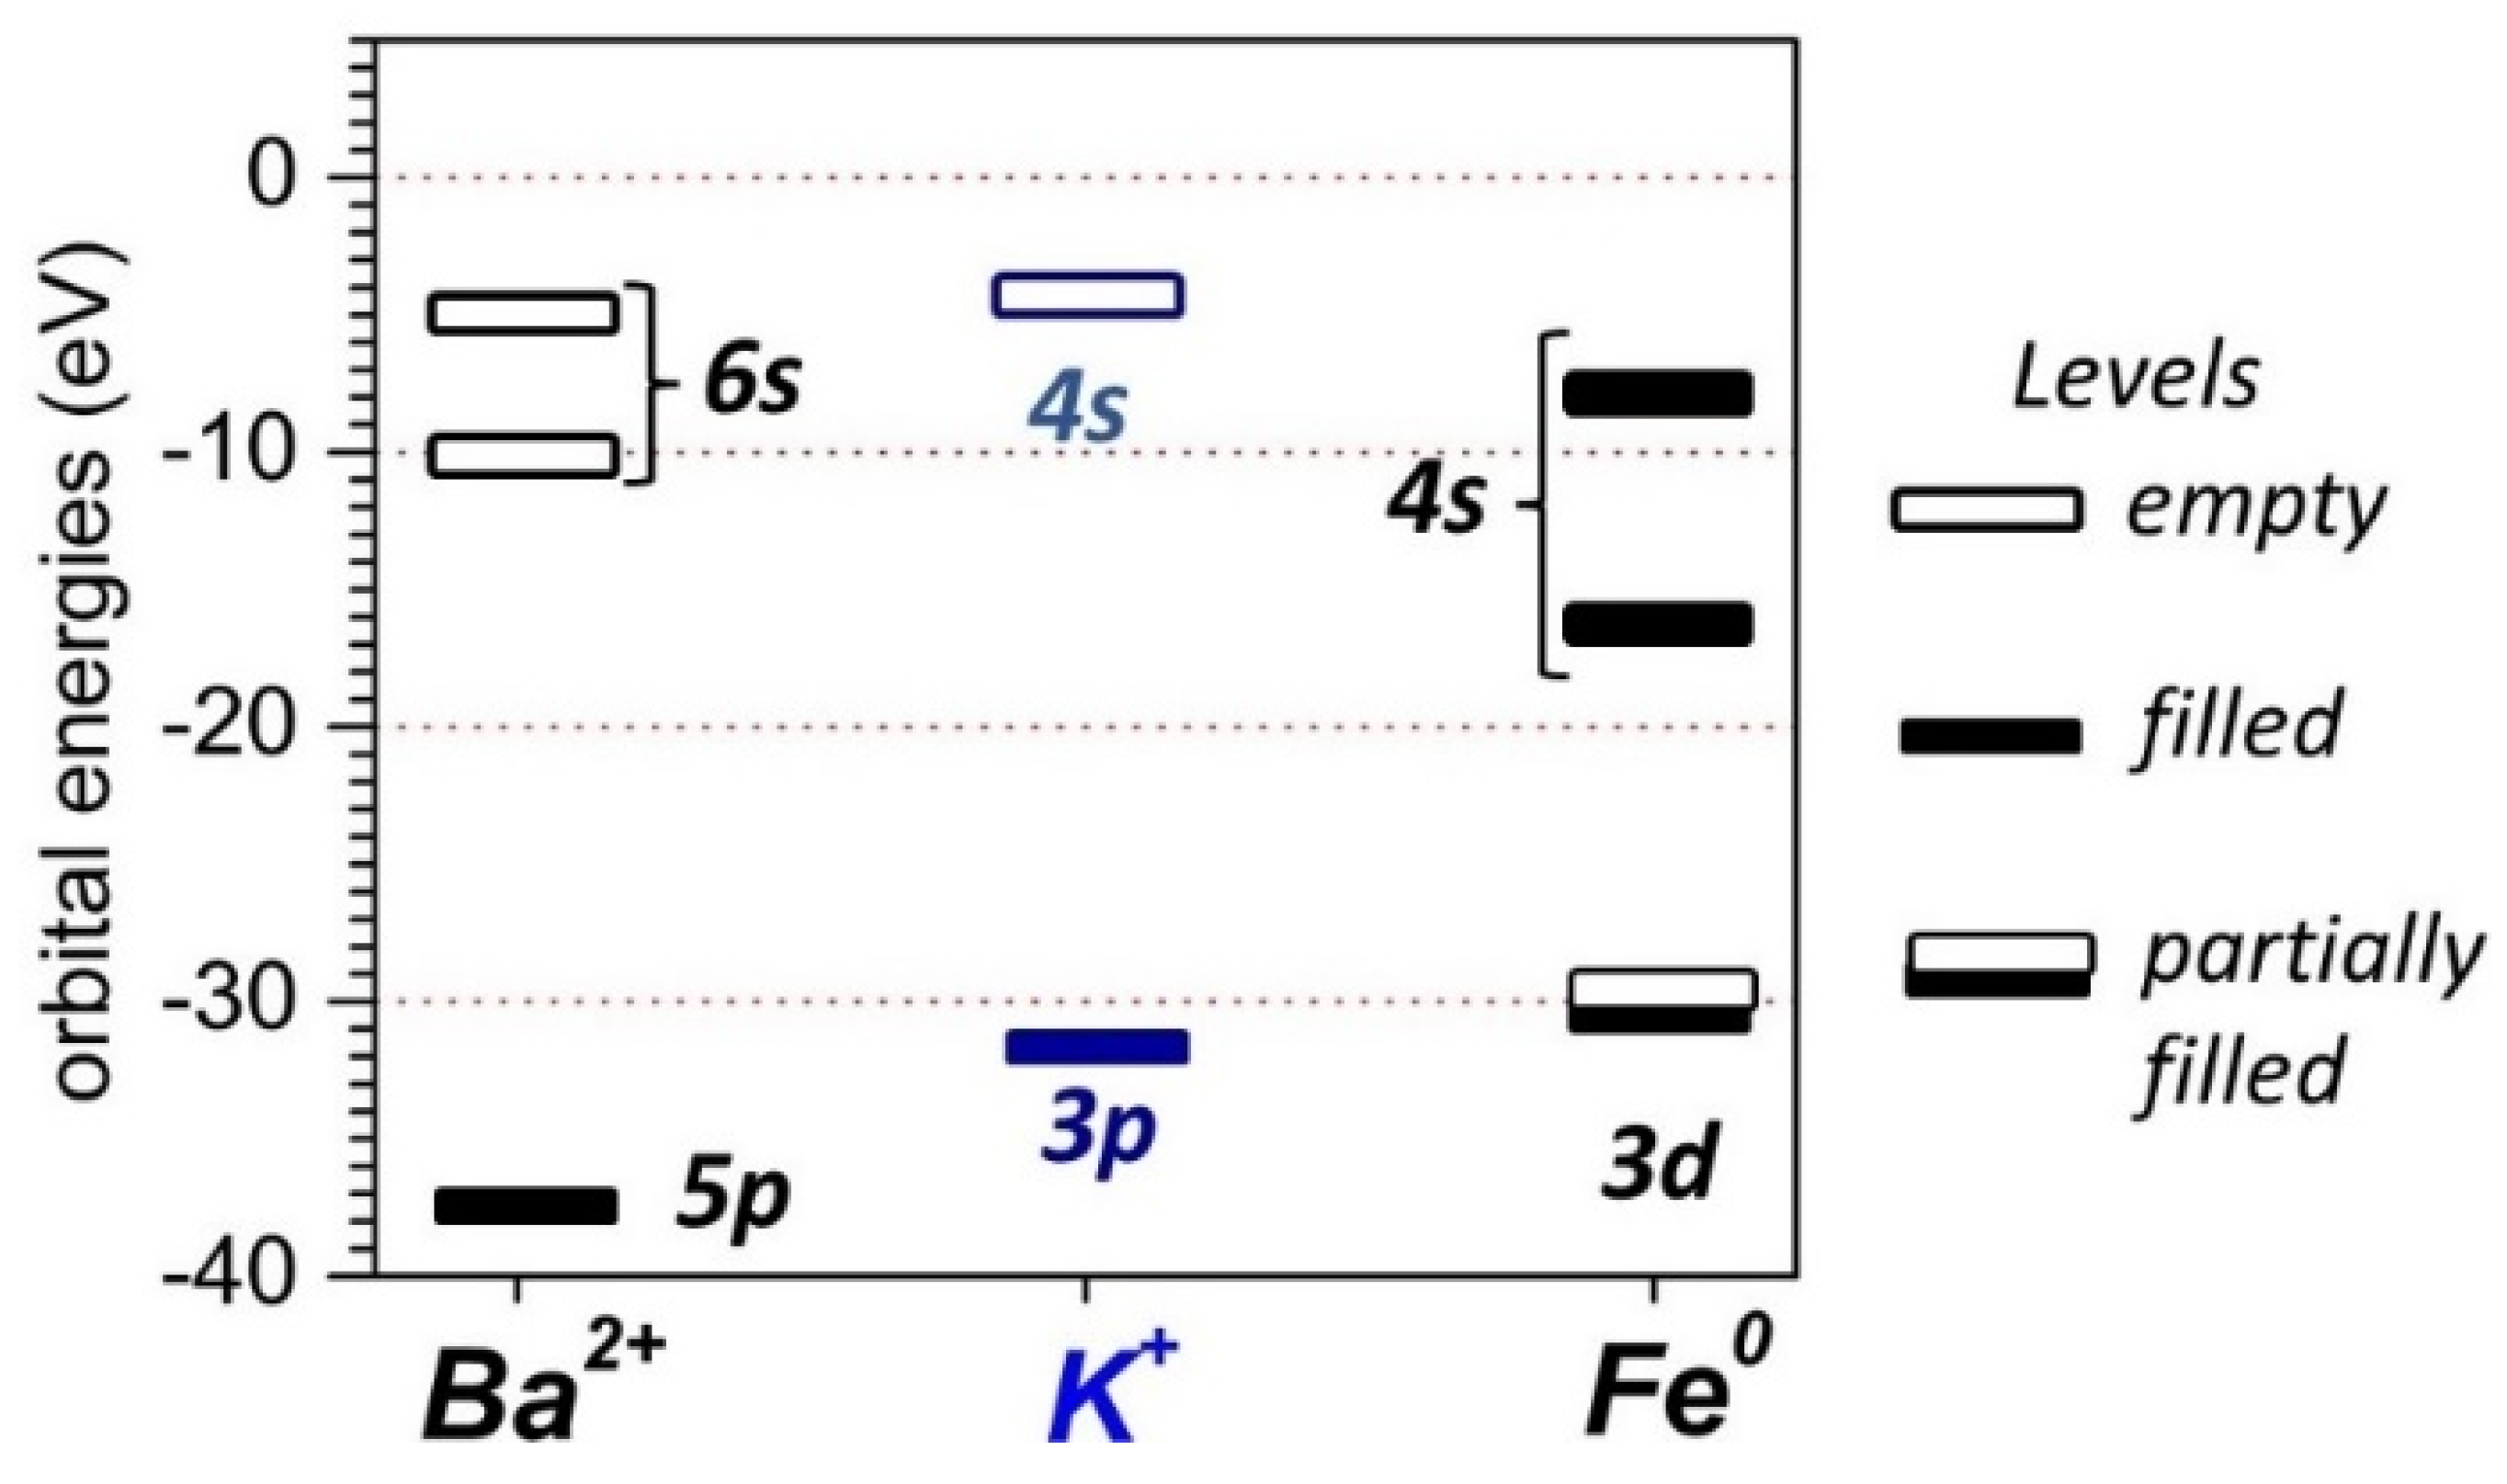
4. Discussion
5. Conclusions
Supplementary Materials
Author Contributions
Funding
Acknowledgments
Conflicts of Interest
References
- van de Loosdrecht, J.; Botes, F.G.; Ciobica, I.M.; Ferreira, A.C.; Gibson, P.; Moodley, D.J.; Saib, A.M.; Visagie, J.L.; Weststrate, C.J.; Niemantsverdriet, J.W. Fischer-Tropsch synthesis: Catalysts and chemistry. In Comprehensive Inorganic Chemistry II: From Elements to Applications; Surface Inorganic Chemistry and Heterogeneous Catalysis; Reedijk, J., Poeppelmeier, K., Eds.; Elsevier: Amsterdam, The Netherlands, 2013; Volume 7.20, pp. 525–557. [Google Scholar]
- Suo, H.; Wang, S.; Zhang, C.; Xu, J.; Wu, B.; Yang, Y.; Xiang, H.; Li, Y.W. Chemical and structural effects of silica in iron-based Fischer–Tropsch synthesis catalysts. J. Catal. 2012, 286, 111–123. [Google Scholar] [CrossRef]
- Chernavskii, P.A.; Kazak, V.O.; Pankina, G.V.; Perfiliev, Y.D.; Li, T.; Virginie, M.; Khodakov, A.Y. Influence of copper and potassium on the structure and carbidisation of supported iron catalysts for Fischer-Tropsch synthesis. Catal. Sci. Technol. 2017, 7, 2325–2334. [Google Scholar] [CrossRef]
- de Smit, E.; Weckhuysen, B.M. The renaissance of iron-based Fischer-Tropsch synthesis: On the multifaceted catalyst deactivation behavior. Chem. Soc. Rev. 2008, 37, 2758–2781. [Google Scholar] [CrossRef] [PubMed]
- Ribeiro, M.C.; Jacobs, G.; Davis, B.H.; Cronauer, D.C.; Kropf, A.J.; Marshall, C.L. Fischer−Tropsch synthesis: An in-situ TPR-EXAFS/XANES investigation of the influence of Group I alkali promoters on the local atomic and electronic structure of carburized iron/silica catalysts. J. Phys. Chem. C 2010, 114, 7895–7903. [Google Scholar] [CrossRef]
- Gnanamani, M.K.; Hamdeh, H.H.; Jacobs, G.; Shafer, W.D.; Sparks, D.E.; Davis, B.H. Fischer-Tropsch Synthesis Activity and Selectivity of χ-Fe5C2 and θ-Fe3C Carbides. In Fischer-Tropsch Synthesis, Catalysts, and Catalysis; Davis, B.H., Occelli, M., Eds.; CRC Press: Boca Raton, FL, USA, 2016; pp. 15–30. [Google Scholar]
- Nagakura, S. Study of Metallic Carbides by Electron Diffraction. Part III: Iron Carbides. J. Phys. Soc. Jpn. 1959, 14, 186–195. [Google Scholar] [CrossRef]
- Raupp, G.B.; Delgass, W.N. Mössbauer investigation of supported Fe and FeNi catalysts: II. Carbides formed Fischer-Tropsch synthesis. J. Catal. 1979, 58, 348–360. [Google Scholar] [CrossRef]
- Paalanen, P.P.; van Vreeswijk, S.H.; Dugulan, A.I.; Weckhuysen, B.M. Identification of Iron Carbides in Fe(Na-S)/α-Al2O3 Fischer-Tropsch Synthesis Catalysts with X-ray Powder Diffractometry and Mössbauer Absorption Spectroscopy. ChemCatChem 2020, 12, 5121–5139. [Google Scholar] [CrossRef]
- Herranz, T.; Rojas, S.; Perez-Alonso, F.J.; Ojeda, M.; Terreros, P.; Fierro, J.L.G. Genesis of iron carbides and their role in the synthesis of hydrocarbons from synthesis gas. J. Catal. 2006, 243, 199–211. [Google Scholar] [CrossRef]
- Eckstrom, H.C.; Adcock, W.A. A New Iron Carbide in Hydrocarbon Synthesis Catalysts. J. Am. Chem. Soc. 1950, 72, 1042–1043. [Google Scholar] [CrossRef]
- Datye, A.K.; Jin, Y.; Mansker, L.; Motjope, R.T.; Dlamini, T.H.; Coville, N.J. The nature of the active phase in iron Fischer−Tropsch catalysts. Stud. Surf. Sci. Catal. 2000, 130, 1139–1144. [Google Scholar]
- Chang, Q.; Zhang, C.; Liu, C.; Wei, Y.; Cheruvathur, A.V.; Dugulan, A.I.; Niemantsverdriet, J.W.; Liu, X.; He, Y.; Qing, M.; et al. Relationship between iron carbide phases (ε-Fe2C, Fe7C3, and χ-Fe5C2) and catalytic performances of Fe/SiO2 Fischer−Tropsch catalysts. ACS Catal. 2018, 8, 3304–3316. [Google Scholar] [CrossRef]
- Paalanen, P.P.; Weckhuysen, B.M. Carbon pathways, sodium-sulphur promotion and identification of iron carbides in iron-based Fischer-Tropsch synthesis. ChemCatChem 2020, 12, 4202–4223. [Google Scholar] [CrossRef]
- de Smit, E.; Beale, A.M.; Nikitenko, S.; Weckhuysen, B.M. Local and long-range order in promoted iron-based Fischer–Tropsch catalysts: A combined in situ x-ray absorption spectroscopy/wide angle x-ray scattering study. J. Catal. 2009, 262, 244–256. [Google Scholar] [CrossRef]
- de Smit, E.; Cinquini, F.; Beale, A.M.; Safonova, O.V.; van Beek, W.; Sautet, P.; Weckhuysen, B.M. Stability and reactivity of ϵ−χ−θ iron carbide catalyst phases in Fischer−Tropsch synthesis: Controlling μC. J. Am. Chem. Soc. 2010, 132, 14928–14941. [Google Scholar] [CrossRef] [PubMed]
- Li, J.; Cheng, X.; Zhang, C.; Yang, Y.; Li, Y.W. Effects of alkali on iron-based catalysts for Fischer-Tropsch synthesis: CO chemisorption study. J. Mol. Catal. A Chem. 2015, 396, 174–180. [Google Scholar] [CrossRef]
- Zhang, C.; Zhao, G.; Liu, K.; Yang, Y.; Xiang, H.; Li, Y.W. Adsorption and reaction of CO and hydrogen on iron-based Fischer–Tropsch synthesis catalysts. J. Mol. Catal. A Chem. 2010, 328, 35–43. [Google Scholar] [CrossRef]
- Zhao, S.; Liu, X.-W.; Huo, C.F.; Li, Y.W.; Wang, J.; Jiao, H. The role of potassium promoter in surface carbon hydrogenation on Hägg carbide surfaces. Appl. Catal. A Gen. 2015, 493, 68–76. [Google Scholar] [CrossRef]
- Jacobs, G.; Pendyala, V.R.R.; Martinelli, M.; Shafer, W.D.; Gnanamani, M.K.; Khalid, S.; MacLennan, A.; Hu, Y.; Davis, B.H. Fischer–Tropsch synthesis: XANES spectra of potassium in promoted precipitated iron catalysts as a function of time on-stream. Catal. Lett. 2017, 147, 1861–1870. [Google Scholar] [CrossRef]
- Sarkar, A.; Jacobs, G.; Ji, Y.; Hamdeh, H.H.; Davis, B.H. Fischer–Tropsch synthesis: Characterization Rb promoted iron catalyst. Catal. Lett. 2008, 121, 1–11. [Google Scholar] [CrossRef]
- Parkinson, G.S. Iron oxide surfaces. Surf. Sci. Rep. 2016, 71, 272–365. [Google Scholar] [CrossRef] [Green Version]
- Li, J.; Cheng, X.; Zhang, C.; Chang, Q.; Wang, J.; Wang, X.; Lv, Z.; Dong, W.; Yang, Y.; Li, Y.W. Effect of alkalis on iron-based Fischer-Tropsch synthesis catalysts: Alkali-FeOX interaction, reduction, and catalytic performance. Appl. Catal. A Gen. 2016, 528, 131–141. [Google Scholar] [CrossRef]
- Cheng, K.; Ordomsky, V.V.; Legras, B.; Virginie, M.; Paul, S.; Wang, Y.; Khodakov, A.Y. Sodium-promoted iron catalysts prepared on different supports for high temperature Fischer–Tropsch synthesis. Appl. Catal. A Gen. 2015, 502, 204–214. [Google Scholar] [CrossRef]
- Xiong, H.; Motchelaho, M.A.; Moyo, M.; Jewell, L.L.; Coville, N.J. Effect of Group I alkali metal promoters on Fe/CNT catalysts in Fischer–Tropsch synthesis. Fuel 2015, 150, 687–696. [Google Scholar] [CrossRef]
- Ngantsoue-Hoc, W.; Zhang, Y.; O’Brien, R.J.; Luo, M.; Davis, B.H. Fischer−Tropsch synthesis: Activity and selectivity for Group I alkali promoted iron-based catalysts. Appl. Catal. A Gen. 2002, 236, 77–89. [Google Scholar] [CrossRef]
- Dry, M.E.; Oosthuizen, G.J. The correlation between catalyst surface basicity and hydrocarbon selectivity in the Fischer-Tropsch synthesis. J. Catal. 1968, 11, 18–24. [Google Scholar] [CrossRef]
- Dry, M.E.; Shingles, T.; Boshoff, L.J.; Oosthuizen, G.J. Heats of chemisorption on promoted iron surfaces and the role of alkali in Fischer-Tropsch synthesis. J. Catal. 1969, 15, 190–199. [Google Scholar] [CrossRef]
- Rajabi, Z.; Martinelli, M.; Watson, C.D.; Cronauer, D.C.; Kropf, A.J.; Jacobs, G. Influence of Cs Loading on Pt/m-ZrO2 Water–Gas Shift Catalysts. Catalysts 2021, 11, 570. [Google Scholar] [CrossRef]
- Li, J.; Zhang, C.; Cheng, X.; Qing, M.; Xu, J.; Wu, B.; Yang, Y.; Li, Y. Effects of alkaline-earth metals on the structure, adsorption, and catalytic behavior of iron-based Fischer–Tropsch synthesis catalyst. Appl. Catal. A Gen. 2013, 464–465, 10–19. [Google Scholar] [CrossRef]
- Luo, M.; Davis, B.H. Fischer–Tropsch synthesis: Group II alkali-earth metal promoted catalysts. Appl. Catal. A Gen. 2003, 246, 171–181. [Google Scholar] [CrossRef]
- Yang, J.; Sun, Y.; Tang, Y.; Liu, Y.; Wang, H.; Tian, L.; Wang, H.; Zhang, Z.; Xiang, H.; Li, Y. Effect of magnesium promoter on iron-based catalyst for Fischer–Tropsch synthesis. J. Mol. Catal. A Chem. 2006, 245, 26–36. [Google Scholar] [CrossRef]
- Li, J.; Hou, Y.; Song, Z.; Liu, C.; Dong, W.; Zhang, C.; Yang, Y.; Li, Y. Chemical and structural effects of strontium on iron-based Fischer-Tropsch synthesis catalysts. Mol. Catal. 2018, 449, 1–7. [Google Scholar] [CrossRef]
- Tao, Z.; Yang, Y.; Zhang, C.; Li, T.; Wang, J.; Wan, H.; Xiang, H.; Li, Y. Effect of calcium promoter on a precipitated iron–manganese catalyst for Fischer–Tropsch synthesis. Catal. Commun. 2006, 7, 1061–1066. [Google Scholar] [CrossRef]
- Pour A., N.; Housaindokht, M.R.; Tayyari, S.F.; Zarkesh, J.; Alaei, M.R. Kinetic studies of the Fischer–Tropsch synthesis over La, Mg and Ca promoted nano-structured iron catalyst. J. Nat. Gas Sci. Eng. 2010, 2, 61–68. [Google Scholar] [CrossRef]
- Gallegos, N.G.; Alvarez, A.M.; Cagnoli, M.V.; Bengoa, J.F.; Marchetti, S.G.; Mercader, R.C.; Yeramian, A.A. Selectivity to Olefins of Fe/SiO2–MgO Catalysts in the Fischer–Tropsch Reaction. J. Catal. 1996, 161, 132–142. [Google Scholar] [CrossRef]
- Toby B., H.; Von Dreele R., B. GSAS-II: The genesis of a modern open-source all-purpose crystallography software package. J. Appl. Cryst. 2013, 46, 544–549. [Google Scholar] [CrossRef]
- Liu, X.W.; Zhao, S.; Meng, Y.; Peng, Q.; Dearden, A.K.; Huo, C.F.; Yang, Y.; Li, Y.W.; Wen, X.D. Mossbauer Spectroscopy of Iron Carbides: From Prediction to Experimental Confirmation. Sci. Rep. 2016, 6, 26184. [Google Scholar] [CrossRef] [PubMed] [Green Version]
- Paalanen, P.P.; van Vreeswijk, S.H.; Weckhuysen, B.M. Combined In Situ X-ray Powder Diffractometry/Raman Spectroscopy of Iron Carbide and Carbon Species Evolution in Fe(−Na–S)/α-Al2O3 Catalysts during Fischer–Tropsch Synthesis. ACS Catal. 2020, 10, 9837–9855. [Google Scholar] [CrossRef]
- Harris, J.; Andersson, S. H2 Dissociation at Metal Surfaces. Phys. Rev. Lett. 1985, 55, 1583. [Google Scholar] [CrossRef] [PubMed]
- Xu, J.; Bartholomew, C.H. Temperature-programmed hydrogenation (TPH) and in situ Mossbauer spectroscopy studies of carbonaceous species on silica-supported iron Fischer-Tropsch catalysts. J. Phys. Chem. B 2005, 109, 2392–2403. [Google Scholar] [CrossRef] [PubMed]
- Pendyala, V.R.R.; Graham, U.M.; Jacobs, G.; Hamdeh, H.H.; Davis, B.H. Fischer-Tropsch Synthesis: Morphology, phase transformation and carbon-layer growth of iron-based catalysts. ChemCatChem 2014, 6, 1952–1960. [Google Scholar] [CrossRef]
- Arakawa, H.; Bell, A.T. Effects of potassium promotion on the activity and selectivity of iron Fischer-Tropsch catalysts. Ind. Eng. Chem. Process Des. Dev. 1983, 22, 97–103. [Google Scholar] [CrossRef]
- Raje, A.P.; O’Brien, R.J.; Davis, B.H. Effect of potassium promotion on iron-based catalysts for Fischer-Tropsch synthesis. J. Catal. 1998, 180, 36–43. [Google Scholar] [CrossRef]
- Kummer, J.T.; Emmett, P.H. Fischer-Tropsch Synthesis Mechanism Studies. The Addition of Radioactive Alcohols to the Synthesis Gas. J. Am. Chem. Soc. 1953, 75, 5177–5183. [Google Scholar] [CrossRef]
- Jacobs, G.; and Davis, B.H. Applications of Isotopic Tracers in Fischer-Tropsch Synthesis. Catal. Sci. Technol. 2014, 4, 3927–3944. [Google Scholar] [CrossRef]
- Ma, W.; Jacobs, G.; Graham, U.M.; Davis, B.H. Fischer–Tropsch Synthesis: Effect of K Loading on the Water-Gas Shift Reaction and Liquid Hydrocarbon Formation Rate over Precipitated Iron Catalysts. Top. Catal. 2014, 57, 561–571. [Google Scholar] [CrossRef]
- Housecroft, C.E.; Sharpe, A.G. Inorganic Chemistry, 2nd ed.; Pearson: Harlow, UK, 2005; pp. 880–882. [Google Scholar]


| Phase | Code | Space Group | Unit Cell Parameters | |||
|---|---|---|---|---|---|---|
| a (Å) | b (Å) | c (Å) | β (deg.) | |||
| θ-Fe3C | amcsd 0013523 | P n m a | 5.092 | 6.741 | 4.527 | |
| χ-Fe5C2 | COD 1521831 | C 2/c | 11.588 | 4.579 | 5.059 | 97.746 |
| Fe3O4 | amcsd 0002400 | F d -3 m | 8.3965 | |||
| α-Fe2O3 | amcsd 0000143 | R -3 c | 5.038 | 5.038 | 13.772 | |
| BaCO3 | amcsd 0000235 | P m c n | 5.3126 | 8.8958 | 6.4284 | |
| Catalysts | Conv. (%) | Selectivity (mol, C-%) | α-Value | |||||
|---|---|---|---|---|---|---|---|---|
| CO | H2 | paraffin a | olefin b | oxy. c | unident. d | Hyd. e | Oxy. f | |
| 100Fe | 63.3 | 67.6 | 30.5 | 50.4 | 7.4 | 11.7 | 0.72 | 0.74 |
| 5K:100Fe | 61.4 | 51.1 | 20.8 | 62.0 | 4.5 | 12.7 | 0.84 | 0.74 |
| 5Ba:100Fe | 59.1 | 62.2 | 35.5 | 51.1 | 3.6 | 51.1 | 0.76 | 0.73 |
Publisher’s Note: MDPI stays neutral with regard to jurisdictional claims in published maps and institutional affiliations. |
© 2021 by the authors. Licensee MDPI, Basel, Switzerland. This article is an open access article distributed under the terms and conditions of the Creative Commons Attribution (CC BY) license (https://creativecommons.org/licenses/by/4.0/).
Share and Cite
Ribeiro, M.Z.L.L.; Souza, J.C.; Gnanamani, M.K.; Martinelli, M.; Upton, G.F.; Jacobs, G.; Ribeiro, M.C. Fischer–Tropsch Synthesis: Effect of the Promoter’s Ionic Charge and Valence Level Energy on Activity. Reactions 2021, 2, 408-426. https://0-doi-org.brum.beds.ac.uk/10.3390/reactions2040026
Ribeiro MZLL, Souza JC, Gnanamani MK, Martinelli M, Upton GF, Jacobs G, Ribeiro MC. Fischer–Tropsch Synthesis: Effect of the Promoter’s Ionic Charge and Valence Level Energy on Activity. Reactions. 2021; 2(4):408-426. https://0-doi-org.brum.beds.ac.uk/10.3390/reactions2040026
Chicago/Turabian StyleRibeiro, Mirtha Z. Leguizamón León, Joice C. Souza, Muthu Kumaran Gnanamani, Michela Martinelli, Gabriel F. Upton, Gary Jacobs, and Mauro C. Ribeiro. 2021. "Fischer–Tropsch Synthesis: Effect of the Promoter’s Ionic Charge and Valence Level Energy on Activity" Reactions 2, no. 4: 408-426. https://0-doi-org.brum.beds.ac.uk/10.3390/reactions2040026