Utilization of Waste Cooking Oil via Recycling as Biofuel for Diesel Engines


1
University of Fire Fighting and Prevention, Hanoi 100000, Vietnam
2
School of Transportation and Engineering, Hanoi University of Science and Technology, Hanoi 100000, Vietnam
3
Faculty of Vehicle and Energy Engineering, Phenikaa University, Hanoi 100000, Vietnam
*
Author to whom correspondence should be addressed.
Recycling 2020, 5(2), 13; https://0-doi-org.brum.beds.ac.uk/10.3390/recycling5020013
Submission received: 16 March 2020
/
Revised: 29 May 2020
/
Accepted: 2 June 2020
/
Published: 8 June 2020
(This article belongs to the Special Issue Recycling and Recovery of Biomass Materials)
Abstract
:In this study, waste cooking oil (WCO) was used to successfully manufacture catalyst cracking biodiesel in the laboratory. This study aims to evaluate and compare the influence of waste cooking oil synthetic diesel (WCOSD) with that of commercial diesel (CD) fuel on an engine’s operating characteristics. The second goal of this study is to compare the engine performance and temperature characteristics of cooling water and lubricant oil under various engine operating conditions of a test engine fueled by waste cooking oil and CD. The results indicated that the engine torque of the engine running with WCOSD dropped from 1.9 Nm to 5.4 Nm at all speeds, and its brake specific fuel consumption (BSFC) dropped at almost every speed. Thus, the thermal brake efficiency (BTE) of the engine fueled by WCOSD was higher at all engine speeds. Also, the engine torque of the WCOSD-fueled engine was lower than the engine torque of the CD-fueled engine at all engine speeds. The engine’s power dropped sequentially through 0.3 kW, 0.4 kW, 0.6 kW, 0.9 kW, 0.8 kW, 0.9 kW, 1.0 kW and 1.9 kW.
1. Introduction
Compression ignition (CI) engines have been used in the industrial and agricultural sectors, and in construction, power factories, and transportation, for several decades. This broad use has resulted in a growing demand for petroleum-based diesel [1,2,3,4,5]. However, global fossil-fuel reserves have become limited due to rising fuel prices, depleting petroleum reserves and issues related to atmospheric pollution [4,5,6,7,8,9]. As a result, many researchers have concentrated on the discovery of renewable, carbon-neutral, and environmentally-friendly non-petroleum-based diesel in recent years [10,11,12,13]. Biodiesel is produced from various feedstocks, such as rapeseed, soybean, cottonseed oil, palm oil, and jojoba oil, and can be used to fuel internal combustion engines with no significant differences from petroleum-based fuels [14,15,16,17]. Since most biodiesel is manufactured using edible oils, the price of biodiesel is higher than conventional diesel. This is a significant barrier to the commercialization of biodiesel [8]. The use of edible feedstocks could also intensify the competition between fuel supply and food production on agricultural land, increasing the cost of food and oil [14,18,19,20]. As such, low-priced, inedible feedstock-based fuels, such as waste cooking oil synthetic diesel (WCOSD), should be adopted due to their competitive pricing compared to conventional diesel, and to ensure food security worldwide. The use of feedstock-based fuels can also help to lessen environmental issues by reducing waste-oil disposal.
Ahmet Necati Ozsezen et al. performed the experiment on canola oil methyl esters (COME) and waste palm oil esters (WPOME) [21], and they observed that while maximum engine torque slightly decreased, brake specific fuel consumption (BSFC) increased when compared to commercial diesel (CD) fuel. In terms of combustion characteristics, although the peak cylinder gas pressures for COME and WPOME were respectively 8.33 MPa and 8.34 MPa, at a 6.75° crankshaft angle (CA) after top dead center (ATDC), the peak cylinder gas pressure for CD fuel was 7.89 MPa at a 7° CA ATDC. In another study, K. Muralidharan explored the effects of compression ratio on the combustion characteristics of a variable compression ratio engine fueled by diesel and methyl esters of waste cooking oil (WCO) blends [15]. As a consequence, the compression ratios were changed, corresponding to the values of 18:1, 19:1, 20:1, 21:1 and 22:1. At the compression ratio of 21:1, although the BSFC of the B40 blend (a blend of 40% biodiesel) was 0.259 kg/kWh, the BSFC of the CD was 0.314 kg/kWh. Muralidharan’s results also revealed that the engine fueled with WCOSD methyl ester had a lower heat release rate, a lower maximum rate of pressure rise, a longer ignition delay and a higher mass fraction, that was burnt at a higher compression ratio, than the engine that was fueled with diesel. In summary, fuel blends can increase nitrogen oxide emissions and decrease the emissions of hydrocarbon and carbon monoxide. When A. Abu-Jrai et al. [20] tested blends of treated WCOSD and CD on a naturally aspirated diesel engine, to investigate the engine’s exhaust emission and combustion characteristics, they observed that the total combustion duration of B50 was longer than the total combustion duration of CD fuel. They also noted that the combustion was advanced at all engine loads and that the BSFC for B50 was slightly higher than the BSFC for conventional diesel. In addition, while the concentration of NOx emissions in the engine fueled by B50 increased by 37%, 29% and 22%, smoke emissions dropped by 42%, 31% and 30%, when compared to the emission reductions of the full load at 25%, 50% and 75%, respectively, for the engine fueled by conventional diesel.
In H. An et al.’s [22] investigation into the impacts of biodiesel that had been derived from WCO on emission characteristics, combustion characteristics and the performance of a test engine, they concluded that the use of biodiesel/blended fuels led to a higher BSFC, particularly at partial load conditions and low engine speeds. The thermal brake efficiency (BTE) of the engine fueled with biodiesel was also found to be slightly lower than the BTE of the engine fueled with conventional diesel at a 25% load. By comparison, the engine’s BTE was higher, with conventional diesel loads of 50% and 100%. In addition, major emissions, such as HC and NOx, were slightly lower for biodiesel than they were for CD. During the combustion process, the ignition delay was slightly shorter, and the peak heat release rate was lower for the engine fueled by biodiesel. However, at low engine speeds, these factors adopted an opposite trend, significantly impacting the engine’s emissions and combustion processes.
In addition to the research projects that have been discussed above, several other studies have investigated the use of trans-esterification biodiesel fuel, produced from WCOSD, in CI engines. Regardless, no study has investigated the impacts of synthetic biodiesel on the cooling and lubricant temperature of the conventional CI engines. As such, this research aims to discuss the technology that is used to produce biodiesel derived from WCO, and evaluate its characteristics and usability in conventional CI engines. To achieve these aims, experiments were conducted to produce WCOSD. In addition, experimental procedures were performed to measure the characteristics of test engines fueled by either diesel or WCOSD. The results of this research are the foundation for using catalyst cracking biodiesel that is derived from WCO in diesel vehicles worldwide.
2. Results and Discussions
2.1. Comparison of Engine Performance Characteristics
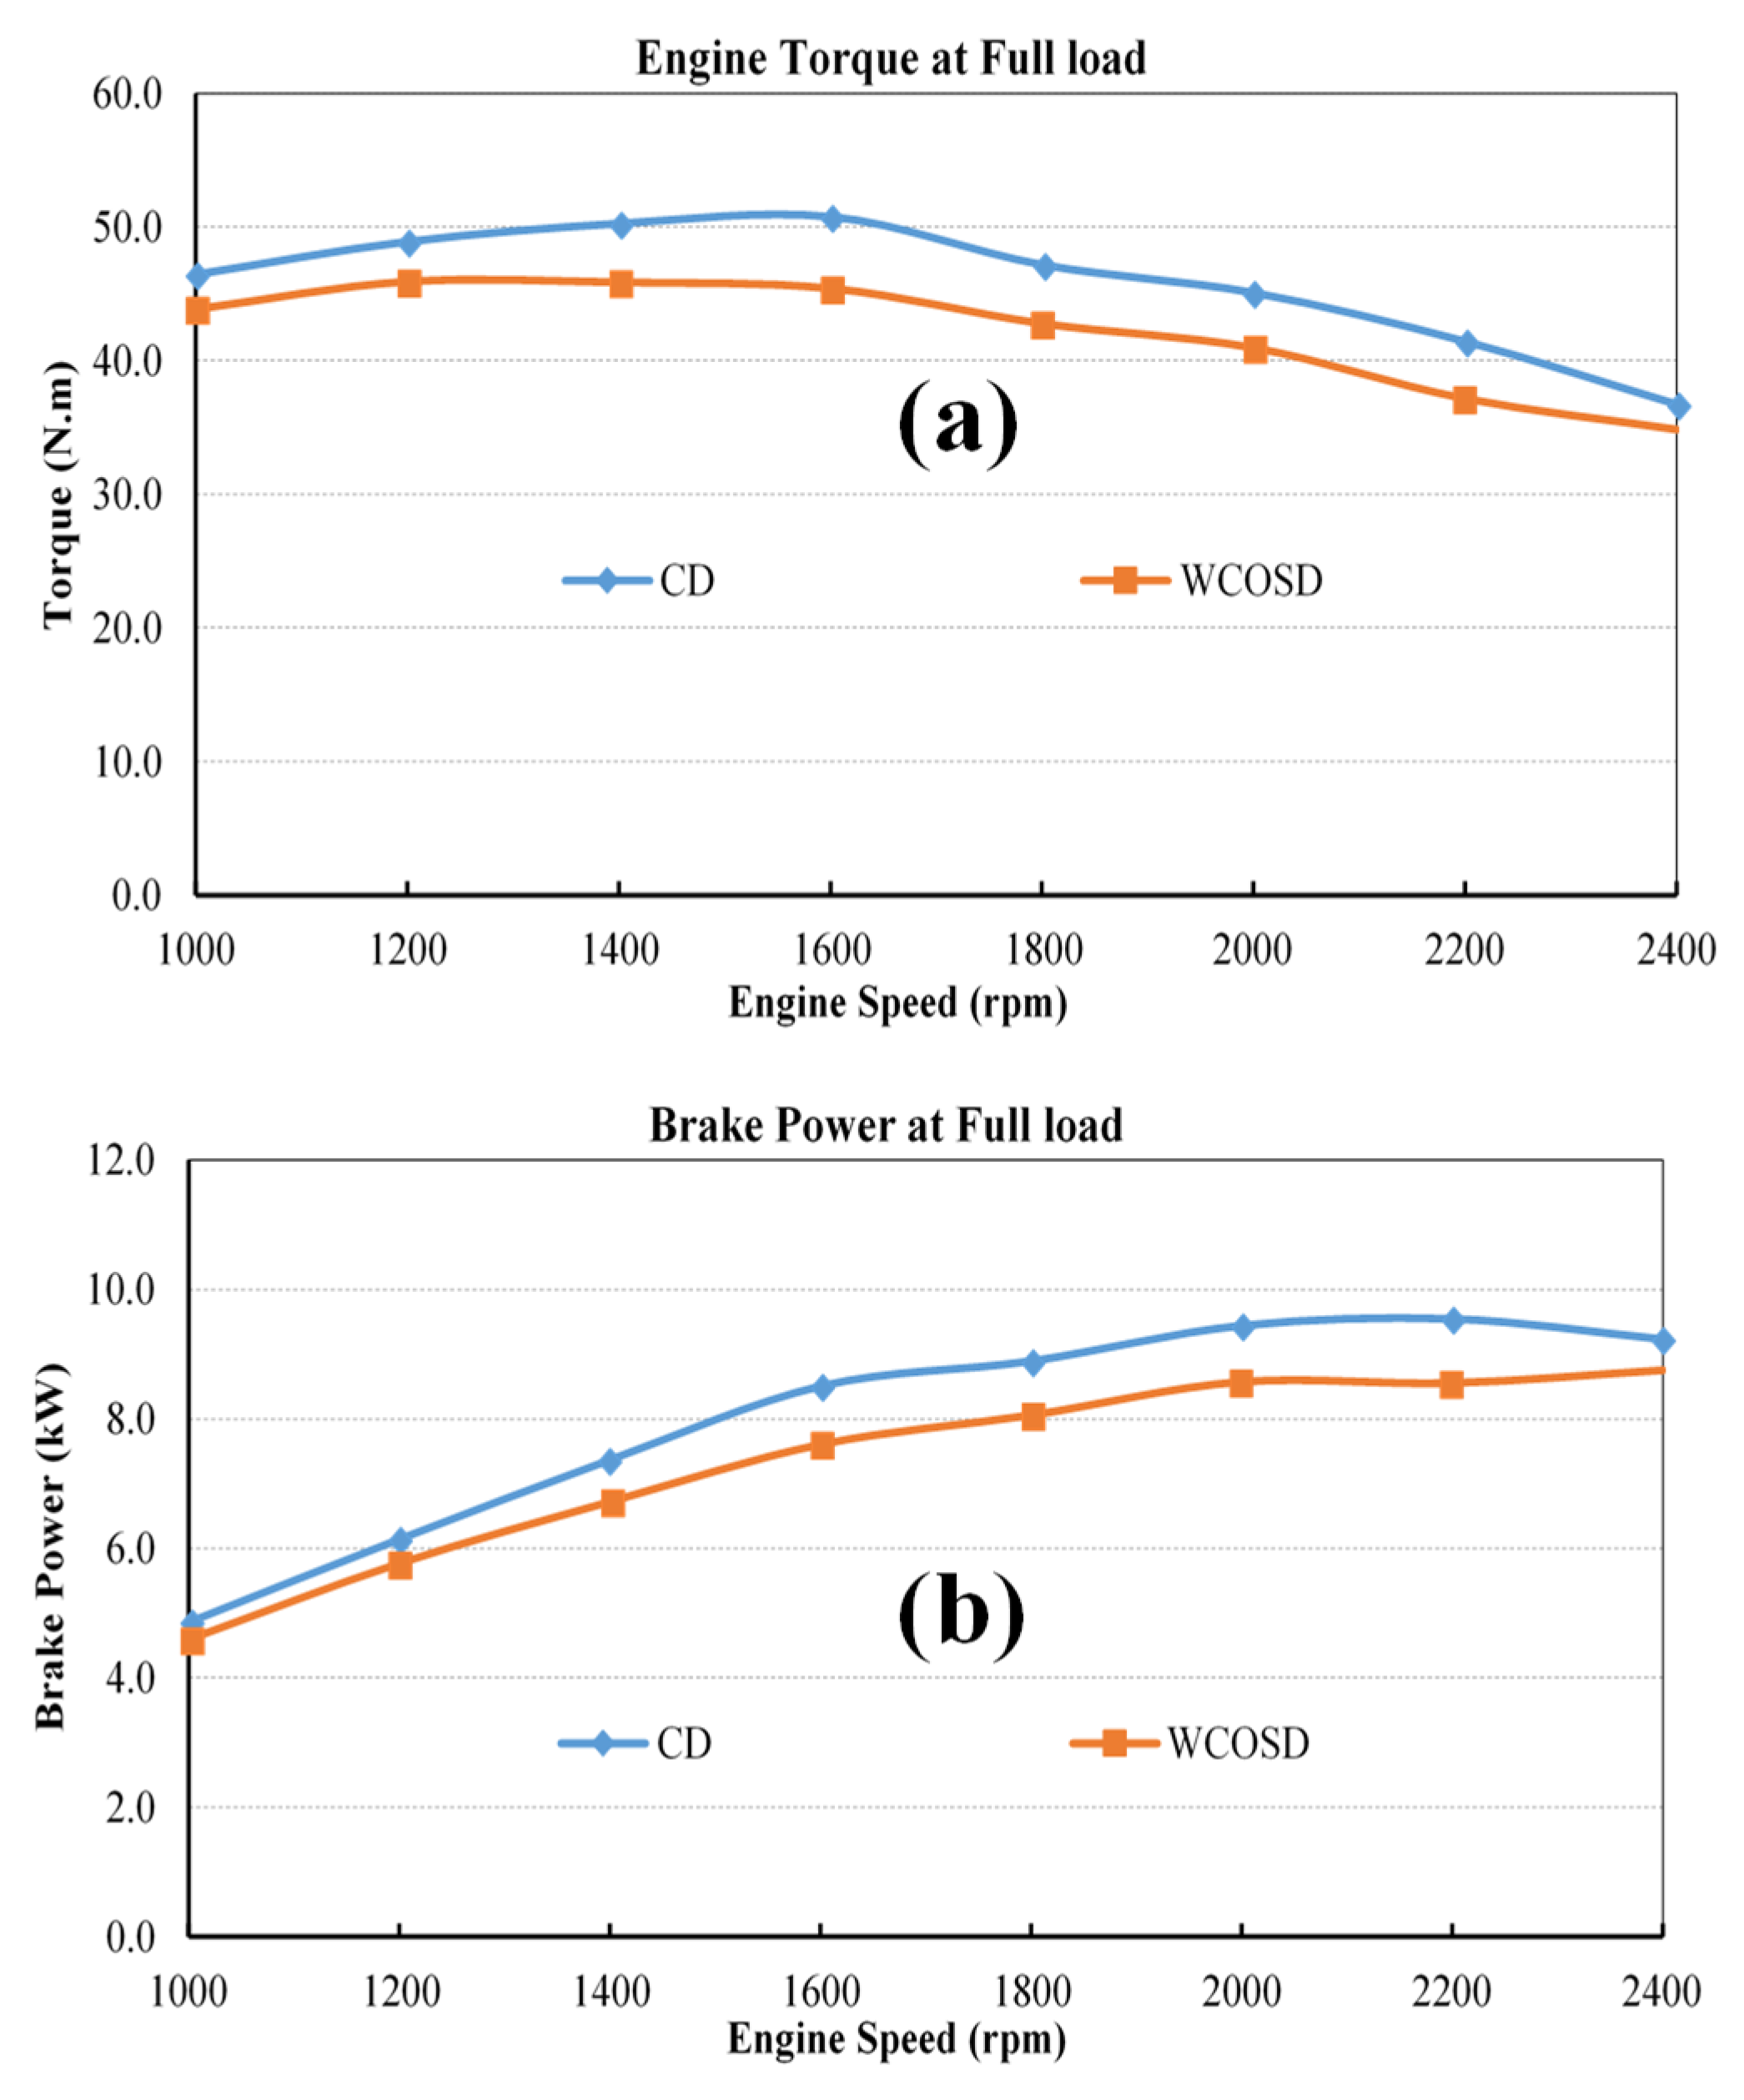
In the performance test, WCOSD (the researched fuel) and CD (the reference fuel) were compared at full and partial load conditions, and at engine speeds between 1200 rpm and 2400 rpm. The performance of an engine is expressed through BTE, BSFC, and engine torque or engine power output. Before investigating the effects of WCOSD on the engine’s performance characteristics at full and partial load conditions, in addition to the effects of WCOSD on the engine’s operating characteristics at full load conditions, the engine’s experimental operation conditions, which were achieved by cooling the temperatures of the water and lubricant, needed to be considered. The engine torque at a full load condition and the engine brake power at a full load condition are shown in Figure 1.
These results reveal that the engine torque with WCOSD was lower at all engine speeds than the engine torque with CD. The engine torque of the engine fueled with WCOSD was 2.6 Nm, 3.0 Nm, 4.4 Nm, 5.4 Nm, 4.4 Nm, 4.1 Nm, 4.3 Nm, and 1.9 Nm lower than the engine torque of the engine fueled with CD at engine speeds of 1000 rpm, 1200 rpm, 1400 rpm, 1600 rpm, 1800 rpm, 2000 rpm, 2200 rpm and 2400 rpm, respectively. Furthermore, engine power dropped sequentially from 0.3 kW to 0.4 kW, then to 0.6 kW, 0.9 kW, 0.8 kW, 0.9 kW, 1.0 kW, and finally to 1.9 kW. Reductions in engine torque and brake power were due to WCOSD’s lower heating value than that of CD (Table 1). WCOSD’s density is also less than CD’s. As a result, WCOSD’s fuel mass supply was lesser than CD’s fuel mass supply under the same configurations of the fuel supply system. This trend is generally similar to the study results mentioned in [22], where the thermal brake efficiency of the engine fueled with WCO was also found to be slightly lower than that of CD at a 25% load.
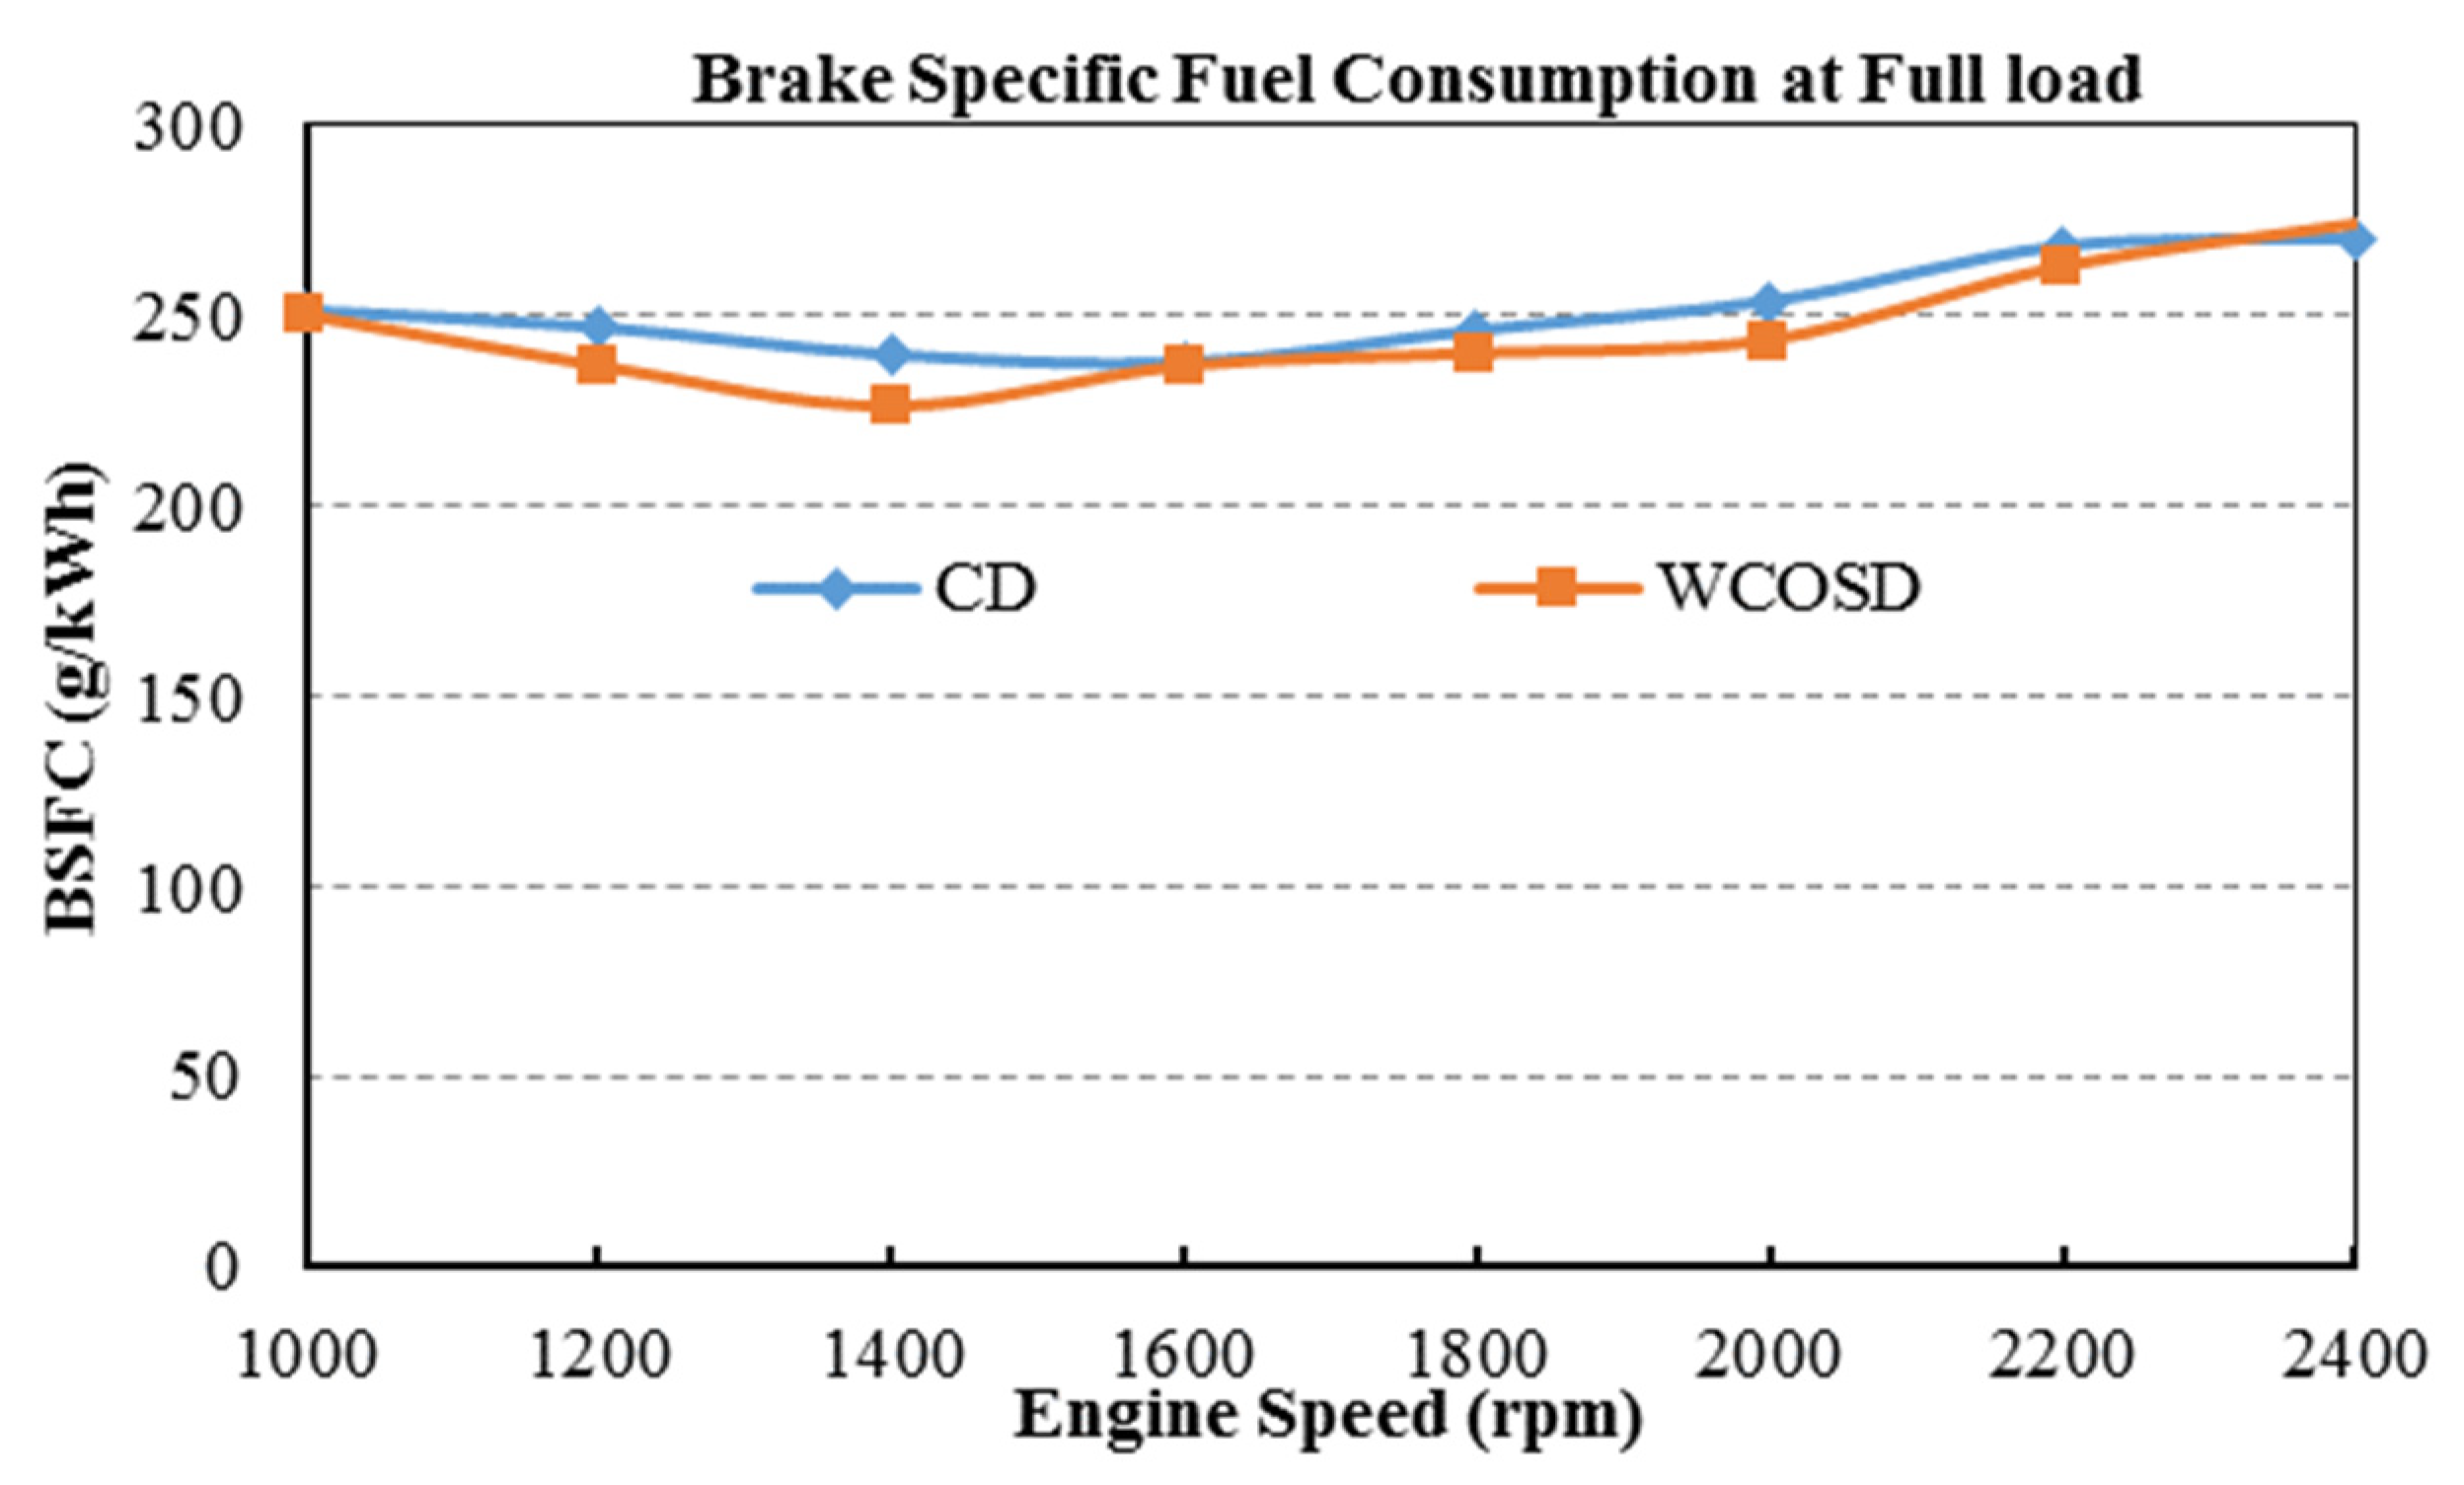
BSFC is one of the most important parameters of an engine and is defined as the fuel consumption per unit of power in a unit of time. It measures how efficiently an engine uses the fuel that is supplied to produce work. Figure 2 shows the BSFC of the WCOSD and CD fuels at full load conditions. The curves illustrate that the BSFC of WCOSD decreased at all engine speeds but 2400 rpm. The BSFC of the engine running with WCOSD dropped from 1.4 g/kWh to 10.4 g/kWh, then to 14.1 g/kWh, 1.4 g/kWh, 6.5 g/kWh, 10.5 g/kWh and 5.3 g/kWh, or by values of 0.5%, 4.2%, 5.9%, 0.6%, 2.6%, 4.1% and 2.0%, respectively. In comparison, the CD-fueled engine’s BSFC dropped at speeds of 1000 rpm, 1200 rpm, 1400 rpm, 1600 rpm, 1800 rpm, 2000 rpm, and 2200 rpm. At 2400 rpm, the BSCF of the engine fueled with WCOSD increased to 4.2 g/kWh, or by 1.6%. This means that the WCOSD-fueled engine was efficient in its use of the chemical energy that was supplied by the fuel.
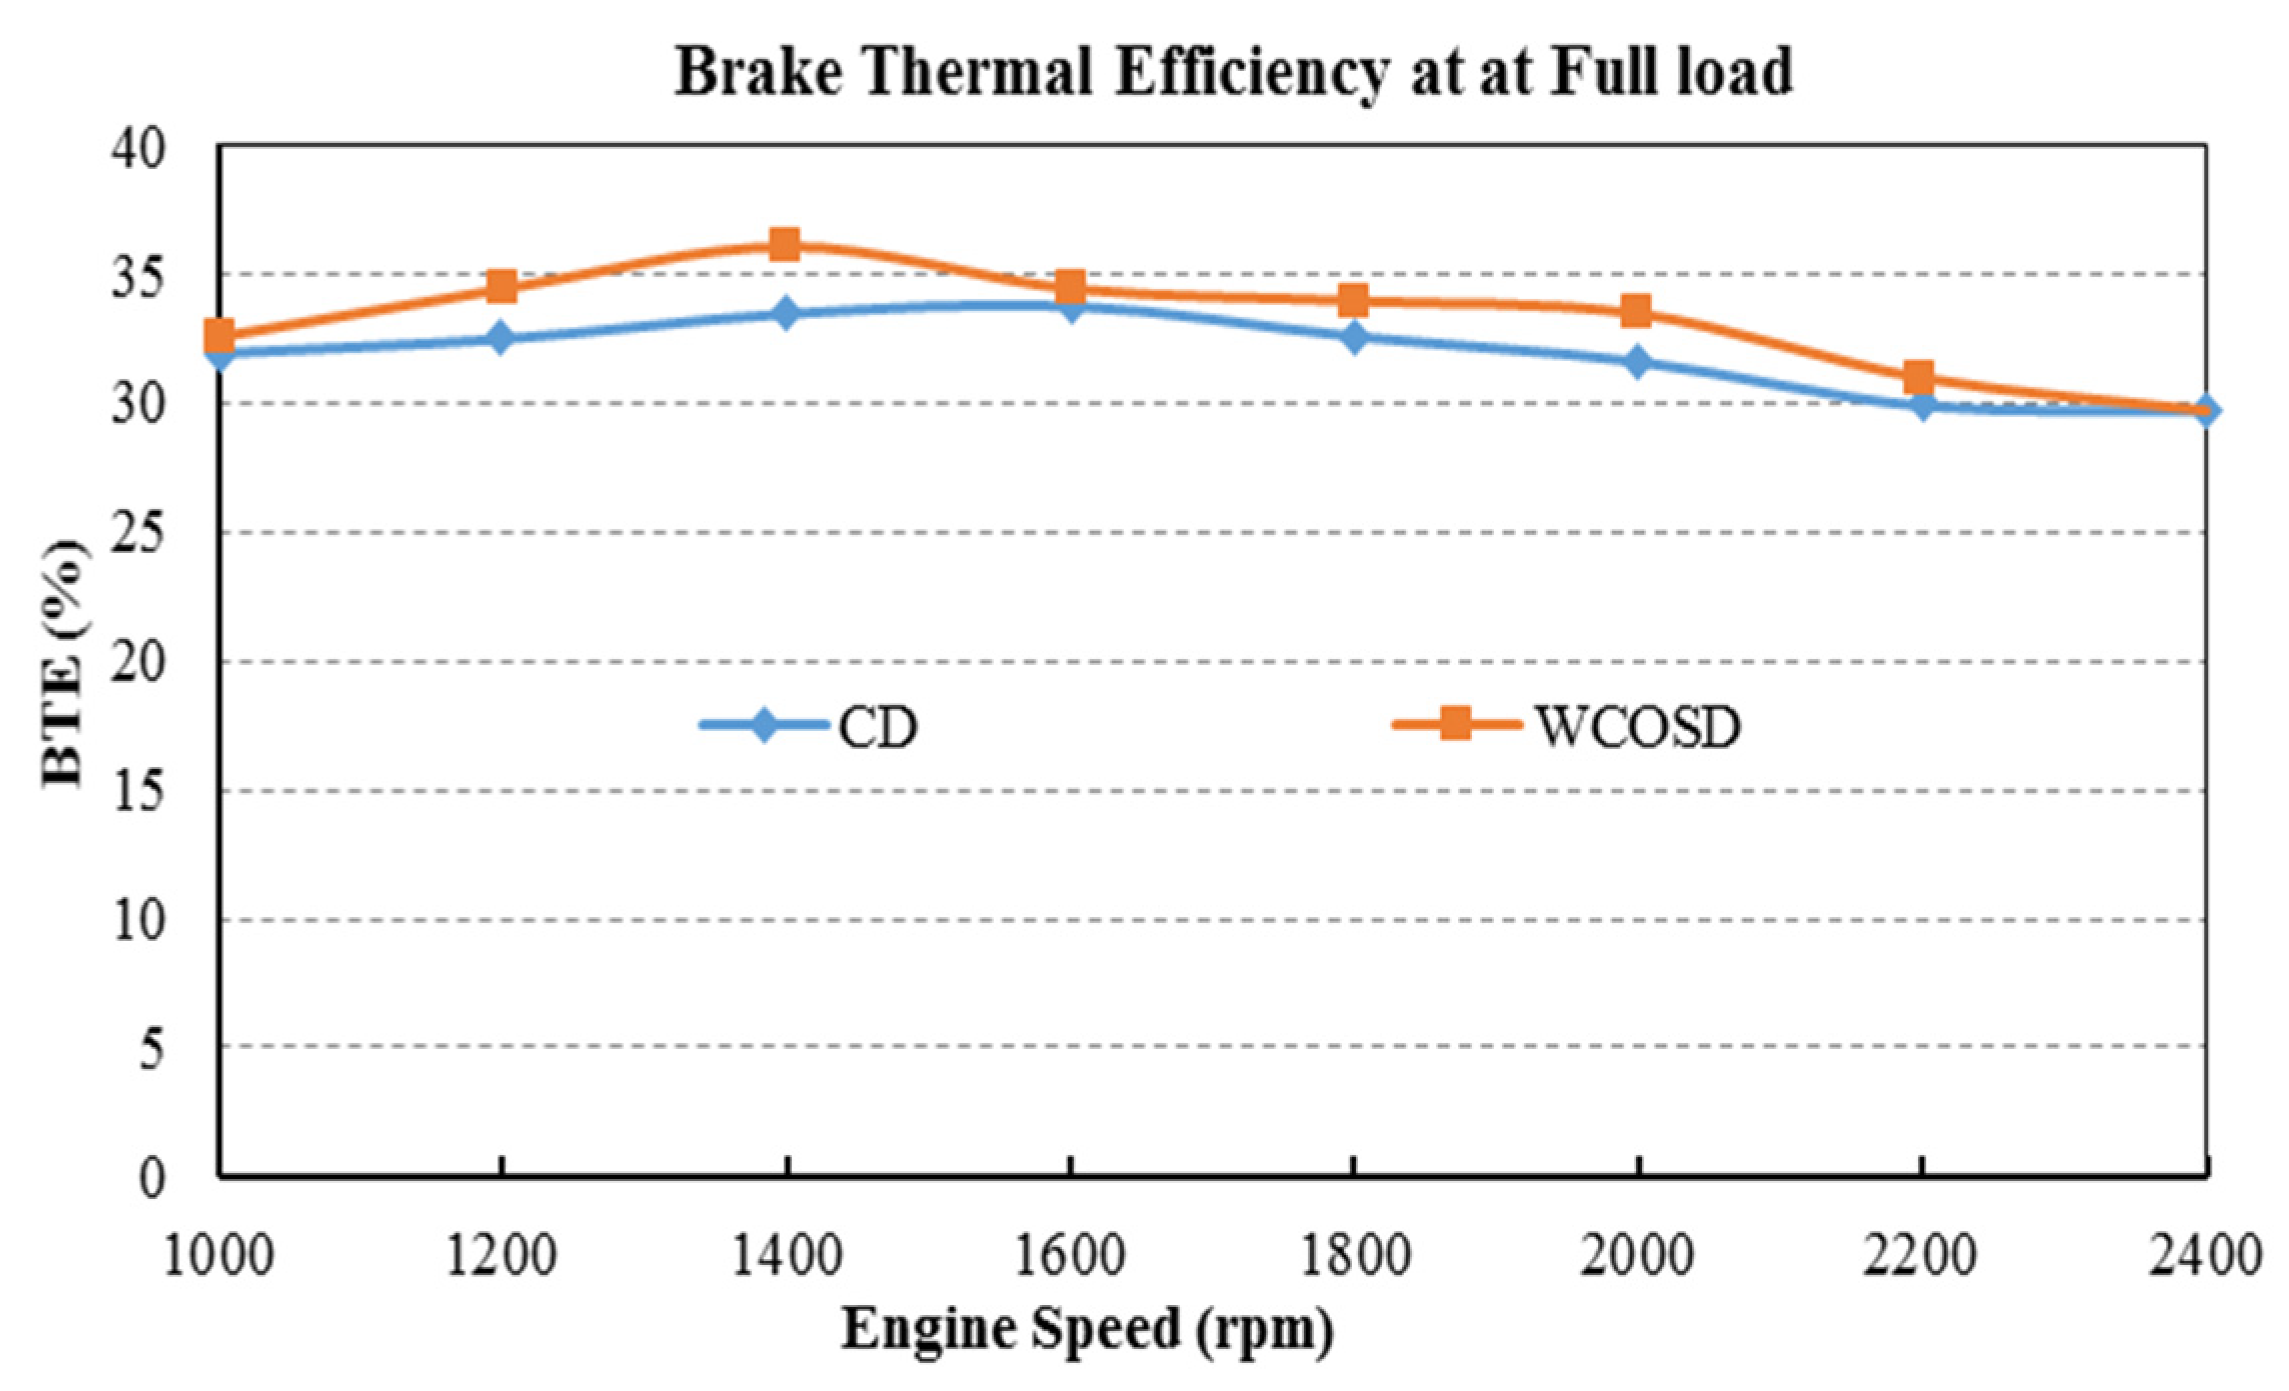
BTE evaluates how efficiently an engine can transform the chemical energy of a fuel into useful work. It is determined by dividing the brake power of an engine by the amount of energy input to the system. The BTE can be determined by dividing the useful work by the lower heating value of the fuel. Figure 3 shows the BTEs of the test engines that were fueled with WCOSD and CD. WCOSD exhibited a higher thermal efficiency than CD at all speeds. The BTEs of the engines fueled with WCOSD were 0.6%, 1.9%, 2.6%, 0.7%, 1.3%, 1.8% and 1.0% higher than the BTEs of the engine fueled with CD. The engine speeds of the engine fueled by CD ranged from 1000 rpm to 2200 rpm. While at lower heating values, the BTEs of the engine fueled with WCOSD were lower than the BTEs of the engine fueled with CD, the thermal efficiency of the engine fueled with WCOSD was higher than the thermal efficiency of the engine fueled with CD. This higher thermal efficiency can be explained by the reduced BSFC of the engine fueled by WCOSD, as shown in Figure 2. In other words, the conversion of the fuel’s chemical energy into the engine’s mechanical energy is more efficient when the engine is fueled by WCOSD, as the density and kinematic viscosity of CD is lower than the density and kinematic viscosity of WCOSD, reducing the likelihood for evaporation, decreasing the efficiency of combustion and increasing fuel consumption.
2.2. Comparison of Lubricant Temperature and Cooling Water Temperature
2.2.1. Lubricant Temperature and Cooling Water Temperature at Full Load
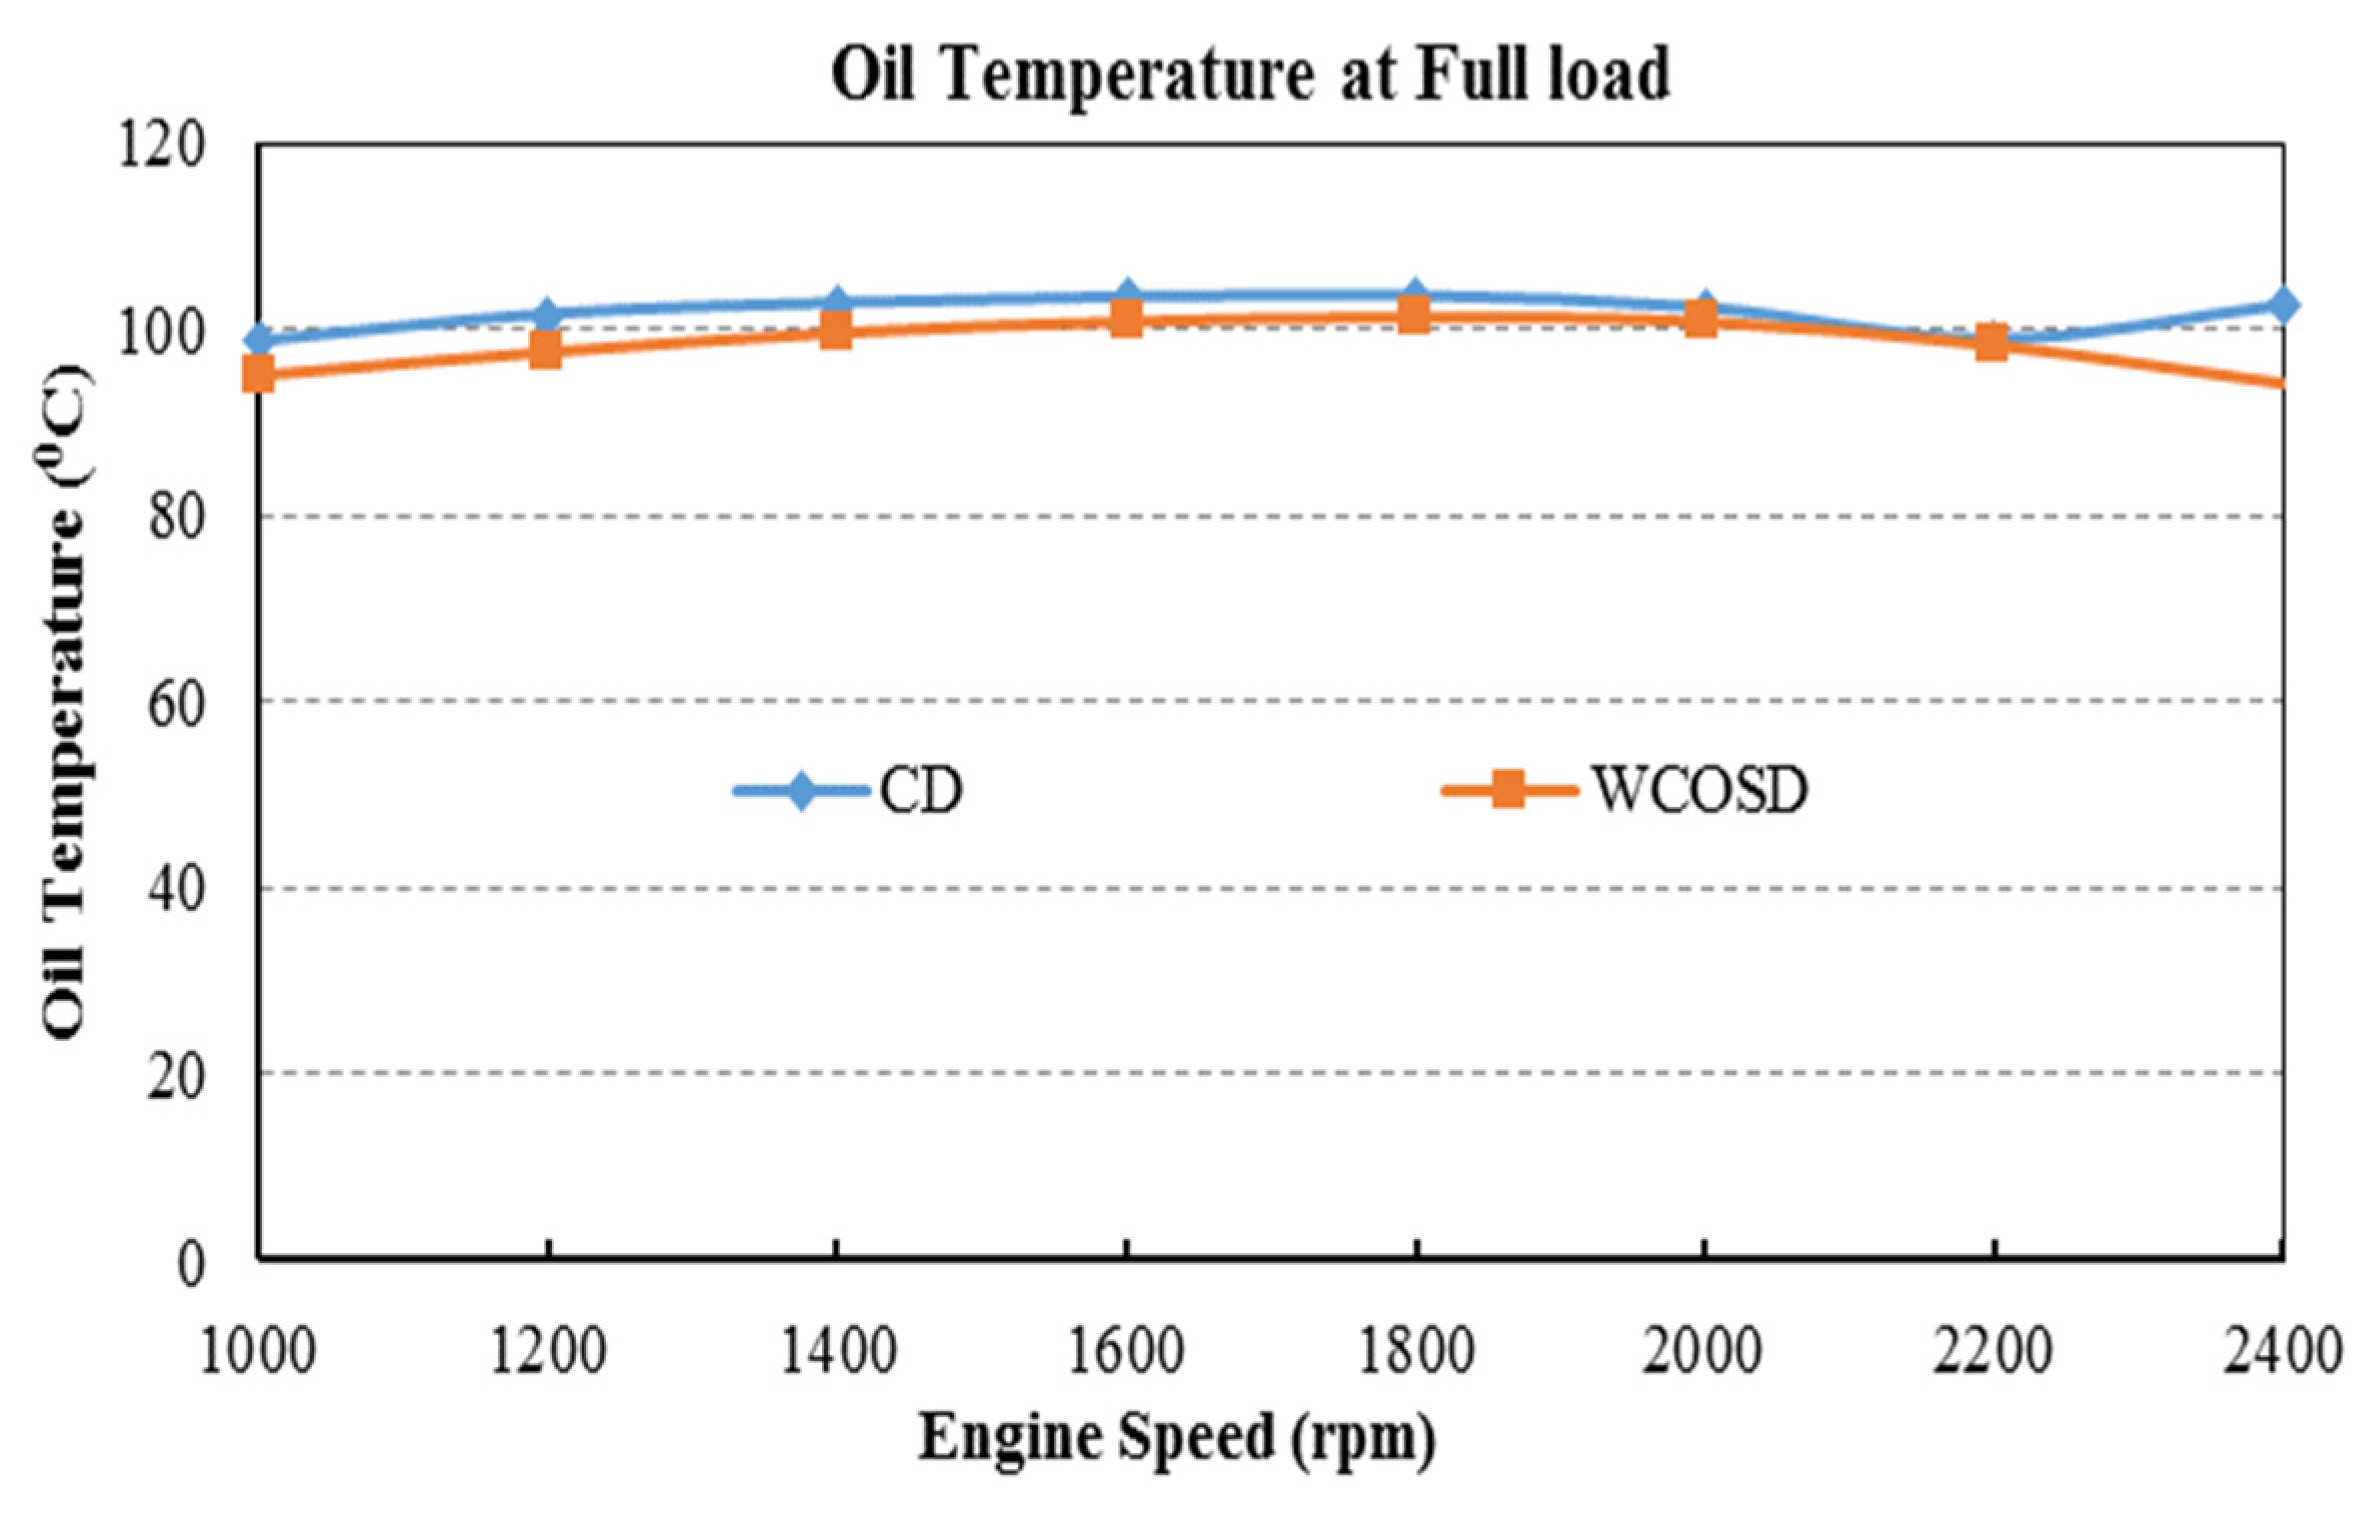
Figure 4 shows the variations in the lubricant oil temperatures for the two fuels. The lubricant oil temperature increased as the engine speed increased, reaching a maximum speed of 1800 rpm. WCOSD’s lubricant oil temperature was lower than CD’s lubricant oil temperature at all speeds. To clarify, WCOSD’s lubricant oil temperatures were 3.5 °C, 3.9 °C, 3.1 °C, 2.6 °C, 2.3 °C, 1.5 °C and 8.2 °C lower than CD’s lubricant oil temperatures at engine speeds of 1000 rpm, 1200 rpm, 1400 rpm, 1600 rpm, 1800 rpm, 2000 rpm and 2400 rpm, respectively. At 2200 rpm, the differences between the two fuels’ lubricant oil temperatures were insignificant.
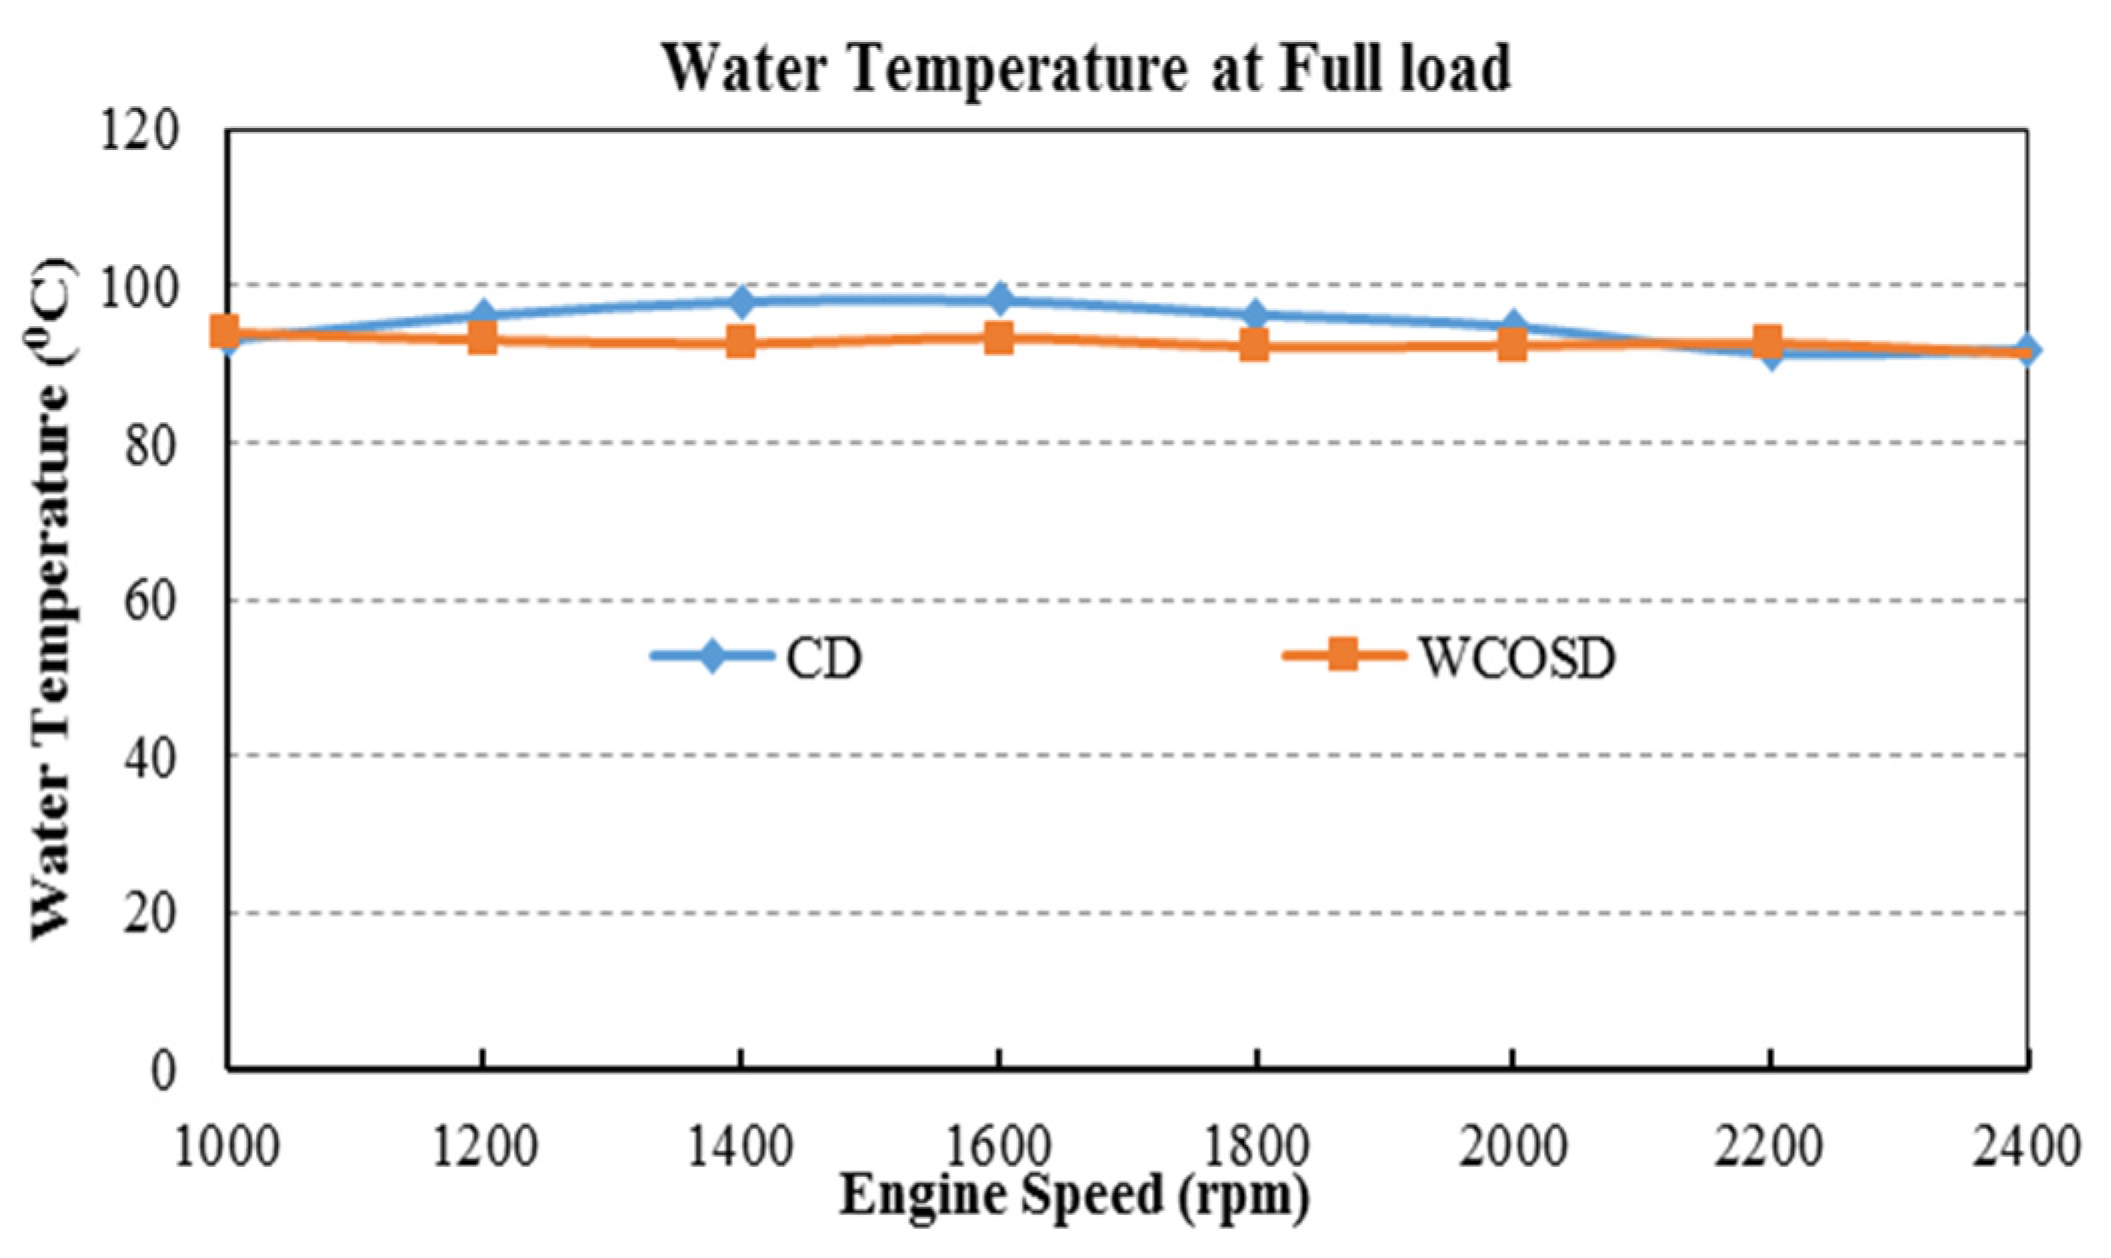
Cooling water temperature is a parameter that indicates the operating state of the engine. As showed in Figure 5, The cooling water temperature of the CD-fueled engine was slightly higher than the cooling water temperature of the WCOSD-fueled engine. The highest difference in cooling water temperature was 5.6 °C at an engine speed of 1400 rpm. The cooling water temperature differences at each test point changed from 0.7 °C to 5.6 °C. The cooling water temperature of the engine fueled with WCSOD was 3.3 °C, 5.6 °C, 4.9 °C, 4.2 °C and 2.5 °C lower than the cooling water temperature of the engine fueled by CD at engine speeds of 1200 rpm, 1400 rpm, 1600 rpm, 1800 rpm and 2000 rpm, respectively. By comparison, the WCOSD-fueled engine’s cooling water temperature was 1.2 °C higher than the CD-fueled engine’s cooling water temperature at 2200 rpm. At 1000 rpm and 2400 rpm, the differences in the cooling water temperatures were insignificant for both engines.
As illustrated above, at a full load, the same speed and when fueled by CD or WCOSD, there was a less than 5 °C difference in the engines’ lubricant and cooling water temperatures, except at the speed of 2400 rpm. This can be explained by the differences in the heat values of each fuel. Indeed, the heat value of CD was higher than the heat value of WCOSD (Table 1). As a result, the higher heat release of CD led to higher cooling water and lubricant temperatures.
2.2.2. Lubricant Temperature, Cooling Water Temperature and Partial Load Conditions
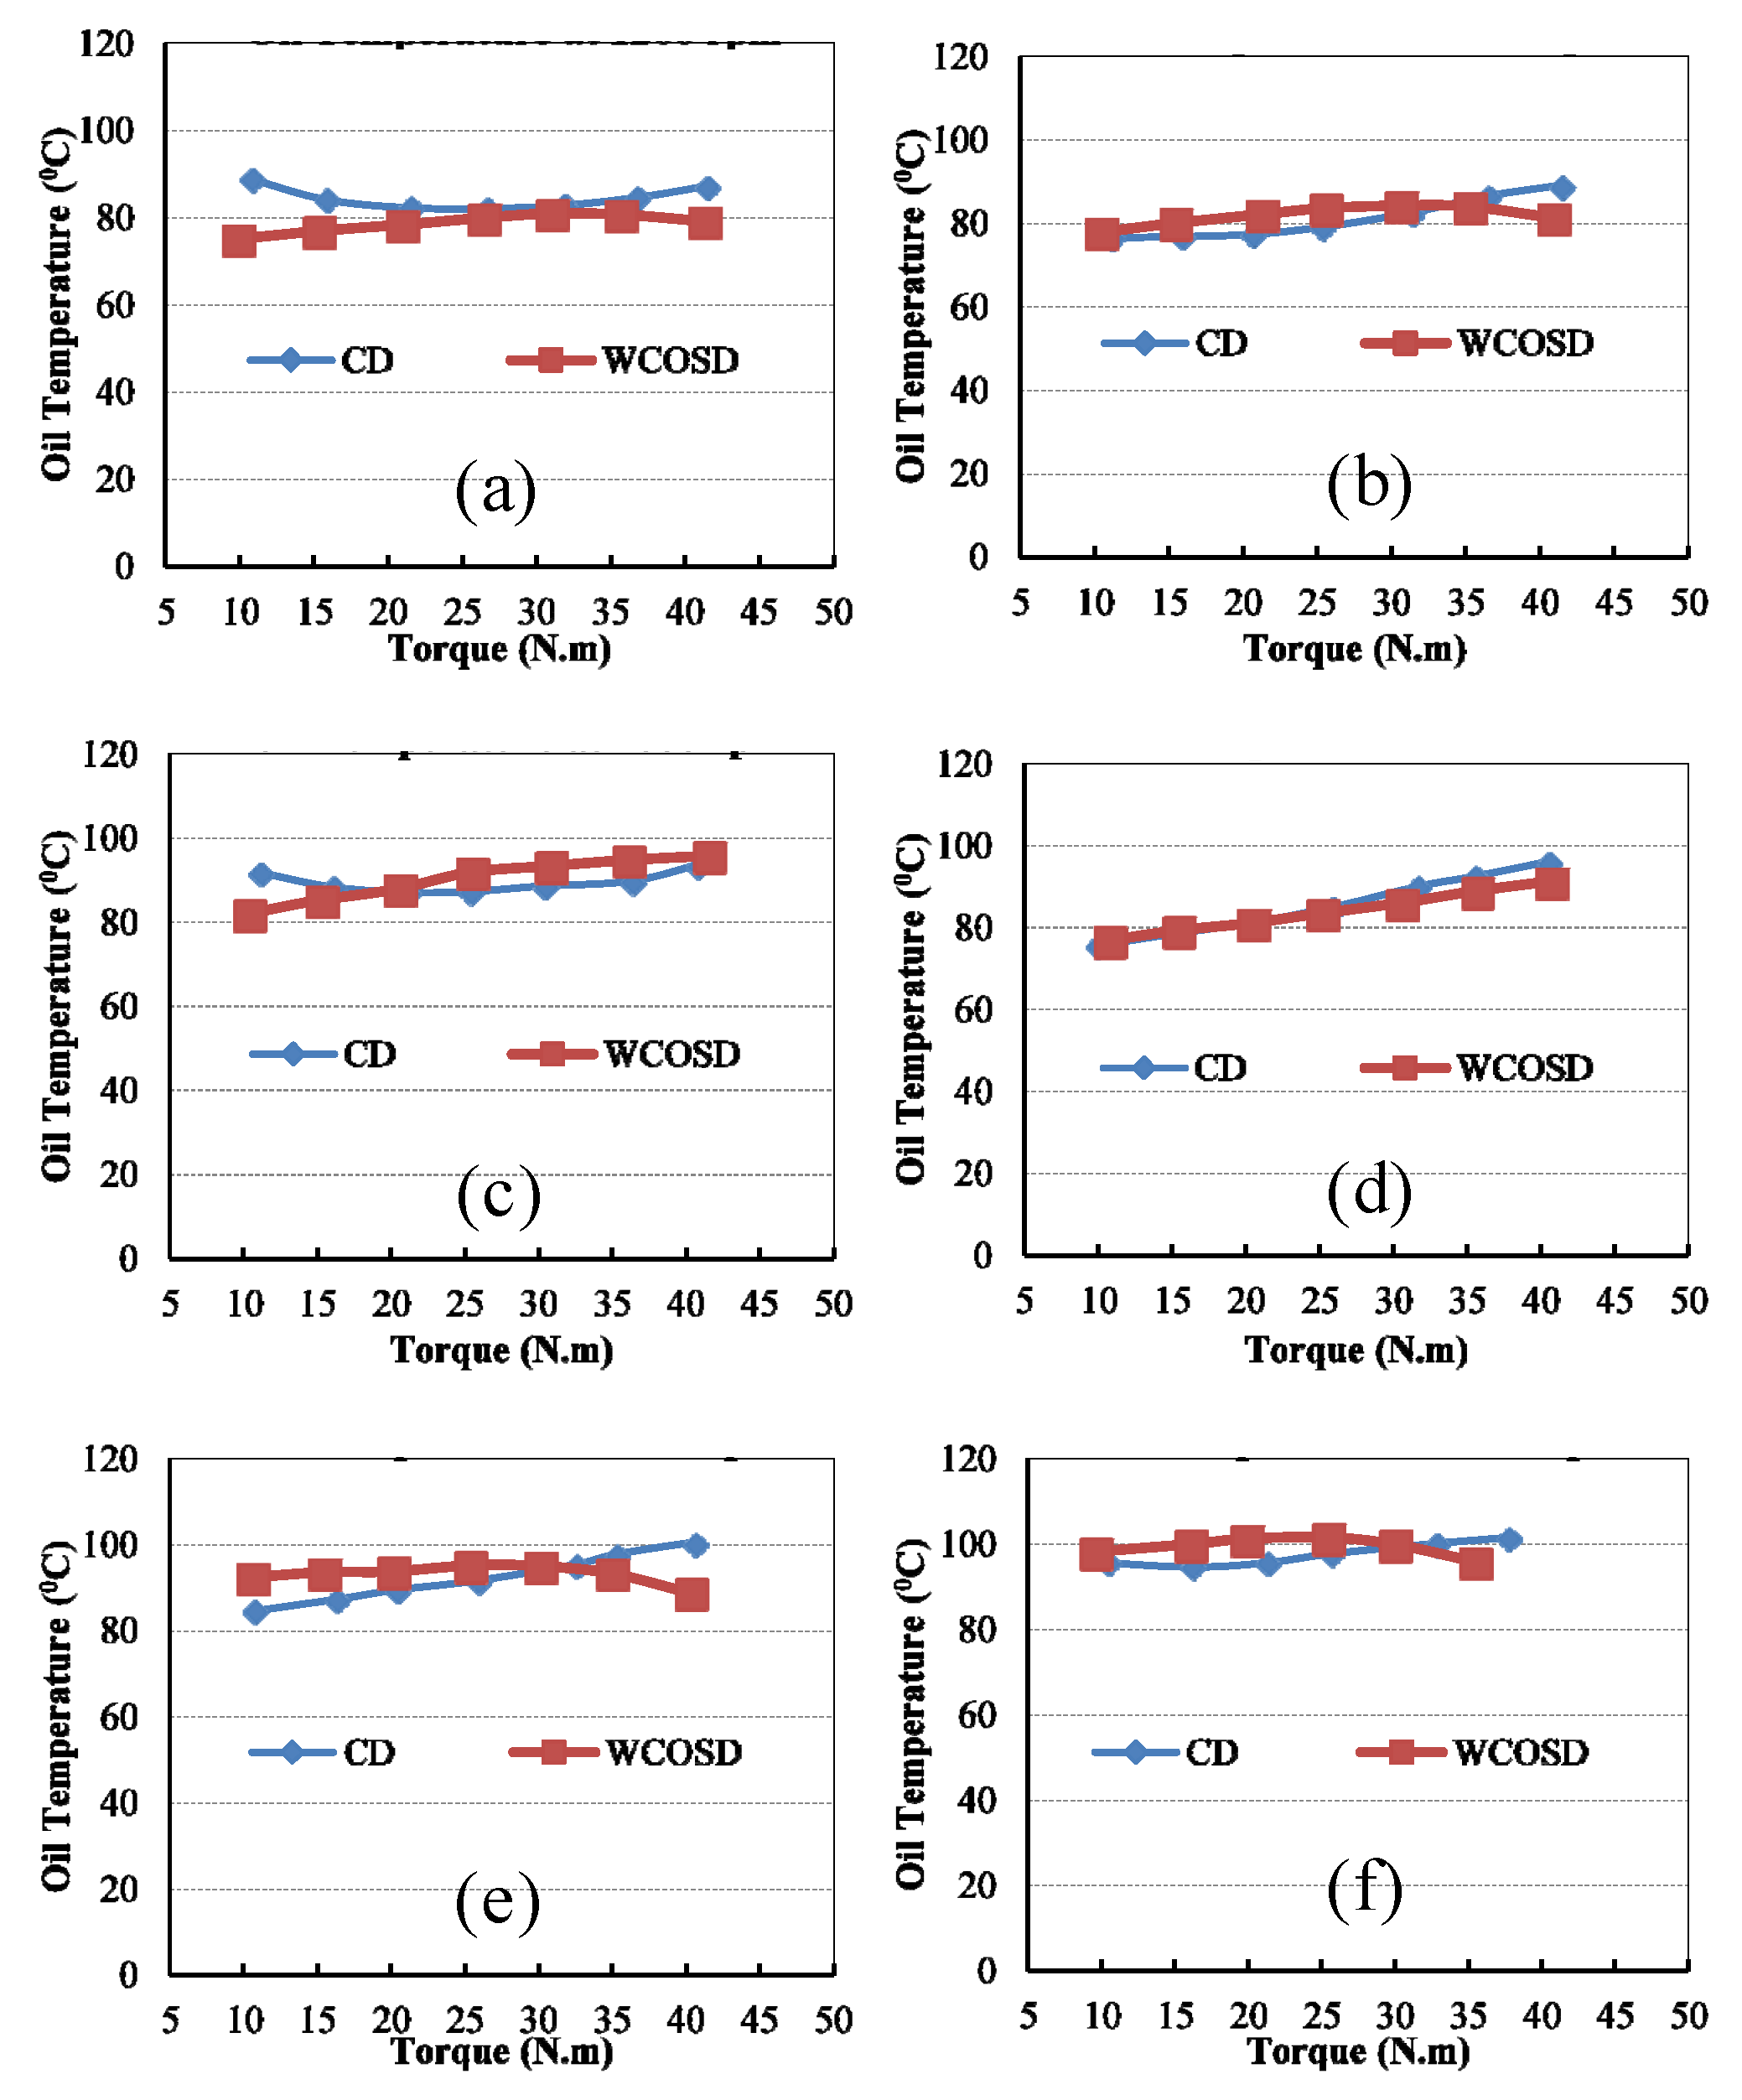
Figure 6 shows the oil lubricant temperature with partial load conditions and at different speeds. In addition, Figure 6a reveals a variation of the oil lubricant temperature against an engine load of 1200 rpm. The oil lubricant temperatures of the engine fueled with CD were higher than the oil lubricant temperatures of the engine fueled with WCOSD. At engine speeds of 1400 rpm, 1800 rpm, 2000 rpm and 2200 rpm, this difference was higher at low and high loads, and smaller at medium loads. When the engine load was low, the CD-fueled engine’s oil lubricant temperature was lower than the WCOSD-fueled engine’s oil lubricant temperature. However, for high engine loads, this trend shifted in the opposite direction. At 1600 rpm, the differences in lubricant temperature were higher at low loads and lower at high loads.
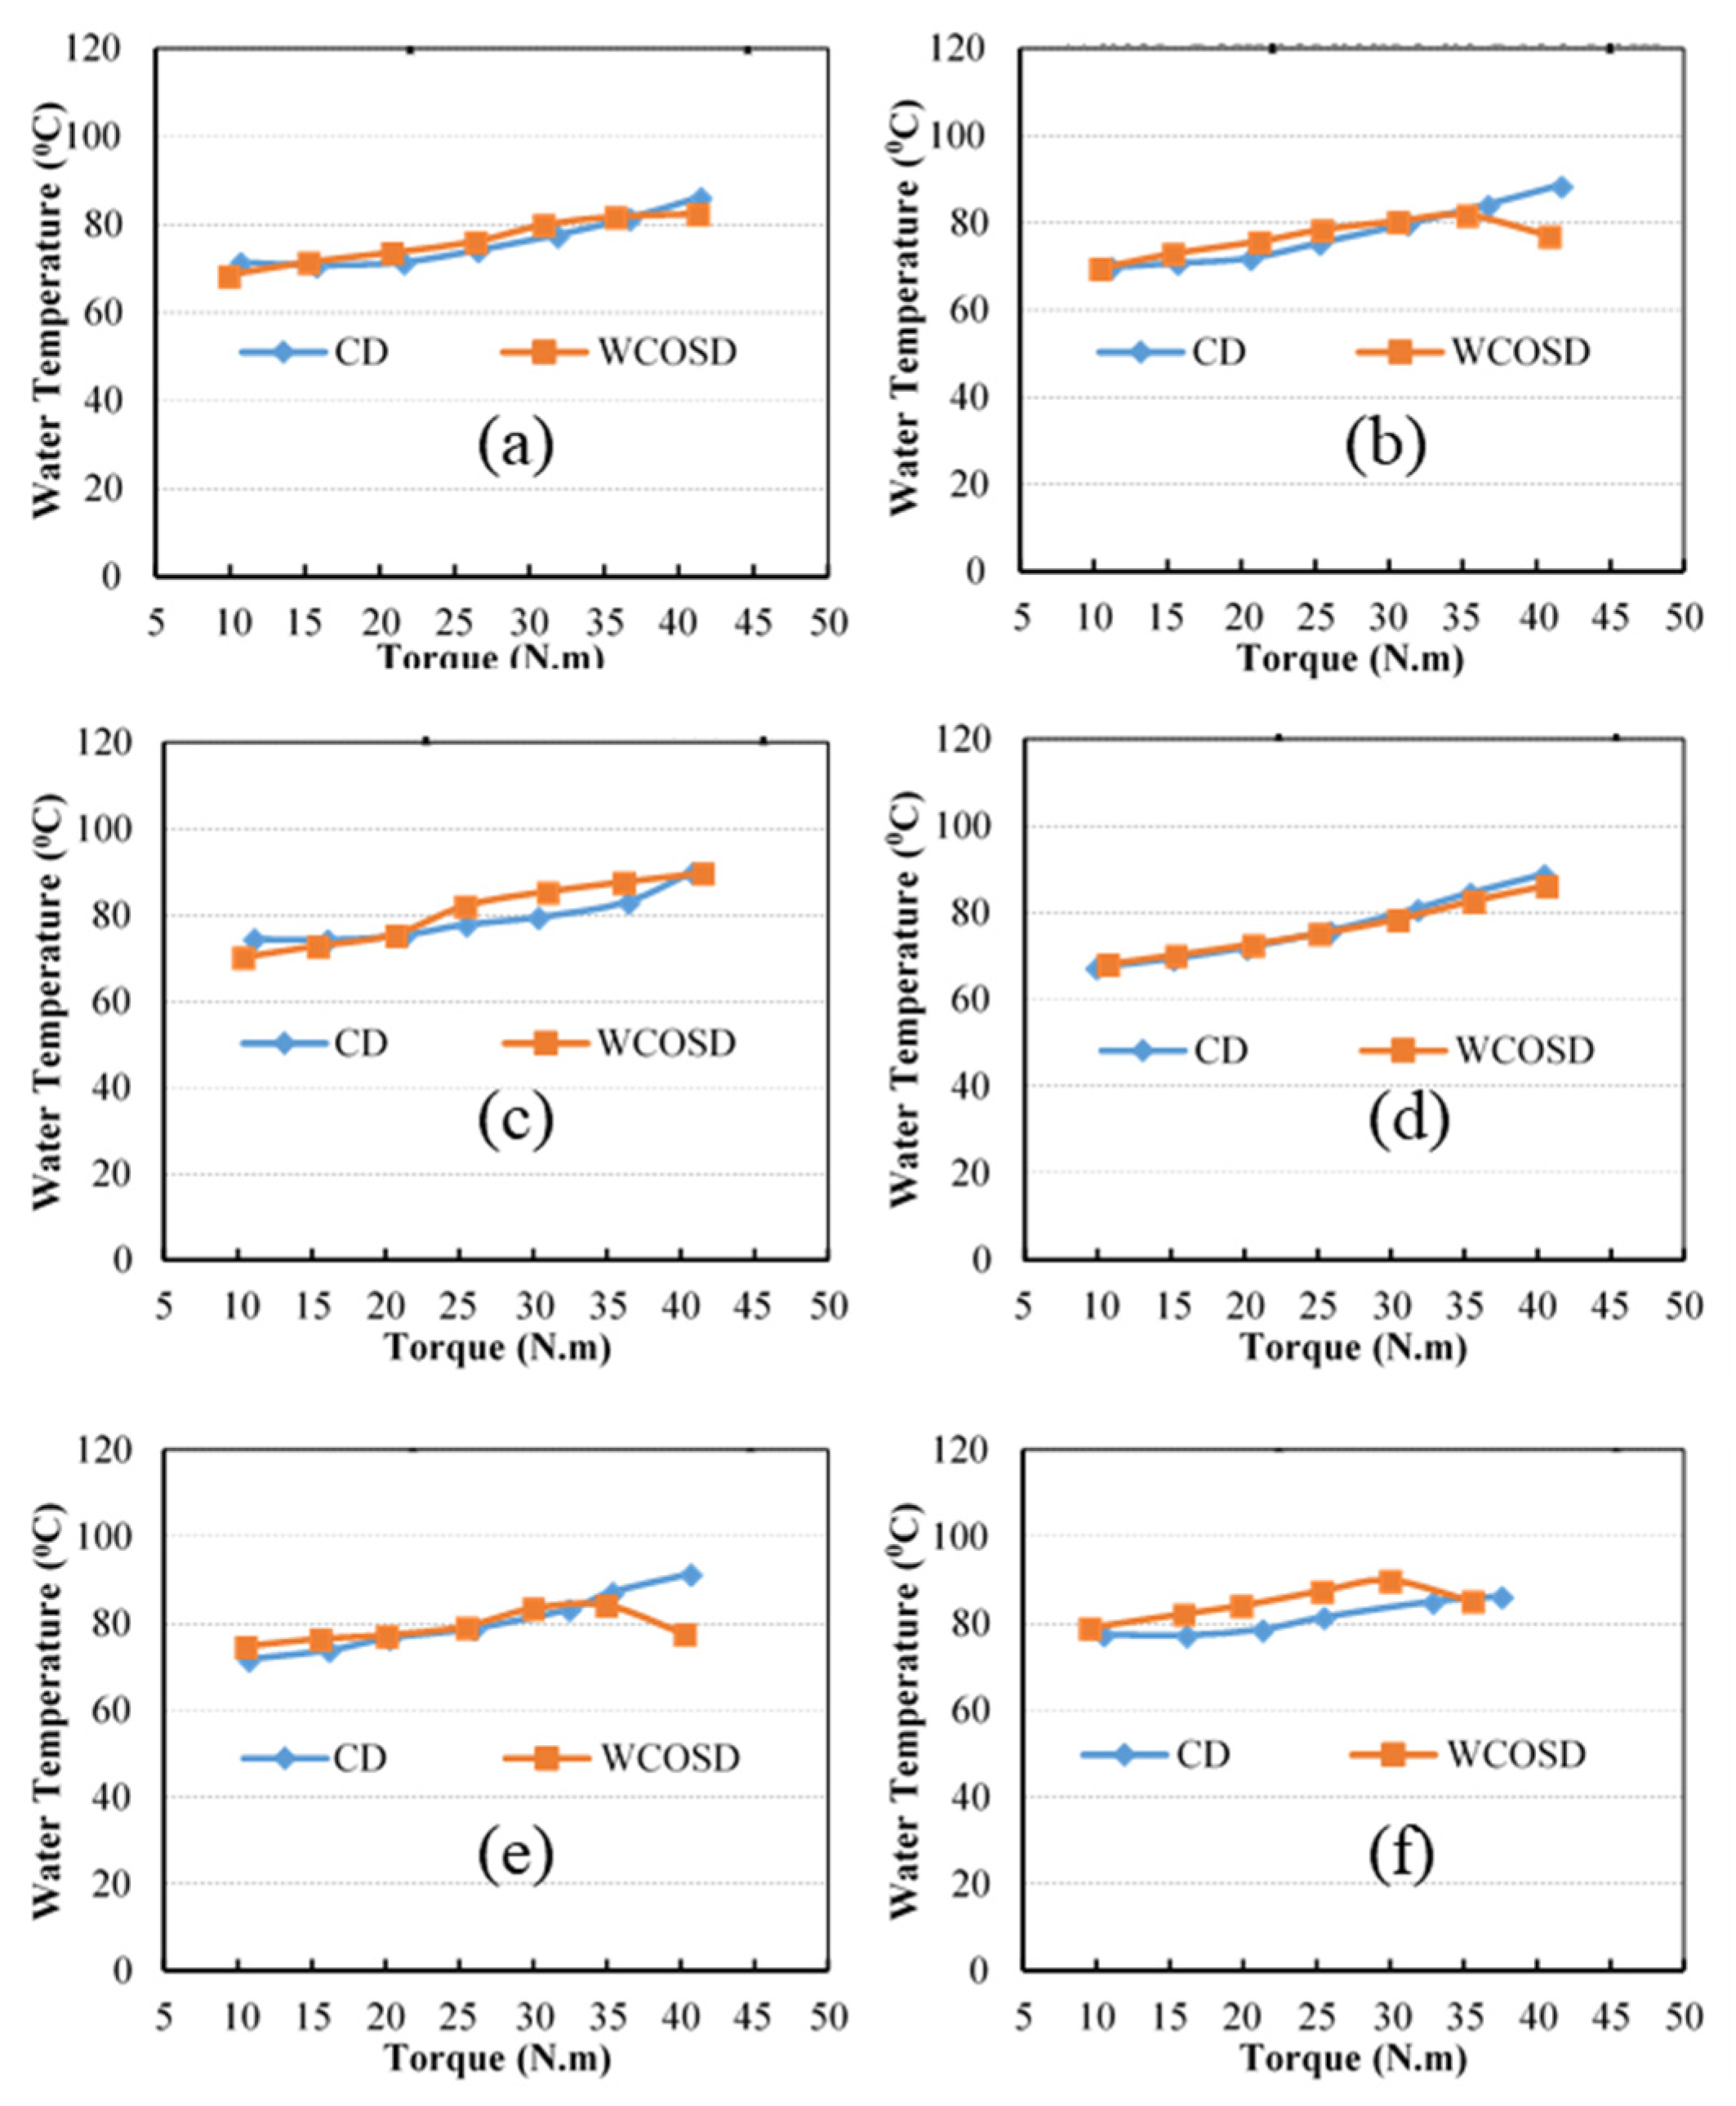
Figure 7 presents the examination of torque and the cooling water temperatures at seven different engine speeds. According to the experiment results, the cooling water temperatures of the WCOSD-fueled engines were higher than the cooling water temperatures of the CD-fueled engines at low and medium load conditions. In contrast, the cooling water temperatures of the WCOSD-fueled engines were lower than the cooling water temperatures of the CD-fueled engines at high load conditions. For most test conditions that used the same engine speeds and load conditions, the differences between the lubricant temperatures and cooling temperatures were inadequate. Further, when the engines were tested with both fuels, the parameters of each test point were recorded when the engines reached a steady state. Thus, the parameters for the performances of the engines at the same speeds and load conditions could be fully compared and analyzed.
In general, when the test engine was at a full load condition, CD’s higher heating value resulted in higher cooling water and lubricant temperatures. At low load conditions, CD’s higher viscosity negatively affected the quality of the injection and air-fuel mixture. As a result, CD’s output power was lower than WCOSD’s output power. In summary, CD fuel produced lower cooling water and lubricant temperatures at lower load conditions, due to the lower released heat.
3. Testing Equipment, Experimental Setup and Test Procedure
3.1. Characteristics of Commercial Diesel Fuel and Waste Cooking Oil Synthetic Diesel Fuel
This research compared the characteristics of test engines that were fueled by CD and WCOSD. The CD fuel was bought at a fuel station in Saraburi and was used as the reference fuel for this study. The characteristics of CD and WCOSD are listed in Table 2.
For this research, catalyst cracking biodiesel was successfully manufactured from WCOSD at the laboratory. The WCOSD was pre-treated to remove solid particles and excessive water and was then used as the raw material for cracking without further treatment. During the cracking process, the free fatty acids (FFAs) in the WCOSD were decarboxylated to hydrocarbon and CO2. FFAs cannot deactivate base catalysts that are in soap form. Therefore, before carrying out the reaction, it is beneficial to use transesterification on WCOSD by removing the FFAs from the raw material, through neutralization with an alkaline solution, esterification with glycerine, extraction with solvents and distillation or removal of the fatty acids with ion-exchange to avoid the form of soaps. Indeed, to manufacture biodiesel fuel oil, in place of diesel, with a higher stable energy output than that of the conventional fatty acid methyl esters (FAME) process (60%), the synthesizing process known as the catalytic cracking method (CCM) was used with a non-food oil at the pilot-scale level. As shown in Figure 8, this new biodiesel production process was comprised of the simple catalytic cracking of different kinds of animal fats and vegetable oils. The results showed that the product quality was similar to, or even higher than, the product quality of CD fuel.
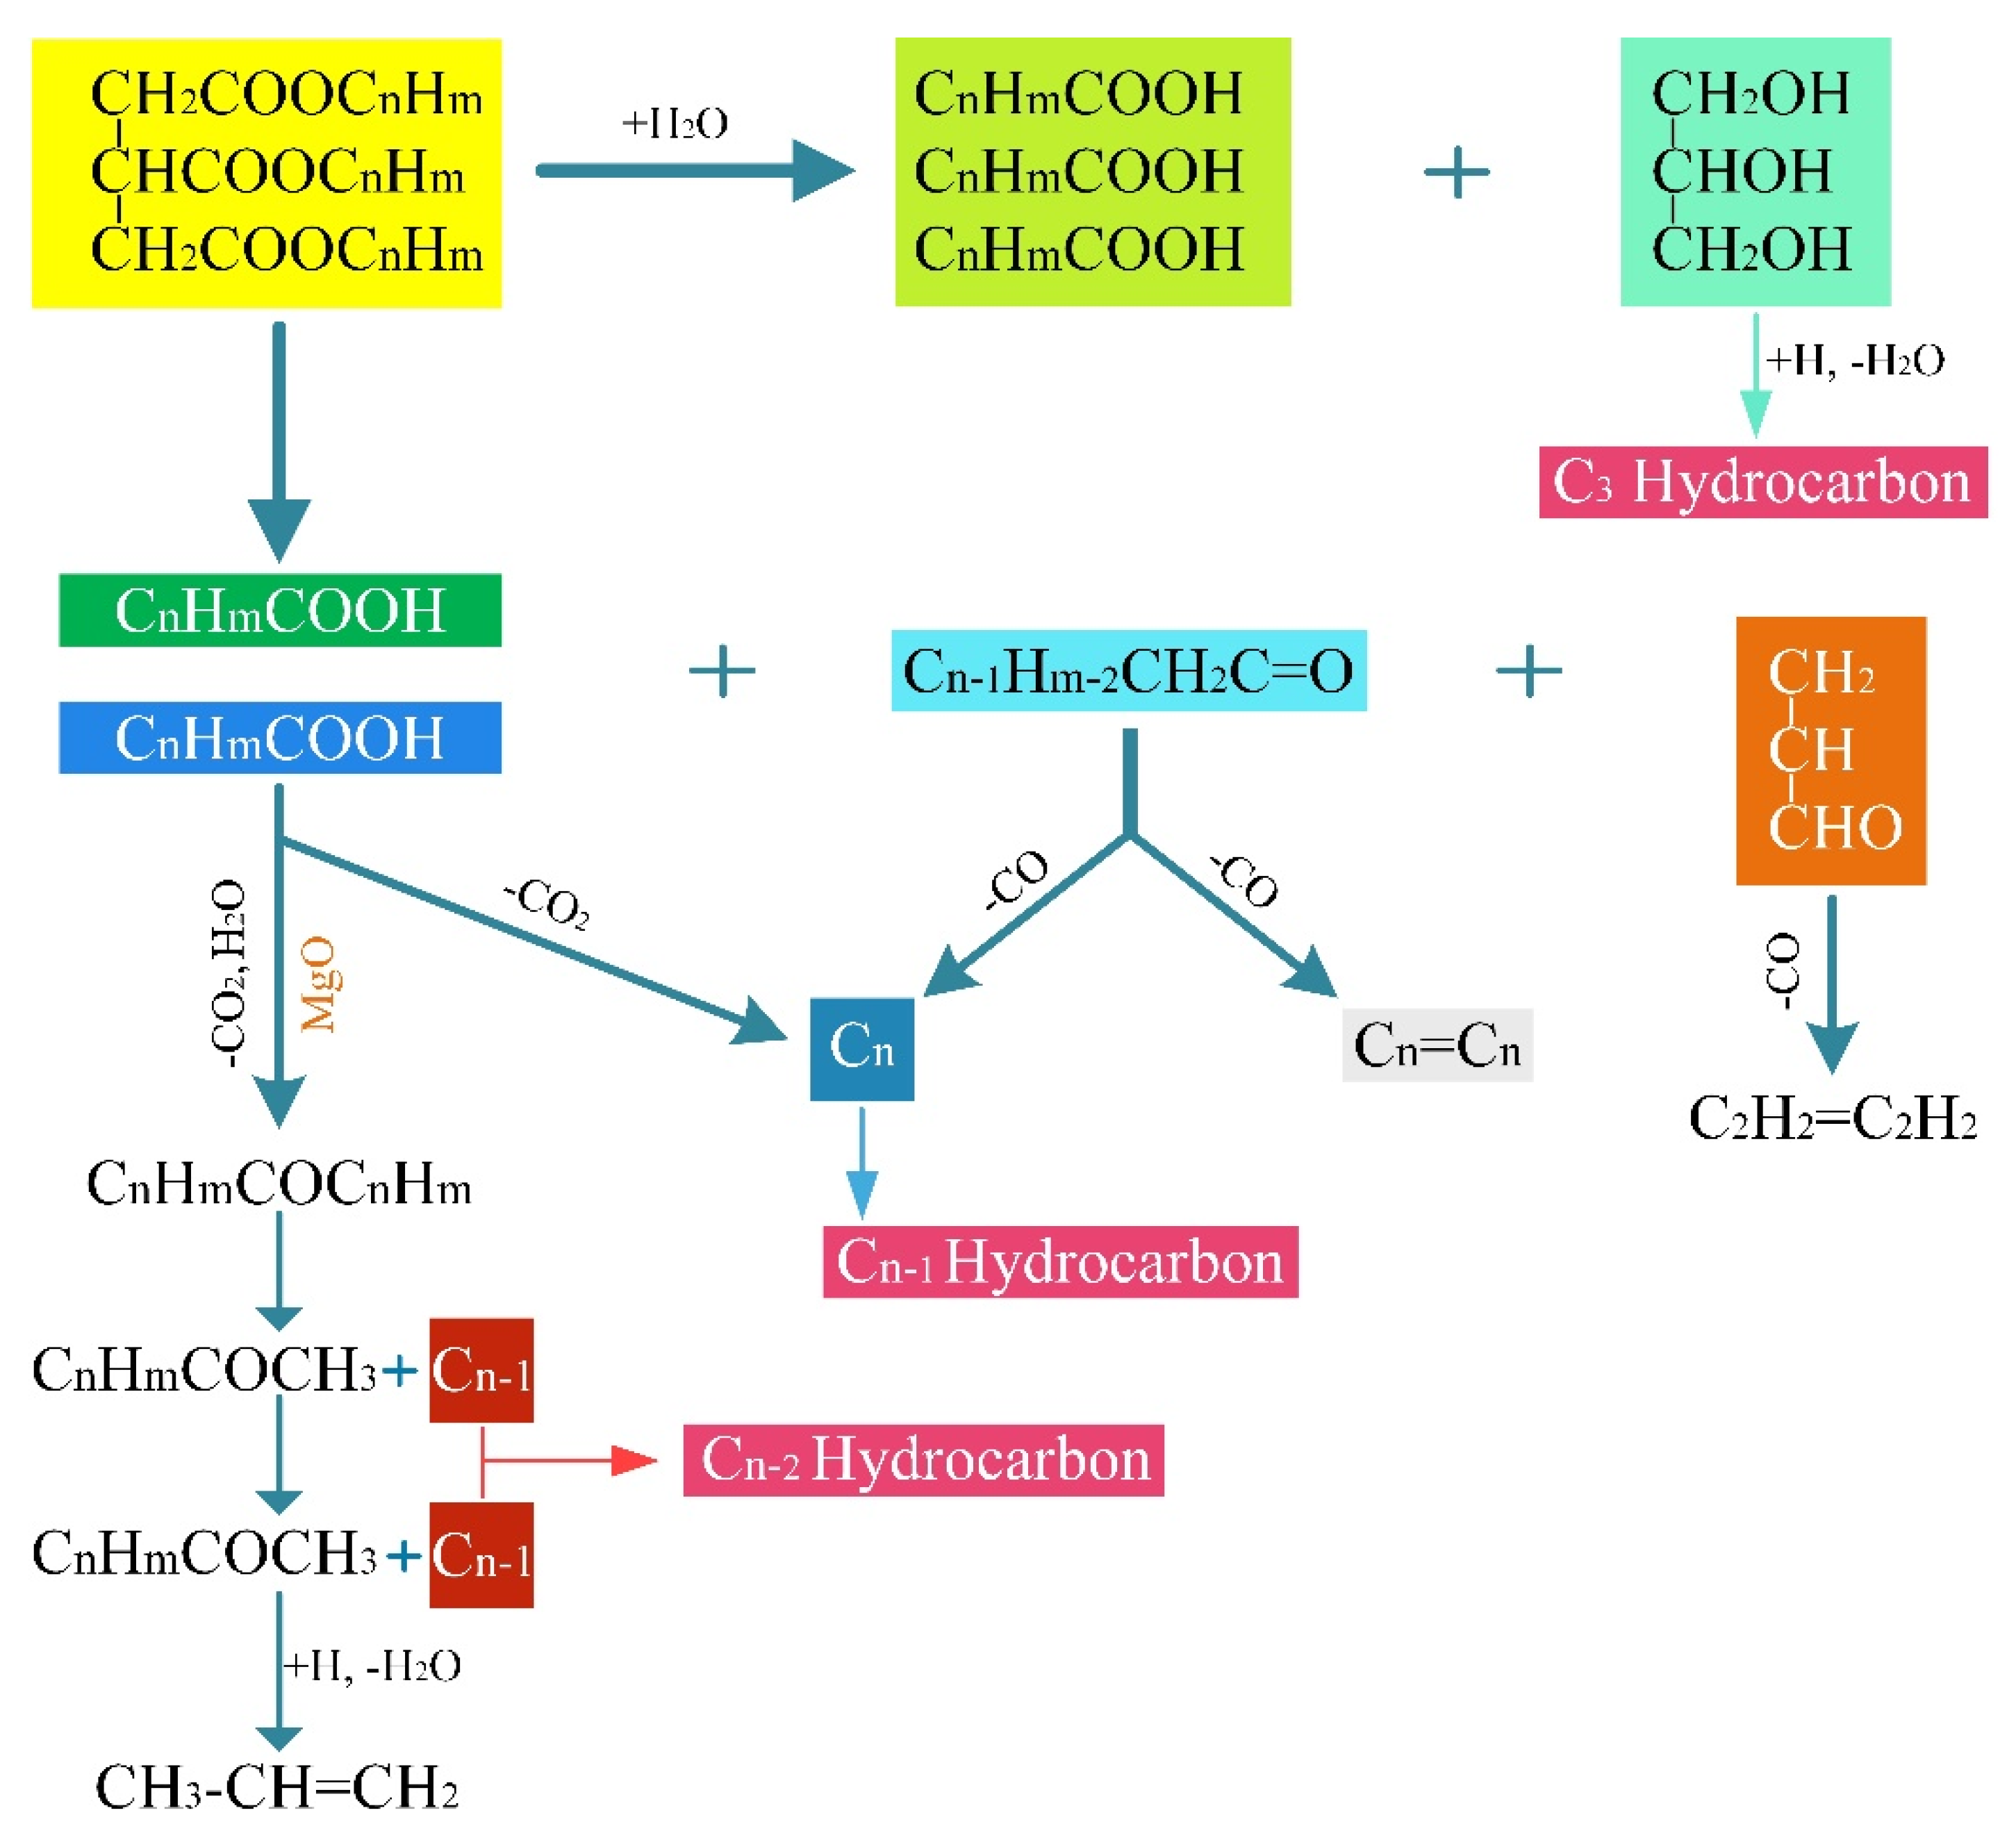
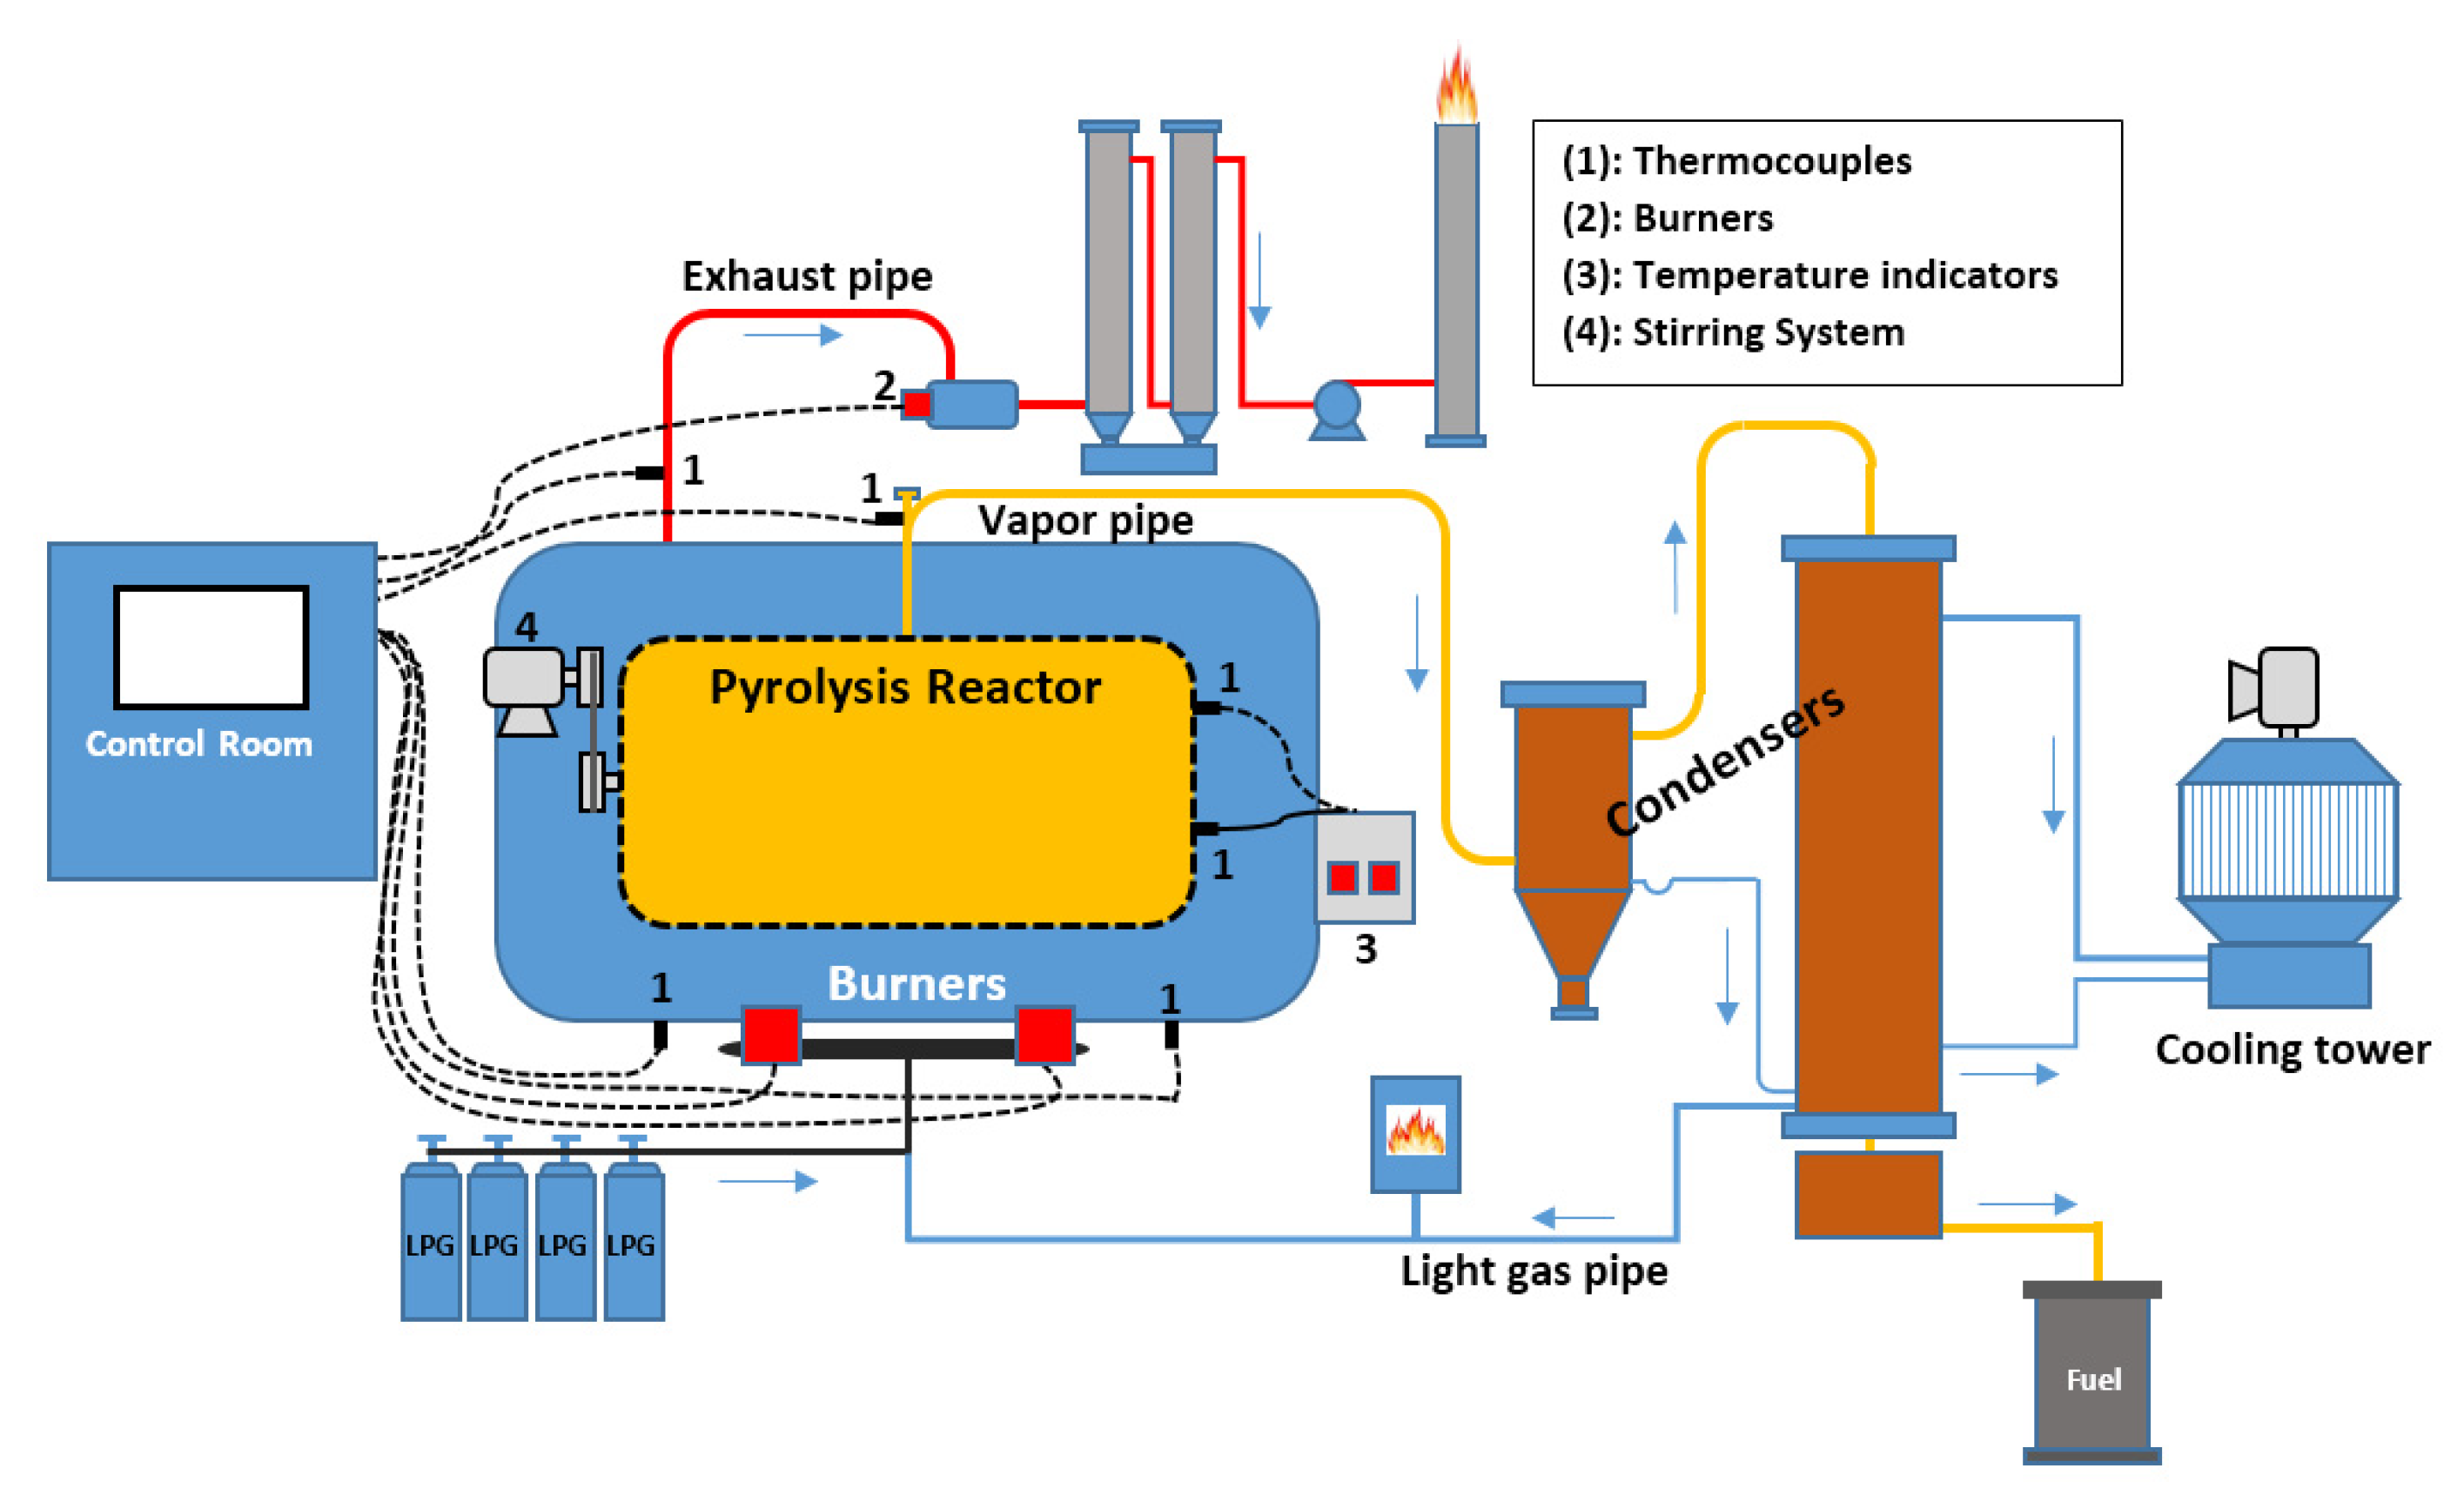
The pathway of the cracking reaction involved the following: (1) the hydrolysis of the triglycerides to glycerine and free acid, (2) the dehydration of the glycerine to gaseous hydrocarbon, and (3) the decarboxylation of an FFA, such as carboxylic acid, hydrocarbon and CO2. The fuel was produced via the pyrolysis system using a schematic diagram, as shown in Figure 9. An internal agitate was then installed inside the reactor to allow for the continued extraction of the overflow of the reactive catalysts, their residues and their follow-up. In addition, a back-flow device was installed to control the outflow of high boiling point elements, and to allow for the selective recovery of kerosene and diesel through multistage cooling.
The catalyst was a magnesium oxide catalyst that was supported with activated carbon. The catalyst advances the Decarboxy-cracking of WCO and other triglycerides, to generate hydrocarbons with a middle-distillate range. The composition of the catalyst was an 89.20 weight percentage of activated carbon, and a 9.75 weight percentage of magnesium oxide.
According to the results of the analysis based on the synthesized oil that was yielded from the pyrolysis system, the fuel performance of the new biodiesel showed levels that were nearly identical to those of CD. The comparison of major indicators can be summarized as follows: (1) Sulphur—<3 ppm weight (the same as FAME); (2) Cetane Index—47.7 (lower than FAME but sufficient to meet the requirements); and (3) Flow Point—−25 °C (higher and better than FAME). The chemical and physical properties of the WCOSD are given in Table 2.
For the use of non-food oils, such as used cooking oil, Jatropha, and palm oil, in producing biodiesel, the present research aimed to establish the synthesizing process known as CCM. The new biodiesel (WCOSD) production process involved the simple catalytic cracking of a variety of vegetable oils and animal fats (Figure 8). The pathway of the cracking reaction can be summarized as the hydrolysis of triglycerides to glycerine and free acid; the dehydration of glycerine to gaseous hydrocarbon and water; the decarboxylation of an FFA, such as carboxylic acid, to hydrocarbon and CO2, using MgO (Equations (1) and (2)); and the decarbonylation and reaction of hydrocarbon.
As shown in Figure 9, the pilot plant was a type of side-on internal agitated reactor with a capacity of 200 L/day. As a consequence, an internal agitator was installed inside the reactor to allow for the extraction of the overflow of reactive catalysts and residues. In addition, a back-flow device was installed to control the outflow of high boiling point elements and to allow for the selective recovery of kerosene and diesel through multistage cooling. According to the results of the analysis based on the synthesized oil that was yielded from the pilot plant, the characteristics of the new biodiesel were nearly identical to those of CD, wherein the sulfur content was less than 3 ppm, the cetane index was 47.7, and the flow point was about −25 °C.
3.2. Experimental Apparatus
The engine that this study used was a single-cylinder, four strokes, naturally aspirated and water-cooled DI CI engine. The engine’s specifications are summarized in Table 1.
The test engine was coupled with a DC regenerative dynamometer—40KW (LKA 4180-AA). The specifications of the dynamometer are presented in Table 3.
3.3. Experimental Procedures
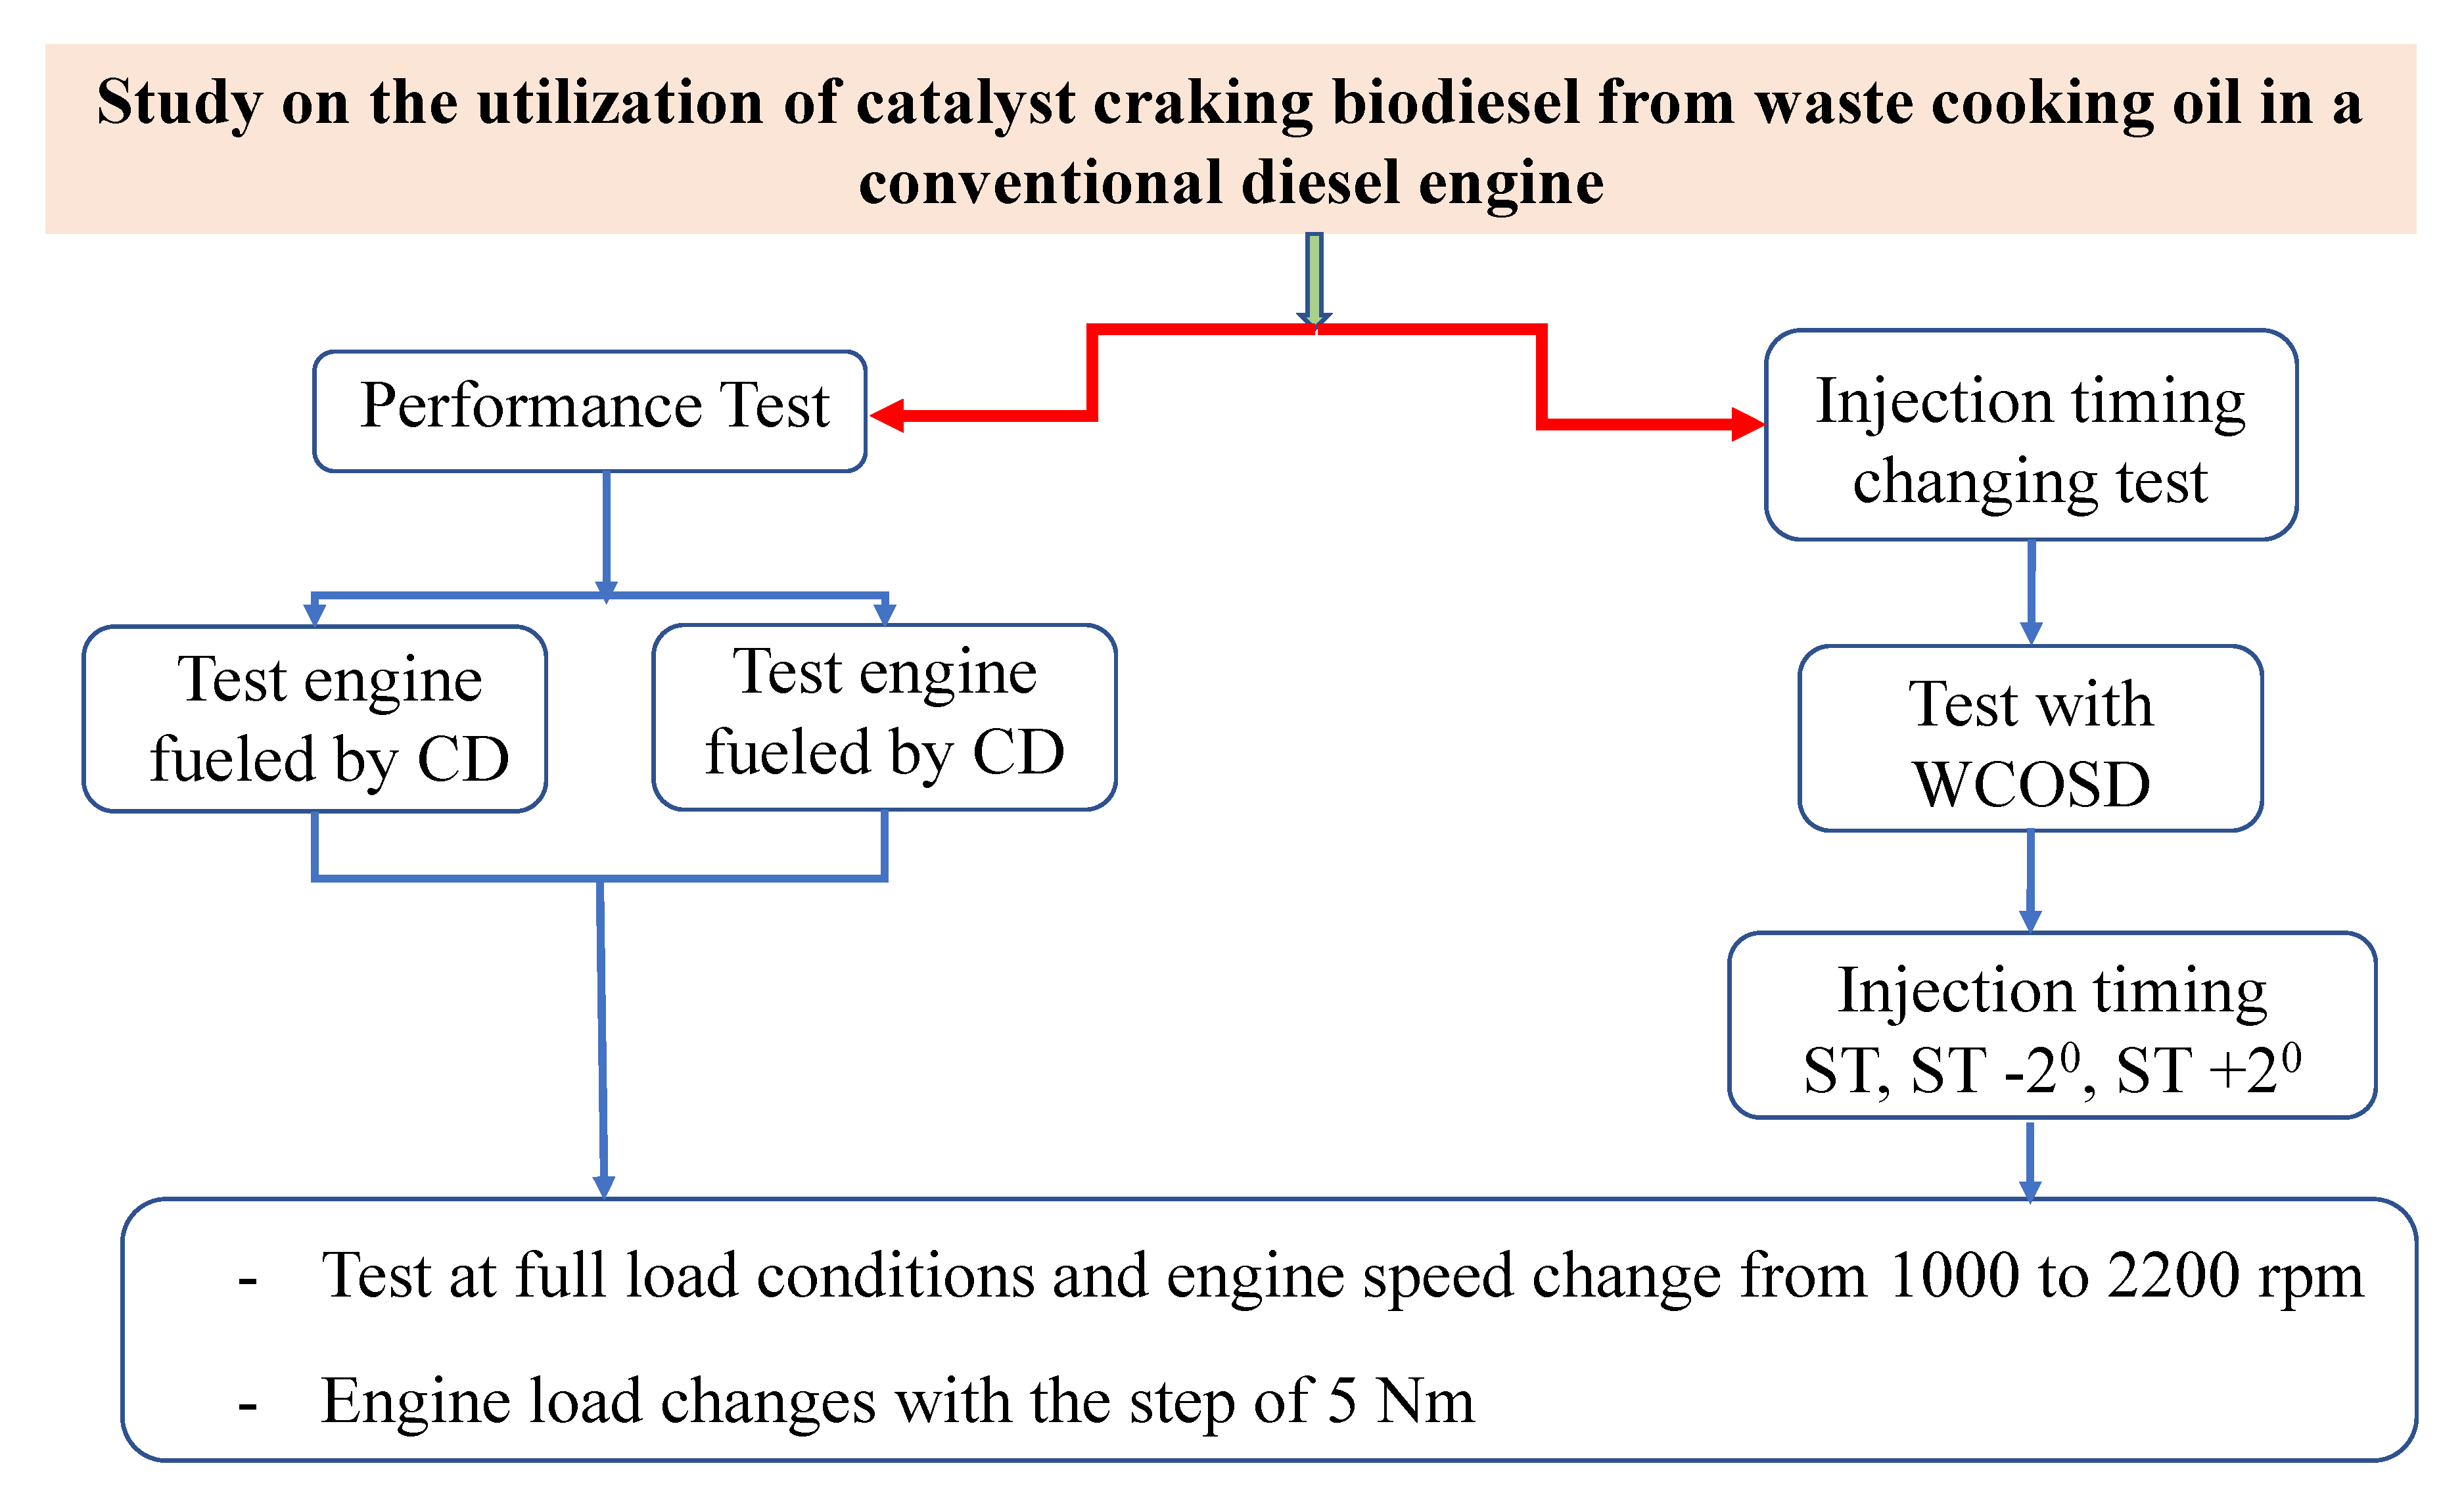
The experimental process in this study proceeded in two main phases as showed in Figure 10. The purpose of the first phase is to investigate the effects of catalyst cracking biodiesel from waste cooking oil on the performance of the tested engine. To reach this purpose, the effects of WCOSD on the emission characteristics and performance of the test engine are compared to those of commercial diesel. The effects of injection timing on the operation of the engine fueled with WCOSD are investigated in the second phase. To change injection timing, the camshaft of the engine is changed. The camshafts include the three following modes: (1) Standard camshaft (STD), with this camshaft both diesel and WCOSD are tested; (2) Modified camshaft with fuel cam advanced 2° CA (STD −2); and (3) Modified camshaft with fuel cam retarded 2° CA (STD +2).
Consequently, the engine is tested with commercial diesel fuel as a reference fuel. Second, the engine is tested with WCOSD. The engine firstly needs to warm-up to the steady operating conditions. At each test point, after adjusting to achieve desired speed and torque (or power), we wait until the engine reaches a stable operating state, then measure all desired parameters. These parameters include engine speed, power output (or torque), fuel consumption, intake air flow rate, exhaust and intake gas temperatures, oil temperatures, cooling water temperature, fuel temperature, environmental conditions and exhaust emission. However, this research is focused on the effect of fuels on the engine characteristics of performance, lubricant and cooling temperature; thus, we only show the results relating to these issues at the standard camshaft value.
4. Conclusions
Based on the catalytic cracking method that was used in this research, WCO was used to successfully manufacture biodiesel. In addition, an experiment was conducted to evaluate the performance and temperature characteristics of the test engines’ cooling water and lubricant oil after they were fueled by CD or WCOSD. When compared to the CD-fueled engine at a full load condition, the WCOSD-fueled engine’s torque dropped from 1.9 Nm to 5.4 Nm at all speeds, and its BSFC dropped at almost every speed at a full load condition. The BTEs of the WCOSD-fueled engine were higher than the BTEs of the CD-fueled engine at all engine speeds but 2400 rpm, at a full load. The exhaust temperatures of the engine running with WCOSD were slightly lower. The lubricant oil temperature for the WCOSD-engine dropped from 0.5 °C to 8.2 °C, and the cooling water temperature of that engine was slightly lower as well. When compared to the BSCF of the CD-fueled engine at a partial load condition, the BSFC of the engine running with WCOSD was almost always lower. In general, WCOSD can be used to fuel conventional CI engines, because it allows the engine to work well and to operate smoothly at all operation conditions, its engine performance at a full load is comparable to the engine performance of CD, and its engine performance at a partial load is comparable to, or slightly better than, the engine performance of CD at certain points.
Author Contributions
Experimental design was performed by T.N.V. and H.N.X.; fieldwork was conducted by H.N.X.; and statistical analyses were performed by T.N.V., K.N.D. and H.N.X.; H.N.X. and V.N.D. contributed to the writing—review & editing of the paper. All authors have read and agreed to the published version of the manuscript.
Funding
This research received no external funding.
Conflicts of Interest
The authors declare no conflict of interest.
References
- Calder, J.; Roy, M.M.; Wang, W. Performance and emissions of a diesel engine fueled by biodiesel-diesel blends with recycled expanded polystyrene and fuel stabilizing additive. Energy 2018, 149, 204–212. [Google Scholar] [CrossRef]
- Jiaqiang, E.; Pham, M.H.; Deng, Y.; Nguyen, T.; Duy, V.N.; Le, D.H.; Zhang, Z. Effects of injection timing and injection pressure on performance and exhaust emissions of a common rail diesel engine fueled by various concentrations of fish-oil biodiesel blends. Energy 2018. [Google Scholar] [CrossRef]
- Duc, K.N.; Tien, H.N.; Duy, V.N. Performance enhancement and emission reduction of used motorcycles using flexible fuel technology. J. Energy Inst. 2018, 91, 145–152. [Google Scholar] [CrossRef]
- Manigandan, S.; Gunasekar, P.; Poorchilamban, S.; Nithya, S.; Devipriya, J.; Vasanthkumar, G. Effect of addition of hydrogen and TiO2 in gasoline engine in various exhaust gas recirculation ratio. Int. J. Hydrogen Energy 2019, 44, 11205–11218. [Google Scholar] [CrossRef]
- Manigandan, S.; Gunasekar, P.; Devipriya, J.; Nithya, S. Emission and injection characteristics of corn biodiesel blends in diesel engine. Fuel 2019, 235, 723–735. [Google Scholar] [CrossRef]
- Anawe, P.A.L.; Folayan, J.A. Data on physico-chemical, performance, combustion and emission characteristics of Persea Americana Biodiesel and its blends on direct-injection, compression-ignition engines. Data Brief 2018, 21, 1533–1540. [Google Scholar] [CrossRef]
- Bello, E.I.; Oguntuase, B.; Osasona, A.; Mohammed, T.I. Characterization and engine testing of palm kernel oil biodiesel. Eur. J. Eng. Technol. 2015, 3, 1–14. [Google Scholar]
- Yadav, C.; Saini, A.; Bera, M.; Maji, P.K. Thermo-analytical characterizations of biodiesel produced from edible and non-edible oils. Fuel Process. Technol. 2017, 167, 395–403. [Google Scholar] [CrossRef]
- Nguyen, D.V.; Duy, V.N. Numerical analysis of the forces on the components of a direct diesel engine. Appl. Sci. (Switzerland) 2018, 8, 761. [Google Scholar] [CrossRef] [Green Version]
- Nguyen Duc, K.; Nguyen Duy, V.; Hoang-Dinh, L.; Nguyen Viet, T.; Le-Anh, T. Performance and emission characteristics of a port fuel injected, spark ignition engine fueled by compressed natural gas. Sustain. Energy Technol. Assess. 2019. [Google Scholar] [CrossRef]
- Duc, K.N.; Duy, V.N. Study on performance enhancement and emission reduction of used fuel-injected motorcycles using bi-fuel gasoline-LPG. Energy Sustain. Dev. 2018. [Google Scholar] [CrossRef]
- Anh, T.L.; Duy, V.N.; Thi, H.K.; Xa, H.N. Experimental investigation on establishing the HCCI process fueled by n-heptane in a direct injection diesel engine at different compression ratios. Sustainability (Switzerland) 2018, 10, 3878. [Google Scholar] [CrossRef] [Green Version]
- Duc, K.N.; Tien, H.N.; Duy, V.N. A Study of Operating Characteristics of Old-Generation Diesel Engines Retrofitted with Turbochargers. Arab. J. Sci. Eng. 2018, 43, 4443–4452. [Google Scholar] [CrossRef]
- Huang, J.; Wang, Y.; Qin, J.; Roskilly, A.P. Comparative study of performance and emissions of a diesel engine using Chinese pistache and jatropha biodiesel. Fuel Process. Technol. 2010. [Google Scholar] [CrossRef]
- Muralidharan, K.; Vasudevan, D. Performance, emission and combustion characteristics of a variable compression ratio engine using methyl esters of waste cooking oil and diesel blends. Appl. Energy 2011. [Google Scholar] [CrossRef]
- Fukuda, H.; Kondo, A.; Noda, H. Biodiesel fuel production by transesterification of oils. J. Biosci. Bioeng. 2001. [Google Scholar] [CrossRef]
- Han, X.; You, K.; Tan, J.; Wang, J.; Ge, Y.; He, C. Characteristics of polycyclic aromatic hydrocarbons emissions of diesel engine fueled with biodiesel and diesel. Fuel 2010, 89, 2040–2046. [Google Scholar] [CrossRef]
- Saravanan, S.; Nagarajan, G.; Sampath, S. International Journal of Sustainable Energy Combined effect of injection timing, EGR and injection pressure in reducing the NO x emission of a biodiesel blend Combined effect of injection timing, EGR and injection pressure in reducing the NO x emission of. Int. J. Sustain. Energy 2014, 33, 386–399. [Google Scholar] [CrossRef]
- Meng, X.; Chen, G.; Wang, Y. Biodiesel production from waste cooking oil via alkali catalyst and its engine test. Fuel Process. Technol. 2008. [Google Scholar] [CrossRef]
- Abu-Jrai, A.; Yamin, J.A.; Ala’a, H.; Hararah, M.A. Combustion characteristics and engine emissions of a diesel engine fueled with diesel and treated waste cooking oil blends. Chem. Eng. J. 2011. [Google Scholar] [CrossRef]
- Ozsezen, A.N.; Canakci, M. Determination of performance and combustion characteristics of a diesel engine fueled with canola and waste palm oil methyl esters. Energy Convers. Manag. 2011, 52, 108–116. [Google Scholar] [CrossRef]
- An, H.; Yang, W.M.; Maghbouli, A.; Li, J.; Chou, S.K.; Chua, K.J. Performance, combustion and emission characteristics of biodiesel derived from waste cooking oils. Appl. Energy 2013. [Google Scholar] [CrossRef]
Figure 1.
(a) engine torque and (b) engine brake power at full load conditions.

Figure 2.
The BSFC at full load condition.

Figure 3.
The brake thermal efficiency at full load condition.

Figure 4.
Lubricant oil temperature at full load condition.

Figure 5.
Cooling water temperature at the full load condition.

Figure 6.
Lubricant oil temperatures at partials load and different engine speeds: (a) at 1200 rpm, (b) 1400 rpm, (c) 1600 rpm, (d) 1800 rpm, (e) 2000 rpm, (f) 2200 rpm.
Figure 6.
Lubricant oil temperatures at partials load and different engine speeds: (a) at 1200 rpm, (b) 1400 rpm, (c) 1600 rpm, (d) 1800 rpm, (e) 2000 rpm, (f) 2200 rpm.

Figure 7.
Cooling water temperatures at partial loads and different engine speeds: (a) at 1200 rpm, (b) 1400 rpm, (c) 1600 rpm, (d) 1800 rpm, (e) 2000 rpm, (f) 2200 rpm.
Figure 7.
Cooling water temperatures at partial loads and different engine speeds: (a) at 1200 rpm, (b) 1400 rpm, (c) 1600 rpm, (d) 1800 rpm, (e) 2000 rpm, (f) 2200 rpm.

Figure 8.
Reaction mechanisms of cracking reaction.

Figure 9.
Schematic diagram of the pyrolysis system during the production of waste cooking oil.

Figure 10.
Experimental processes.


Table 1.
Specifications of the test engine.
| Parameter | Characteristic |
|---|---|
| Type of the engine | Single-cylinder, four strokes, direct injection water-cooled, naturally aspirated. |
| Number of cylinders | 1 |
| Bore x Stroke | 97 mm × 96 mm |
| Displacement | 709 cm3 |
| Continuous rated power output | 9.2 kW/2400 rpm |
| Starting system | Electric system |
| Air cleaner type | Wet/dry type |
| Lubricating system | Forced lubrication with a pump |
| Cooling system | Radiator |
| Combustion system | Direct injection |
| Max. torque | 49 Nm/1600 rpm |
| Compression ratio | 18.1 |
| Max. output | 10.3 kW/2.400 rpm |
| Dry weight | 116 kg |
Table 2.
Chemical and physical properties of tested fuels.
| Properties | WCOSD | CD | Method Test | |
|---|---|---|---|---|
| Composition (%) | C | 77.14 | 81.17 | |
| H | 14.6005 | 15.285 | ||
| N | 0.077545 | 0.066545 | ||
| Density (kg/m3) | 820.289 | 827.485 | ASTM D1298 | |
| Heating Value (MJ/kg) | 44.245 | 44.864 | ASTM 04-5865 | |
| Flash Point (°C) | 93.5 | 81.5 | ASTM D92 | |
| Viscosity (mm2/s) | 2.92 | 3.74 | ASTM D445 | |
| Cetan Number | 47.7 | 49.2 | ASTM D613 | |
Table 3.
Specifications of the 40-kW direct current generator.
| Model of Dynamometer | LKA-4180 |
|---|---|
| Electric Supply | 3 × 380–420 V, 50 Hz |
| Maximum mechanical speed | 4500 min−1 |
| Base speed (min−1) at armature voltage (V) | 1420 min−1 |
| Cooling system | Air with a flow rate of 1300 m3/h |
| Power output | 62.2 kW |
| Armature voltage | 440 V |
| Exciter voltage | 310 V |
| Rated armature current | 151 A |
| Exciter current | 2.00 A |
| Torque | 398 Nm |
© 2020 by the authors. Licensee MDPI, Basel, Switzerland. This article is an open access article distributed under the terms and conditions of the Creative Commons Attribution (CC BY) license (http://creativecommons.org/licenses/by/4.0/).
Share and Cite
MDPI and ACS Style
Nguyen Xa, H.; Nguyen Viet, T.; Nguyen Duc, K.; Nguyen Duy, V. Utilization of Waste Cooking Oil via Recycling as Biofuel for Diesel Engines. Recycling 2020, 5, 13. https://0-doi-org.brum.beds.ac.uk/10.3390/recycling5020013
AMA Style
Nguyen Xa H, Nguyen Viet T, Nguyen Duc K, Nguyen Duy V. Utilization of Waste Cooking Oil via Recycling as Biofuel for Diesel Engines. Recycling. 2020; 5(2):13. https://0-doi-org.brum.beds.ac.uk/10.3390/recycling5020013
Chicago/Turabian StyleNguyen Xa, Hoi, Thanh Nguyen Viet, Khanh Nguyen Duc, and Vinh Nguyen Duy. 2020. "Utilization of Waste Cooking Oil via Recycling as Biofuel for Diesel Engines" Recycling 5, no. 2: 13. https://0-doi-org.brum.beds.ac.uk/10.3390/recycling5020013