Article

Influence of Hydrologic Alteration on Sediment, Dissolved Load and Nutrient Downstream Transfer Continuity in a River: Example Lower Brda River Cascade Dams (Poland)

Institute of Geography, Kazimierz Wielki University, 85-064 Bydgoszcz, Poland
*
Author to whom correspondence should be addressed.
Submission received: 6 May 2021 / Revised: 29 June 2021 / Accepted: 30 June 2021 / Published: 1 July 2021

Abstract

:
Hydrologic alternation of river systems is an essential factor of human activity. Cascade-dammed waters are characterized by the disturbed outflow of material from the catchment. Changes in sediment, dissolved load and nutrient balance are among the base indicators of water resource monitoring. This research was based on the use of hydrological and water quality data (1984–2017) and the Indicators of Hydrologic Alteration (IHA) method to determine the influence of river regime changes on downstream transfer continuity of sediments and nutrients in the example of the Lower Brda river cascade dams (Poland). Two types of regimes were used: hydropeaking (1984–2000) and run–of–river (2001–2017). Using the IHA method and water quality data, a qualitative and quantitative relationship were demonstrated between changes of regime operation and sediment and nutrient balance. The use of sites above and below the cascade made it possible to determine sediment, dissolved load, and nutrient trapping and removing processes. Studies have shown that changes in operation regime influenced the supply chain and continuity of sediment and nutrient transport in cascade-dammed rivers. The conducted research showed that sustainable management of sediment and nutrient in the alternated catchment helps achieve good ecological status of the water.

1. Introduction

The hydrological cycle is limited by natural and anthropogenic factors. The first group includes, e.g., atmospheric circulation, precipitation, geological structure and soil erosion among others; the second group includes modifying river systems for flood control, water supply, irrigation, land cover changes and electricity production, among others. The factors listed in both groups are directly or indirectly influenced by human activities, which additionally modify the hydrological cycle. Water flow results from the phenomena and processes taking place in the catchment area and is responsible for the nature of fluvial processes, sediment dynamics, and bedforms forming in the channel [1]. Understanding the river regime is key to defining climate change as a human impact [2,3].
The regime of inland waters on a regional and global scale regulates the transport of sediments and nutrients from land to the ocean [4]. Climate change is reflected in the global balance of sediment supply to the world’s oceans [5]. Nutrients are one of the main components of soil, water, sediments and organisms [6], especially phosphorus, which is considered a key factor of eutrophication [7]. Research by Allan [8] indicated that anthropogenic eutrophication processes are related to agricultural area development, especially with respect to phosphorus supply to reservoirs [9]. Water pollution can be expressed by the processes of sorption and desorption of nutrients from sediments [10]. Revenga et al. [11] showed that 60% of the world’s rivers are fragmented by hydrological alteration and have lost their hydromorphological and ecological continuity [12]. Belletti et al. [13] pointed out there are at least 1.2 million instream barriers in 36 European countries. However, the appearance of large dams and their reservoirs increased sediment retention on the terrestrial part of the hydrosphere, with estimated retention of suspended particles as 50% of the load that would have been transported to the oceans [4,14]. The number of large dams in the world has been estimated at 58,700 [15]. The impact of dams is reflected in many aspects: hydrological, morphological and ecological, among others. The change concerns not only the commission of the reservoir itself, i.e., the increase of the water surface in the catchment area, but also has impacts above and below, often over many kilometers. Dams influence changes in the timing and frequency of high and low flows [16]. In many cases, this is due to hydropower plant regimes, which should preserve ecological base flow (environmental flow). In this respect, participation is a significant renewable energy source (RES) in overall energy consumption. Poland should reach 15% RES by 2020 [17], and in 2016 the share of RES in total energy consumption reached 13.5%, including 2% from hydropower plants [18]. Transformation of river regimes below dams has been studies by Wiliams and Wolman [19], Vörösmarty et al. [20] and Obodovskyi et al. [21]. The aggradational or degradational state of a river system influences channel morphology and substrate textures of the bottom channel below dams [22]. Research on the dynamics of sediments transport includes that by Van Rijn [23], Kondolf [24] and Vörösmarty et al. [4], also taking into account research in our study area, the Brda River catchment [25]. Dams reduce the natural connectivity of the fluvial system [26], and the natural regime of rivers is changed [27]. This reflects on the sediment budget, where accumulation processes are dominant. For example, a 90% sediment load reduction was observed after the Akosombo Dam construction on the Volta River in West Africa [28], a 45% reduction of sediments in the Sulejów Reservoir [29], sediment accumulation estimated at 66% on the Danube River in Serbia [30], and accumulation of suspended sediments by the Wloclawek dam (Vistula River in Poland) estimated by Babiński [31] at 42%. Changes in river regime caused by reservoir function is reflected by nutrient trapping [32] or altering the original nutrient biogeochemical cycle [33].
On the other hand, environmental flow is guaranteed only for a small number of world rivers [34]. The Water Framework Directive (WFD) [35] includes a hydromorphological assessment. Achieving the requirement of WFD good status of the water is possible for hydromorphological, biological and chemical elements.
The amount and components of nutrients transported by rivers play an essential role in maintaining the ecosystem of downstream rivers [36]. The river regime is reflected in the ecological health of a river [37] and influences the biodiversity of the river system [38]. Disturbed by barriers of various types, sediment and nutrient transport has severe consequences for downstream ecosystems, including sensitive wetlands and delta systems [39]. According to Harrison et al. [40], much nitrogen removal takes place in reservoirs, and according to Bosch [41], reservoir sediments are effective at trapping phosphorus. Despite these general trends, single dams may temporarily serve as sources of nutrients [42]. Thus, the functioning of dams affects the condition of the habitats of aquatic organisms (e.g., living in a river or a reservoir) and organisms dependent on the water (e.g., living on a floodplain or in oxbow lakes). On the other hand, river flow regulation favors some fish species that spawn during a specific period [43]. This state is widely used by humans, introducing fishing on artificial reservoirs and rivers under their influence.
The seasonal characteristics of streamflow at the global scale were recognized by Dettinger and Diaz [44]. Many studies have used IHA to investigate the impact of commissioned dams or cascades of reservoirs on river regime [14,45,46,47,48,49,50,51,52,53], including the hydrological impact of the dam operation [54,55]. IHA was also used to predict future conditions in the river regime during climate change [56,57] and to detect urbanization impacts [58].
The main aim of this research was to demonstrate the impact of changes in the operating regime of the Lower Brda Cascade dams (LBC) to quantify both the trapping and removal of suspended sediment, dissolved load, and nutrients. Data included (a) daily discharge, concentration, and load of (b) suspended sediment, (c) dissolved load and (d) nutrients (nitrogen and phosphorus), measured at the positions above and below reservoir cascade. The main research objectives related to: (i) the presence of dams changing the regime above and below the dam, conditioned by the dam operating system; (ii) equalization of water outflow from the cascade of reservoirs affecting the dynamics of suspended sediment, dissolved load, and nutrients; (iii) disruptions of the continuum of sediment and nutrient transport below the water stages resulting in increased sediment accumulation in LBC reservoirs and limitation of nutrients responsible for primary production. The IHA method of hydrological data (1984–2017) was used for quantitative analysis of sediment and nutrient concentration, and calculated loads of the analyzed catchments. The conducted research is essential not only from the point of view of the future water management in the cascade of hydropower plants, but also with respect to river regime, sediment and nutrient data for long-term observation of environmental pressures.

2. Materials and Methods
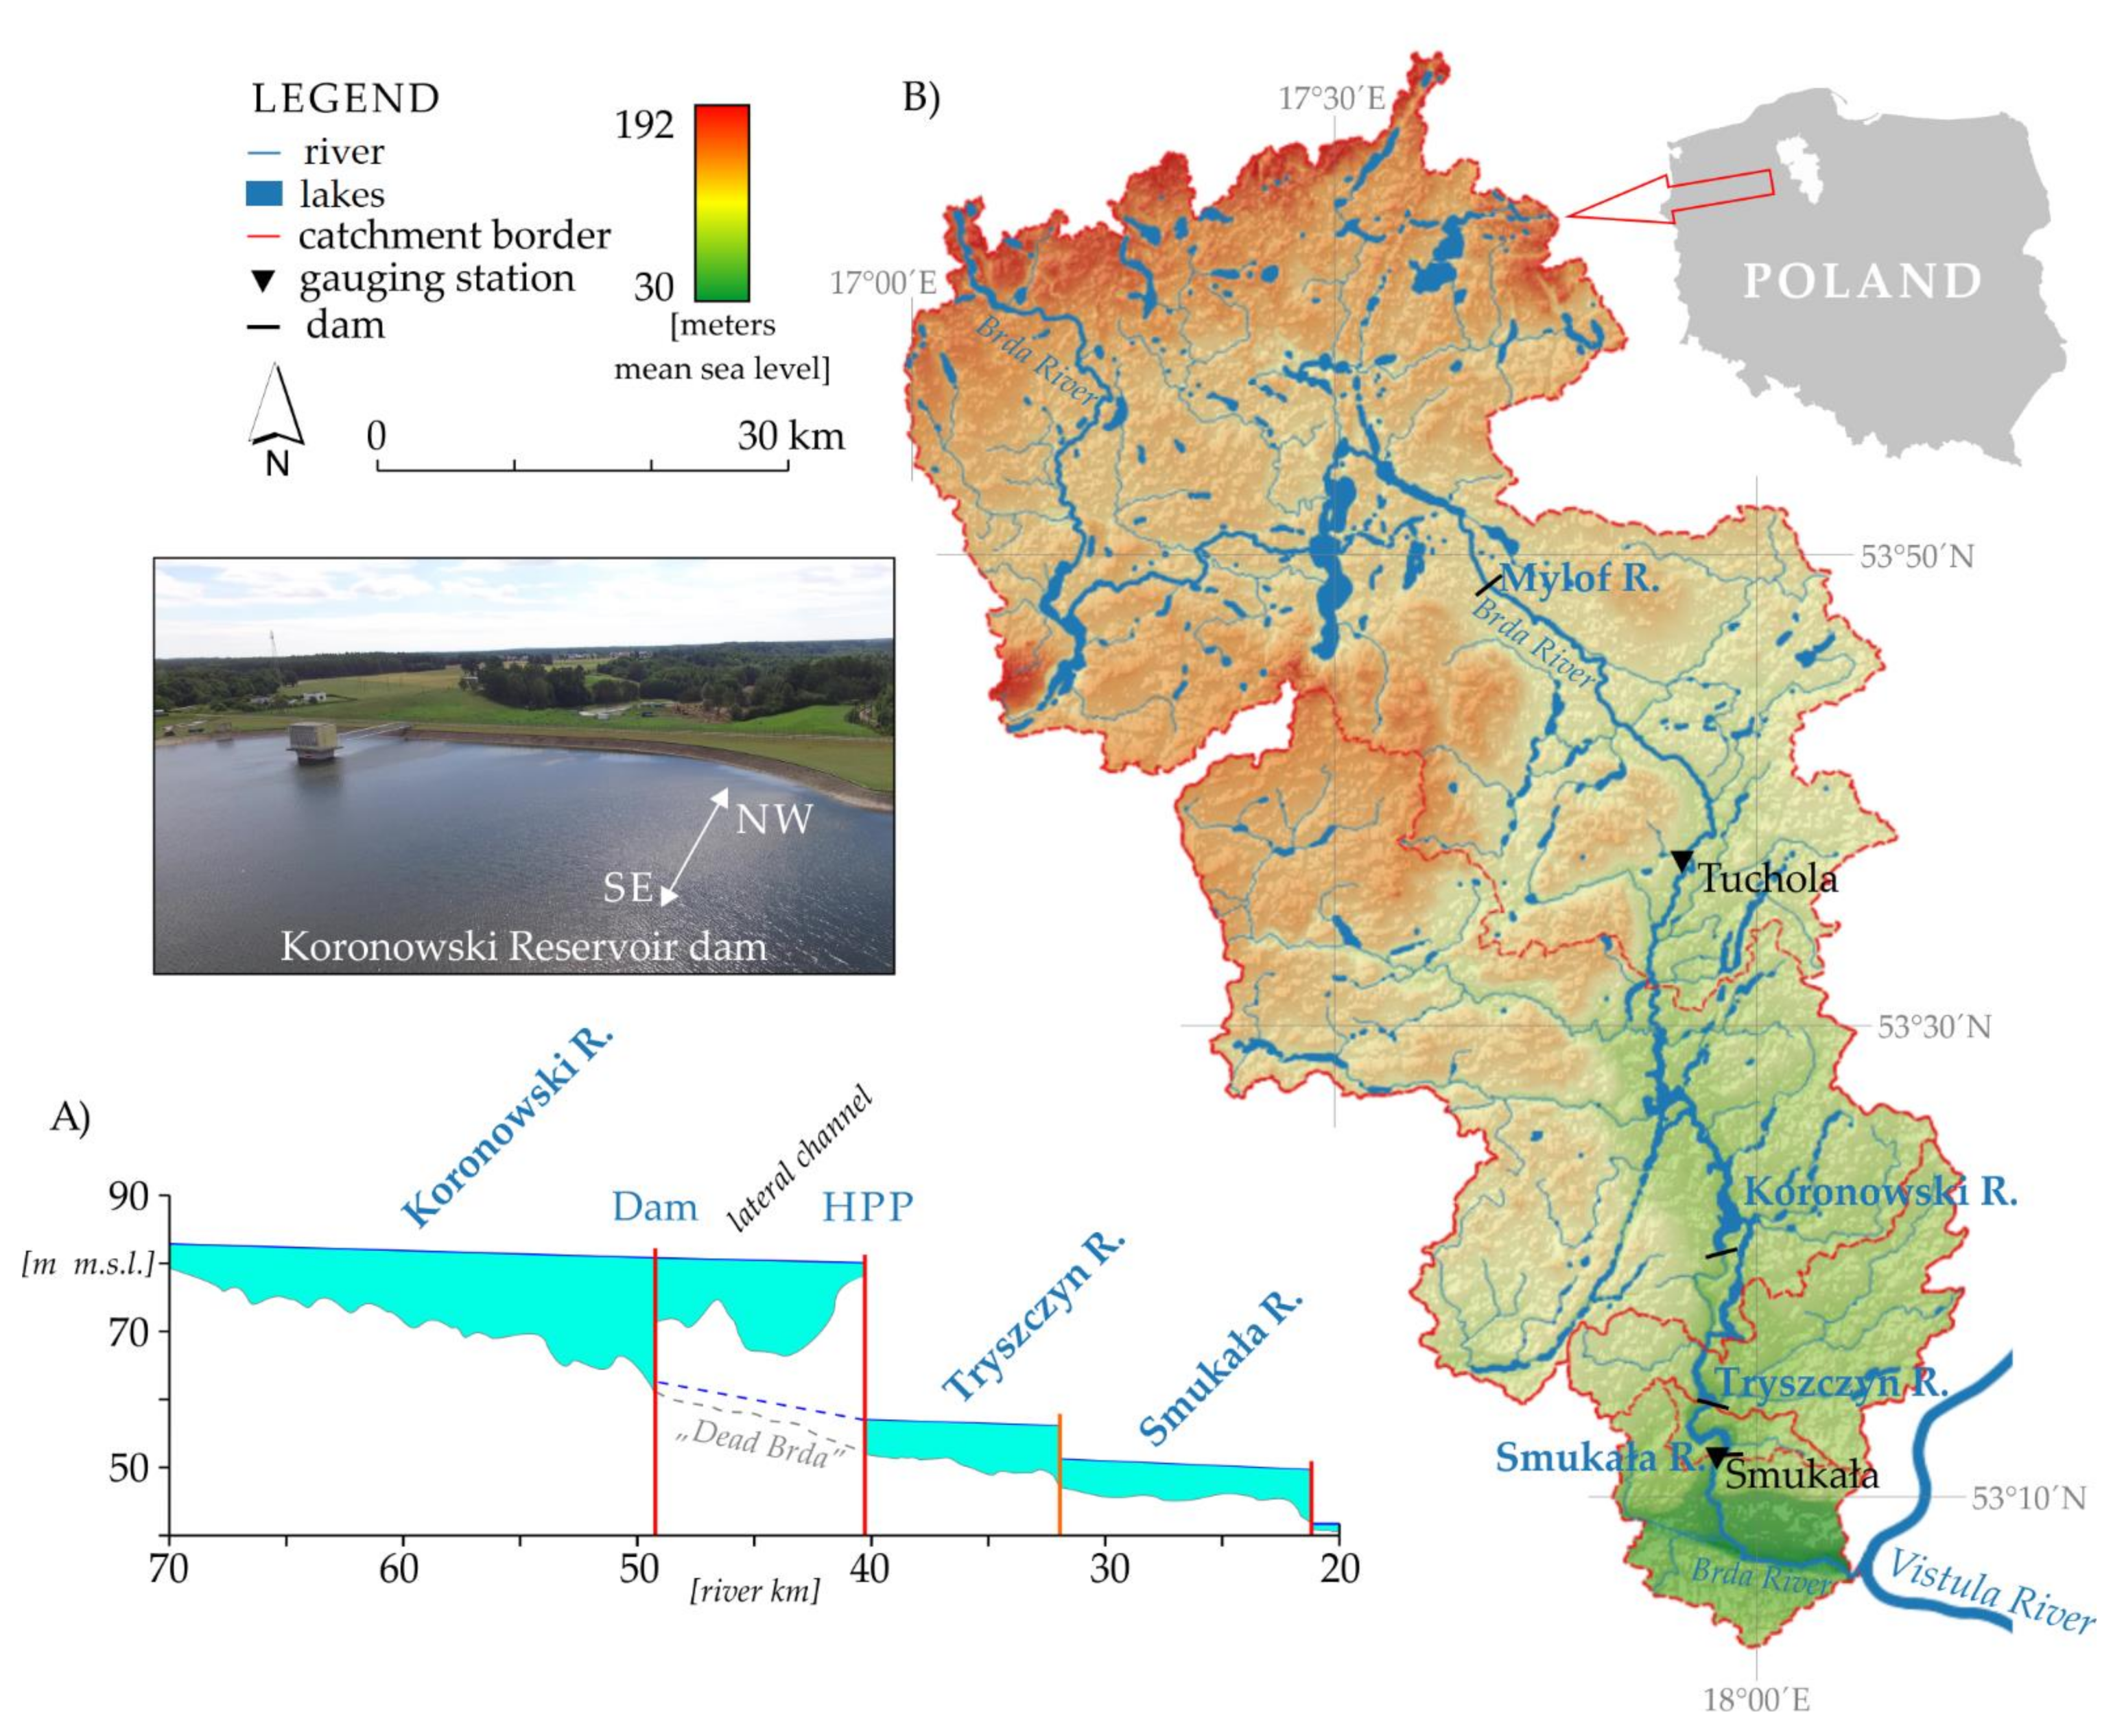
2.1. Study Area

The Brda River is 245 km long and is a left-bank tributary of the Vistula River—the longest river in Poland, forming the largest basin in the Baltic Sea catchment area (Figure 1). The Brda catchment area amounts to 4661 km2 [59]. The equal river regime of the catchment area above the LBC is influenced by the river’s functioning in its river-lake system. The Brda flows through 16. lakes with a capacity from 0.7 million m3 to 134.5 million m3 (the largest is Lake Charzykowskie) [25]. The Brda valley’s geomorphological evolution is related to the accumulation of outwash sands in the younger phases of the Pomeranian stage of the last glaciation [60,61]. The moraine uplands surrounding the Brda River valley are built of postglacial clays separated by different-grained sands. In the study area, several postglacial forms occur, e.g., terminal moraines, kames and subglacial channels [25].
The observation sites for hydrological conditions for the period 1984–2017 were water gauge stations of the Institute of Meteorology and Water Management National Research Institute in Tuchola (85.9 km) and Smukała (20.1 km) (Figure 1). The average annual flow in the first of these is 18.85 m3s−1, and in Smukała, it is 26.19 m3s−1. The Brda River is characterized by the lowest variability of flows among all Polish rivers [62]. The mean annual flow irregularity coefficients (C.V.) for the observation sites are 0.27 and 0.35, respectively. In the annual course, the regularity of high water flows of the Brda River in the winter period (spring snowmelt supply combined with ground supply), and low water flows in the summer period, are noticeable. This course is conditioned by the existence of a significant underground supply, the share of which in the total outflow from the Brda catchment area is estimated at 85% [63]. The functioning of the ecosystems of the Koronowski, Tryszczyn, and Smukała reservoirs is determined primarily by the size and variability of the flows of the Brda River, and less by the direct tributaries: Kamionka, Sępolna, Krówka, Kręgiel, Kotomierzyca (approximately 15% of the total inflow).
The climatic conditions of the study area were characterized for the period 1971–2000. The average annual sum of precipitation for the study area is 550 mm [64], the average annual temperature is 7.5 °C, of which the average annual temperature for the winter is 0.5 °C, and for summer is 14.0 °C [65].
The dominant land cover in the Brda catchment area, defined by Szatten and Habel [66] based on the Corine Land Cover (CLC) database, is forest and intensively used arable land covering 46.9% and 36.6% of the area, respectively. Cover types of arable (9.1%), anthropogenic areas (4.2%) and surface waters (3.2%) occupy a much smaller area. A characteristic feature of the Brda catchment area is a change in the dominant type of land cover with an increase in the catchment area, i.e., a decrease in the forest area and increase of intensively used arable land and the anthropogenic regions [66].
The Brda River is strongly modified by hydrotechnical structures. In 1848, in the upper part of the catchment, the first dam with a reservoir in Mylof (km 138.0) (Figure 1) [67] and weirs in the estuary section of the river were built [68]. In the 1960s and 1970s, a cascade was built in the lower part of the Brda River (LBC) with the Koronowski, Tryszczyn, and Smukała reservoirs. The basic characteristics of the LBC reservoirs are presented in Figure 1 and Table 1.
LBC performs three primary functions: energy production, flood prevention and recreation. The turbines in the hydropower plants allow for a total average annual electricity production of 60.32 GWh. In the case of the Tryszczyn and Smukała reservoirs, the hydropower plants are located on the dam. In the Koronowski Reservoir, the hydropower plant is located about 10 km below the dam, to which the waters are led through a lateral canal running at the bottom of the flooded glacial gutter of the Lipkusz—Białe lakes (Figure 1). This fact affects the functioning of the Brda section between the dam and the hydropower plant of the Koronowski Reservoir, called the “Dead Brda”, due to the limitation of water flow from the average annual flow rate from before the dam was built, at a level of about 21.6 m3s−1, to a resulting level of about 2.0 m3s−1 [69].
The LBC operating regime has changed twice (Figure 2) since its start. During regime I, called the hydropeaking operation from January 1951 (when the first dam was commissioned) to 2000, the powerplant was put into operation only in the highest electricity demand periods. This operation of the cascade of dams caused an impact on the temporary increase in flow and water stage both in the reservoirs and below the hydropower plant (Figure 2). The maximum amplitudes of the flows reached 50 m3 s−1 [70]. These fluctuations were recorded especially on weekdays (Monday–Friday). This intensity decreased during days off (Saturday–Sunday) when reservoir retention dominated over energy production outflow. The highest amplitudes of the water flows occurred during average flows. During this time, water was flushed from the reservoirs twice a day. The hydropower plants worked in the run–of–river operation for the remainder of the day, maintaining the environmental flow at 15 m3 s−1. In this way, the LBC hydropower plants operated for about 70% of days in a year. The second regime implemented in 2001, called run–of–river operation, was characterized by a different system of dam operation [71]. Its introduction was related to the implementation of proecological provisions of the Water Law Act [72]. Under this operating regime, hydropower plants were operated in run–of–river, taking into account the environmental flow of 20 m3 s−1. The operation scheme in this regime consisted of “working up” the water flowing into the LBC through the first hydropower plant at the Koronowski Reservoir dam. Next, the hydropower plant’s turbines on the Tryszczyn dam, and then in Smukała, were put into operation,. This way, water level fluctuations in these reservoirs were eliminated, which, according to the research by Szatten [73], oscillated in the range of up to 0.3 m. For comparison, during the operation of the hydropower plant in the hydropeaking regime (before 2000), water fluctuations in the reservoirs were as high as 0.5 m (Figure 2).

2.2. Input Data

2.2.1. Hydrological Data

Hydrological data was the daily discharge (in m3 s−1), obtained from the public database of the Institute of Meteorology and Water Management National Research Institute in Warsaw (IMWM—NRI) for the years 1984–2017 for the measurement stations located above and below the LBC, i.e., Tuchola (km 85.9) and Smukała (km 20.1). The location of the measurement stations is shown in Figure 1. The hydrological data for IHA analysis were used covering the range from the beginning of observations (the 1980s) at the Tuchola and Smukała sites to 2017. An equal period (16-years) of the operation of the LBC under regime I (1984–2000) and regime II (2001–2017) was specified.

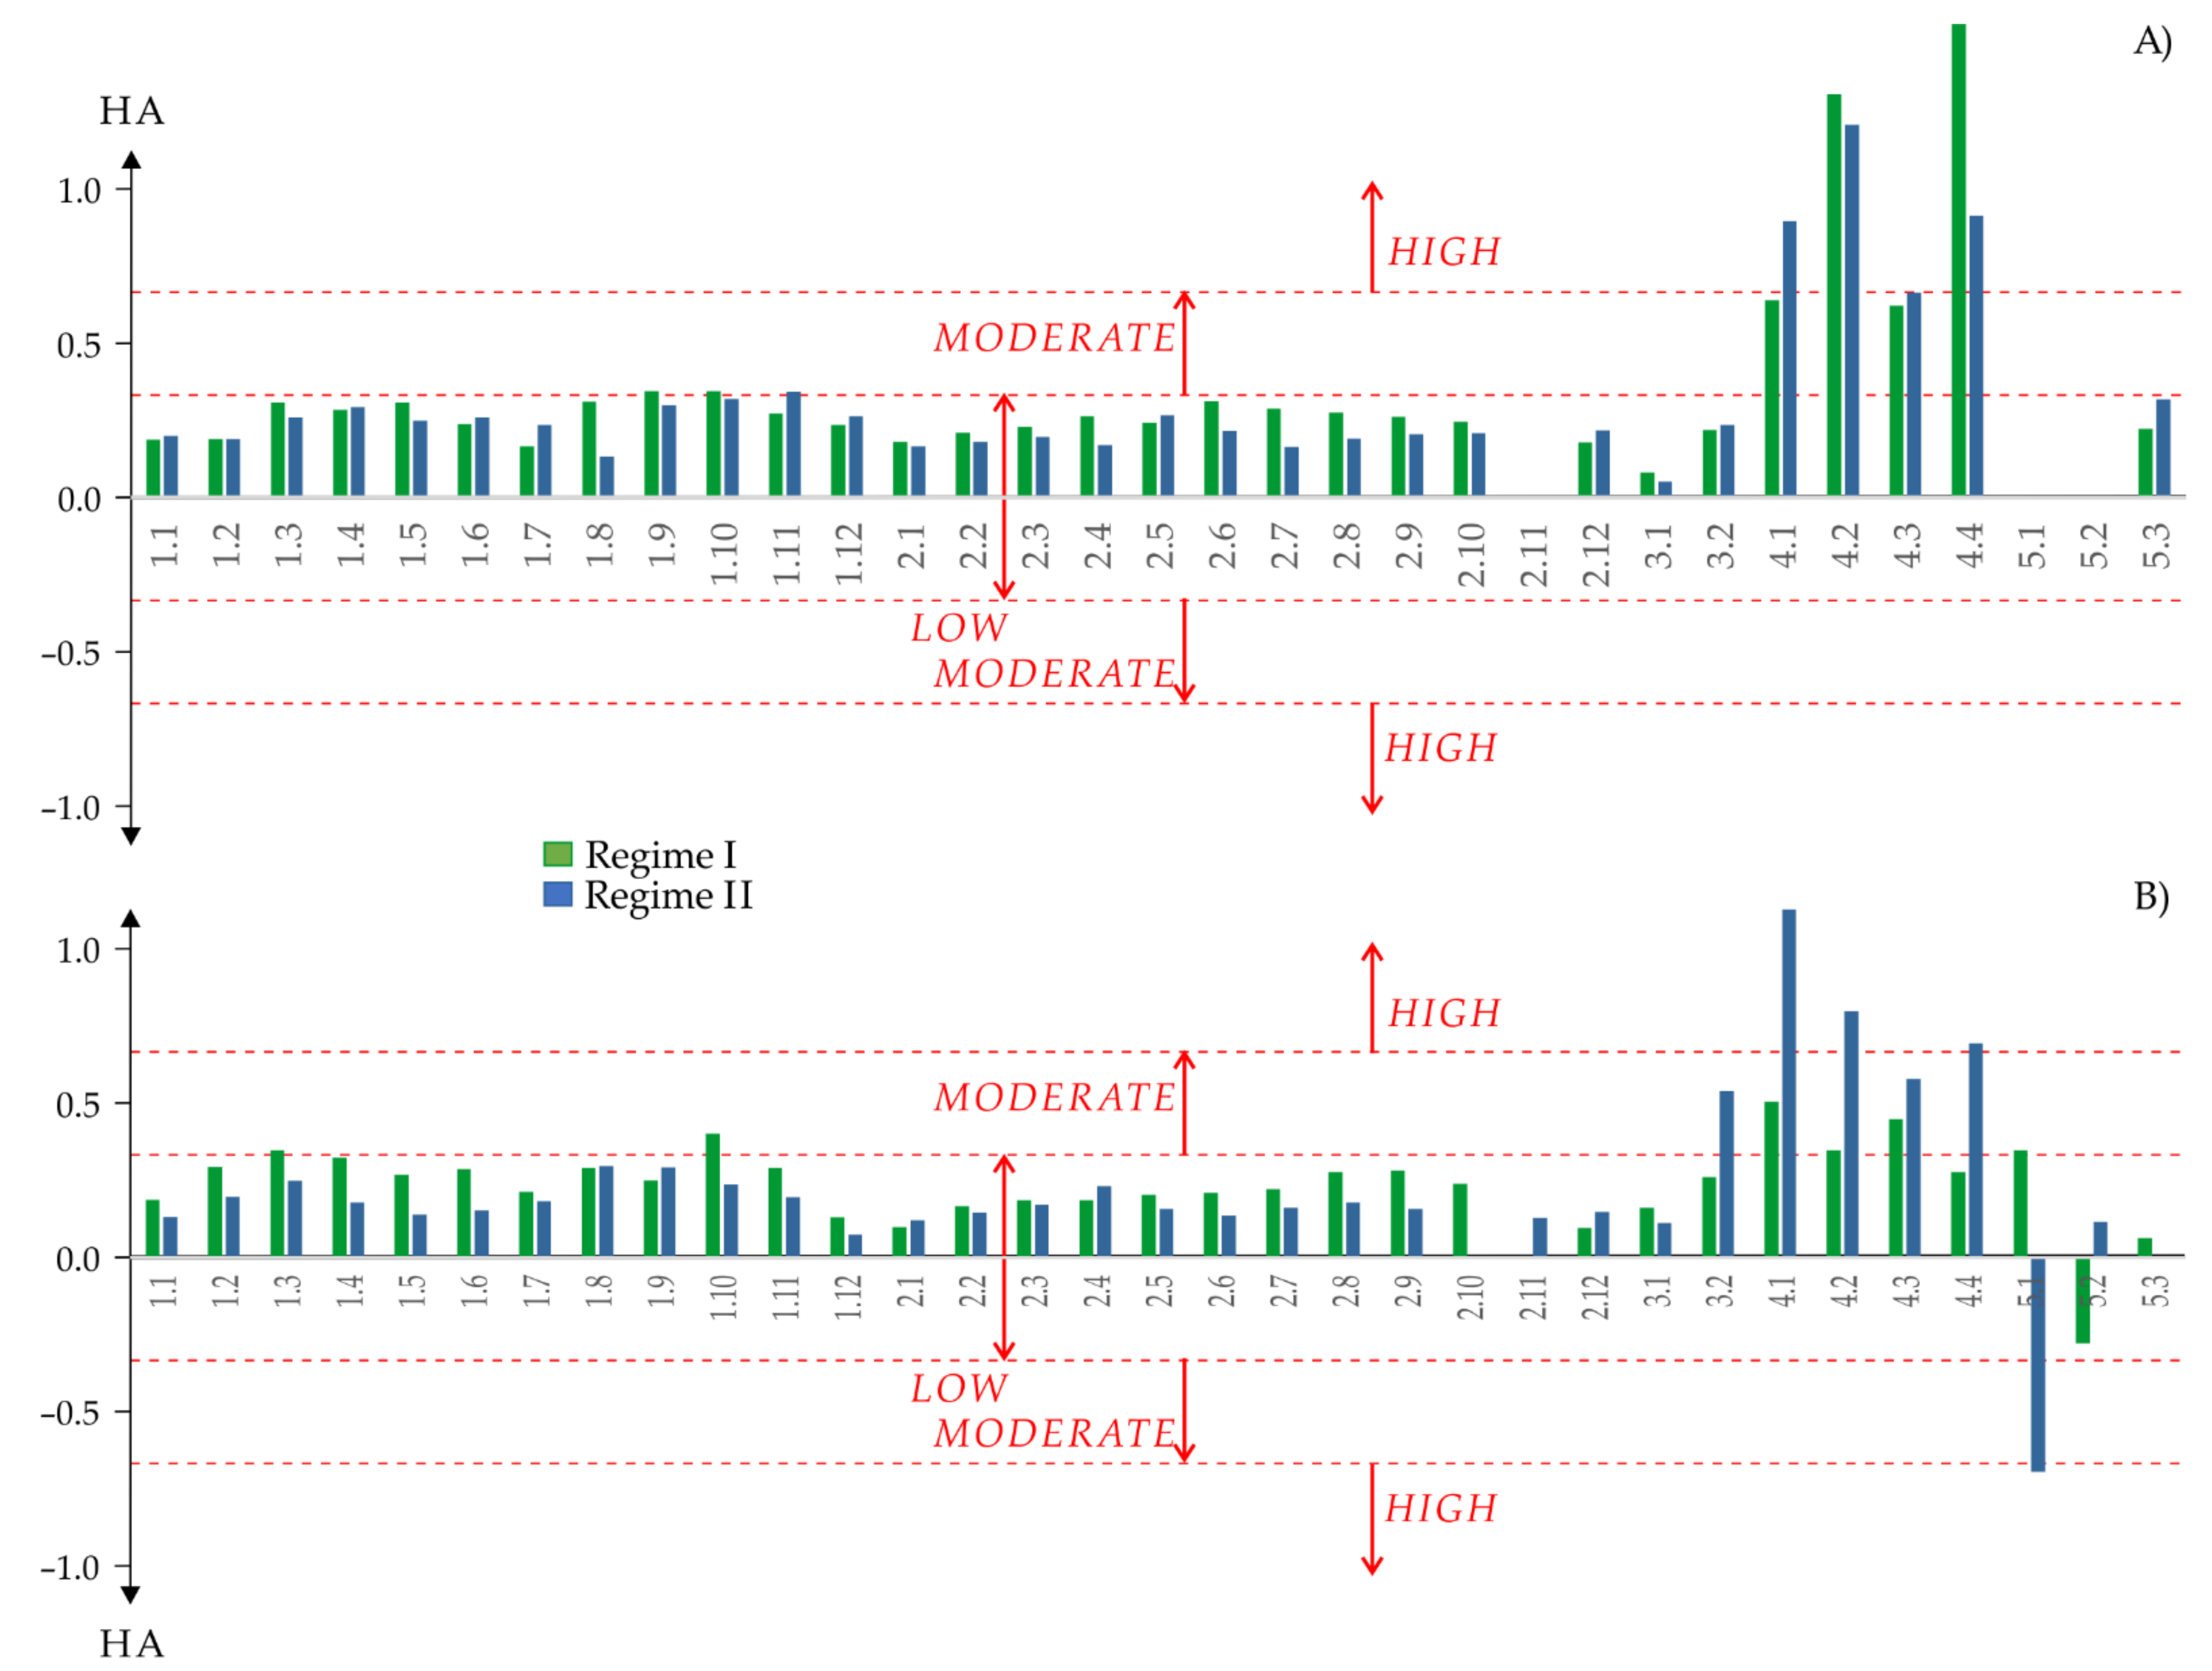
2.2.2. Indicators of Hydrologic Alteration

To determine changes in the hydrological regime resulting from LBC functioning, the Indicators of Hydrologic Alteration (IHA) method proposed by Richter et al. [74] was used. The characteristics of the Brda river flow from hydrological years 1984‒2000 were compared in the gauging station located upstream of the reservoirs in Tuchola with the flow characteristics in the Smukała hydrological stations situated directly downstream of the dam. The assessment of the impact of changing the hydroelectric power plant’s operation method from the hydropeaking regime to the run–of–river system was analyzed on a series of mean daily water flow values from the hydrological years 2001‒2017 in Tuchola and Smukała.
Calculation were conducted with IHA software developed by The Nature Conservancy (Arlington, VA, U.S.) (version 7.1.0) and according to commonly used methodology: (i) defining data series described in Section 2.2.1; (ii) calculating values of hydrologic attributes for the hydropeaking operation data series (1984–2000) and the run–of–river operation data series (2001–2017); (iii) computing interannual statistics; and (iv) calculating values for IHA between two operation data series. The result is a list of 33 hydrologic parameters with their characteristics, in five statistics groups: (1) the magnitude of monthly water conditions, (2) magnitude and duration of annual extreme water conditions, (3) timing of annual extreme water conditions, (4) frequency and duration of high and low pulses and (5) rate and frequency of water condition changes, described in detail by Richter et al. [74].
The Range Variability Approach (RVA) method was used to determine the variability of IHA parameters [75]. For nonparametric data, the RVA breakpoints were set accordingly: low category ≤33rd percentile, <33rd middle category ≤67th, and >67th high category. Hydrologic alternation (HA) for analyzed parameters was calculated using Equation (1). HA is equal to zero when the observed frequency (OF) of post impact annual values falling with the RVA target range equals the expected frequency (EF). A positive deviation indicates that annual parameter values fell inside the RVA target window more often than expected. Negative values indicate that annual values fell within the RVA target window less often than expected [76].
HA = OF EF EF × 100
The transformation coefficient parameter in the range of ǀ0.0–0.33ǀ means no change or a low discharge transformation; the range ǀ0.34–0.67ǀ means a moderate transformation; and the range ǀ0.68–1.0ǀ a large alternation [76].

2.2.3. Suspended Sediment, Dissolved Load and Nutrient Data

The analysis of the transformation of the concentration of river sediment and nutrients was made possible by monthly measurements of suspended sediment concentration (SSC in mg L−1), dissolved load concentration (DLC in mg L−1), total nitrogen (TN in mgN L−1), and total phosphorus (TP in mgP L−1) at the sites of Tuchola and Smukała (Figure 1) in the period 1991–2012. The measurements were carried out as part of the State Environmental Monitoring Program (SEM). The data analysis period used for qualitative analyzes differed from the hydrological data period due to the change in the SEM. After considering WFD in Poland, the number of measurement stations and the frequency of sampling was limited. In research, a shorter, uniform data quality period was used. The suspended sediment concentration was determined following the standard in [77] using the traditional filtration method, filters with a porosity of 0.45 µm and a drying procedure. Sampling was done with a slowly filling bathometer according to commonly used methods [78]. Determination of the dissolved load concentration was carried out by the weight method, according to the procedure described by Hermanowicz et al. [79]. The concentration of nutrients was determined using generally used methods, including chemiluminescent detection for total nitrogen [80] and a spectrometry method for total phosphorus [81]. Using the Redfield relationship [82], the dominant nutrient primary production source was determined.
Balance (β) of suspended sediment load (SSL), dissolved load (DL), and nutrient loads (TNL, TPL) were calculated according to Equation (2) as material delivered to (D, in tons) and flushed off (F, in tons) the cascade reservoirs [83]:
β = D F .

3. Results

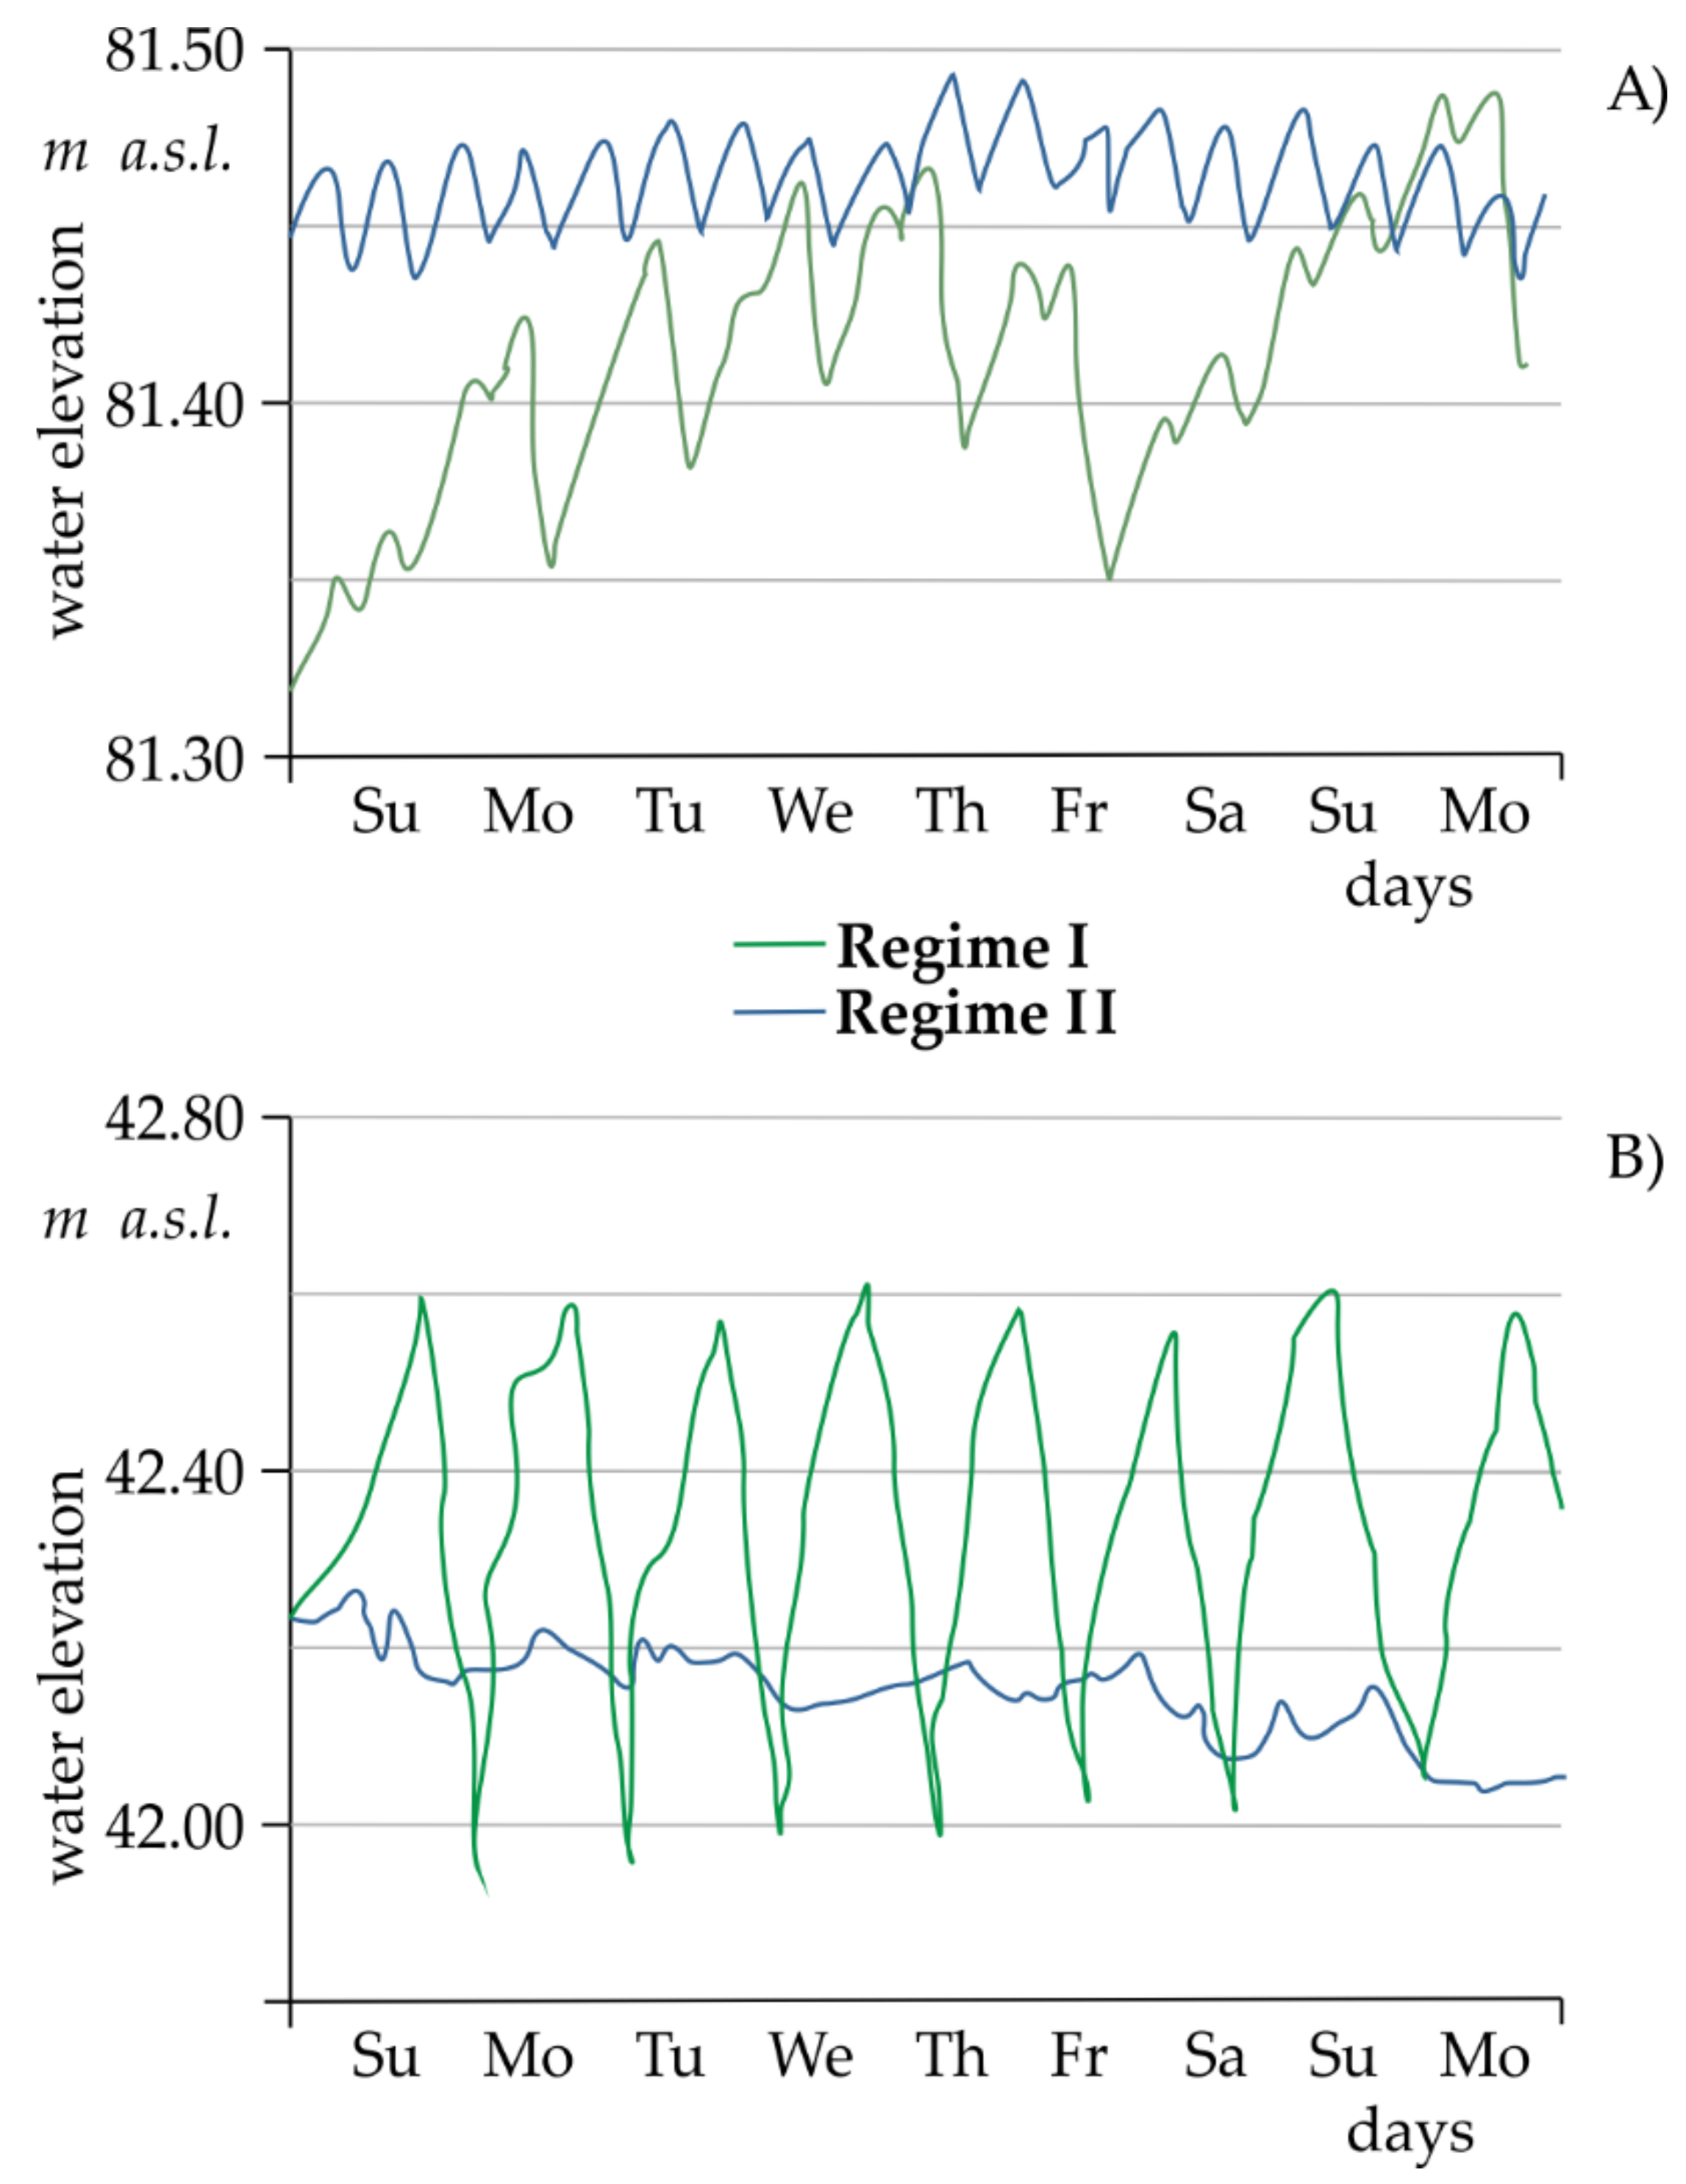
3.1. Impact of LBC Regime Change on the Hydrologic Alternation

The IHA model results indicate that the mean annual flow in Tuchola increased from 18.57 m3 s−1 (1984–2000) to 19.14 m3 s−1 (2001–2017). At the Smukała site for the same periods, the mean annual flows decreased from 26.46 m3 s−1 to 25.93 m3 s−1, respectively. Annual C.V. for the above gauge stations was 0.25 and 0.29 (Tuchola) and 0.38 and 0.31 (Smukała), respectively. The calculated flood-free season had higher values for the Tuchola water gauge station (47 days for the period 1984–2000 and 30 days for the period 2001–2017) than for the Smukała site, where the number of days was 5 and 23, respectively.
Hydrologic alternation (HA) for indicators from the first group for Tuchola, assume values indicating low discharge transformation in most of the months. They oscillated in the range from 0.188 (November) to 0.313 (June) (Figure 3). Only for the months of July–August, HA values indicated moderate transformation. The situation was different for Smukała, where for the period up to 2000, the transformation of the flow reached moderate values in almost all months. On the other hand, for the period after 2001, for most of the year (except for summer months), the flow transformation was classified as low.
The HA parameters from the second group mostly assume a range of low regime transformation for both sites (Figure 3). The Base Flow Index (BFI) had relatively low values (0.56–0.61); however, there was a noticeable decrease in BFI values on the Smukała site for the second analyzed period (Table 2). There were no zero-flow days in the period 1984–2017. For the Tuchola station, the values of minimum flows (Table 2) in the first analyzed period fluctuated in the range from 11.00 m3 s−1 (1-day) to 13.92 m3 s−1 (90-days). In the second period, they slightly increased and assumed values ranging from 12.00 m3 s−1 (1-day) to 14.46 m3 s−1 (90-day). The same upward trend was characteristic for maximum flows (Table 2). On the other hand, for the Smukała position, for the first analyzed period, the minimum flows: 1-day, 3-day, and 7-day were higher than the second analyzed period. One-day and three-day maximum flows followed the same trend. Long-term flow parameters (30-day, 90-day minimum, and 90-day maximum) assumed higher values for the second research period (Table 2).
In the case of HA parameters belonging to the third group, the acceleration of the date of minimum and date of maximum discharges was noticeable. For the Tuchola station, the occurrence of minimum and maximum flows in the second period was accelerated by about 25 days, indicating the end of April and the end of November, respectively. The same tendency between the analyzed periods was characteristic of the Smukała station. However, the date of minimum discharge acceleration was 19 days (beginning of May), while the date of maximum discharge was 47 days (end of December) (Table 2).
The fourth group’s parameters were characterized by the highest values of the transformation of flows from all analyzed indicators (Figure 3). In the case of the first analyzed period, for the Tuchola site, the number of low and high pulses were determined at seven and eight in the hydrological year, respectively. At the position below the LBC, their numbers significantly increased, amounting to 33 and 24. In the second studied period, the difference between the number and duration of low and high pulses was much lower (Table 2). However, the classification of HA parameters still indicated a significant transformation of the river regime (Figure 3).
The last fifth group of the parameters was characterized by internal differentiation, indicating a low transformation of the regime for the position of Tuchola and a high transformation for the position of Smukała (Figure 3). For the first of them, the annual discharge number of reversals was 69 for both analyzed periods, indicating an aligned rise and fall rate of discharges. On the other hand, for the site in Smukała, this parameter for the two tested periods had values of 166 and 129, respectively, with less equal values of rising and falling flow rates (Table 2).

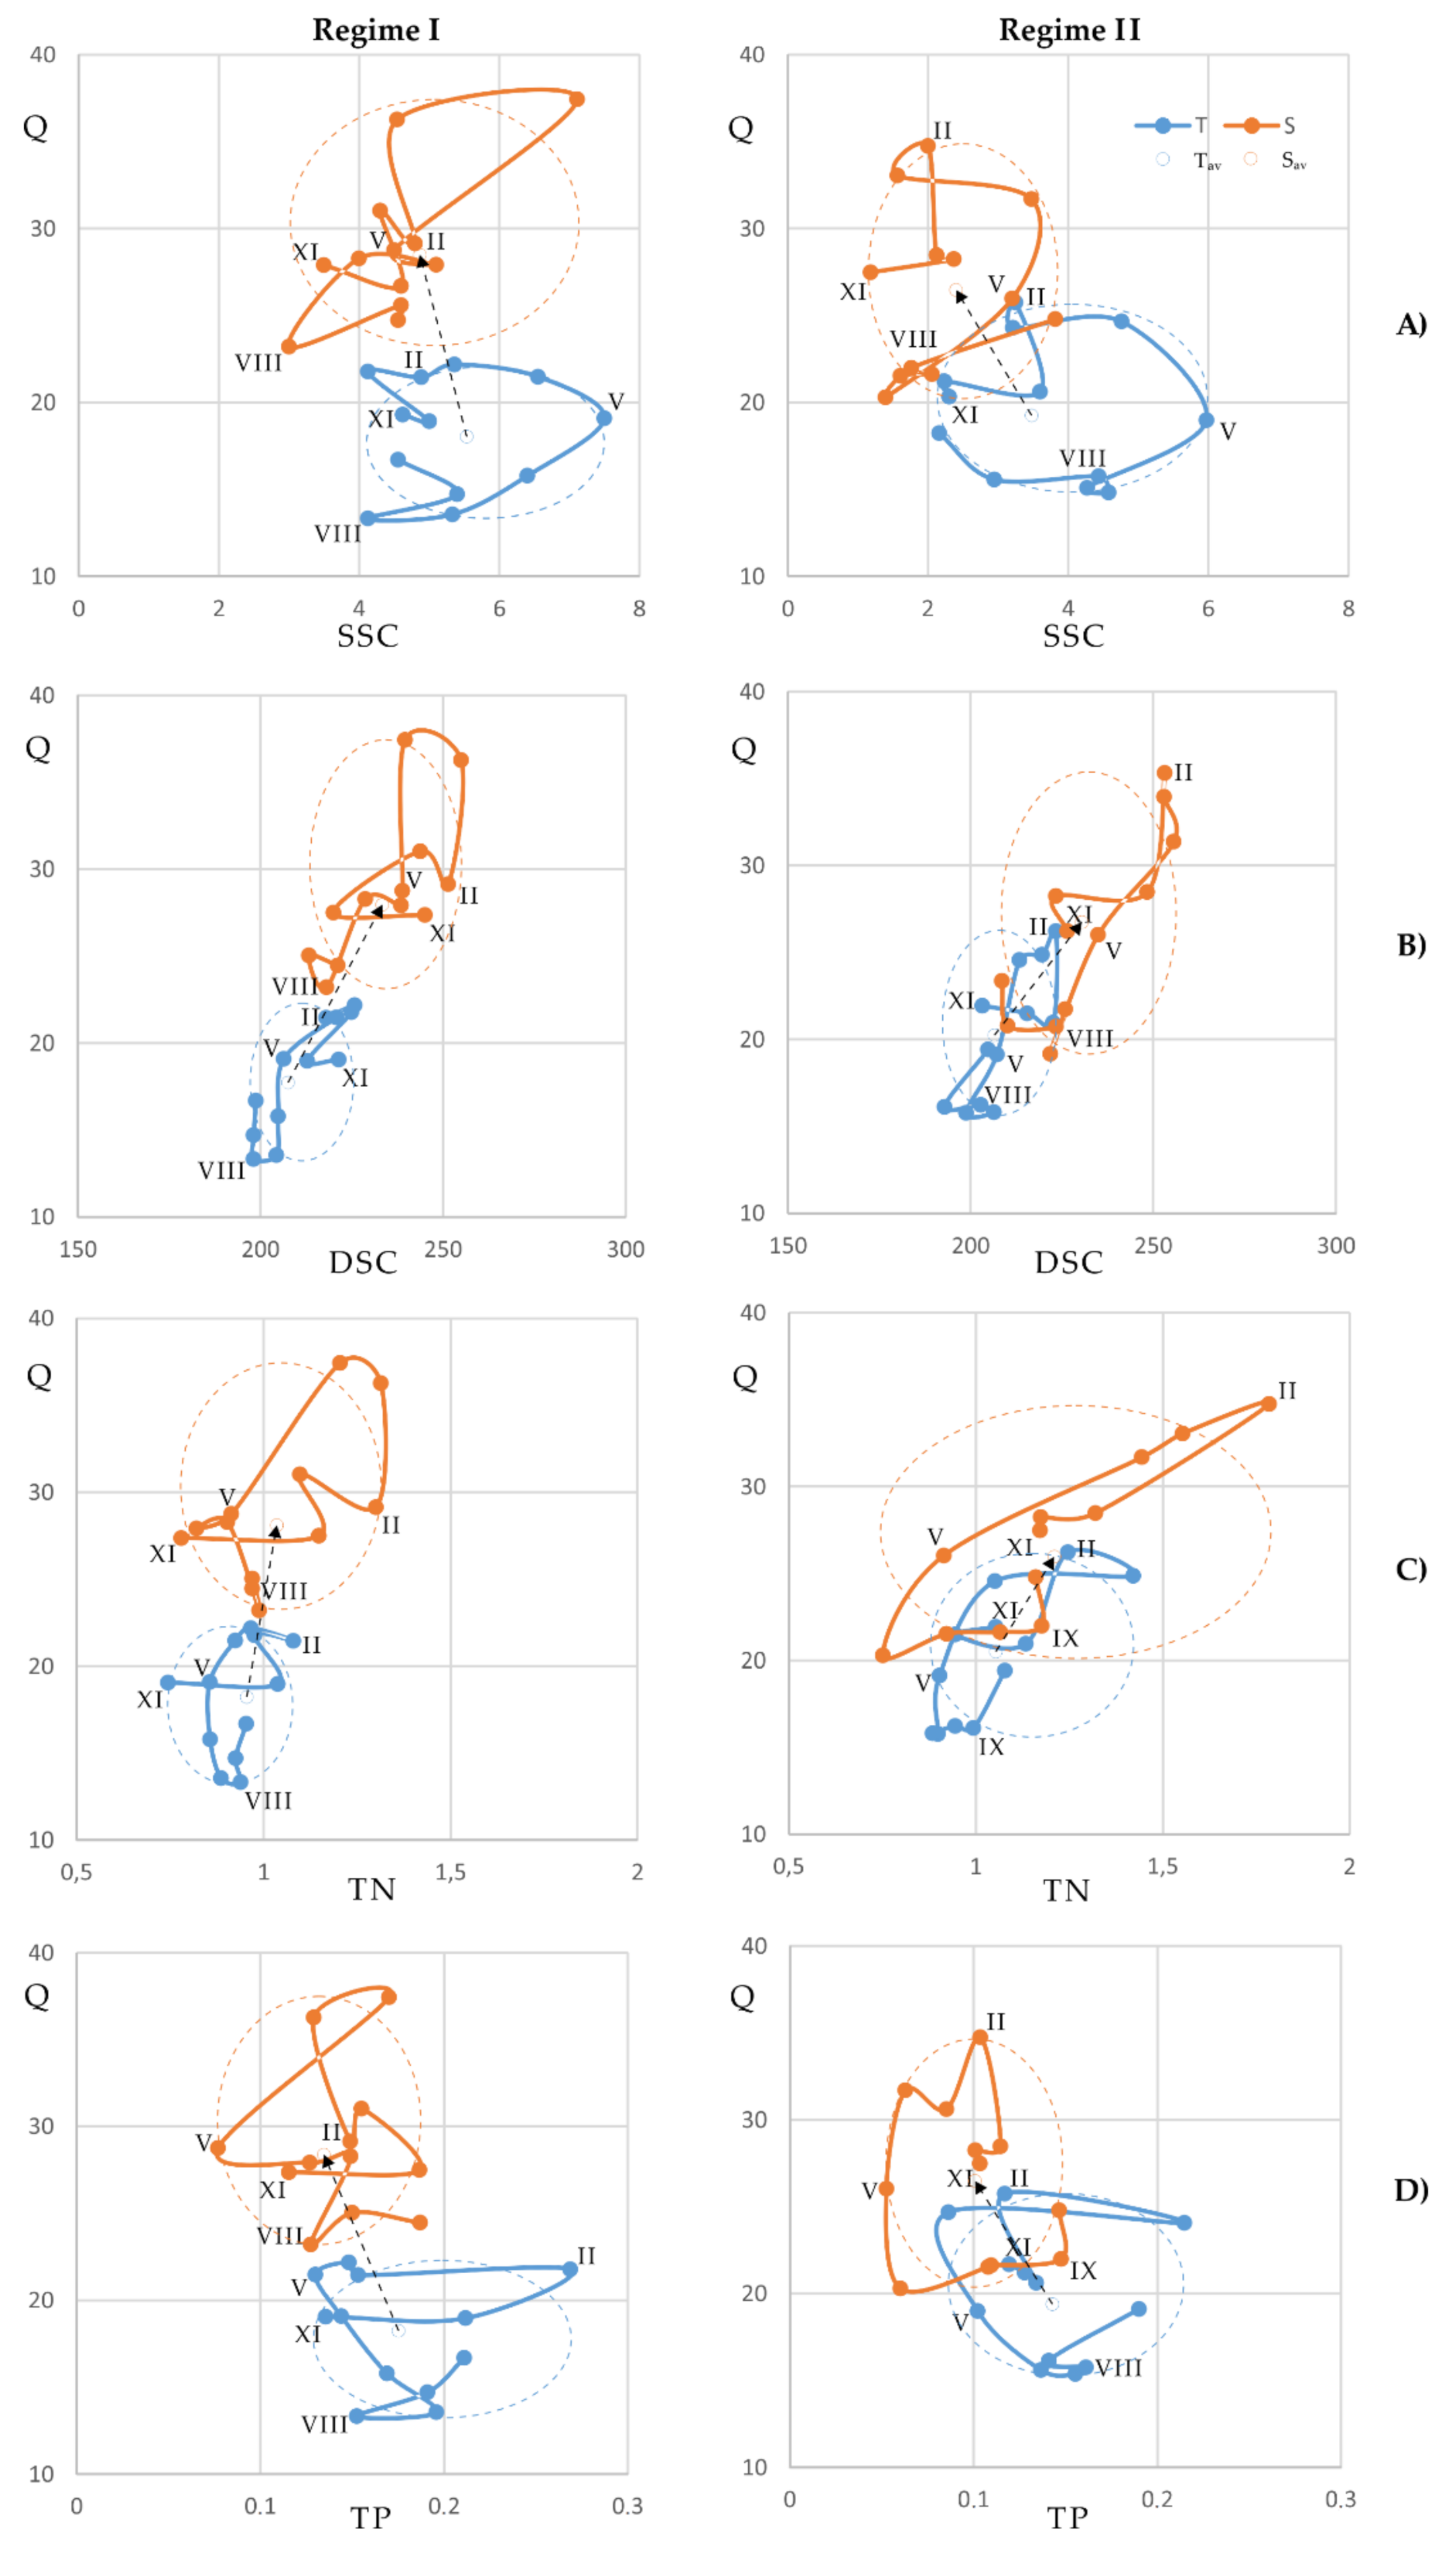
3.2. Link between Sediment, Dissolved Load, Nutrient Transport and Flow Regime on LBC

One of the simplest analyses of the influence of damming structures on the trapping of suspended sediment is the comparison of inflow and outflow loads. In our work, we additionally analyzed the impact of two different regimes of hydropower operation on the regulation of sediment and nutrient transport downstream. The average value of suspended sediment concentration (SSC) for the period 1991–2000 (regime I), compared to Tuchola 5.39 mg L−1 and Smukała 4.56 mg L−1, showed a reduction of 15.4%. In the second period (2001–2012), when the cascade was run–of–river (regime II) and the average concentration of suspended sediments in Tuchola was 3.66 mg L−1 and 2.21 mg L−1 in Smukała, we observed a reduction of SSC caused by LBC of about 39.6%. Comparing the average DSC value for the period 1991–2000 (regime I), the value in Tuchola was 210.62 mg L−1, and in Smukała was 208.55 mg L−1, which is only about 1% reduction in the concentration of dissolved load in the water. In the second period (2001–2012), when the cascade operated in run–of–river (regime II), the average DSC value in Tuchola was 234.99 mg L−1, and that in Smukała 232.07 mg L−1. We observed a slightly higher concentration reduction caused by LBC of about 1.25%. From the comparison of the averaged TN value for the period 1991–2000 (regime I), the value in Tuchola was 0.92 mgN L−1, and in Smukała 1.03 mgN L−1, i.e., a nitrogen enrichment by about 12%. In the second period (2001–2012), when the cascade operated in run–of–river (regime II) and the average TN value in Tuchola was 1.03 mgN L−1, and in Smukała 1.20 mgN L−1, we observed even more significant nitrogen enrichment of waters than in the previous period, i.e., a concentration reduction caused by LBC of about 16.5%. For the second analyzed nutrient, i.e., TP for the period 1991–2000 (regime I), the value in Tuchola was 0.17 mgP L−1, and that in Smukała 0.14 mgP L−1, which reduced phosphorus by about 18%. In the second period (2001–2012), when the cascade operated in run–of–river (regime II) and the average TN value in Tuchola was 0.14 mgP L−1, and in Smukała 0.10 mgP L−1, we observed an even more evident reduction of phosphorus in the water than in the previous period, the concentration reduction caused by LBC being about 28.5%. It should be mentioned that the general tendency to reduce SSC, DSC, and TP in the Brda waters passing through the cascade reservoirs in both regimes (I and II) could have been even more remarkable because the main reservoir is supplied by water directly from the catchment area of several small tributaries, i.e., Kamionka, Sępolna and Krówka. The inverse relationship should be taken into account in the case of enrichment of Brda waters in TN.
Another relationship that distinguishes the LBC river regimes was noted in the case of the occurrence of maximum SSC values in individual years at the site in Smukała (Figure 4). In the case of the cascade operation in regime I, slightly higher SSC maxima were achieved (average of the annual maximum was 9.3 mg L−1), compared to the run–of–river operation (regime II) (average of the annual maximum was 7.78 mg L−1). This relationship is analogous for the DSC indicator, i.e., in regime I, a DSC of 280.6 mg L−1, and in regime II a DSC of 277 mg L−1. In the case of nutrients, the change of the hydropeaking to run–of–river regime created better conditions for enriching the waters with nitrogen. In the periods of its maximum concentration, more favorable conditions for increasing nitrogen in the waters occurred, i.e., in regime I a TN 1.68 mgN L−1; in regime II a TN 2.04 mgN L−1. Additionally, if we compared the mean maximum TN concentrations at the station above the cascade with those below the cascade, it follows that during the period of regime II operation, the increase in mean values calculated from the maximum TN concentrations was higher by 4%. In the case of phosphorus, with the transition from regime I to regime II, the conditions for its reduction slightly improved in that TP decreased from 0.24 mgP L−1 to 0.21 mgP L−1.
To demonstrate the change in the LBC’s operating regime of regulating the suspended sediment concentration (SSC), dissolved load concentration (DLC), total nitrogen (TN) and total phosphorus (TP), the results of the indicators mentioned above in the form of monthly values in the years 1991–2000 (regime I) and 2001–2012 (regime II) were compared to the value of water flows (Figure 4). Concerning the SSC, a trend line change after the transition from hydropeaking to the run–of–river regime appeared to be evident from all four analyzed indicators on the site in Smukała (Figure 4A); a decrease in the suspended sediment concentration was observed as the flow rate increases for the run–of–river regime. The opposite trend occurred when the dams operated in a hydropeaking regime. For comparison, at the site located above the LBC, beyond the range of the reservoirs’ impact, an increase in flows was recorded, and a decrease in the suspended sediment concentration was recorded, both in the first and the second period. In the case of DSC, during both regime I and regime II, a similar relation with the water flow was observed, i.e., with the increase of the flow rate, the dissolved load concentration increased (Figure 4B). The course of TN concentrations indicated that in both observed sites there was an increase in the average concentration of the indicator between the analyzed periods. In the case of TN, both during the operation of regime I and regime II, a similar relation to water flow was observed, i.e., with the increase of the flow rate, there was an increase in total nitrogen concentration in the Brda river waters (Figure 4C). In the relation of TP to flows, we observed an opposite relationship to that in the case of TN, and this decrease was even more pronounced during the operation of regime II (Figure 4D).
The change in the LBC operating regime to regulate the transport of SSC, DSC, TN, and TP were determined, as well as the periods of the occurrence of the extreme monthly mean values of the indicators mentioned above on the base of average flow rates for stations above and below the reservoir cascade. The results showed eight pattern loops (Figure 5).
The SSC loop at the Tuchola site for the first analyzed period 1991–2000 (regime I) shows that the spring’s culmination of flows preceded the maximum suspended sediment concentration in the waters. Then, as the water flow decreased, the SSC decreased too (June–August). The loop for the second analyzed period 2001–2012 (regime II) takes a similar course. However, in this case, the summer ahead of maximum suspended sediment concentration was even earlier and occurred in July (Figure 5A). In the case of the Smukała station, for both regimes I and II, the SSC loop follows a similar course for the spring months. However, the difference in the course of the loop was noticeable in the case of summer and autumn months because for regime I, there were periods of maximum SSC ahead of the flow peak for the months June and September. In contrast, for regime II they were characteristic for the later months, i.e., August, October (Figure 5A).
The Tuchola station loop for the indicator reflecting the DSC for regime I (1991–2000) shows that the spring period of maximum flows preceded the maximum concentrations of DSC. Then, as the flow decreased, the dissolved loads’ concentration decreased, which occurred from July to August. In the case of the second analyzed operating regime of the hydropower plant, the spring period was similar. At the same time, in July, the maximum DSC concentration was observed with the peak of the flow intensity. For the Smukała station in regime I (1992–2000), a different course of the loop was observed compared to the Tuchola station. For both the spring and summer flow culmination, they were exceeded by the maximum DSC concentrations. In the case of regime II (2001–2012), the course of the loop also has a different course compared to the Tuchola station because the flow rate ahead of the maximum DSC concentrations was observed both in spring and summer (Figure 5B).
In the case of nutrients, the loop at the Tuchola site assumes a similar course (Figure 5C,D). For regime I (1991–2000), in the spring period, the maximum concentration of total nitrogen (February) and total phosphorus (January) was ahead of the flow rate (March). A similar situation was observed in summer and autumn (Figure 5C). For the second analyzed regime (2001–2012), there was an opposite tendency during spring. The maximum flow rate (February) was ahead of the maximum concentration of nutrients in the river water (March). However, in summer and autumn, the maximum concentration of total nitrogen (September) and total phosphorus (August) occurred ahead of the peak flow rate. At the Smukała station, located below the cascade, a different course of the loop is observed than at the station above the reservoirs’ cascade. During spring floods, for both analyzed operating regimes of hydropower plants (1991–2000 and 2001–2012), the concentration of total nitrogen in the river water (February) was ahead of the culmination of the flow rate (April), while for total phosphorus the opposite tendency was observed (Figure 5D). In summer and autumn, for total nitrogen in the first analyzed period, the culmination of the flow rate in the river was ahead of the concentration of the indicator mentioned above, while the course was reversed for the second period (Figure 5C). The advance of the maximum total phosphorus concentrations in the Brda waters before the maximum flow rate was also characteristic for both analyzed periods in the case of the Smukała site (Figure 5D).
All three reservoirs, Koronowski, Tryszczyn and Smukała, operating in the cascade system, affect the continuity of sediment transport and the distribution of nutrients along the Brda River. The course of the β coefficient for LBC, concerning the two, analyzed operating regimes of dams in the years 1991–2012, showed differences in the balance of suspended sediment load (βSSL), dissolved load (βDSL) and nutrient load (βTNL and βTPL).
In the first analyzed period, when the cascade was operating in the hydropeaking regime, in the case of the βSSL coefficient, the removal of the suspended sediment from the LBC reservoirs was dominant. The annual mean value for the period 1991–2000 was −44.0%, ranging from −0.3% (1995) to −113.0% (1991). In the second analyzed period (2001–2012), the annual mean value of βSSL was 18.2%, demonstrating SSL accumulation in LBC reservoirs in almost all years (Figure 6A). In the case of βDSL, removing the dissolved load out of the cascade dominated in both periods, but with less intensity in the second, run–of–river regime (Figure 6B). The annual mean value for the period 1991–2000 (regime I) was −85.2%, while for the period 2001–2012 (regime II), it was −40.2%. The first of the analyzed nutrients, total nitrogen, was also characterized by the dominance of removal from the LBC reservoirs (Figure 6C). The annual mean value of βTNL for the first period was −88.5%, while for the second period was −70.9%. The balance for total phosphorus also showed the dominance of the removal process in the first analyzed period (βTPL −32.5%). However, in the second period, there were times of accumulation (mean value of βTNL −1.9%) (Figure 6D). For all the analyzed indicators, there was a clear trend of changing the nature of the balance from the removal/transit of sediment and nutrients towards the accumulation/retention of matter in LBC reservoirs.

4. Discussion

Artificial regulation of sediment and nutrient transport is closely related to the hydrological situation, determining the energy carrier for the circulation of matter. Mean annual flow at the station in Tuchola, located beyond the range of influence of LBC reservoirs, indicated a slight increase in water outflow between the two analyzed periods, which may be associated with anthropogenic transformations of the catchment area. It may have resulted indirectly from changes in the structure of the catchment coverage, as found in the research by Szatten and Habel [66]. It was also confirmed by the increase in the value of C.V. in both analyzed periods. On the other hand, a slight decrease in mean annual flow in Smukała indicated the retention role of reservoirs in the lower part of the Brda, in a reduction of C.V value. Similar results were presented in research by Wang et al. [84], demonstrating significant flow alteration since the start of operation of the Three Gorges Dam on the Yangtze River. The changes may also indirectly result from increased evaporation caused by increased air temperature in recent decades. A study by Döll and Zhang [85] showed that in the second part of the 21st century, climate change effects on river regimes would outrank reservoirs. The calculated values of the flood-free season, especially for the Smukała station, indicated the role of reservoirs in equalizing the river outflow after changing the operating regime to run–of–river.
Low HA values for the Tuchola station for the first group of indicators demonstrated a natural course of the hydrological regime in the upper part of the Brda catchment area. Moderate discharge transformation for summer months showed the impact of flood episodes (Figure 3). In the case of the Smukała station, for the period up to 2000, a moderate discharge transformation was observed. This variation was the result of the hydropeaking operation of the cascade. The change of the operating regime to the run–of–river (since 2001) reduced the HA value for the second analyzed period (Figure 3). The average class of flow transformation below the water stages was recorded only for the summer months, which was related to the occurrence of rainfall and faster channel reaction time of the Brda system to changes in water flow.
The share of groundwater in the total runoff in the Brda catchment area is significant, as was shown in the studies by Jutrowska [63]. This fact is also indicated by the values of the Base Flow Index (BFI) (Table 2), illustrating the contribution of groundwater to river flow [86] and the lack of days with no water flow in the entire analyzed period. The decrease in the BFI value for Smukała in the studied periods from the level of 0.61 to 0.56 (Table 2) indicated a reduction in the impact of ground supply due to equalization of the water outflow below the cascade (run–of–river regime). The influence of the geological structure of the catchment area and the changes in the dominant land cover in the lower part of the catchment (from agricultural and forest areas to urban areas) were noticeable here [66,87], which affected the dynamics of the Brda River regime.
For the Tuchola station, an increase in the flow was observed between the analyzed periods, both for the minimum and maximum flows. It was related to the intensification of water outflow from the catchment area. The decrease in the minimum short-term flows (1-day–7-days) and maximum short-term flows (1-day–3-days) (Table 2) observed on the Smukała station indicated the equalization of water flow caused by the operation of hydropower plants. This fact was confirmed by the simultaneous increase in the minimum and maximum long-term (90-day) river flows (Table 2). Similar results were presented in studies by Magilligan and Nislow [45], Wang et al. [88], Pyron and Neumann [89], and Zhang et al. [90]. The overall reduction of peak minimum and maximum values were the most commonly defined effect of the dams functioning. This also resulted in a reduction of the nutrient exchange volume between rivers and floodplains. Besides, it is worth noting that the higher class of flow transformation for the Smukała site (indicators 7-days maximum–90-days maximum) (Figure 3) in the first analyzed period may determine the increased impact on the structuring of channel morphology below the cascade. It may result in the intensification of the erosion process below the water stages [53], described by Kondolf [24] as the phenomenon known as “hungry water”.
Acceleration of the date of minimum discharge (Table 2) indicated a deepening water deficit problem (drought phenomenon), resulting in earlier occurrence of minimum flows. Acceleration was also observed in research by Lin et al. [48]. The acceleration of extreme water condition occurrence time also affects organisms’ life cycles or spawning cues for migratory fish. It can influence the connectivity between the floodplain and the river channel, affecting especially fish that lay eggs in the river floodplain or oxbow lake [84]. The impact of the LBC reservoirs’ presence was illustrated by the difference between dates of minimum and maximum discharge for two analyzed water gauges (Table 2). For the first analyzed period, for the minimum flows, it was nine days, indicating that the hydropower plant operated without changing the river regime even in the case of low water levels. For the maximum flows, the difference was 43 days, indicating the retention of the supply water flowing into the cascade in the case of high water flows. In the second analyzed period, these differences amounted to 16 and 19 days, respectively. This indicates longer water retention in the case of minimum flows and faster water outflow for the maximum flows, which can be associated with increased energy production in periods of high water levels on the Brda River.
The high value of HA for the fourth group’s parameters indicates an extensive transformation of the hydrological regime due to the cascade of the lower Brda reservoirs (Figure 3). The parameters from this group had the highest RVA values of all analyzed indicators. The number and duration of low and high pulses indicated the Brda cascade’s intervention regime in the first analyzed period (Table 2). This could have affected the artificial regulation of the exchange of nutrients and organic matter between the river and the floodplain, influencing the amount of sediment transport and the texture of the riverbed. Changes in sediment and nutrient transport after commission of the reservoir were reported by Ligon et al. [16] and Stanford and Ward [91]. According to Richter et al. [74], the fourth group of hydrologic alteration indices showed limited habitat availability for aquatic species, including water birds and other terrestrial organisms. The typical lowland nature of the deep and thermally stratified Koronowski Reservoir is a significant source of an indigenous supply of nutrients and suspended sediments from the areas near the river bed (reservoir). Hence, it is an essential indicator of the Brda River hydrological transformation regarding the balance between a river system’s sediment supply and transport capacity [92,93]. On the other hand, in the lower, shallow Tryszczyn and Smukała reservoirs, this indicator’s impact is only visible in the zone directly below the dam. The changes of the flow pulses can influence the downstream erosion of the channel and degradation of the bed below dams, as pointed out in the research of Leopold et al. [94]. A significant decrease in the value of the parameters mentioned above in the second period resulted from changing the operating system to a run–of–river regime (Table 2).
The change in the operating system was also reflected in the rise and fall rate of discharge and annual discharge number of reversals, which indicated a much more frequent fluctuation of flows below the analyzed water stages but with a smaller amplitude (Table 2). Similar results were reported by Chen et al. [47], Yang et al. [46], and Timpe and Kaplan [95].
The conducted research allows determining the conceptual model of river sediment and nutrient circulation for the cascade of reservoirs to select the most favorable operating regime of a hydropower plant for the hydrological continuum of the river.
In the first analyzed period, the SSL balance for LBC reservoirs showed its removal (Figure 6A), indirectly reflecting the influence of frequent and large water level/flow rate fluctuations (Figure 2) characteristic of the hydropeaking regime. With the start of the run–of–river regime for LBC reservoirs in 2001, SSL transport and accumulation conditions changed. The energetics of the suspended sediment transport environment decreased, and the occurrence of high (June) and low (August) flows shifted, resulting in increased sediment accumulation in LBC reservoirs. This is consistent with the observations carried out on artificial reservoirs [28,29,30,31,96], also according to LBC reservoir sedimentation [25,66]. On the other hand, the DSL balance in both observed regimes indicates the continued transit through the LBC reservoirs, where the decrease in removal (Figure 6B) was directly related to the reduction in the volume of flows; water mass being the only factor determining the transport of the dissolved load.
The observed figure of eight pattern loops for sediment transport for the studied sites (Figure 5A,B) resulted from both the changes taking place in the Brda catchment area and the influence of the change in the operating regime of the hydropower plant, as demonstrated by the IHA analysis. The recorded advance of the maximum water flow in the channel with the maximum value of the analyzed sediment transport indicators demonstrated the supply of matter from a remote upstream area. On the other hand, the anticipation of the maximum value of the studied sediment transport indicators concerning the maximum water flow in the river indicated that the near channel was the sediment source. In the case of the spring period, the transit of matter from the catchment area was dominant (Figure 5A,B), with a delay resulting from high retention capacity, i.e., the presence of the river-lake system in the catchment area above the LBC combined with the postglacial formations of the catchment area. Sources of sediment supply during the summer period, when the near channel was the sediment source, were anthropogenic surfaces. The hardened surfaces, taking into account climate change [97] and change in land use [66], directly correlated with SSL and DSL transport and floodplain area. The impact of the cascade of reservoirs is most clearly reflected in the course of the loop for the second analyzed period (regime II), where the loop was disturbed for maximum (spring) and minimum (summer) flows. For the Tuchola station, there were no such apparent disturbances in the loop as for the Smukała station (Figure 5A,B). This shows that the functioning of the reservoir cascade had a decisive influence on the dynamics and continuity of the Brda river sediment transport.
In the case of nutrients TN and TP, the situation is more complicated because, in the first analyzed period, the balance of TNL and TPL for LBC indicates their removal (Figure 6C,D). After changing the hydropower plant’s operation to the run–of–river regime in 2001, a negative nutrient balance for LBC was still recorded. Additionally, Wang [36] indicated that the presence of reservoirs in the river’s longitudinal profile, including thermal stratification of reservoir waters, has an essential control over the content and forms of nutrients in the water. In the case of phosphorus, its reduction in the waters outflowing from the LBC may be a common phenomenon, as phosphorus is usually absorbed by bottom sediments [41], and its more significant reduction was noticeable when the LBC dams operated in the run–of–river. The annual mean values of total nitrogen depend on both allochthonous and autochthonous supply. After changing the hydropower plant’s operation to the run–of–river regime in 2001, TN increased slightly, enriching the outflowing waters with nitrogen (Figure 4C). This can be directly related to the source of nutrient supply and the flow nature of the cascade operation, which decreased the energy of the aquatic environment in reservoirs. Therefore, better conditions can be expected for the activity of the microflora and fauna of reservoirs and the mineralization of organic debris, which is also characteristic of other reservoirs [42]. Above the LBC, as a result of human activity, the nature and source of nutrients could have changed in the spring period; the supply being from the floodplain area to the upstream area (Figure 4C,D). Despite the notable change in both periods, the nutrient limiting the primary production was total nitrogen (TN:TP ratio < 16). This resulted in an extended delivery time of nutrients to the LBC reservoirs. Similar results were shown by Syvitski et al. [98] and Van Cappellen and Maavara [99]. The lacustrine character and thermal stratification of the waters of the largest LBC reservoir, combined with the change of the source of the Smukała station from the catchment area to the flood plain area for total nitrogen (Figure 4C,D), resulted in the fact that the volume of primary production inside the LBC became decisive for the nutrient balance. Additionally, the low TN:TP ratio stimulates the growth of cyanobacterial biomass and strengthens their advantage over other phytoplankton groups [100], which is unfavorable in the light of internal enrichment of water with nutrients. The total nitrogen balance showed its continuous removal (Figure 6C), while the balance of total phosphorus in the second analyzed period showed its accumulation (Figure 6D). This contributes to driving the internal primary production inside the LBC, directly influencing the ecological status of waters. The primary limiting production in LBC reservoirs in the first period was total nitrogen, while as a result of changes in the river regime resulting in the above, i.e., the described changes in nutrient supply sources, total phosphorus became the limiting nutrient (TN:TP ratio > 16). The ease of keeping phosphorus in the reservoir, confirmed by the research of Qin et al. [101], promotes the development of phytoplankton groups other than cyanobacteria [100], which improves the ecological status of waters.

5. Conclusions

Based on the results of conducted studies on the influence of hydropower plant regime change on suspended sediment transport dynamics on the example Lower Brda River Cascade (LBC), the following conclusions were drawn:
  • The commission of the reservoirs in the cascade system influenced the hydrological regime on the section of the reservoirs themselves and the river below. The hydropeaking operating regime resulted in high water flow dynamics, especially below the LBC, reflecting high HA values. The change of the operating regime to the run–of–river, more in tune with the habitat requirements of aquatic species and those associated with water, resulted in the equalization of water flow throughout the year, which was reflected in a decrease in the HA index.
  • The observed acceleration of the occurrence of the minimum and maximum flows in the Brda River below the LBC resulted directly from the change of the hydropower plant’s operating regime to the run–of–river. It was also an indirect indicator of progressing climate change.
  • Functioning LBC disturbs the hydrological continuum of the Brda River. The change of hydropeaking to the run–of–river operating regime of the hydropower plant increased the accumulation of suspended sediment in reservoirs. In the case of dissolved load transport, a direct link to the operating regime was noted, but without a significant impact on the overall balance, indicating continuous load transit. In the case of nutrients, the change in the LBC operating regime resulted in changes in the course of biochemical processes taking place in the reservoirs, which translated into the TN and TP transport balance.
  • The observed figure-eight pattern loops show the influence of hydropower plant operation on the LBC’s sediment and nutrient transport. This was especially noticeable for the summer period, when heavy rainfall caused an increased supply of sediment and nutrients due to the surface runoff from hardened areas. There were also changes in the matter supply sources, affecting nutrients and indicating a change of the nutrient primary limiting production in reservoirs from total nitrogen to total phosphorus.
  • The research pointed out the usefulness of analyses of river regimes and sediment and nutrient data for long-term observations of environmental pressures in relation to water management in fluvial schemes with dammed water systems.

Author Contributions

Conceptualization, D.S. and M.H.; methodology, D.S., M.H. and Z.B.; software, D.S.; validation, M.H.; formal analysis, Z.B.; investigation, D.S. and M.H.; resources, D.S. and M.H.; data curation, D.S.; writing—original draft preparation, D.S. and M.H.; writing—review and editing, M.H. and Z.B.; visualization, M.H. and D.S.; supervision, Z.B.; project administration, D.S.; funding acquisition, D.S., M.H. and Z.B. All authors have read and agreed to the published version of the manuscript.

Funding

This research and APC was funded by the Project Supporting Maintenance of Research Potential of the Institute of Geography at Kazimierz Wielki University [grant number BS/2016/N2].

Institutional Review Board Statement

Not applicable.

Informed Consent Statement

Not applicable.

Data Availability Statement

Publicly available data sets were analyzed in this study. These data can be found here: (i) hydrological data [https://danepubliczne.imgw.pl/ (accessed on 19 May 2020)]; (ii) water quality data is provided from the State Environmental Monitoring Program.

Acknowledgments

We would like only to thank the four anonymous reviewers for constructive comments that substantially improved our paper.

Conflicts of Interest

The authors declare no conflict of interest.

References

  1. Zwoliński, Z. Geomorficzne Dostosowywanie Się Koryta Parsęty do Aktualnego Reżimu Rzecznego; Institute of Geography and Spatial Organization Polish Academy of Sciences: Wrocław/Warszawa/Kraków/Gdańsk/Łódź, Poland, 1989; p. 144. [Google Scholar]
  2. Wilson, D.; Hannah, D.M.; McGregor, G.R. A large scale hydroclimatological perspective on western European river flow regimes. Hydrol. Res. 2012, 44, 809–833. [Google Scholar] [CrossRef]
  3. Wrzesiński, D.; Sobkowiak, L. Detection of changes in flow regime of rivers in Poland. J. Hydrol. Hydromech. 2018, 66, 55–64. [Google Scholar] [CrossRef] [Green Version]
  4. Vörösmarty, C.J.; Meybeck, M.; Fekete, B.; Sharma, K.; Green, P.; Syvitski, J.P.M. Anthropogenic sediment retention: Major global impact from registered river impoundments. Glob. Planet. Chang. 2003, 39, 169–190. [Google Scholar] [CrossRef]
  5. Syvitski, J.P.M.; Milliman, J.D. Geology, geography, and humans battle for dominance over the delivery of fluvial sediment to the coastal ocean. J. Geol. 2007, 115, 1–19. [Google Scholar] [CrossRef] [Green Version]
  6. Baldy, V.; Trémolières, M.; Andrieu, M.; Belliard, J. Changes in phosphorus content of two aquatic macrophytes according to water velocity, trophic status and time period in hardwater streams. Hydrobiologia 2006, 575, 343–351. [Google Scholar] [CrossRef] [Green Version]
  7. Schindle, D.W. Eutrophication and recovery in experimental lakes—Implications for lake management. Science 1974, 184, 897–899. [Google Scholar] [CrossRef] [PubMed] [Green Version]
  8. Allan, J.D. Landscapes and riverscapes: The influence of land use on stream ecosystems. Annu. Rev. Ecol. Evol. Syst. 2004, 35, 257–284. [Google Scholar] [CrossRef] [Green Version]
  9. Michalak, A.M.; Anderson, E.J.; Beletsky, D.; Boland, S.; Bosch, N.S.; Bridgeman, T.B.; DePinto, J.V. Record-setting algal bloom in Lake Erie caused by agricultural and meteorological trends consistent with expected future conditions. Proc. Natl. Acad. Sci. USA 2013, 110, 6448–6452. [Google Scholar] [CrossRef] [PubMed] [Green Version]
  10. Machesky, M.L.; Holm, T.R.; Slowikowski, J.A. Phosphorus speciation in stream bed sediments from an agricultural watershed: Solid-phase associations and sorption behavior. Aquat. Geochem. 2010, 16, 639–662. [Google Scholar] [CrossRef]
  11. Revenga, C.; Brunner, J.; Henniger, N.; Kassem, K.; Payne, R. Pilot Analysis of Global Ecosystems: Freshwater Systems; World Resources Institute: Washington, DC, USA, 2000; p. 78. [Google Scholar]
  12. Nilsson, C.; Reidy, C.A.; Dynesius, M.; Revenga, C. Fragmentation and Flow Regulation of the World’s Large River Systems. Science 2005, 308, 405–408. [Google Scholar] [CrossRef] [Green Version]
  13. Belletti, B.; Garcia de Leaniz, C.; Jones, J.; Bizzi, S.; Börger, L.; Segura, G.; Castelletti, A.; Bund, W.; Aarestrup, K.; Barry, J.; et al. More than one million barriers fragment Europe’s rivers. Nature 2020, 588, 436–441. [Google Scholar] [CrossRef]
  14. Walling, D.E. Human impact on land-ocean sediment transfer by the world’s rivers. Geomorphology 2006, 79, 192–216. [Google Scholar] [CrossRef]
  15. World Commission on Dams (WCD) Dams and Development. A New Framework for Decision Making. The Report of the World Commission on Dams; Taylor and Francis Group, Earthscan: London, UK, 2000; p. 446. [Google Scholar]
  16. Ligon, F.K.; Dietrich, W.E.; Trush, W.J. Downstream ecological effects of dams. BioScience 1995, 45, 183–192. [Google Scholar] [CrossRef]
  17. Directive 2001/77/EC of 27 September 2001 on the Promotion of Electricity Produced from Renewable Energy Sources in the Internal Electricity Market (O.J.EC L 283 of 27.10.2001). Available online: https://eur-lex.europa.eu/legal-content/en/ALL/?uri=CELEX%3A32001L0077 (accessed on 20 January 2021).
  18. Energy from Renewable Sources in 2018; Statistics Poland: Warszawa, Poland, 2019; p. 90. Available online: https://stat.gov.pl/obszary-tematyczne/srodowisko-energia/energia/energia-ze-zrodel-odnawialnych-w-2018-roku,10,2.html (accessed on 9 July 2020).
  19. Williams, G.P.; Wolman, M.G. Downstream Effects of Dams on Alluvial Rivers; United States Geological Survey, US Government Printing Office: Washington, DC, USA, 1984; p. 83.
  20. Vörösmarty, C.J.; Sharma, K.P.; Fekete, B.M.; Copeland, A.H.; Holden, J.; Marble, J.; Lough, J.A. The storage and aging of continental run off in large reservoir systems of the world. Ambio 1997, 26, 210–219. [Google Scholar]
  21. Obodovskyi, O.; Habel, M.; Szatten, D.; Rozlach, Z.; Babiński, Z.; Maerker, M. Assessment of the Dnieper Alluvial Riverbed Stability Affected by Intervention Discharge Downstream of Kaniv Dam. Water 2020, 12, 1104. [Google Scholar] [CrossRef]
  22. Lisle, T.E.; Hilton, S. The volume of fine sediment in pools: An index of sediment supply in gravel-bed streams. Water Resour. Bull. 1992, 28, 371–383. [Google Scholar] [CrossRef]
  23. Van Rijn, L. Sediment Transport. Part III: Bed forms and alluvial roughness. J. Hydraul. Eng. 1984, 110, 1733–1754. [Google Scholar] [CrossRef]
  24. Kondolf, G. Hungry water: Effects of Dams and Gravel Mining on River Channels. Environ. Manag. 1997, 21, 533–551. [Google Scholar] [CrossRef] [PubMed]
  25. Szatten, D.; Habel, M.; Pellegrini, L.; Maerker, M. Assessment of Siltation Processes of the Koronowski Reservoir in the Northern Polish Lowland Based on Bathymetry and Empirical Formulas. Water 2018, 10, 1681. [Google Scholar] [CrossRef] [Green Version]
  26. Moilanen, A.; Hanski, I. On the use of connectivity measures in spatial ecology. Oikos 2001, 95, 147–151. [Google Scholar] [CrossRef]
  27. Pringle, C.M.; Freeman, M.C.; Freeman, B.J. Regional effects of hydrologic alterations on riverine macrobiota in the New World: Tropical-temperate comparisons. Bioscience 2000, 50, 807–823. [Google Scholar] [CrossRef] [Green Version]
  28. Amenuvor, M.; Gao, W.; Li, D.; Shao, D. Effects of Dam Regulation on the Hydrological Alteration and Morphological Evolution of the Volta River Delta. Water 2020, 12, 646. [Google Scholar] [CrossRef] [Green Version]
  29. Urbaniak, M.; Kiedrzynska, E.; Zalewski, M. The role of a lowland reservoir in the transport of micropollutants, nutrients and the suspended particulate matter along the river continuum. Hydrol. Res. 2012, 43, 400–411. [Google Scholar] [CrossRef]
  30. Babic-Mladenovic, M.; Kolarov, V.; Damjanovic, V. Sediment regime of the Danube River in Serbia. Int. J. Sediment. Res. 2013, 28, 470–485. [Google Scholar] [CrossRef]
  31. Babiński, Z. Hydromorphological consequences of regulating the lower Vistula, Poland. Regul. Rivers Res. Manag. 1992, 7, 337–348. [Google Scholar] [CrossRef]
  32. Friedl, G.; Wüest, A. Disrupting biogeochemical cycles—Consequences of damming. Aquat. Sci. 2002, 64, 55–65. [Google Scholar] [CrossRef]
  33. Wang, X.; Yang, T.; Yong, B.; Krysanova, V.; Shi, P.; Li, Z.; Zhou, X. Impacts of climate change on flow regime and sequential threats to riverine ecosystem in the source region of the Yellow River. Environ. Earth Sci. 2018, 77, 465. [Google Scholar] [CrossRef]
  34. Richter, B.D.; Davis, M.M.; Apse, C.; Konrad, C. A presumptive standard for environmental flow protection. River Res. Appl. 2012, 28, 1312–1321. [Google Scholar] [CrossRef]
  35. Directive 2000/60/EC of the European Parliament and of the Council of 23 October 2000 Establishing a Framework for Community Action in the Field of Water Policy. Available online: https://eur-lex.europa.eu/eli/dir/2000/60/oj (accessed on 21 October 2019).
  36. Wang, F. Impact of a large sub-tropical reservoir on the cycling of nutrients in a river. Water Res. 2020, 186, 116363. [Google Scholar] [CrossRef]
  37. Merritt, D.M.; Scott, M.L.; Poff, N.L.; Auble, G.T.; Lytle, D.A. Theory, methods and tools for determining environmental flows for riparian vegetation: Riparian vegetation-flow response guilds. Freshw. Biol. 2009, 55, 206–255. [Google Scholar] [CrossRef]
  38. Poff, N.L.; Allan, J.D.; Bain, M.B.; Karr, J.R.; Prestegaard, K.L.; Richter, B.D.; Sparks, R.E.; Stromberg, J.C. The natural flow regime. BioScience 1997, 47, 769–784. [Google Scholar] [CrossRef]
  39. Finger, D.; Schmid, M.; Wüest, A. Comparing effects of oligotrophication and upstream hydropower dams on plankton and productivity in perialpine lakes. Water Resour. Res. 2007, 43, W12404. [Google Scholar] [CrossRef] [Green Version]
  40. Harrison, J.A.; Seitzinger, S.P.; Bouwman, A.F.; Caraco, N.F.; Beusen, A.H.W.; Vörösmarty, C.J. Dissolved inorganic phosphorus export to the coastal zone: Results from a spatially explicit, global model. Glob. Biogeochem. Cycles 2005, 19, GB4S03. [Google Scholar] [CrossRef]
  41. Bosch, N.S. The influence of impoundments on riverine nutrient transport: An evaluation using the Soil and Water Assessment Tool. J. Hydrol. 2008, 355, 131–147. [Google Scholar] [CrossRef]
  42. Teodoru, C.; Wehrli, B. Retention of sediments and nutrients in the Iron Gate I Reservoir on the Danube River. Biogeochemistry 2005, 76, 539–565. [Google Scholar] [CrossRef]
  43. Freeman, M.C.; Bowen, Z.H.; Bovee, K.D.; Irwin, E.R. Flow and habitat effects on juvenile fish abundance in natural and altered flow regimes. Ecol. Appl. 2001, 11, 179–190. [Google Scholar] [CrossRef]
  44. Dettinger, M.D.; Diaz, H.F. Global characteristics of stream flow seasonality and variability. J. Hydrometeorol. 2000, 1, 289–310. [Google Scholar] [CrossRef] [Green Version]
  45. Magilligan, F.J.; Nislow, K.H. Changes in hydrologic regime by dams. Geomorphology 2005, 71, 61–78. [Google Scholar] [CrossRef]
  46. Yang, T.; Zhang, Q.; Chen, Y.D.; Tao, X.; Xu, C.; Chen, X. A spatial assessment of hydrologic alteration caused by dam construction in the middle and lower Yellow River, China. Hydrol. Process. 2008, 22, 3829–3843. [Google Scholar] [CrossRef]
  47. Chen, Y.D.; Yang, T.; Xu, C.Y.; Zhang, Q.; Chen, X.; Hao, Z.C. Hydrologic alteration along the Middle and Upper East River (Dongjiang) basin, South China: A visually enhanced mining on the results of RVA method. Stoch. Environ. Res. Risk Assess. 2010, 24, 9–18. [Google Scholar] [CrossRef]
  48. Lin, K.; Lian, Y.; Chen, X.; Lu, F. Changes in runoff and eco-flow in the Dongjiang River of the Pearl River Basin, China. Front. Earth Sci. 2014, 8, 547–557. [Google Scholar] [CrossRef]
  49. Saraiva-Okello, A.M.L.; Masih, I.; Uhlenbrook, S.; Jewitt, G.P.W.; Van der Zaag, P.; Riddell, E. Drivers of spatial and temporal variability of streamflow in the Incomati River basin. Hydrol. Earth Syst. Sci. 2015, 19, 657–673. [Google Scholar] [CrossRef] [Green Version]
  50. Mittal, N.; Bhave, A.G.; Mishra, A.; Singh, R. Impact of Human Intervention and Climate Change on Natural Flow Regime. Water Resour. Manag. 2016, 30, 685–699. [Google Scholar] [CrossRef] [Green Version]
  51. Duan, W.; Guo, S.; Wang, J.; Liu, D. Impact of Cascaded Reservoirs Group on Flow Regime in the Middle and Lower Reaches of the Yangtze River. Water 2016, 8, 218. [Google Scholar] [CrossRef] [Green Version]
  52. Gebremicael, T.G.; Mohamed, Y.A.; Zaag, P.; Hagos, E.Y. Temporal and spatial changes of rainfall and streamflow in the Upper Tekezē–Atbara river basin, Ethiopia. Hydrol. Earth Syst. Sci. 2017, 21, 2127–2142. [Google Scholar] [CrossRef] [Green Version]
  53. Gierszewski, P.J.; Habel, M.; Szmańda, J.; Luc, M. Evaluating effects of dam operation on flow regimes and riverbed adaptation to those changes. Sci. Total. Environ. 2020, 710, 136202. [Google Scholar] [CrossRef] [PubMed]
  54. Lu, X.X.; Li, S.; Kummu, M.; Padawangi, R.; Wang, J.J. Observed changes in the water flow at Chiang Saen in the lower Mekong: Impacts of Chinese dams? Quat. Int. 2014, 336, 145–157. [Google Scholar] [CrossRef]
  55. Szmanda, J.; Gierszewski, P.; Habel, M.; Luc, M.; Witkowski, K.; Bortnyk, S.; Obodovskyi, O. Response of the Dnieper River fluvial system to the river erosion caused by the operation of the Kaniv hydro-electric power plant (Ukraine). Catena 2021, 105265. [Google Scholar] [CrossRef]
  56. Kim, B.S.; Kim, B.K.; Kwon, H.H. Assessment of the impact of climate change on the flow regime of the Han River basin using indicators of hydrologic alteration. Hydrol. Process. 2011, 25, 691–704. [Google Scholar] [CrossRef]
  57. Wang, X.; Yang, T.; Wortmann, M.; Shi, P.; Hattermann, F.; Lobanova, A.; Aich, V. Analysis of multi-dimensional hydrological alterations under climate change for four major river basins in different climate zones. Clim. Chang. 2017, 141, 483–498. [Google Scholar] [CrossRef]
  58. McDaniel, R.D.; O’Donnell, F.C. Assessment of Hydrologic Alteration Metrics for Detecting Urbanization Impacts. Water 2019, 11, 1017. [Google Scholar] [CrossRef] [Green Version]
  59. Map of the Polish Hydrographic Division; Department of Hydrography and Morphology of River Channels Institute of Meteorology and Water Management. Available online: http://mapa.kzgw.gov.pl/ (accessed on 10 December 2016).
  60. Galon, R. Morfologia doliny i sandru Brdy. Stud. Soc. Scient. Tor. 1953, C, 1–6. [Google Scholar]
  61. Galon, R. Geomorfologia Polski; Polish Scientific Publishers: Warszawa, Poland, 1972; p. 372. [Google Scholar]
  62. Choiński, A. Zróżnicowanie i Uwarunkowania Zmienności Przepływów Rzek Polskich; Adam Mickiewicz University Press: Poznań, Poland, 1988; p. 99. [Google Scholar]
  63. Jutrowska, E. Antropogeniczne Zmiany Warunków Hydrologicznych w Dorzeczu Brdy; Biblioteka Monitoringu Środowiska: Bydgoszcz, Poland, 2007; p. 128. [Google Scholar]
  64. Lorenc, H. (Ed.) Atlas klimatu Polski; Institute of Meteorology and Water Management National Research Institute: Warszawa, Poland, 2005; p. 116. [Google Scholar]
  65. Atlas Hydrologiczny Polski; Institute of Meteorology and Water Management National Research Institute: Warszawa, Poland, 1997; p. 95.
  66. Szatten, D.; Habel, M. Effects of Land Cover Changes on Sediment and Nutrient Balance in the Catchment with Cascade-Dammed Waters. Remote. Sens. 2020, 12, 3414. [Google Scholar] [CrossRef]
  67. Studium Regionu Doliny Brdy; Biuro Planów Regionalnych: Warszawa, Poland, 1953; p. 235.
  68. Szatten, D. Wpływ zabudowy hydrotechnicznej na występowanie ekstremalnych stanów wody na przykładzie Brdy skanalizowanej. Inżynieria Ekol. 2016, 46, 55–60. [Google Scholar] [CrossRef] [Green Version]
  69. Pietrucień, C. Stosunki hydrograficzne w rejonie Zalewu Koronowskiego. Stud. Soc. Scient. Tor. 1967, I, 15–34. [Google Scholar]
  70. Hoffman, A. (Ed.) Załącznik do Założeń Projektu Elektrowni Wodnej Koronowo; Zjednoczenie Energetyczne Okręgu Bydgosko-Toruńskiego: Gdańsk, Poland, 1950; p. 230. [Google Scholar]
  71. Biuro Wojewody Kujawsko-Pomorskiego. Pozwolenie Wodnoprawne na Szczególne Korzystanie z Wód Rzeki Brdy Dla Potrzeb Elektrowni Wodnej Smukała. 2004. Available online: http://archiwum.kujawsko-pomorskie.pl/index.php?option=com_content&task=view&id=20512&Itemid=665 (accessed on 10 September 2020).
  72. Water Law Act. Journal of Laws. 2017. Available online: http://isap.sejm.gov.pl/isap.nsf/DocDetails.xsp?id=WDU20170001566 (accessed on 20 January 2021).
  73. Szatten, D. Zmiany stanów wody w Zbiorniku Koronowskim w latach 1996-2012. Inżynieria Ekologiczna 2015, 44, 204–209. [Google Scholar] [CrossRef] [Green Version]
  74. Richter, B.D.; Baumgartner, J.V.; Powell, J.; Braun, D.P. A Method for Assessing Hydrologic Alternation within Ecosystems. Conserv. Biol. 1996, 10, 1163–1174. [Google Scholar] [CrossRef] [Green Version]
  75. Richter, B.D.; Baumgartner, J.V.; Wigington, R.; Braun, D.P. How much water does a river need? Freshw. Biol. 1997, 37, 231–249. [Google Scholar] [CrossRef] [Green Version]
  76. Richter, B.D.; Baumgartner, J.V.; Braun, D.P.; Powell, J. A spatial assessment of hydrologic alternation within a river network. Regul. Rivers Res. Manag. 1998, 14, 329–340. [Google Scholar] [CrossRef]
  77. Water Quality—Determination of Suspended Sediment Concentration (PN-EN 872); Polish Committee for Standardization: Warszawa, Poland, 2007; p. 8.
  78. Wren, D.; Barkdoll, B.; Kuhnle, R.; Derrow, R. Field Techniques for Suspended-Sediment Measurement. J. Hydraul. Eng. 2000, 126, 97–104. [Google Scholar] [CrossRef]
  79. Hermanowicz, W. Fizyczno-Chemiczne Badanie Wody i Scieków; Arkady: Warszawa, Poland, 1999; p. 556. [Google Scholar]
  80. Water Quality—Determination of Nitrogen (PN-EN 12260:2004); Polish Committee for Standardization: Warszawa, Poland, 2014; p. 13.
  81. Water Quality—Determination of Phosphorus (PN-EN ISO 6878:2006); Polish Committee for Standardization: Warszawa, Poland, 2006; p. 23.
  82. Redfield, A.C. The influence of organisms on the composition of sea-water. Sea 1963, 2, 26–77. [Google Scholar]
  83. Łajczak, A. Studium Nad Zamulaniem Wybranych Zbiorników Zaporowych w Dorzeczu Wisły; Institute of Geography and Spatial Organization Polish Academy of Sciences: Warszawa, Poland, 1995; p. 105. [Google Scholar]
  84. Wang, Y.; Wang, D.; Lewis, Q.W.; Wu, J.; Huang, F. A framework to assess the cumulative impacts of dams on hydrological regime: A case study of the Yangtze River. Hydrol. Process. 2017, 31, 3045–3055. [Google Scholar] [CrossRef]
  85. Döll, P.; Zhang, J. Impact of climate change on freshwater ecosystems: A global-scale analysis of ecologically relevant river flow alterations. Hydrol. Earth Syst. Sci. 2010, 7, 1305–1342. [Google Scholar]
  86. Bloomfield, J.P.; Allen, D.J.; Griffiths, K.J. Examining geological controls on Baseflow Index (BFI) using regression analysis: An illustration from the Thames Basin, UK. J. Hydrol. 2009, 373, 164–176. [Google Scholar] [CrossRef] [Green Version]
  87. CORINE Land Cover 2006; Chief Inspectorate for Environmental Protection & Institute of Geodesy and Cartography. Available online: http://clc.gios.gov.pl/ (accessed on 6 April 2017).
  88. Wang, H.; Yang, Z.; Saito, Y.; Liu, J.P.; Sun, X. Interannual and seasonal variation of the Huanghe (Yellow River) water discharge over the past 50 years: Connections to impacts from ENSO events and dams. Glob. Planet. Chang. 2006, 50, 212–225. [Google Scholar] [CrossRef]
  89. Pyron, M.; Neumann, K. Hydrologic alterations in the Wabash River watershed, USA. River Res. Appl. 2008, 24, 1175–1184. [Google Scholar] [CrossRef]
  90. Zhang, Q.; Xiao, M.; Liu, C.L.; Singh, V.P. Reservoir-induced hydrological alterations and environmental flow variation in the East River, the Pearl River basin, China. Stoch. Environ. Res. Risk Assess. 2014, 28, 2119–2131. [Google Scholar] [CrossRef]
  91. Stanford, J.A.; Ward, J.V. An ecosystem perspective of alluvial rivers—Connectivity and the hyporheic corridor. J. N. Am. Benthol. Soc. 1993, 12, 48–60. [Google Scholar] [CrossRef]
  92. Phillips, J.D. Sedimentation in bottomland hardwoods downstream of an east Texas dam. Environ. Geol. 2001, 40, 860–868. [Google Scholar]
  93. Pitlick, J.; Wilcock, P. Relations between streamflow, sediment transport, and aquatic habitat in regulated rivers. In Geomorphic Processes and Riverine Habitat; Dorava, J.M., Montgomery, D.R., Palcsak, B.B., Fitzpatrick, F.A., Eds.; American Geophysical Union, Water Science and Application: Washington, DC, USA, 2001; Volume 4, pp. 185–198. [Google Scholar]
  94. Leopold, L.B.; Wolman, M.G.; Miller, J.P. Fluvial Processes Geomorphology; Dover Publications: New York, NY, USA, 1992; p. 893. [Google Scholar]
  95. Timpe, K.; Kaplan, D. The changing hydrology of a dammed Amazon. Sci. Adv. 2017, 3, 1700611. [Google Scholar] [CrossRef] [Green Version]
  96. Babiński, Z.; Habel, M. Impact of a single dam on sediment transport continuity in large lowland rivers. In Proceedings of the 13th International Symposium on River Sedimentation, Stuttgart, Germany, 19–22 September 2016; Wieprecht, S., Haun, S., Weber, K., Noack, M., Terheiden, K., Eds.; Taylor & Francis CRP Press: Leiden, The Netherlands, 2016; pp. 975–982. [Google Scholar]
  97. Vinnikov, K.Y. Global Warming Trend of Mean Tropospheric Temperature Observed by Satellites. Science 2003, 302, 269–272. [Google Scholar] [CrossRef] [Green Version]
  98. Syvitski, J.P.M.; Vörösmarty, C.J.; Kettner, A.J.; Green, P. Impact of humans on the flux of terrestrial sediment to the global coastal ocean. Science 2005, 308, 376–380. [Google Scholar] [CrossRef] [PubMed]
  99. Van Cappellen, P.; Maavara, T. Rivers in the Anthropocene: Global scale modifications of riverine nutrient fluxes by damming. Ecohydrol. Hydrobiol. 2016, 16, 106–111. [Google Scholar] [CrossRef] [Green Version]
  100. Wilk, P.; Orlińska-Woźniak, P.; Gębala, J. Variability of nitrogen to phosphorus concentration ratio on the example of selected coastal river basin. Sci. Rev. Eng. Environ. Sci. 2017, 26, 55–65. [Google Scholar]
  101. Qin, B.; Zhou, J.; Elser, J.J.; Gardner, W.S.; Deng, J.; Brookes, J.D. Water depth underpins the relative roles and fates of nitrogen and phosphorus in lakes. Environ. Sci. Technol. 2020, 54, 3191–3198. [Google Scholar] [CrossRef] [PubMed]
Figure 1. Sketch of the study area. (A) Longitudinal profile of LBC (B) on the background of the Brda catchment area.
Resources 10 00070 g001
Figure 2. Examples of hourly water elevation of the Koronowski Reservoir on lacustrine section (A) and Brda River directly below the Smukała Reservoir (B) under different regimes. Regime I: hydropeaking (7–15 May 2000) and Regime II: run–of–river (9–17 September 2015).
Resources 10 00070 g002
Figure 3. Comparison of changes in the value of hydrologic alteration (HA) for 33 Indicators of Hydrologic Alteration (IHA) for Tuchola (A) and Smukała (B) stations using RVA target range for a hydropeaking (1984–2000) and run–of–river (2001–2017) regime periods. Explanations for parameters 1.1–5.3 in Table 2.
Resources 10 00070 g003
Figure 4. The relationship between water discharge (Q, in m3 s−1) with: (A) suspended sediment concentration (SSC, in mg L−1), (B) dissolved load concentration (DLC, in mg L−1), (C) total nitrogen (mgN L−1), (D) total phosphorus (mgP L−1) at the stations Tuchola (T) and Smukała (S) during Regime I (hydropeaking) and Regime II (run–of–river).
Resources 10 00070 g004
Figure 5. The pattern loops for seasonal relationship for water discharge (Q, in m3 s−1) for stations Tuchola (T) and Smukała (S) with: (A) suspended sediment concentration (SSC, in mg L−1), (B) dissolved load concentration (DLC, in mg L−1), (C) total nitrogen (mgN L−1) and (D) total phosphorus (mgP L−1), during Regime I (hydropeaking) and Regime II (run–of–river).
Resources 10 00070 g005
Figure 6. The ability of yearly (β) and average (βav.) retention of river load and nutrients for LBC in the period 1991–2011. (A) suspended sediment load (SSL, in tones), (B) dissolved load (DL, in tones), (C) total nitrogen load (TNL, in tones) and (D) total phosphorus load (TPL, in tones). The green color line is for Regime I (hydropeaking), and the blue color line is for Regime II (run–of–river).
Resources 10 00070 g006
Table 1. Characteristics of the reservoirs included in the LBC.
ReservoirDam Localization
[River km]
Commission YearWater Damming
[m]
Area
[km2]
Capacity
[Million m3]
Hydraulic Resistance Time
[Year−1]
Koronowski49.1 * 40.1 **196024.714.35781.08.07
Tryszczyn31.519624.60.871.80.16
Smukała22.319517.50.942.20.16
Explanations: * dam, ** hydropower plant.
Table 2. Calculated values for 33 indicators of Hydrologic Alteration (IHA) for LBC under a hydropeaking (1984–2000) and run–of–river (2001–2017) regime periods.
ParameterTucholaSmukała
1984–20002001–20171984–20002001–2017
1.1November mean flow20.020.025.025.0
1.2December mean flow21.021.026.026.0
1.3January mean flow21.021.029.030.0
1.4February mean flow21.022.030.030.0
1.5March mean flow21.022.031.031.0
1.6April mean flow23.021.032.030.0
1.7May mean flow18.019.026.025.0
1.8June mean flow16.015.021.519.0
1.9July mean flow13.015.018.021.0
1.10August mean flow13.014.019.019.0
1.11September mean flow16.516.021.520.5
1.12October mean flow19.017.024.023.0
2.11-day minimum11.012.014.014.0
2.23-day minimum11.012.015.314.3
2.37-day minimum11.112.316.015.0
2.430-day minimum12.013.517.017.1
2.590-day minimum13.914.518.919.0
2.61-day maximum27.030.048.044.0
2.73-day maximum27.029.346.041.7
2.87-day maximum26.628.038.939.4
2.930-day maximum25.325.736.536.4
2.1090-day maximum22.823.432.332.9
2.11Number of zero days0000
2.12Base flow index0.6090.6160.6050.562
3.1Date of minimum198172207188
3.2Date of maximum53309649
4.1Low pulse count7.05.033.09.0
4.2Low pulse duration4.03.52.02.0
4.3High pulse count8.06.024.010.0
4.4High pulse duration3.06.02.53.0
5.1Rise rate1.01.03.01.0
5.2Fall rate−1.0−1.0−2.5−1.0
5.3Number of reversals69.069.0166.0129.0
Publisher’s Note: MDPI stays neutral with regard to jurisdictional claims in published maps and institutional affiliations.

