
Assessment of Rainwater Retention Efficiency in Urban Drainage Systems—Model Studies


Department of Infrastructure and Water Management, The Faculty of Civil Environmental Engineering and Architecture, Rzeszow University of Technology, Av. Powstancow Warszawy 6, 35-959 Rzeszow, Poland
Resources 2022, 11(2), 14; https://0-doi-org.brum.beds.ac.uk/10.3390/resources11020014
Submission received: 30 October 2021
/
Revised: 21 December 2021
/
Accepted: 25 January 2022
/
Published: 27 January 2022
Abstract
:Around the world, there is growing interest in the use of rainwater retention, and in particular channel retention, as part of urban drainage systems. This is made possible by means of intentional damming of rainwater in the existing sewer collectors in order to maximise the use of gravitational spaces in the channels. This approach is particularly favourable for drainage types related to high levels of urban development, where construction of a building is difficult due to the low amount of space available. This article explains the results of a study concerning the efficiency assessment of three retention devices characterised by different hydraulic systems, one of which uses channel retention in its operation. The analysis conducted within the simulation study has demonstrated that the use of standard single-chamber reservoirs is the least efficient solution. A comparison of the functions of different hydraulic systems of retention reservoirs under equal conditions has shown that the necessary retention capacity of a single-chamber reservoir is many times greater in comparison to highly efficient solutions and it may constitute up to 582% of the reservoir’s capacity and works in conjunction with the channel retention system. At the same time, it has been demonstrated that the application of channel retention is not the most efficient solution for all hydraulic conditions for a drainage system or for all hydrological conditions. In addition, the article proposes a set of retention efficiency indices that may be used in the future assessment of individual rainwater storage solutions. Estimation of the necessary capacity of the retention facilities operating in specific hydraulic conditions was made on the basis of model tests—hydrodynamic modelling with the use of SWMM 5.0 software. The course of the research was planned using the theory of experiment planning (DOE) with the use of Statistica software, whereas efficiency indices were developed with the use of artificial neural networks (ANNs). The study results include practical and cognitive aspects. These may constitute guidelines for the designers and potential investors, as well as a tool with the aim of promoting the most efficient rainwater retention solutions in urban drainage systems.
1. Introduction
Many scientific reports in recent years have focused on the topic of climate change [1,2,3,4]. Unfortunately, this change affects to a greater or lesser degree practically every aspect of human life, generating social issues [5,6] and economic losses [7]. The ongoing climate change process includes temperature change in the annual cycles, which as a consequence interferes with the water circuit characteristics, as has been indicated on numerous occasions in the climate change reports of the IPCC Climate Change and Land (Intergovernmental Panel on Climate Change) [8] and their future forecasts.
Changes in the rainfall characteristics are highly important from the standpoint of water management in urban areas. In his study, Doulabian [9] demonstrated that climate change linked to temperature increase is connected to the intensification of rainfall phenomena in annual cycles, while the annual precipitation remains almost unchanged (or changes to a minor degree) [10]. In practice, this results in increased intensity of rainwater flow rates during rainfall in the existing drainage systems. This results in the frequent operation of the pressure-assisted gravity systems [11] and even the overflow of rainwater from the system, leading to urban flooding [12]. This issue is further intensified by the unsustainable and often irresponsible development of urban areas [13]. In his study, Zelenakova [13] placed special emphasis on the problem of limiting the surface of biologically active areas for the benefit of commercial buildings in city centres. This has been noticed in urban areas for over three decades in almost all larger cities [14]. This has led numerous researchers to undertake studies with the aim of seeking temporary or permanent solutions that can be applied within the municipal infrastructure [15]. As a result, a range of scientific and engineering subcategories have arisen focusing on solving the problem in a specific manner. In this field, the widely understood matters of the ‘Sponge City’ are particularly distinguished, and they concern a specific method of designing urban areas [16,17,18,19], covering mainly the need for infiltration [20,21] and rainwater management [22] in systemic terms. At the same time, temporary solutions are a source of considerable interest in engineering practice, intended to increase the efficiency [23] or alter the function of the existing municipal infrastructure [11] in order to increase rainwater retention. Their development is further intensified thanks to the EU water directive (Water Framework Directive) [24], which imposes the obligation to improve the ecological and chemical condition of waters.
In the case of urban drainage systems, due to limited investment possibilities resulting from dense development, the most frequently chosen solution is the use of sewage retention reservoirs [25]. This is related to the fact that rainwater retention in buildings is the simplest solution to the problem [23]. Such devices constitute an inseparable element of drainage systems and have long been studied by many researchers, both for hydraulic [10] and water quality reasons [26]. Currently, numerous versions of these devices can be distinguished, in particular standard gravity reservoirs (single- and multi-chamber reservoirs) [10,27] and forced flow reservoirs (typically, multi-chamber reservoirs) [28,29]. Their classification can be further expanded by taking into account their function in the system. In addition, there is an increasing number of types of such facilities, which is supported by the development of numerous patents and typically stems from the need to adapt a device to local investment conditions.
Another approach to solving the problem, which in recent years has been applied in areas with limited space for building investments, is altering the function of the existing infrastructure, such as the use of channel retention [11] or through retention. Such actions are of particular interest in land reclamation as well as in urban drainage systems. In the case of drainage systems, these actions are aimed at the search of solutions enabling temporary damming of rainwater in a pipeline system in order to better use the free space in the pipes. In the most general terms, it can be stated that such actions aim at the transformation of the urban drainage system into a retention reservoir [30].
When reviewing the literature on the functioning of rainwater drainage and retention systems, it can be stated that they most often relate to the practical aspects of assessing the functioning of existing sewage systems with classic solutions of retention facilities [31]. The most frequently discussed issues include the topic of Sponge Cities and their impact on the water and sewage management of cities [32,33,34]. From the point of view of the functioning of retention facilities, the research is most often focused on the system’s response to the occurrence of rainfall with different temporal and/or spatial variability or the possibility of reducing the run-off of rainwater [11,35]. However, the very aspect of canal retention is one of the rarely discussed topics. It is often mentioned, and its important role in sewage systems is emphasised, but it is not a direct research topic.
However, taking into account the development of computer tools in the field of hydrodynamic modelling as well as machine learning, there is a good chance to solve these problems. The widespread use of hydrodynamic modelling in the municipal economy in conjunction with the calibration of models gives great opportunities to reproduce the functioning of the system and the selection of the best engineering solutions [10]. Similarly, as indicated by Tanty and Desmukh [36], artificial intelligence operation can be well exemplified through application in rainfall-run-off modelling, modelling streamflow, water quality modelling and application in ground water.
The current state of research on rainwater retention in urban drainage systems shows a limited number of studies related to the function of temporary methods of dealing with excess amounts of rainwater in urban catchments.
For this reason, three research goals were set in the paper: firstly, the comparison of the necessary retention capacities of three solutions of retention facilities objects (a classic single-chamber reservoir, a modified multi-chamber reservoir with increased hydraulic efficiency and a reservoir using the canal retention of the drainage system) operating under the same hydrological and hydraulic conditions of the catchment area and the sewage system; secondly, the verification at which hydraulic and hydrological parameters of the sewage system works best for a specific type of reservoir; and thirdly, proposing retention efficiency coefficients that allow for the assessment of the effectiveness of the functioning of given retention facilities in various hydraulic conditions, which was obtained with the use of artificial neural networks, or the ANNs.
The study results hold practical and cognitive value. They constitute a valuable tool for the designers of municipal infrastructure systems and are applicable for the future assessment of other retention solutions. At the same time, the results are of key significance for general research in the future into the efficiency of different sewage retention methods. The next stages of this research should concern:
- The effect of temporal and spatial variability of rainfall on the functioning and efficiency of the solutions discussed in the article;
- Assessment of the rationality of introducing mechanical control elements that enable the increase in retention of a sewage system working in conjunction with retention facilities;
- The impact of decentralisation of retention devices in a catchment on their hydraulic efficiency.
In connection with the above, the study described in the article can be viewed as an attempt to answer the need for further research to assess retention efficiency based on different methods for collecting water in urban drainage systems.
2. Materials and Methods
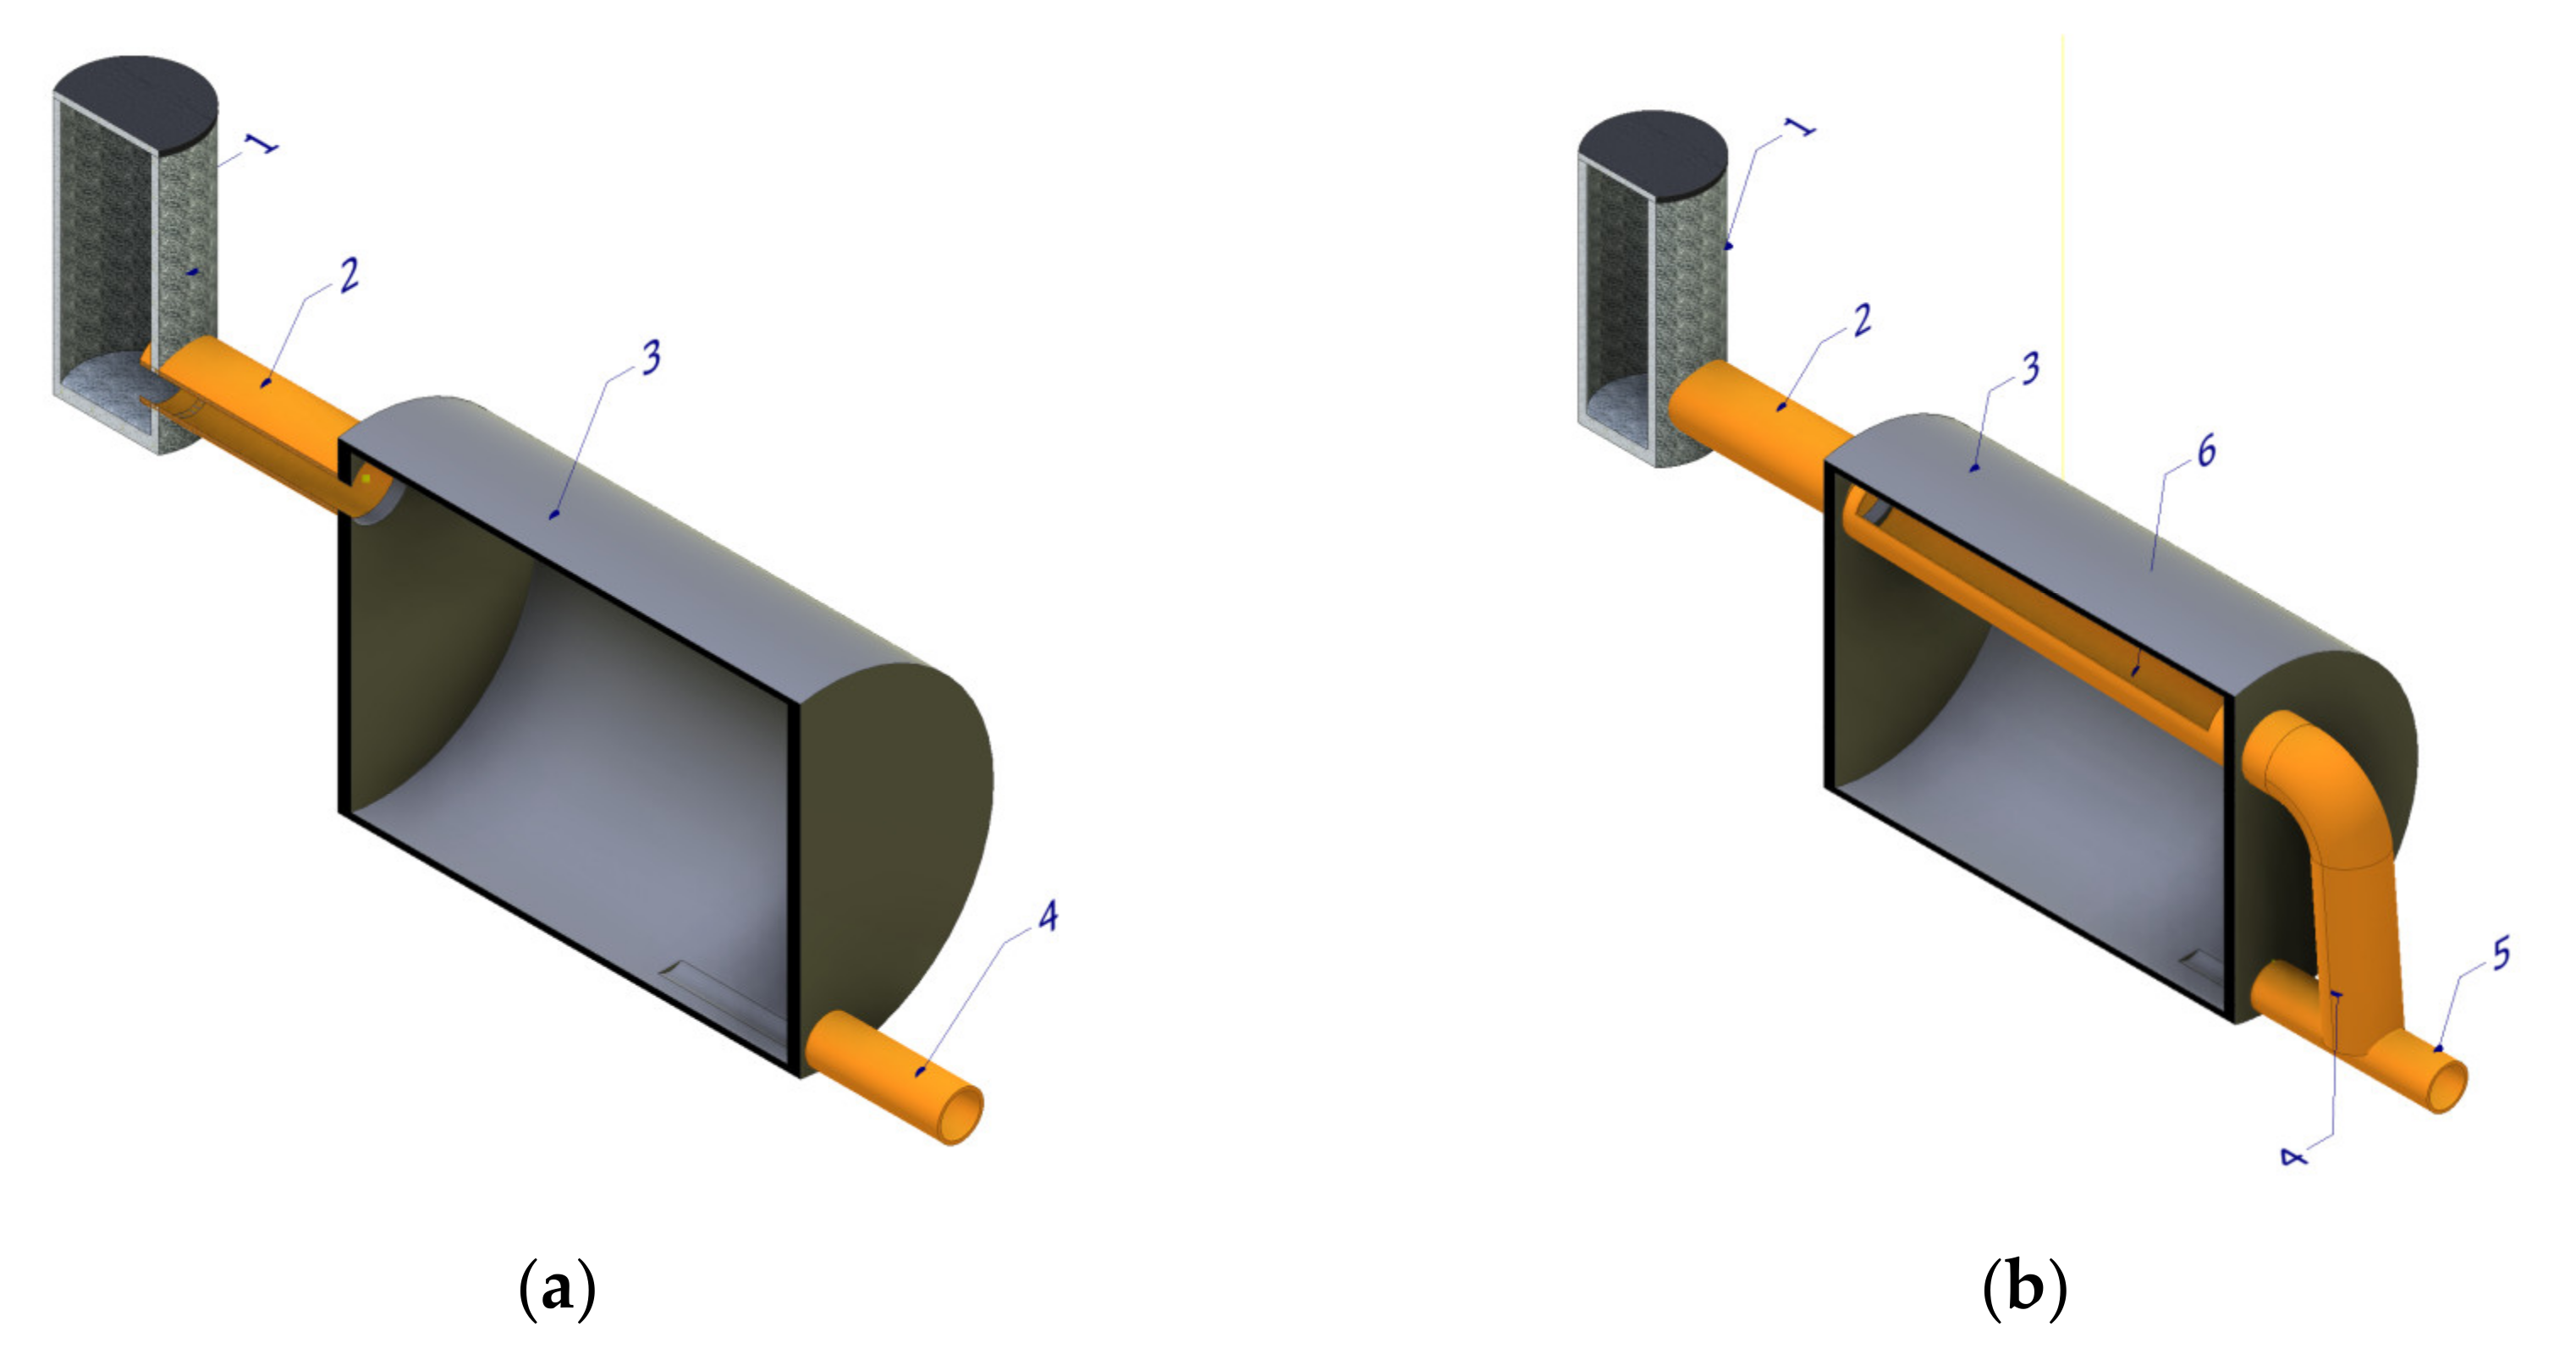
The planned study was based on the verification of the functioning and determination of the necessary retention device capacity functioning within a drainage system. The study compared three separate hydraulic systems of a retention device operation. The first device was the standard single-chamber reservoir, presented in Figure 1a. As shown, it was the simplest of the tested devices and consisted of an accumulation chamber and inlet and outlet channels, with a characteristic level differentiation between these channels. Due to its construction, it was the least expensive device to build, but its most marked disadvantage was the dependency of the maximum attainable outflow rate on the level of sewage present in the accumulation chamber.
The second device was a modified multi-chamber reservoir containing an accumulation and flow chamber implemented as a channel with overflow. The modification, consisting in replacing the flow chamber with a low-diameter channel with appropriately designed overflow, enabled the maximum limiting of the sewage flow time through the reservoir and obtaining the highest sewage outflow rate value already in the first phase of its functioning. An additional advantage of the device was the independence of the highest value of the rainwater outflow value from the reservoir of its temporary filling level in the accumulation chamber. This solution is presented in Figure 1b.
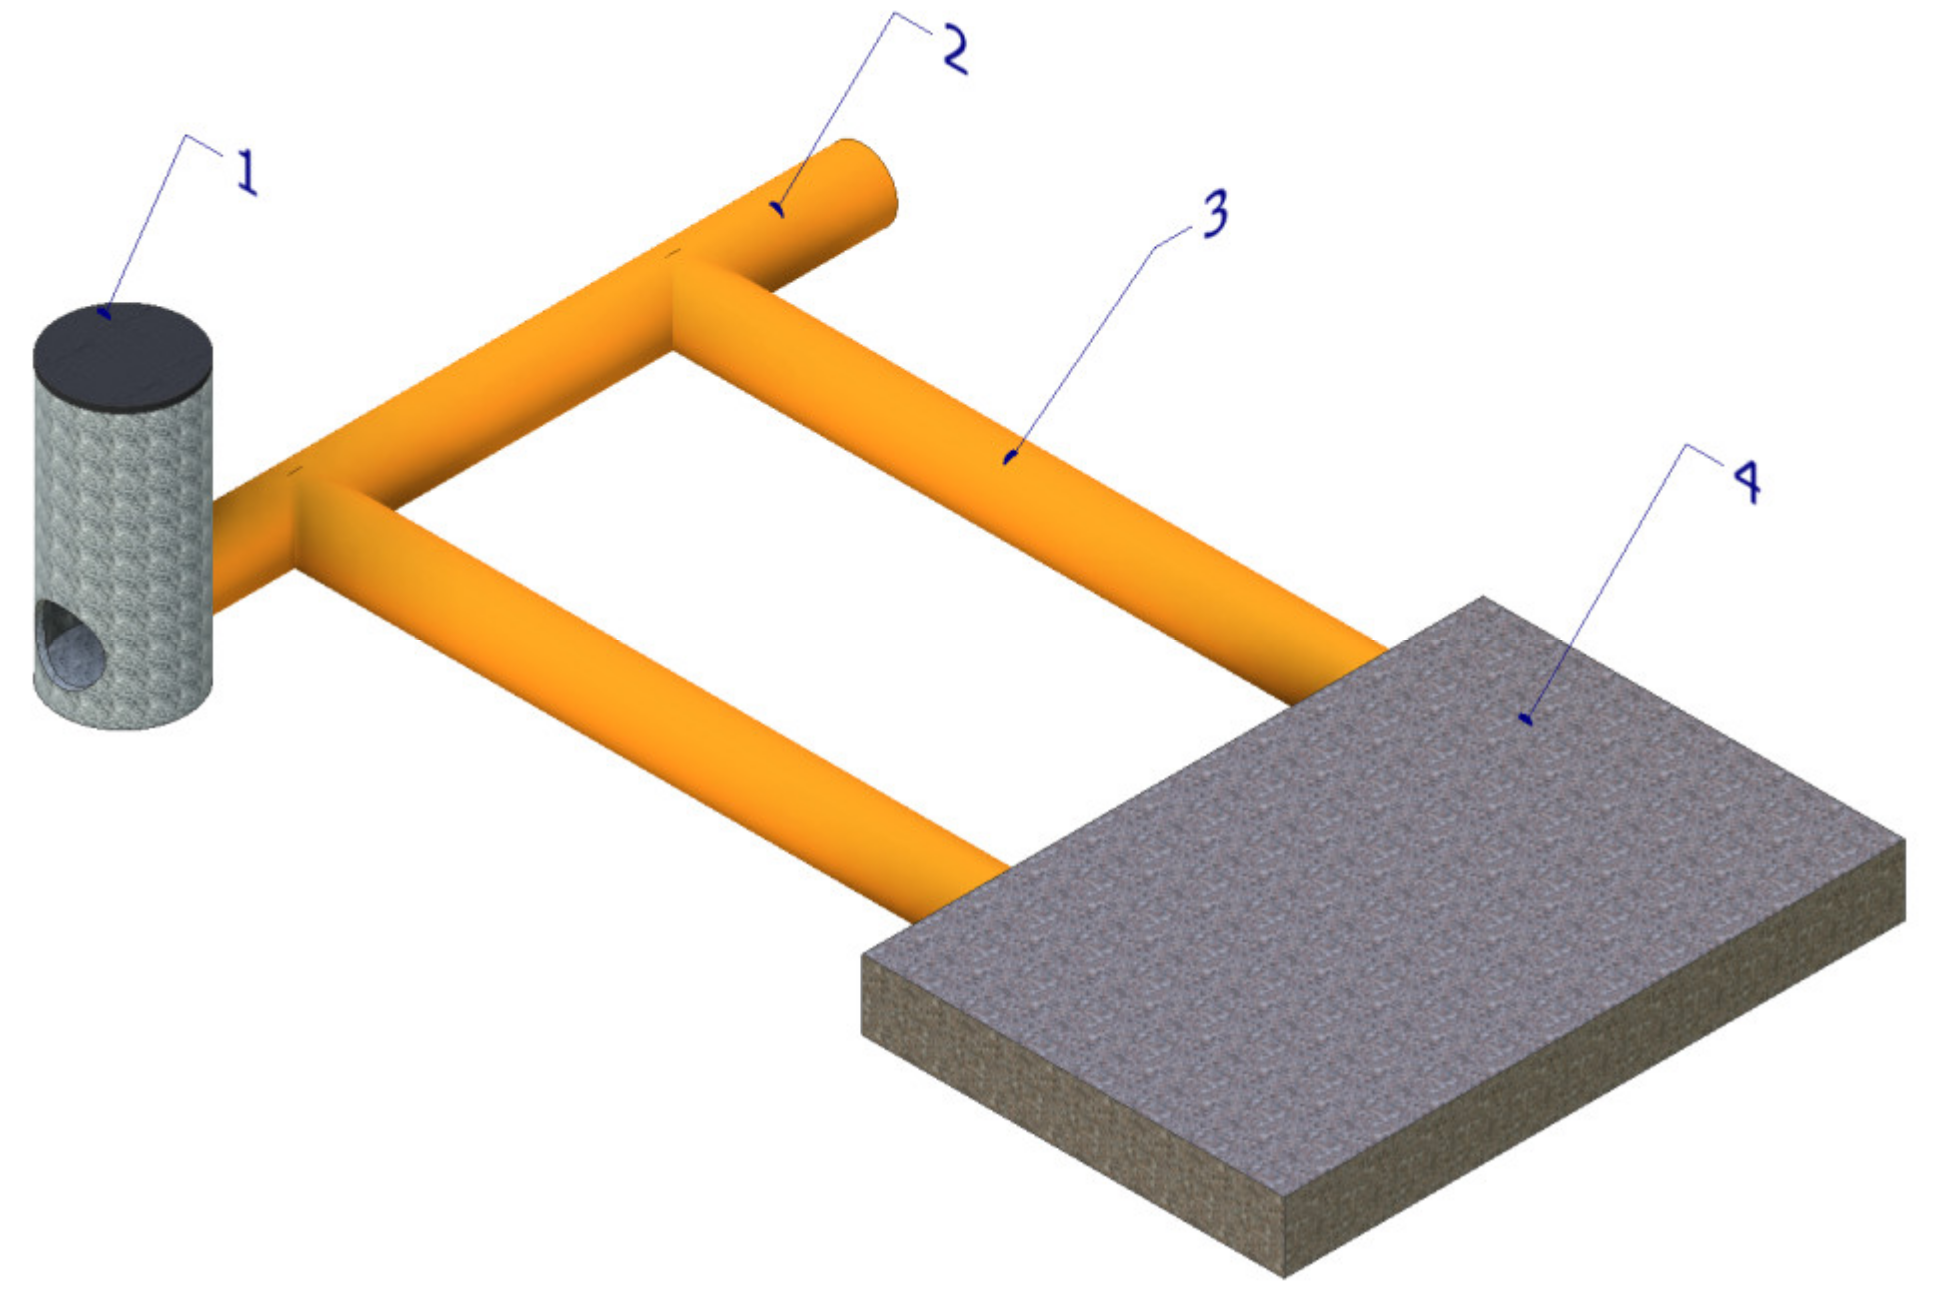
The third device was a reservoir which worked in conjunction with a sewage system by means of a certain degree of availability of retention capacity of its channels. The main assumption for its functioning was the intended damming of the rainwater level in the drainage channels above the maximum designed level. This aim can be achieved in terms of the maximum reservoir filling level and by the assumption that it should be equal to the diameter of the channel in which it has been installed. This solution comprised a single accumulation chamber, whose base was located at the level of the bottom of the inflow channel. At the same time, it was connected with a bidirectional transit channel (one or more) with a drainage network. In addition, the transit channels affected the increased retention of the coalition system, which could be regulated by increasing the length of these channels. This solution is presented in Figure 2.
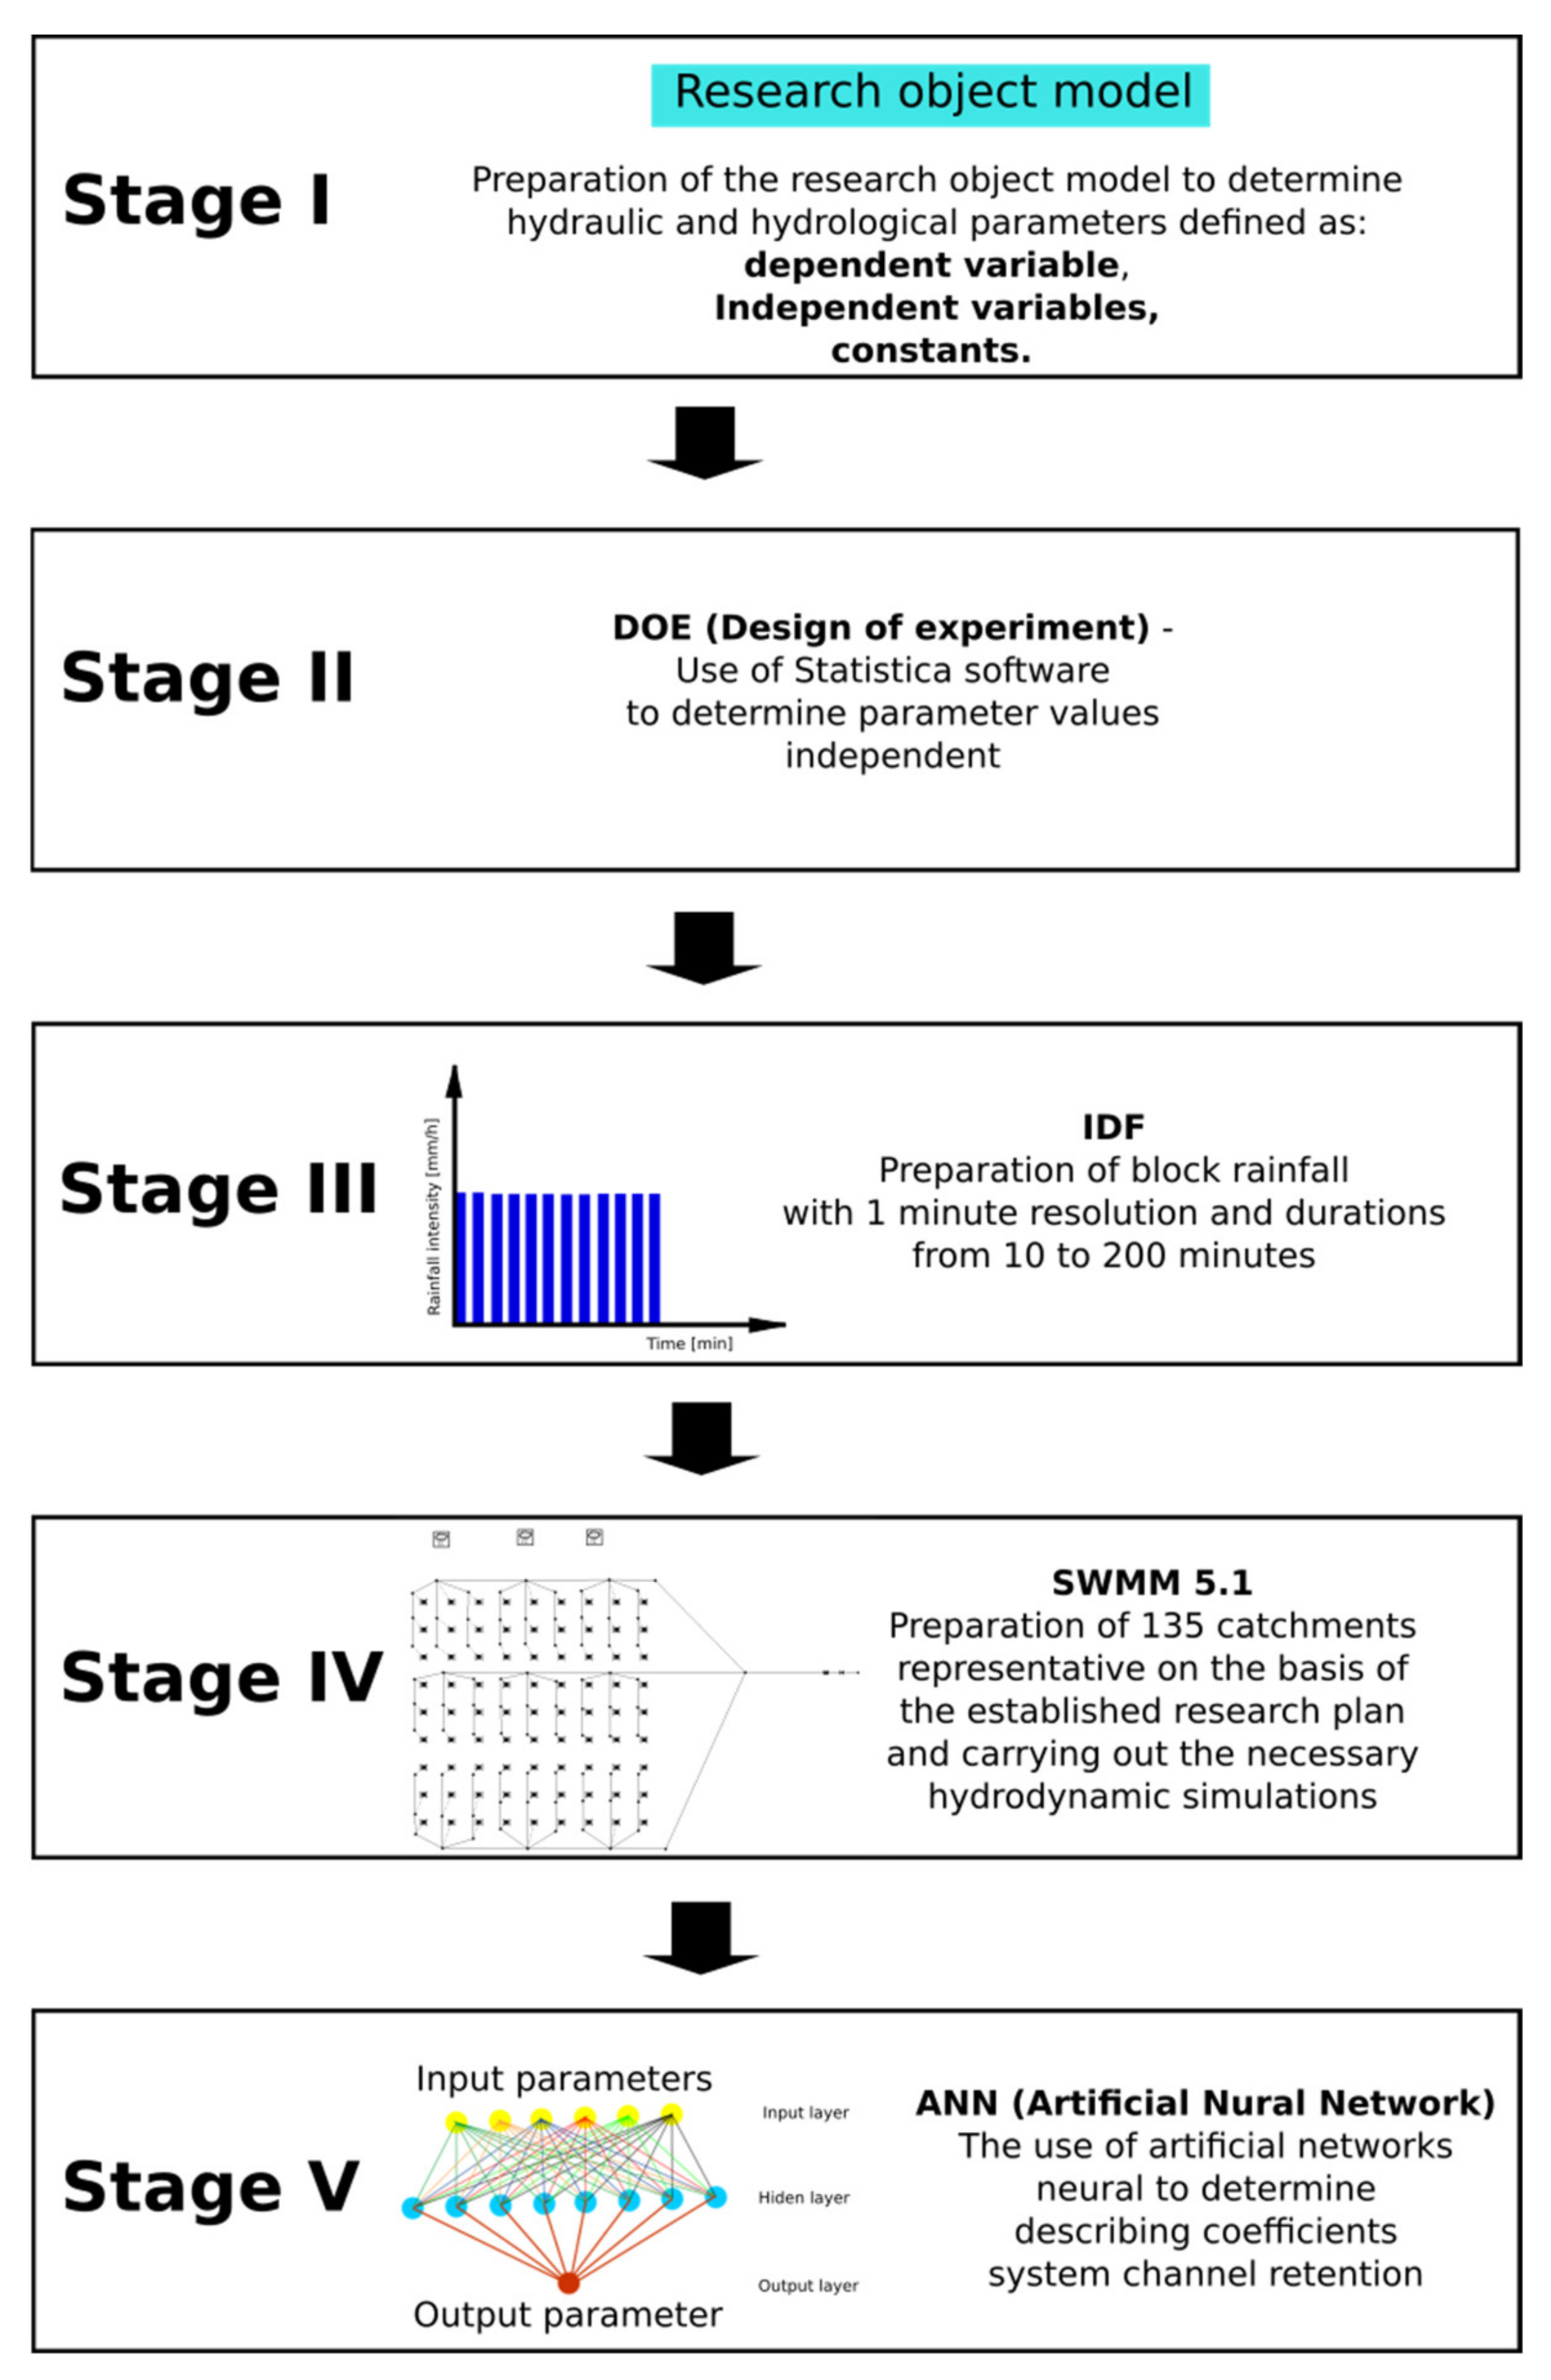
To realise the study concerning the described solutions of retention devices a 5-stage design was prepared. In the first stage, the retention facility model was characterised in order to determine the parameters of hydraulic and hydrological networks of the studied catchments, significant from the standpoint of hydrodynamic modelling and referred to here as the independent and dependent variables. Subsequently, the values of parameters of independent variables were determined, and for this purpose, a simulation plan was prepared using the Design of Experiment (DOE) tool. This enabled the determination of the layout number (sets of characterising parameters of catchments with specific hydraulic parameters—independent variables) and the values of their parameters. In the third stage, rainfall models were prepared, which were then used to load the previously prepared representative catchments. In the fourth stage, on the basis of the results from the second stage, representative catchments that will be burdened with rainfall were developed. Then, a series of hydrodynamic simulations were performed with the use of the Storm Water Management Model (SWMM) software in order to determine the required retention capacity of a facility at the given level of liquid flow reduction. In the fifth stage, artificial neural networks (ANNs) were developed to determine the indicator which explains the retention efficiency of the individual sewage retention solutions in a sewage system. The study design is presented in Figure 3.
2.1. Stage 1
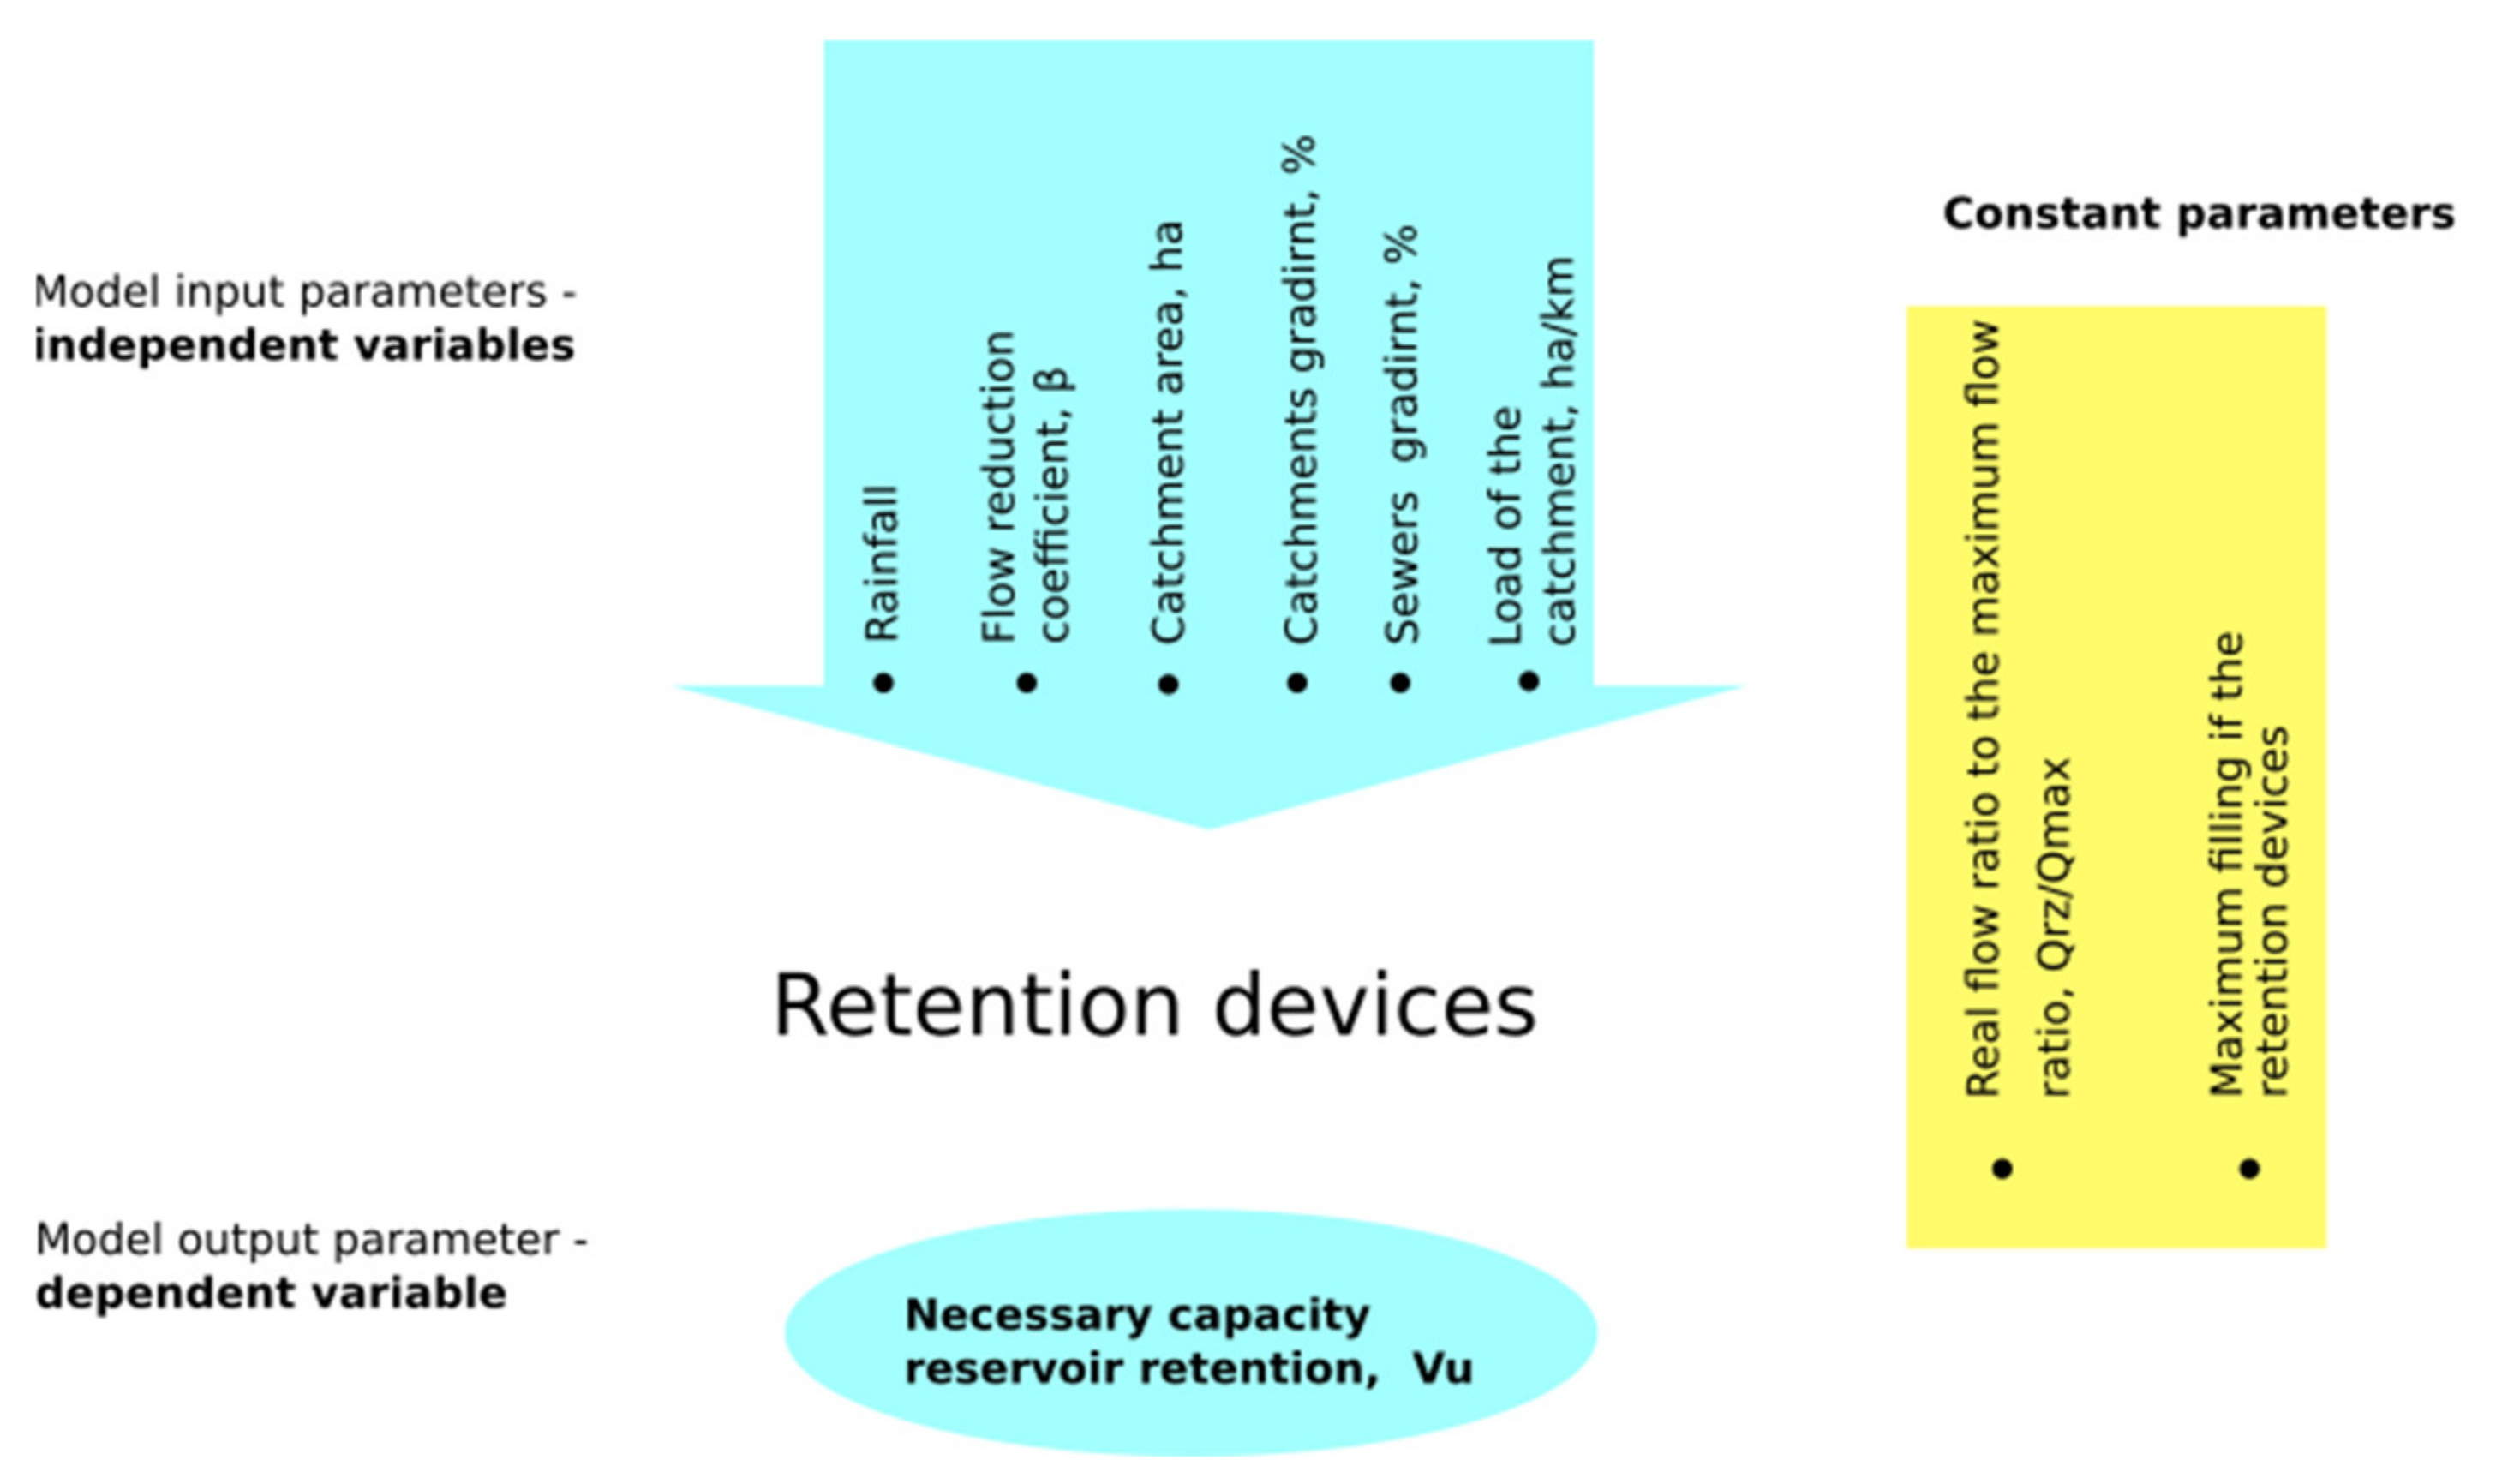
The first stage of the study comprised the assumption of the study subject model—a retention device. Building a model of the research object requires defining the result parameter, the dependent variable, and analysing all hydraulic and hydrological parameters (independent variables) that may affect the result. Due to the large number of independent variables that may occur in the model, it is necessary to verify and accept for further research those that correlate to the greatest extent with the independent variable. Similar studies were presented in [37], in which an analogous model of the research object (retention reservoir) was developed, in which the independent variables were defined on the basis of the performed sensitivity analysis. As a consequence, the model presented in [37] was adopted for this study. The retention facility model developed in the cited study comprises input and output parameters and constants to the model. The output parameter for the model, the dependent variable, is the reservoir’s retention capacity, Vu. The input parameters for the model, the independent variables, are the rainfall assumed for the analysis, the sewage flow reduction coefficient β, the catchment area F, the channel gradient sk, the catchment gradient sc and the catchment load oc. In the first stage of the research, rainfall was determined as one of the basic independent variables in accordance with the work [37]. However, this factor cannot be described with a fixed value because in each simulation, its individual values were determined depending on the conditions of the sewage system functioning. A detailed description of the rainfall parameters is presented in step 3. The sewage system flow reduction coefficient for the reservoir was explained with Equation (1) [37]. This coefficient is the quotient of the sewage stream volume drained from the reservoir Qo and the sewage stream introduced into the reservoir Qi at the same time. In the study, the analysis was performed for sewage flow reduction coefficients of 0.2, 0.35, 0.5, 0.65 and 0.8.
Catchment load is the ratio between the length of the sewage network and the catchment area in which it is located. Constant parameters were also determined for the model, which were the maximum filling of sewage in the reservoir (set at 1.8 m) and the maximum sewage filling in the channel (set at 80% channel filling). The study subject model used is presented in Figure 4.
Simulation testing was conducted for the input data values presented in Table 1.
2.2. Stage 2
The main study element was the determination of the necessary capacity Vu of different retention devices functioning under the same hydraulic parameters for catchment and the sewage system and the determination of their hydraulic efficiencies. Obtaining the assumed objective is possible after the execution of a series of hydrodynamic simulations for the representative catchments with different parameters. Thus, the next study stage was to determine what independent variable values should characterise the tested representative catchments. The most favourable approach appeared to assume a complete plan, that is, one that would envisage the preparation of representative catchments in such a number so as to enable the projection of every possible combination of the independent variable values characterising the given catchment. However, an approach assuming the creation of a finite number of combinations of such parameters would require the preparation and testing of a high number of catchments. This stemmed from the significant number of input parameters which characterise a sewage system and from the high number of values they can assume. It was considered worth implementing Design of Experiment theory (DOE).
Implementation of a DOE tool from the Statistica software package enabled the creation of a limited number of data sets mapping the parameters necessary to test the representative catchments. This data set was referred to as a system. In the study, a fractorial trivalent design 3(k-p) was assumed [38], where k was the number of inputs and p the number of inputs generated from the complete design [39].
Rainfall was excluded from the independent variable group (Table 1) at the study design creation stage. This stemmed from the fact that with variable hydraulic parameters of a catchment and sewage system, the parameters of critical precipitation (its duration) would be subject to change for the retention device. As a consequence, completely different rainfall levels could be critical for different water retention solutions. Thus, it would be unjustified to load all representative catchments with a rainfall of constant parameters. Therefore, every parameter set forming a representative catchment obtained from the design was loaded with rainfall of different durations in order to find the highest capacity (critical precipitation). In an analogous manner, the sewage flow reduction coefficient β was excluded from the group of independent variables (Table 1). Considering that this was one of the most important parameters affecting the cubic capacity of a retention reservoir [37], it was decided to analyse the remaining parameters in a wider spectrum of coefficient β, which might be from 0.2 to 0.8. While this step increased the number of necessary simulations, it enabled the drawing of significant conclusions. The applied methodology allowed the selection of values for the tested parameters, which are listed in Table 2. The rainfall parameters are not summarised in Table 2 due to the fact that each obtained system was loaded with different durations of rainfall. They were of a duration ranging from 10 to 200 min. This treatment was necessary due to the fact that the critical time of rain for the retention device changed depending on the hydraulic parameters of the system.
As a result, 27 systems (27 data sets for independent parameters) were obtained. Each system was tested for five values of the sewage flow reduction coefficient β (0.2, 0.35, 0.5, 0.65, 0.8). Therefore, a total of 135 tested system models were prepared for each analysed retention device. A total of 405 models of drainage systems were developed. The study verified the relationship between the catchment and the catchment parameters and a sewage system with three different retention facility designs.
2.3. Stage 3
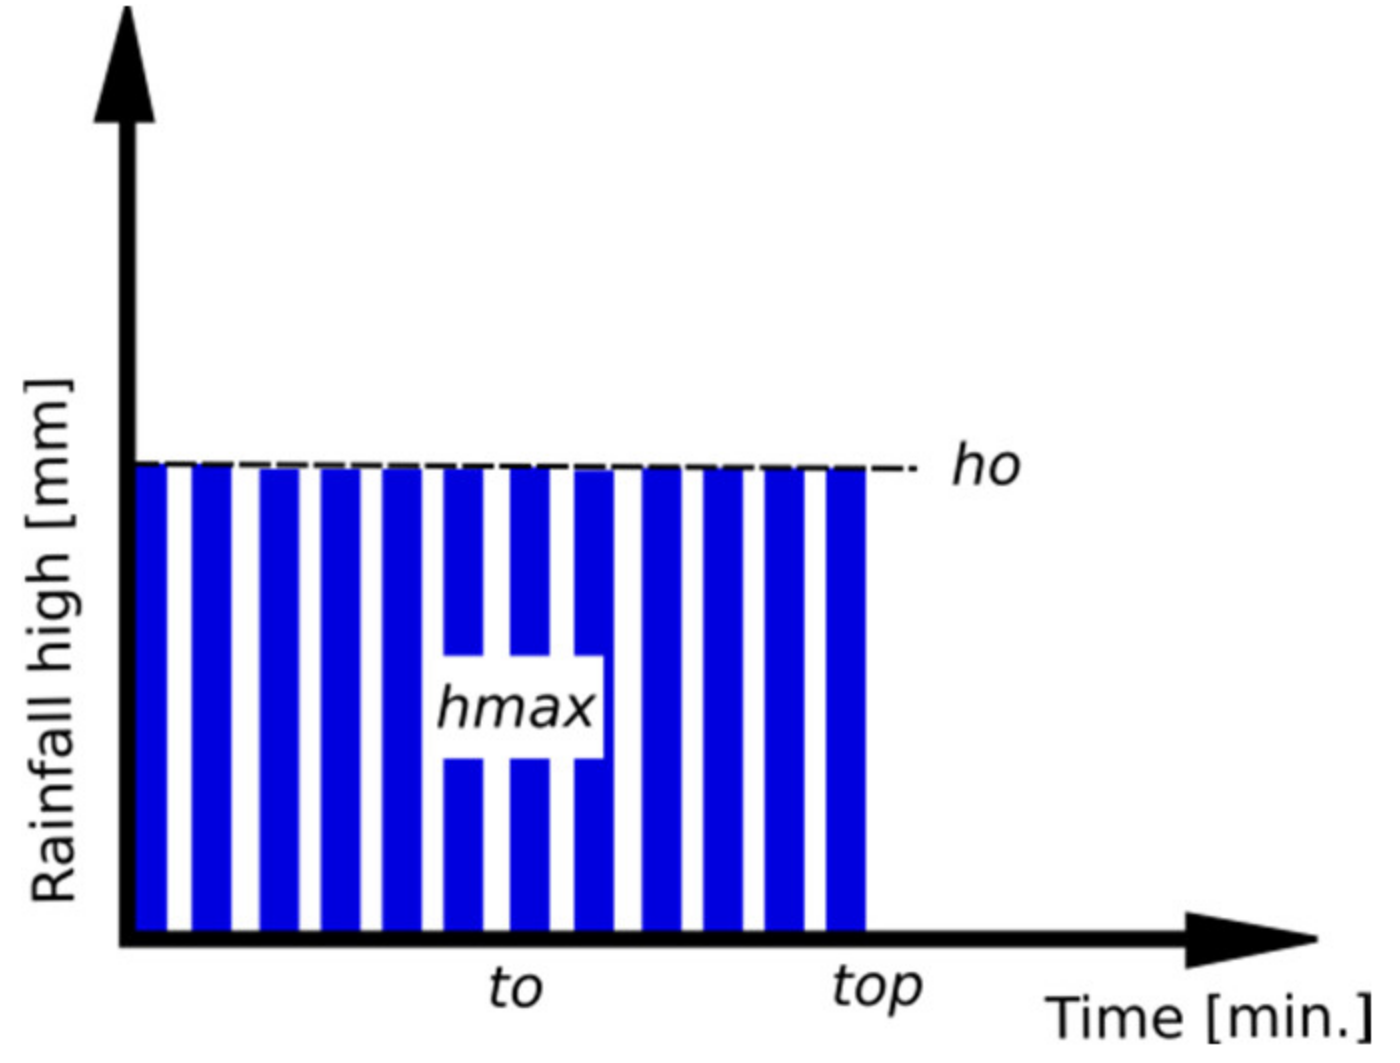
As presented in the study subject model (Stage 1), rainfall was one of the independent variables. The study used synthetic rain histograms in the form of block precipitation with a constant distribution over time. The parameters describing the assumed rainfall were:
- Maximum total rainfall level with a specified duration top and height difference probability p, hmax mm;
- Rainfall duration, top min;
- Probability of rainfall occurrence, p%.
When simulating the functioning of sewage systems, the most advantageous way to assess them is to use typical rain hyetographs based on IDF or DDF curves, using, e.g., Euler rainfall type II [40] or the method of the city of Chicago [41]. In this article, however, block precipitation was used due to the easier process of preparing and implementing such precipitation into a model that requires a large number of simulations. Such a simplification was decided due to the fact that the aim of the article was primarily to compare the dependencies between the necessary capacities of different retention devices under identical hydraulic conditions. The construction of a rainfall equivalent that could be used for the drainage infrastructure facility design required determination of the maximum total rainfall level, hmax. In the study, for the purpose of further calculation of maximum total rainfall hmax, with a specified probability of occurrence and duration top, the Bogdanowicz and Stach model [42], appropriate for the area of Poland, was applied, explained by Equation (2).
where hmax is the maximum total rainfall with specified duration top and overflowing probability p (mm), p is the precipitation overflowing probability and α is the parameter (of scale) dependent on the region of Poland (R) and the rainfall duration top.
The described Bogdanowicz and Stach rainfall model enabled the projection of IDF and DDF curves [43], which constituted the most popular precipitation data form used in hydrodynamic modelling.
Another parameter was the rainfall duration, top, which was one of the more significant parameters for two reasons. Firstly, it was used during the construction of hydrodynamic models in order to determine the required duct diameters. Secondly, it was used to determine the critical capacity of the retention device. In both cases, verification of drainage system model operation was required for a wide spectrum of different rainfall durations and selection of the maximum value. For the testing, rainfall durations between 10 and 200 min were used.
The final parameter characterising rainfall was the probability of its occurrence, which for the purpose of the study was established at 50%, in accordance with the PN-EN 752 standard [44]. The development of a series of block precipitations with the use of the Bogdanowicz and Stach formula required the calculation of the maximum total rainfall level hmax depending on the rainfall duration top on the basis of Equation (3).
where ho(t) is the rainfall level in time to (min), hmax is the maximum total rainfall level (mm) and top is the rainfall duration (min).
As a result, on the basis of Equation (3), 200 precipitation events with durations from 10 to 200 min with a time step of 1 min were prepared. Their total height hmax determined for the 50% probability of precipitation and the region of central Poland ranged from 11.11 to 27.24 mm.
2.4. Stage 4
Stage 4 consisted of the preparation of the representative catchments, whose hydraulic and hydrological parameters were established during the study design in Stage 2. The prepared catchments constituted the basis for the execution of hydrodynamic simulations aimed at the determination of the critical capacities of three retention solutions differing in hydraulic terms.
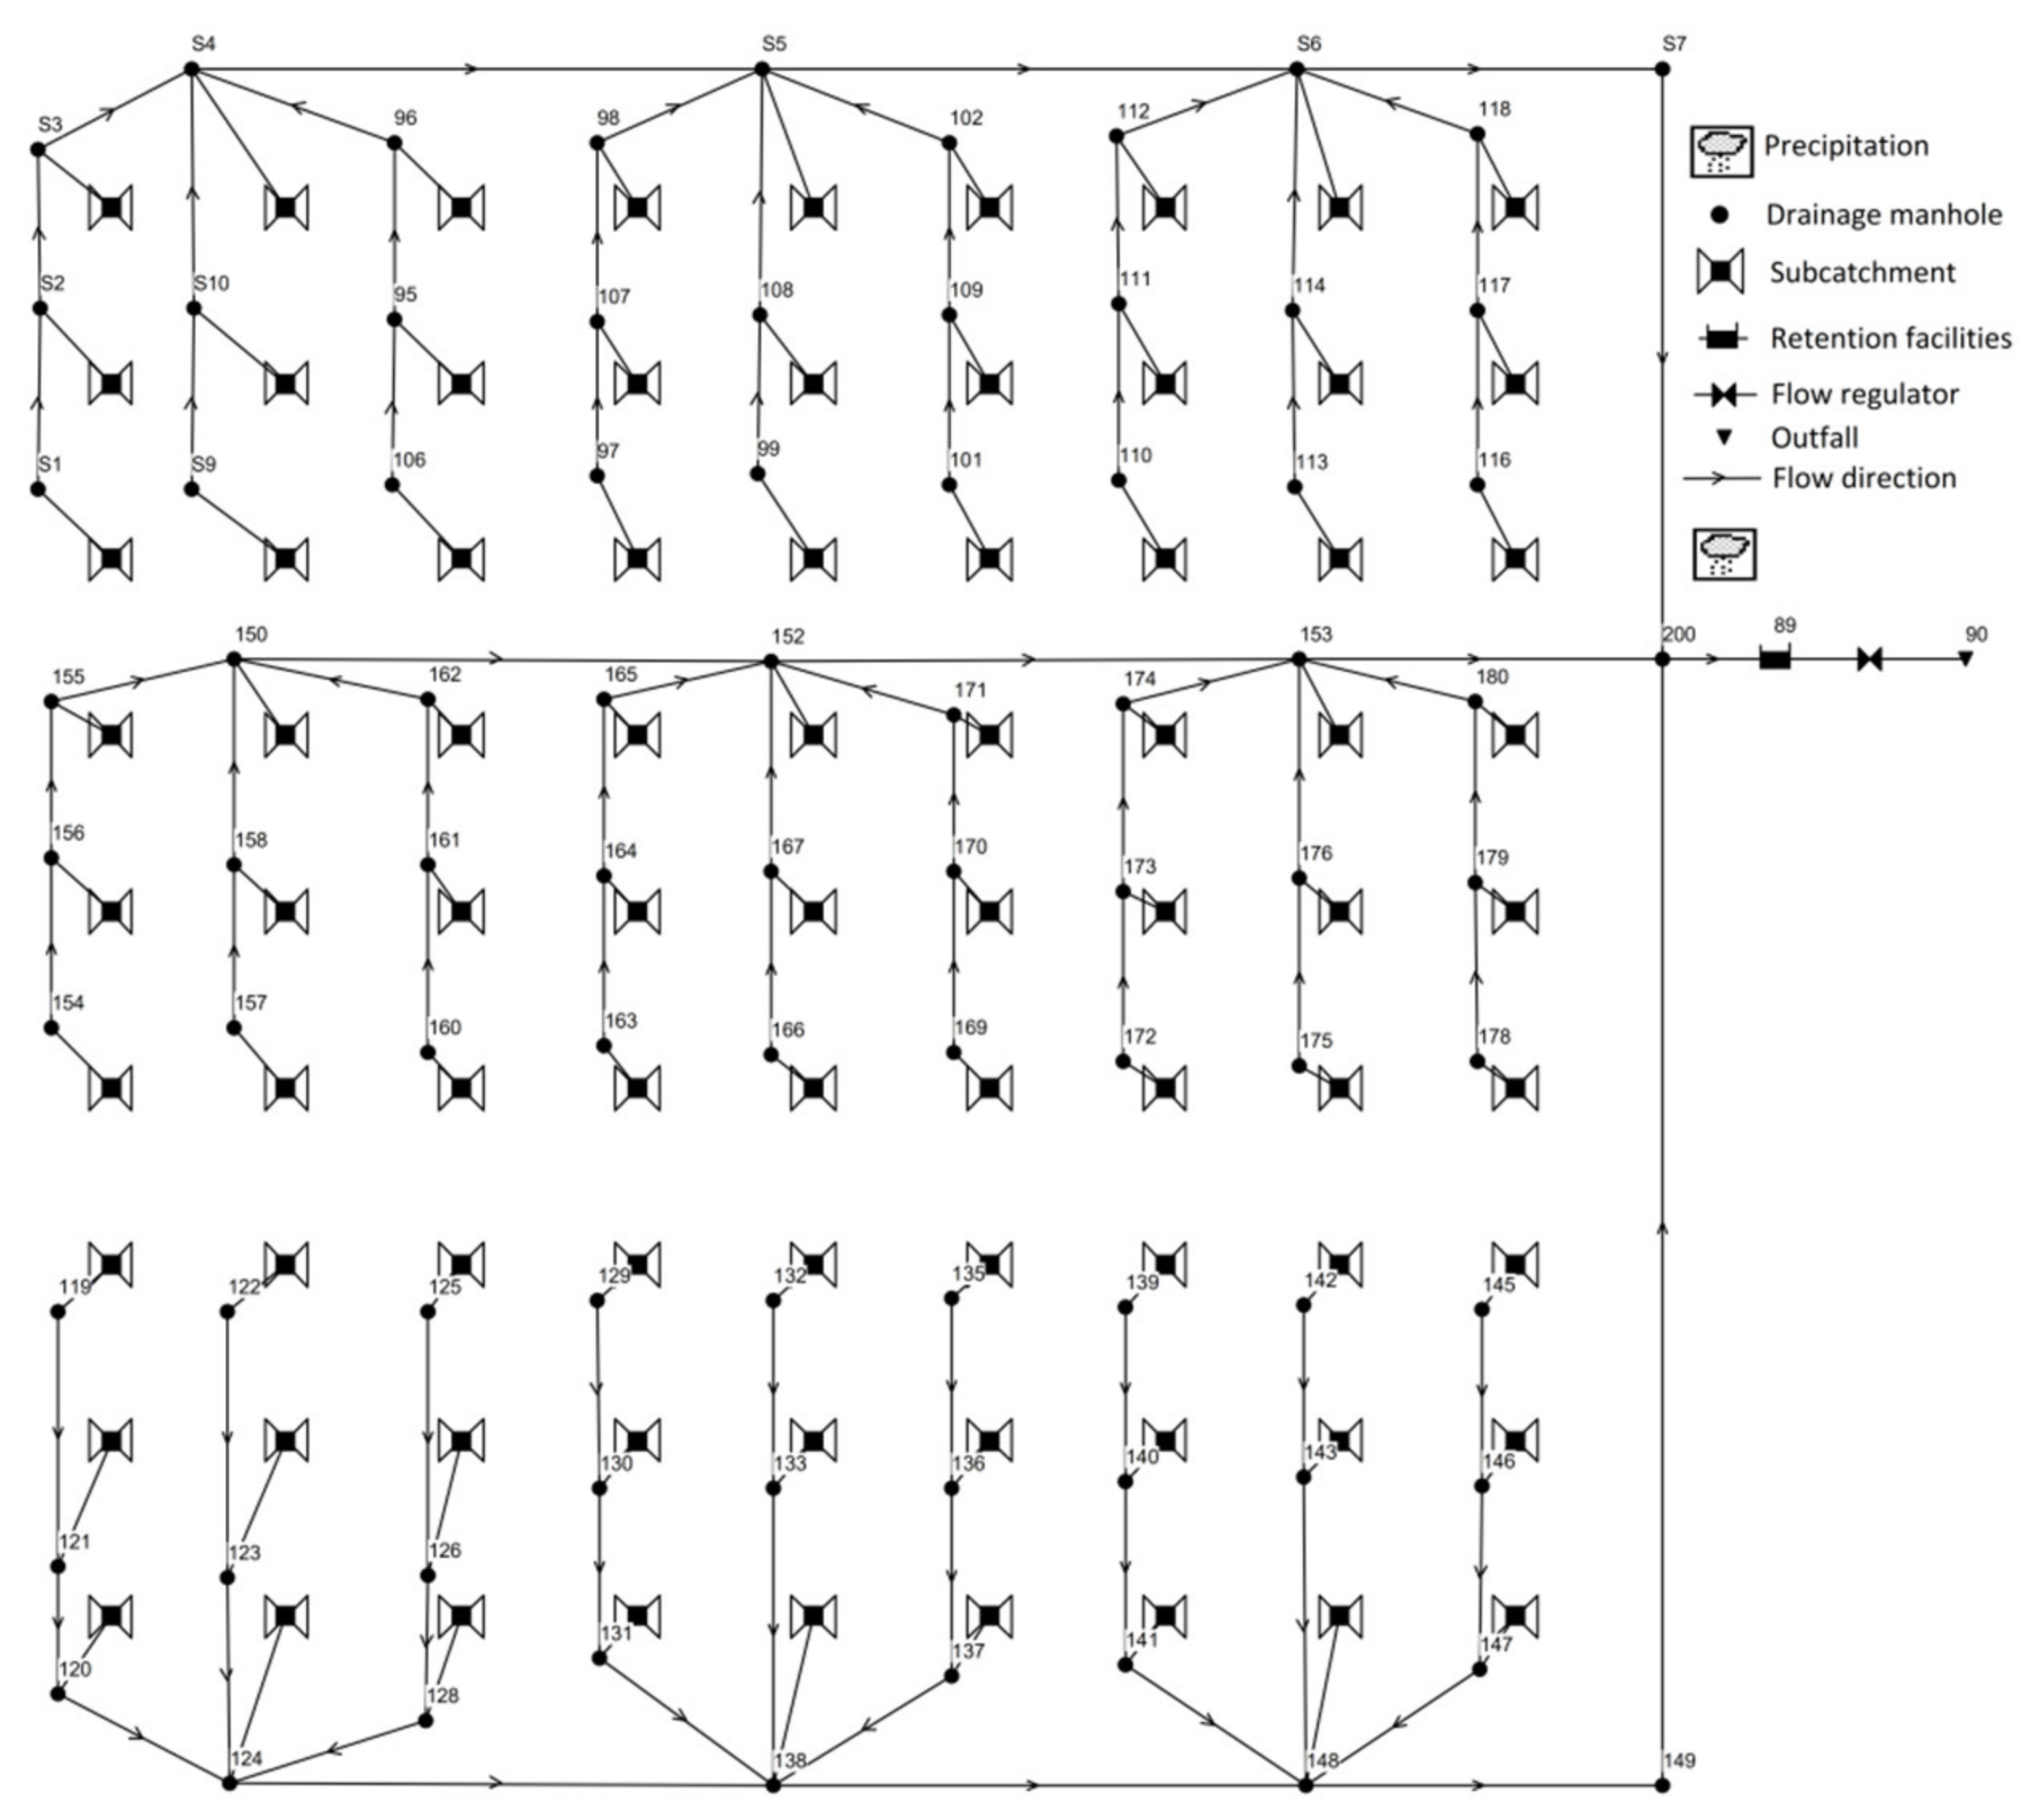
Both the construction of the catchment as well as the later simulations were executed using the 1d SWMM 5.1 hydrodynamic modelling software. On the basis of the results obtained from the DOE tool discussed in Stage 2, 27 distinct types of sewage system functioning were determined, at five different levels of flow reduction and three different retention facilities. Therefore, a total of 135 tested sewage models were prepared for each analysed retention device. A total of 405 sewage system models were developed. An example model for a 15 ha catchment is presented in Figure 6. The basic hydraulic/hydrological parameters necessary for the construction of these models are presented in Table 2, and they concerned the area of the partial catchment F, the decline of the channels, the decline of the partial catchments and the catchment load. The remaining parameters describing the catchments as having a slight impact on the necessary capacity of the retention device were adopted at the same level for each of the studied catchment systems, in accordance with the research results [37]. Their values were, respectively:
- Run-off coefficient 0.5;
- Infiltration model Horton;
- Depth of depression 0.05 m;
- The catchment width was in each case determined as the doubled length of the channel belonging to the catchment area.
During the construction of the retention facility models, the constant explained in the retention facility model (Stage 1) was described; it concerned the filling of the channel with rainwater. Considering the fact that the individual catchment systems were characterised by different hydraulic parameters, the channel diameters were selected individually for each system so as to retain similar channel retention parameters. The study assumed that the channel diameter would be selected so that, at the maximum flow rate, the ratio between the flow (Qrz) and the maximum possible flow (Qmax) that could be transported remained in the range 0.75–0.8. This parameter is described in the SWMM programme as Capacity.
A similar determination of a constant parameter was required during the hydrodynamic simulations. In this case, it was necessary to determine the filling of the reservoir. Numerous studies have shown that the capacity of a retention reservoir depends on the maximum design filling level in the reservoir [10,11,13,23,37,40]. The present study assumed the maximum design filling in the tank of 1.8 m (+/− 5 cm) for a single- and multi-chamber facility. However, for the facility using channel retention, the maximum filling in the reservoir was equal to the diameter of the inlet channel to the reservoir. The main purpose of these simulations was to determine the necessary (critical) capacity of the retention facility.
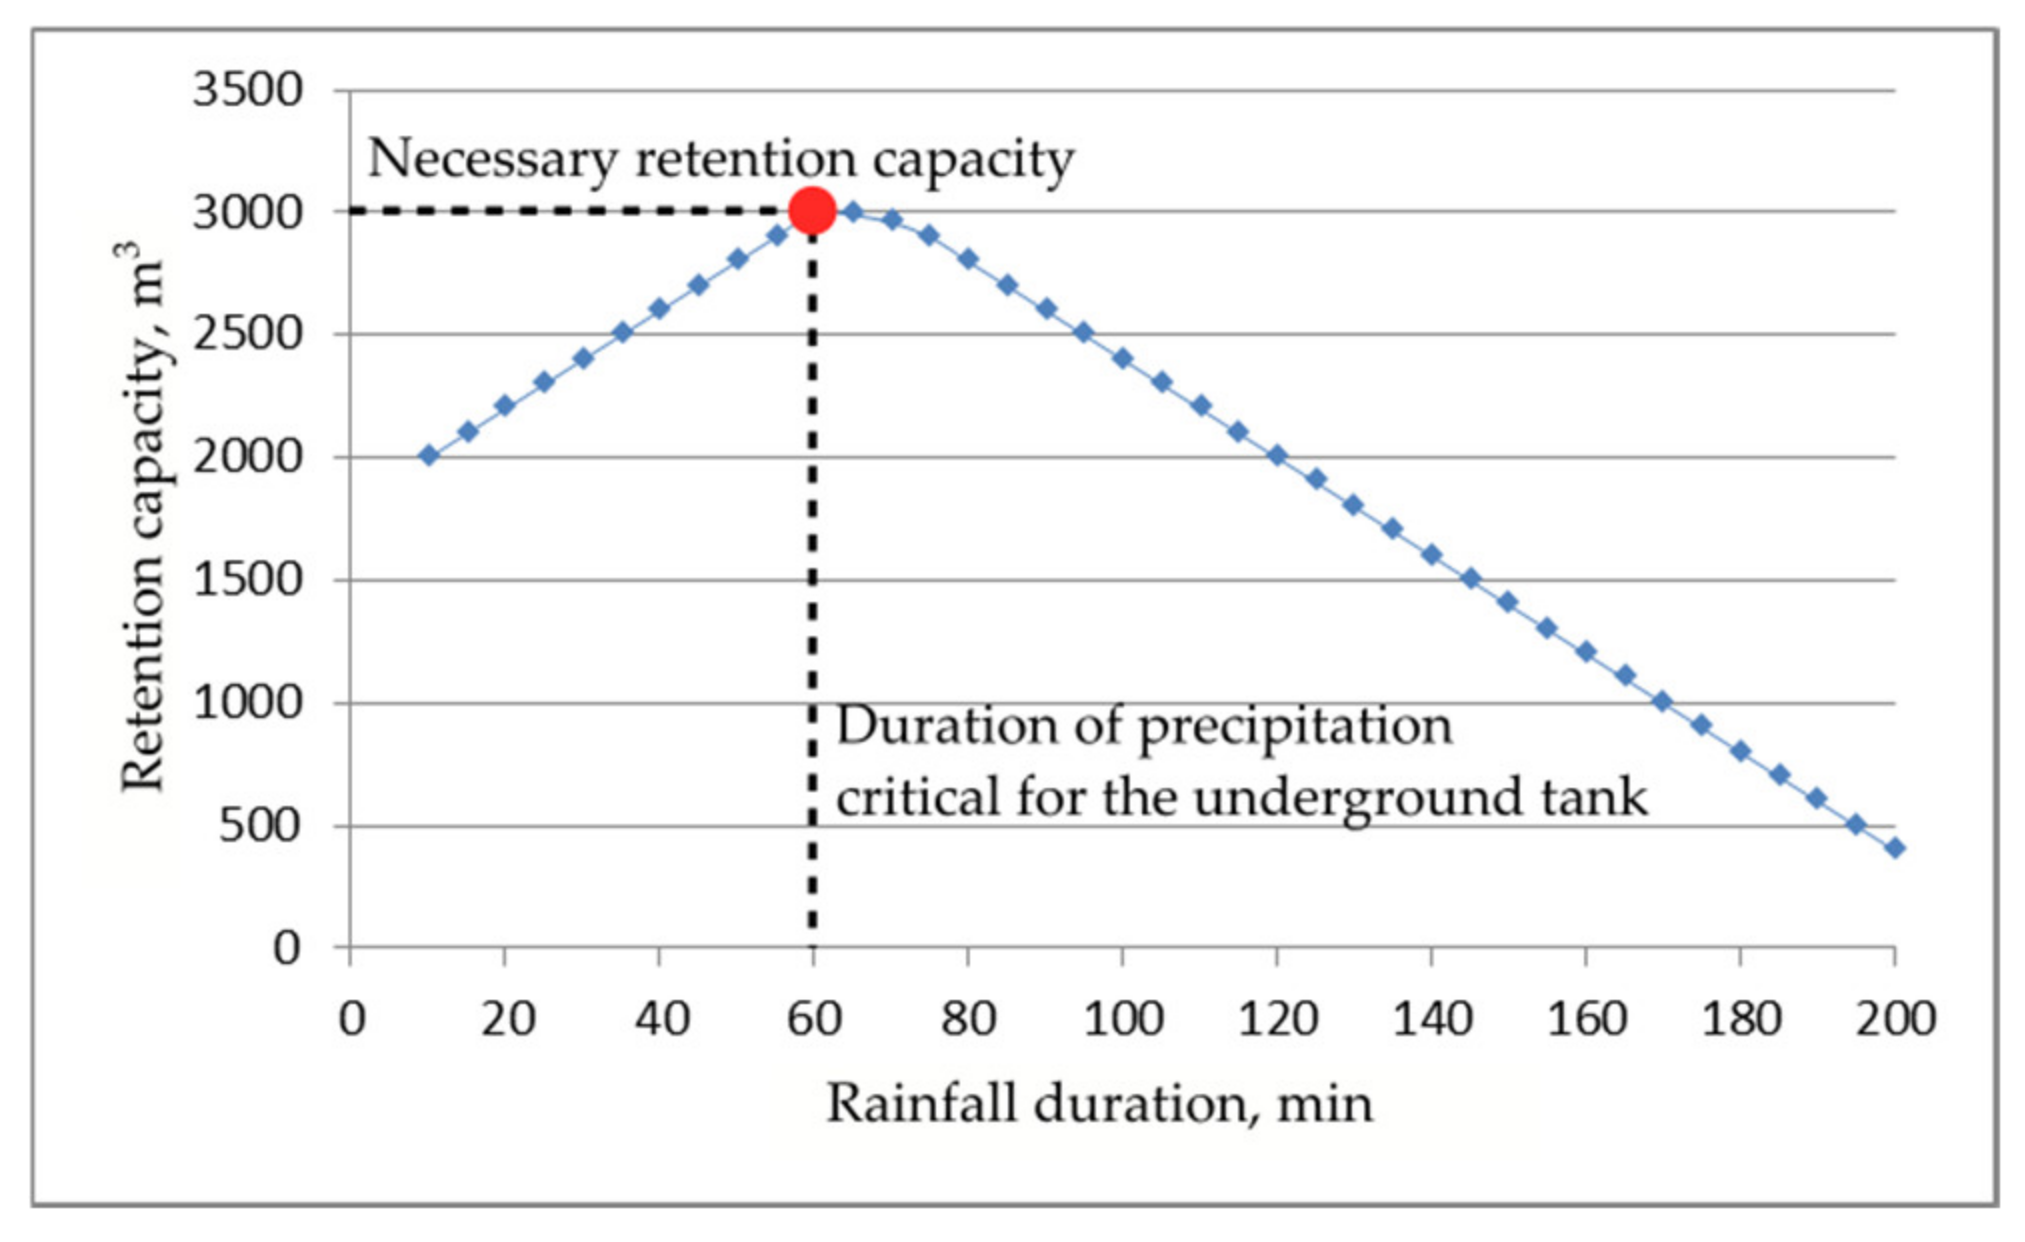
The dimensioning of a cubature object in sewage systems is based on the analysis of the critical duration of rainfall, in which the reservoir has the highest retention capacity, Vu. For this reason, the simulations were carried out for different rainfall durations, from 10 to 200 min. An example of estimating the critical duration and the corresponding necessary retention capacity is shown in Figure 7.
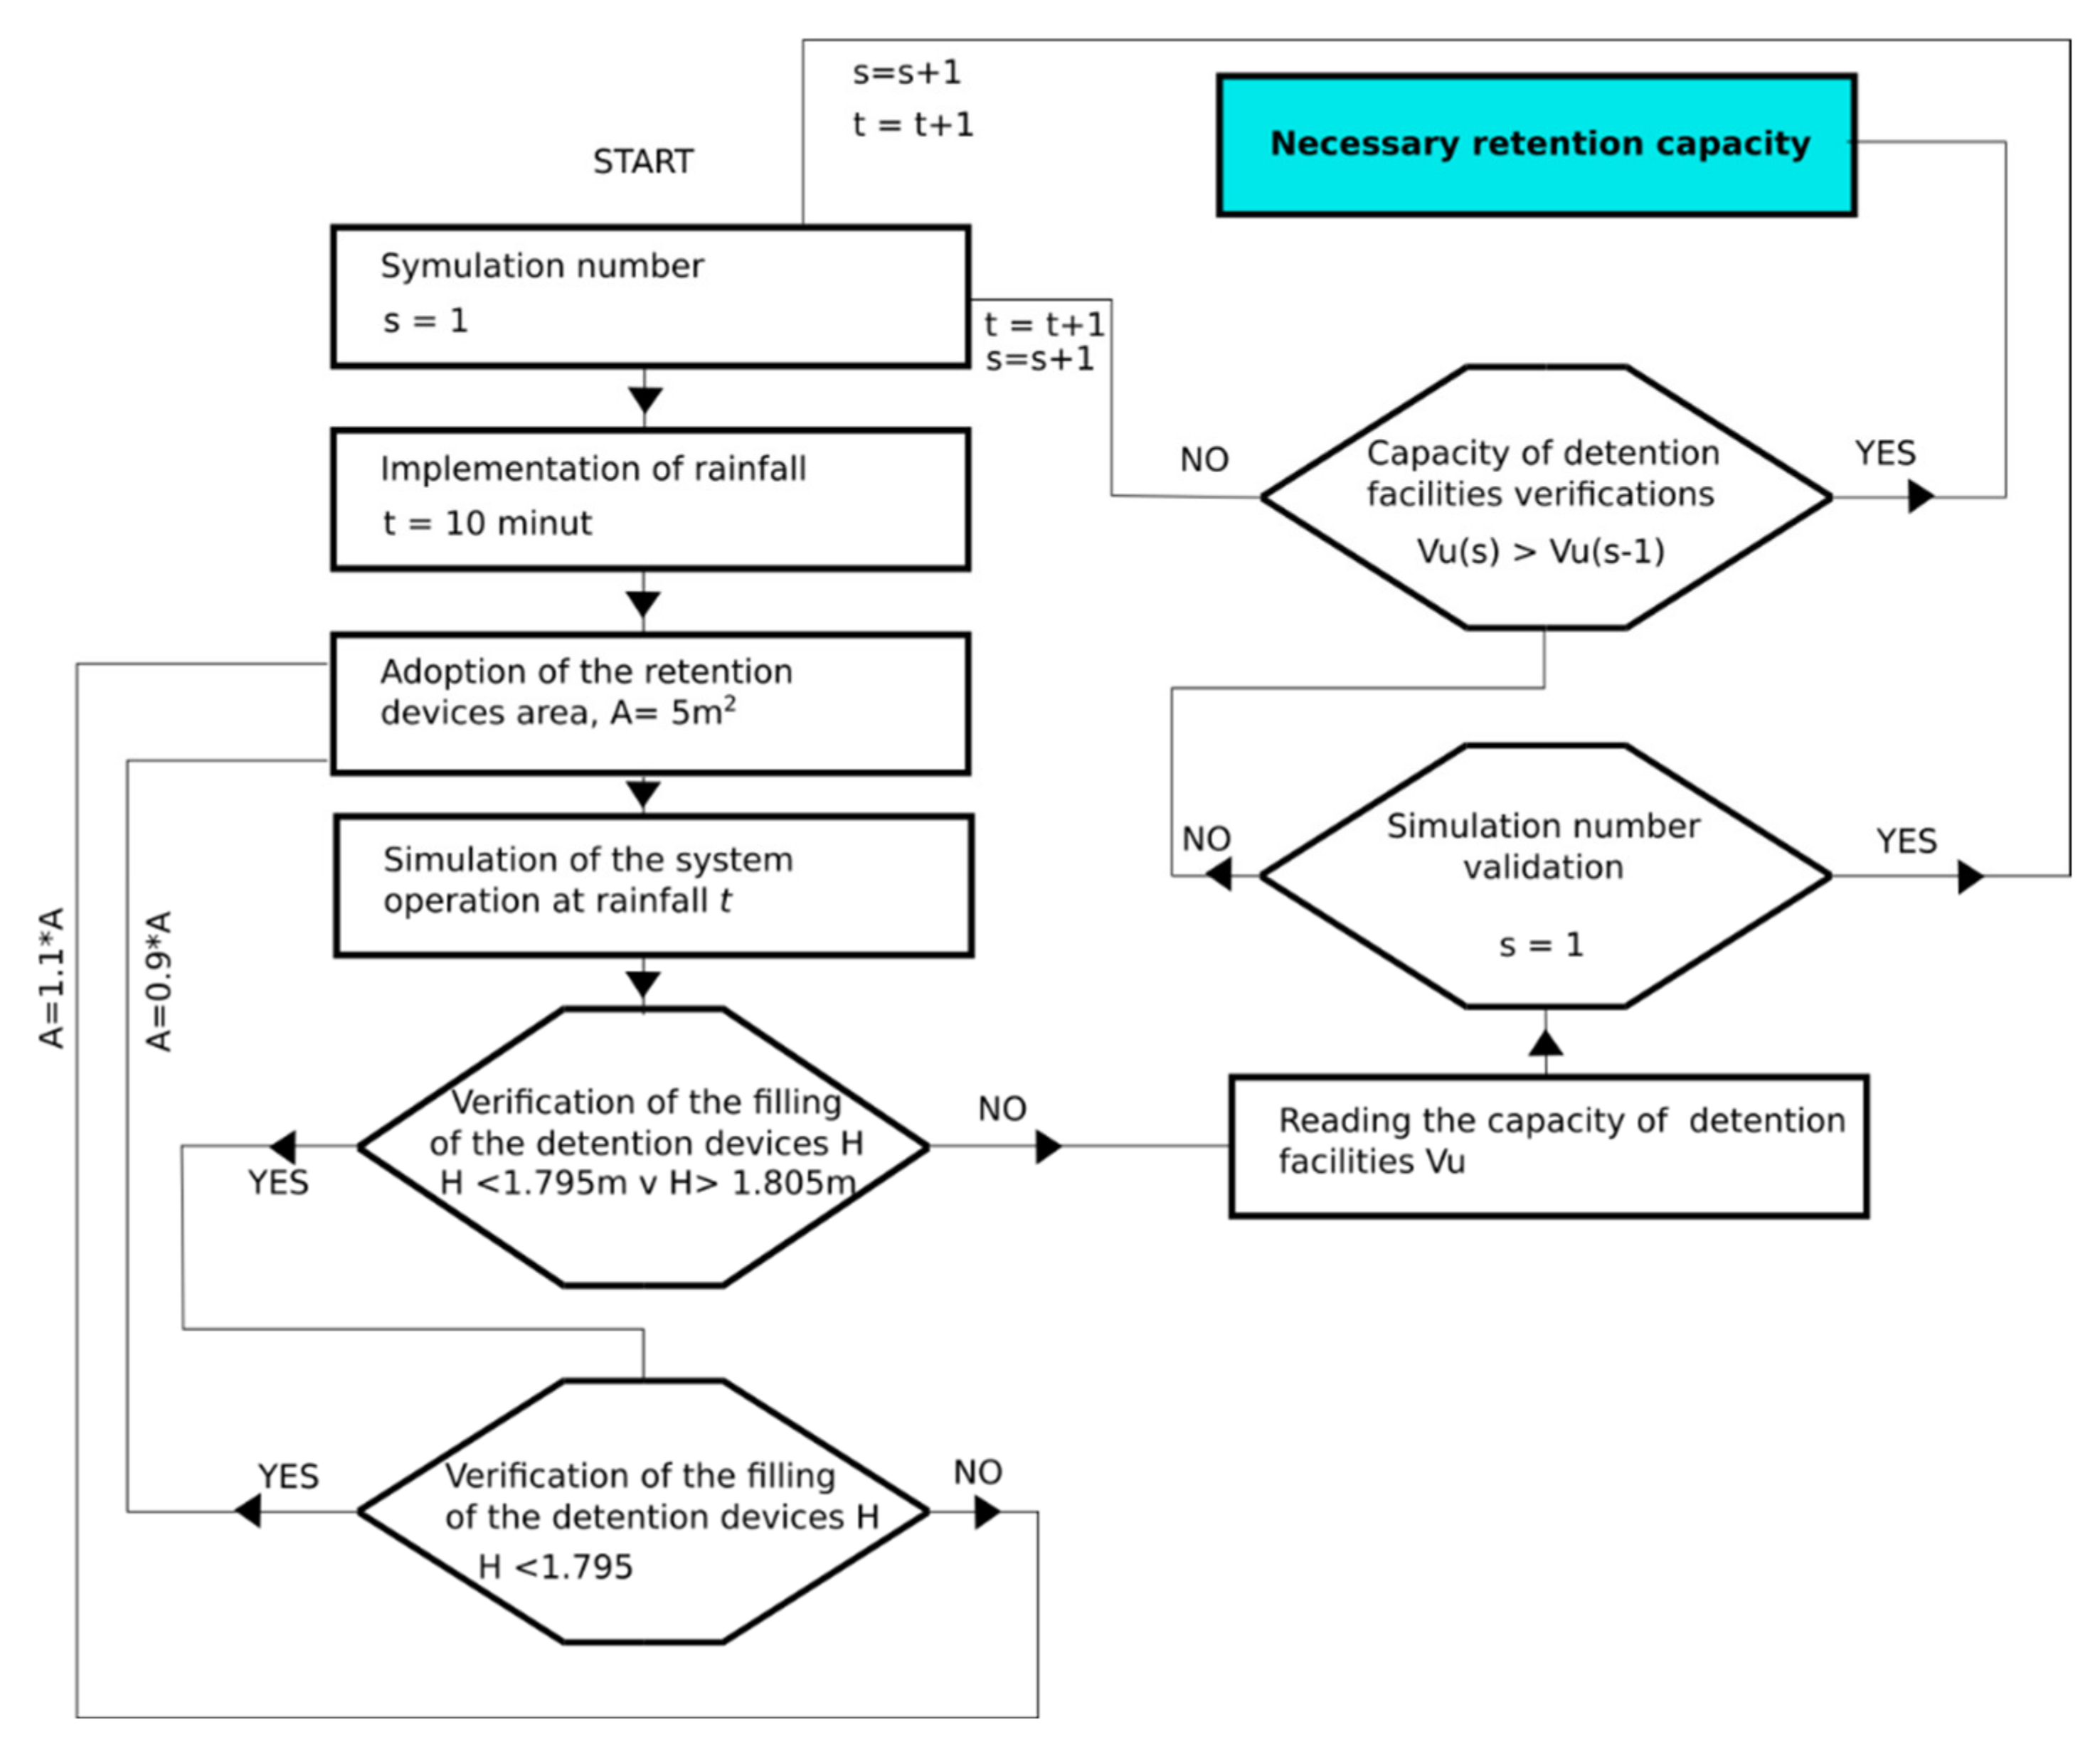
Simulations aimed at obtaining the necessary capacity of the retention facility for classic and modified multi-chamber reservoirs were carried out in accordance with the algorithm presented in Figure 8. In the case of a reservoir using channel retention, only the condition of filling the retention facility was changed, the maximum value of which was determined by the diameter of the channel on which it was installed.
2.5. Stage 5
The last study stage focused on the search for relationships capable of explaining the hydraulic efficiency of individual retention devices functioning in the specified local conditions. However, due to the complexity of the phenomena, artificial neural networks (ANNs) were selected as the most favourable tool aiding their development.
An artificial neural network was generated with the use of Statistica software. The data obtained during Stage 4 were entered into the program, followed by use of the artificial neural network creator to define the settings concerning the division of the collected data into:
- Test data—70% of all data;
- Training data—15% of all data;
- Validation data—15% of all data.
The neural networks obtained via the creator were subject to a selection process, during which one network was selected, characterised by the lowest error value and the highest matching value. During the creation of the artificial neural network, a total of 405 system configurations were analysed. At the same time, the obtained artificial neural network was used to develop the model sensitivity analysis.
3. Results
3.1. Results of and Discussion on the Scope of Hydrodynamic Modelling
As stated in the study methodology, for the purpose of the simulation, sewage systems models were developed that worked in conjunction with three different retention devices:
- A single-chamber reservoir;
- A modified multi-chamber reservoir;
- A reservoir using channel retention.
The prepared study design (DOE) indicated the necessity of constructing 27 different catchment parameter sets (Table 2) in relation to five values of flow reduction coefficient ß. For one retention device, a total of 135 results for its capacity were determined.
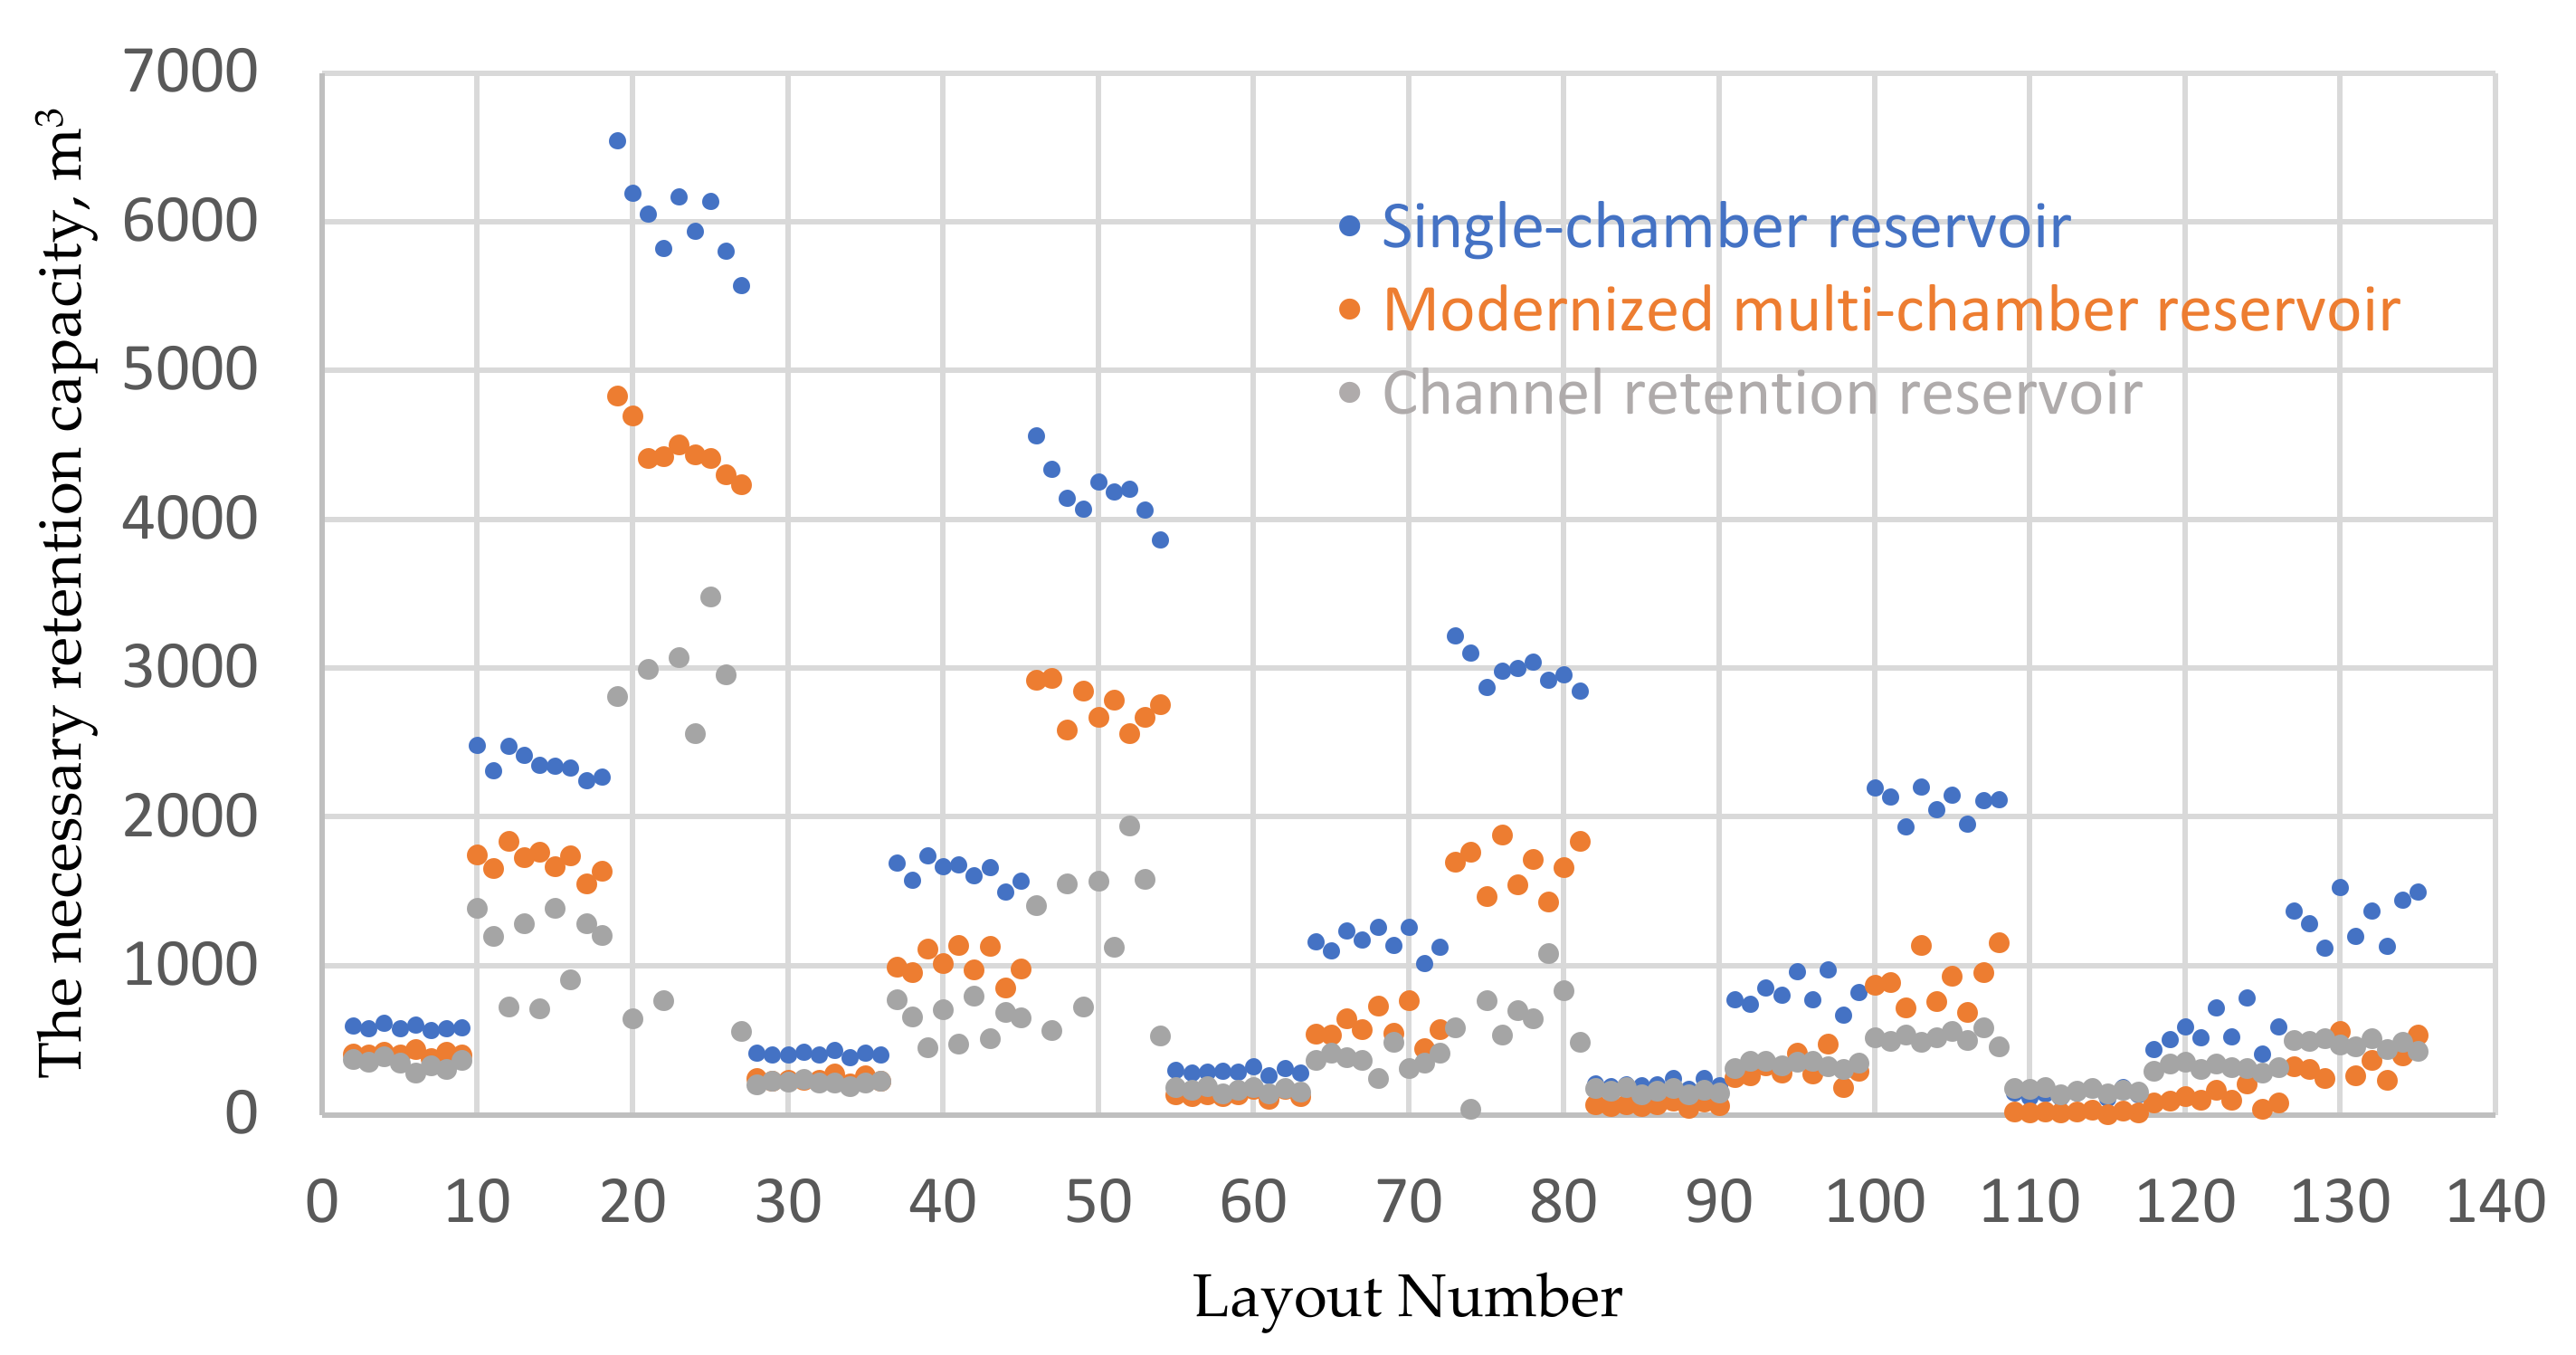
The obtained results of the necessary retention capacities of all three analysed solutions are presented in the aggregate graph in Figure 9. To improve readability, the data were marked with the values of the ß reduction coefficients. The order of the data on the x axis stems from the developed design. Example data sets for the randomly selected systems 1, 54, 72, 89 and 125 are presented in Table 3. The complete data list is presented in the Supplementary Materials Table S1. The necessary capacity in the study was the securing of such capacity of the retention device (functioning with a certain degree of flow reduction ß) so that no accumulation occurred in the drainage channels, resulting in an overflow from the system into the catchment area.
The greatest difference in the necessary retention capacity Vu between the standard reservoir and the channel retention reservoir was observed for system 81. This system was characterised by the following hydraulic/hydrological parameters: flow reduction coefficient ß = 0.65, catchment area F = 50 ha, channel gradient = 2‰, catchment gradient = 10‰ and catchment load 5 ha/km. In this case, the use of a single-chamber reservoir required a retention capacity of 2846 m3, while a channel retention reservoir required 489 m3. The least pronounced difference was observed for system 114. This system was characterised by the following hydraulic/hydrological parameters: flow reduction coefficient ß = 0.8, catchment area F = 5 ha, channel gradient = 6‰, catchment gradient = 10‰ and catchment load 25 ha/km. In this case, the use of a single-chamber reservoir required a retention capacity of 186 m3, while a channel retention reservoir required 180 m3.
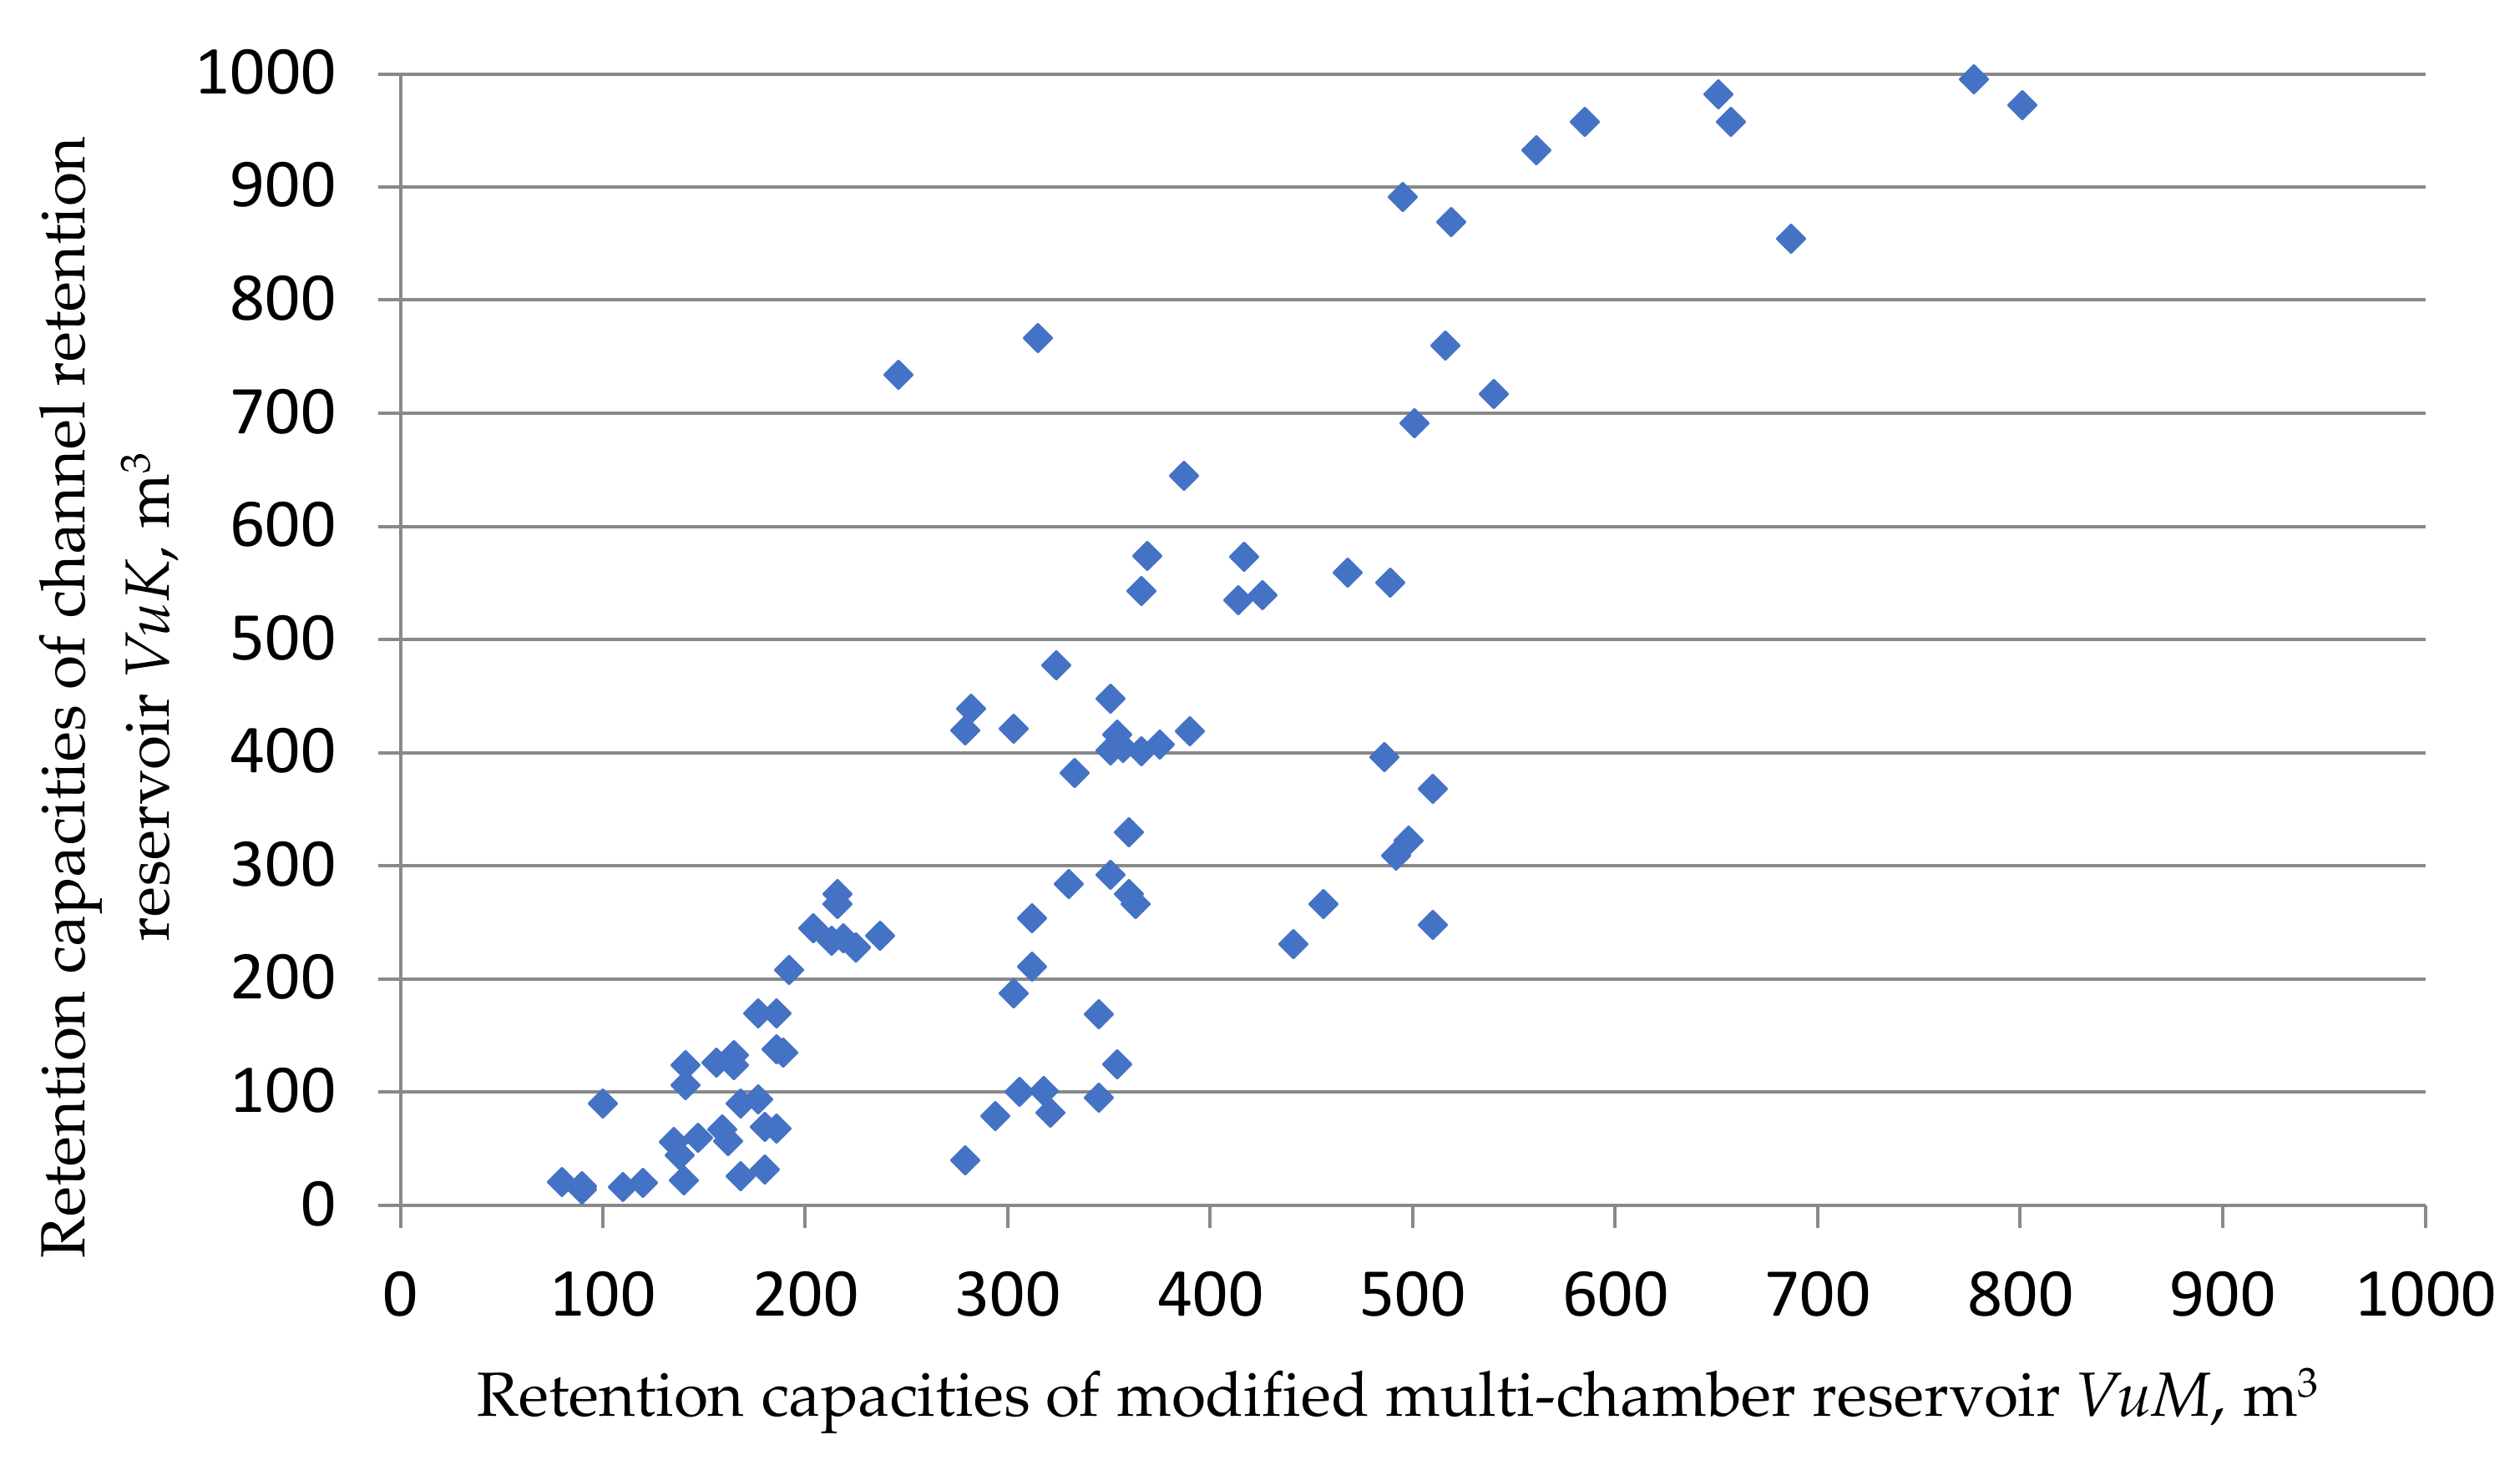
Further relationships were determined for the comparison of necessary capacities of a modernised multi-chamber reservoir (Figure 1b) with the channel retention reservoir (Figure 2). In this case, it was not possible to clearly indicate a more advantageous solution based on the data compilation presented in Figure 9, as the differences between the results were much smaller. A more detailed representation of the obtained data is presented in Figure 10, which presents the relationship between the necessary retention capacities of the modified multi-chamber reservoir VuM (x axis) and the channel retention reservoir VuK (y axis). Data in the graph were limited to reservoirs with lower capacities, not exceeding 1000 m3. The limitation of the presentation of these data resulted from the need to increase the legibility of the presented results and the fact that the benefits of using a modified multi-chamber reservoir occurred with small capacities of the device.
As presented in Figure 9, the relationship with the system’s channel retention was not more favourable for all cases. This was observed in systems:
- 55–63 (β = 0.5);
- 82–94, 96, 98–99 (β = 0.65);
- 109–129, 94, 131–134 (β = 0.08).
In these catchment systems, the modified multi-chamber reservoir capacity was lower or markedly lower than that of the channel retention reservoir. The obtained differences varied between 4.1% and 391%. However, these were systems characterised by high sewage flow reduction coefficient values. Thus, the real differences in the necessary capacities ranged between 7 and 262 m3. However, in systems with more favourable results for reservoirs using channel retention, the differences between the extreme results of the necessary capacity ranged from 1 to 4050 m3.
To conduct further assessment of these two solutions, the ϑ index was introduced (Equation (4)), explaining the ratio between the necessary retention capacity of the modernised multi-chamber reservoir, VuM, and the necessary capacity of the channel retention reservoir, VuK.
where VuM is the necessary retention capacity of the modernised multi-chamber reservoir, m3, and VuK is the necessary retention capacity of channel retention reservoir, m3.
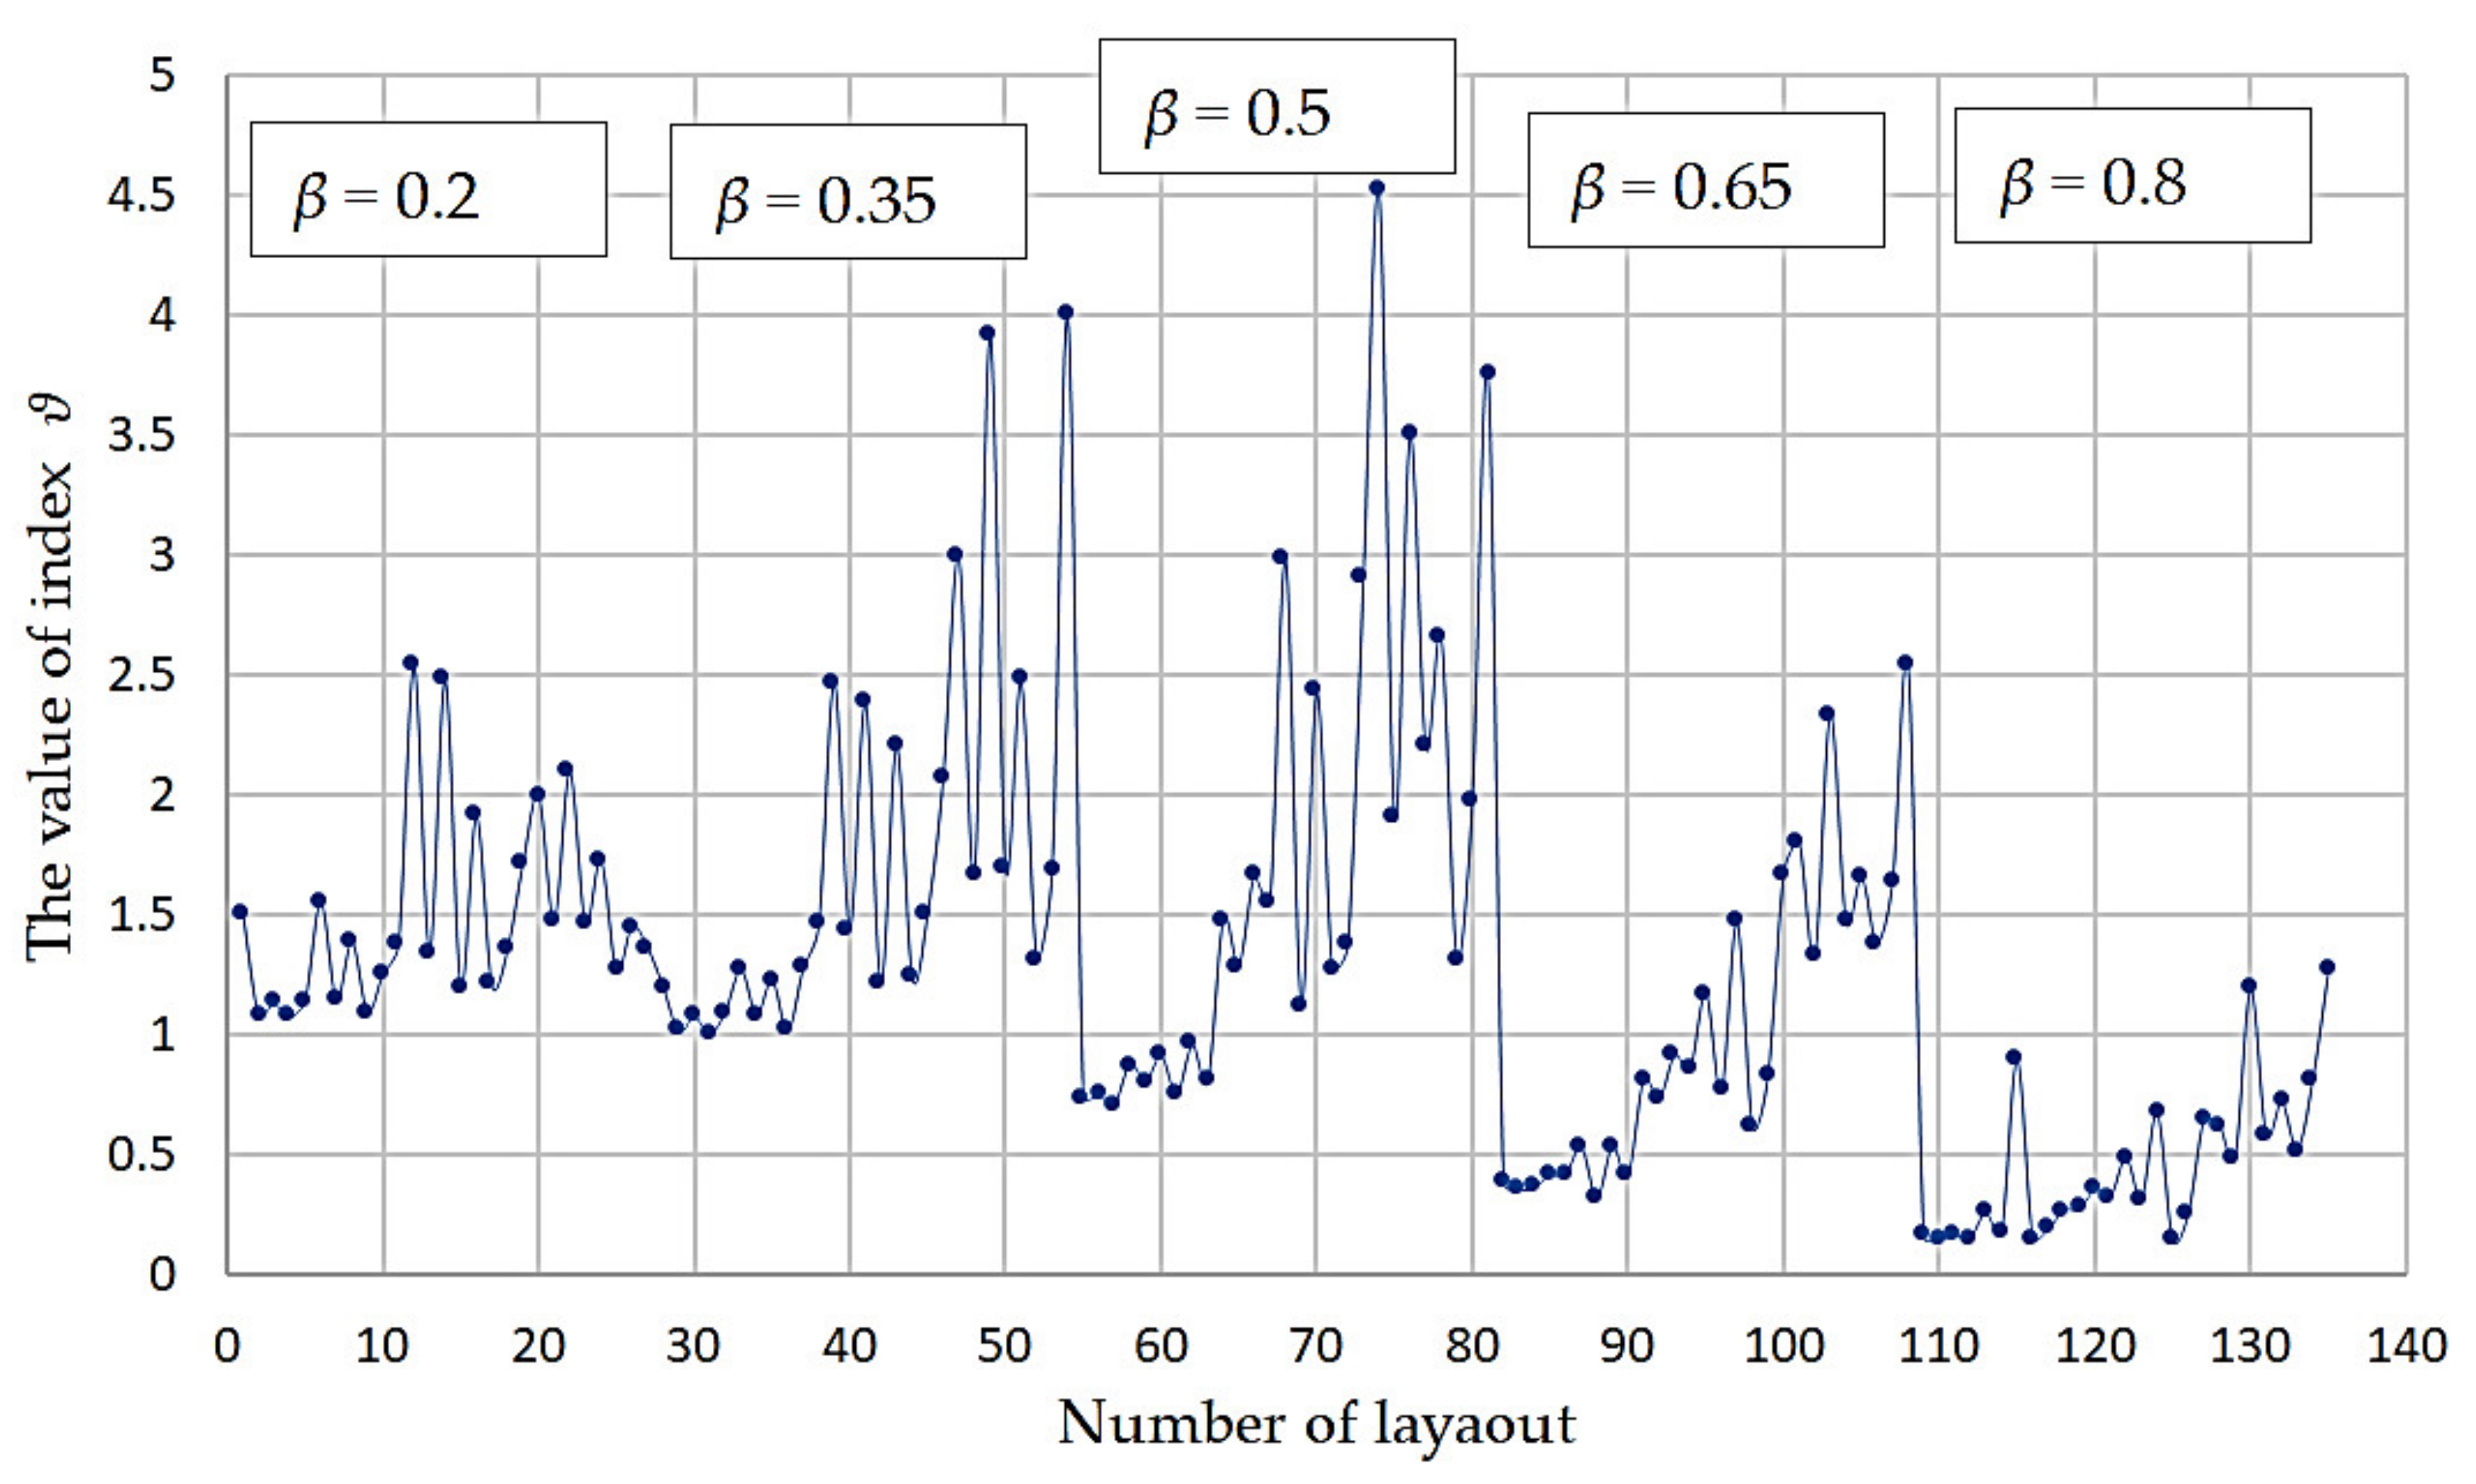
The obtained values of the ϑ index are listed in Figure 11. Results exceeding 1 indicated higher retention efficiency of the channel retention reservoir. Values lower than 1 indicated higher efficiency of the modernised multi-chamber reservoir.
The presented data show that for lower values of the reduction coefficient, β = 0.2 and β = 0.35 (systems from 1 to 54), the channel retention device was characterised by higher retention efficiency in every case. This is corroborated by index ϑ, which exceeded the value of 1 in each case. The lowest value of the index in this scope was observed for system 31, at 1.004, whereas the highest was for system 54, at 3.98.
The results for the higher sewage flow reduction coefficient β values from 0.5 to 0.8 differed (systems 55 to 135). In this group of results, there was an unambiguous trend indicating a correlation between coefficient β and the number of systems in which the value of index ϑ was lower than 1.
Starting with the systems characterised by a reduction coefficient β = 0.5, there were nine systems (systems 55 to 63) in which the modified multi-chamber reservoirs were more efficient. In turn, in the group of systems characterised by β = 0.65, in 16 out of 27 cases, a higher efficiency characterised the modified multi-chamber reservoir. The trend was also maintained in the group of systems characterised by the reduction coefficient β = 0.8. Only in two cases (systems 130 and 135) was the channel retention reservoir characterised by a higher efficiency. The lowest value of index ϑ was observed for system 125, at 0.14, whereas the highest was for system 74, at 4.53.
3.2. Results of and Discussion on the Scope of Efficiency of Sewage Retention Reservoirs
As shown in the study design, the subsequent stage consisted in the development of an assessment tool for the retention efficiency assessment for individual solutions of retention reservoirs under different hydraulic sewage system conditions and hydrological catchment conditions. For this purpose, the results obtained and presented in the previous section and artificial neural networks (ANNs) were used. As the basic assessment criterion for the validity of using a specified retention device solution, efficiency index ζ was proposed; see Equation (5).
where VuS is the necessary retention capacity of a single-chamber reservoir, m3, and VuK the necessary retention capacity of a channel retention reservoir, m3.
This index explained the ratio between the necessary retention capacity of a single-chamber reservoir VuS and the necessary capacity of the channel retention reservoir VuK. Due to the diversity of the hydraulic parameters assumed for the sewage systems, a neural network enabling quick verification of index ζ was created. With the use of the Statistica software, a neural network with MLP 6-7-1 architecture was selected, with six neurons in the input layer, seven in the hidden layer and one in the output layer. The parameters of the developed network are listed in Table 4 and the obtained PMML code in the Supplementary Materials (Neural network PMML code of ζ index).
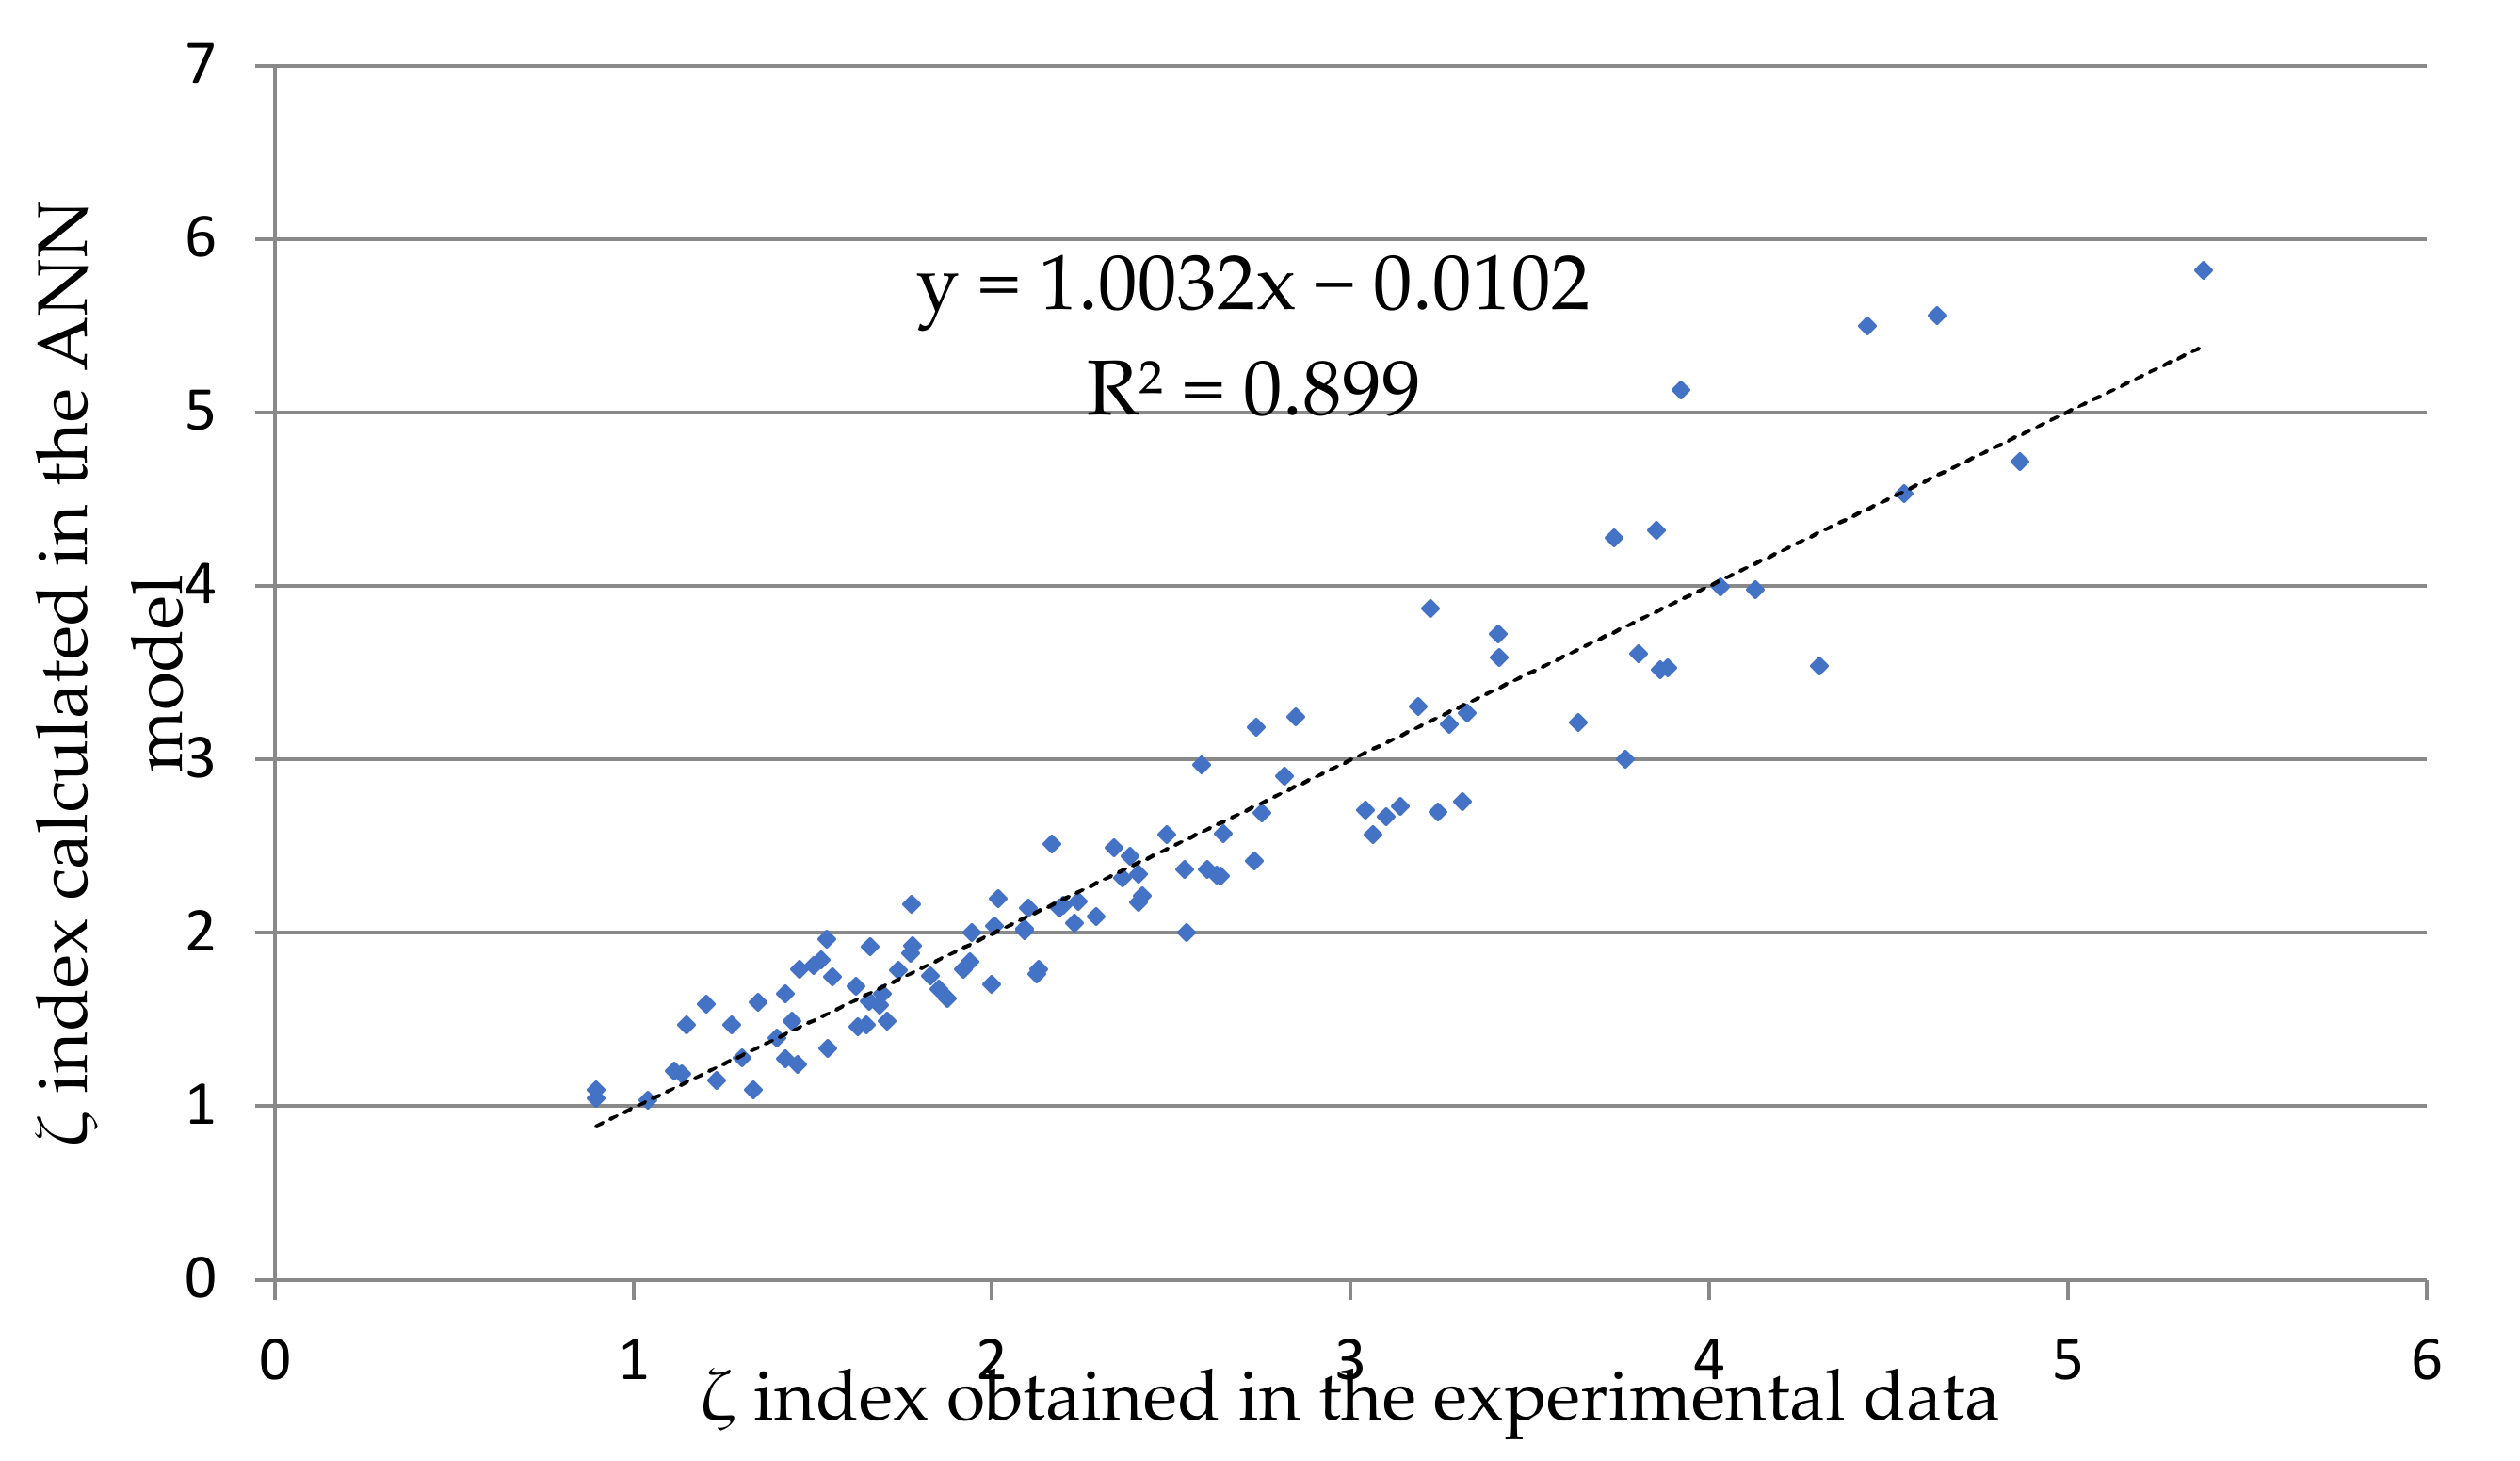
Based on the results of the simulation tests and those calculated with the use of neural networks, it could be concluded that the described model of the artificial neural network was characterised by high accuracy. This is presented in Figure 12, which summarises the expected values of index ζ obtained from computer simulations and the values obtained using the developed model of an artificial neural network.
The conducted analysis enabled the determination of the values of slope a, at 1.0032, and the parameter b, of 0.0102. The value of the determination coefficient R2 was 0.899, which indicated a good linear relationship between the expected values and those obtained from the model.
Global sensitivity analysis was executed for the developed artificial neural network (ANN). This analysis aimed to determine in what proportions the input parameters of the model affected the result of the efficiency index ζ. Results of the analysis are listed in Table 5.
The results from the global sensitivity analysis confirmed that one of the most significant parameters affecting the high values of the efficiency index ζ was flow reduction coefficient β. The value of the sensitivity coefficient for this parameter was 19.05. However, the highest value characterised the sensitivity coefficient for the level of outflow rate from the reservoir, at 25.1. Equally high values characterised the sensitivity coefficient for the catchment area F. As part of the study, the efficiency coefficient ϑ, described by Equation (4), was also introduced. By determining the value of this indicator using the developed artificial neural network, it is possible to quickly justify the choice of a highly efficient solution, i.e., a reservoir using canal retention or a modified multi-chamber reservoir. In this study, in Section 3 (Figure 9, Figure 10 and Figure 11), it was confirmed that the use of channel retention is not justified in all conditions. In many cases, the retention efficiency of these solutions is lower than when using modified large-chamber reservoirs. Therefore, in order to evaluate these solutions, the effectiveness indicator ϑ was proposed as the basic criterion for assessing the legitimacy of using this solution of the retention device. Similarly to the assessment of the retention efficiency of modified multi-chamber reservoirs using the Statistica software, a neural network was selected. The most favourable network was the MLP 6-6-1 architecture, with six neurons in the input layer, six in the hidden layer and one in the output layer. The parameters of the developed network are listed in Table 6 and the obtained PMML code in the Supplementary Materials (Neural network PMML code of ϑ index).
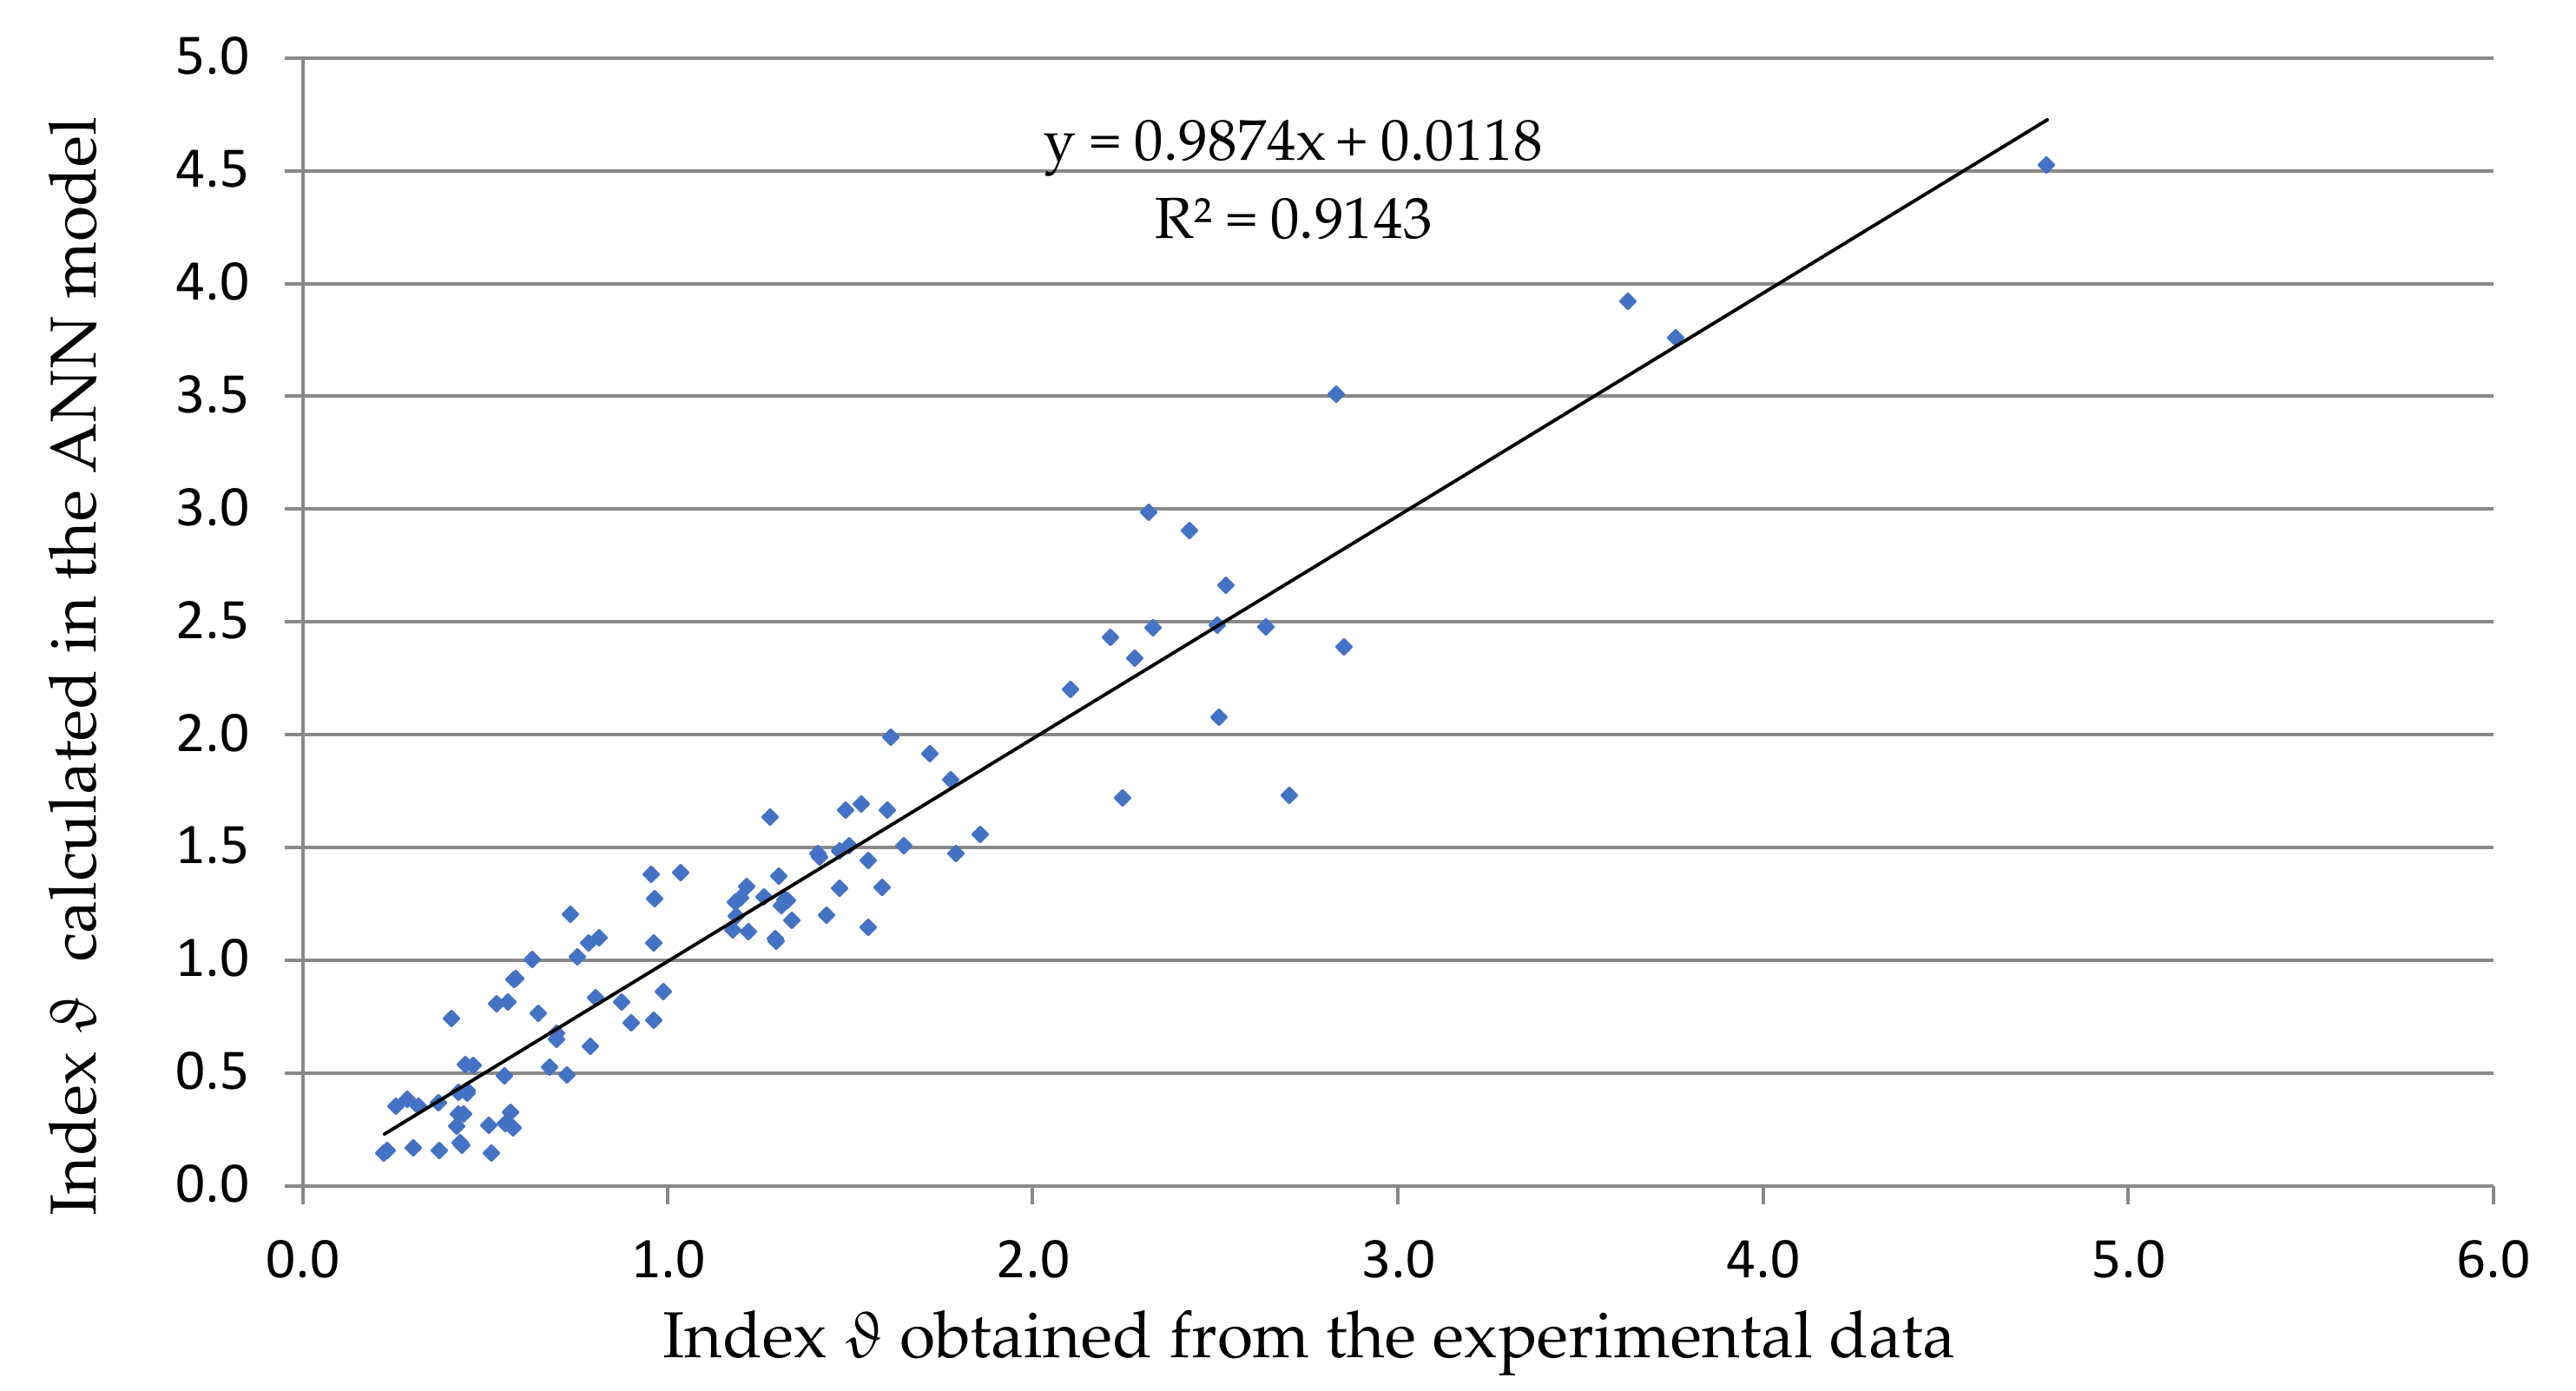
Based on the results of the simulation tests and those calculated with the use of neural networks, it could be concluded that the described model of the artificial neural network was characterised by high accuracy. This is presented in Figure 13, which summarises the expected values as index ϑ obtained from computer simulations and the values obtained using the developed model of an artificial neural network.
The conducted analysis enabled the determination of the value of slope a, at 1.0032, and the parameter b, of 0.0102. The determination coefficient R2 reached a value of 0.899, thus indicating a good linear relationship between the expected values and those obtained from the model.
Global sensitivity analysis was applied to the presented artificial neural network. This analysis aimed to determine in what proportions the input parameters of the model affected the result of efficiency index. Results of the analysis are listed in Table 7.
The results obtained from the global sensitivity analysis show that the most important parameters influencing the high values of efficiency index ϑ were the outflow rate value from the reservoir, the flow reduction factor β, the catchment area F and the catchment gradient. As was the case with index ζ, obtaining the greatest benefits related to the use of devices in conjunction with channel retention in comparison to the modified multi-chamber reservoirs occurred for large retention facilities.
4. Discussion
The first planned research goal was to compare the necessary capacities of the retention devices. The research material provided shows that operating under the same hydraulic/hydrological conditions of the catchment area and the drainage system, the capacity of classic single-chamber reservoirs is higher by 3.33% to 582.00% compared to reservoirs that use canal retention. Additionally, of the 135 variants tested, only in 4 cases was the difference less than 10%.
Other relationships were established when comparing the necessary capacities of the modernised multi-chamber reservoir (Figure 1b) with the device using channel retention (Figure 2). In their case, it cannot be unequivocally stated that sewer retention will always be characterised by a smaller necessary retention capacity because it depends on the hydraulic parameters of the catchment area and the drainage system with which they are to cooperate. Therefore, a broader review of the results obtained for 135 tested systems of various values of hydraulic and hydrological parameters was made (these parameters are summarised in the Supplementary Materials Table S1). In 85 out of the 135 cases, higher capacities were obtained for the modernised multi-chamber device and they were greater than for reservoir using channel retention from 0.40% to 392.00%. However, in the remaining 50 systems, higher retention capacities were obtained for the reservoir using channel retention. The use of this device in the 50 indicated systems implies the need to provide a higher retention capacity, from 4% to almost 636.66%.
Similar studies were carried out by Dziopak [27,29]. The aim was to show the benefits of using multi-chamber devices. In his research, he relied on a comparison of a classic tank with a multi-chamber tank containing a flow chamber with a significant capacity. The results of his research show that by using modernised structures containing flow chambers, the required tank capacity can be reduced by even two times. The research conducted by the author of this article not only confirmed this thesis but also showed that using more advanced retention facilities, in the most favourable cases, the required capacity can be reduced by even six times.
In the second defined goal of the investigation, the objective was to determine in which hydraulic/hydrological parameters of the catchment area it is more advantageous to use a given solution of the retention device. Taking into account the research results presented (Figure 9), it can be concluded that the use of single-chamber reservoirs to counteract the overflow of rainwater from the drainage system is the least effective solution. The presented data show that, regardless of the adopted hydraulic parameters of the catchment area and the sewage system (that is, for each tested data system), the most unfavourable results were obtained for a single-chamber reservoir (Figure 1a). In each case, this solution was characterised by the necessity to provide a greater retention capacity than in the case of the modernised multi-chamber reservoir and the device using channel retention. In the entire range of data uniformity analysed, the capacity of 33 tanks was large by up to 582%. Additionally, out of 135 variants tested, only in 4 cases was this control localised more than 10%. Taking into account the research results presented (Figure 8 and Figure 9), it can be concluded that the use of single-chamber reservoirs in order to counteract the overflow of rainwater from the sewage system is the least effective solution. However, the selection of more advanced solutions in the form of reservoirs using canal retention and modified multi-chamber reservoirs depends on the hydraulic and hydrological parameters of the sewage system.
As indicated by the research results, in the largest number of cases (85 of 135), a device using canal retention was a more advantageous solution. The benefits associated with its use were mainly correlated with the value of the wastewater flow reduction coefficient β and the catchment area affecting the wastewater flow rate. The research established that the lower the β flow reduction coefficient the retention facility has, the more often the more favourable solution is to use channel retention in cooperation with the retention reservoir. At higher values of this coefficient, resulting in a greater amount of sewage discharged into the receiver, deliberate accumulation of sewage in the channels causes the opposite effect, but not in every case.
In the work [37], the degree of influence of the wastewater flow reduction factor β on the functioning of the retention devices was also observed. In this research, the authors simulating the functioning of classic reservoirs with various rainfall events showed that this parameter determines the capacity of the retention reservoir and the way of its functioning to the greatest extent. A similar opinion was expressed by Szeląg et al. [45], who noticed the same relationship when designing tubular tanks. The influence of hydraulic parameters of the sewage system was also observed in the work of Dziopak [46], who analysed various aspects of the functioning of the sewage system. He noticed the possibility of the interchangeable use of reservoir devices with sewer retention, for example, by using retention canal solutions. However, in these studies, the use of such solutions was shown to be beneficial only under certain hydraulic/hydrological conditions of the functioning of the drainage system.
Taking into account the fact that at higher values of the flow reduction factor β, the selection of the device that requires the lowest retention capacity is closely related to the values of the hydraulic/hydrological parameters of the catchment and the sewage system, efficiency indicators were proposed. Therefore, they were the most important part of the third research objective. The proposed efficiency indicators allow to quickly assess whether, in the given local conditions, the retention potential of the drainage system is so high that it will allow for a significant reduction in the capacity of the retention reservoir or if it is insufficient and requires the use of conventional solutions of retention reservoirs. The research proposed indicators ζ (Equation (5)), which describe the ratio of the necessary capacities of a classic reservoir to the device using canal retention, and the detailed indicator ϑ (Equation (4)), which describes the ratio of the necessary capacities of the modified multi-chamber reservoir to the device using canal retention. In both cases, artificial neural networks were built to determine them, obtaining high matching coefficients.
The neural networks obtained will constitute the basis for the development of the problem of assessing the effectiveness of various retention solutions. They are a tool for a quick assessment of the value of performance indicators determined by machine learning. They will help identify the most favourable solution depending on the hydraulic/hydrological parameters of the catchment area and the sewage system in which it is to operate. This is confirmed by the research presented in [23]. The results of these studies confirm the possibility of using artificial neural networks to estimate the necessary retention capacity of reservoirs. The neural networks developed were also used to perform sensitivity analysis, which confirmed the conclusions drawn about the influence of the hydraulic parameters of the catchment area and the sewage system on the selection of the retention device. On this basis, it was concluded that the greatest benefits associated with the use of devices cooperating with canal retention occur with large retention facilities. This is due to the large area of the F catchment area, which generates high values of wastewater inflow into the reservoir with a simultaneous significant reduction of this flow in the reservoir. The remaining parameters analysed for the catchment area and the sewage system, such as the decline in the catchment, the decline of the channel or the load of the catchment, have a much smaller impact on the result.
5. Conclusions
The progress of computational technology in the modelling of catchments and sewage networks allows the verification of the validity of the use and determination of the effectiveness of various types of retention devices, including those used in conjunction with channel retention of drainage systems.
The paper presents the results of research work on the retention efficiency of various hydraulic systems used with retention reservoirs. The study results show that in order to select a specific solution of hydraulic system for the retention reservoir, its operational efficiency must be taken into consideration, not just local terrain conditions, the former being describable by appropriate indicators. Devices with the highest retention efficiency indicators are characterised by the lowest retention capacity necessary to ensure the proper operation of the entire drainage system. The conducted study had two main objectives: firstly, a comparison of the various devices necessary to ensure the retention capacities of different reservoirs operating under the same conditions in the catchment area and sewage system, and secondly, to propose a retention efficiency index and the method for its determination, as helpful in the assessment of retention devices.
The study led to the following conclusions, both practical and cognitive:
- The standard solutions of single-chamber reservoirs, due to their simple hydraulic systems, are characterised by the lowest retention efficiency. In the analysed data range for a catchment with a sealed area of 5 to 50 ha, it was shown that in the most unfavourable case, the capacity of a single-chamber reservoir could be as much as 582% higher than that of a reservoir using channel retention.
- The use of channel retention as a buffer in conjunction with a retention reservoir in the vast majority of cases leads to a significant reduction in the necessary retention capacity of the reservoir. In the analysed data range, the use of a hydraulic system in a modernised multi-chamber reservoir in the most unfavourable case would constitute 452% of the capacity that would be considered sufficient for a reservoir using channel retention. This is particularly noticeable for low values of reduction coefficient β, and therefore large-capacity retention reservoirs, the construction of which is significantly costly.
- The use of channel retention is not to be viewed as favourable for all catchment conditions. In the case of high values of coefficient β (0.5, 0.65 and 0.8) and low values of rainwater run-off from the reservoir, modified two-chamber reservoirs may be more efficient. In the analysed data range, in the best case (the data set for the flow reduction coefficients of 0.5, 0.65 and 0.8), the necessary retention capacities of reservoirs using channel retention may constitute from 4.1% to 391% of the necessary capacities of the modified multi-chamber reservoirs. However, these are systems characterised by high sewage flow reduction coefficient values. Thus, the real differences in the necessary capacities ranged between 7 and 262 m3.
- Artificial neural networks can be a good tool for predicting the values of the retention efficiency indicators and thus helpful in selecting the most favourable type of retention device.
- A global sensitivity analysis has shown that the highest values of efficiency indicators ϑ and ζ occur for large retention facilities. This is affected by a large catchment area F, which generates high values of sewage inflow rate to the tank, with the concomitant significant reduction of this flow in the reservoir.
- To sum up, during the design of drainage systems, it is important to properly select the type of hydraulic system for the retention device, which should be adapted to the hydraulic conditions of the drainage system and the hydrological conditions of the catchment area. The presented results and conclusions constitute an introduction to further studies concerning rainwater retention in drainage systems. Among the most important issues to comprise the subsequent study stages, the following can be distinguished:
- Assessment of the impact of temporal and spatial variability in rainfall on the retention efficiency of various hydraulic systems used for retention reservoirs;
- Assessment of the impact of centralisation and decentralisation of retention devices on retention efficiency;
- Assessment of the impact of the implementation of retention device control systems in conjunction with Internet of Things (IoT) on their retention efficiency;
- Assessment of the quality of rainwater flowing out of retention devices with different hydraulic systems.
The retention efficiency index referring to the least efficient retention solution, that is, a standard single-chamber reservoir, will constitute the basis for subsequent studies.
Supplementary Materials
The following are available online at www.mdpi.com/article/10.3390/resources11020014/s1: Table S1: Complete data list prepared with the DOE tool, Neural network PMML code of ζ index, Neural network PMML code of ϑ index.
Funding
This research was funded by Poland’s National Science Centre, Project No. 2020/04/X/ST8/00450.
Institutional Review Board Statement
Not applicable.
Informed Consent Statement
Not applicable.
Data Availability Statement
Not applicable.
Conflicts of Interest
The author declares no conflict of interest. The funders had no role in the design of the study; in the collection, analyses or interpretation of data; in the writing of the manuscript or in the decision to publish the results.
References
- Coscarelli, R.; Aguilar, E.; Petrucci, O.; Vicente-Serrano, S.M.; Zimbo, F. The Potential Role of Climate Indices to Explain Floods, Mass-Movement Events and Wildfires in Southern Italy. Climate 2021, 9, 156. [Google Scholar] [CrossRef]
- De Urioste-Stone, S.M.; Le, L.; Scaccia, M.D.; Wilkins, E. Nature-based tourism and climate change risk: Visitors’ perceptions in Mount Desert Island, Maine. J. Outdoor Recreat. Tour. 2016, 13, 57–65. [Google Scholar] [CrossRef] [Green Version]
- Stevenson, K.; Nils, P. Motivating action through fostering climate change hope and concern and avoiding despair among adolescents. Sustainability 2016, 8, 6. [Google Scholar] [CrossRef] [Green Version]
- Kempton, W. Lay perspectives on global climate change. Glob. Environ. Chang. 1991, 1, 183–208. [Google Scholar] [CrossRef]
- Bouwer, L.M. Have disaster losses increased due to anthropogenic climate change? Bull. Am. Meteorol. Soc. 2011, 92, 39–46. [Google Scholar] [CrossRef] [Green Version]
- Serdeczny, O.M.; Steffen, B.; Huq, S. Non-economic losses from climate change: Opportunities for policy-oriented research. Clim. Dev. 2018, 10, 97–101. [Google Scholar] [CrossRef]
- Estrada, F.; Wouter Botzen, W.J.; Tol, R.S.J. Economic losses from US hurricanes consistent with an influence from climate change. Nat. Geosci. 2015, 8, 880–884. [Google Scholar] [CrossRef]
- Shukla, P.R.; Skea, J.; Slade, R.; Haughey, E.; Malley, J.; Pathak, M.; Portugal Pereira, J. IPCC, 2019: Climate Change and Land: An IPCC Special Report on Climate Change, Desertification, Land Degradation, Sustainable Land Management, Food Security, and Greenhouse Gas Fluxes in Terrestrial Ecosystems; IPCC: Geneva, Switzerland, 2019. [Google Scholar]
- Doulabian, S.; Golian, S.; Shadmehri Toosi, A.; Murphy, C. Evaluating the effects of climate change on precipitation and temperature for Iran using RCP scenarios. J. Water Clim. Chang. 2021, 12, 166–184. [Google Scholar] [CrossRef]
- Kordana, S.; Słyś, D. An analysis of important issues impacting the development of stormwater management systems in Poland. Sci. Total Environ. 2020, 727, 138711. [Google Scholar] [CrossRef]
- Starzec, M.; Dziopak, J.; Słyś, D. An analysis of stormwater management variants in urban catchments. Resources 2020, 9, 19. [Google Scholar] [CrossRef] [Green Version]
- Ramachandran, A.; Palanivelu, K.; Mudgal, B.V.; Jeganathan, A.; Balu, A.; Sankar, G. Performance of urban storm drainage network under changing climate scenarios: Flood mitigation in Indian coastal city. Sci. Rep. 2019, 9, 7783. [Google Scholar] [CrossRef] [Green Version]
- Zeleňáková, M.; Markovič, G.; Kaposztásová, D.; Vranayová, Z. Rainwater management in compliance with sustainable design of buildings. Procedia Eng. 2014, 89, 1515–1521. [Google Scholar] [CrossRef] [Green Version]
- Galuppini, G.; Quintilliani, C.; Arosio, M.; Barbero, G.; Ghilardi, P.; Manenti, S.; Petaccia, G.; Todeschini, S.; Ciaponi, C.; Martina, M.L.V.; et al. A unified framework for the assessment of multiple source urban flash flood hazard: The case study of Monza, Italy. Urban Water J. 2020, 17, 65–77. [Google Scholar] [CrossRef]
- Piotrowska, B.; Słyś, D.; Kordana-Obuch, S.; Pochwat, K. Critical Analysis of the Current State of Knowledge in the Field of Waste Heat Recovery in Sewage Systems. Resources 2020, 9, 72. [Google Scholar] [CrossRef]
- Li, H.; Ding, L.; Ren, M.; Li, C.; Wang, H. Sponge City Construction in China: A Survey of the Challenges and Opportunities. Water 2017, 9, 594. [Google Scholar] [CrossRef] [Green Version]
- Xia, J.; Zhang, Y.; Xiong, L.; He, S.; Wang, L.; Yu, Z. Opportunities and challenges of the Sponge City construction related to urban water issues in China. Sci. China Earth Sci. 2017, 60, 652–658. [Google Scholar] [CrossRef]
- Nguyen, T.T.; Ngo, H.H.; Guo, W.; Wang, X.C.; Ren, N.; Li, G.; Ding, J.; Liang, H. Implementation of a specific urban water management—Sponge City. Sci. Total Environ. 2019, 652, 147–162. [Google Scholar] [CrossRef]
- Jia, H.; Wang, Z.; Zhen, X.; Clar, M.; Yu, S.L. China’s sponge city construction: A discussion on technical approaches. Front. Environ. Sci. Eng. 2017, 11, 18. [Google Scholar] [CrossRef]
- Elliott, R.; Adkins, E.; Culligan, P.; Palmer, M. Stormwater infiltration capacity of street tree pits: Quantifying the influence of different design and management strategies in New York City. Ecol. Eng. 2018, 111, 157–166. [Google Scholar] [CrossRef]
- Maimone, M.; O’Rourke, D.E.; Knighton, J.O.; Thomas, C.P. Potential impacts of extensive stormwater infiltration in Philadelphia. Environ. Eng. Appl. Res. Pract. 2018, 14, 2–12. [Google Scholar]
- Pour Hadi Pour, S.; Khairi Abd Wahab, A.; Shahid, S.; Asaduzzaman, M.; Dewan, A. Low impact development techniques to mitigate the impacts of climate-change-induced urban floods: Current trends, issues and challenges. Sustain. Cities Soc. 2020, 62, 102373. [Google Scholar] [CrossRef]
- Pochwat, K. The use of artificial neural networks for analyzing the sensitivity of a retention tank. E3S Web Conf. 2018, 45, 00066. [Google Scholar] [CrossRef] [Green Version]
- Directive 2000/60/EC of the European Parliament and of the Council of 23 October 2000 Establishing a Framework for Community Action in the Field of Water Policy. Available online: https://eur-lex.europa.eu/eli/dir/2000/60/oj (accessed on 19 August 2021).
- Bertrand-Krajewski, J. Integrated urban stormwater management: Evolution and multidisciplinary perspective. J. Hydro Environ. Res. 2021, 38, 72–83. [Google Scholar] [CrossRef]
- Ziembowicz, S.; Kida, M.; Koszelnik, P. Removal of dibutyl phthalate (DBP) from landfill leachate using an ultrasonic field. Desalin. Water Treat. 2018, 4, 13. [Google Scholar] [CrossRef] [Green Version]
- Dziopak, J. Physical and mathematical model for traditional storage reservoir. Environ. Prot. Eng. 2002, 28, 119–130. [Google Scholar]
- Mrowiec, M.; Kisiel, A. Dimensioning methods for the vacuum-driven storage tanks. In Proceedings of the 11th International Conference on Urban Drainage, Edinburgh, UK, 31 August–5 September 2008. [Google Scholar]
- Dziopak, J. The mathematical models for gravitational two-chamber storage reservoir of the contract type. Environ. Prot. Eng. 2003, 29, 83–95. [Google Scholar]
- Słyś, D.; Stec, A. Centralized or decentralized rainwater harvesting systems: A case study. Resources 2020, 9, 5. [Google Scholar] [CrossRef] [Green Version]
- Ngu, J.O.K.; Mah, D.Y.S.; Bong, C.H.J. Flow characteristics of individual lot stormwater detention. Water Pract. Technol. 2016, 11, 721–727. [Google Scholar] [CrossRef]
- Chan, F.K.S.; Griffiths, J.A.; Higgitt, D.; Xu, S.; Zhu, F.; Tang, Y.T.; Thorne, C.R. “Sponge City” in China—A breakthrough of planning and flood risk management in the urban context. Land Use Policy 2018, 76, 772–778. [Google Scholar] [CrossRef]
- Zhihong, Z.; Duan, X.; Lu, S. The application research of rainwater wetland based on the Sponge City. Sci. Total Environ. 2021, 771, 144475. [Google Scholar] [CrossRef]
- Todeschini, S.; Papiri, S.; Ciaponi, C. Performance of stormwater detention tanks for urban drainage systems in northern Italy. J. Environ. Manag. 2012, 101, 33–45. [Google Scholar] [CrossRef]
- Drake, J.; Young, D.; McIntosh, N. Performance of an underground stormwater detention chamber and comparison with stormwater management ponds. Water 2016, 8, 211. [Google Scholar] [CrossRef] [Green Version]
- Tanty, R.; Desmukh, T. Application of Artificial Neural Network in Hydrology—A Review. Int. J. Eng. Technol. Res. 2015, 4, 184–188. [Google Scholar] [CrossRef]
- Pochwat, K.; Słyś, D.; Kordana, S. The temporal variability of a rainfall synthetic hyetograph for the dimensioning of stormwater retention tanks in small urban catchments. J. Hydrol. 2017, 549, 501–511. [Google Scholar] [CrossRef]
- Statsoft. Available online: https://www.statsoft.pl/textbook/stathome_stat.html?https%3A%2F%2Fwww.statsoft.pl%2Ftextbook%2Fstexdes.html (accessed on 19 August 2021).
- Connor, W.S.; Zelen, M. Fractional factorial experiment designs for factors at three levels. In Applied Factorial and Fractional Designs; McLean, R.A., Anderson, V.L., Eds.; Marcel Dekker: New York, NY, USA, 1984. [Google Scholar]
- Wartalska, K.; Kaźmierczak, B.; Nowakowska, M.; Kotowski, A. Analysis of Hyetographs for Drainage System Modeling. Water 2020, 12, 149. [Google Scholar] [CrossRef] [Green Version]
- Calabrò, P.S. Design storms and water quality control. J. Hydrol. Eng. 2004, 9, 28–34. [Google Scholar] [CrossRef]
- Bogdanowicz, E.; Stachy, J. Maximum rainfall in Poland-a design approach. IAHS Publ. 2002, 227, 15–18. [Google Scholar]
- Nissen, K.M.; Ulbrich, U. Increasing frequencies and changing characteristics of heavy precipitation events threatening infrastructure in Europe under climate change. Nat. Hazards Earth Syst. Sci. 2017, 17, 1177–1190. [Google Scholar] [CrossRef] [Green Version]
- Kotowski, A.; Nowakowska, M. Standards for the dimensioning and assessment of reliable operations of area drainage systems under conditions of climate change. Tech. Trans. 2018, 1, 125–139. [Google Scholar]
- Szeląg, B.; Kiczko, A.; Musz-Pomorska, A.; Widomski, M.K.; Zaburko, J.; Łagód, G.; Stránský, D.; Sokáč, M. Advanced Graphical–Analytical Method of Pipe Tank Design Integrated with Sensitivity Analysis for Sustainable Stormwater Management in Urbanized Catchments. Water 2021, 13, 1035. [Google Scholar] [CrossRef]
- Dziopak, J. A wastewater retention canal as a sewage network and accumulation reservoir. E3S Web Conf. 2018, 45, 184–188. [Google Scholar] [CrossRef] [Green Version]
Figure 1.
Analysed models of a standard single-chamber reservoir and a modified multi-chamber reservoir; (a) single-chamber reservoir; (b) modified multi-chamber reservoir. (1—sewer manhole, 2—inflow channel, 3—retention reservoir body, 4—outflow from the reservoir, 5—outflow with a flap valve and 6—channel with overflow (as a flow chamber)).

Figure 2.
Analysed model of a reservoir using channel retention (channel retention reservoir). (1—sewer manhole, 2—existing drainage system channel, 3—transit bidirectional channels and 4—reservoir accumulation chamber).
Figure 2.
Analysed model of a reservoir using channel retention (channel retention reservoir). (1—sewer manhole, 2—existing drainage system channel, 3—transit bidirectional channels and 4—reservoir accumulation chamber).

Figure 3.
Study design.

Figure 4.
Study subject model.

Figure 5.
Block rain characteristics. (top is the rainfall duration; ho is the rainfall level in time t; and hmax is the maximum total rainfall level, mm).
Figure 5.
Block rain characteristics. (top is the rainfall duration; ho is the rainfall level in time t; and hmax is the maximum total rainfall level, mm).

Figure 6.
Example model of a sewage system for a 15 ha catchment.

Figure 7.
Estimating the necessary capacity of the retention device.

Figure 8.
Algorithm for conducting hydrodynamic simulations in order to determine the necessary capacity of the retention device.
Figure 8.
Algorithm for conducting hydrodynamic simulations in order to determine the necessary capacity of the retention device.

Figure 9.
Necessary capacities of retention devices Vu.

Figure 10.
Necessary retention capacities of a modified multi-chamber reservoir VuM and a channel retention reservoir Vuk.
Figure 10.
Necessary retention capacities of a modified multi-chamber reservoir VuM and a channel retention reservoir Vuk.

Figure 11.
Index ϑ value.

Figure 12.
Linear regression analysis for ζ index obtained between the experimental data and the data calculated in the ANN model.
Figure 12.
Linear regression analysis for ζ index obtained between the experimental data and the data calculated in the ANN model.

Figure 13.
Linear regression analysis for index ϑ obtained from the experimental data and the data calculated in the ANN model.
Figure 13.
Linear regression analysis for index ϑ obtained from the experimental data and the data calculated in the ANN model.


Table 1.
Input data values.
| Parameter | Computational Scope | |
|---|---|---|
| Minimum Value | Maximum Value | |
| Rainfall | * | * |
| Reduction coefficient for sewage flow through reservoir β | 0.2 | 0.8 |
| Catchment area, ha | 5 | 50 |
| Catchment gradient, ‰ | 5 | 15 |
| Sewer gradient, ‰ | 2 | 6 |
| Catchment load, ha/km | 5 | 25 |
* Details in step 3.
Table 2.
Three-valued fractional plan 3**(4–1).
| Layout Number | Catchment Area F, ha | Chanel Gradient, ‰ | Catchment Gradient, ‰ | Catchment Load, ha/km |
|---|---|---|---|---|
| 1 | 5 | 6 | 10 | 5 |
| 2 | 5 | 6 | 5 | 15 |
| 3 | 5 | 2 | 5 | 5 |
| 4 | 5 | 4 | 5 | 25 |
| 5 | 5 | 4 | 15 | 5 |
| 6 | 5 | 6 | 15 | 25 |
| 7 | 5 | 4 | 10 | 15 |
| 8 | 5 | 2 | 10 | 25 |
| 9 | 5 | 2 | 15 | 15 |
| 10 | 20 | 2 | 10 | 15 |
| 11 | 20 | 2 | 5 | 25 |
| 12 | 20 | 4 | 10 | 5 |
| 13 | 20 | 2 | 15 | 5 |
| 14 | 20 | 6 | 15 | 15 |
| 15 | 20 | 4 | 5 | 15 |
| 16 | 20 | 4 | 15 | 25 |
| 17 | 20 | 6 | 10 | 25 |
| 18 | 20 | 6 | 5 | 5 |
| 19 | 50 | 6 | 10 | 15 |
| 20 | 50 | 6 | 5 | 25 |
| 21 | 50 | 6 | 15 | 5 |
| 22 | 50 | 2 | 5 | 15 |
| 23 | 50 | 2 | 15 | 25 |
| 24 | 50 | 4 | 5 | 5 |
| 25 | 50 | 4 | 10 | 25 |
| 26 | 50 | 4 | 15 | 15 |
| 27 | 50 | 2 | 10 | 5 |
Table 3.
List of data in randomly selected systems for sewage systems (complete data set in the Supplementary Materials Table S1).
Table 3.
List of data in randomly selected systems for sewage systems (complete data set in the Supplementary Materials Table S1).
| Layout Number | Flow Reduction Coefficient ß, - | Catchment Area F, ha | Chanel Gradient, ‰ | Catchment Gradient, ‰ | Catchment Load, ha/km |
|---|---|---|---|---|---|
| 1 | 0.2 | 5 | 6 | 10 | 5 |
| 54 | 0.35 | 50 | 2 | 10 | 5 |
| 72 | 0.5 | 20 | 6 | 5 | 5 |
| 89 | 0.65 | 2 | 10 | 25 | 5 |
| 125 | 0.8 | 20 | 6 | 10 | 25 |
Table 4.
Neural network parameters for the retention efficiency index ζ.
| Network Name | MLP 6-7-1 |
|---|---|
| Quality (training) | 0.948176 |
| Quality (testing) | 0.929698 |
| Quality (validation) | 0.924971 |
| Error (training) | 0.055395 |
| Error (testing) | 0.061299 |
| Error (validation) | 0.101558 |
Table 5.
Global sensitivity analysis for the MLP 6-7-1 neural network.
| Network Name | Sensitivity Analysis | |||||
|---|---|---|---|---|---|---|
| Outflow | Flow Reduction Coefficient β | Catchment Area | Catchment’s Gradient | Conduit’s Gradient | Load of the Catchment | |
| MLP 6-7-1 | 25.10361 | 19.04999 | 17.97782 | 2.304629 | 2.279302 | 1.707263 |
Table 6.
Neural network parameters for the retention efficiency index ϑ.
| Network Name | MLP 6-6-1 |
|---|---|
| Quality (training) | 0.979494 |
| Quality (testing) | 0.964673 |
| Quality (validation) | 0.980805 |
| Error (training) | 0.032826 |
| Error (testing) | 0.050025 |
| Error (validation) | 0.178226 |
Table 7.
Global sensitivity analysis for the MLP 6-6-1 neural network.
| Network Name | Sensitivity Analysis | |||||
|---|---|---|---|---|---|---|
| Outflow | Flow Reduction Coefficient β | Catchment Area | Catchment’s Gradient | Conduit’s Gradient | Load of the Catchment | |
| MLP 6-6-1 | 41.27960 | 28.84026 | 18.51401 | 16.97290 | 10.28483 | 4.058230 |
Publisher’s Note: MDPI stays neutral with regard to jurisdictional claims in published maps and institutional affiliations. |
© 2022 by the author. Licensee MDPI, Basel, Switzerland. This article is an open access article distributed under the terms and conditions of the Creative Commons Attribution (CC BY) license (https://creativecommons.org/licenses/by/4.0/).
Share and Cite
MDPI and ACS Style
Pochwat, K. Assessment of Rainwater Retention Efficiency in Urban Drainage Systems—Model Studies. Resources 2022, 11, 14. https://0-doi-org.brum.beds.ac.uk/10.3390/resources11020014
AMA Style
Pochwat K. Assessment of Rainwater Retention Efficiency in Urban Drainage Systems—Model Studies. Resources. 2022; 11(2):14. https://0-doi-org.brum.beds.ac.uk/10.3390/resources11020014
Chicago/Turabian StylePochwat, Kamil. 2022. "Assessment of Rainwater Retention Efficiency in Urban Drainage Systems—Model Studies" Resources 11, no. 2: 14. https://0-doi-org.brum.beds.ac.uk/10.3390/resources11020014
Note that from the first issue of 2016, this journal uses article numbers instead of page numbers. See further details here.