
Using New Spare Parts for Repair of Waste Electrical and Electronic Equipment? The Material Footprint of Individual Components


Center for Environmental Systems Research (CESR), University of Kassel, Wilhelmshoeher Allee 47, 34117 Kassel, Germany
*
Author to whom correspondence should be addressed.
Resources 2022, 11(2), 24; https://0-doi-org.brum.beds.ac.uk/10.3390/resources11020024
Submission received: 28 January 2022
/
Revised: 10 February 2022
/
Accepted: 17 February 2022
/
Published: 21 February 2022
Abstract
:The growing production of waste electrical and electronic equipment (WEEE) requires close loop management to protect the environment and save resources. Repair and reuse can extend the product’s life span. However, debates on the differences seen in resource consumption linked to the different ways of repairing devices have received a limited amount of attention. This article demonstrates quantification of the resource consumption (cradle-to-gate) of five types of appliances on a component level based on life-cycle assessment within the framework of the product-material-footprint. The data for this assessment is based on the dismantling of these products, weighing their components, and determining their material composition. The results show that the resource relevance of all devices is dominated by a few individual components. For example, for flat-screen monitors, 5 out of 17 components per device account for more than 90% of resource consumption (abiotic total material requirement). Hence, repairing devices while using new spare parts is not always the most resource-efficient way of handling WEEE. The results of this investigation suggest that the resource consumption in repairs should be taken into account at different levels, e.g., regulatory, with regard to eco-design requirements, or for informational purposes with a view to the consideration of the repair and reuse practices.
1. Introduction
Waste from electrical and electronic (WEEE) equipment contains many valuable metals and other substances [1], while using equipment for a long time saves resources and protects the environment. The production of more than 12 million tons of waste per year in Europe [2], significantly demonstrates that the potential to protect resources is not being utilised. Studies show, for example, that electrical appliances are often only used for a few years [3,4].
Reusing a product extends its life span and also minimises the use of resources which are required in the product life cycle [5,6]. This close loop management allows the product’s economic value to be preserved for as long as possible [7].
The importance of reuse is also reflected in the waste regulation (Waste Framework Directive) and in several scientific papers [8,9]. Repair is defined as an operation which “refers to the fixing of a specified fault in an object that is a waste or a product and/or replacing defective components, in order to make the waste or product a fully functional product to be used for its originally intended purpose” [5]. According to Ardente et al. [10], repair can be part of different types of reuse but it does not have to be (e.g., repair within a maintenance operation). Therefore, repairing products plays an essential role in the process of retaining its value.
Product design plays a critical role in the decision on whether the repair can be accomplished.
Manufacturers could improve the repairability of electronic devices such as washing machines, monitors, etc. and make spare parts available. Corresponding ambitions are being pursued in the EU with the Eco-Design Directive. The latest regulations impose repairability requirements for certain product groups (e.g., refrigerators, washing machines, dishwashers, electronic displays, light sources, electric motors, transformers and welding equipment) as of March 2021 [11]. For instance, spare parts and repair instructions must be available seven to ten years after the product has been placed on the market. In addition, it must be feasible to replace the parts using standard tools. Since the beginning of 2021, and for the first time in Europe, consumers in France who purchased an electrical or electronic appliance have been able to obtain information on how to easily repair the product via a national repairability index [12].
The classification of products with regard to their repairability is also the subject of various research projects and standardisation activities [13,14], which can be classified into different levels (e.g., on information, product and service levels according to Bracquenea et al. [14]). Repairs on the material level have been given little consideration until now. However, a device that has to be repaired due to a typical defect (e.g., the battery of a mobile phone) and the replacement of the defective component with a new one requires a high consumption of resources (compared to the production of the entire device); it is to be regarded as less repairable than a device that can be repaired in a less resource-intensive manner, for example. In 2019, Pini et al. [15] gave initial indications on the dependence of the environmental friendliness from the reused electronic device and its replaced components.
Relevant life cycle assessments (LCA) have already been carried out in the context of electrical appliances [16,17,18,19,20]. Most LCA studies that consider the manufacturing of appliances at the product level [21,22] show in the best scenario which material has a high or low environmental impact, but not which component. The technical potentials and the material basis of the individual components are largely unknown to date in terms of a comparative investigation within a device. This information could be very revealing, for example, in understanding the extent to which repairing defects by replacing components can lead to resource savings in reuse processes [23].
The aim of this article is therefore to clarify the following question: How do the components of a product differ in terms of the resource consumptions required for production?
The study is thus to be understood as an exploratory one that
- on the one hand provides insights into the resource consumption of repairs, and on the other hand;
- provides a basis for further data collection, e.g., in the context of case studies (e.g., is it necessary to evaluate failure statistics? For large differences, yes, but for small differences, no).
With regard to the first point, the study is therefore focussed on scientists who advise decision makers and are concerned, for example, with questions relating to the eco-design of products (such as specifications on the repairability of certain components). This study also supports the targeted design of research in this area (e.g., consideration and analysis of different resource uses of components in the context of reuse processes).
2. Materials and Methods
2.1. Product Selection
In order to ensure an adequate scope of work while guaranteeing the necessary depth of analysis, this research is limited to five electrical and electronic appliances typically used in a household. The product selection contains a range of products that are representative of different product characteristics and the associated challenges as well as incentives for repair and reuse. Product-specific influencing variables on the reuse potential are the type of appliance (comparable features with regard to the type of use or function) and other characteristics of the products, such as the scarcity of the raw materials used or technical progress [24]. Accordingly, the following products have been selected:
- Washing machines as representatives of large household appliances;
- Flat-screen monitors with LCD technology, representing information and telecommunications technology equipment;
- Loudspeaker boxes of stereo systems as representatives of consumer electronic equipment;
- Coffee machines as representatives of small household appliances.
Washing machines are subject to rather complex repair processes, and a large number of faults can occur [23,25], making them profoundly interesting objects of investigation. Flat-screen monitors, loudspeaker boxes and coffee machines are products that have been identified as being particularly important for the use of resource-relevant metals [26], and are important products in the volume flows of the everyday practice of reuse centers [23].
Depending on the type, appliances can also significantly differ within a product group, e.g., coffee machines can be designed as fully automatic machines, portioned coffee machines, sieve carrier machines or filter machines [27]. These differences are also reflected in the built-in components (e.g., with or without a pump) and can lead to completely different material compositions. With this in mind, one filter coffee machine and one coffee pad machine are being considered (further specification of products can be found in the Supplementary Materials A section).
2.2. Definition of Product Components
According to DIN 40,150 [28], the devices under consideration are defined as technical systems. These technical systems are in turn subdivided hierarchically into the following subsystems:
- Part: independently usable unit in a system;
- Group: unit within a part that cannot be used independently;
- Element: smallest indivisible unit in a group.
The different system levels can be characterised either by functional criteria, i.e., task/effect (e.g., water flow) or by design criteria, i.e., structure/composition (e.g., water hose) according to the subsystems described.
With regard to the question of which units are to be replaced during a repair, the design criteria offer the best possible option. For example, the “washing machine” (system) contains the “motor” (part), the “carbon brushes” (group) and the “carbon” (element).
The repair of systems in terms of unit replacement is carried out in widely differing ways—on the part level, group level or element level. On this basis, the term “component” is introduced, which is to be understood as parts, groups and elements. The respective definition of the components is made according to its practicability (e.g., with a view to clarity), on the basis of experience from the literature, as well as surveys and observations of failure patterns, dismantling, and repair practices. With this approach, the material compositions of the systems can be systematised in a stringent and uniform but also practice-oriented manner.
2.3. Aim and Scope of the Reference Life Cycle Assessments
The life-cycle assessment (LCA) serves to evaluate resource consumption. The present life-cycle assessment is carried out according to ISO 14040/14044 [29,30].
2.3.1. Objective and Functional Unit
The aim of the life-cycle assessment is to calculate the resource consumption from the extraction of raw materials up to and including the manufacture of the device components, assembly and packaging (cradle-to-gate), and thus to describe the environmental performance of the components and overall devices.
The functional unit is defined as the production of a new component required to repair the device. Hence, the flows considered by the LCA are related to the different components of an appliance (washing machine, flat-screen monitor, loudspeaker box, coffee filter machine or coffee pad machine). Based on this, the potential resource consumption of a repair (replacement of defective components by a new one) are compared between the different components of a device.
2.3.2. Defining the System Boundaries
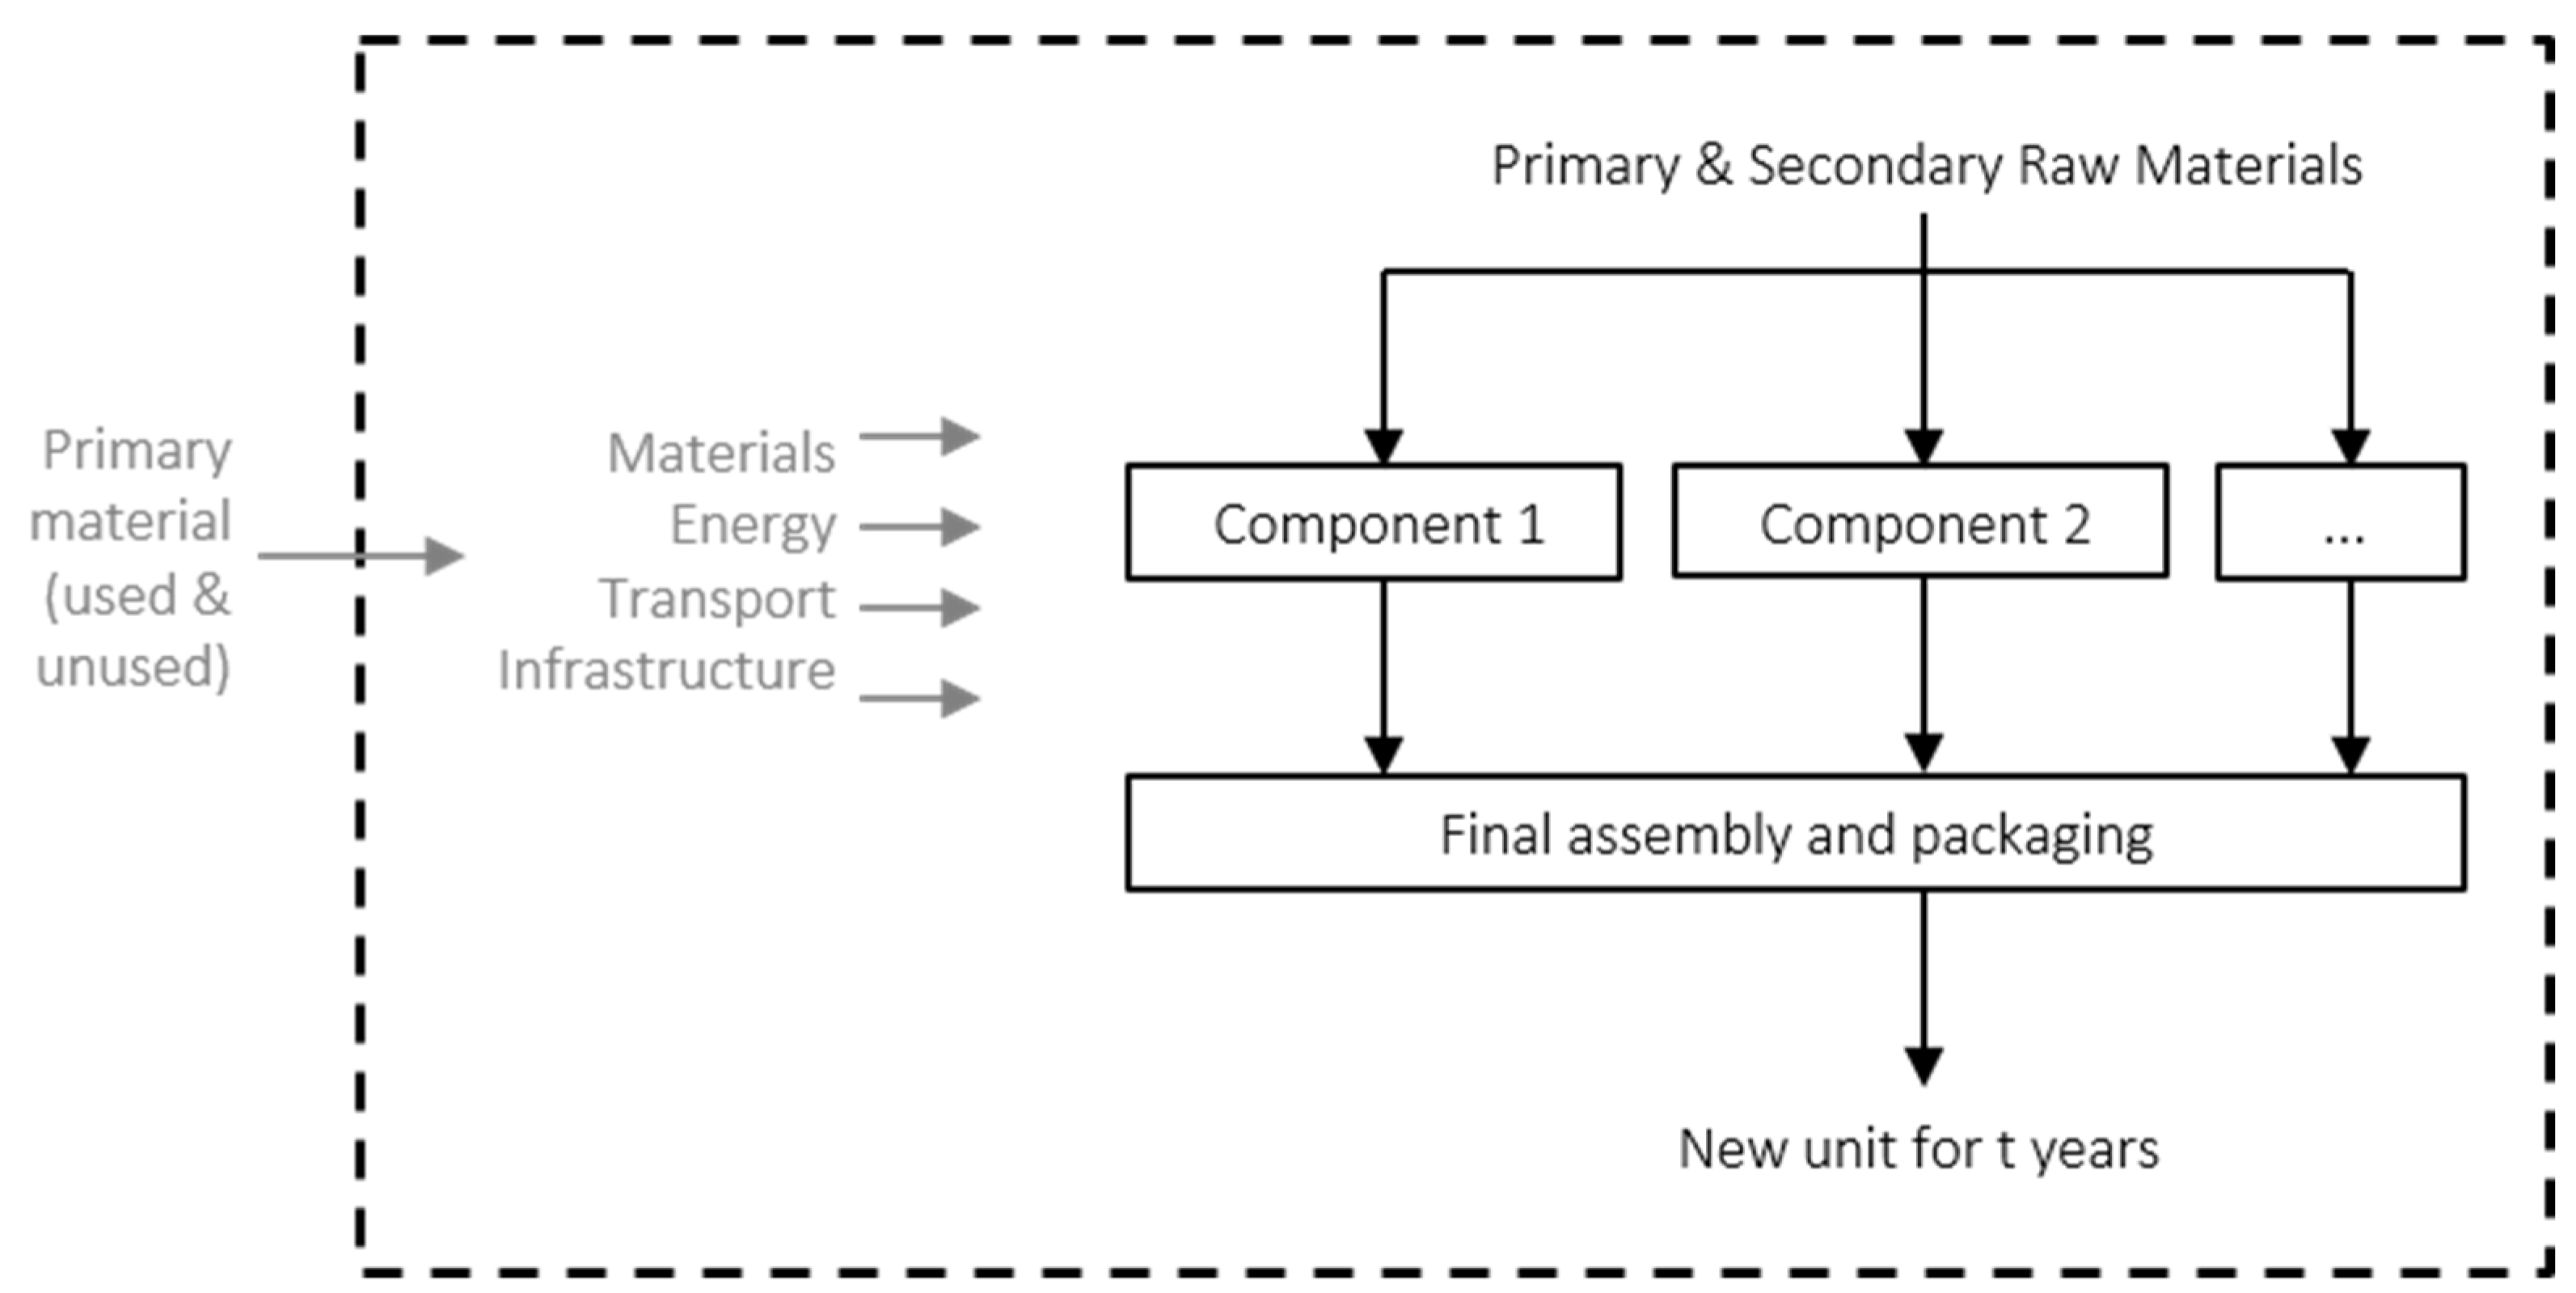
The system boundaries are shown in Figure 1 below which include the production of the components, final assembly and packaging of the devices.
Material losses in the upstream chains are taken into account by the typical loss contained in the data sets (e.g., rolling of metal sheets). Specific product-related losses (e.g., punching losses in the manufacturing of washing machine drums) are not taken into account. This approach is based on Gensch and Blepp [21].
The present study focuses on the description of already produced devices, therefore, according to Weidema et al. [31], it is a so-called descriptive life-cycle assessment (“attributional LCA”) and not a consequential LCA which focuses on modelling the possible consequences of a decision maker.
2.3.3. Allocation
An allocation is always necessary if the processes which generate several usable products include those which cannot be considered in that particular system. In this paper, allocation is based on the approach: “Allocation, cut-off, by classification” [32]. In the Ecoinvent data sets (Version 3.3) used for upstream chains (e.g., in raw material production), allocations have already been made at the necessary points.
2.4. Method for Impact Assessment and Modelling Basis
2.4.1. Impact Assessment with the Product Material Footprint
Impact assessment is based on the so-called product-material footprint (PMF) [33]. The PMF is an instrument which measures the life-cycle input of raw materials and the total amount of extracted primary material for products and services (ibid).
The methodology is based on the concept of material input per service unit (MIPS) [34,35]. However, the PMF differs from the MIPS since it focuses on material resource input, and neglects the categories of soil movement, water, and air. The potential environmental impacts with the product life cycle are quantified within the framework of the PMF using the following impact indicators [33]:
- Cumulative raw material input (RMI): The cumulative raw material input is the sum of the primary raw material quantities used, for example, to provide a material or product. The RMI indicates the mass turnover which ends up in the form of waste and emissions in processes and locations subsequent to resource extraction.
- Total material requirement (TMR): The total material requirement includes the sum of the primary material quantities extracted from nature, which contains both used and unused extraction (e.g., overburden). The TMR indicates the magnitude of human-induced material flows around the extraction locations, and thus the order of magnitude of environmental pressure due to landscape changes, etc.
This paper investigates both indicators, with a focus on abiotic primary raw material consumption (impact category) (in the following briefly: TMRabiotic und RMIabiotic).
In the German Resource Efficiency Programme III, the RMI is the main indicator used to determine the various ratios used to measure increases in resource efficiency (e.g., total raw material productivity = (gross domestic product + imports)/RMI). These assessments make it possible to formulate concrete targets precisely, and to monitor the achievement of the targets. The German federal government agreed to stay committed to sustain the total raw material productivity trend from 2000 to 2010 and to extend its commitment until 2030 to be part of the German Resource Efficiency Programme II. In this respect, indicators, such as the RMI, are presented in the programme as a valuable and indispensable orientation [36].
Acting as an additional indicator, the TMR completes the picture, since it shows which role unused materials, such as overburdened and mining material, play in the use of resources.
Therefore, the TMR has high influence on the environmental impact but the use of the indicator to define targets is still limited due to its incomplete database [33].
2.4.2. Characterisation Factors and Impact Assessment with OpenLCA
All inputs along the life cycle are counted back to resource consumption with characterisation factors according to Mostert and Bringezu [33].
The PMF assessment method uses the ecoinvent database (version 3.3, cut-off LCI) with the software openLCA (version 1.6), in which the values for the characterisation factors are added, and each elementary flow of the database (“resources, in ground”) is assigned to a corresponding characterisation factor.
Since Mostert and Bringezu [33] implemented the factors with version 3.1 of the ecoinvent database in openLCA (version 1.7), the software implementation with the ecoinvent database (version 3.3) is conducted by comparing the names of each elementary flow between the two versions and the assignment is adjusted accordingly. If the names of the elementary flows match, the assignment of the characterisation factor to the elementary flow is then adopted. If the elementary flow occurs in version 3.3 but not in version 3.1, a characterisation factor is subsequently assigned to the corresponding raw material. In the opposite case, i.e., when the elementary flow occurs in version 3.1 but not in version 3.3, no adjustment is made.
Supplementary Materials B section show an overview of the changes made to implement the methodology.
2.4.3. Data Quality Requirements, Data Collection and Cut-Off Rules
Considering the availability of material compositions in research, which usually refers to appliances and not to the component level, it is mandatory to disassemble products in order to evaluate repairs of individual components.
Five appliances (one appliance per product group, except for coffee machines with two appliances) are dismantled and the components are weighed. If a component consists of one material and weighs less than three grams (the smallest weight increment of the scale), it is not included in the material balance. In practice, however, the total weight determined does not significantly underestimate the respective real weights of the appliances, as only very few components are under the cut-off criterion.
For the individual components, the main materials are determined and quantified according to their mass.
The material is determined on the one hand visually, acoustically, and haptically, in combination with
- general knowledge (e.g., the fact that aluminium is relatively light compared to steel, that copper has a distinctive colour or that plastics sound different from metals) and
- information available in the literature (e.g., determining whether the magnet in the motor of the washing machine is a permanent magnet or a layered electrical sheet).
On the other hand, the type of material could also partly be determined directly from material designations on parts or elements of components.
The weight of the materials is determined or estimated by further disassembling the components (destructively, if necessary). If a material has a (weighed or estimated) share of less than 1% of the weight of the component under consideration, the material is named but not taken into account in the modelling (marked < 1%). If further disassembly of the component which consists of different materials is very time-consuming (e.g., desoldering all components of a printed circuit board) and/or the estimation of the material composition is impossible due to the complexity of the component, then the weight of the entire component is included. Nevertheless, in order to be able to carry out the LCA, the data from the LCA database is used. In addition to data sets on materials, processes, transports, etc., LCA databases also contain data sets on entire components. In this way, it is possible, for example, to estimate the resource consumption for complex components such as the liquid crystal display of an LCD monitor without determining the material composition itself.
The assumptions and allocations of the specific materials to the Ecoinvent datasets are made consistently for all selected products by modelling the same materials with the same data sets. Inconsistencies result from the age of the data in the data sets, whereby these are partly resolved by modifications, e.g., ratios of certain inputs (e.g., electric steel and oxygen steel, primary aluminium and secondary aluminium) in the sense of values established in research.
The tables with the material compositions per appliance (see Supplementary Materials C section) indicate whether the determination of the material composition is based on a measured value (in the following: M) or an estimated value (in the following: SZ). This information is not required if components consist of only one material. The method used to determine the type of material has also been indicated by either a research-based, general knowledge estimate (in the following: SA), or is stated on the component marking (in the following: K). In total, only 10% of the material composition is estimated, while 58% of the material type is determined by an estimated value. The estimated values for the type of material dominate, especially for flat screens and loudspeaker boxes.
In addition to weights, other units are also used to describe some components (e.g., dimensions) if the data sets used for subsequent modelling require it.
3. Life-Cycle Inventory
3.1. Structure and Material Composition of the Reference Appliances
An overview of the number of components and the total weight of the five dismantled appliances is shown in Table 1. The description of the material composition and the weight of the individual components as well as the determination method is shown in the Supplementary Materials C section.
With 41 components and a weight of around 70 kg, the washing machine has the highest number of components and is the heaviest. The loudspeaker box has the fewest components and the filter coffee machine is the lightest.
3.2. Final Assembly, Packaging and Transport of the Units
In the literature, component assembly to form a complete unit is described as the least significant step from an ecological point of view [37]. This part is, therefore, neglected in the study.
After final assembly, the devices are packed. The packaging includes foil and cardboard as well as shock-absorbing materials if necessary. Table 2 shows the estimated material and weight used to pack devices. Due to the comparable product size, although different in form, the packaging requirements for flat-screen monitors are also applied to that of coffee machines and loudspeaker boxes.
All transports are already recorded with the (global) datasets used in the Ecoinvent database.
4. Results: Product-Material-Footprint of Device Manufacturing at Component Level
In order to model the manufacturing and packaging of the devices, inventory analysis is used to allow the datasets to be selected in the Ecoinvent database.
4.1. Flat-Screen Monitor
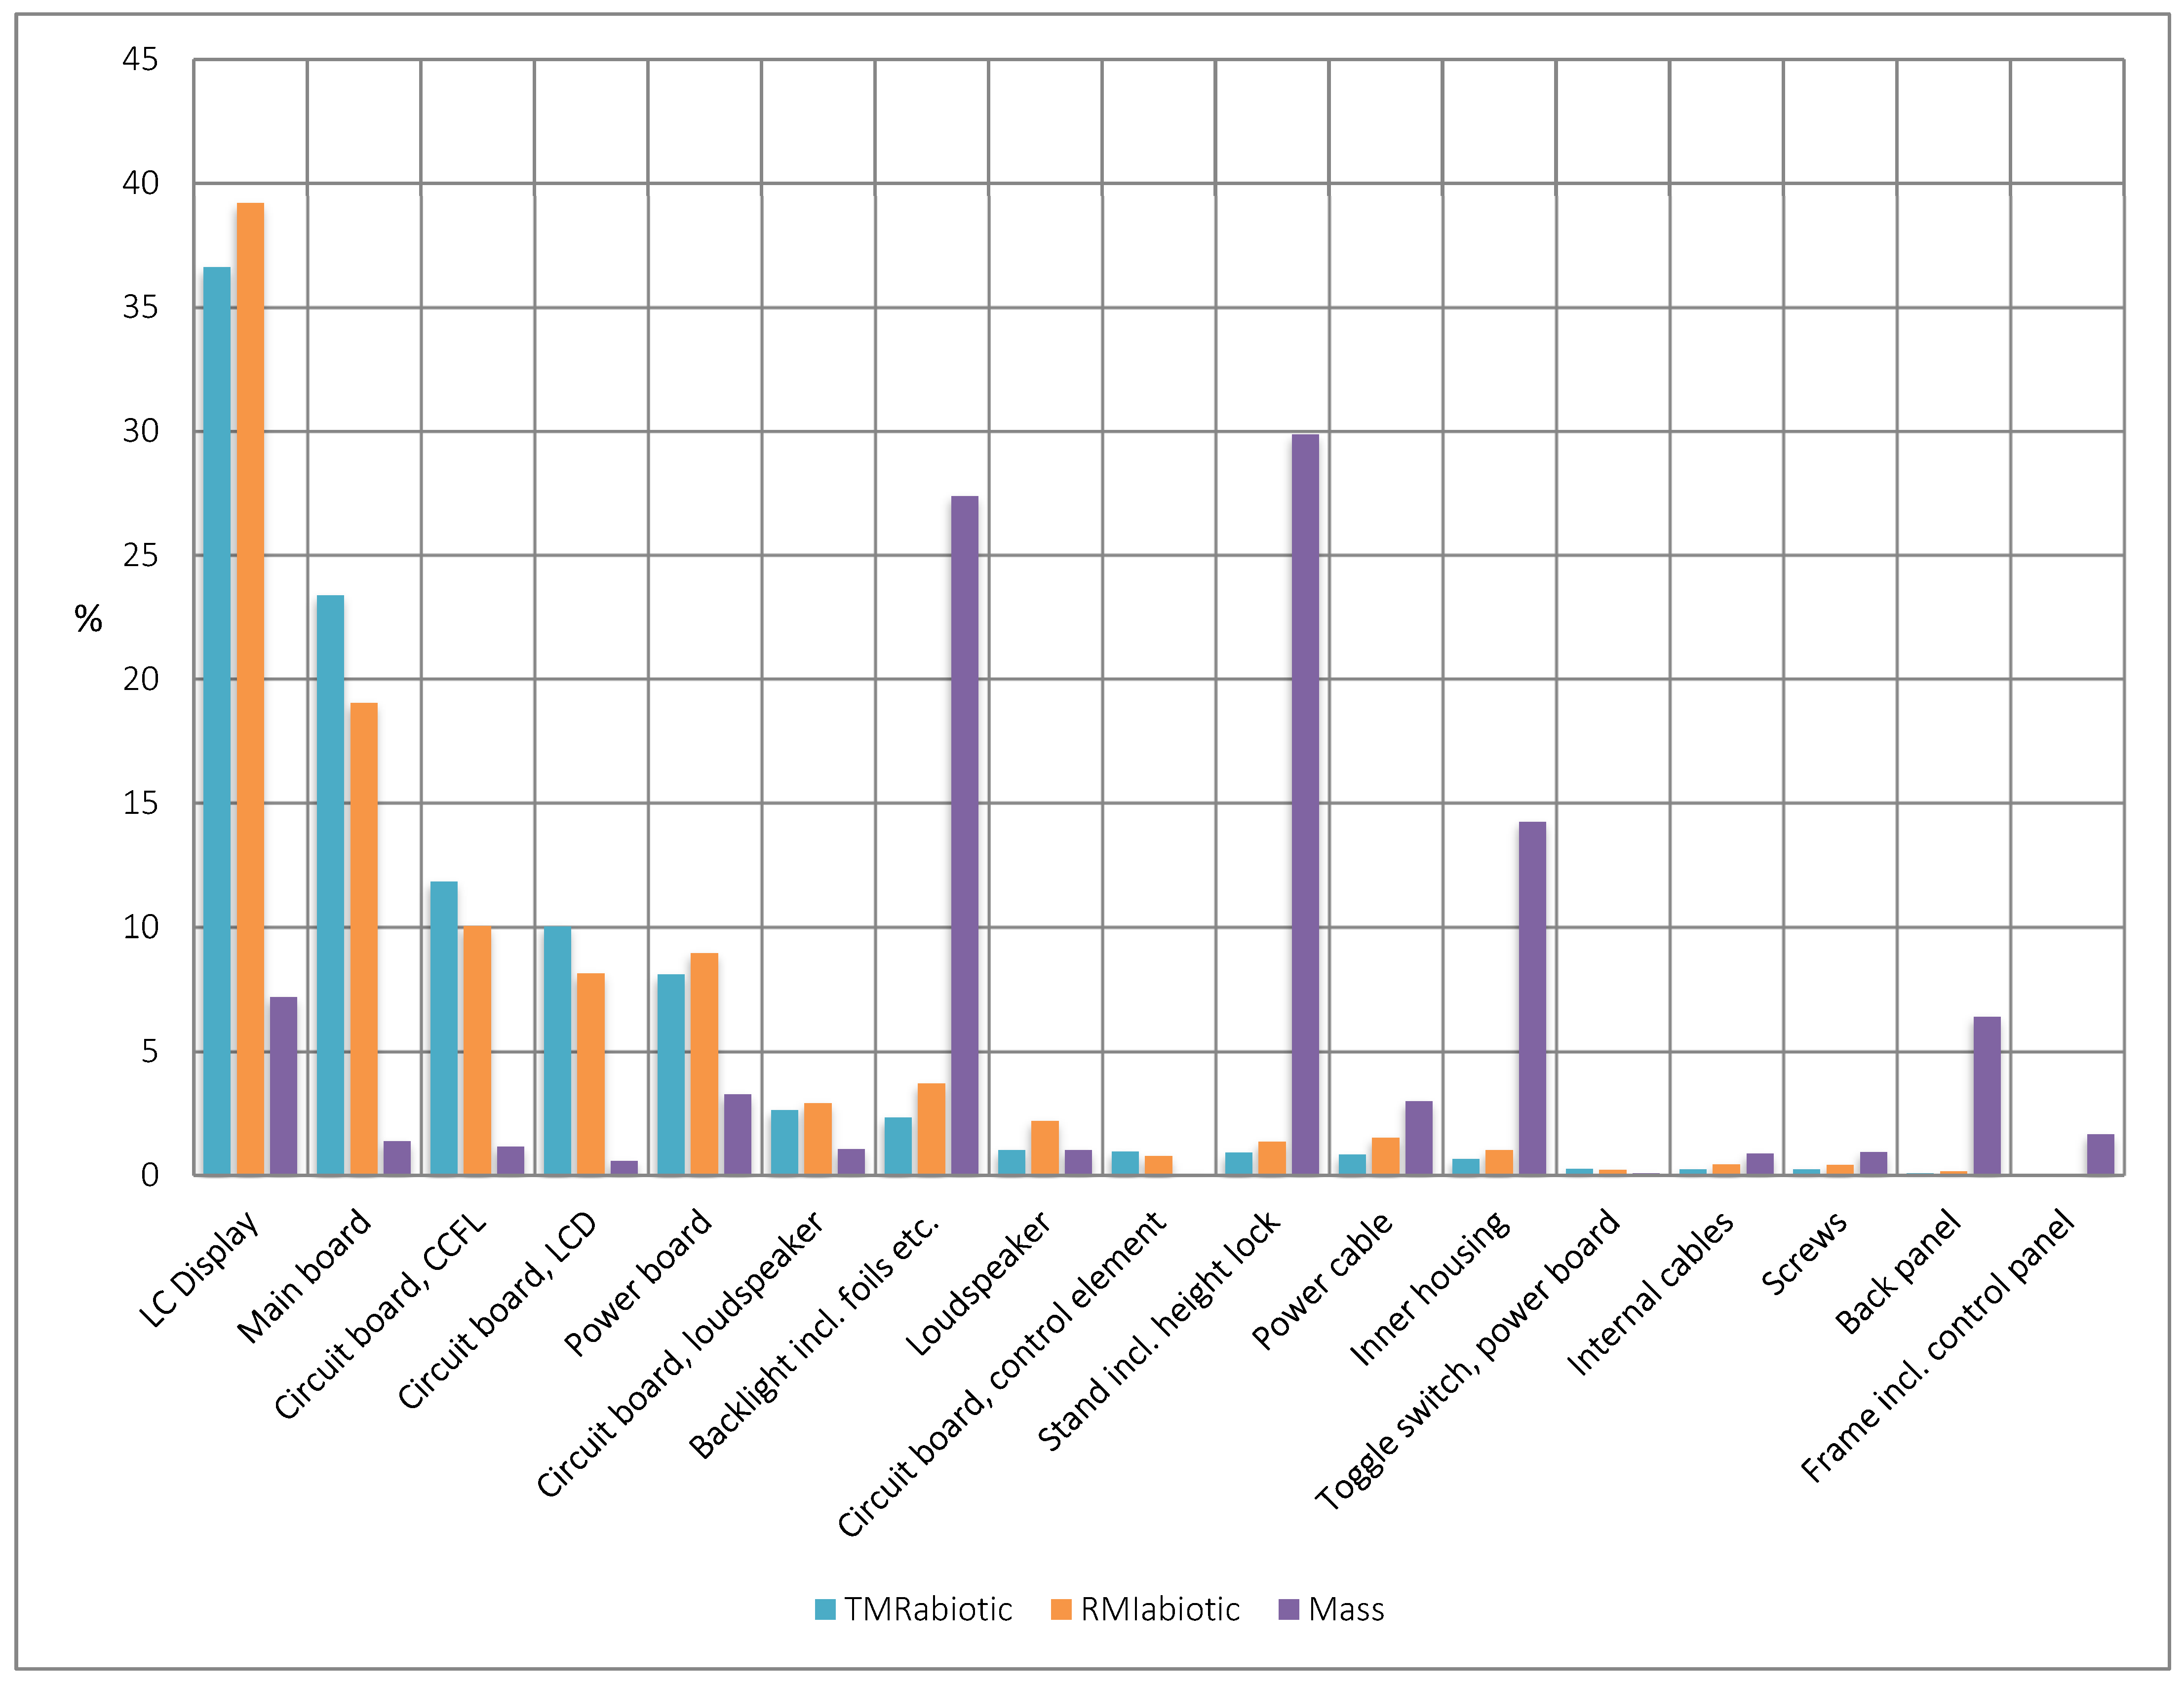
In total, the TMRabiotic and RMIabiotic of component production including device packaging amounts to 2247 kg and 998 kg, respectively. Figure 2 shows the contribution of the individual components to the main indicators.
The figure shows that TMRabiotic, RMIabiotic and mass fractions are dominated by specific components with high contribution rates:
- The high gold content in the electronic circuit integrated in the LC display is the main driver for the high TMRabiotic and RMIabiotic.
- Both indicators are also determined by the content of valuable metals in the printed circuit board (in the following: PCB). The higher the proportion of PCBs with surface-mounted components, the higher the value and consequently the TMRabiotic und RMIabiotic proportions. This is due to the surface-mounted boards having a higher packing density than boards with components attached with wire.
- The mass is determined by the proportion of plastic (backlight, back cover) and of sheet steel (base, inner housing).
- Sorting the respective shares of TMRabiotic and RMIabiotic by size results in only slight differences with regard to the order of the components.
Overall, the LC display and all PCBs make up 93% of the TMRabiotic, 89% of the RMIabiotic and only 15% of the mass. Whereas the percentage of the mass and the resources used for the housing parts (back panel, base, inner case) and the backlight is exactly the opposite: the TMRabiotic and RMIabiotic ratio is 4% and 6%, respectively, and the mass is almost completely determined by the components at almost 80%.
The Supplementary Materials D section shows the results of the modelled flat-screen monitor in detail.
4.2. Loudspeaker Boxes
In total, the TMRabiotic is 594 kg and the RMIabiotic are 551 kg per pair (including packaging). Considering the TMRabiotic, RMIabiotic and mass fractions of the components in the respective total value for loudspeaker boxes, the enormous differences in the resource and mass relevance of loudspeaker boxes becomes clear (see Figure 3).
The reason for the high TMRabiotic and RMIabiotic of the woofer and tweeter is the permanent magnet. The neodymium content of the magnet (compared to the iron content) leads to a resource relevance of more than 70% of the whole device, especially for the woofer (which contains a large permanent magnet). The mass fraction of the woofer is significantly lower at 23% but is in second place compared to the other components. The bulk of the loudspeaker box is clearly dominated by the housing (65%), which in turn has a negligible resource relevance of about 0.5%.
The detailed modelling results per box for loudspeakers are shown in the Supplementary Materials D section.
4.3. Filter Coffee Machine
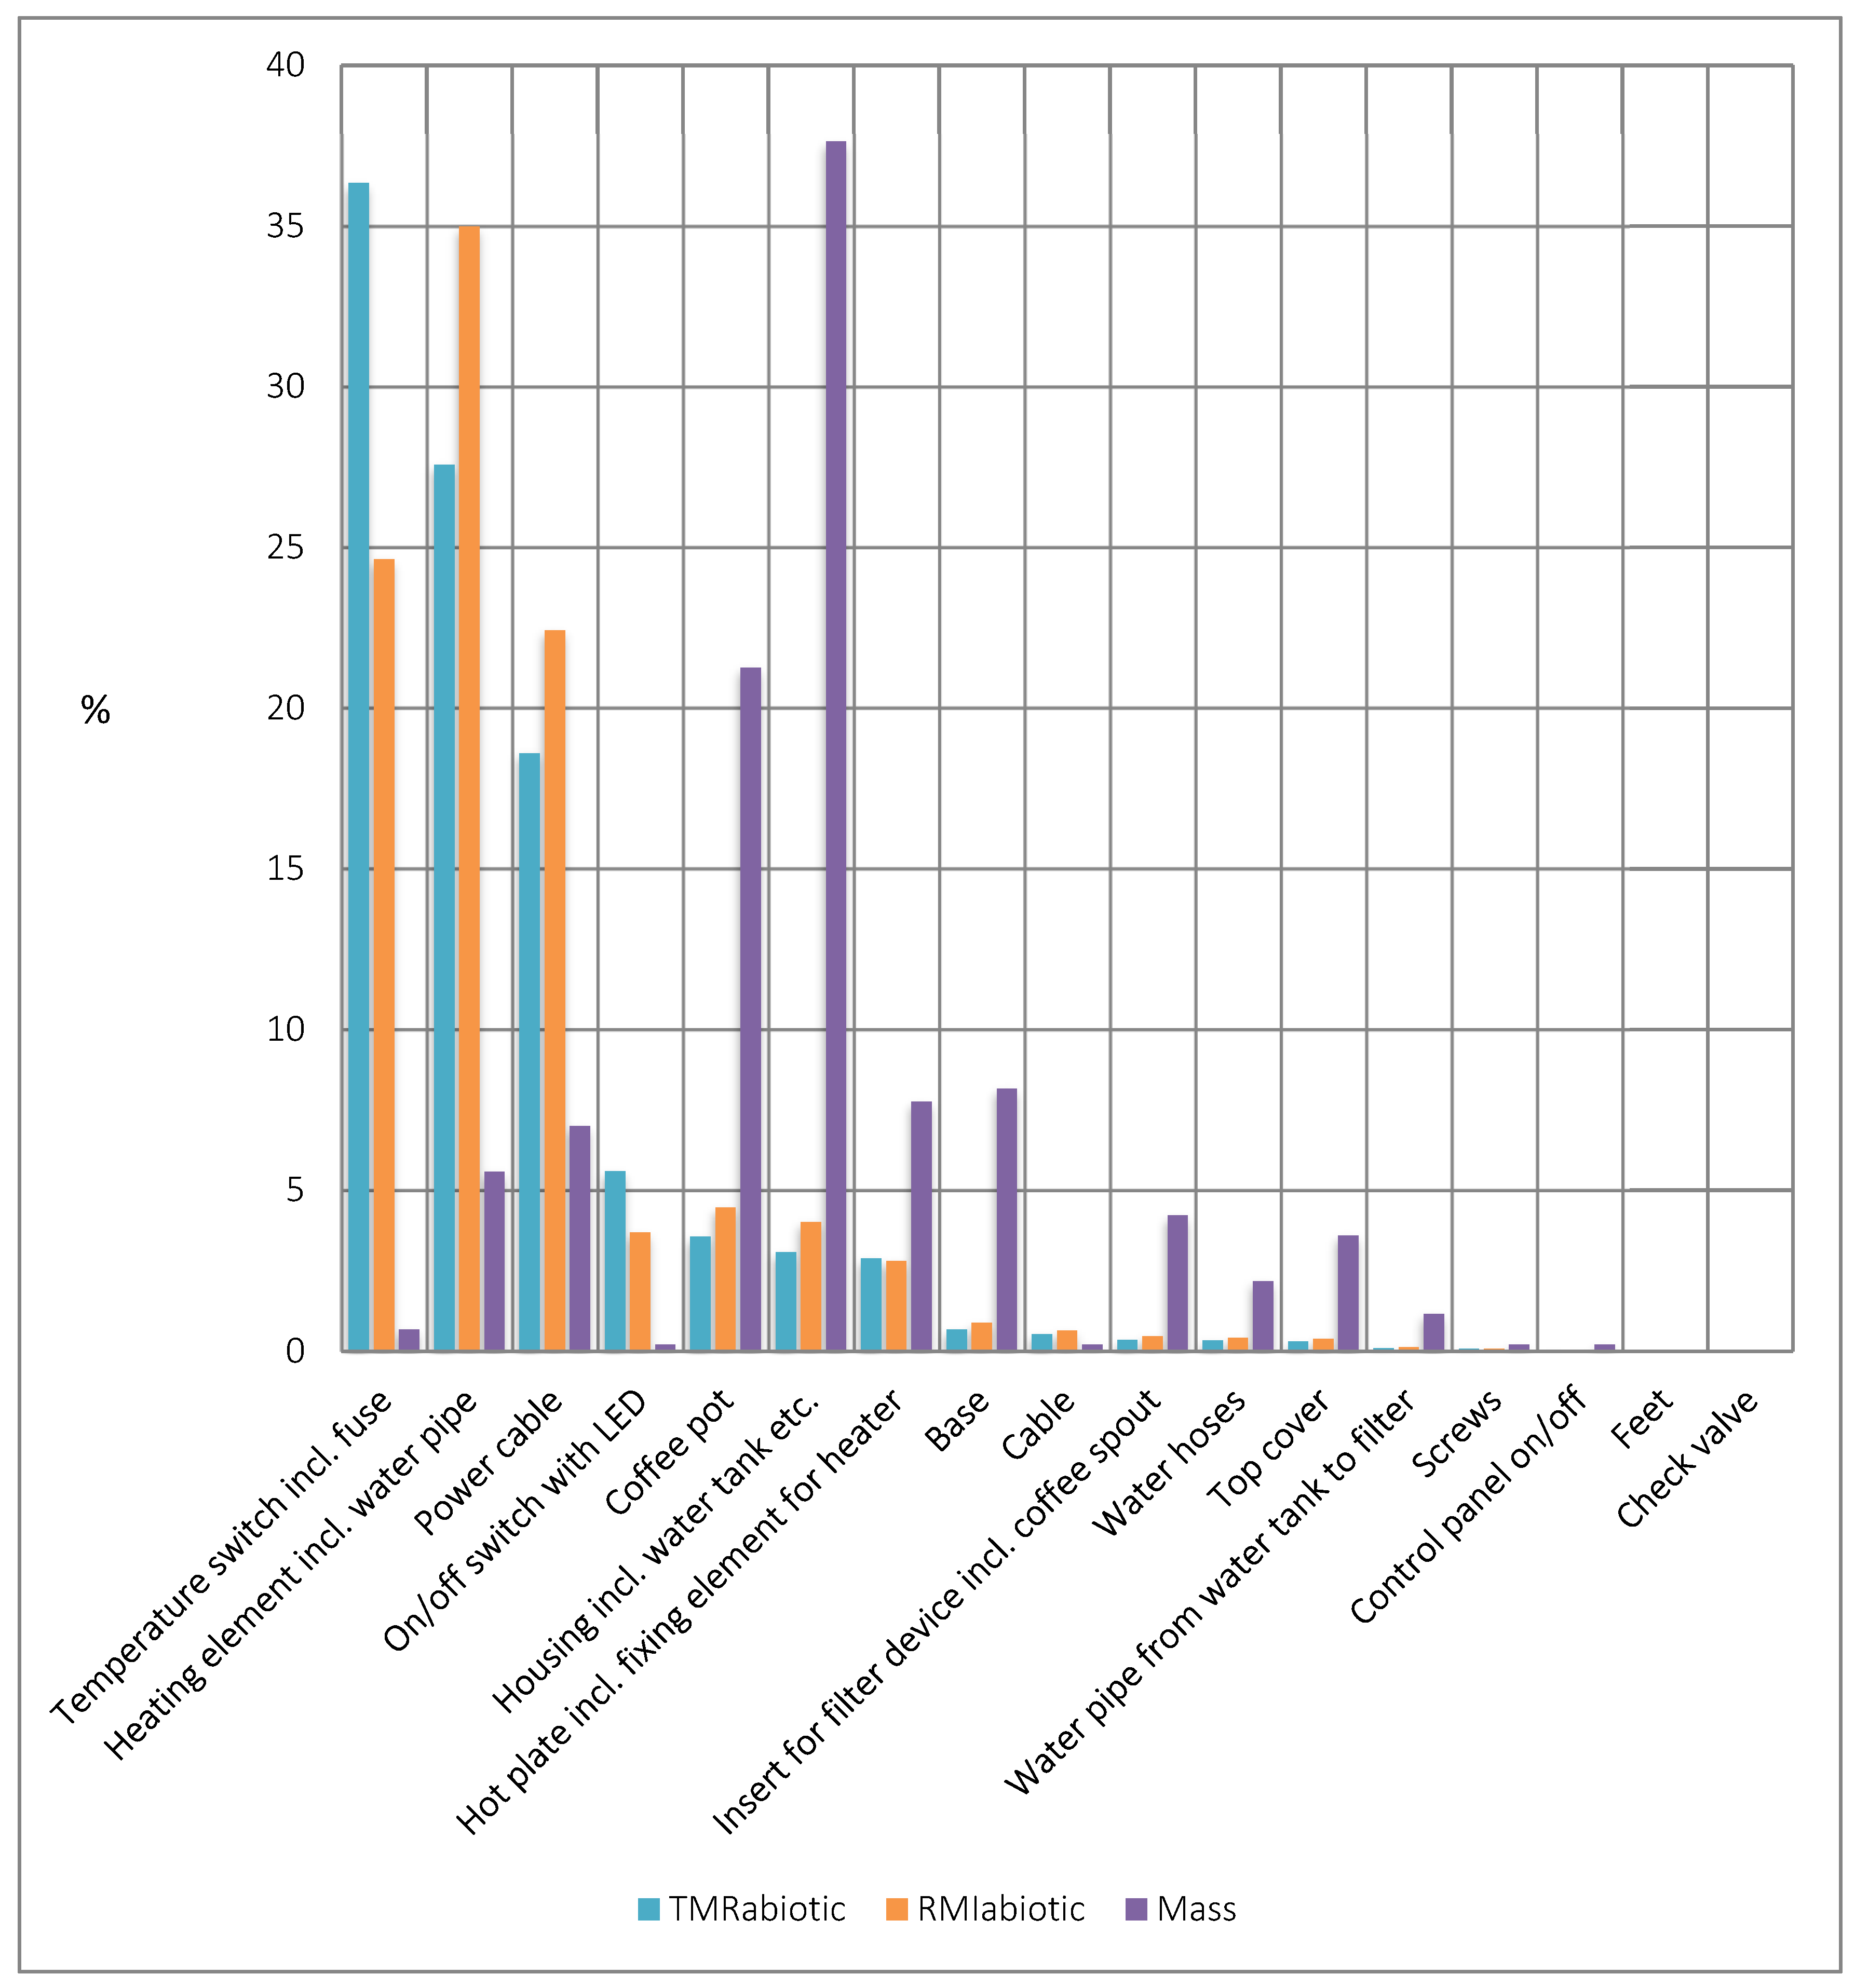
All in all, the production and packaging of the filter coffee machine is associated with a TMRabiotic of 64 kg and a RMIabiotic of 43 kg. The values of the two indicators and the mass are shown in Figure 4 as ratios across the individual components.
The figure shows that TMRabiotic, RMIabiotic and mass fractions are dominated by the temperature switch, the heating element and the power cable with high contribution numbers:
- The resource consumption of the temperature switch is mainly determined by the gold content in the electronic component.
- For the heater, aluminium production is the main driver for the high proportion of RMIabiotic of 35% and the TMRabiotic of almost 30%.
- Both indicators are also relatively high for the power cable. The copper contained in the cable is responsible for this.
- The mass is determined with the largest share (almost 40%) by the housing including the water tank, filter device and elements of the water flow (without bottom and lid).
The Supplementary Materials D section shows the modelling results for the filter coffee machine per component.
4.4. Coffee Pad Machine
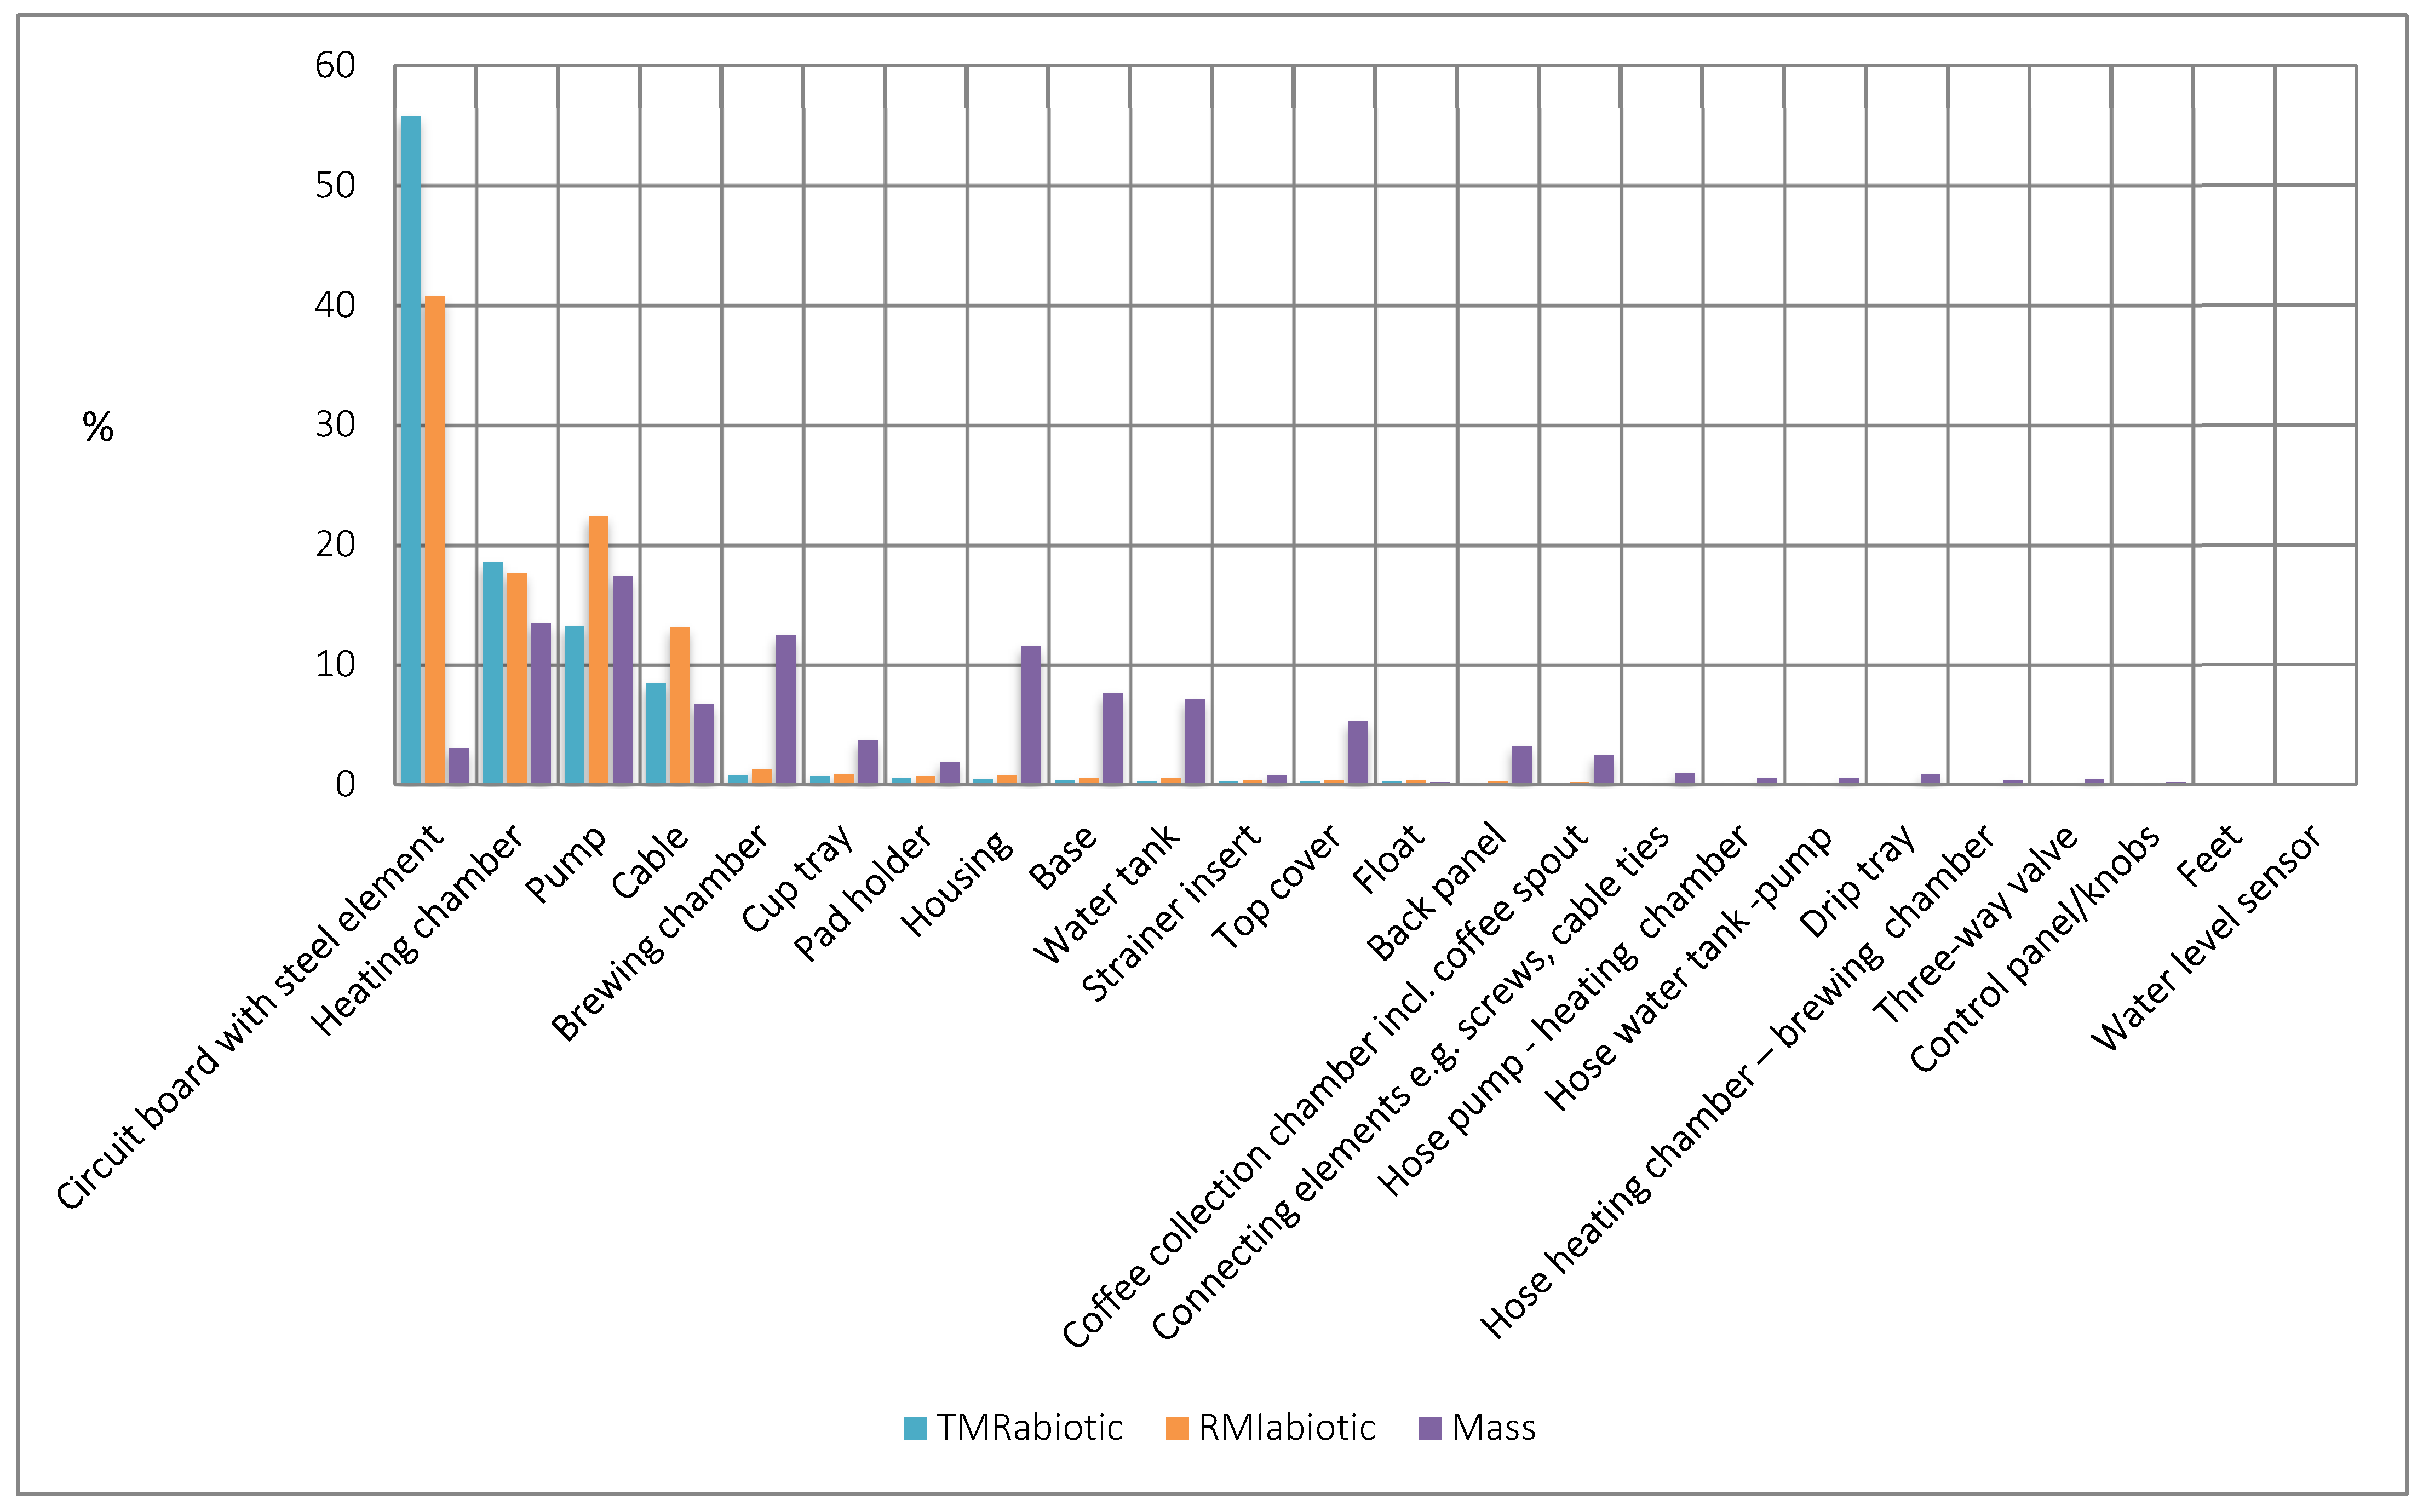
The production and packaging of the complete device generates a TMRabiotic of about 164 kg and RMIabiotic of 86 kg. Figure 5 illustrates the resource consumption for the different proportions related to the total device. The resource relevance is shown in comparison to the mass relevance.
The high TMRabiotic and RMIabiotic fraction is mostly due to the gold content of the PCB. In the heating chamber, gold production (for the electronic components) and stainless steel are also responsible for the majority of the resource consumption of the individual indicator values; neodymium in the permanent magnet and copper play a central role in the pump. Copper is also largely responsible for the cable’s resource consumption. These four components account for more than 94% of each indicator value’s resource consumption, while contributing to only about half as much of the device’s mass.
An overview of the calculated values for the RMIabiotic and TMRabiotic by component can be found in the Supplementary Materials D section.
4.5. Washing Machine
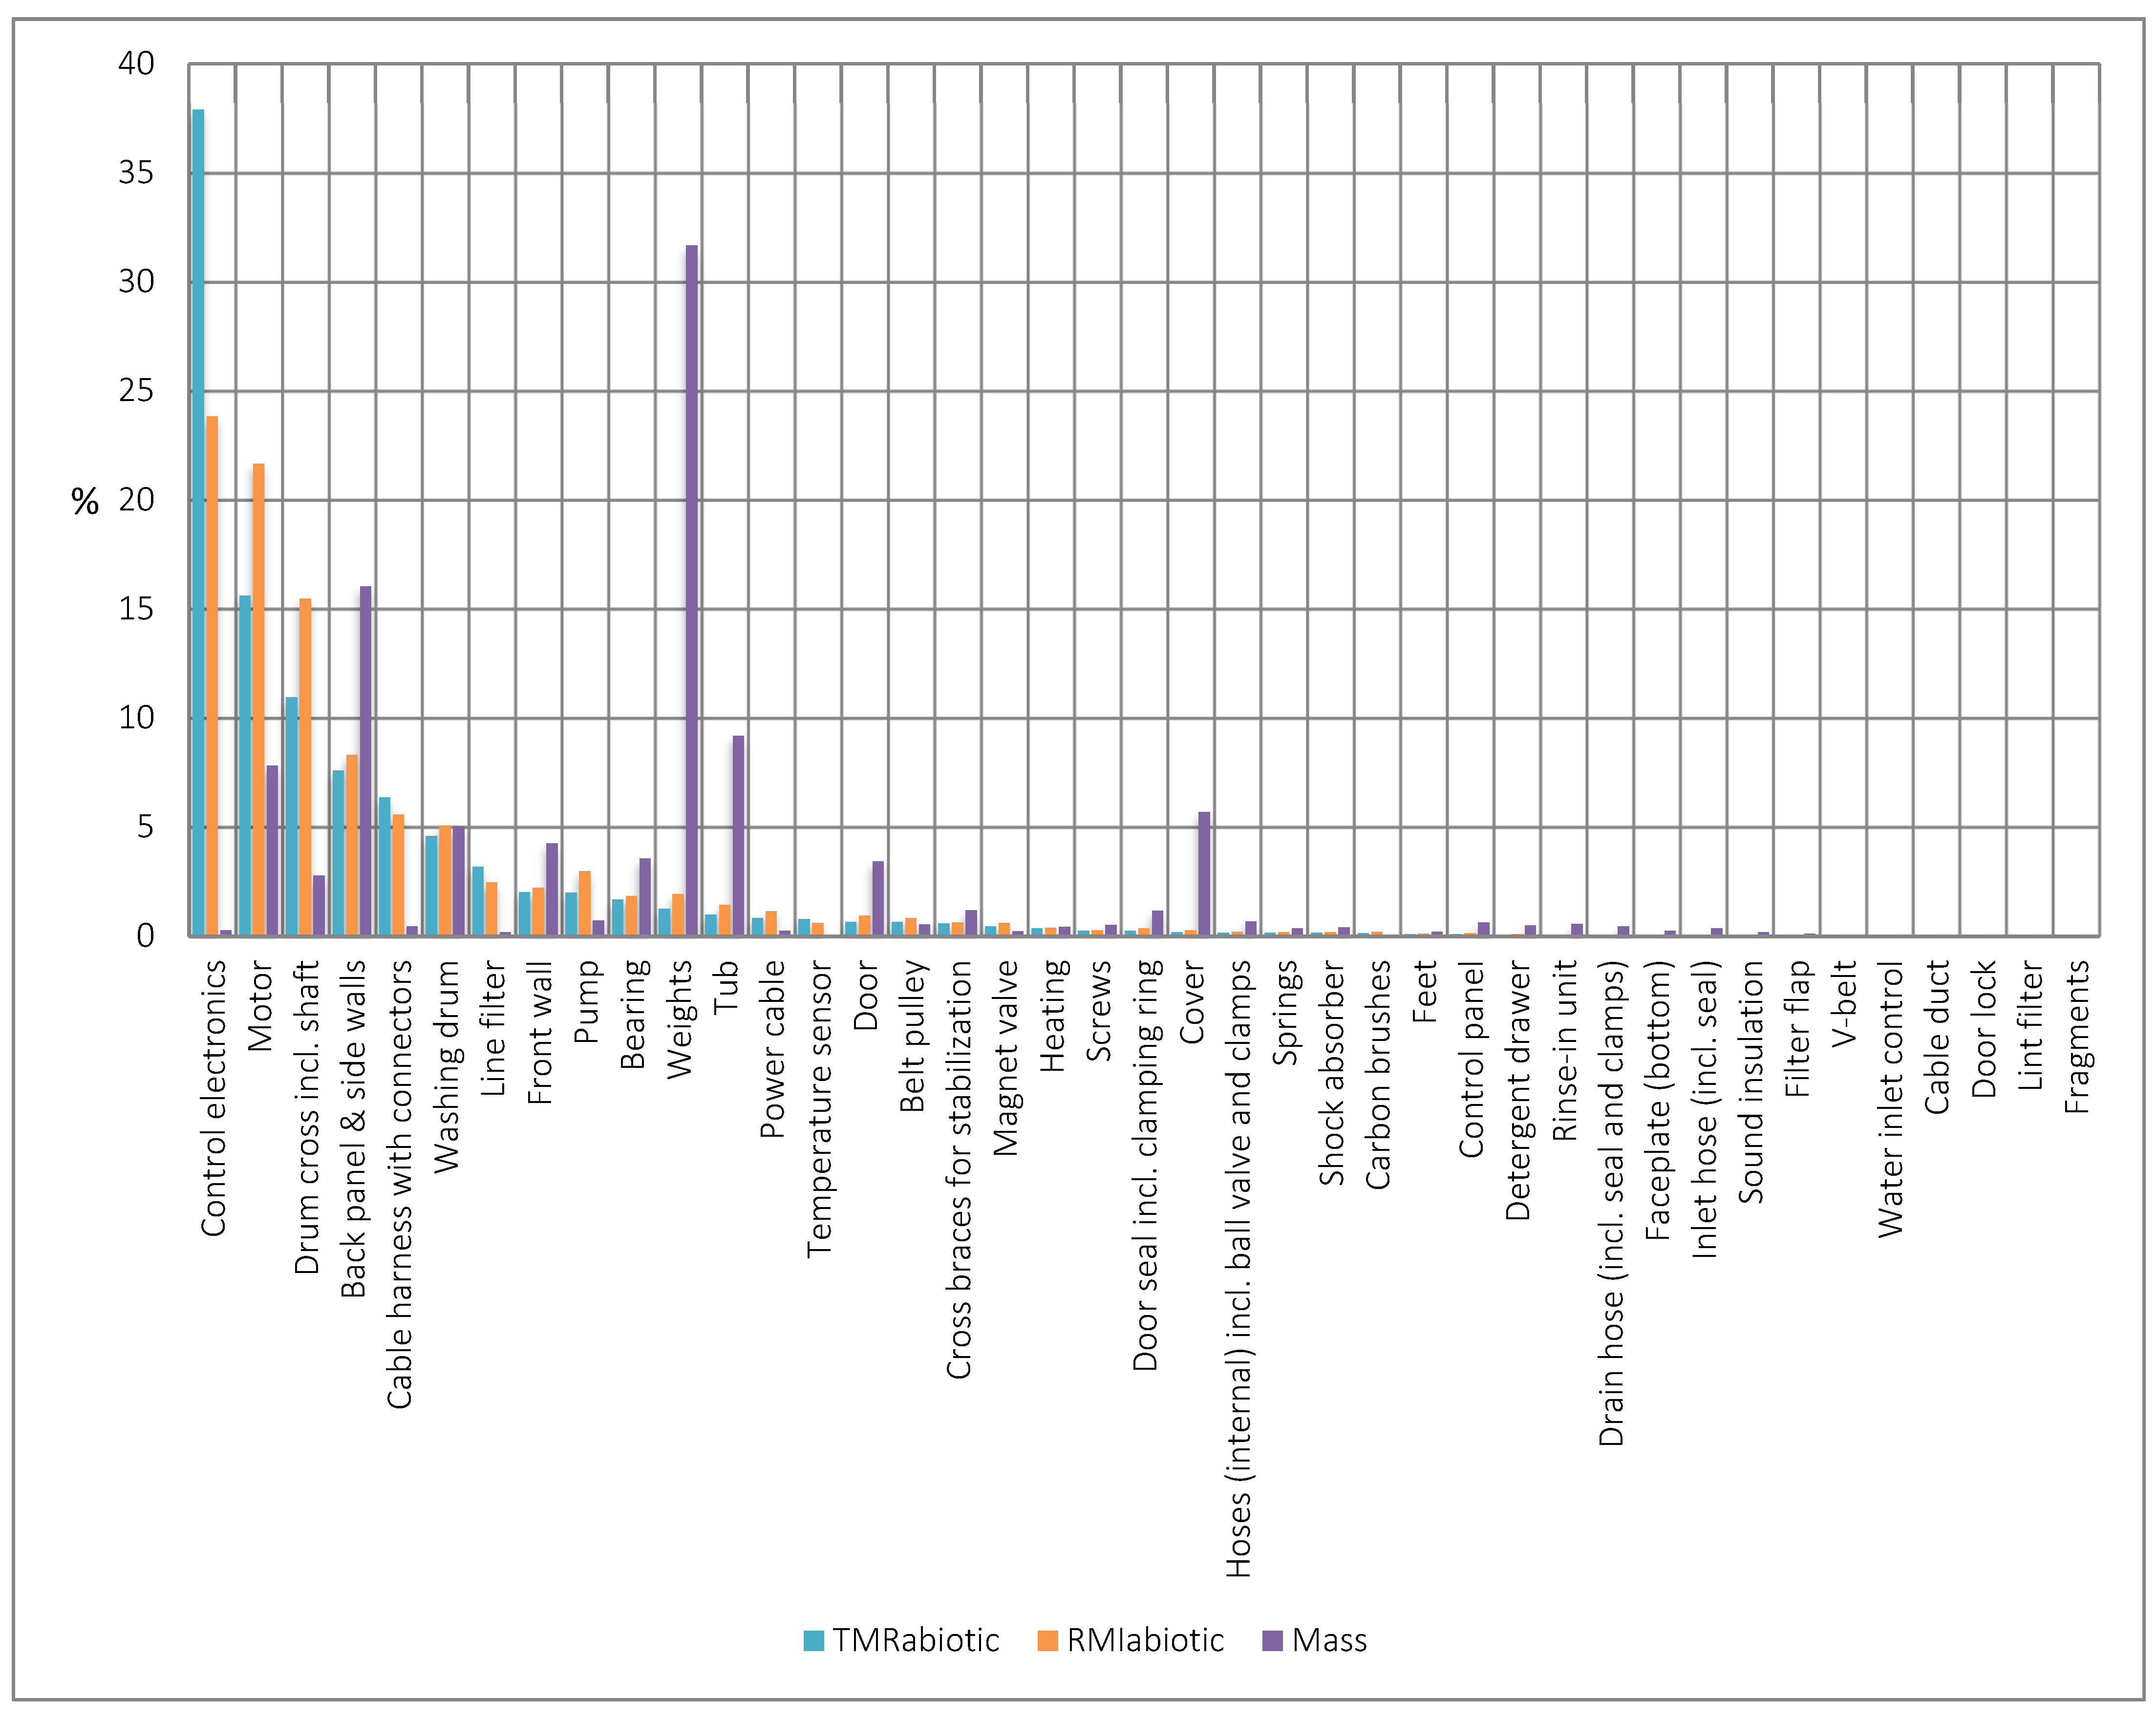
The production and packaging of the washing machine is associated with a TMRabiotic of 2292 kg and a RMIabiotic of 1393 kg. Figure 6 shows the resource and mass relevance of the individual components.
In particular, the PCB has a high environmental impact compared to its weight proportion. Thus, the PCB accounts for 38%, or 24% of the resources used, but its mass fraction is well below 1%. The (counter-)weights, on the other hand, are the components with the largest weight proportion but have a resource relevance of less than 2%.
The Supplementary Materials D section shows the modelling results of washing machine production and packaging.
4.6. Comparison of Results
Looking at the number of components with the highest absolute values for resource consumption, which account for at least 90% of the resource consumption of the entire device, it is clear that the resource relevance of all devices is dominated by a few individual components. In
- flat-screen monitors there are 5 (TMRabiotic) or 7 (RMIabiotic) out of 17, in
- loudspeaker boxes there are 2 (TMRabiotic and RMIabiotic) out of eight, in
- filter coffee machines there are five (TMRabiotic and RMIabiotic) out of 17, in
- coffee pad machines there are four (TMRabiotic and RMIabiotic) of 24 and in
- washing machines there are nine (TMRabiotic) or 10 (RMIabiotic) of 41 components.
A comparison of devices clearly shows that flat-screen monitors require by far the most resources related to the respective device’s weight (see Table 3). The differences between the specific TMRabiotic and RMIabiotic are smaller with the loudspeaker box than with the other products. Hence, the environmental impact at the resource extraction sites in the production of the flat-screen monitors, filter coffee machines, coffee pad machines and washing machines is relatively higher.
The considerable differences between the individual components as well as devices indicate that, on the one hand, repairing defects by exchanging components can lead to great variations, while on the other hand, the type of devices supplied for a second life cycle can also have a considerable influence on the potential resource savings.
5. Discussion
5.1. Findings
Overall, the results show that the primary material consumption for the production of the individual components are very different. A few components almost completely dominate the resource consumption of the entire device. Thus, if appliances are repaired and, for example, defective components with high resource relevance are replaced with new spare parts, the primary material consumption for the repair can be relatively close to the resource consumption for the production of a new appliance. Repair is therefore not always the most resource efficient way of dealing with WEEE, considering that the entire device’s life span, despite the repair of individual components, may no longer correspond to that of a new device. For example, the device may be subject to another irreparable defect within the following year, while a new device can be used for several years before the first defect occurs.
However, this picture changes with repairs that use reused spare parts. Therefore the results suggest that, in order to evaluate reuse practices, the focus should also be on repairing measures, such as the quantitative relevance of certain components with regard to replacement during repairs and the respective proportion of used and new spare parts.
A complete evaluation of repairs can only be done when considering the whole context. In addition to the technical product characteristics (design and materials), the reuse practice determines which resource effects ultimately result from repair and reuse measures. The concrete design of the collection, reprocessing and distribution structures (e.g., access to products, personal know-how) determines whether a particular product enters the repair process at all. Consumption patterns also play a role—for example, the offer of a cheap second-hand product can also lead to additional consumption that would not have taken place otherwise [39].
The results presented here on resource consumption of individual components should be seen as part of the knowledge required to evaluate reuse practices from a resource-conserving perspective.
5.2. Methodological Challenges
When interpreting the results, the extent to which the results are determined by methodological definitions, underlying data and assumptions must be taken into account.
In this sense, the assessment of data validity shows the following: between 6% and 24% (depending on the device) of the material compositions are estimated (see the Supplementary Materials C section). In contrast, the estimated values for the type of material are significantly higher, accounting for 43% to 54% for the filter coffee machine, coffee pad machine and washing machine, and over 90% for the flat-screen monitor and loudspeaker box. Consequently, variations in material composition could change the results.
In order to show the significance of the results depending on the material composition of the respective reference devices, the question of how the results would change is investigated, assuming that another device of the same type would be used instead of the reference device.
For this investigation, the material compositions of the reference device are first compared with those from the literature [40,41,42,43,44,45]. The material compositions in the literature are often only available at product level and not at component level, which is why the life-cycle inventories of the reference devices are aggregated at the product level. The total weight of the respective equipment is also compared. In addition, the sensitivity of the results with regard to the material composition of the permanent magnets used is examined where relevant. This applies to loudspeaker boxes and the coffee pad machine, as the permanent magnets in these devices account for a significant share of the total resource consumption of each indicator value. Supplementary Materials E section show relative sensitivities of influencing factors.
The results for the flat-screen monitor show that the significance of the results is still given despite the expected changes in resource consumption: flat-screen monitors have by far the highest specific resource consumption of each indicator value and the components with the highest share of resource relevance also remain unchanged. The results for the loudspeaker boxes react very sensitively to possible changes in the material compositions. The specific TMRabiotic and RMIabiotic of the coffee filter machine would double. In comparison to the other devices, the results would thus be approximately of the same order of magnitude as the results of the coffee pad machine. The specific TMRabiotic and RMIabiotic of the coffee pad machine differ only slightly from the original calculation. For the washing machine the results for the entire device can be considered robust.
The following exemplary calculation of the effort for the final assembly of a washing machine (as the largest and heaviest appliance with the most components) supports the assumption that the assembly effort can in principle be neglected. Data for modeling final assembly of a washing machine is based on the assumptions made by Gensch and Blepp [21]: electricity: 48 kWh per appliance, natural gas: 2.9 kWh per appliance, water: 23.6 kWh per appliance. The data includes the efforts required for assembly at the manufacturer’s site and may include additional steps besides the assembly of the components (e.g., cutting of sheets). For the washing machine, a TMRabiotic of 26 kg and a RMIabiotic of 17 kg can be respectively calculated for the assembly. This corresponds to only about 1% of the total effort for component production, assembly and packaging. The other devices (loudspeaker box, filter coffee machine, coffee pad machine) are less complex. Therefore it can be assumed that the assembly effort will be low, both in terms of the number of components and the components themselves. The same applies to flat-screen monitors: although flat-screen monitors are significantly more complex devices, it should be noted that the assembly of the components themselves, such as the assembly of the PCB and the assembly of the LC display, are included in the datasets of entire components and thus in the calculated component resource consumption. As a result, it can be assumed that the assembly effort will be low.
At this point, it is important to consider that some of the data in the Ecoinvent database (e.g., ore concentration) is outdated and can have a considerable influence on the modeling results. The Center for Environmental Systems Research (University of Kassel), for example, conducted a comparative study of the Copper Mine Operation coupling process in the cut-off variant for the production of copper and molybdenum concentrate in the Ecoinvent databases 3.1 and 3.3 for all existing regions. This investigation resulted in discovering that the data shown in the Ecoinvent database is either older than 15 years, or the age of the data is even unknown [46]. Therefore, it is urgently recommended to review the data in the near future.
6. Conclusions
In this paper, based on the life-cycle inventory data of five selected appliances, the resource consumption from raw material extraction to production and packaging is calculated per component using the life-cycle assessment method. The use of raw materials in the life cycle was measured by using two complementary indicators; the RMI as an indicator for the environmental pollution potential along with the production chain up to final disposal, and the TMR as an indicator for the environmental pollution at the raw material extraction locations. With the component as a reference value which enables an assessment of the resource consumption of individual components, a relevant research gap is closed. These assessments allow to for the understanding of the relationship between the primary material consumption required for a repair and the resource consumption for the production of a new appliance.
This paper has shown how important this information is, since it demonstrates that often the entire resource consumption of a product is dominated by only a few components.
A repair which includes resource-intensive components should be critically evaluated, and be supported only when reused components can be used.
Therefore, decisions during the reuse process should consider such aspects. Clearly, all other inputs in the product’s life cycle must also be taken into account, and undoubtedly those for the repairs, which are hardly found on this level of detail in the literature. The paper has provided insights on the need for further research on establishing databases with differentiated product information, e.g., on statistical failures of specific product components, their repair and the resource consumption of spare parts. Such databases can be used in the practice of reuse and are also part of the basis for informed policymaking to promote reuse and resource-efficient repair.
Supplementary Materials
The following supporting information can be downloaded at: https://0-www-mdpi-com.brum.beds.ac.uk/article/10.3390/resources11020024/s1, Supplementary Materials A: Specification of Products (Table S1); Supplementary Materials B: Assignment of Characterisation Factors (Table S2); Supplementary Materials C: Material Compositions per Appliance and Data Origin of Life Cycle Inventory Data (Tables S3–S8); Supplementary Materials D: PMR Results per Appliance (Tables S9–S18); Supplementary Materials E: Sensitivity Analysis—Significance of the Results Depending on the Material Composition (Table S19).
Author Contributions
Conceptualization N.v.G.; methodology, N.v.G.; validation, N.v.G.; formal analysis, N.v.G.; investigation, N.v.G.; data curation, N.v.G.; visualization, N.v.G.; writing, N.v.G.; review and editing N.v.G. and S.B.; supervision S.B. All authors have read and agreed to the published version of the manuscript.
Funding
This research received a grant from the German Federal Environmental Foundation. Financial support for publishing this article was provided by the University of Kassel.
Institutional Review Board Statement
Not applicable.
Informed Consent Statement
Not applicable.
Data Availability Statement
The data used to derive the results is freely available and contained in the article and Supplementary Materials.
Acknowledgments
This research was supported by the University of Kassel and the Wuppertal Institute for Climate, Environment and Energy.
Conflicts of Interest
The authors declare that they have no conflict of interest. The funders had no role in the design of the study; in the collection, analyses, or interpretation of data; in the writing of the manuscript, or in the decision to publish the results.
References
- European Commission. Study on the Review of the List of Critical Raw Materials; European Commission: Brussels, Belgium, 2017. [Google Scholar]
- Forti, V.; Baldé, C.P.; Kuehr, R.; Bel, G. The Global E-Waste Monitor 2020: Quantities, Flows, and the Circular Economy Potential; United Nations University (UNU)/United Nations Institute for Training and Research (UNITAR)—Co-Hosted SCYCLE Program International Telecommunication (ITU) & International Solid Waste Association (ISWA): Bonn, Germany; Geneva, Switzerland; Rotterdam, The Netherlands, 2020. [Google Scholar]
- Longmuß, J.; Dworak, C. Reparierbarkeit im Fokus. In Geplante Obsoleszenz: Hinter den Kulissen der Produktentwicklung; Poppe, E., Longmuß, J., Eds.; Transcript Verlag: Bielefeld, Germany, 2019; pp. 73–95. [Google Scholar]
- Prakash, S.; Dehoust, G.; Gsell, M.; Schleicher, T.; Stamminger, R. Einfluss der Nutzungsdauer von Produkten auf ihre Umweltwirkung: Schaffung einer Informationsgrundlage und Entwicklung von Strategien gegen “Obsoleszenz”. UBA Texte 11/2016. 2016. Available online: https://www.umweltbundesamt.de/sites/default/files/medien/378/publikationen/texte_11_2016_einfluss_der_nutzungsdauer_von_produkten_obsoleszenz.pdf (accessed on 21 December 2020).
- IRP. Re-Defining Value—The Manufacturing Revolution. Remanufacturing, Refurbishment, Repair and Direct Reuse in the Circular Economy; A Report of the International Resource Panel; United Nations Environment Programme: Nairobi, Kenya, 2018. [Google Scholar]
- EEA. Circular Economy in Europe—Developing the Knowledge Base. 2016. Available online: http://www.eea.europa.eu/publications/circular-economy-in-europe (accessed on 21 December 2020).
- Ellen MacArthur Foundation. Towards the Circular Economy—Opportunities for the Consumer Goods Sector. No. 2. 2013. Available online: http://www.ellenmacarthurfoundation.org/business/reports/ce2013 (accessed on 21 December 2020).
- Boldoczki, S.; Thorenz, A.; Tuma, A. The environmental impacts of preparation for reuse: A case study of WEEE reuse in Germany. J. Clean. Prod. 2020, 252, 119736. [Google Scholar] [CrossRef]
- Gusmerotti, N.M.; Corsini, F.; Borghini, A.; Frey, M. Assessing the role of preparation for reuse in waste-prevention strategies by analytical hierarchical process: Suggestions for an optimal implementation in waste management supply chain. Environ. Dev. Sustain. 2019, 21, 2773–2792. [Google Scholar] [CrossRef]
- Ardente, F.; Peiró, L.T.; Mathieux, F.; Polverini, D. Accounting for the environmental benefits of remanufactured products: Method and application. J. Clean. Prod. 2018, 198, 1545–1558. [Google Scholar] [CrossRef] [PubMed]
- UBA. Neue Waschmaschinen, Kühlschränke & Co ab 2021 Besser Reparierbar. 2019. Available online: https://www.umweltbundesamt.de/themen/neue-waschmaschinen-kuehlschraenke-co-ab-2021 (accessed on 21 December 2020).
- Right to Repair. The French Repair Index: Challenges and Opportunities. 2021. Available online: https://repair.eu/de/news/the-french-repair-index-challenges-and-opportunities/ (accessed on 21 March 2021).
- ECOS. EN 45554: A Standard That Works for the Environment. 2020. Available online: https://ecostandard.org/news_events/en-45554-a-standard-that-works-for-the-environment/ (accessed on 22 December 2020).
- Bracquene, E.; Peeters, J.R.; Burez, J.; De Schepper, K.; Duflou, J.R.; Dewulf, W. Repairability evaluation for energy related products. Procedia CIRP 2019, 80, 536–541. [Google Scholar] [CrossRef]
- Pini, M.; Lolli, F.; Balugani, E.; Gamberini, R.; Neri, P.; Rimini, B.; Ferrari, A.M. Preparation for reuse activity of waste electrical and electronic equipment: Environmental performance, cost externality and job creation. J. Clean. Prod. 2019, 222, 77–89. [Google Scholar] [CrossRef]
- Xue, M.; Xu, Z. Application of life cycle assessment on electronic waste management: A review. Environ. Manag. 2017, 59, 693–707. [Google Scholar] [CrossRef] [PubMed]
- Rocha, T.B.; Penteado, C.S.G. Life cycle assessment of a small WEEE reverse logistics system: Case study in the Campinas Area, Brazil. J. Clean. Prod. 2021, 314, 128092. [Google Scholar] [CrossRef]
- Ismail, H.; Hanafiah, M.M. Evaluation of e-waste management systems in Malaysia using life cycle assessment and material flow analysis. J. Clean. Prod. 2021, 308, 127358. [Google Scholar] [CrossRef]
- Pérez-Martínez, M.M.; Carrillo, C.; Rodeiro-Iglesias, J.; Soto, B. Life cycle assessment of repurposed waste electric and electronic equipment in comparison with original equipment. Sustain. Prod. Consum. 2021, 27, 1637–1649. [Google Scholar] [CrossRef]
- Withanage, S.V.; Habib, K. Life Cycle Assessment and Material Flow Analysis: Two Under-Utilized Tools for Informing E-Waste Management. Sustainability 2021, 13, 7939. [Google Scholar] [CrossRef]
- Gensch, C.-O.; Blepp, M. Betrachtungen zu Produktlebensdauer und Ersatzstrategien von Miele-Haushaltsgeräten; Öko Institut e. V.: Freiburg, Germany, 2015. [Google Scholar]
- Prakash, S.; Liu, R.; Schischke, K.; Stobbe, L. Timely Replacement of a Notebook under Consideration of Environmental Aspects. UBA Texte 44/2012. 2012. Available online: https://www.umweltbundesamt.de/sites/default/files/medien/461/publikationen/4316.pdf (accessed on 21 December 2020).
- Von Gries, N. Ressourcenpotenziale der “Vorbereitung zur Wiederverwendung” von Elektro- und Elektronikaltgeräten. Eine vergleichende Analyse in Flandern und Nordrhein-Westfalen. Ph.D. Thesis, Kassel University, Kassel, Germany, 2020. [Google Scholar] [CrossRef]
- VDI 2343; Recycling Elektrischer und Elektronischer Geräte—Reuse. Blatt 7. VDI-Gesellschaft Energie und Umwelt: Duesseldorf, Germany, 2013.
- Tecchio, P.; Ardente, F.; Mathieux, F. Analysis of Durability, Reusability and Reparability—Application to Washing Machines and Dishwashers. JRC Technical Report. 2016. Available online: http://publications.jrc.ec.europa.eu/repository/bitstream/JRC102632/lbna28042enn.pdf (accessed on 21 December 2020).
- Sander, K.; Marscheider-Weidemann, F.; Wilts, H.; Hobohm, J.; Hartfeil, T.; Schoeps, D.; Heymann, R. Abfallwirtschaftliche Produktverantwortung unter Ressourcenschutzaspekten. UBA Texte 52/2019. 2019. Available online: https://www.umweltbundesamt.de/sites/default/files/medien/1410/publikationen/2019-05-24_texte_52-2019_repro.pdf (accessed on 21 December 2020).
- Stratmann, B.; Grießhammer, R.; Bush, E. PROSA Espressomaschinen: Kriterien für das Umweltzeichen für Klimarelevante Produkte und Dienstleistungen. 2009. Available online: https://www.oeko.de/uploads/oeko/oekodoc/937/2009-043-de.pdf (accessed on 21 December 2020).
- DIN 40150; Concepts for the Arrangement in Connection with Functional and Constructional Units. DIN: Berlin, Germany, 1979. [CrossRef]
- DIN EN ISO 14040; Umweltmanagement-Ökobilanz-Grundsätze und Rahmenbedingungen. DIN: Berlin, Germany, 2009.
- DIN EN ISO 14044; Umweltmanagement-Ökobilanz-Anforderungen und Anleitungen. DIN: Berlin, Germany, 2018.
- Weidema, B.P.; Bauer, C.; Hischier, R.; Mutel, C.; Nemecek, T.; Reinhard, J.; Wernet, G. Overview and Methodology, Data Quality Guideline for the Ecoinvent Database Version 3; Ecoinvent Report No. 1(v3); The Ecoinvent Centre: St. Gallen, Switzerland, 2013. [Google Scholar]
- Ecoinvent Association. System Models in Ecoinvent 3. N.d. Available online: https://www.ecoinvent.org/database/system-models-in-ecoinvent-3/system-models-in-ecoinvent-3.html (accessed on 21 December 2020).
- Mostert, C.; Bringezu, S. Measuring Product Material Footprint as New Life Cycle Impact Assessment Method: Indicators and Abiotic Characterization Factors. Resources 2019, 8, 61. [Google Scholar] [CrossRef] [Green Version]
- Ritthoff, M.; Rohn, H.; Liedtke, C. MIPS Berechnen: Ressourcenproduktivität von Produkten und Dienstleistungen; Wuppertal Institut für Klima, Umwelt, Energie: Wuppertal, Germany, 2002. [Google Scholar]
- Schmidt-Bleek, F. Wieviel Umwelt Braucht der Mensch? MIPS—Das Maß für Ökologisches Wirtschaften; Birkhaeuser Verlag: Berlin, Germany; Basel, Switzerland; Boston, MA, USA, 1994. [Google Scholar]
- BMU. German Resource Efficiency Program III. 2020. Available online: https://www.bmu.de/download/deutsches-ressourceneffizienzprogramm-progress-iii/ (accessed on 13 June 2021).
- Wrisberg, N.; Udo de Haes, H.A.; Triebswetter, U.; Eder, P.; Clift, R. (Eds.) Analytical Tools for Environmental Design and Management in a Systems Perspective; Springer: Dordrecht, The Netherlands, 2002. [Google Scholar]
- Hischier, R.; Classen, M.; Lehmann, M.; Scharnhorst, W. Life Cycle Inventories of Electric and Electronic Equipment: Production, Use and Disposal; Ecoinvent Report No. 18; Technology & Society Lab, Swiss Centre for Life Cycle Inventories: Dubendorf, Switzerland, 2007. [Google Scholar]
- Cooper, D.R.; Gutowski, T.G. The environmental impacts of reuse: A review. J. Ind. Ecol. 2017, 21, 38–56. [Google Scholar] [CrossRef]
- Boeni, H.; Widmer, R. Entsorgung von Flachbildschirmen in der Schweiz. 2011. Available online: https://www.swico.ch/media/filer_public/1c/4d/1c4d7923-7c18-4023-a514-3377fc95f99a/entsorgung_von_flachbildschirmen_in_der_schweiz.pdf (accessed on 21 December 2020).
- Salhofer, S.; Spitzbart, M.; Maurer, K. Recycling of flat screens as a new challenge. Proc. ICE—Waste Resour. Manag. 2012, 165, 37–43. [Google Scholar] [CrossRef]
- Mudgal, S.; Tinetti, B.; Lyons, L.; Lavelle, P.; Cornier, A.; Sannier, C.; Jean-Jean, A. Preparatory Studies for Ecodesign Requirements of EuPs (III), Lot 25 Non-Tertiary Coffee Machines, Task 4: Technical Analysis of Existing Products; BIO Intelligence Service: Paris, France, 2011. [Google Scholar]
- Ebersberger, R. Energieoptimierte Nutzungsdauern von Produkten—Methodik, Anwendung, Beispiel; TU Muenchen: Munich, Germany, 1996. [Google Scholar]
- Presutto, M.; Stamminger, R.; Scialdoni, R.; Mebane, W.; Esposito, R. Preparatory Studies for Eco-design Requirements of EUPs, Lot 14: Domestic Washing Machines & Dishwashers; Institute of Studies for the Integration of Systems: Rome, Italy, 2007. [Google Scholar]
- Boyano, A.; Cordella, M.; Epinosa, N.; Villanueva, A.; Graulich, K.; Rudenauer, I.; Alborzi, F.; Hook, I.; Stamminger, R. Ecodesign and Energy Label for Household Washing Machines and Washer Dryers. JRC Technical Report. 2017. Available online: https://ec.europa.eu/jrc/en/publication/ecodesign-and-energy-label-household-washing-machines-and-washer-dryers (accessed on 21 December 2020).
- Kaiser, S. Kupfer- und Molybdäninput in Ecoinvent 3.1 und 3.3; Center for Environmental Systems Research, University of Kassel: Kassel, Germany, 2018; Unpublished work. [Google Scholar]
Figure 1.
System boundary—production, final assembly and packaging of the devices.

Figure 2.
TMRabiotic, RMIabiotic and mass fractions of components, production and packaging, Flat-screen monitor.
Figure 2.
TMRabiotic, RMIabiotic and mass fractions of components, production and packaging, Flat-screen monitor.

Figure 3.
TMRabiotic, RMIabiotic and mass fractions of components, production and packaging, loudspeaker boxes.
Figure 3.
TMRabiotic, RMIabiotic and mass fractions of components, production and packaging, loudspeaker boxes.

Figure 4.
TMRabiotic, RMIabiotic and mass fractions of components, production and packaging, filter coffee machine.
Figure 4.
TMRabiotic, RMIabiotic and mass fractions of components, production and packaging, filter coffee machine.

Figure 5.
TMRabiotic, RMIabiotic and mass fractions of components, production and packaging, coffee pad machine.
Figure 5.
TMRabiotic, RMIabiotic and mass fractions of components, production and packaging, coffee pad machine.

Figure 6.
TMRabiotic, RMIabiotic and mass fractions of components, production and packaging, washing machine.
Figure 6.
TMRabiotic, RMIabiotic and mass fractions of components, production and packaging, washing machine.


Table 1.
Number of components and weight of the selected appliances.
| Device | Number of Components Per Device | Total Weight of the Device in g |
|---|---|---|
| Flat-screen monitor | 17 | 5712 |
| Loudspeaker box | 8 | 2298 |
| Filter coffee machine | 17 | 1472 |
| Coffee pad machine | 24 | 1865 |
| Washing machine | 41 | 70,122 |
Table 2.
Packaging of the devices.
| Device | Weight (kg) | Material | Reference |
|---|---|---|---|
| Washing machine | 3.84 | 84% coarse chipboard *, 10% polystyrene, 6% cardboard | Gensch and Blepp [21] |
| Flat-screen monitor | 1.5 | 45% polystyrene, 55% cardboard | Hischier et al. [38] |
| Filter coffee machine, coffee pad machine, loudspeaker box | 1.5 | 45% polystyrene, 55% cardboard | Assumption as flat-screen monitor |
* Data set used requires input value in volume. Dimension estimated at 0.005 m3. Estimate based on the assumption that the density of the coarse chipboard is 600 kg/m3.
Table 3.
Specific TMRabiotic and RMIabiotic.
| Device | TMRabiotic, kg/kg | RMIabiotic, kg/kg |
|---|---|---|
| Flat-screen monitor | 391.42 | 173.15 |
| Loudspeaker box (per box) | 126.51 | 117.42 |
| Filter coffee machine | 40.59 | 27.04 |
| Coffee pad machine | 85.79 | 44.37 |
| Washing machine | 32.05 | 18.91 |
Publisher’s Note: MDPI stays neutral with regard to jurisdictional claims in published maps and institutional affiliations. |
© 2022 by the authors. Licensee MDPI, Basel, Switzerland. This article is an open access article distributed under the terms and conditions of the Creative Commons Attribution (CC BY) license (https://creativecommons.org/licenses/by/4.0/).
Share and Cite
MDPI and ACS Style
von Gries, N.; Bringezu, S. Using New Spare Parts for Repair of Waste Electrical and Electronic Equipment? The Material Footprint of Individual Components. Resources 2022, 11, 24. https://0-doi-org.brum.beds.ac.uk/10.3390/resources11020024
AMA Style
von Gries N, Bringezu S. Using New Spare Parts for Repair of Waste Electrical and Electronic Equipment? The Material Footprint of Individual Components. Resources. 2022; 11(2):24. https://0-doi-org.brum.beds.ac.uk/10.3390/resources11020024
Chicago/Turabian Stylevon Gries, Nadja, and Stefan Bringezu. 2022. "Using New Spare Parts for Repair of Waste Electrical and Electronic Equipment? The Material Footprint of Individual Components" Resources 11, no. 2: 24. https://0-doi-org.brum.beds.ac.uk/10.3390/resources11020024
Note that from the first issue of 2016, this journal uses article numbers instead of page numbers. See further details here.