Influence of Forestry Practices Cost on Financial Performance of Forestry Investments


Department of Forestry and Environmental Conservation, Clemson University, Clemson, SC 29634-0317, USA
*
Author to whom correspondence should be addressed.
Resources 2019, 8(1), 28; https://0-doi-org.brum.beds.ac.uk/10.3390/resources8010028
Submission received: 14 December 2018
/
Revised: 26 January 2019
/
Accepted: 28 January 2019
/
Published: 31 January 2019
Abstract
:Understanding forestry practices cost is important for predicting the financial outcome of forest management activities. Assessing costs of practices that will be used in the future can be difficult and may result in over or underestimations of financial returns depending on the values used. We used historic real average rates of cost change for the southern United States to assess changes in the values of several loblolly pine plantation management scenarios over time through the use of discounted cash flow (DCF) analysis. Additionally, we analyzed the impact of certain practices cost changes on the financially optimal number of thinnings and rotation age. Findings indicated that declining costs for herbicide site preparation could all but offset the increasing costs of other practices and that a relatively slight increase in timber prices would more than compensate for increasing costs. Also, increasing thinning costs could exacerbate the effects of low sawtimber prices, further decreasing the viability of regimes with multiple thinnings. In the face of stagnant timber prices, the use of operator-select thinnings, and herbicide site preparation could stabilize the long-term financial value of plantation management.
1. Introduction
Growing timber and managing forestland require a long-term approach to understanding how forestry investments produce financial returns. Final timber harvests on traditionally managed forests can involve very long timeframes and changing timber prices and management costs produce uncertainty in expected investment returns [1]. Financial analysis techniques like discounted cash flow (DCF) or net present value (NPV) analyses can assist forest owners in projecting expected financial outcomes from timber-related forestry investment and management decisions.
The key factors in DCF analysis needed to project financial return are the value of the timber to be harvested, other income that might occur during a timber rotation, the costs associated with establishing the timber stand and for ongoing forest management, the timing of those costs and revenues, and the interest rate that the investment is expected to earn [1]. That most costs occur upfront, at or near the time of forest stand establishment, means that forest owners tend to be heavily influenced in terms of their perceptions of expected profitability and the decision to regenerate a stand [2,3,4].
Additionally, the level of investment in forest management intensity has a substantial impact on long-term timber supply [5], and as an extension, timber supplies are influenced by forest practices cost, as these costs influence what practices are used and, thus, on how forests are managed [6]. Intensive forest management is based on intensive silviculture designed to maximize forest productivity and involves forestry practices like high levels of site preparation prior to tree planting, the use of more costly genetically superior tree seedlings, competition control using herbicides and fertilization. These forestry practices are costly and the justification for them is increased forest yields, impacting timber supply and leading to higher investment returns.
Reliable cost data is imperative to developing timber management regimes that accurately reflect financial performance expected from a timber investment [6]. Immediate reforestation projects offer the advantage that the major upfront costs occur near the present and produce little difficulty in terms of estimation (solicitation of bids from local contractors can provide this information). However, timber management regimes include other costs that extend well out into the future, making cost projections more difficult.
We provide a temporal analysis of these forest practices cost data for the southern United States to allow for more accurate estimates of timber investment financial performance. Our objectives were to analyze long-term trends in forestry practices cost in terms of real (net of inflation) changes in cost trends and to identify factors that may have contributed to these changes. Moreover, we incorporate historical forestry practices cost trends into typical timber management regimes to quantify the impact of these costs on the financial feasibility of these timber management scenarios. We note that cost changes have the potential to alter optimal rotation lengths of timber investments or otherwise shift optimal use of forestry practices [7,8,9]. We used DCF analysis to analyze changes in the profitability of various timber management regimes assuming current costs and changing costs over time, as well as changes in the financially optimum number of thinning regimes and rotation length. The profitability of thinnings has changed over the last few decades as additional wood products have allowed for a better market for small-diameter trees (forest products like wood pellets that can used for bioenergy and “chip and saw” where small trees are used to produce both lumber and wood chips). Our results will allow forest owners to better understand forestry practices cost influences on the profitability of pine plantation forestry in the U.S. South.
2. Literature on Forest Practices Cost
Interest in southern forestry practices cost relates to the rise of intensive forest management in the American South beginning in the second half of the twentieth century, with planted southern pine area increasing from one percent to 15% of the region’s timberland area during those 50 years [10]. Increased forest productivity, staring with the southern pine plantation of the early 1950s extending to superior plantations of the twenty-first century, powered this change; mean annual increment of pine plantations, now intensively-managed, doubled over the same time period, while average rotation length halved [11]. Intensive forest management involved innovations in site preparation methods, genetically improved seedlings, vegetation control, and fertilization. These improvements led to changes in the associated forest management regime in terms of the magnitude and timing of costs [12].
Intensive forestry in the American South began with efforts to create conditions similar to the “old field” that foresters observed when reforesting abandoned agricultural land. This was mainly accomplished via hardwood control [13]. The process started in the mid-1950s with roller-drum choppers, with disk harrows quickly introduced to better control hardwoods and provide soil tillage like old fields. Over the next two decades shearing, windrowing, and broadcast disking became common, culminating in large bulldozers and three-pass systems [14]. Fertilization became common by the 1980s and chemical site preparation began to replace mechanical site preparation by the 1990s on the majority of sites [15]. Integrated forest operations and changing technology resulted in shifts in forest practices cost patterns [16]. This ever-changing spectrum of forestry practices is crucial to understanding the foundation of changes in cost patterns.
Understanding the costs associated with timber production is necessary for analyzing the financial performance of any timber management regime. Average forestry practices costs for the South have been reported since 1953 in Forest Landowner magazine (formerly Forest Farmer magazine) using survey results provided by both private and public forestland managers [17,18,19,20,21,22,23,24,25,26,27,28,29,30,31,32,33,34,35,36,37,38,39,40]. This source is considered the most preeminent source of forestry practices cost data for the United States [6]. We cited the entire series above to aid forest analysts who might want to use the time series as the complete set of data is seldom identified and can be difficult to locate.
There have been a few analyses of the data from this set of surveys, but none have utilized the entire data set or provided any sort of detailed statistical analyses. The first economic trend analysis of this data, covering 24 years, occurred in 1982 and found forestry practices cost rising substantially faster than both the price of southern pine lumber and the whole price index, suggesting that the cost of practicing forestry was outpacing inflation and any potential increase in the price of southern pine sawtimber [41]. A 1991 study constructed cost indices for nine commonly used forestry practices in the South for the years 1982 to 1988, creating simple price indices for each practice and developing a Southern Forest Practices Cost Index (SFPCI) as a metric for tracking changes in forestry practices cost as a conglomerate, along with a Southern Forestry Employee Wage Index (SFEWI) [42]. Using only data from private forestry firms, the study found that both the SFPCI and SFEWI rose slightly less than inflation, suggesting that forestry practices cost increases were moderating [42].
There were other forestry practices cost studies during this time period that did not utilize the Forest Landowner/Forest Farmer surveys, but these tended to be much more limited in terms of timeframe and detail due to much more limited data. Even for the major timber producing regions forestry practices cost estimates are very limited [43,44]. One study utilized forestry practices cost data from national forests and found a significant relationship between forestry practices cost and the number of people employed by the contractors hired to complete forestry treatments, reinforcing the relationship between labor costs and silvicultural practices cost [45]. Other forestry practices analyses used limited data at the national level to determine temporal and regional cost trends, noting the real costs of some major forestry practices had remained relatively constant in real terms between 1982 and 2002, with a few costs rising slightly [6]. Also, timber management cost data has been utilized in timber production modeling and, in estimating carbon sequestration prospects [46,47,48,49], with various modeling techniques [50].
Forest management practices cost is often an integral part of timber management investment analyses, with discussion of costs and cost trends for various practices and management intensity levels [51,52,53,54,55]. Likewise, other nontimber aspects of forest management activities, like best management practices and water quality issues, often involve investment analyses that include forest practices cost [56,57,58]. Forest practices cost was also analyzed for special situations like post-hurricane reforestation activities or specific practices like tree planting [59,60,61].
Updated forestry practices cost data and its analysis is considered relevant to better understanding potential for profit as well as the future direction of the forestry industry [6]. A recent study analyzed Southern forestry practices cost between 1982 and 2016 finding that the real cost of controlled burning had continued to rise while the cost of herbicide applications had declined [62]. Other practices, like mechanical site preparation, had declined slightly or remained relatively steady in cost, with labor intensive practices such as hand planting and timber cruising increasing in cost [62]. This recent analysis of cost trends has the potential to be applied to analysis of forestry profit potential.
3. Analyzing the Effects of Cost Change
NPV is defined as the total discounted revenue, net of all discounted costs [1], and is calculated using the following formula.
where is the real discount rate (expressed as a decimal), represents the initial investment, represent a revenue or cost (that would have a negative value for a cost) in a given year after the initial investment, and is the final harvest revenue at rotation age . NPV can also be used to assess optimal timber rotation age by assuming final harvest will take place in the year at which these criteria are maximized [63].
When calculating NPV, values for costs and revenue streams occurring in the future may require assumptions on expected changes, or a real interest rate (one that does not include inflation) may be used and only changes over or above inflation need to be estimated (this is called a constant dollar approach). Southern forest practices costs have been well-documented since 1953 and analyses of those cost series provide reliable trends that support a constant dollar approach in evaluating timber investment alternatives [62]. Timber stumpage prices, of course, are a second set of assumptions that impact timber investments. In addition to changing costs, pine sawtimber prices in the South have decreased by 20% since the recession of 2008, while pine pulpwood prices showed an increase of 18% between 2008 and 2016 [64]. Given the state of stumpage prices in the South, it becomes logical that some landowners may benefit from growing smaller diameter trees for pulpwood over the course of shorter rotations, which inevitably means fewer thinnings. Increasing costs of practices associated with thinning (i.e., timber marking and cruising) may only exacerbate this trend [65].
Addressing the possibility of future changes in financial performance of timber rotations due to changes in forest practices costs requires identification of temporal changes in costs trends, what affects these trends, and how these trends can be used for cost projection. Additionally, it may be beneficial to simulate these cost changes in conjunction with a variety of feasible forest management scenarios in order to assess what combination of practices might provide for the highest valued timber rotations over time. Such analysis becomes particularly pertinent given the variety of possible practices that can be used, and that a mix of practices may be used over the course of a rotation, some of these practices increasing in cost while others are decreasing in cost. It also is left uncertain that given current low sawtimber prices and increasing forest management costs, whether a more intensive management regime with two thinnings and a later harvest will remain the most profitable option at moderate discount rates.
Forestry investments have several characteristics that impact investment financial performance and the structure of the costs, mainly high front end sunk costs (in terms of site preparation and tree planting) that occur at the very beginning of the timber rotation and very long time horizons (as long as 30 to 35 years for timber rotations in the southern United States). Timber markets are driven by a derived demand from end products like housing and paper, leading to significant volatility in timber prices in particular, but also a cost structure that also exhibits considerable volatility. The cost series that are the basis of this study are subject to that volatility. Mean Absolute Percentage Error (MAPE) is commonly used in trend analysis to report the size of forecast error for growth rate of costs as a percentage of the actual growth rate from the survey. For the forestry practices we discuss, the MAPE ranged from 10.7% for fertilization to 27.7% for timber marking, meaning that if we forecasted annual growth rate based on past growth rate our forecast error would be in that range. MAPE is one of the most common tools to evaluate forecast error and is also used to evaluate volatility. The statistic range obtained for the forest practices indicates that, like for many cost series, our forest practices cost series contains appreciable volatility. Our discussion of cost trends is tempered by that volatility.
Therefore, the objective of this study was to analyze the comparative financial viability of loblolly pine plantation management using various management practices and to simulate and to analyze the effects of changing costs of forestry practices on these regimes over time using DCF techniques and assuming average rates of past change. This was done through two separate analyses: Analysis of the change in value of timber rotations due to cost change under the assumption of fixed thinning regimes and rotation ages, and analysis of change in the financially optimal number of thinnings and rotation ages given cost change.
4. Methods: Determining Effects of Cost Trends
4.1. Management Scenarios and Yield Modeling
The management scenarios in this study were comprised of common practices used for timber rotations geared towards the production of loblolly pine sawtimber. Thinnings occurred when the stands reached a basal area of 25.3 m2/ha and were thinned to a basal area of 16.1 m2/ha. First thinnings were fifth row thinnings combined with thinning from below and second thinnings were thinnings from below. The exact year the thinnings occurred depended on the site preparation method and whether or not a mid-rotation fertilization/hardwood control were included and are presented in Table 1. Ptaeda 4.0 growth and yield simulation software was used to simulate the yields produced by each management regime [66]. This software was chosen due to its prevalent use in the literature and its ability to simulate the effects of various site preparation techniques, as well as varying levels of hardwood competition. Mechanical site preparation techniques were simulated in Ptaeda 4.0 by specifying the treatments of shear, pile and disk, and chop and burn options available for site conditions. Additionally, levels of hardwood competition for each site preparation technique were specified using values for percent hardwood basal area from work that tracked loblolly pine plantation growth and yield as well as levels of hardwood competition for the site preparation techniques specified in Table 1, over an eighteen-year period [67]. Burn only and herbicide, and burn site preparation were simulated solely by specifying hardwood competition levels.
Management regimes which included hardwood chemical release and fertilization received mid-rotation release treatments for the reduction of hardwood competition and wildlife habitat improvement in the year in which the first thinning occurred. These treatments were assumed to reduce hardwood competition by 80%. Fertilization was specified in the year following the first thinning, which included 224 kg ha−1 of nitrogen plus phosphorous. In order to represent a site of average quality, the default site quality of fair (SI = 19 m at base age 25 years) was specified for all scenarios. Since analysis of impact on the financially optimal number of thinnings and rotation ages was primarily focused on changes in costs that are associated with thinnings and harvesting, i.e., timber cruising and marking, it was deemed sufficient to simulate only one site preparation technique. Therefore, for the optimal regime analysis only the use of the practices in management regime 4 were simulated, as herbicide application is the most common form of site preparation in the Piedmont and Upper Coastal Plain regions of the U.S. South [11] and the regime likely represented an average level of management intensity for the South.
4.2. Cost Change
Forest practices costs used in this study were obtained from the most recent Forest Landowner cost study [40] and represent average costs for southern U.S. forestry practices reported for 2016, presented in Table 2. Seedling costs were obtained from the South Carolina Forestry Commission. For simplicity sake it was assumed that property taxes were offset by a hunting lease (not uncommon in the South), and all costs or fees associated with administering timber sales other than those associated with cruising and marking timber were not included in the analysis.
Real annual rates of change for costs were determined between the above specified costs for 2016 and those for 1988 and are also presented in Table 2 [26]. The year 1988 was chosen as this was the first year in the cost trends studies that provided costs specifically for chemical site preparation and chemical release. Due to the specificity provided in the 1988 and 2016 studies, cost change rates for drum chopping (reported as drum chopping in 1988 and single pass mechanical treatments in 2016), chemical site preparation, site preparation burns, chemical release treatments, and tree marking for thinning plantations were determined for those specific practices. The rates of change for all other practices were determined using the cost values associated with the overall average for all practices in that practice category (i.e., all fertilization, all timber cruising, etc.). Factors that have influenced the rates of cost change used in this analysis include increases in forestry wages, declines in herbicide prices, and the increased logistical difficulties of controlled burning, among others [62]. Though cost data indicated a slight real average annual increase in the cost of all hand planting types together and decreases in the cost of hand planting bareroot seedlings between 1988 and 2016, due to uncertainty regarding the long-term effects of recent 2015 change to H-2B temporary worker policy, no cost change was simulated for hand planting costs [68].
NPV was calculated for each scenario using the specified rates of cost change. This was first performed for a base year (2016 costs) for which no year 0 cost experienced any change; however, any practice that occurred after year 0 was subject to a level of cost change reflective of the number of years after year 0 it occurred. For instance, planting and site preparation costs would incur no cost changes since they occurred in the initial cost base year (2016), however a timber marking cost at year 15 would be subject to 15 years of cost change. This change in cost for a practice with the cost base year as the establishment year can be represented by the following equation.
where is the cost of the ith practice in the year t that it occurs in the management regime, is the cost of that practice in the cost base year (2016 cost value), and r is the real average annual rate of change for the cost of that practice.
The investment year (year 0) was then moved forward one year at a time, with each movement incurring an additional year of cost change. For example, a forestry investment made with an establishment year that was three years after the cost base year would incur year zero establishment costs that were subject to three years of cost change, year 15 costs that were subject to 18 years of cost change, and year 30 costs that were subject to 33 years of cost change. The cost of a practice occurring in any management regime where the establishment year occurs after the initial cost base year can be represented by the following equation.
where is the cost of the ith practice at the year it occurs in the management regime, is the cost of that practice in the base year (2016 cost value), r is the real average annual rate of change for the cost of that practice, t is the year that the practice occurs in the management regime, and n is the number of years after the initial 2016 cost base year that the cost occurs. It is important to note that all costs and revenues for each regime at each point in time were discounted to the establishment year of that regime, rather than to the cost base year.
4.3. Price Assumptions
Timber prices for this study were average prices for the South for 2016 as published in Timber-Mart South [64] and these prices along with product specifications appear in Table 3.
The timber prices used in these analyses reflect the low southern yellow pine sawtimber and chip-n-saw prices in the U.S. South since the 2008 recession. To examine the effects of cost change under the assumption that timber prices increase, a 0.5% annual increase in all product categories was simulated for the analysis under the assumption of fixed thinning regimes and rotation age. These changes in price were simulated in the same manner as changes in cost.
Assuming that costs associated with thinning may indeed be a deterrent for landowners to conduct multiple thinnings, and to expand the analysis of the financially optimal number of thinnings and rotation age given forestry practices cost changes, increasing sawtimber prices were simulated in order to establish the financial breakeven point for management regimes with one versus two thinnings. This breakeven point was the rate at which sawtimber prices must increase in order for a regime with two thinnings to become more profitable than a regime with one thinning. Only sawtimber price increases were simulated for this second analysis as the production of sawtimber is the primary economic reason for using multiple thinnings.
5. Results
5.1. Fixed Regimes
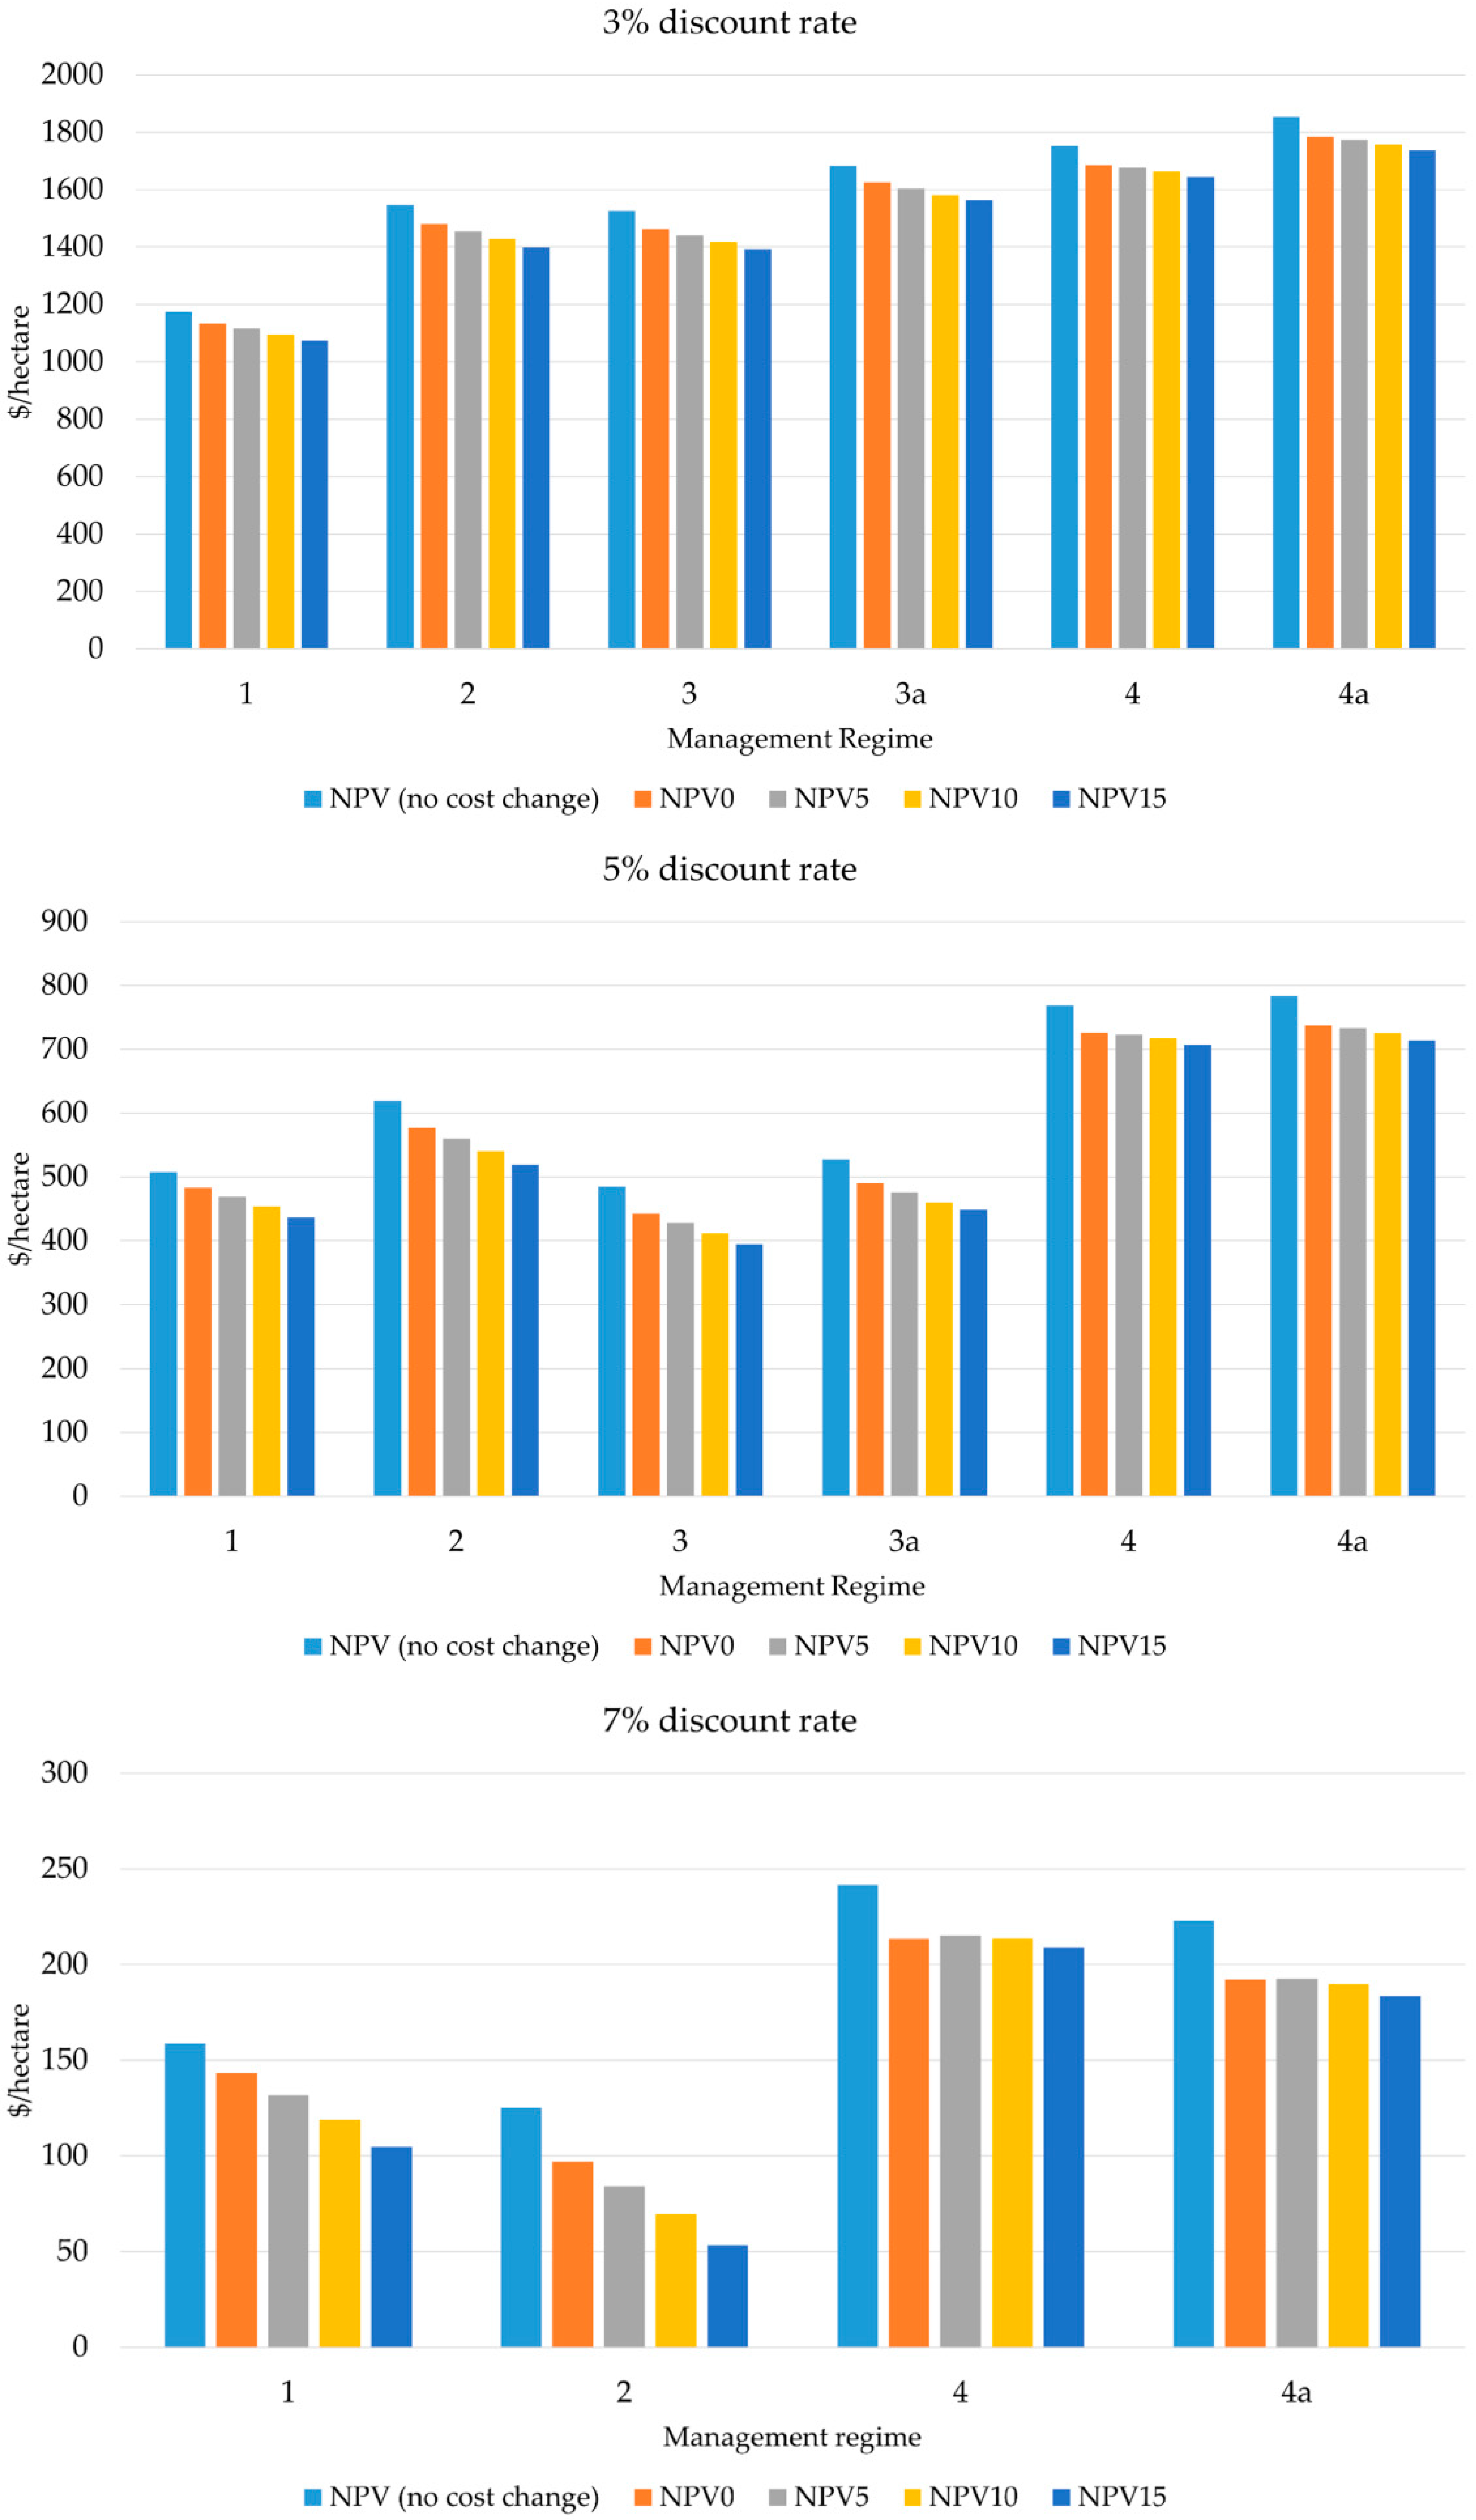
Changes in valuation due to cost changes for regimes 1–4a assuming a fixed number of thinnings and harvest age, are presented in Figure 1 at four establishment points 0, 5, 10, and 15 years after the cost base year, as well as at three discount rates. Despite the fact that rotations including intensive mechanical site preparation (regimes 3 and 3a) produced the most timber, the high up-front costs associated with these treatments did not allow for full financial realization of this production. As a result, regimes 3 and 3a decreased in comparative value with increases in discount rate, and were not viable at a 7%. Likewise, the added value due to the use of mid-rotation herbicide/fertilization declined with discount rate. Regime 4 was the most highly valued of those without a mid-rotation fertilization/herbicide treatment and regime 4a was the most highly valued of those with a mid-rotation fertilization/herbicide treatment.
Though some management regimes included forestry practices with both increasing and decreasing costs, particularly regimes 4 and 4a, under the assumption of cost change, all scenarios demonstrated a decline in value over the course of the four potential establishment points. However, these same regimes (4 and 4a) decreased in value at slower rates than the regimes that did not include herbicide site preparation. Since regime 1 did not contain costs associated with a second thinning, it declined the least assuming the regime was established in the cost base year. Simulating cost change did not change the ranking of the management regimes in terms of their comparative NPVs.
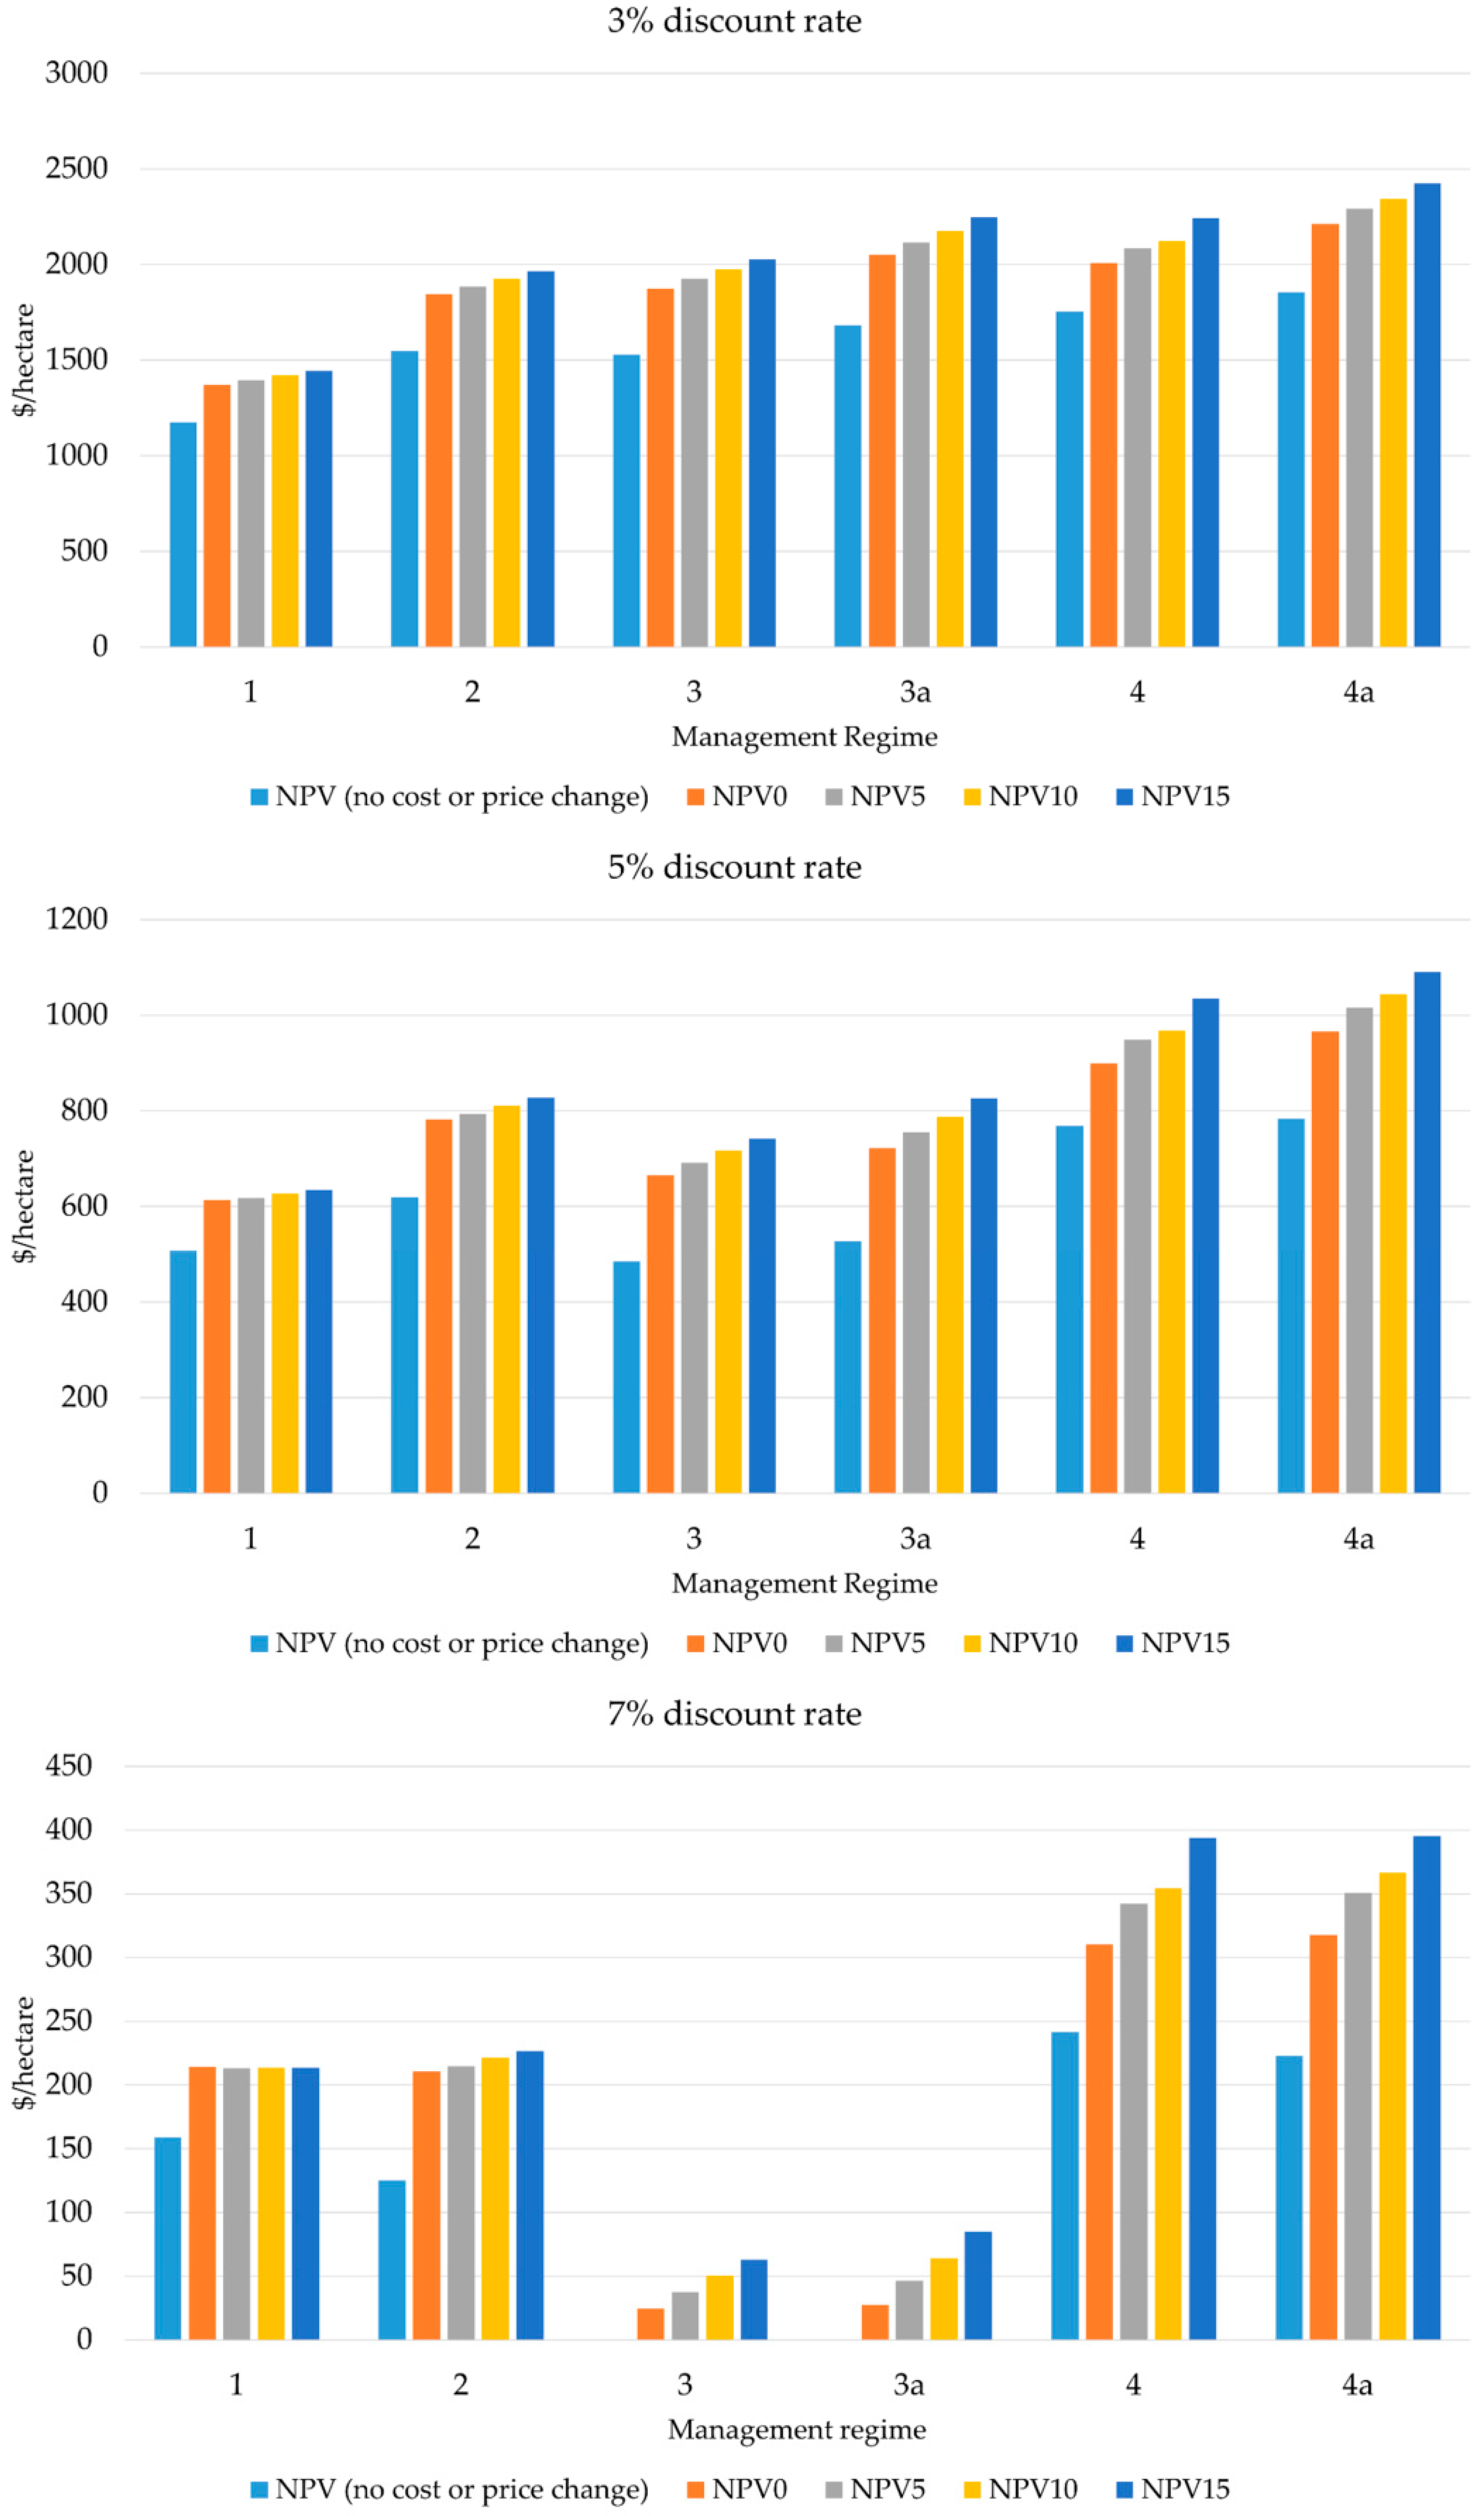
The management regimes under the assumption of changing costs and increasing prices are presented in Figure 2. Under this assumption, all scenarios increased in value, despite changes in cost, and 3 and 3a became viable using a 7% discount rate. An increase in timber prices of 0.5% annually was substantial enough that even the value of regime 1 would remain stable over time, despite low timber production and using only practices that increased in cost. Also, regime 3 becomes slightly more competitive than regime 2 at 3% and regime 2 becomes slightly more competitive than regime 1 at 7%. Further analysis indicated that breakeven points, points at which the effects of timber price increases counteracted the effects of cost increases for rotations valued in the base year, occurred at timber price increases of real rates of less than 0.2% annually, indicating that minor increases in timber prices would compensate for increasing costs.
5.2. Optimal Regimes
Under this specific analysis, the number of thinnings and rotation ages represents financially optimal management scenarios. Results for NPV values for regimes with zero, one, and two thinnings, with and without cost change, and given three different discount rates, are presented in Table 4. Under the assumption of no cost change a regime with one thinning was less profitable than a regime with two using a 3% and 5% discount rate. However, assuming timber marking and cruising costs changed at the specified rates, a management regime with only one thinning became slightly more profitable when using a 5% discount rate. A regime with one thinning was more profitable than a regime with two thinnings at a 7% discount rate and less profitable than a regime with two thinnings at a 3% discount rate, regardless of cost change. A regime with no thinnings remained less profitable than a regime with one thinning in all cases; however, assuming cost change, a regime with no thinnings was more profitable than a regime with two thinnings at a 7% discount rate.
A given discount rate in an investment can be thought of as the opportunity cost of the capital used in that investment. Therefore, the higher the discount rate is the sooner that the return on investment must be realized. Also, the additional timber value gained by thinning will be more heavily discounted at a higher rate than at a lower rate. Therefore, a management regime with multiple thinnings and a longer rotation will be less desirable at higher discount rates, which is reflected here.
The rates of increase of sawtimber prices necessary for a regime with two thinnings to be more profitable under all discount rates given the assumption of cost change and using NPV, are presented in Table 5. These values reveal that relatively little to no real change to sawtimber prices was necessary for regimes using two thinnings to be more profitable, depending on the discount rate used. By default, when regimes with two thinnings became more profitable than a regime with one thinning, they also became more profitable than a regime with no thinnings. Additionally, given increasing timber prices, the optimal harvest age for a one-thinning regime becomes 30, and for a two-thinning regime becomes 35.
6. Discussion
6.1. Fixed Regimes
The results of the first analysis imply that even though there is no indication that mechanical site preparation costs are increasing, their current costs make mechanical site preparation undesirable if the practice is not going to substantially lower planting costs while also improving soil structure and reducing hardwood competition. Rather, given the effectiveness of chemical site preparation in reducing hardwood competition and this practice’s current lower and decreasing costs, chemical site preparation is likely the most cost-effective way to improve upland loblolly pine plantation growth. These implications support the transition to chemical site preparation that has occurred on upland sites throughout the South since the early 1990s [11,14]. This analysis also indicates that levels of decline in herbicide application costs are not quite substantial enough to compensate for increases in timber cruising, marking, and controlled burning costs over time. However, Figure 1 indicates that for regimes 4 and 4a, once one takes into account increasing cruising and marking costs for rotations established in the cost base year, rotations established 5 and 10 years out decrease relatively little in NPV. In fact, for regimes 4 and 4a, rotations established 5 and 10 years after the cost base year do not decreases at all in NPV from those established in the cost base year when using a 7% discount rate. This suggests that if one of the other practices that are increasing in cost were to either stop increasing, or if the rotation could be successful grown without it, the decreasing cost of chemical site preparation and competition control may be substantial enough to offset the remaining increases in costs of other practices.
An example of a practice that could be potentially “left out” is timber marking, via performing thinnings where the logger is allowed to select which trees to remove. However, operator select harvesting must be performed in a way that protects the future integrity of the stand. It has been suggested that if there is any uncertainty about the ability of the logger to correctly select the trees to be removed, it will likely be worth the cost to mark the thinning [69].
Evaluation of the management regimes under the assumption of changing costs and increasing timber prices revealed that even relatively slight real increases in timber prices allowed for increasing rotation NPVs, and thus, if prices increase in the relatively near future, past trends in the cost of the practices analyzed in this study, if carried into the future, will not contribute to a decline in the financial value of loblolly pine timber rotations. This importance of price change relative to cost change has been previously demonstrated using DCF [70], highlighting that changes in price have a much more substantial effect on forestry investment valuation than changes in cost. These costs may however still impact landowner decisions regarding management intensity, particularly for costs that are incurred well before any revenue is made [71]. For instance, as the cost of burning increases, landowners may become more reluctant to use the practice as part of site preparation, requiring them to plant sooner after harvesting before herbaceous and woody growth makes the logistics of planting much harder. Planting costs could also increase due to the level of logging debris on the site that may have been reduced through burning [72].
Though increases in costs for practices such as controlled burning, timber marking, and timber cruising may not reduce the rotation NPVs under the assumption of slightly increasing timber prices, they could still reduce profit potential. For example, analysis under the assumption of no timber price increases indicates that under management regime 4, the assumption of increasing marking and cruising costs reduces NPV when valued in the cost change base year by four to 12% depending on the discount rate, as compared to no cost change at all. When extrapolated over large land areas, these declines in value could add up to a substantial amount of money that could have been made had these costs not increased, even if increasing timber prices dilute the extent to which the effects of these increasing costs are felt.
6.2. Optimal Regimes
This second analysis demonstrated that increasing costs associated with timber cruising and marking have the potential to exacerbate the effects of current low sawtimber prices to the point that management regimes with fewer thinnings become optimal. However, the difference in NPV for one-thinning regimes versus two-thinning regimes, assuming this cost change, is minimal at a 5% discount rate. Rather, it is primarily the fact that thinning costs were taken into consideration at all in this study, as well as the current low price for sawtimber, that make fewer thinnings and shorter rotations more financially feasible under the two higher discount rates used in this study. A similar study concluded that when using a 5% discount rate, the use of two thinnings would remain optimal given price assumptions similar to the base price assumptions used in this study [65]. This result was somewhat surprising since land expectation value (LEV) was used as the financial criteria in the aforecited study, as LEV takes into account the opportunity costs of the land and capital invested in a timber rotation [73]. Thus, using LEV as the financial criteria for evaluating optimal rotations is more likely than NPV, which only takes into account the opportunity cost of the capital used in the investment, to favor shorter rotations. However, this aforecited study also did not take into account costs associated with thinning, which should be considered important factors when performing analyses evaluating the optimal number of thinnings.
It is important to note that costs associated with timber marking and cruising are not the only costs that may be associated with conducting a timber harvest. Other costs may include fees for having a forester actually administer the harvest. Any additional fees associated with commercial thinnings besides those for marking and cruising would increase the discrepancy between the values of regimes with one versus two thinnings given current sawtimber prices. For instance, if an additional cost for administering each thinning amounted to $75 ha−1 the reduction in NPV for a regime with two thinnings (at years 16 and 26) due to this fee would be approximately $55 ha−1 at a 5% discount rate, while it would only be approximately $34 ha−1 for a management regime with one thinning. Given the assumptions in the scenarios in this study, an additional cost of this magnitude associated with two thinnings is enough to make a regime with only one thinning financially comparable to a regime with two thinnings, even without increasing marking and cruising costs.
When considering additional administration fees associated with thinning on top of the costs examined in this analysis, the results of this study make it seem as if it may not be financially prudent for landowners to incur the management costs associated with multiple thinnings. However, this is only the case if sawtimber prices remain the same or decline. The analysis in this study has shown that only relatively minor real increases in sawtimber prices would be necessary for regimes with two thinnings to be more financially optimal than those with one, at 5% and even 7% discount rates. This indicates that for a landowner currently facing the decision of whether or not to do a second thinning and extend their rotation length, forgoing a second thinning on the basis of currents cost would mean assuming that there would not be a real increase in average sawtimber prices of at least approximately 3.4% over the next ten or eleven years. Though this is possible given that sawtimber prices have not increased over the last ten years [74], a landowner content with earning a 5% discount rate would lose relatively little if they did choose to thin twice and extend their rotation, if indeed prices remained flat. Additionally, the use of operator select thinning, if properly executed, could increase the financial competiveness of management regimes with one rather than two thinnings by saving costs on timber marking, but once again, only under the assumption that such a practice would not reduce the future value of the stand.
7. Conclusions
This study indicates that that though they still may decrease in value over time assuming no changes to timber prices, management regimes incorporating chemical site preparation may be subject to much more moderate reductions in NPV over time compared to regimes with other forms of site preparation. Furthermore, the potential to use cost saving measures such as operator select thinning could allow the decreasing cost of herbicide application to completely compensate for increases in the costs of other practices used in a regime. Though common management regimes in the South may decrease NPV over time due to the number of practices that are increasing in cost, and though there is potential for these cost increases to lead to shorter rotations with fewer thinnings, this study has shown that the effects of these trends in cost could be easily mitigated by slight increases in timber prices. However, given the oversupply of sawtimber in the South that will likely continue into the near future or beyond [75], landowners and managers seeking to maximize return in the face of continued low prices should closely analyze their choice of management regime, the practices associated with that regime, and the trends in the cost of those practices. Additionally, further research into the long-term cost effectiveness of marking pine plantation thinnings is necessary to validate the financial feasibility of this practice.
Author Contributions
Conceptualization, D.W.C., P.N.K., and T.J.S.; Methodology, D.W.C.; Formal Analysis, D.W.C.; Writing—Review and Editing, D.W.C., P.N.K., T.J.S. and D.L.H.
Funding
This research received no external funding.
Conflicts of Interest
The authors declare no conflict of interest. The funders had no role in the design of the study; in the collection, analyses, or interpretation of data; in the writing of the manuscript, and in the decision to publish the results.
References
- Bullard, S.H.; Straka, T.J. Basic Concepts in Forest Valuation and Investment Analysis, 3rd ed.; Forestry Suppliers, Inc.: Jackson, MS, USA, 2011. [Google Scholar]
- Brooks, D.J. Public policy and long-term timber supply in the South. For. Sci. 1985, 30, 697–704. [Google Scholar]
- Royer, J.P. The Effects of Markets and Public Policies on the Reforestation Behavior of Southern Landowners; SCFER Working Paper 12; Southern Center for Forest Economics Research: Research Triangle, NC, USA, 1985.
- Hyberg, B.T.; Holthausen, D.M. The behavior of non-industrial private forest landowners. Can. J. For. Res. 1989, 19, 1014–1023. [Google Scholar] [CrossRef]
- Adams, D.M.; Haynes, R.W.; Dutrow, G.F.; Barber, R.L.; Vasievich, J.M. Private investment in forest management and the long-term supply of timber. Am. J. Agric. Econ. 1982, 64, 232–241. [Google Scholar] [CrossRef]
- Bair, L.S.; Alig, R.J. Regional Cost Information for Private Timberland Conversion and Management; General Technical Report PNW-GTR-684; USDA Forest Service, Pacific Northwest Research Station: Portland, OR, USA, 2006.
- Chang, S.J. Rotation age, management intensity, and the economic factors of timber production: Do changes in stumpage price, interest rate, regeneration cost, and forest taxation matter? For. Sci. 1983, 29, 267–277. [Google Scholar]
- McConnell, K.E.; Daberkow, J.N.; Hardie, I.W. Planning timber production with evolving prices and costs. Land Econ. 1983, 59, 292–299. [Google Scholar] [CrossRef]
- Yin, R.; Newman, D. Optimal timber rotations with evolving prices and costs revisited. For. Sci. 1995, 41, 477–490. [Google Scholar]
- Conner, R.C.; Hartsell, A.J. Forest area and conditions. In Southern Forest Resource Assessment; General Technical Report GTR-SRS-53; Wear, D.N., Greis, J.G., Eds.; USDA Forest Service, Southern Research Station: Asheville, NC, USA, 2002; pp. 357–401. [Google Scholar]
- Fox, T.R.; Jokela, E.J.; Allen, H.L. The development of pine planation silviculture in the southern United States. J. For. 2007, 105, 337–347. [Google Scholar]
- Siry, J. Intensive timber management practices. In Southern Forest Resource Assessment; General Technical Report GTR-SRS-53; Wear, D.N., Greis, J.G., Eds.; USDA Forest Service, Southern Research Station: Asheville, NC, USA, 2002; pp. 327–340. [Google Scholar]
- Clutter, J.L.; Dell, T.R. Estimated Yields of Pine Plantations on Prepared Sites. In Proceedings: A Symposium on Principles of Maintaining Productivity on Prepared Sites; Tippin, T., Ed.; USDA Forest Service, Southeast Area State and Private Forestry: Atlanta, GA, USA, 1978; pp. 111–122. [Google Scholar]
- Fox, T.R.; Jokela, E.J.; Allen, H.L. The evolution of pine plantation silviculture in the southern United States. In Southern Forest Science: Past, Present, and Future; General Technical Report SRS-75; Rauscher, H.M., Johnsen, K., Eds.; USDA Forest Service, Southern Research Station: Asheville, NC, USA, 2004; pp. 63–82. [Google Scholar]
- Lowery, R.F.; Gjerstad, D.H. Chemical and mechanical site preparation. In Forest Regeneration Manual; Duryea, M.L., Dougherty, P.M., Eds.; Kluwer Academic Publishers: Dordrecht, The Netherlands, 1991; pp. 251–261. [Google Scholar]
- Rummer, B. Forest operations technology. In Southern Forest Resource Assessment; General Technical Report GTR-SRS-53; Wear, D.N., Greis, J.G., Eds.; USDA Forest Service, Southern Research Station: Asheville, NC, USA, 2002; pp. 341–353. [Google Scholar]
- Worrell, A.C. What does it cost to practice forestry in the South? For. Farmer 1953, 12, 17. [Google Scholar]
- Somberg, S.I.; Eads, L.D.; Yoho, J.G. What it costs to practice forestry in the South. For. Farmer 1963, 22, 6–8, 15. [Google Scholar]
- Yoho, J.G.; Dutrow, G.F.; Moak, J.E. Costs and cost trends—What it costs to practice forestry. For. Farmer 1971, 30, 42–50. [Google Scholar]
- Moak, J.E.; Kucera, J.M. Current costs and cost trends for forestry practices in the South. For. Farmer 1975, 34, 74–82. [Google Scholar]
- Moak, J.E.; Kucera, J.M.; Watson, W.F. Current costs and cost trends for forestry practices in the South. For. Farmer 1977, 36, 16–21. [Google Scholar]
- Moak, J.E.; Watson, W.F.; Van Deusen, P. Costs and cost trends for forest practices in the South. For. Farmer 1980, 39, 50–63. [Google Scholar]
- Moak, J.E.; Watson, W.F.; Watson, M.S. Costs of forestry practices in the South. For. Farmer 1983, 42, 26–32. [Google Scholar]
- Straka, T.J.; Watson, W.F. Costs of forestry practices. For. Farmer 1985, 44, 16–22. [Google Scholar]
- Watson, W.F.; Straka, T.J.; Bullard, S.H. Costs and cost trends for forestry practices in the South. For. Farmer 1987, 46, 28–34. [Google Scholar]
- Straka, T.J.; Watson, W.F.; Dubois, M.R. Costs and cost trends for forestry practices in the South. For. Farmer 1989, 48, 8–14. [Google Scholar]
- Dubois, M.R.; Watson, W.F.; Straka, T.J.; Belli, K.L. Costs and cost trends for forestry practices in the South. For. Farmer 1991, 50, 26–32. [Google Scholar]
- Belli, M.L.; Straka, T.J.; Dubois, M.R.; Watson, W.F. Costs and cost trends for forestry practices in the South. For. Farmer 1993, 52, 25–31. [Google Scholar]
- Dubois, M.R.; McNabb, K.; Straka, T.J.; Watson, W.F. Costs and cost trends for forestry practices in the South. For. Farmer 1995, 54, 10–17. [Google Scholar]
- Dubois, M.R.; McNabb, K.; Straka, T.J. Costs and cost trends for forestry practices in the South. For. Landowner 1997, 56, 7–13. [Google Scholar]
- Dubois, M.R.; McNabb, K.; Straka, T.J. Costs and cost trends for forestry practices in the South. For. Landowner 1999, 58, 3–8. [Google Scholar]
- Dubois, M.R.; Erwin, C.B.; Straka, T.J. Costs and cost trends for forestry practices in the South. For. Landowner 2001, 60, 3–8. [Google Scholar]
- Dubois, M.R.; Straka, T.J.; Crim, S.D.; Robinson, L.J. Costs and cost trends for forestry practices in the South. For. Landowner 2003, 62, 3–9. [Google Scholar]
- Smidt, M.F.; Dubois, M.R.; Folegatti, B.S. Costs and cost trends for forestry practices in the South. For. Landowner 2005, 64, 25–31. [Google Scholar]
- Folegatti, B.S.; Smidt, M.F.; Dubois, M.R. Costs and cost trends for forestry practices in the South. For. Landowner 2007, 66, 11–16. [Google Scholar]
- Barlow, R.J.; Smidt, M.F.; Morse, J.Z.; Dubois, M.R. Costs and cost trends for forestry practices in the South. For. Landowner 2009, 68, 5–12. [Google Scholar]
- Barlow, R.J.; Dubois, M.R. Costs and cost trends for forestry practices in the South. For. Landowner 2011, 70, 15–24. [Google Scholar]
- Dooley, E.; Barlow, R. Special report: 2012 cost and cost trends for forestry practices in the South. For. Landowner 2013, 72, 22–29. [Google Scholar]
- Barlow, R.; Levendis, W. Special report: 2014 cost and cost trends for forestry practices in the South. For. Landowner 2015, 74, 22–31. [Google Scholar]
- Maggard, A.; Barlow, R. Special report: 2016 costs and trends for southern forestry practices. For. Landowner 2017, 76, 30–39. [Google Scholar]
- Moak, J.E. Forest practices cost trends in the South. South. J. Appl. For. 1982, 6, 130–132. [Google Scholar]
- Dubois, M.R.; Straka, T.J.; Watson, W.F. A cost index for southern forest practices. South. J. Appl. For. 1991, 15, 128–133. [Google Scholar]
- Arano, K.G.; Cushing, T.L.; Munn, I.A. Forest management expenses of Mississippi’s nonindustrial private forest landowners. South. J. Appl. For. 2002, 26, 93–98. [Google Scholar]
- Gerbert, K.M.; Niccolucci, M.J.; Schuster, E.G. Timber management costs in the northern region: A historical analysis. West. J. Appl. For. 1999, 14, 200–207. [Google Scholar]
- Mills, T.J.; Shinkle, P.B.; Cox, G.L. Direct Costs of Silvicultural Treatments on National Forests; Research Paper WO-40; USDA Forest Service, Washington Office: Washington, DC, USA, 1985.
- Adams, D.M.; Alig, R.J.; Callaway, J.M.; McCarl, B.A.; Winnett, S.M. The Forest and Agricultural Sector Optimization Model (FASOM): Model Structure and Policy Implications; Research Paper PNW-RP-495; USDA Forest Service, Pacific Northwest Research Station: Portland, OR, USA, 1996.
- Alig, R.; Adams, D.; McCarl, B.; Callaway, J.M.; Winnett, S. Assessing effects of mitigation strategies for global climate change with an intertemporal model of the U.S. forest and agricultural sectors. Environ. Resour. Econ. 1997, 9, 259–274. [Google Scholar] [CrossRef]
- Moulton, R.J.; Richards, K.R. Costs of Sequestering Carbon Through Tree Planting and Forest Management; General Technical Report WO-58; USDA Forest Service, Washington Office: Washington, DC, USA, 1990.
- Nielsen, A.S.E.; Plantinga, A.J.; Alig, R.J. New Cost Estimates for Carbon Sequestration through Afforestation in the United States; General Technical Report PNW-GTR-888; USDA Forest Service, Pacific Northwest Research Station: Portland, OR, USA, 2014.
- Alig, R.J.; Parks, P.J.; Farrar, R.M., Jr.; Vasievich, J.M. Regional Timber Yield and Cost Information for the South: Modelling Techniques; General Technical Report RM-112; USDA Forest Service, Rocky Mountain Forest and Range Experiment Station: Fort Collins, CO, USA, 1984.
- Bullard, S.; Hodges, J.D.; Johnson, R.L.; Straka, T.J. Economics of direct seeding and planting for establishing oak stands on old-field sites in the South. South. J. Appl. For. 1992, 16, 34–40. [Google Scholar]
- Adams, D.M.; Alig, R.J.; McCarl, B.A.; Callaway, J.M.; Winnett, S.M. An analysis of the impacts of public timber harvest policies on private forest management in the United States. For. Sci. 1996, 42, 343–358. [Google Scholar]
- Khanal, P.N.; Dean, T.J.; Roberts, S.D.; Grebner, D.L.; Straka, T.J. Explaining first-year seedling survival from quality distributions of bare-root seedlings and microsites in industrial plantations. Open J. For. 2018, 8, 362–379. [Google Scholar] [CrossRef]
- Munn, I.A.; Rogers, W.R. Timber investment management organizations and industrial landowners in Mississippi. South. J. Appl. For. 2003, 27, 83–91. [Google Scholar]
- Winjum, D.R.; Krankina, O. Forestation and Forest Management Options and Their Costs at the Site Level; EPA/600/D-91/209; Environmental Protection Agency: Washington, DC, USA, 1991.
- Lickwar, P.; Hickman, C.; Cubbage, F.W. Costs of protecting water quality during harvesting on private forestlands in the Southeast. South. J. Appl. For. 1992, 16, 13–20. [Google Scholar]
- Nolan, L.; Aust, W.M.; Barrett, S.M.; Bolding, M.C.; Brown, K.; McGuire, K. Estimating costs and effectiveness of upgrades in forestry best management practices for stream crossings. Water 2015, 7, 6946–6966. [Google Scholar] [CrossRef]
- Straka, T.J.; Marsinko, A.P.; Baumann, J.L.; Haight, R.G. Site preparation and tree planting costs on hurricane-damaged lands in South Carolina. South. J. Appl. For. 1995, 19, 131–138. [Google Scholar]
- Marsinko, A.P.; Straka, T.J.; Baumann, J.L. The effect of Hurricane Hugo on forest practice costs. In Hurricane Hugo: South Carolina Forest Land Research and Management Related to the Storm; General Technical Report SRS-5; Haymond, J.L., Hook, D.D., Harms, W.R., Eds.; USDA Forest Service, Southern Research Station: Asheville, NC, USA, 1996; pp. 279–282. [Google Scholar]
- Straka, T.J.; Watson, W.F. Management cost changes for southern forests. For. Ind. 1987, 114, 27–29. [Google Scholar]
- Straka, T.J.; Dubose, M.R.; Watson, W.F. Costs and cost component trends of hand and machine tree planting in the southern United States (1952–1990). Tree Plant. Notes 1992, 43, 89–92. [Google Scholar]
- Callaghan, D.W. An Analysis of Costs and Cost Trends for Southern Forestry Practices. Master’s Thesis, Clemson University, Clemson, SC, USA, 2018. [Google Scholar]
- Straka, T.J. Valuation of bare forestland and premerchantable timber stands in forestry appraisal. J. Am. Soc. Farm Manag. Rural Apprais. 2007, 70, 142–146. [Google Scholar]
- Timber Mart-South. US South Annual Review: 2016; Timber-Mart-South; University of Georgia, Warnell School of Forestry and Natural Resources: Athens, GA, USA, 2017. [Google Scholar]
- Frey, G. Timber prices and landowners: How might future stumpage prices affect family forest management? Va. For. 2015, 60, 13–19. [Google Scholar]
- Burkhart, H.E.; Amateis, R.L.; Westfall, J.A.; Daniels, R.F. PTAEDA4.0: Simulation of Individual Tree Growth, Stand Development and Economic Evaluation in Loblolly Pine Plantations; Virginia Tech, Department of Forestry: Blacksburg, VA, USA, 2008. [Google Scholar]
- Borders, B.E. Piedmont Loblolly Pine Site Preparation Study: Results through Age 18; PMRC Technical Report 2004-3; University of Georgia, Warnell School of Forest Resources: Athens, GA, USA, 2004. [Google Scholar]
- Brodbeck, A.M., IV. Immigrant Labor in the Forest Industry: The Impacts of H-2B Employment on Local Livelihoods. Ph.D. Thesis, Auburn University, Auburn, AL, USA, 2016. [Google Scholar]
- Dickens, E.D. A Guide to Thinning Pine Plantations; Georgia Forest Productivity Publication Series 0010; University of Georgia, Warnell School of Forestry and Natural Resources: Athens, GA, USA, 2015. [Google Scholar]
- Mendell, B.C. How sensitive are forestland values to changes in management costs and timber prices? For. Source 2018, 23, 24. [Google Scholar]
- Khanal, P.N.; Grebner, D.L.; Straka, T.J.; Adams, D.C. Obstacles to participation in carbon sequestration for nonindustrial private forest landowners in the southern United States: A diffusion of innovations perspective. Forest Policy Econ. 2019, 100, 95–101. [Google Scholar] [CrossRef]
- Callaghan, D.W.; Khanal, P.N.; Straka, T.J. An analysis of costs and cost trends for southern forestry practices. J. For. 2019, 117, 21–29. [Google Scholar]
- Pearse, P.H. The optimum forest rotation. For. Chron. 1967, 43, 178–195. [Google Scholar] [CrossRef]
- Timber Mart-South. Timber-Mart South. Market. New Quarterly, 2nd Quarter 2018; Timber Mart-South; University of Georgia, Warnell School of Forestry and Natural Resources: Athens, GA, USA, 2018. [Google Scholar]
- Dezember, R. Thousands of Southerners planted trees for retirement. It didn’t work. 9 October 2018. Available online: https://www.wsj.com/articles/thousands-of-southerners-planted-trees-for-retirement-it-didnt-work-1539095250 (accessed on 29 January 2019).
Figure 1.
Net present value (NPV) of management regimes at successive establishment points at the cost base year and 5, 10, and 15 years following that, given change in costs. For regimes established in the cost base year 0, only practices occurring after year 0 are subject to cost change.
Figure 1.
Net present value (NPV) of management regimes at successive establishment points at the cost base year and 5, 10, and 15 years following that, given change in costs. For regimes established in the cost base year 0, only practices occurring after year 0 are subject to cost change.

Figure 2.
NPV of management regimes at successive establishment points (at the cost base year and 5, 10, and 15 years after the cost base year), assuming change in cost and increasing (0.5% annually) timber prices.
Figure 2.
NPV of management regimes at successive establishment points (at the cost base year and 5, 10, and 15 years after the cost base year), assuming change in cost and increasing (0.5% annually) timber prices.


Table 1.
Pine plantation management regimes and timing of cost incurring practices.
| Management Regime | Thinning and Final Harvest Ages | Establishment Treatment (Year 0) | Thinnings | Other Intermediate Treatments | Final Harvest (Year 35) |
|---|---|---|---|---|---|
| 1 | 22/35 | burn only; plant | cruising and marking | cruising | |
| 2 | 16/26/35 | chop and burn; plant | cruising and marking | cruising | |
| 3 | 15/24/35 | shear, pile, and disc; plant | cruising and marking | cruising | |
| 3a | 15/22/35 | shear, pile, and disc; plant | cruising and marking | woody release at 1st thinning and fertilization in the next year | cruising |
| 4 | 16/26/35 | herbicide and burn; plant | cruising and marking | cruising | |
| 4a | 16/23/35 | herbicide and burn; plant | cruising and marking | woody release at 1st thinning and fertilization in the next year | cruising |
Table 2.
Forestry practices cost and real annual rate of cost change.
| Practice | Cost ($/ha) | Real Annual Cost Change (%) |
|---|---|---|
| Hand planting bareroot seedlings | 107.61 | — |
| Seedlings | 86.47* | — |
| Roller chopping | 261.21 | −0.24 |
| Shear, pile, disc | 622.79 | 0.04 |
| Site prep. burn | 71.50 | 1.97 |
| Chemical site prep. | 195.07 | −1.89 |
| Mid-rotation release | 153.47 | −0.49 |
| Fertilization | 239.71 | 0.46 |
| Timber marking | 83.43 | 1.88 |
| Timber cruising | 26.29 | 2.07 |
Note: a $0.08/seedling @ 1347 trees per ha.
Table 3.
Timber product prices and specifications by diameter breast height (dbh) and top diameter.
| Product | Specifications | Price ($/ton) |
|---|---|---|
| Sawtimber | >=30.5 cm dbh to 22.8 cm top | 24.73 |
| Chip-N-Saw | >=22.9 cm dbh to 15.2 cm top | 17.13 |
| Pulpwood | >=15.1 cm dbh to 10.1 cm top | 10.17 |
Table 4.
Harvest age and NPV values for management regimes with zero, one, or two thinnings, with and without cost change.
Table 4.
Harvest age and NPV values for management regimes with zero, one, or two thinnings, with and without cost change.
| Number of Thinnings | Harvest Age (years) | Discount Rate | NPV no Cost Change ($/ha) | NPV0 a w/Cost Change ($/ha) | NPV5 a w/Cost Change ($/ha) |
|---|---|---|---|---|---|
| 0 | 31 | 3% | 1485.49 | 1476.17 | 1484.92 |
| 0 | 28 | 5% | 652.71 | 647.52 | 656.68 |
| 0 | 23 | 7% | 230.18 | 226.84 | 236.33 |
| 1 | 34 | 3% | 1715.24 | 1681.13 | 1680.19 |
| 1 | 32 | 5% | 760.42 | 737.35 | 739.82 |
| 1 | 28 | 7% | 262.79 | 246.43 | 251.08 |
| 2 | 48 | 3% | 1945.54 | 1877.41 | 1751.46 |
| 2 | 37 | 5% | 776.40 | 733.69 | 731.22 |
| 2 | 32 | 7% | 251.69 | 223.46 | 225.11 |
a NPV0 and NPV5 denote NPV for management regimes established in the cost base year and 5 years after the cost base year, respectively, assuming cost change.
Table 5.
NPV, harvest age, and approximate real rates of sawtimber price increases necessary for breakeven profit for regimes with two thinnings versus regimes with one thinning.
Table 5.
NPV, harvest age, and approximate real rates of sawtimber price increases necessary for breakeven profit for regimes with two thinnings versus regimes with one thinning.
| Number of Thinnings | Harvest Age (years) | Discount Rate | NPV0 w/Cost and Price Change ($/ha) | Sawtimber Price Increase Rate |
|---|---|---|---|---|
| 1 | 34 | 3% | 1715.24 | — |
| 1 | 32 | 5% | 741.30 | 0.04%/year |
| 1 | 30 | 7% | 261.13 | 0.50%/year |
| 2 | 48 | 3% | 1945.54 | — |
| 2 | 37 | 5% | 742.06 | 0.04%/year |
| 2 | 35 | 7% | 261.97 | 0.50%/year |
© 2019 by the authors. Licensee MDPI, Basel, Switzerland. This article is an open access article distributed under the terms and conditions of the Creative Commons Attribution (CC BY) license (http://creativecommons.org/licenses/by/4.0/).
Share and Cite
MDPI and ACS Style
Callaghan, D.W.; Khanal, P.N.; Straka, T.J.; Hagan, D.L. Influence of Forestry Practices Cost on Financial Performance of Forestry Investments. Resources 2019, 8, 28. https://0-doi-org.brum.beds.ac.uk/10.3390/resources8010028
AMA Style
Callaghan DW, Khanal PN, Straka TJ, Hagan DL. Influence of Forestry Practices Cost on Financial Performance of Forestry Investments. Resources. 2019; 8(1):28. https://0-doi-org.brum.beds.ac.uk/10.3390/resources8010028
Chicago/Turabian StyleCallaghan, Daniel W., Puskar N. Khanal, Thomas J. Straka, and Donald L. Hagan. 2019. "Influence of Forestry Practices Cost on Financial Performance of Forestry Investments" Resources 8, no. 1: 28. https://0-doi-org.brum.beds.ac.uk/10.3390/resources8010028
Note that from the first issue of 2016, this journal uses article numbers instead of page numbers. See further details here.