Particle Size Distribution in Municipal Solid Waste Pre-Treated for Bioprocessing


1
Water and Environmental Engineering Group, University of Southampton, Southampton SO16 7QF, UK
2
Liaoning Key Laboratory of Agricultural Biology Environment and Energy Engineering, Shenyang Agricultural University, Shenyang 110866, China
*
Authors to whom correspondence should be addressed.
Resources 2019, 8(4), 166; https://0-doi-org.brum.beds.ac.uk/10.3390/resources8040166
Submission received: 20 September 2019
/
Revised: 10 October 2019
/
Accepted: 17 October 2019
/
Published: 21 October 2019
(This article belongs to the Special Issue Underutilised Resources in Urban Environments)
Abstract
:While it is well known that particle size reduction impacts the performance of bioprocessing such as anaerobic digestion or composting, there is a relative lack of knowledge about particle size distribution (PSD) in pre-treated organic material, i.e., the distribution of particles across different size ranges. PSD in municipal solid waste (MSW) pre-treated for bioprocessing in mechanical–biological treatment (MBT) was researched. In the first part of this study, the PSD in pre-treated waste at two full-scale MBT plants in the UK was determined. The main part of the study consisted of experimental trials to reduce particle sizes in MSW destined for bioprocessing and to explore the obtained PSD patterns. Shredders and a macerating grinder were used. For shear shredders, a jaw opening of 20 mm was found favourable for effective reduction of particle sizes, while a smaller jaw opening rather compressed the wet organic waste into balls. Setting the shredder jaw opening to 20 mm does not mean that in the output all particles will be 20 mm or below. PSD profiles revealed that different particle sizes were present in each trial. Using different types of equipment in series was effective in reducing the presence of larger particles. Maceration yielded a PSD dominated by very fine particles, which is unsuitable for composting and potentially also for anaerobic digestion. It was concluded that shredding, where equipment is well selected, is effective in delivering a material well suited for anaerobic digestion or composting.
1. Introduction
The mechanical–biological treatment (MBT) makes use of a bioprocessing step for biological stabilisation of the organic fraction of municipal solid waste (MSW). Enforced by EU legislation that requires diversion of organics from landfills, thermal MSW treatment and MBT are widely applied in Europe [1,2]. In the UK alone, around 30 MBT plants were in operation or under construction in 2017 [3]. MBT schemes consist of a series of mechanical and biological processes with the aim to recover valuable materials and energy in line with circular economy efforts, reduce MSW volume and stabilise the organic fraction. Final MBT outputs include recyclables such as metals, the high calorific fraction used to produce refuse derived fuel (RDF), the stabilised organic fraction and the remaining residual fraction. The bioprocessing step in MBT consists either of anaerobic digestion (AD) or composting.
Particle size of a substrate is known to be a factor that may affect the performance of biological processes such as AD (anaerobic digestion) [4,5,6] or composting [7,8]. A smaller particle size entails a greater unit surface area exposed to enzymatic attack, which may improve carbon accessibility and hydrolysis of the processed material [9,10,11]. On the other hand, based on their re-analysis of data from other studies Mason and Stuckey [12] identified what they referred to as the particle size paradox. According to this, for smaller particles the relative rate of gas production per unit surface area diminishes rapidly with decreasing particle size, indicating that other factors besides the mean particle size have a key role. Based on a literature review, Hernadez-Beltran et al. [13] concluded that there is no universal optimum particle size suitable for bioprocessing.
For conventional wet AD (stirred tank reactor), faster biomass stabilisation has been observed at smaller particle sizes [14,15,16]. It was also reported, however, that very fine material (mean particle size 2 mm) caused severe foaming in wet AD and in consequence lower biogas yields due to the need to reduce organic loading rates [17]. Similarly, Izumi et al. [18] observed severe accumulation of volatile fatty acids and lower methane yield in wet AD after excessive particle size reduction. For dry AD (operated at higher total solids content than wet AD) the presence of components with larger size (several centimetres rather than millimetres) is a prerequisite for good performance, because the process requires a substrate matrix with voids to allow movement of liquids, gas and micro-organisms [19,20]. Particle size reduction in the range of several centimetres is favourable to achieve faster degradation in dry AD [21,22]; but too small a particle size risks lowered biological activity in the reactor, due to slumping and compaction of material [19,22,23], with channelling and short-circuiting through the substrate body [24]. Composting also requires the presence of particles with larger size. While some particle size reduction is favourable [7], Hamoda et al. [8] observed faster composting at 40 mm compared to 20 or 30 mm, which was explained by better oxygen access because the larger particles created bigger voids in the substrate body. Taken together, these observations suggest that, while particle size reduction is an important element to support biological waste treatment, minimising the particle size is not the most suitable option for any of the commonly applied bioprocessing schemes (wet or dry anaerobic digestion, composting).
Particle size reduction of MSW today is standard in MBT; in consequence, the organic-rich fraction of MSW, when diverted to the bioprocessing step of an MBT scheme, will typically have been exposed to some such pre-treatment. In practice shredding is most commonly applied in mechanical–biological waste treatment [22,25], but other processes such as milling are also in frequent use [26]. Hammer milling of MSW was extensively investigated [27,28] and it was found that the particle size distribution of the output depended on that of the solid waste fed into the hammermill, as well as its residence time in the equipment. Problems of plugging were, however, reported for biomass with a moisture content over 10%–15% [29], and therefore hammer milling was found more suitable for materials with low moisture such as straw or corn stalks [30,31]. Shredders consume less energy, are robust in operation and are less destructive than mills [26,29]; shredding typically reduces the particle size to few centimetres or less. Several researchers report a generally positive impact of shredding on bioprocessing of MSW [22,25,32], although the impact differs for different types of organic material such as paper or woody components [33].
Relatively little information is available, however, about the actual particle size distribution (PSD) obtained after size reduction, and especially on the PSD in the organic-rich fraction destined for biological treatment, i.e., the occurrence of different particle size ranges in MSW pre-treated for bioprocessing. Knowing the maximum or the mean particle size, which is commonly reported for material exposed to particle size reduction, is limited information. No waste particle size reduction method will deliver an output composed of uniform particles with equal size; instead, pre-treated waste will contain a variety of particles of different sizes. PSD can be assumed to directly influence biodegradation patterns, and also the final output. As an example, for MSW compost, higher degrees of compost maturity were reported for fine fractions, but also higher heavy metal contents; while the larger fractions were richer in fertilizer content [34,35]. This work emphasises that researching and understanding the actual PSD in pre-treated solid material merits more efforts to achieve progress towards more effective bioprocessing schemes.
This study explored particle size distributions in waste after different pre-treatments were applied to prepare an organic-rich particle size-reduced substrate for subsequent bioprocessing. Actual performance of the materials in bioprocessing is reported elsewhere [17], and this work focuses on studying the presence of particles of different sizes in pre-treated waste. The first part of the study assessed PSD in pre-treated non source segregated MSW collected from two full-scale MBT plants operated in the UK, where the pre-treated material serves as input to the bioprocessing. In one case this consisted of hydraulically shredded MSW with no separation after size reduction; and in the second case of ball mill processed MSW followed by a mechanical separation pre-treatment. These two MBT plants represent very different but common types of MBT schemes operated in the UK; the one implements aerobic bioprocessing of the whole MSW stream after size reduction, while the second implements AD of the organic-rich fraction only. Experiments with different particle size reduction equipment and modes of operation were also performed. Shredding was the main interest of this work, and the focus was on dry shredding with commercial equipment suitable for large-scale waste processing. Shredding is not suitable to achieve an output that consists primarily of very fine particles below 5 mm. To achieve finer particles, wet processing was additionally performed using a macerating grinder, equipment suggested as particularly favourable for such application due to its low operating costs [36]. A typical household waste stream from an urban UK area, after separation of dry recyclables and bulky items, was exposed to different particle size reduction schemes and the resulting PSD patterns were analysed. The study design acknowledges that different bioprocessing schemes benefit from different particle sizes. The goal, therefore, was not to achieve maximum reduction of particle sizes, but to better understand the PSD that occurs with different processing.
The remainder of this publication is organised as follows. Section 2 describes the experimental design and documents material and methods that were used in this study. Section 3 presents and discusses the results of the experimental work, and with the last subsection includes a discussion about limitations of this study and further research needs. Section 4 presents the conclusions of this work.
2. Materials and Methods
The experimental work comprised two parts, both aimed at understanding the patterns of PSD obtained from processing MSW through different types of mechanical size reduction equipment. The first part of the work assessed outputs from machinery operated at two full-scale MBT plants in the UK. The second part comprised a series of particle size reduction trials using different types of equipment, with the aim of identifying a favourable choice of technology and processing. Materials were analysed for PSD as described in Section 2.1. Waste samples obtained from full-scale MBT plants are documented in Section 2.2, while the experimental particle size reduction work using different equipment is described in Section 2.3 and Section 2.4.
2.1. Analysis of Particle Size Distribution (PSD)
PSD in the solid waste substrates was analysed using a British Standard test sieve shaker (Endecotts Ltd., London, UK). The sieve apertures used were 5, 6.7, 13.2, 20 and 37.5 mm (except for Trials 1a–d described in Section 2.3, where there was no sieve aperture of 13.2 mm but additional sieve apertures of 10 and 12 mm were used). Sieve diameter was around 70 cm and the vertical separation between the sieves was approximately 15 cm. Samples of 30 kg were processed (20 kg in Trials 1a–d), and the test sieve shaker was operated for a 20-min period.
The PSD can be expressed either as the cumulative percent oversize or undersize in relation to the particle diameters; or as a distribution of the weight present in each of a number of defined size classes. The latter method was used in this study, with weights expressed as a percentage of the total wet weight. Unless noted, assessment of contamination levels followed the procedures in PAS 100 [37] and in guidance from the UK Environment Agency (EA) [38]. These require analysis of size distribution followed by a physical assessment of the contaminants in each of the particle size fractions >5 mm (EA Guidance) or >2 mm (PAS 100). This work applied the >5 mm threshold. In accordance with the EA and PAS 100 specifications, fines below this size were not analysed for contaminants but entirely allocated to the organic fraction. The EA Guidance also includes nappies, leather, wood and textiles as biodegradable organic matter.
For material exposed to extensive particle size reduction through wet processing in a macerating grinder, an adapted PSD analysis methodology was applied, as described in Section 2.4.
Mean particle size in this study was calculated as the mass mean particle size [39,40], which represents the mass weighted average of the PSD (Equation (1)):
where i: size class; mi: mass in size class i and xi: mean particle size in size class i expressed as mean of sieve apertures at low and high end of size class i.
Mass mean particle size = ∑(mi × xi)/∑mi,
2.2. Particle-Size-Reduced MSW (Input to Bioprocessing) from Two Full-Scale MBT Plants
Samples of non-source segregated waste were collected from two full-scale MBT plants operating size reduction equipment. These two plants use very different MBT schemes, and both types are commonly found in the UK and Europe. Further reasons to select these two sites were that both are well established and considered representative; waste components have been studied in published papers [41,42,43]. Samples were analysed as received (i.e., after pre-treatment at the full-scale plant) without further pre-treatment. In both cases, the analysed material represents MSW that had undergone regular pre-treatment at the full-scale plant before being delivered to bioprocessing. The first material was a hydraulically shredded non-segregated MSW and the second material was a ball mill processed non-source segregated MSW.
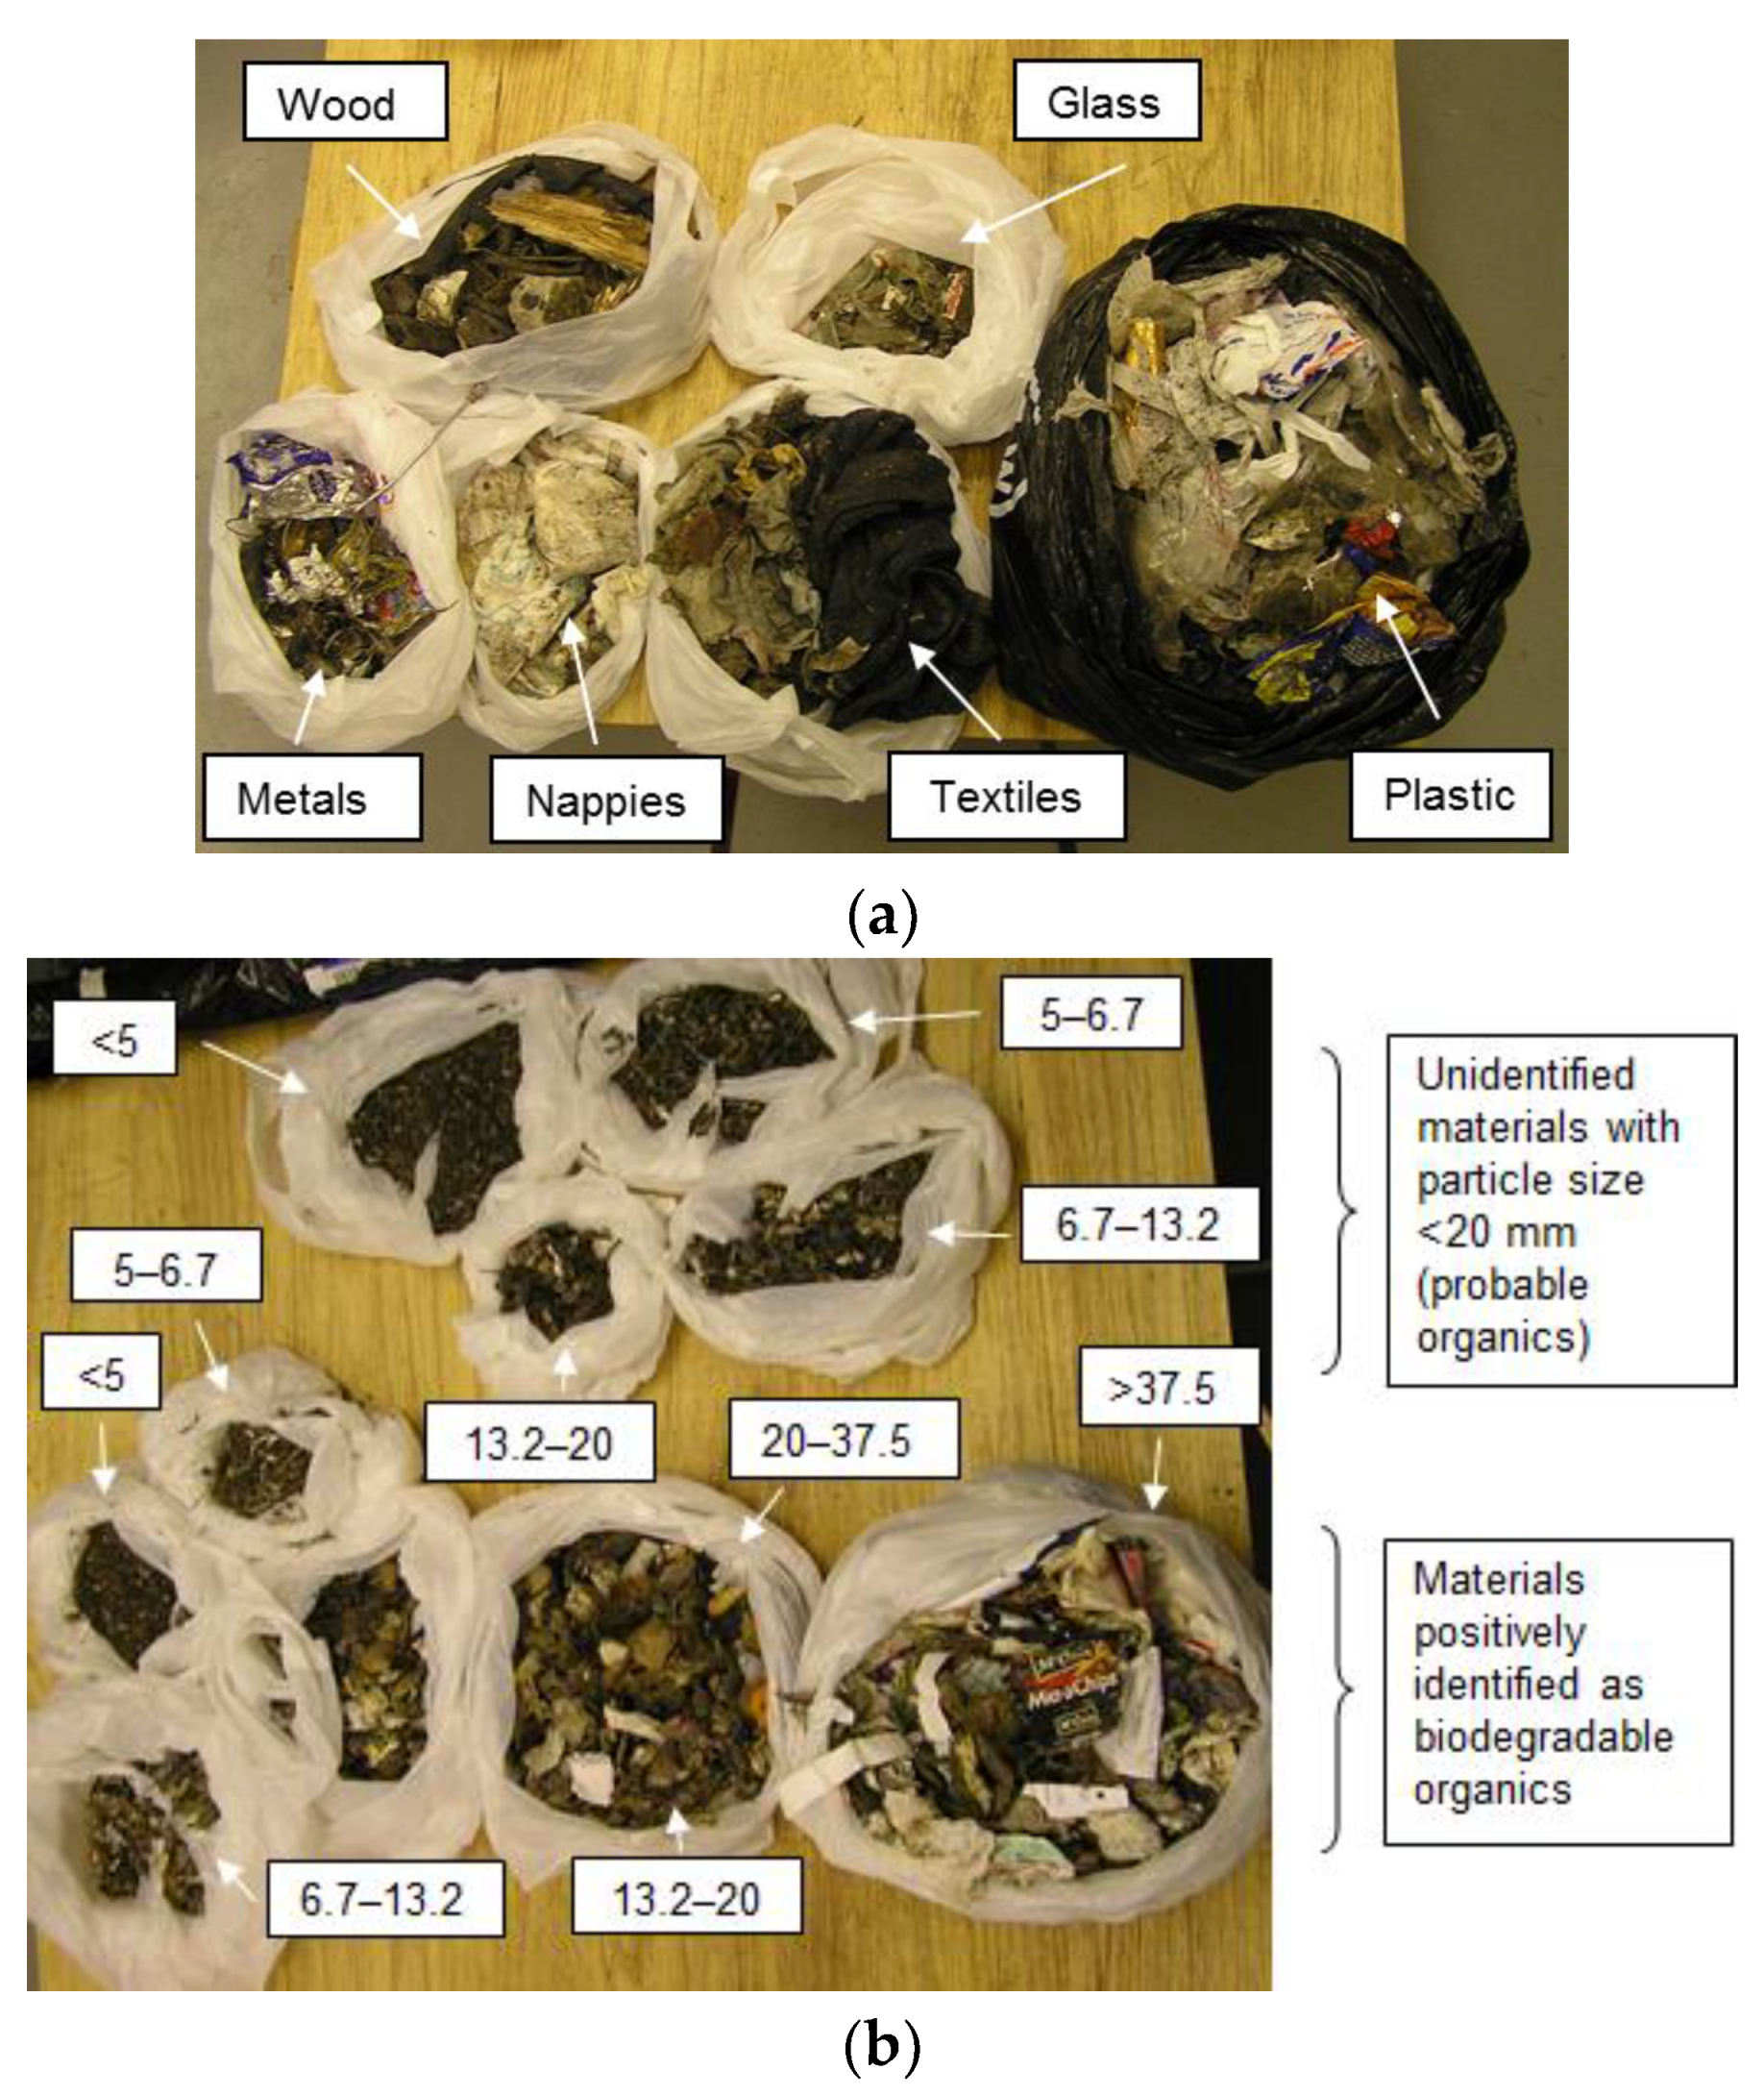
The hydraulically shredded waste sample was collected from Thornley waste transfer station, Durham, operated by Premier Waste Management Ltd. This site hosted one of the demonstrator plants in the Defra Waste Implementation Programme (WIP), in which the waste was subsequently treated by in-vessel aerobic digestion [44]. MSW was first shredded, then composted under forced aeration and then separated into the various fractions (metals, glass, high-calorific fractions and compost-like output). The heavy-duty hydraulic shredder used to pre-process this non-segregated waste was a Super 3G 515X (Shear Technology Ltd., Nottinghamshire, UK) with an electro-hydraulic drive powered by two 132 kW motors. The shredder has twin shafts with blades turning at different speeds to create the shredding effect. The shredded waste contained a large proportion of contaminants and of material greater than the maximum 37.5 mm mesh size used (Figure A1a in Appendix A); these fractions were manually separated and classified as either inert or organic according to the EA guidance as described in Section 2.1. PSD size fractions of the whole sample, obtained from sieving (Figure A1b), were assessed for composition as described above (Section 2.1). The materials of all PSD size-graded fractions were included in the data on the sample composition in terms of organic matter and physical contaminants.
The sample of ball mill processed waste was collected from Bursom recycling centre, Leicester, operated by Biffa Plc. At this plant the waste is continuously fed along a conveyor and into a 6.4 m diameter drum containing a large number of 5.5 kg steel balls. As the drum slowly rotates the balls break the waste down into small pieces, which pass through 80 mm slots in the drum and are then fed into a trommel. This separates the material into two fractions of 0–40 mm and 40–80 mm. The 40–80 mm fraction is passed through a magnetic separator for ferrous metals recovery and then into a ballistic separator. This separates out plastic, paper and card, which is baled as a refuse-derived fuel (RDF) and sent to a cement kiln. The inert material goes through an eddy current separator for recovery of non-ferrous metals and the remainder is sent to landfill. The 0–40 mm fraction (mainly putrescibles) goes through a flip-flop slotted screen, which removes excess water and then through a 5 mm grid. The material is then transferred to closed containers and, after a further plastics separation stage at Wanlip treatment plant, is used as substrate for anaerobic digestion [43,45]. The sample analysed for PSD (Figure A2a in Appendix A) was taken from containers destined for the Wanlip AD facility. Unlike the hydraulically shredded waste from Thornley waste transfer station, the ball mill processed waste from Bursom recycling centre did not contain significant proportions of large-size contaminants.
Materials were sampled in sufficient quantity to meet the requirement described in Section 2.1 (processed sample size > 30 kg) and were analysed for PSD according to the procedures described in Section 2.1. For this purpose, as described in Section 2.1, constituents of the studied sample were first size-graded and then each particle size fraction with >5 mm mesh size was hand sorted to identify the shares of organic material and non-organic contaminants (glass, plastic, metal and non-combustibles). Figure A2b (Appendix A) shows an example of hand-sorted fractions of size-graded waste from the Bursom recycling centre (ball mill processed waste).
2.3. Pilot Scale Particle Size Reduction Studies Using Different Types and Opeartion Modes of Shredders
A single source of residual domestic waste was chosen for the particle size reduction studies. The waste used was obtained from Otterbourne transfer station (Otterbourne, Hampshire, UK), which is operated by Veolia Hampshire Ltd. and serves residential kerbside collections from Southampton, Eastleigh and Winchester. Various aspects of the management of waste from Otterbourne transfer station have been studied by a number of researchers [46,47,48,49,50]. Hampshire was the location of a ground-breaking waste management partnership between 13 local authorities and contractor Veolia Environmental Services; this aimed to provide sustainable integrated waste management for all domestic waste in the county. Started in 1995, the initiative received widespread praise including the award of Beacon Council for waste management in 2002 [51,52,53,54].
To ensure consistency, whenever possible the waste was obtained in the same week of each month, on the same day of the week and from the same collection round. This was identified as a round from the urban Winchester area in which a separate source segregated kerbside collection of dry recyclable materials was also in operation. The material should therefore have a reduced content of plastic bottles, newsprint, metal cans and glass, as these are targeted materials for the separate collection. Details of the collection round sampled each month are given in Table 1. The sampling involved taking a representative portion of approximately 400 kg of the material discharged from the refuse collection vehicle (RCV). This was separated from the bulk of the waste using a mechanical shovel and placed in an open area. A preliminary sort typical of the manual removal of contaminants at a materials recycling facility (MRF) was carried out to remove obvious bulky non-biodegradable wastes, such as electrical appliances and construction material residues.
After this preliminary sort, a sub-sample of approximately 200 kg was further hand-sorted in the laboratory to remove non-biological materials such as steel, aluminium, glass and plastics. This left an enriched organic fraction including paper/cardboard, kitchen waste, garden waste and pet waste. In a full-scale process these steps would be carried out using automated magnetic or eddy current separators, trommel screens and densitometric methods in a series of mechanical pre-processing operations. The percentage rejects in the secondary sorting are shown in Table 1.
The enriched organic fraction obtained from the collection rounds was subjected to different particle size reduction methods, as described in Table 2, and the size-reduced material was then analysed for PSD with the sieve shaker according to the procedures described in Section 2.1. Choice of processing schemes for the later trials in Table 2 was based on observations made during preceding trials (as discussed in the results section). Promising processing methods were repeated twice to four times, using material from different collection rounds. As an example, Trials 9b, 10c, 11c and 12c are repetitions, but using materials obtained from different rounds (collection rounds 9, 10, 11 and 12 in Table 1). In some cases, multiple repetitions were carried out as shown in Table 2 because the trial was actually performed to obtain material for subsequent processing. Due to availability of machinery, only those trials using the Alko-Kober garden waste shredder were directly performed by the University of Southampton, while the other shredding operations were carried out by Biogen Greenfinch Ltd. (Shropshire, UK) under instruction from the University of Southampton.
Three groups of particle size reduction trials were performed (Table 2): (A) Basic assessment of two types of shredding equipment and identification of a favourable jaw opening range for shear shredders; (B) assessment of PSD performance of a commercial shredder suitable for large-scale waste preparation and (C) advanced processing combining different methods to further reduce the proportion of large particles.
The material from the first two collections (Trials 1a to 2d) was used to assess the particle size reduction efficiency of two types of shredding equipment. The first type was a rotating shaft shear shredder (30001-1206-DI Muffin Monster, JWC Environmental, Santa Ana, CA, USA) in which the space between cutting discs on the shaft could be adjusted; and the second was the garden shredder type with rotary chopping blades, i.e., a high speed cutter where a feed pusher assists in feeding in material. Two models of garden waste shredder were used: a household machine (Alko-Kober Limited, Warwickshire, UK), and a commercial heavy-duty Viking electric garden shredder (Andreas Stihl Ltd., Surrey, UK).
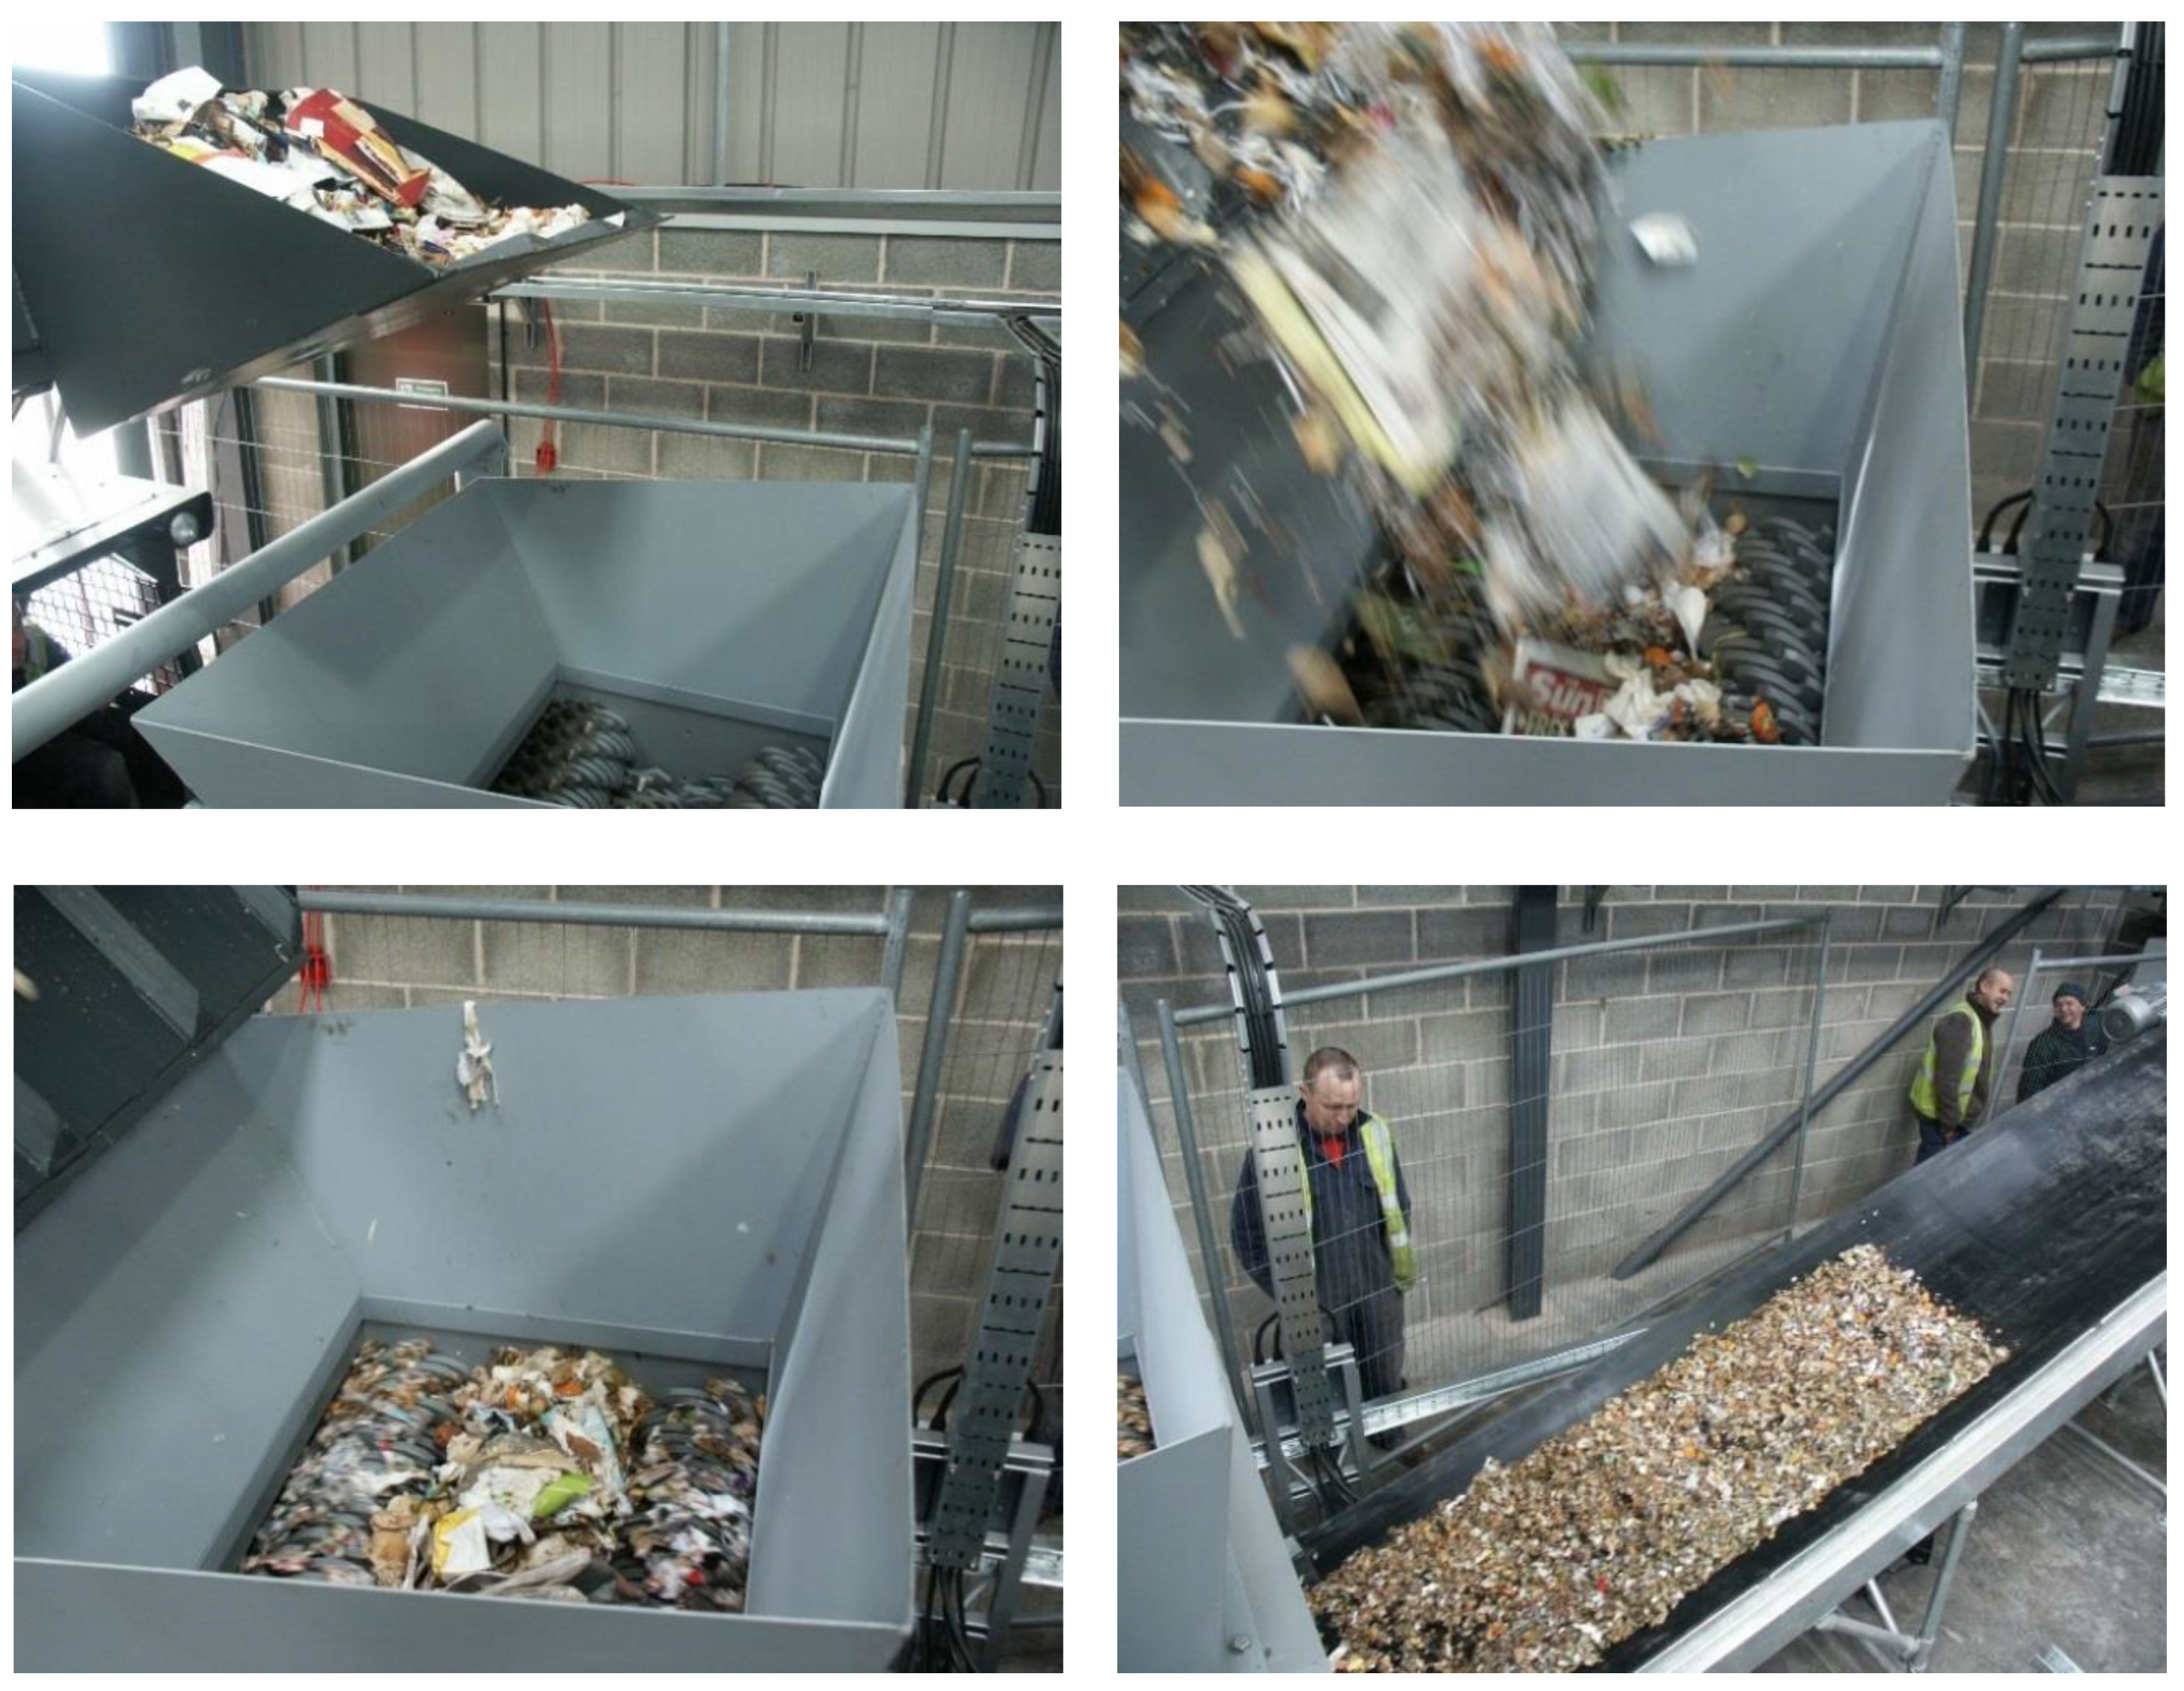
Materials from collection rounds 3 to 12 were processed in an Untha commercial shear shredder (RS404S, Untha Ltd., Karlstadt, Germany) installed on the Defra Demonstrator plant at Ludlow, Shropshire and operated by Biogen Greenfinch Ltd. The equipment had four counter-rotating shafts with cutting blades and a 20 mm jaw spacing, and a rejection screen the size of which could be changed. Material rejected by the screen is recycled through the shredder until it passes (i.e., the maximum two-dimensional size is the aperture of rejection screen). The equipment can be seen in operation in Figure A3 (Appendix A).
Materials from collection rounds 9 to 12, after having been processed with the Untha shear shredder, were subjected to further treatment, with the aim of further reducing the presence of large particles. The waste was first processed by passing it through the Untha shredder twice, and then the particle size of the fraction >20 mm was further reduced using the Alko-Kober shredder.
2.4. Wet Processing of Test Material (Maceration)
To produce a fine material with a significantly smaller average particle size than can be achieved with the mechanical processing schemes described in Section 2.3, a batch of test material was subjected to wet particle size reduction. Waste that had first been processed through the Untha shredder was passed through a macerating grinder (S52/010 Waste Disposer, Imperial Machine Company Ltd., Hertfordshire, UK). This feed preparation technique was designed to simulate the action of hydro-pulping technology, which has been adapted from the paper industry as a pre-treatment method for anaerobic processes such as the Linde BTA system (Linde-KCA-Dresden). A similar type of material could be produced using macerator pumps, although these are probably not as effective in achieving such a small particle size.
To determine the particle size of the prepared small-size waste it was diluted to give a slurry with a solids content of approximately 5% (w/v), and then analysed using a wet sieving technique [55]. This was performed manually using laboratory test sieves (Endecotts Ltd., London, UK) with a decreasing sequence of apertures (4.75, 3.18, 2, 1, 0.6 and 0.3 mm). The screened undersize material (particle size <0.3 mm) was collected in two 25-litre containers and then centrifuged to concentrate the finest particles prior to weight determination. The waste retained on each of the larger mesh size sieves was rinsed off with water. The centrifugate and the rinse waters were air-dried to a constant weight allowing the quantity of the macerated waste retained on each sieve to be expressed as a percentage weight fraction.
3. Results and Discussion
3.1. Particle Size Distribution Analysis on Materials Obtained from Full-Scale MBT Plants
For materials collected from the two full-scale MBT plants, the proportion classified as either organic or inert (physical contamination) based on the EA classification (Section 2.1) is shown in Table 3, as a percentage of the total sample weight. The low contamination in the ball mill processed waste is a result of the more complex processing scheme at this MBT plant, which included separate recuperation of different recyclables as described above. Clearly, this delivers a low-contamination input to the anaerobic digestion process at this site: the organic fraction represented nearly 92% of this mechanically pre-processed waste stream.
Figure 1 presents the results of particle size grading of the collected MBT materials. From Figure 1a it can be clearly seen that the hydraulic shredding process at Thornley waste transfer station is not highly effective, with 44% of waste falling into the >37.5 mm fraction. The finer particles (<5 mm) were thought to be naturally present in the waste, rather than being physically changed as a result of the action of the cutting blades (an observation also made during later experiments as discussed below in Section 3.2). Very different results were found for the ball mill processed MSW collected from Bursom recycling centre. This mechanically pre-processed waste had a mean particle size of 6.0 mm and more than 99% of the material was less than 13.2 mm (Figure 1b).
The overall process at Bursom recycling centre is thus effective in both sorting and particle size reduction, based on mechanical processing.
3.2. Dry Waste Shredding to Preliminary Assess Performance of Different Shredders and to Identify a Suitable Jaw Spacing for Shear Shredders (Trials 1a to 2d)
Figure 2a–c shows the PSD profiles obtained with the two-shaft shear shredder with adjustable jaw spacing (set to 12 mm in Figure 2a, 25 mm in Figure 2b and 50 mm in Figure 2c). For the 50 mm spacing (Figure 2c), an almost linear gradation of particle size was observed, from particles above 37.5 mm (37%) to those between 5–6.7 mm (2%). The finer particles (<5 mm) were thought to be naturally present in the waste rather than being physically changed as a result of the action of the cutting discs.
At the smaller jaw openings of 12 and 25 mm (Figure 2a,b) there was an increase in the percentage of materials in the size range 10–37.5 mm and a reduction to approximately 27% in the proportion of particles above 37.5 mm. The proportions of the smaller size fractions remained about the same, supporting the view that those below 10 mm were naturally present in the waste material and not generated as a result of the processing. Reducing the jaw size to less than 12 mm (results not shown) proved ineffective in cutting the waste and only served to compress the damp food component into balls.
To reduce the apparent particle size of the material further, a high speed rotary cutter was needed: this technology is typically employed in green waste cutting machinery and was simulated by the use of garden shredders. After use of the heavy-duty Viking electric garden shredder (Trial 1d) 27% of the material was able to pass the smallest mesh size used in the analysis and 60% was able to pass the 10 mm sieve (Figure 2d).
The results from Trials 2a, 2b and 2c (Figure 3a–c), which used the same equipment as Trials 1a, 1b and 1d to process material from collection round 2, gave a similar pattern, but with less effective shredding at the 25 mm jaw opening and also less effective shredding with the heavy-duty garden shredder. The elevated water content of the material used for these trials (see Table 1) is a potential explanation for the less effective shredding; however, further research would be required to understand implications of humidity. The light-duty garden shredder (Alko-Kober) used in Trial 2d was particularly effective at achieving particle sizes below 20 mm (ca. 70% particles < 20 mm; Figure 3d).
It can be concluded that a shear-type shredder is unsuitable for preparing a high moisture content waste fraction when the jaw size is closed down to less than 12 mm, due to compression of the material. Such risk of compression of high-moisture biomass during particle size reduction processing was previously noted in literature [29]. It can furthermore be concluded that the larger jaw size (>25 mm) gives very little cutting action to reduce the particle size to less than that of the jaw opening, and can only be regarded as providing a rough treatment to cut down objects that are bulky in more than one plane. The optimum jaw spacing for the shear shredder appeared to be between 12.5–25 mm and when set up in this manner it gave a substantial increase in particles in the mid range of between 10–37.5 mm. For ‘dry’ shredding to a finer particle size, the action of high-speed cutters appears to be a favourable option.
Based on these findings, a commercial shear shredder with 20 mm jaw spacing (Untha) was selected for the subsequent trials, keeping in mind that additional processing would be required to achieve an average particle size in the fine or medium size range (majority of particles <20 mm).
3.3. Commercial Shredder (Untha) Suitable for Large-Scale Waste Preparation (Trials 3 to 8b)
Three runs were carried out using the Untha shredder (20 mm jaw spacing) equipped with a 50 mm reject screen (Trials 3, 4 and 5b, using waste from collection rounds 3–5). The results from the sieve analysis are shown in Figure 4a–c. An additional run was carried out in which the post rejection screen material was processed a second time (equivalent to having two machines in series), as shown in Figure 4d. The results show that when operated in a single pass mode the equipment gave a consistent processed material with 70%–80% in the size range 6.7–20 mm and a mean value of 13–14 mm. Again, the proportion in the lower size fraction band is typical of that found in unprocessed waste, but the fraction above 20 mm was significantly reduced compared to that from the test rig used in the first two runs, due to the recycling of material from the reject screen. The double processing of the material further reduced this larger size fraction to less than 5% (Figure 4d).
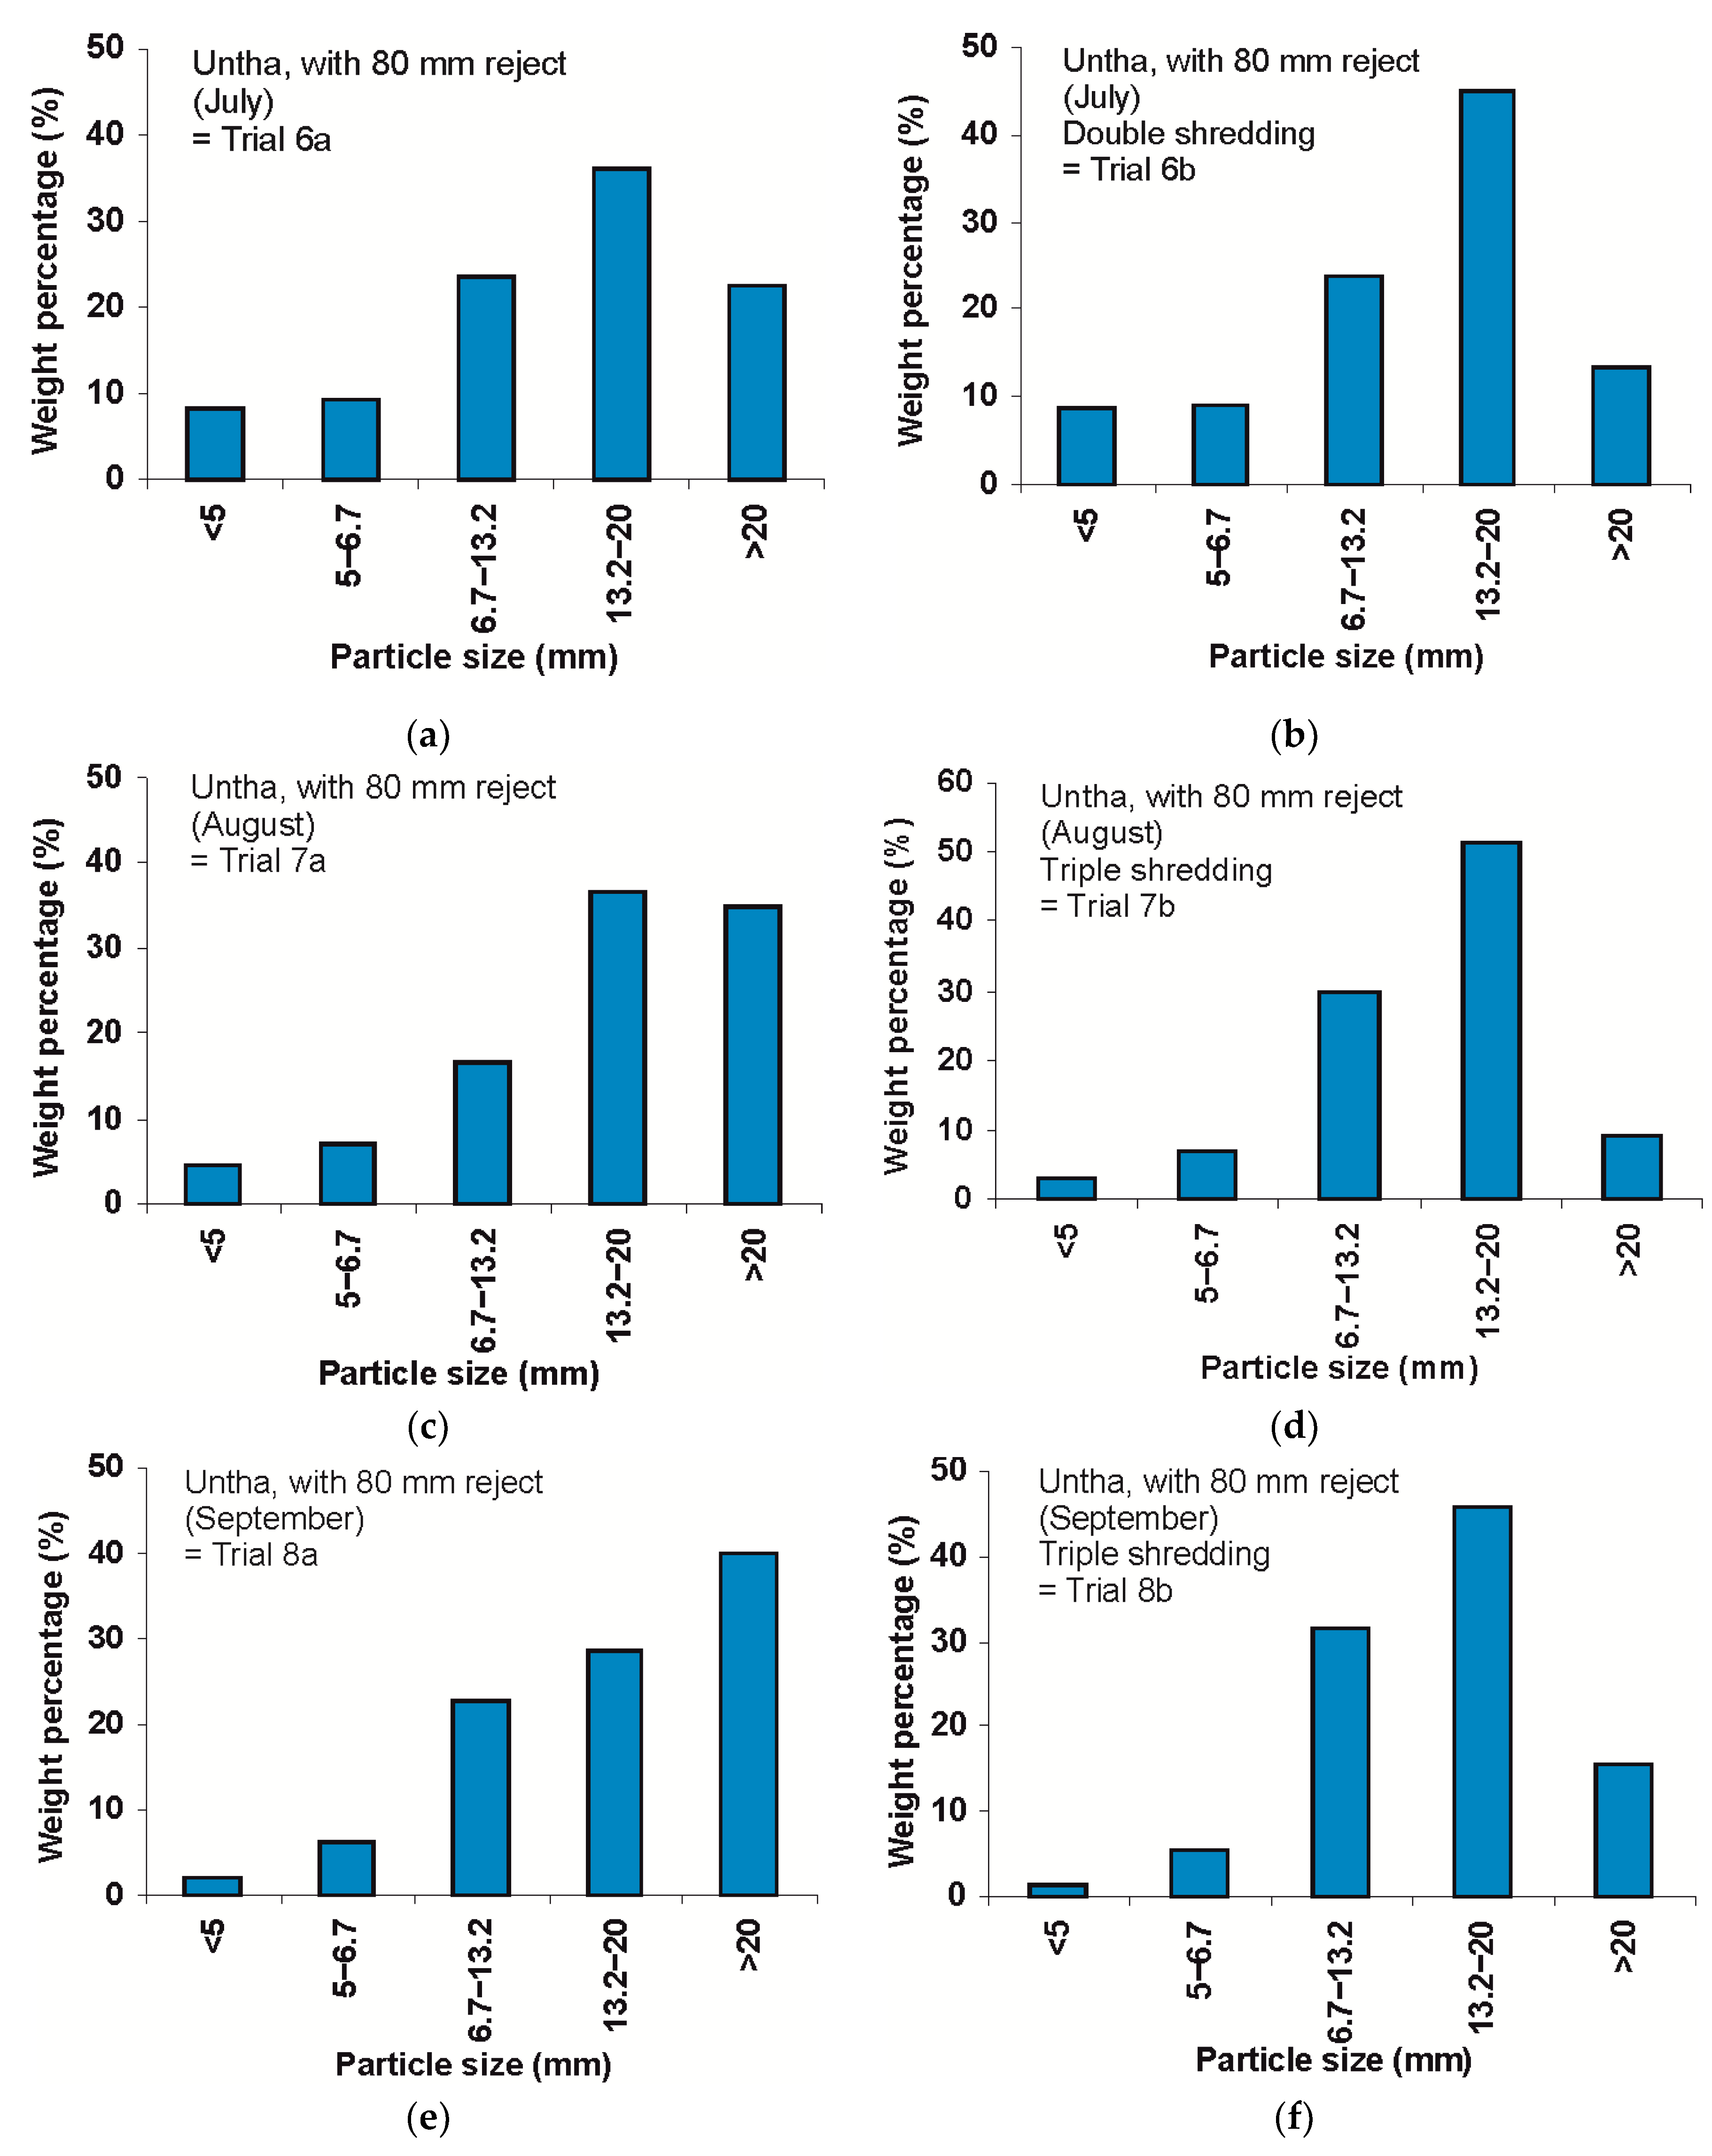
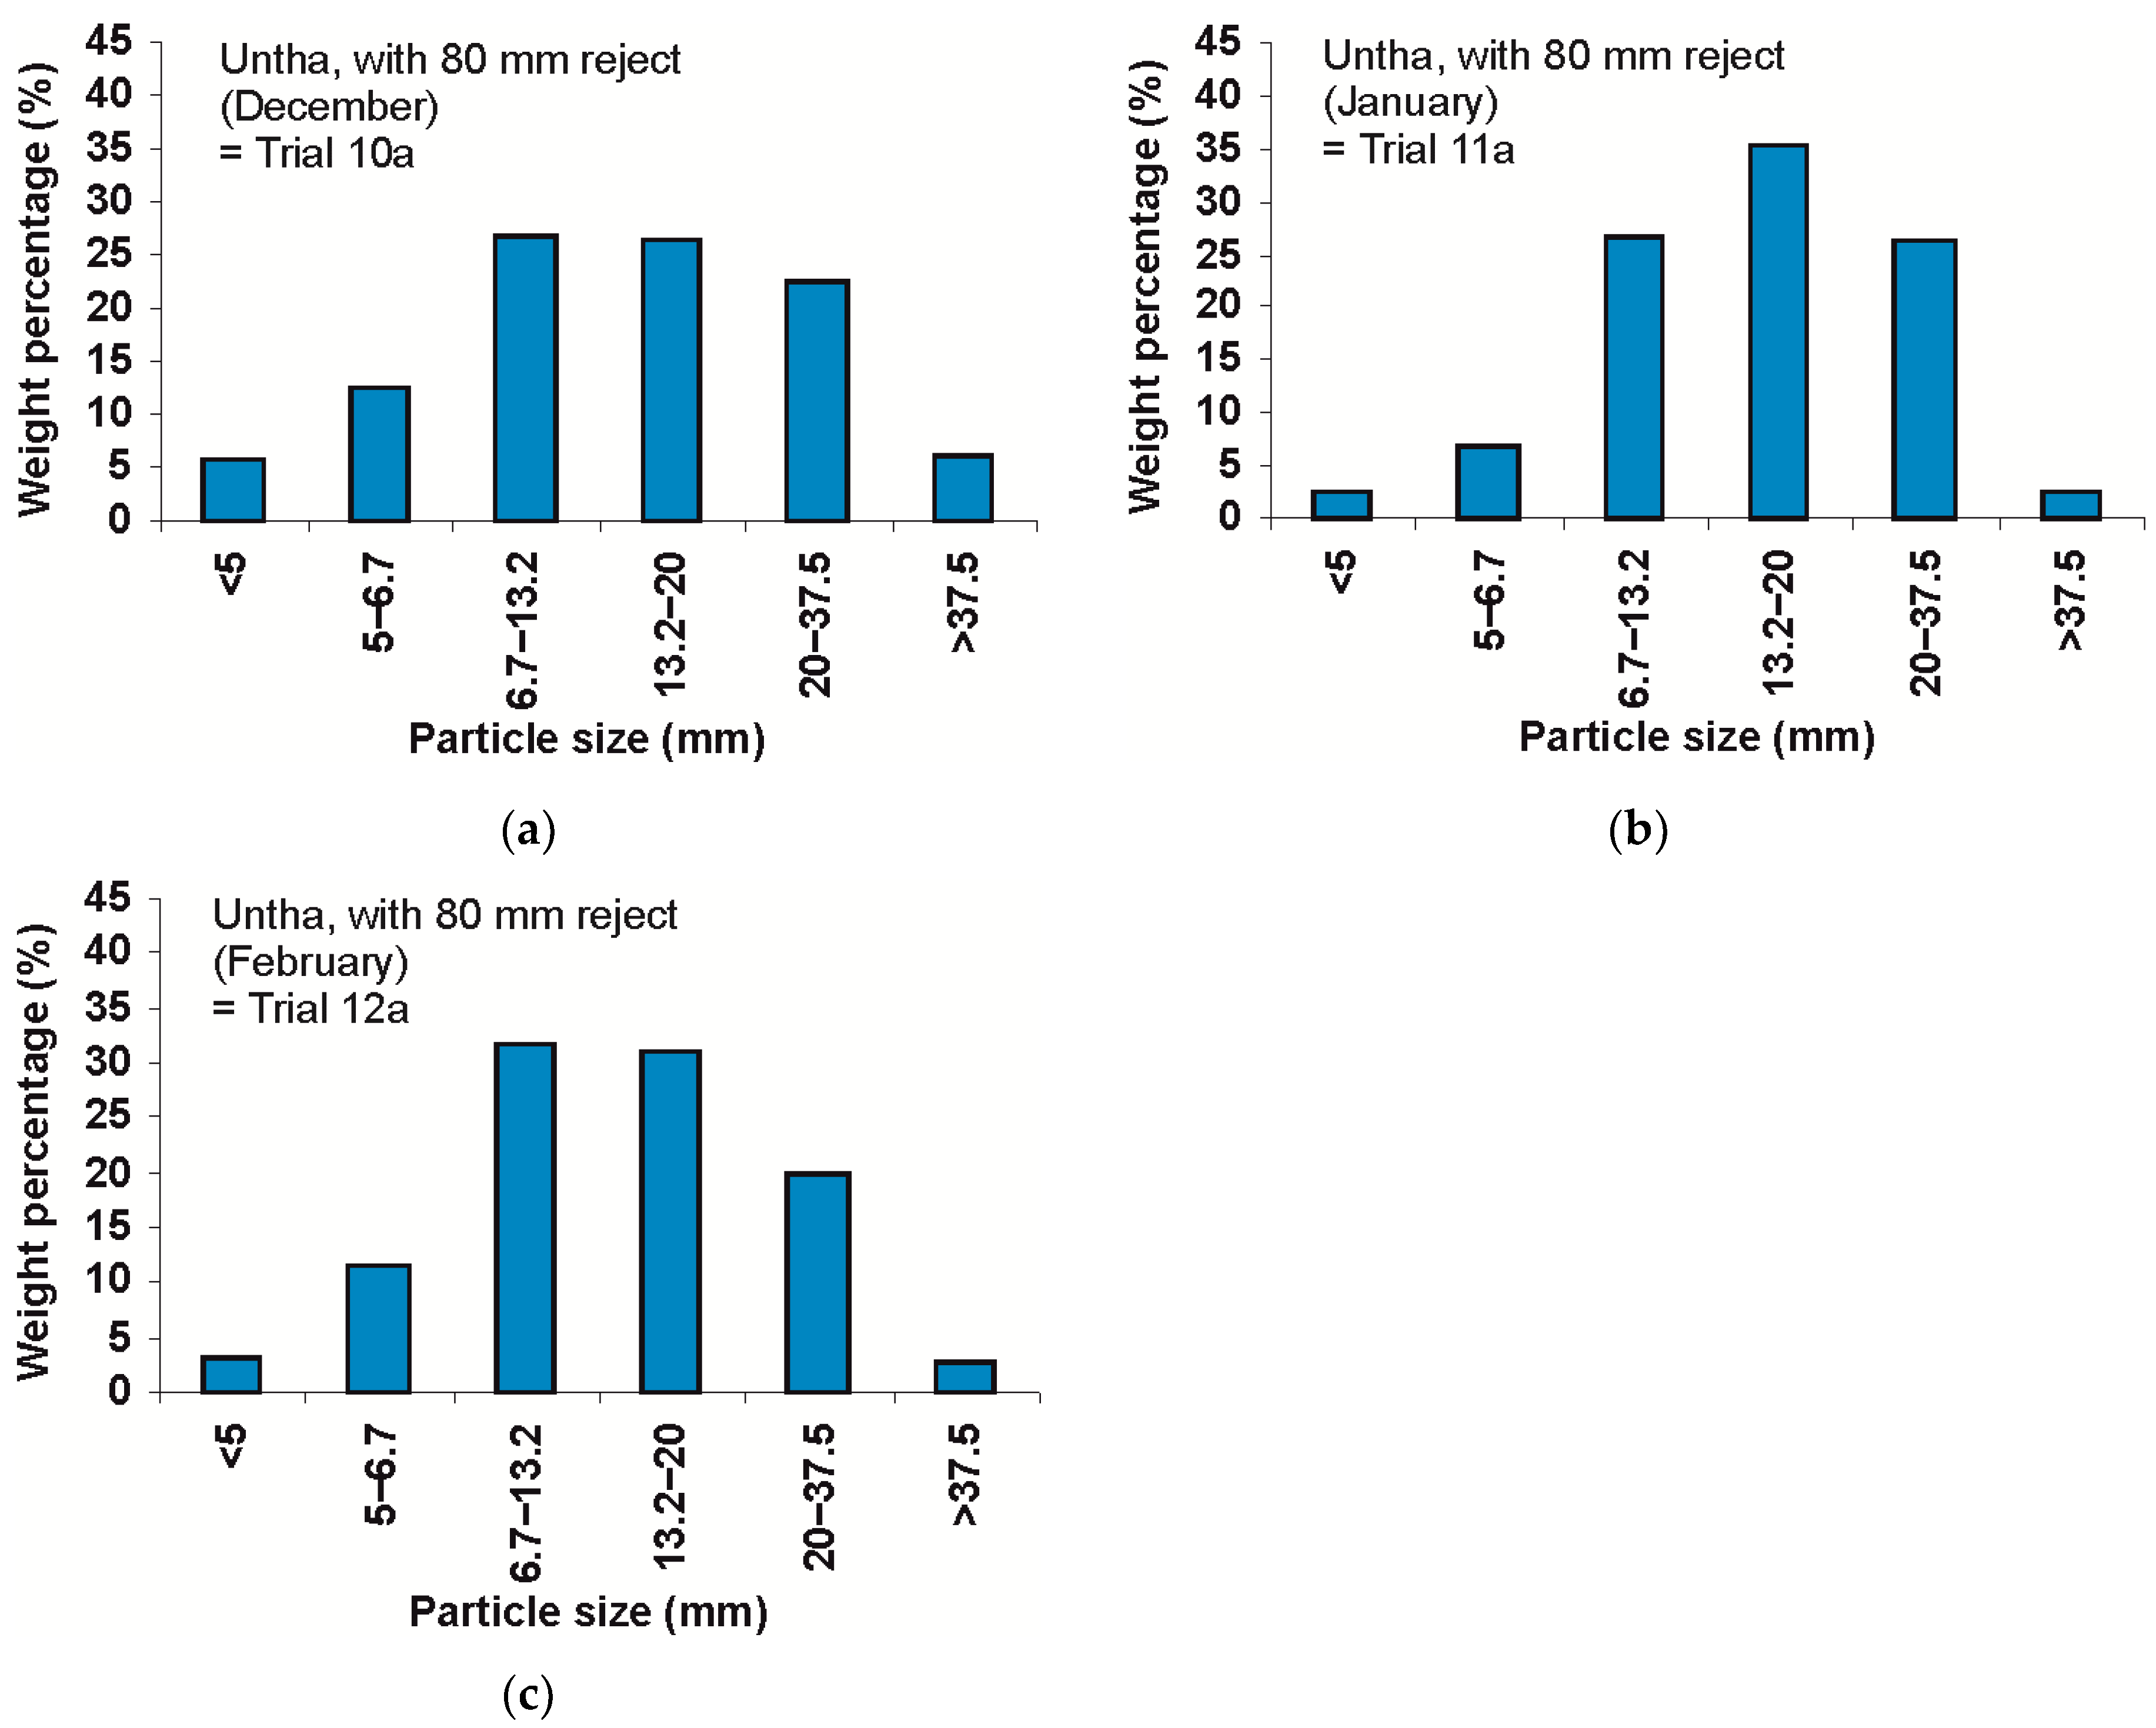
From Trial 6 (waste collection round 6) onwards, the aperture of the reject screen in the Untha shredder was increased to 80 mm and the waste was processed using this screen. When compared to results with the 50 mm reject screen, there was a significant increase in the proportion of particles in the >20 mm range as can be seen in Figure 5a,c,e. This observation was confirmed in later trials (Trials 10a, 11a and 12a; results shown in Figure A4 in Appendix B). Double or triple processing of the waste reduced this larger size fraction, as shown in Figure 5b,d,f, resulting in a mean particle size of 13–14 mm. Triple processing tended to compress the damp food component, however, and this can be seen from the reduced proportion of material recovered in the <5 mm size range. It was concluded that double processing using the Untha shear shredder with an 80 mm reject screen gave approximately the same size distribution as using the same equipment in a single pass mode with a 50 mm reject screen (confirmed in Section 3.5). The commercial Untha equipment installed on the Defra Demonstrator plant in Ludlow was equipped with an 80 mm reject screen by decision of the operator, and material was shredded twice with this equipment during subsequent trials.
3.4. Combining the Commercial Shredder (Untha) with Subsequent High-Speed Rotary Chopping (Alko-Kober Garden Shredder; Trials 9a to 12c)
The results of Trials 9a to 12c, aiming to further reduce the particle sizes to smaller ranges by applying different technologies in series, are shown in Figure 6.
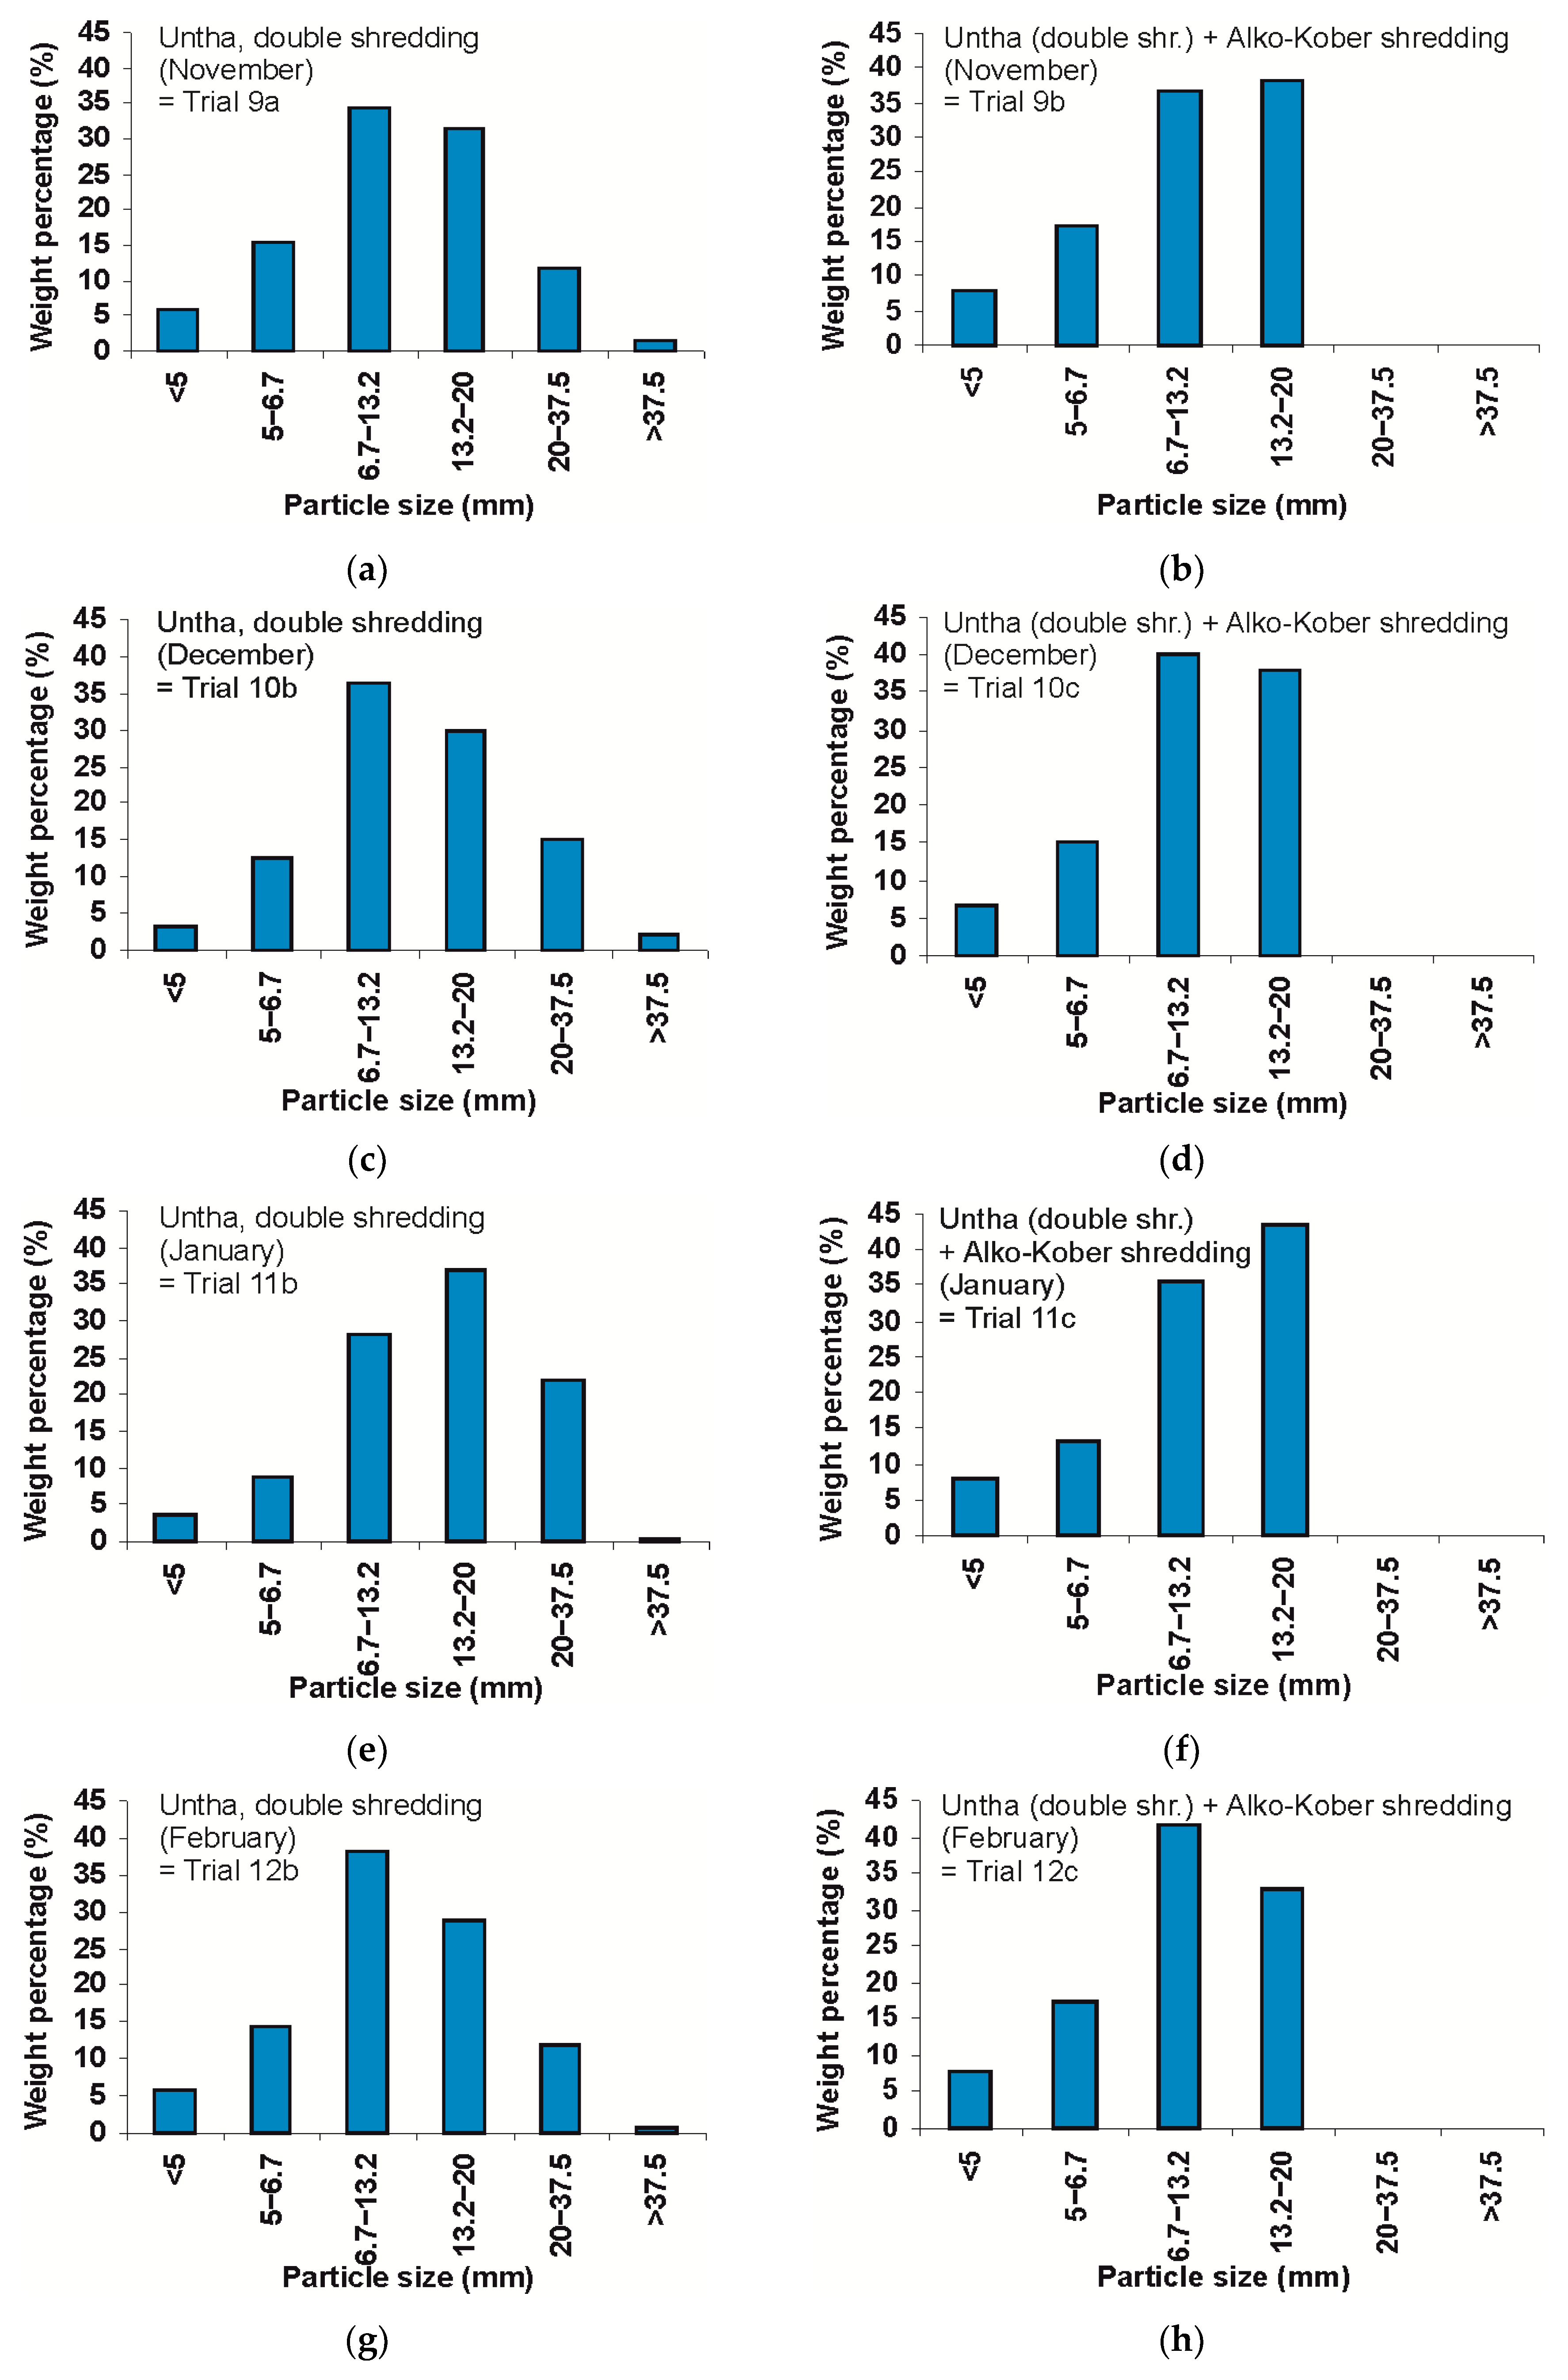
While some presence of larger particles is favourable in composting and dry anaerobic digestion, wet digestion generally benefits from smaller sized material. To further reduce the average particle size obtained with mechanical pre-treatment, material from the commercial Untha shredder was additionally processed with the light-duty garden shredder (Alko-Kober). This was applied to four batches, namely material from the last four collection rounds (9–12). Waste was processed by passing it through the Untha shredder twice, and the particle size of the fraction >20 mm was subsequently further reduced using the Alko-Kober shredder. The results of Trials 9a to 12c, aiming to further reduce the particle sizes to smaller ranges by applying different technologies in series, are shown in Figure 6. Four repetitions of the same approach, but using waste from other collection rounds are visualised: Figure 6a,c,e,g represent repetitions of sending the waste twice through the commercial Untha shredder, while in Figure 6b,d,f,h the waste was first passed twice through the Untha shredder and then additionally through the Also-Kober equipment.
This combined treatment using the Untha and Alko-Kober shredders in series achieved an output where all particles were below 20 mm and the mean particle size was 10 mm in all four batches (Figure 6b,d,f,h). The mean particle size of 10 mm is significantly below that of waste that had been shredded only with the Untha equipment. Shredding the material once produced a waste where around 30% of particles were >20 mm and the mean particle size was 15–17 mm (PSD of three batches shown in Figure A4, Appendix B). Double shredding with the Untha equipment (Figure 6a,c,e,g) generated a mean particle size of 13–14 mm.
3.5. Mean Values across the Different Trials Using the Commercial Shredder (Trials 3 to 12c)
Mean values of trials where the same processing was applied to waste are shown in Table 4.
Shredding the waste once with the commercial Untha shredder equipped with an 80 mm reject screen achieved an average particle size of 17 mm and a relatively high proportion (30%) of larger particles (>20 mm). Shredding the waste twice with this equipment or using a 50 mm reject instead reduced the mean particle size to 13–14 mm and the proportion of larger particles (>20 mm) to ca. 15%, while the proportion of very fine particles (<5 mm) was 4%–6%. For triple shredding, as explained above, the very low proportion of fine particles was due to compression of damp components with agglomeration into larger particles. While in wet digestion this might not affect process performance, because agglomerated particles may re-suspend into the stirred liquid reactor contents, such compressed material is of concern in dry digestion or composting [8,19,24]. No such compression was observed when waste was first shredded twice with the Untha shredder and then passed through the Alko-Kober light-duty garden shredder, achieving an average particle size of 10 mm.
A high reproducibility of treatment output (indicated by a low standard deviation across batches) would improve predictability of PSD patterns and of average particle size. It was expected that multiple processing, using several types of equipment or processes in series, would reduce output variations across batches and thus increase the predictability of treatment output. However, compared to single processing, lower standard deviations were only partially found for trials where waste had been exposed to multiple processing. For the experiments using the Untha shredder with an 80 mm reject screen, PSD pattern variation across batches was indeed lower after triple shredding (either triple shredding with the Untha machinery or double shredding with the Untha plus shredding with Alko-Kober); but this was not the case after double shredding. The lowest variation (lowest standard deviation) was found for single processing using the Untha shredder with a 50 mm reject screen. This suggests that, while multiple processing might in some cases improve reproducibility of results and therefore the predictability of outcome, such increased output predictability cannot generally be expected for schemes that use several types of equipment in series compared to schemes with just one machinery.
3.6. Further Observations from the ‘Dry’ Mechanical Treatments Using Shredding Equipment (Trials 1 to 12c)
When using the shredder equipment, particles larger than the jaw opening of the shredders were found in the PSD analysis. This is due to the functioning principle of shear shredders and to the nature of the material itself, which is not uniform in all dimensions. The shearing action tears or cuts the materials, but thin flexible items may slip through the gaps between the knives [26,29]. Another factor is the method of analysis used. For example, paper can pass through the shredder as torn strands, which on a sieve analysis lie flat against the mesh of the sieve. This was an unavoidable limitation in the analytical method, despite the use of British Standard equipment. The results from different samples can still be compared, however, provided that these are processed in the same manner.
It was expected that studying the different ‘dry’ mechanical treatments applied to the organically enriched MSW in Trials 1 to 12c would allow identification of a processing that could be used to generate a waste composed of particles primarily in a medium size range between 10 and 20 mm, with particles in other size ranges more or less absent. A waste with such purposely-tailored PSD can be expected to show favourable performance in composting and dry anaerobic digestion, where some particle size reduction is beneficial, but the presence of fine particles is unwanted due to the risk of inhibition of the biological degradation. In practice, however, such tailored processing to a ‘medium-sized’ material was not possible. PSD of each treatment revealed the presence of a significant proportion of fine particles, with even the smallest fraction (<5 mm) making up to 10% of total weight. This is explained by the fact that even before shredding the waste already had an inherent component of smaller particle sizes. Presence of such small particles in MSW was previously reported in literature [56,57].
Some PSD profiles suggest a certain level of symmetry; PSD in waste that was shredded twice with the commercial rotating shaft shear shredder (Untha equipment) was close to a bell-shaped curve (Figure 6a,c,e,g). However, such symmetric particle distribution was not generally observed. Some trials rather showed a near-linear gradation of particle sizes (e.g., Figure 6b,d,f,h). In other trials no distinct PSD pattern occurred. These findings highlight that symmetry in the PSD cannot be assumed in the shredded organic fraction of MSW, which implies that knowledge of a mean particle size will not allow estimation of the actual distribution of particle sizes.
What can be concluded, however, is that processing the organic fraction of MSW with a rotating shaft shear shredder, which is the common type of shredding equipment in MBT, produces a PSD pattern with a maximum of particles close to the shredder’s jaw spacing (20 mm in this work); but also with significant amounts of smaller and larger particles. In contrast, the high speed rotary cutter (garden shredder), which is common in green waste treatment but not in MBT, was more effective at reducing larger particles, and the resulting PSD profiles showed little similarity to those from rotating shaft shear shredders. Clearly, garden shredders cannot be used to simulate rotating shaft shear shredding in MBT.
3.7. Wet Processing of Test Material with the Macerating Grinder
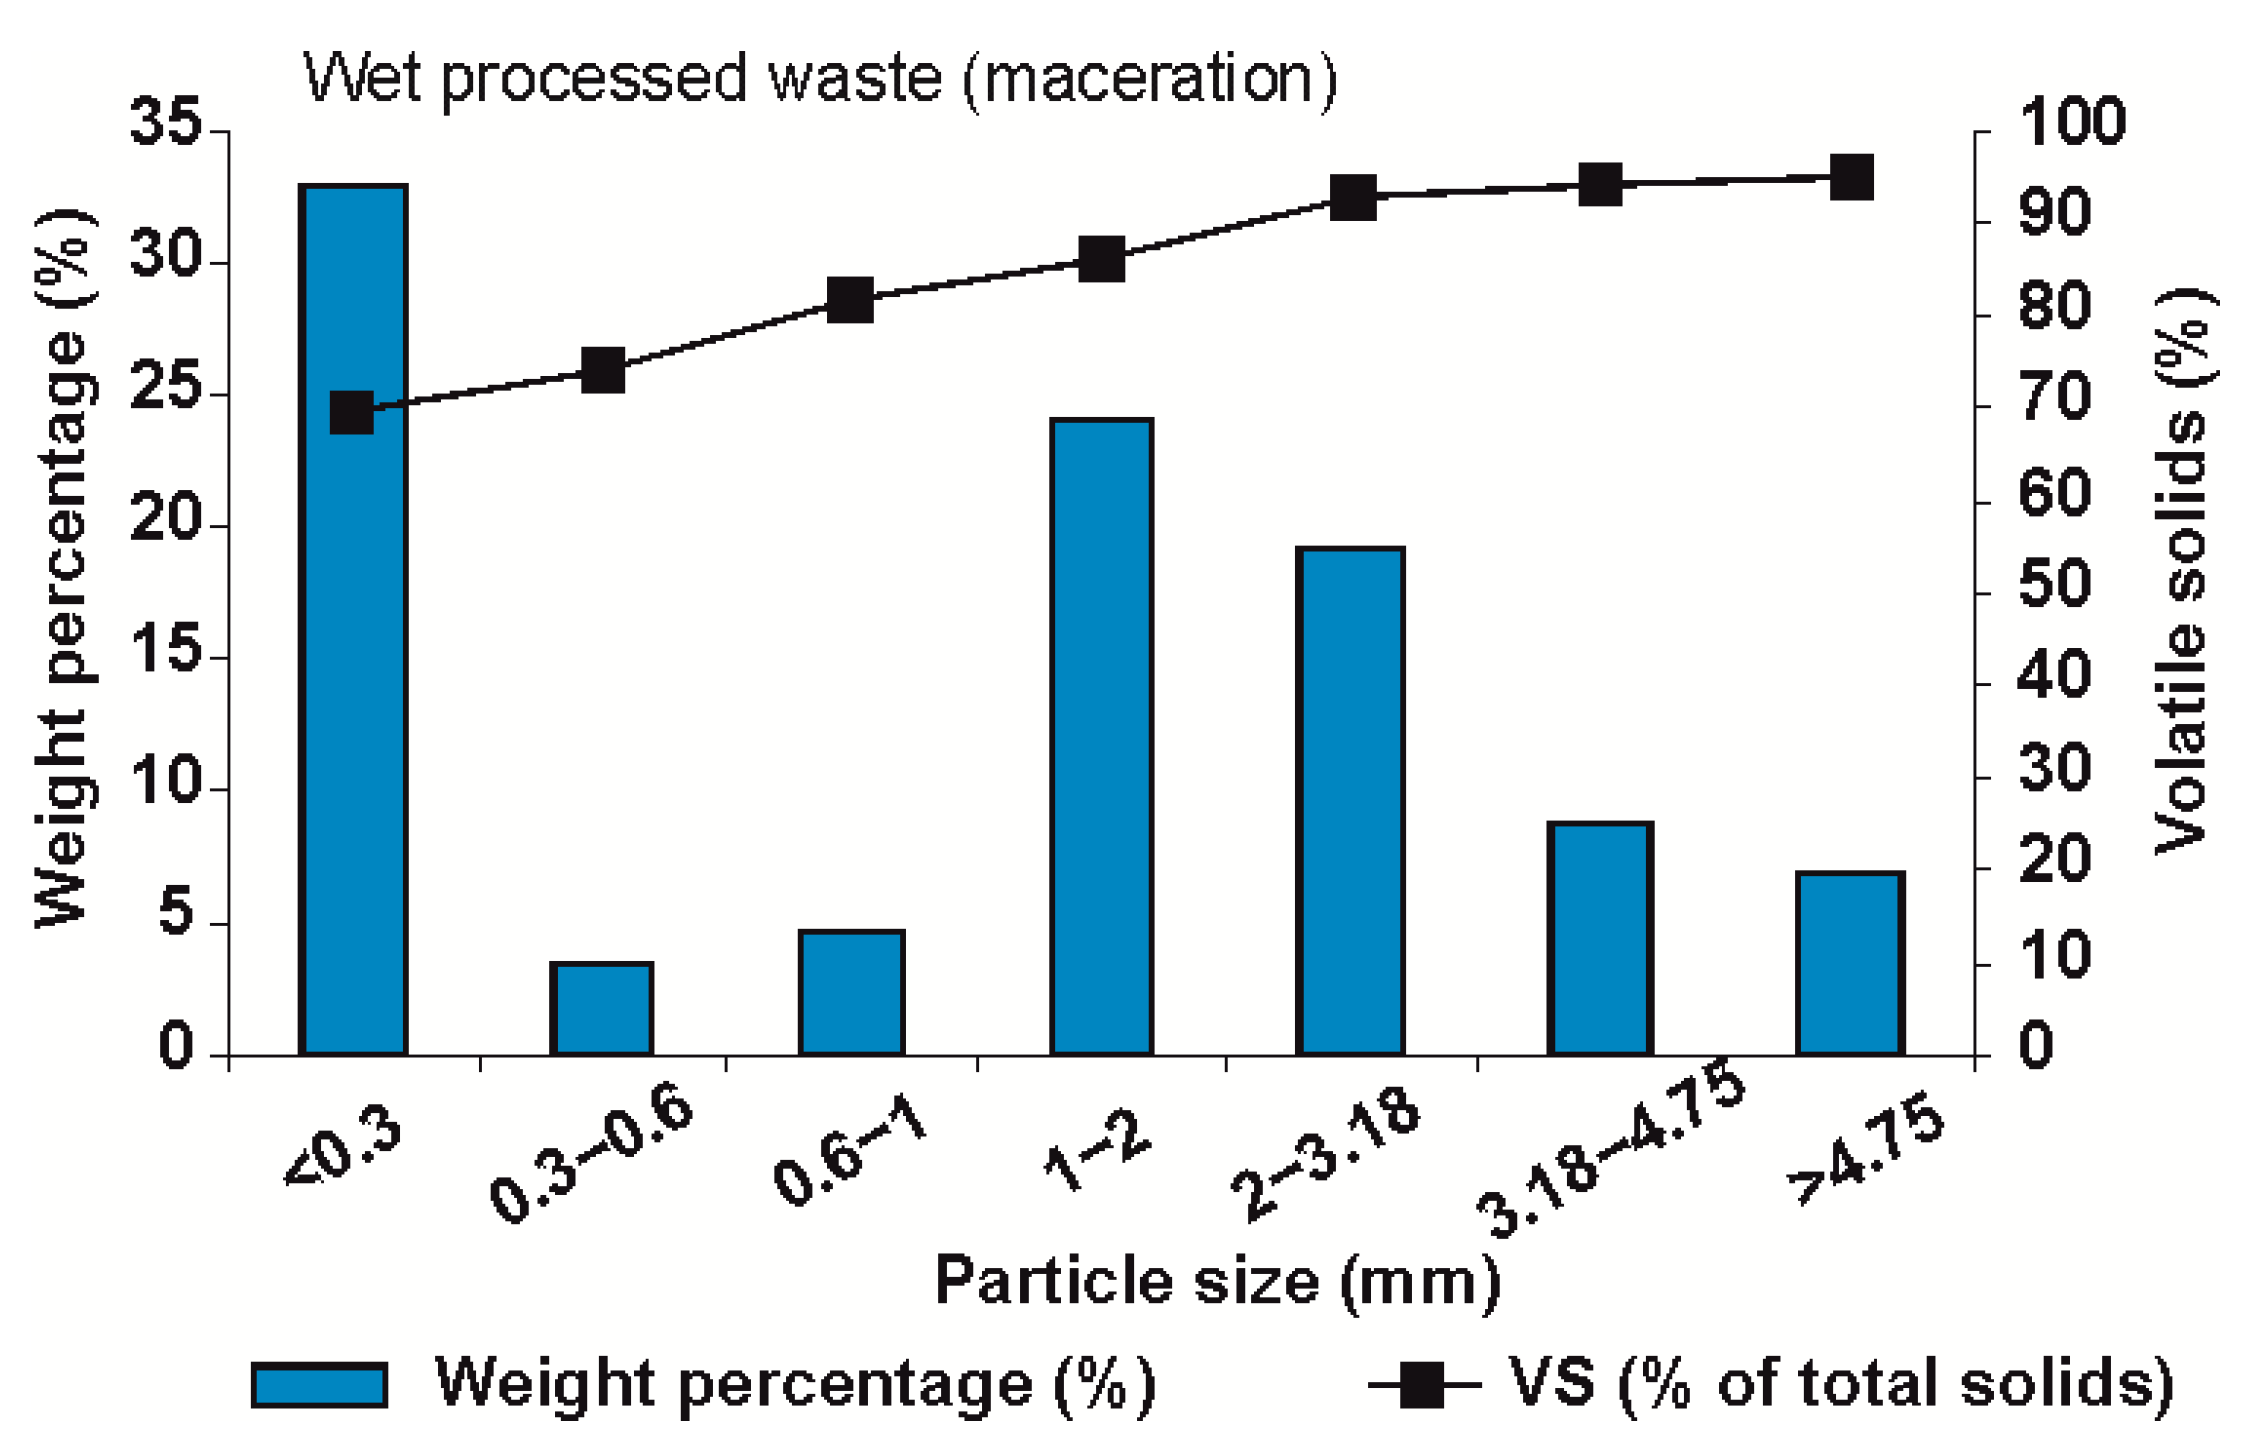
The results of the wet processing using the macerating grinder are shown in Figure 7. The mean particle size of wet processed material was 1.7 mm, with a substantial percentage (33%) being less than 0.3 mm. These results confirm that wet processing of MSW using a macerating grinder is very effective in terms of particle size reduction. Less than 10% of material belonged to the particle size range >5 mm. However, such extensive particle size reduction might not be beneficial to improve performance of the material during bioprocessing. Notably, with such fine material there is an increased risk of foaming during wet anaerobic digestion [17]. Gunaseelan [11] also reported no significant digestion benefit from such an extensive size reduction. For dry digestion and composting, which require a substrate matrix with voids between the solid particles [8,19,24], such pre-treatment is generally not suitable.
The volatile solids (VS) content of each fraction of the macerated waste was measured and this revealed that the smaller particle sizes had a higher ash content, indicating that a proportion of these could be soil or similar material. This supports the earlier observation that MSW contains a substantial inherent fraction of small-size particles (usually around 5% and up to 10% w/w of <5 mm in the earlier trials of this study) and suggests that this fraction incorporates a significant amount of inert material. It has previously been reported that the fine fraction of MSW contains elevated proportions of inert materials such as sand [56]. The presence of sand and similar inert materials is unfavourable in bioprocessing, since it causes abrasion of technical equipment, reduced operating reactor volume as result of accumulating inert fractions (in particular in wet anaerobic digestion) and a need for regular removal of such material from the reactor [58].
3.8. Specific Value and Limitations of the Study
This study explored the performance of different particle size reduction processes applied to MSW fractions, under the lens of understanding the resulting PSD patterns. The results contribute to closing the gap of knowledge around PSD in pre-treated waste. The information obtained is of use in evaluating the suitability of technologies for the pre-treatment of material destined for different types of bioprocessing (composting and anaerobic digestion).
The results remain preliminary, in so far as testing was done with MSW from one UK urban region only. The waste was collected from the same transfer station and round in 12 different months, but there was no comparison to MSW from other regions. While several repetitions were performed for many of the processing schemes studied, some testing was done once only, such as the wet processing using the macerating grinder. Although this does not limit the informative value of results in answering the defined research questions, a more complex study design, based on a higher number of waste samples and including waste from different regions, would be required to allow statistically supported final conclusions about particle size distributions in pre-treated organic wastes. In addition, more complex studies should compare the outputs of commercial equipment from different manufacturers. The results of this work suggest that caution is needed in generalising observations. The organic fraction of MSW is composed of various types of materials, including food waste, paper, wood or textiles, which might all show different performance under specific pre-treatments, and especially as constituents of damp mixtures. Performance of individual constituents of organic waste was not studied in this work.
Observations made during the different trials suggest that the shape of particles is a relevant factor (see Section 3.6), which was not studied in detail in this work. Therefore, future research should explore the actual shape of particles. Finally, energy consumption of equipment was not monitored, but would need to be considered when evaluating overall efficiency of pre-treatment schemes.
4. Conclusions
Assessment of the particle size distribution (PSD) in the output from mechanical size reduction equipment operated at two full-scale MBT plants, i.e., PSD in pre-treated municipal solid waste (MSW) that serves as the input to bioprocessing at these MBT sites, revealed two major points of interest:
- The hydraulic shredder used at the Thornley waste transfer station, Durham, was not effective in reducing the particle size of the waste stream as delivered.
- The ball mill and mechanical pre-treatment used at the Burson plant, Leicester, was very effective in producing a fine graded material suitable as a feedstock for bioprocessing.
From the experimental work of this study, which consisted of using different particle size reduction equipment and modes of operation to pre-treat MSW destined for bioprocessing, the following conclusions are drawn:
- MSW (domestic waste collected from Otterbourne transfer station) was shown to have a substantial fraction of small size particles inherent in the material without any pre-treatment.
- Shear-type shredders appeared to be unsuitable for preparing a high moisture content waste fraction at a small jaw opening size (below 12 mm), as compression forms the material into balls. A jaw opening around 20 mm was found favourable to process the organic fraction of MSW.
- Shear shredders can be used effectively to reduce the particle size of material larger than the jaw spacing and/or reject screen aperture, but the output still contains particles that are larger than the jaw spacing.
- The particle size distribution can be influenced by changing jaw spacing, screen aperture and/or number of passes through the shredder but this affects the mid-range rather than the smaller sizes which pass through the shredder without change.
- The reject screen aperture of shear shredders in combination with the jaw opening is important in determining the upper size limit, but cannot be used to ‘grade’ the waste material: PSD in treated organic waste spans across multiple size ranges.
- High-speed cutters appeared to be effective in reducing the particle size of larger dry fractions of the waste material.
- The wet grinder (macerator) was very effective in producing a homogeneous material of particle size less than 5 mm with a mean of 1.7 mm; however, such extensive particle size reduction might not be favourable during subsequent bioprocessing.
While several particle size reduction technologies and schemes were shown to be effective in reducing the mean particle size, it was also revealed that variations exist across actual particle size distribution patterns. At the same time, different bioprocessing schemes benefit from different particle sizes. Therefore, choice in favour of a pre-treatment scheme must be made under consideration of the bioprocessing scheme in scope. The results of this work facilitate the selection of an MSW pre-treatment scheme that supports best performance of the organic material during bioprocessing. Further research is required to reveal the performance of different waste constituents during particle size reduction, i.e., the resulting component-specific particle size distribution patterns. There is also a need to extend the study to commercially available equipment from other manufacturers, in order to better understand to what degree particle size distribution patterns are not only replicable but also transferable.
Author Contributions
Conceptualisation, S.H. and Y.Z.; methodology, S.H. and Y.Z.; formal analysis, Y.Z., S.K.-B. and S.G.; investigation, Y.Z.; resources, S.H.; data curation, Y.Z.; writing—original draft preparation, Y.Z., S.H., S.K.-B. and S.G.; writing—review and editing, S.K.-B., S.G., S.H. and Y.Z.; visualisation, Y.Z. and S.K.-B.; project administration, Y.Z.; supervision, S.H.
Funding
This work was carried out with funding from the Defra Technologies Research and Innovation Fund (TRIF). Shiyan Gu was supported by a China Scholarship Council Visiting Scholar Fellowship.
Acknowledgments
The authors would particularly like to acknowledge the staff of Greenfinch Ltd. (now BiogenGreenfinch) for their support and assistance.
Conflicts of Interest
The authors declare no conflict of interest. The funders had no role in the design of the study; in the collection, analyses, or interpretation of data; in the writing of the manuscript, or in the decision to publish the results.
Appendix A
Figure A1.
Size-graded organic waste and contaminants in the waste from Thornley waste transfer station, Durham: (a) Composite components greater than 37.5 mm mesh size, manually separated (as labelled) and (b) size fractions (in mm) as recovered after the particle size analysis (as labelled).
Figure A1.
Size-graded organic waste and contaminants in the waste from Thornley waste transfer station, Durham: (a) Composite components greater than 37.5 mm mesh size, manually separated (as labelled) and (b) size fractions (in mm) as recovered after the particle size analysis (as labelled).

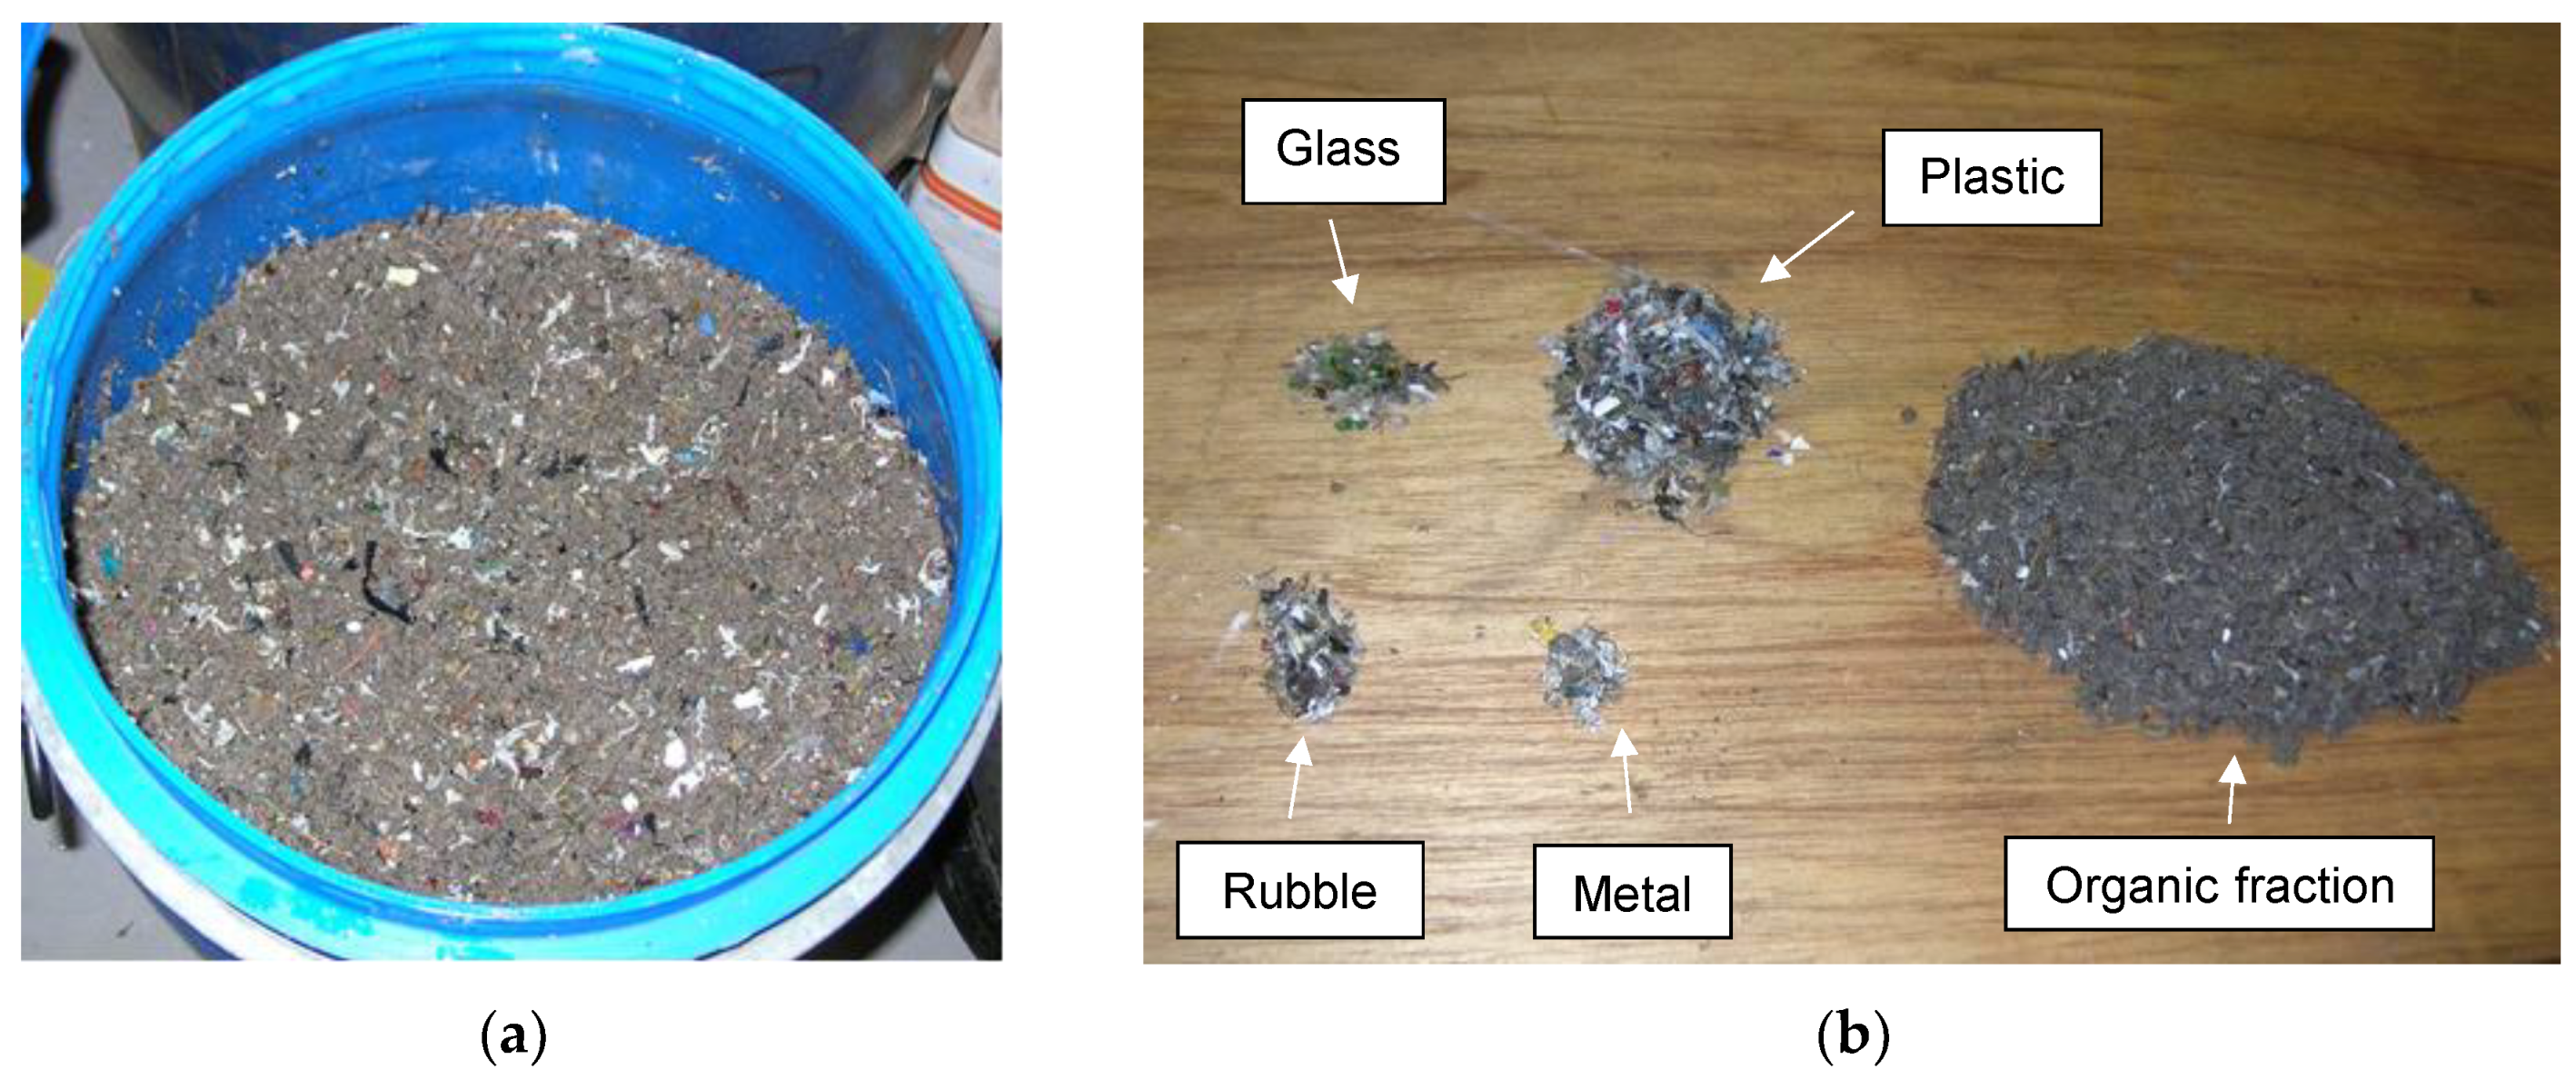
Figure A2.
MBT material from Bursom recycling centre, Leicester: (a) Non source-segregated mechanically pre-treated MSW (ball mill processed waste) as received from the recycling centre, before it would be sent to Wanlip for further processing as feed for the anaerobic digester and (b) hand-sorted fractions of size graded waste (6.7–13.2 mm particle size).

Figure A3.
Operation of the Untha shear shredder at the Biocycle plant, Ludlow (photos illustrate the feeding mechanism, the shaft cutters and the processed material leaving via the conveyor).
Figure A3.
Operation of the Untha shear shredder at the Biocycle plant, Ludlow (photos illustrate the feeding mechanism, the shaft cutters and the processed material leaving via the conveyor).

Appendix B
Figure A4.
Particle size analysis on shredded waste using a commercial four-shaft shear shredder (Untha Ltd.) with an 80 mm reject screen: (a) Trial 10a (waste from collection round 10); (b) Trial 11a (collection round 11) and (c) Trial 12a (collection round 12).
Figure A4.
Particle size analysis on shredded waste using a commercial four-shaft shear shredder (Untha Ltd.) with an 80 mm reject screen: (a) Trial 10a (waste from collection round 10); (b) Trial 11a (collection round 11) and (c) Trial 12a (collection round 12).

References
- Malinauskaite, J.; Jouhara, H.; Czajczynska, D.; Stanchev, P.; Katsou, E.; Rostkowski, P.; Thorne, R.J.; Colon, J.; Ponsa, S.; Al-Mansour, F.; et al. Municipal solid waste management and waste-to-energy in the context of a circular economy and energy recycling in Europe. Energy 2017, 141, 128. [Google Scholar] [CrossRef]
- Lee, P.; Sims, E.; Bertham, O.; Symington, H.; Bell, N.; Pfaltzgraff, L.; Sjögren, P.; Wilts, H.; O’Brien, M. Towards a Circular Economy—Waste Management in the EU; European Parliamentary Research Service: Brussels, Belgium, 2017. [Google Scholar]
- Tolvik Consulting. 2017 Briefing Report: Mechanical Biological Treatment—15 Years of UK Experience. 2017. Available online: https://www.tolvik.com/wp-content/uploads/2017/09/Tolvik-2017-Briefing-Report-Mechanical-Biological-Treatment.pdf (accessed on 6 October 2019).
- Panigrahi, S.; Dubey, B.K. A critical review on operating parameters and strategies to improve the biogas yield from anaerobic digestion of organic fraction of municipal solid waste. Renew. Energy 2019, 143, 779–797. [Google Scholar] [CrossRef]
- Hartmann, H.; Ahring, B.K. Strategies for the anaerobic digestion of the organic fraction of municipal solid waste: An overview. Water Sci. Technol. 2006, 53, 7–22. [Google Scholar] [CrossRef] [PubMed]
- Yadvika; Santosh; Sreekrishnan, T.R.; Kohli, S.; Rana, V. Enhancement of biogas production from solid substrates using different techniques—A review. Bioresour. Technol. 2004, 95, 1–10. [Google Scholar] [CrossRef] [PubMed]
- Reyes-Torres, M.; Oviedo-Ocana, E.R.; Dominguez, I.; Komilis, D.; Sánchez, A. A systematic review on the composting of green waste: Feedstock quality and optimization strategies. Waste Manag. 2018, 77, 486–499. [Google Scholar] [CrossRef]
- Hamoda, M.F.; Abu Qdais, H.A.; Newham, J. Evaluation of municipal solid waste composting kinetics. Resour. Conserv. Recycl. 1998, 23, 209–223. [Google Scholar] [CrossRef]
- Dahunsi, S.O. Mechanical pretreatment of lignocelluloses for enhanced biogas production: Methane yield prediction from biomass structural components. Bioresour. Technol. 2019, 280, 18–26. [Google Scholar] [CrossRef] [Green Version]
- Karthikeyan, P.O.; Trably, E.; Mehariya, S.; Bernet, N.; Wong, J.W.C.; Carrere, H. Pretreatment of food waste for methane and hydrogen recovery: A review. Bioresour. Technol. 2018, 249, 1025–1039. [Google Scholar] [CrossRef] [Green Version]
- Gunaseelan, V.N. Anaerobic digestion of biomass for methane production: A review. Biomass Bioenergy 1997, 13, 83–114. [Google Scholar] [CrossRef]
- Mason, P.M.; Stuckey, D.C. Biofilms, bubbles and boundary layers–A new approach to understanding cellulolysis in anaerobic and ruminant digestion. Water Res. 2016, 104, 93–100. [Google Scholar] [CrossRef]
- Hernadez-Beltran, J.U.; Hernández-De Lira, I.O.; Cruz-Santos, M.M.; Saucedo-Luevanos, A.; Hernández-Terán, F.; Balagurusamy, N. Insight into pretreatment methods of lignocellulosic biomass to increase biogas yield: Current state, challenges, and opportunities. Appl. Sci. 2019, 9, 3721. [Google Scholar] [CrossRef]
- Martinez, E.J.; Rosas, J.G.; Moran, A.; Gomez, X. Effect of ultrasound pretreatment on sludge digestion and dewatering characteristics: Application of particle size analysis. Water 2015, 7, 6483–6495. [Google Scholar] [CrossRef]
- Sanders, W.T.M.; Geerink, M.; Zeeman, G.; Lettinga, G. Anaerobic hydrolysis kinetics of particulate substrates. Water Sci. Technol. 2000, 41, 17–24. [Google Scholar] [CrossRef] [PubMed]
- Sharma, S.K.; Mishra, I.M.; Sharma, M.P.; Saini, J.S. Effect of particle size on biogas generation from biomass residues. Biomass 1988, 17, 251–263. [Google Scholar] [CrossRef]
- Zhang, Y.; Banks, C.J. Impact of different particle size distributions on anaerobic digestion of the organic fraction of municipal solid waste. Waste Manag. 2013, 33, 297–307. [Google Scholar] [CrossRef] [Green Version]
- Izumi, K.; Okishio, Y.-K.; Nagao, N.; Niwa, C.; Yamamoto, S.; Toda, T. Effects of particle size on anaerobic digestion of food waste. Int. Biodeter. Biodegr. 2010, 64, 601–608. [Google Scholar] [CrossRef]
- Kusch, S. Methanisierung Stapelbarer Biomassen in Diskontinuierlich Betriebenen Feststofffermentationsanlagen; Utz Verlag: Munich, Germany, 2007. [Google Scholar]
- Martin, D.J. Mass transfer limitations in solid-state digestion. Biotechnol. Lett. 1999, 21, 809–814. [Google Scholar] [CrossRef]
- Kusch, S.; Oechsner, H.; Jungbluth, T. Biogas production with horse dung in solid-phase digestion systems. Bioresour. Technol. 2007, 99, 1280–1292. [Google Scholar] [CrossRef]
- Sponza, D.T.; Agdag, O.N. Effects of shredding of wastes on the treatment of municipal solid wastes (MSWs) in simulated anaerobic recycled reactors. Enzym. Microb. Technol. 2005, 36, 25–33. [Google Scholar] [CrossRef]
- Vandevivere, P.; De Baere, L.; Verstrate, W. Types of anaerobic digester for solid wastes. In Biomethanisation of the Organic Fraction of Municipal Solid Wastes; Mata-Alvarez, J., Ed.; IWA Publishing: London, UK, 2003; pp. 111–140. [Google Scholar]
- Ten Brummeler, E. Full scale experience with the Biocel-process. In Proceedings of the 2nd International Symposium on Anaerobic Digestion of Solid Waste, Barcelona, Spain, 15–17 June 1999; Volume 1, pp. 308–314. [Google Scholar]
- Di Lonardo, M.C.; Lombardi, F.; Gavasci, R. Characterization of MBT plants input and outputs: A review. Rev. Environ. Sci. Bio/Technol. 2012, 11, 353–363. [Google Scholar] [CrossRef]
- Bardos, P. Composting of Mechanically Segregated Fractions of Municipal Solid Waste—A Review; SITA Environmental Trust Project; r3 Environmental Technology Limited: Hertfordshire, UK, 2004; Available online: http://www.compostinfo.info/content/SET%20Critical%20Review%20MSW%20Composting.pdf (accessed on 18 August 2019).
- Shiflett, G.R.; Trezek, G.J. Parameters governing refuse comminution. Resour. Recovery Conserv. 1979, 4, 31–42. [Google Scholar] [CrossRef]
- Trezek, G.J. Significance of Size Reduction in Solid Waste Management; U.S. Environmental Protection Agency: Cincinnati, OH, USA, 1977.
- Kratky, L.; Jirout, T. Biomass Size Reduction Machines for Enhancing Biogas Production. Chem. Eng. Technol. 2011, 34, 391–399. [Google Scholar] [CrossRef]
- Moiceanu, G.; Paraschiv, G.; Voicu, G.; Dinca, M.; Negoita, O.; Chitoiu, M.; Tudor, P. Energy Consumption at Size Reduction of Lignocellulose Biomass for Bioenergy. Sustainability 2019, 11, 2477. [Google Scholar] [CrossRef]
- Mani, S.; Tabil, L.G.; Sokhansanj, S. Grinding performance and physical properties of wheat and barley straws, corn stover and switchgrass. Biomass Bioenergy 2004, 27, 339–352. [Google Scholar] [CrossRef]
- Lornage, R.; Redon, E.; Lagier, T.; Hébé, I.; Carré, J. Performance of a low cost MBT prior to landfilling: Study of the biological treatment of size reduced MSW without mechanical sorting. Waste Manag. 2007, 27, 1755–1764. [Google Scholar] [CrossRef] [PubMed]
- Krause, M.J.; Chickering, G.W.; Townsend, T.G.; Pullammanappallil, P. Effects of temperature and particle size on the biochemical methane potential of municipal solid waste components. Waste Manag. 2018, 71, 25–30. [Google Scholar] [CrossRef] [PubMed]
- Zhao, S.; Liu, X.; Duo, L. Physical and chemical characterization of municipal solid waste compost in different particle size fractions. Pol. J. Environ. Stud. 2012, 21, 509–515. [Google Scholar]
- Lopez, R.; Hurtado, M.D.; Cabrera, F. Compost properties related to particle size. WIT Trans. Ecol. Environ. 2002, 56, 509–516. [Google Scholar]
- Hartmann, H.; Angelidaki, I.; Ahring, B.K. Increase of anaerobic degradation of particulate organic matter in full-scale biogas plants by mechanical maceration. Water Sci. Technol. 2000, 41, 145–153. [Google Scholar] [CrossRef]
- BSI. Publicly Available Specification 100: Specification for Composted Materials; British Standards Institution: London, UK, 2002; ISBN 0580405907. [Google Scholar]
- Environment Agency. Guidance on Monitoring MBT and Other Pre-Treatment Processes for the Landfill Allowances Schemes (England and Wales); Environment Agency: Bristol, UK, 2005.
- ETH. Milling and Analysis of Particles; ETH Swiss Federal Institute of Technology: Zurich, Switzerland, 2016; Available online: https://ethz.ch/content/dam/ethz/special-interest/mavt/process-engineering/particle-technology-laboratory-dam/documents/lectures/practica-fourth-semester/2016/Size-distribution_2016.pdf (accessed on 8 August 2019).
- Horiba Scientific. A Guidebook to Particle Size Analysis; Horiba Instruments: Irvine, CA, USA, 2017; Available online: https://www.horiba.com/fileadmin/uploads/Scientific/eMag/PSA/Guidebook/pdf/PSA_Guidebook.pdf (accessed on 8 August 2019).
- Cook, E.; Wagland, S.; Coulon, F. Investigation into the non-biological outputs of mechanical–biological treatment facilities. Waste Manag. 2015, 46, 212–226. [Google Scholar] [CrossRef]
- Yang, Y.; Heaven, S.; Venetsaneas, N.; Banks, C.J.; Bridgwater, A.V. Slow pyrolysis of organic fraction of municipal solid waste (OFMSW): Characterisation of products and screening of the aqueous liquid product for anaerobic digestion. Appl. Energy 2018, 213, 158–168. [Google Scholar] [CrossRef]
- Zhang, Y.; Banks, C.J.; Heaven, S. Anaerobic digestion of two biodegradable municipal waste streams. J. Environ. Manag. 2012, 104, 166–174. [Google Scholar] [CrossRef] [PubMed] [Green Version]
- Stentiford, E. Research, Monitoring and Evaluation of the Premier Waste Tower Composting System at Thornley, county Durham; DEFRA New Technologies Demonstrator Programme Project; Leeds University: Leeds, UK, 2010. [Google Scholar]
- Biffa Leicester. Composting Facility—Anaerobic Digester. Available online: http://biffaleicester.co.uk/about/composting-facility-anaerobic-digester/ (accessed on 16 August 2019).
- Yirong, C.; Zhang, W.; Heaven, S.; Banks, C.J. Influence of ammonia in the anaerobic digestion of food waste. J. Environ. Chem. Eng. 2017, 5, 5131–5142. [Google Scholar] [CrossRef] [Green Version]
- Serna-Maza, A.; Heaven, S.; Banks, C.J. Biogas stripping of ammonia from fresh digestate from a food waste digester. Bioresour. Technol. 2015, 190, 66–75. [Google Scholar] [CrossRef] [PubMed] [Green Version]
- McLeod, F.N.; Cherrett, T.J.; Waterson, B.J. The scope for joint household/commercial waste collections: A case study. Int. J. Logist. Res. Appl. 2011, 14, 399–411. [Google Scholar] [CrossRef]
- Yunus, A.; Smallman, D.J.; Stringfellow, A.; Beaven, R.; Powrie, W. Characterisation of the recalcitrant organic compounds in leachates formed during the anaerobic biodegradation of waste. Water Sci. Technol. 2011, 64, 311–319. [Google Scholar] [CrossRef]
- Goulson, D.; Hughes, W.O.; Chapman, J.W. Fly populations associated with landfill and composting sites used for household refuse disposal. Bull. Entomol. Res. 1999, 89, 493–498. [Google Scholar] [CrossRef] [Green Version]
- Veolia Environmental Services UK, Hampshire. Project Integra. Available online: https://www.veolia.co.uk/hampshire/waste-management/overview (accessed on 6 October 2019).
- Thomas, C. Public understanding and its effect on recycling performance in Hampshire and Milton Keynes. Resour. Conserv. Recycl. 2001, 32, 259–274. [Google Scholar] [CrossRef] [Green Version]
- Lisney, R. Project Integra: A Personal History by Robert Lisney; Hampshire County Council: Winchester, UK, 2003.
- Bull, R.; Petts, J.; Evans, J. Social learning from public engagement: Dreaming the impossible? J. Environ. Plan. Manag. 2008, 51, 701–716. [Google Scholar] [CrossRef]
- Vogt, G.M.; Liu, H.W.; Kennedy, K.J.; Vogt, H.S.; Holbein, B.E. Super blue box recycling (SUBBOR) enhanced two-stage anaerobic digestion process for recycling municipal solid waste: Laboratory pilot studies. Bioresour. Technol. 2002, 85, 291–299. [Google Scholar] [CrossRef]
- Arina, D.; Kalnacs, J.; Bendere, R.; Murasovs, A. Mechanical pre-treatment for separation of bio-waste from municipal solid waste: Case study of district in Latvia. In Proceedings of the Engineering for Rural Development Conference, Jelgava, Latvia, 22–24 May 2019; pp. 1599–1604. [Google Scholar]
- Ruf, J.A. Particle Size Spectrum and Compressibility of Raw and Shredded Municipal Solid Waste. Ph.D. Thesis, University of Florida, Gainesville, FL, USA, 1974. [Google Scholar]
- Nayono, S.E. Anaerobic Digestion of Organic Solid Waste for Energy Production; KIT Scientific Publishing: Karlsruhe, Germany, 2010. [Google Scholar]
Figure 1.
Particle size distribution in pre-treated MSW collected from two full-scale MBT plants, representing pre-treated waste destined to serve as input to the bioprocessing: (a) Hydraulically shredded MSW collected at Thornley waste transfer station, Durham and (b) ball mill processed MSW collected at Bursom recycling centre, Leicester.

Figure 2.
Particle size analysis on shredded waste from collection 1: (a) Trial 1a: Shear shredder with a 12 mm jaw opening; (b) Trial 1b: Shear shredder with a 25 mm jaw opening; (c) Trial 1c: Shear shredder with a 50 mm jaw opening and (d) Trial 1d: Commercial heavy-duty garden shredder (Viking).
Figure 2.
Particle size analysis on shredded waste from collection 1: (a) Trial 1a: Shear shredder with a 12 mm jaw opening; (b) Trial 1b: Shear shredder with a 25 mm jaw opening; (c) Trial 1c: Shear shredder with a 50 mm jaw opening and (d) Trial 1d: Commercial heavy-duty garden shredder (Viking).

Figure 3.
Particle size analysis on shredded waste from collection 2: (a) Trial 2a: Shear shredder with a 12 mm jaw opening; (b) Trial 2b: Shear shredder with a 25 mm jaw opening; (c) Trial 2c: Commercial heavy-duty garden shredder (Viking) and (d) Trial 2d: Light-duty garden shredder (Alko-Kober).
Figure 3.
Particle size analysis on shredded waste from collection 2: (a) Trial 2a: Shear shredder with a 12 mm jaw opening; (b) Trial 2b: Shear shredder with a 25 mm jaw opening; (c) Trial 2c: Commercial heavy-duty garden shredder (Viking) and (d) Trial 2d: Light-duty garden shredder (Alko-Kober).

Figure 4.
Particle size analysis on shredded waste using a commercial four-shaft shear shredder (Untha Ltd.) with a 50 mm reject screen: (a) Trial 3 (waste from collection round 3); (b) Trial 4 (collection round 4); (c) Trial 5a (collection round 5) and (d) Trial 5b: Double shredding of waste from collection round 5.

Figure 5.
Particle size analysis on shredded waste using a commercial four-shaft shear shredder (Untha Ltd.) with an 80 mm reject screen: (a) Trial 6a (waste from collection round 6); (b) Trial 6b: Double shredding of waste from collection round 6; (c) Trial 7a (waste from collection round 7); (d) Trial 7b: Triple shredding of waste from collection round 7; (e) Trial 8a (waste from collection round 8) and (f) Trial 8b: Triple shredding of waste from collection round 8.

Figure 6.
Particle size analysis on shredded waste after using in series a commercial four-shaft shear shredder (Untha Ltd.) and a garden shredder (Alko-Kober): (a) Trial 9a (Untha-shredded waste from collection round 9); (b) Trial 9b (Untha-shredded plus Alko-Kober-shredded); (c) Trial 10b (repetition to Trial 9a); (d) Trial 10c (repetition to Trial 9b); (e) Trial 11b (repetition to Trial 9a); (f) Trial 11c (repetition to Trial 9b); (g) Trial 12b (repetition to Trial 9a); and (h) Trial 12c (repetition to Trial 9b).

Figure 7.
Particle size distribution of wet processed waste and volatile solids content of each particle size fraction.
Figure 7.
Particle size distribution of wet processed waste and volatile solids content of each particle size fraction.


Table 1.
Collection details and rejection rates for residual municipal solid waste (MSW) after secondary sorting.
Table 1.
Collection details and rejection rates for residual municipal solid waste (MSW) after secondary sorting.
| Collection Round 1 | Month of Collection | Net Weight MSW Discharged from RCV (tonne) | Net Weight of Sample Taken for Experiments (kg) | Waste Source | Waste Type | Water Content (%) 2 | Rejected Proportion after Laboratory Sorting (%) |
|---|---|---|---|---|---|---|---|
| 1 | November | 6640 | ca. 400 | Winchester | Household | 46.9 | 18.7 |
| 2 | January | 4940 | ca. 400 | Winchester | Household | 69.6 | 21.0 |
| 3 | February | 5660 | ca. 400 | Winchester | Household | 55.9 | 31.9 |
| 4 | March | n/a | ca. 400 | Winchester | Household | 52.5 | 30.7 |
| 5 | April | n/a | ca. 400 | Winchester | Household | 60.3 | 27.6 |
| 6 | July | 7100 | ca. 400 | Winchester | Household | 43.4 | 45.1 |
| 7 | August | 6880 | ca. 400 | Winchester | Household | 52.3 | 36.2 |
| 8 | September | 6840 | ca. 400 | Winchester | Household | 63.5 | 39.0 |
| 9 | November | 6460 | ca. 400 | Winchester | Household | n/a | 25.6 |
| 10 | December | 8960 | ca. 400 | Winchester | Household | n/a | 24.7 |
| 11 | January | 10,200 | ca. 400 | Winchester | Household | n/a | 33.5 |
| 12 | February | 8880 | ca. 400 | Winchester | Household | n/a | 37.1 |
1 One collection round per month (sampling was generally done in consecutive months, while during 4 single months no collection could be performed, i.e., the collections span a total period of 16 months). 2 Variations in water content do not necessarily reflect seasonal effects but rather weather conditions such as rain during collection and preparation for experiments. No values are reported for the last collections, where water content was determined only after laboratory sorting, and data therefore might not be comparable.
Table 2.
Shredders used for processing each batch in the particle size reduction trials.
| Trial 1 | Type of Shredder | Operator | PSD Analysis |
|---|---|---|---|
| Group A of trials: Basic assessment of different types of shredding equipment and identification of favourable range of jaw opening for shear shredders | |||
| 1a | Shear shredder with 12 mm jaw opening | Greenfinch Ltd. | Figure 2a |
| 1b | Shear shredder with 25 mm jaw opening | Greenfinch Ltd. | Figure 2b |
| 1c | Shear shredder with 50 mm jaw opening | Greenfinch Ltd. | Figure 2c |
| 1d | Heavy-duty garden shredder (Viking) | Greenfinch Ltd. | Figure 2d |
| 2a | Shear shredder with 12 mm jaw opening | Greenfinch Ltd. | Figure 3a |
| 2b | Shear shredder with 25 mm jaw opening | Greenfinch Ltd. | Figure 3b |
| 2c | Heavy-duty garden shredder (Viking) | Greenfinch Ltd. | Figure 3c |
| 2d | Light-duty garden shredder (Alko-Kober) | Univ. Southampton | Figure 3d |
| Group B of trials: Application of a commercial shear shredder (Untha with a 20 mm jaw spacing, equipped with an adjustable rejection screen to recycle material through the shredder until it passes) | |||
| 3 | Commercial shear shredder Untha with a 50 mm reject screen | Greenfinch Ltd. | Figure 4a |
| 4 | Untha with a 50 mm reject screen | Greenfinch Ltd. | Figure 4b |
| 5a | Untha with a 50 mm reject screen | Greenfinch Ltd. | Figure 4c |
| 5b | Double processing through Untha with a 50 mm reject screen | Greenfinch Ltd. | Figure 4d |
| 6a | Untha with an 80 mm reject screen | Greenfinch Ltd. | Figure 5a |
| 6b | Double processing through Untha with an 80 mm reject screen | Greenfinch Ltd. | Figure 5b |
| 7a | Untha with an 80 mm reject screen | Greenfinch Ltd. | Figure 5c |
| 7b | Triple processing through Untha with an 80 mm reject screen | Greenfinch Ltd. | Figure 5d |
| 8a | Untha with an 80 mm reject screen | Greenfinch Ltd. | Figure 5e |
| 8b | Triple processing through Untha with an 80 mm reject screen | Greenfinch Ltd. | Figure 5f |
| Group C of trials: Advanced processing combining the commercial Untha shredder (20 mm jaw spacing, adjustable rejection screen) with the light-duty garden shredder to further reduce the share of large particles | |||
| 9a | Double processing through Untha (20 mm jaw spacing) with an 80 mm reject screen | Greenfinch Ltd. | Figure 6a |
| 9b | Further processing of the >20 mm fraction of double processed waste from Untha (80 mm reject screen), obtained in Trial 9a, using the light-duty garden shredder (Alko-Kober) | Univ. of Southampton | Figure 6b |
| 10a | Untha 20 mm jaw spacing) with an 80 mm reject screen | Greenfinch Ltd. | Figure A4a |
| 10b | Double processing through Untha (20 mm jaw spacing) with an 80 mm reject screen | Greenfinch Ltd. | Figure 6c |
| 10c | Further processing of the >20 mm fraction of double processed waste from Untha (80 mm reject screen), obtained with Trial 10b, using the light-duty garden shredder (Alko-Kober) | Univ. of Southampton | Figure 6d |
| 11a | Untha with an 80 mm reject screen | Greenfinch Ltd. | Figure A4b |
| 11b | Double processing through Untha with an 80 mm reject screen | Greenfinch Ltd. | Figure 6e |
| 11c | Further processing of the >20 mm fraction of double processed waste from Untha (80 mm reject screen), obtained with Trial 11b, using the light-duty garden shredder (Alko-Kober) | Univ. of Southampton | Figure 6f |
| 12a | Untha with an 80 mm reject screen | Greenfinch Ltd. | Figure A4c |
| 12b | Double processing through Untha with an 80 mm reject screen | Greenfinch Ltd. | Figure 6g |
| 12c | Further processing of the >20 mm fraction of double processed waste from Untha (80 mm reject screen), obtained with Trial 12b, using the light-duty garden shredder (Alko-Kober) | Univ. of Southampton | Figure 6h |
1 The number indicates the MSW collection round specified in Table 1, i.e., trials with the same number used material from the same collection round (e.g., Trials 1a, 1b, 1c and 1d used material from collection round 1).
Table 3.
Proportions of organic matter and physical contaminants present in pre-treated waste at two full-scale mechanical–biological treatment (MBT) plants, representing material destined to serve as feed to the bioprocessing step (% of whole sample).
Table 3.
Proportions of organic matter and physical contaminants present in pre-treated waste at two full-scale mechanical–biological treatment (MBT) plants, representing material destined to serve as feed to the bioprocessing step (% of whole sample).
| Fractions | Proportion Accountable to Each Fraction (% w/w) | |
|---|---|---|
| Hydraulically Shredded Waste (Thornley Waste Transfer Station) | Ball Mill Processed Waste (Bursom Recycling Centre) | |
| Organic fraction and fines | 59.9 | 91.97 |
| Physical contaminants | ||
| Plastic | 18.0 | 4.34 |
| Metal | 5.3 | 0.16 |
| Glass | 4.7 | 3.08 |
| Non-combustibles | 12.2 | 0.46 |
Table 4.
Summary of results from trials using the commercial Untha shredder, showing average values (mean and standard deviation) from trials with the same processing (n: number of trials).
Table 4.
Summary of results from trials using the commercial Untha shredder, showing average values (mean and standard deviation) from trials with the same processing (n: number of trials).
| Processing | n | Proportion of Fractions (% w/w) | Mean Particle Size (mm) 1 | ||||
|---|---|---|---|---|---|---|---|
| <5 mm | 5–6.7 mm | 6.7–10 mm | 10–20 mm | >20 mm | |||
| (A) Mean values of trials using single processing (waste passed through equipment once) | |||||||
| Untha with 50 mm reject screen | 3 | 3.6 ± 1.3 | 9.3 ± 2.2 | 29.2 ± 3.6 | 44.1 ± 1.2 | 13.4 ± 0.9 | 13.7 ± 0.3 |
| Untha with 80 mm reject screen | 6 | 4.3 ± 2.4 | 8.9 ± 2.7 | 24.8 ± 5.1 | 32.4 ± 4.3 | 29.7 ± 6.9 | 16.7 ± 1.6 |
| (B) Mean values of trials using multiple processing in series (double or triple shredding) | |||||||
| Untha, 50 mm reject, double shredding | 1 | 6.1 ± n/a | 8.3 ± n/a | 37.3 ± n/a | 43.6 ± n/a | 4.7 ± n/a | 11.6 ± n/a |
| Untha, 80 mm reject, double shredding | 5 | 5.5 ± 2.1 | 12.0 ± 3.0 | 32.2 ± 6.0 | 34.5 ± 6.6 | 15.8 ± 4.1 | 13.4 ± 1.1 |
| Untha, 80 mm reject, triple shredding | 2 | 2.3 ± 1.1 | 6.1 ± 0.9 | 30.8 ± 1.2 | 48.5 ± 4.0 | 12.4 ± 4.8 | 13.8 ± 0.8 |
| Untha, 80 mm reject, double shredding + Alko-Kober shredding | 4 | 7.5 ± 0.5 | 15.7 ± 2.0 | 38.6 ± 2.9 | 38.2 ± 4.3 | 0.0 | 10.1 ± 0.3 |
© 2019 by the authors. Licensee MDPI, Basel, Switzerland. This article is an open access article distributed under the terms and conditions of the Creative Commons Attribution (CC BY) license (http://creativecommons.org/licenses/by/4.0/).
Share and Cite
MDPI and ACS Style
Zhang, Y.; Kusch-Brandt, S.; Gu, S.; Heaven, S. Particle Size Distribution in Municipal Solid Waste Pre-Treated for Bioprocessing. Resources 2019, 8, 166. https://0-doi-org.brum.beds.ac.uk/10.3390/resources8040166
AMA Style
Zhang Y, Kusch-Brandt S, Gu S, Heaven S. Particle Size Distribution in Municipal Solid Waste Pre-Treated for Bioprocessing. Resources. 2019; 8(4):166. https://0-doi-org.brum.beds.ac.uk/10.3390/resources8040166
Chicago/Turabian StyleZhang, Yue, Sigrid Kusch-Brandt, Shiyan Gu, and Sonia Heaven. 2019. "Particle Size Distribution in Municipal Solid Waste Pre-Treated for Bioprocessing" Resources 8, no. 4: 166. https://0-doi-org.brum.beds.ac.uk/10.3390/resources8040166
Note that from the first issue of 2016, this journal uses article numbers instead of page numbers. See further details here.