Article

Assessment of Household Solid Waste Generation and Composition by Building Type in Da Nang, Vietnam

1
Institute of Energy Economics and Rational Energy Use (IER), University of Stuttgart, 70565 Stuttgart, Germany
2
Institute of Geography, University of Tübingen, 72070 Tübingen, Germany
3
Da Nang Institute for Socio-Economic Development, Da Nang City 550000, Vietnam
4
German Aerospace Center (DLR), Earth Observation Center, 82234 Wessling, Germany
*
Author to whom correspondence should be addressed.
Submission received: 30 September 2019 / Revised: 29 October 2019 / Accepted: 30 October 2019 / Published: 5 November 2019
(This article belongs to the Special Issue Underutilised Resources in Urban Environments)

Abstract

:
This study assesses the quantity and composition of household solid waste (HSW) in the City of Da Nang and proposes a transparent and standardised method for its assessment through a combination of very-high-resolution (VHR) satellite imagery, field surveys, questionnaires, and solid waste measurements on the ground. This was carried out in order to identify underutilised resources and to obtain discrete planning values at city level. The procedure proved to be a suitable method for reliable data gathering. To describe HSW generation, 818 valid datasets, subdivided into five building types, and their location were used. The average HSW generation rate was 297 g per capita per day. Within a total of 19 subcategories, organic waste had a share of 62.9%. The specific generation and composition of HSW correlates positively with both the building type and the spatial location within the city. The most HSW (509 g per capita per day), by far, was generated in the ‘villa-type’ building while in the ‘basic-type’ building, this was the least (167 g per capita per day). Taking into account the number of individual buildings, the total HSW generation in Da Nang in 2015 was estimated between 109,844 and 164,455 tonnes per year, which corresponds to about one-third to one-half of the total municipal solid waste.

1. Introduction

Population growth and migration, as well as socioeconomic developments, cause rapid changes in the extent and morphology of urban agglomerations in emerging countries in the Global South [1]. For decision makers and entrepreneurs of the housing sector, spatial and infrastructure planning, municipal revenue collection, and the supply of services it important to have up-to-date information on the qualitative and quantitative characteristics of settlements and their population. Urban growth and social changes also come with environmental challenges. Sustainable urbanisation and reducing the environmental impact of the cities are of paramount global importance and part of the United Nations’ Sustainable Development Goals (SDG target 11.6). The efficient use of natural resources and their sustainable management (SDG target 12.2), especially an environmentally sound waste management (SDG target 12.4), are some of the challenges which we face in today’s globally interlinked consumer society. Next to the depletion of dwindling resources worldwide, the generation of waste has a huge environmental, economic, and social impact. Formal and informal waste disposal and dumping lead to greenhouse gas (GHG) emissions, wastewater leakage, smell nuisance, and microplastics in air and water. However, Gutberlet [2] not only names challenges but also opportunities for city planners, administration, and residents regarding waste. For example, instead of informal waste pickers reclaiming recyclables, a working recycling system would create jobs plus improve health and environmental conditions.
One a global scale, the waste sector is one of the top five sources of GHG emissions, while accounting for about 3.1% with 1.5 gigatonnes of carbon dioxide equivalents (CO2 eq) in 2014 [3]. For 2014, the share is even 3.7% with 9.3 million tonnes CO2 eq in Vietnam, with absolute emissions increasing but the relative share is decreasing as the influence of the energy sector increases disproportionately [3]. In particular, landfills emit methane gas due to anaerobic decay of organic matter, which is about 28 times as climate-damaging as carbon dioxide [4]. Especially in cities, the consumption of environmental goods and services is comparably high. In general, convenience and shopping goods, heavily packaged food and drinks, consumables, and durables exceed the natural limits. Formal and informal waste dumping was the solution in the past. As long as authorities have no effective strategy for implementing sustainable solutions, the environmental impact of urban growth remains. This is the case in many developing and emerging countries. However, some cities serve as a showpiece: Singapore managed to cut down landfill waste to 2%, recycle 58%, and use 40% for energy generation [5]. Thus, UN-Habitat stated that improved solid waste disposal improves quality of life and, therefore, increases the prosperity and environmental sustainability of cities [5]. These are all important reasons to enforce the concept of reduce, reuse, and recycle (the 3Rs) and aspire to a sound solid waste management. Cutting down waste and especially organic waste to landfills is one of the most important issues. In order to be able to implement this initiative, a detailed insight into the composition and amount of solid waste generation is necessary. In principle, there are three sources or, rather, sectors of solid waste generation: industry, commercial and public institutions, and households. Even if the latter do not generate the largest amount of solid waste, they are definitely the group with the most participants. Private households also do not have a lot of knowledge on the amount and composition of their own waste. Accordingly, in this sector, there is a large need for expedient and reliable data, and also a large effort toward implementing the 3Rs.
Worldwide, there are numerous studies and models on the generation and composition of solid waste, as can be seen, for example, in literature reviews by Beigl et al. [6] or Kolekar et al. [7]. By far, the majority only refer to the municipal level, and not household. Solid waste of public and commerce is thereby at least partly included in these studies, but should be considered separately. In this respect, the analysis of waste generation in shophouses is particularly important. Shophouses are quite common in Southeast Asia and especially in Vietnam. This term results from the combination of a characteristic shop or other public use at the street level and residential accommodation in the floors above. However, new shophouses with a completely residential usage also have the same architectural type due to local traditions. The waste of single-use or combined-use shophouses is, in general, collected in a bag or a bin and then placed on the kerbside close to the building, where it is usually collected daily due to climate conditions. From this point, it is impossible to determine the origin of the waste and thus obtain a value for the specific waste generation in the respective household. Thus, most studies focus on a larger regional scale and refer to district, settlement, or even country perspective. In our work, however, we want to look at household solid waste (HSW) separately from any other solid waste and examine whether there are differences in waste quantity and composition on the smallest possible scale.
Da Nang, as the centre of economic development in Central Vietnam, has a dynamic population development, even though the annual population growth has slowed down in recent years from 3.15% in 2010 to an expected growth in 2018 of 1.57% [8]. A total of 1,080,744 people lived in Da Nang during 2018. Yet, the number of people within the city and their socioeconomic status and respective consumption patterns are unequally distributed. Satellite remote sensing techniques and earth observation-based methods have been successfully used to ascertain the aforementioned parameters. The allocation of population derived from census data over a study area is largely supported by remote sensing-based settlement maps. On a global scale, the population is disaggregated by areal-weighting methods or by dasymetric mapping approaches. The resulting gridded population datasets that are the current state of the art include the Rural-Urban Mapping Project (GRUMP) [9], the Gridded Population of the World, Version 4 (GPWv4) [10], LandScan Global Population database [11], the Global Human Settlement Layer-Population grid (GHS-POP) [12,13], WorldPop [14,15], and the World Settlement Footprint Population dataset [16]. These products have been used as an essential input for cross-disciplinary mapping applications like epidemiological modelling [17,18,19], poverty mapping [20], deriving population estimates [19], and disaster management [21,22] among others. The high-resolution settlement layer (HRSL) population grid is produced with very-high-resolution (VHR) satellite images in order to identify single buildings. The final product is downscaled and provided with 30 m resolution [23]. Grippa et al. [24] improved a population distribution based on medium-resolution images by training a model with land-use information derived from VHR images. The improved model resulted in a 100 × 100 m grid.
The relatively low spatial resolution of the datasets mentioned above (10 m to 1 km) reduces the usefulness for intra-urban applications. The use of VHR satellite imagery is therefore preferred on a local scale. By identifying single buildings and additional information, such as roof type, occupancy rates, or statistics on its inhabitants, population numbers can be estimated when statistics from census data or field surveys are available [25,26,27]. Besides the building footprint information, height information can also be derived from stereoscopic satellite image acquisitions or LiDAR campaigns and can improve the disaggregation of the population [28,29,30]. A further refinement of the built-up information can be provided by the identification of different building types [31,32,33,34]. Building types and the associated characteristics emerging in urban structure types (USTs) in different parts of cities can also be utilised as proxies for the estimation of socioeconomic parameters, as well as for the demand of supply services and the consumption of goods. Tusting et al. [35] analysed 51 national censuses in sub-Saharan Africa and found correlations between housing type and socioeconomic factors. Jones & Lomas [36] found relations between dwelling types, socioeconomic parameters, and electricity consumption. Yet, the use of remote sensing is focusing on the identification of both existing and new waste disposal sites [37]. Anilkumar & Chithra [38] found that household size and income are related to the estimation of solid waste generation, but also factors like housing types, floor area, and the lifestyle of the household. The lifestyle or socioeconomic status was identified in multiple studies as one of the main parameters that explains the generation of solid waste [39,40,41,42]. Trang et al. [43] found a strong correlation between socioeconomic characteristics and solid waste generation and composition for Thu Dau Mot, Vietnam.
This study aims to assess the amount of urban household solid waste (HSW) by empirical terrestrial data collection and geospatial mapping techniques. It is based on the hypothesis that there is a relationship between waste generation patterns and building typology, which represents the socioeconomic conditions of their inhabitants. This, in turn, directly affects their way of life and the corresponding waste generation patterns. By assessing building types and their spatial distribution in Da Nang and linking them to information gathered in field surveys, a reliable estimation of the quantity and composition of HSW at the city scale is possible. This leads to a more sustainable management of waste utilisation and a more effective disposal infrastructure.

2. Materials and Methods
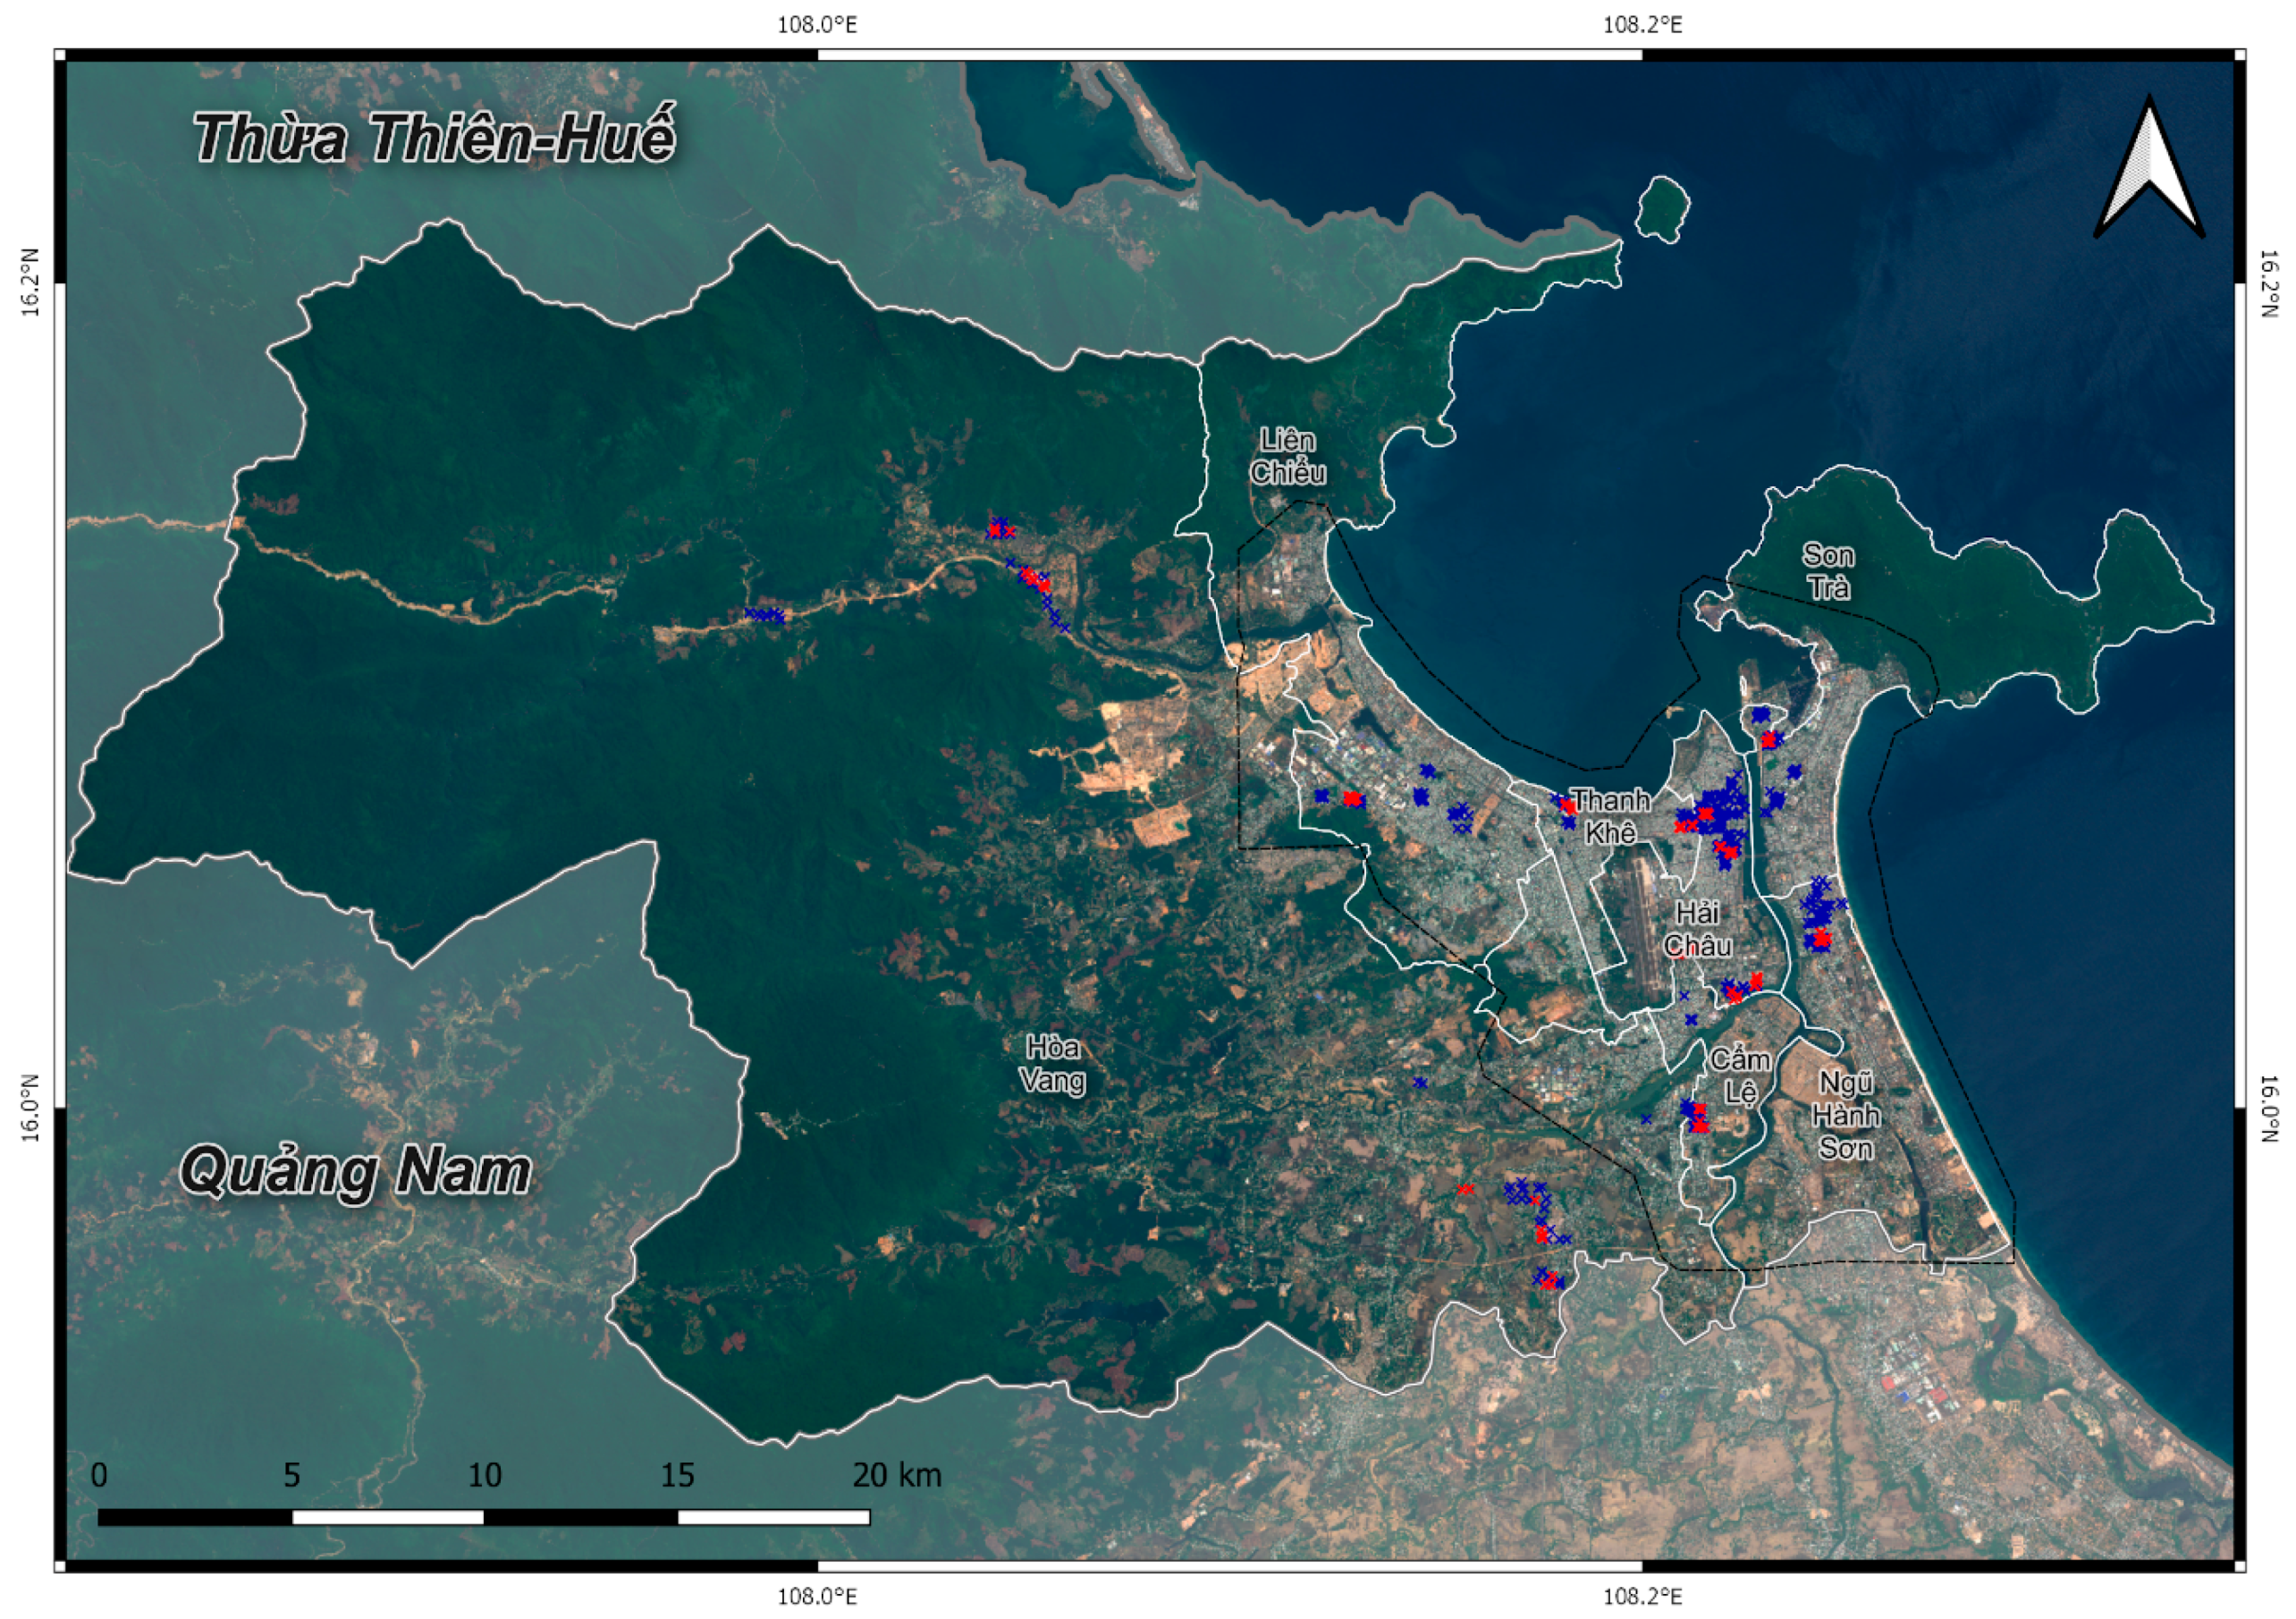
2.1. Study Area

Da Nang is situated on the coast of the Eastern Sea and is the largest city in central Vietnam. According to the preliminary results of the Vietnam population and housing census for 2019 [8], the average household size of Vietnam is 3.5 persons, which is 0.3 persons lower than the result of the 2009 census [8]. For the North Central and Central Coastal Areas, the household size is 3.6 persons. The annual population growth rate of Da Nang was 1.9% in 2015 and is expected to be 1.57% in 2018, and the total population was 1,026,800 in 2015 and is expected to be 1,080,744 in 2018 (see Table 1) [44].
The most densely populated district of Da Nang is Thanh Khê, and the most densely built-up areas are concentrated in Thanh Khê and Hải Châu, as well as generally at the coast. In the recent decades, a rapid sprawl into the fringes of the city is documented [45]. At the southeastern coastline in the direction toward Hội An, a high-class living and touristic development is emerging. The growth of the city is constrained by the inner-city airport, the coast in the east and southeast, as well as the topography in the north and northwest.
So far, all solid waste collected in Da Nang has ended up at Khánh Sơn landfill in the Liên Chiểu District at some point. It has been operated by the Da Nang Urban Environment Company (URENCO) since 2007. With 3.2 million tonnes already, it is growing by 1100 tonnes per day [46]. The limit of the landfill is to be reached soon, and an alternative solution has to be found. Besides, some of its infrastructure does not meet hygiene requirements—for instance, degraded ancillary items—and the distance from the landfill’s fences to the nearest residential areas is about 200 m, which is not sufficient as stipulated in the Vietnamese Code QCVN 07:2010/BXD (≥1.000 m), to prevent smells and pollution [47]. Thus, city authorities want to turn it into a solid waste treatment complex where an incineration plant is to be built to generate energy and simultaneously free up capacity at the landfill [46].
Table 2 illustrates the generation of municipal solid waste (MSW) in Da Nang by district and between 2011 and 2015. The Da Nang People’s Committee speaks of ‘domestic’ waste, which can be understood as a synonym meaning the solid waste of households, buildings, and public places [48]. This is in line with our definition of MSW according to Kolekar et al. [7] and several researchers before, where household, commercial, institutional, street sweeping, construction and demolition, and sanitation waste is included. The table shows that the amount of collected domestic waste in the urban and suburban areas of Da Nang increased between 2011 and 2015, with the strongest increase in the districts of Thanh Khê and Hải Châu. While the rate of waste collection in urban areas reached 76%, it was 66% in suburban areas [48]. In the suburban area (Hòa Vang & Hoàng Sa), a part of domestic waste is treated by burning or burying by the residents.
Currently, Da Nang has not established a synchronised program of waste segregation across the city. Since the people have been increasingly aware of the value of waste, there are some pilot projects to separate solid wastes at households in several communities. Those projects have been mostly carried out by the city’s Women Union since 2011, and by some People’s Committees at district level during the period of 2017–2018 [47].

2.2. Spatial Analysis of Housing and Building Structures

2.2.1. Survey on Data for Generating a Building Typology

Information on building types was collected during three field surveys in March 2015, March 2016, and December 2016. The main aim was to develop a building typology and to define precise criteria for the different building types. This should allow for identification of the building types by satellite images (Section 2.2.3). Using specifically developed digital questionnaires prepared with the OpenDataKit (ODK, [49]), a total number of 975 records on buildings was collected in all parts of the city containing information on the type, usage, height, neighbourhood, maintenance, and construction materials of the buildings (Figure 1, blue marks). Besides the mentioned information, each record contained two pictures and the GPS coordinates of the respective building. The building typology and the definitions used for the identification of the buildings are shown in Table 3. They served as the base information for the later city-wide identification of buildings.

2.2.2. Data Sources for Generating a Building Typology

To estimate building distribution on the level of the entire city, two satellite image acquisitions were utilised: a VHR tri-stereoscopic image of Pléiades acquired on 24 October 2015 with a spatial resolution of 0.5 m covering large parts of the urban area (Figure 1, black dashed line) and a high-resolution (HR) scene from RapidEye acquired on 2 April 2015 of the entire administrative area with a spatial resolution of 5 m (Figure 1). Both sensors acquire images in the visible (red, green, and blue) and in the infrared spectrum, and the HR scene provides an additional red edge channel [50]. As further data sources, polygons defining land use as envisaged by the master plan developed by the City of Da Nang [51] were provided by the Urban Planning Institute (UPI) of Da Nang, as well as cadastral plot boundaries for parts of the districts of Cẩm Lệ, Hải Châu, Liên Chiểu, Ngũ Hành Sơn, Sơn Trà, and Thanh Khê.

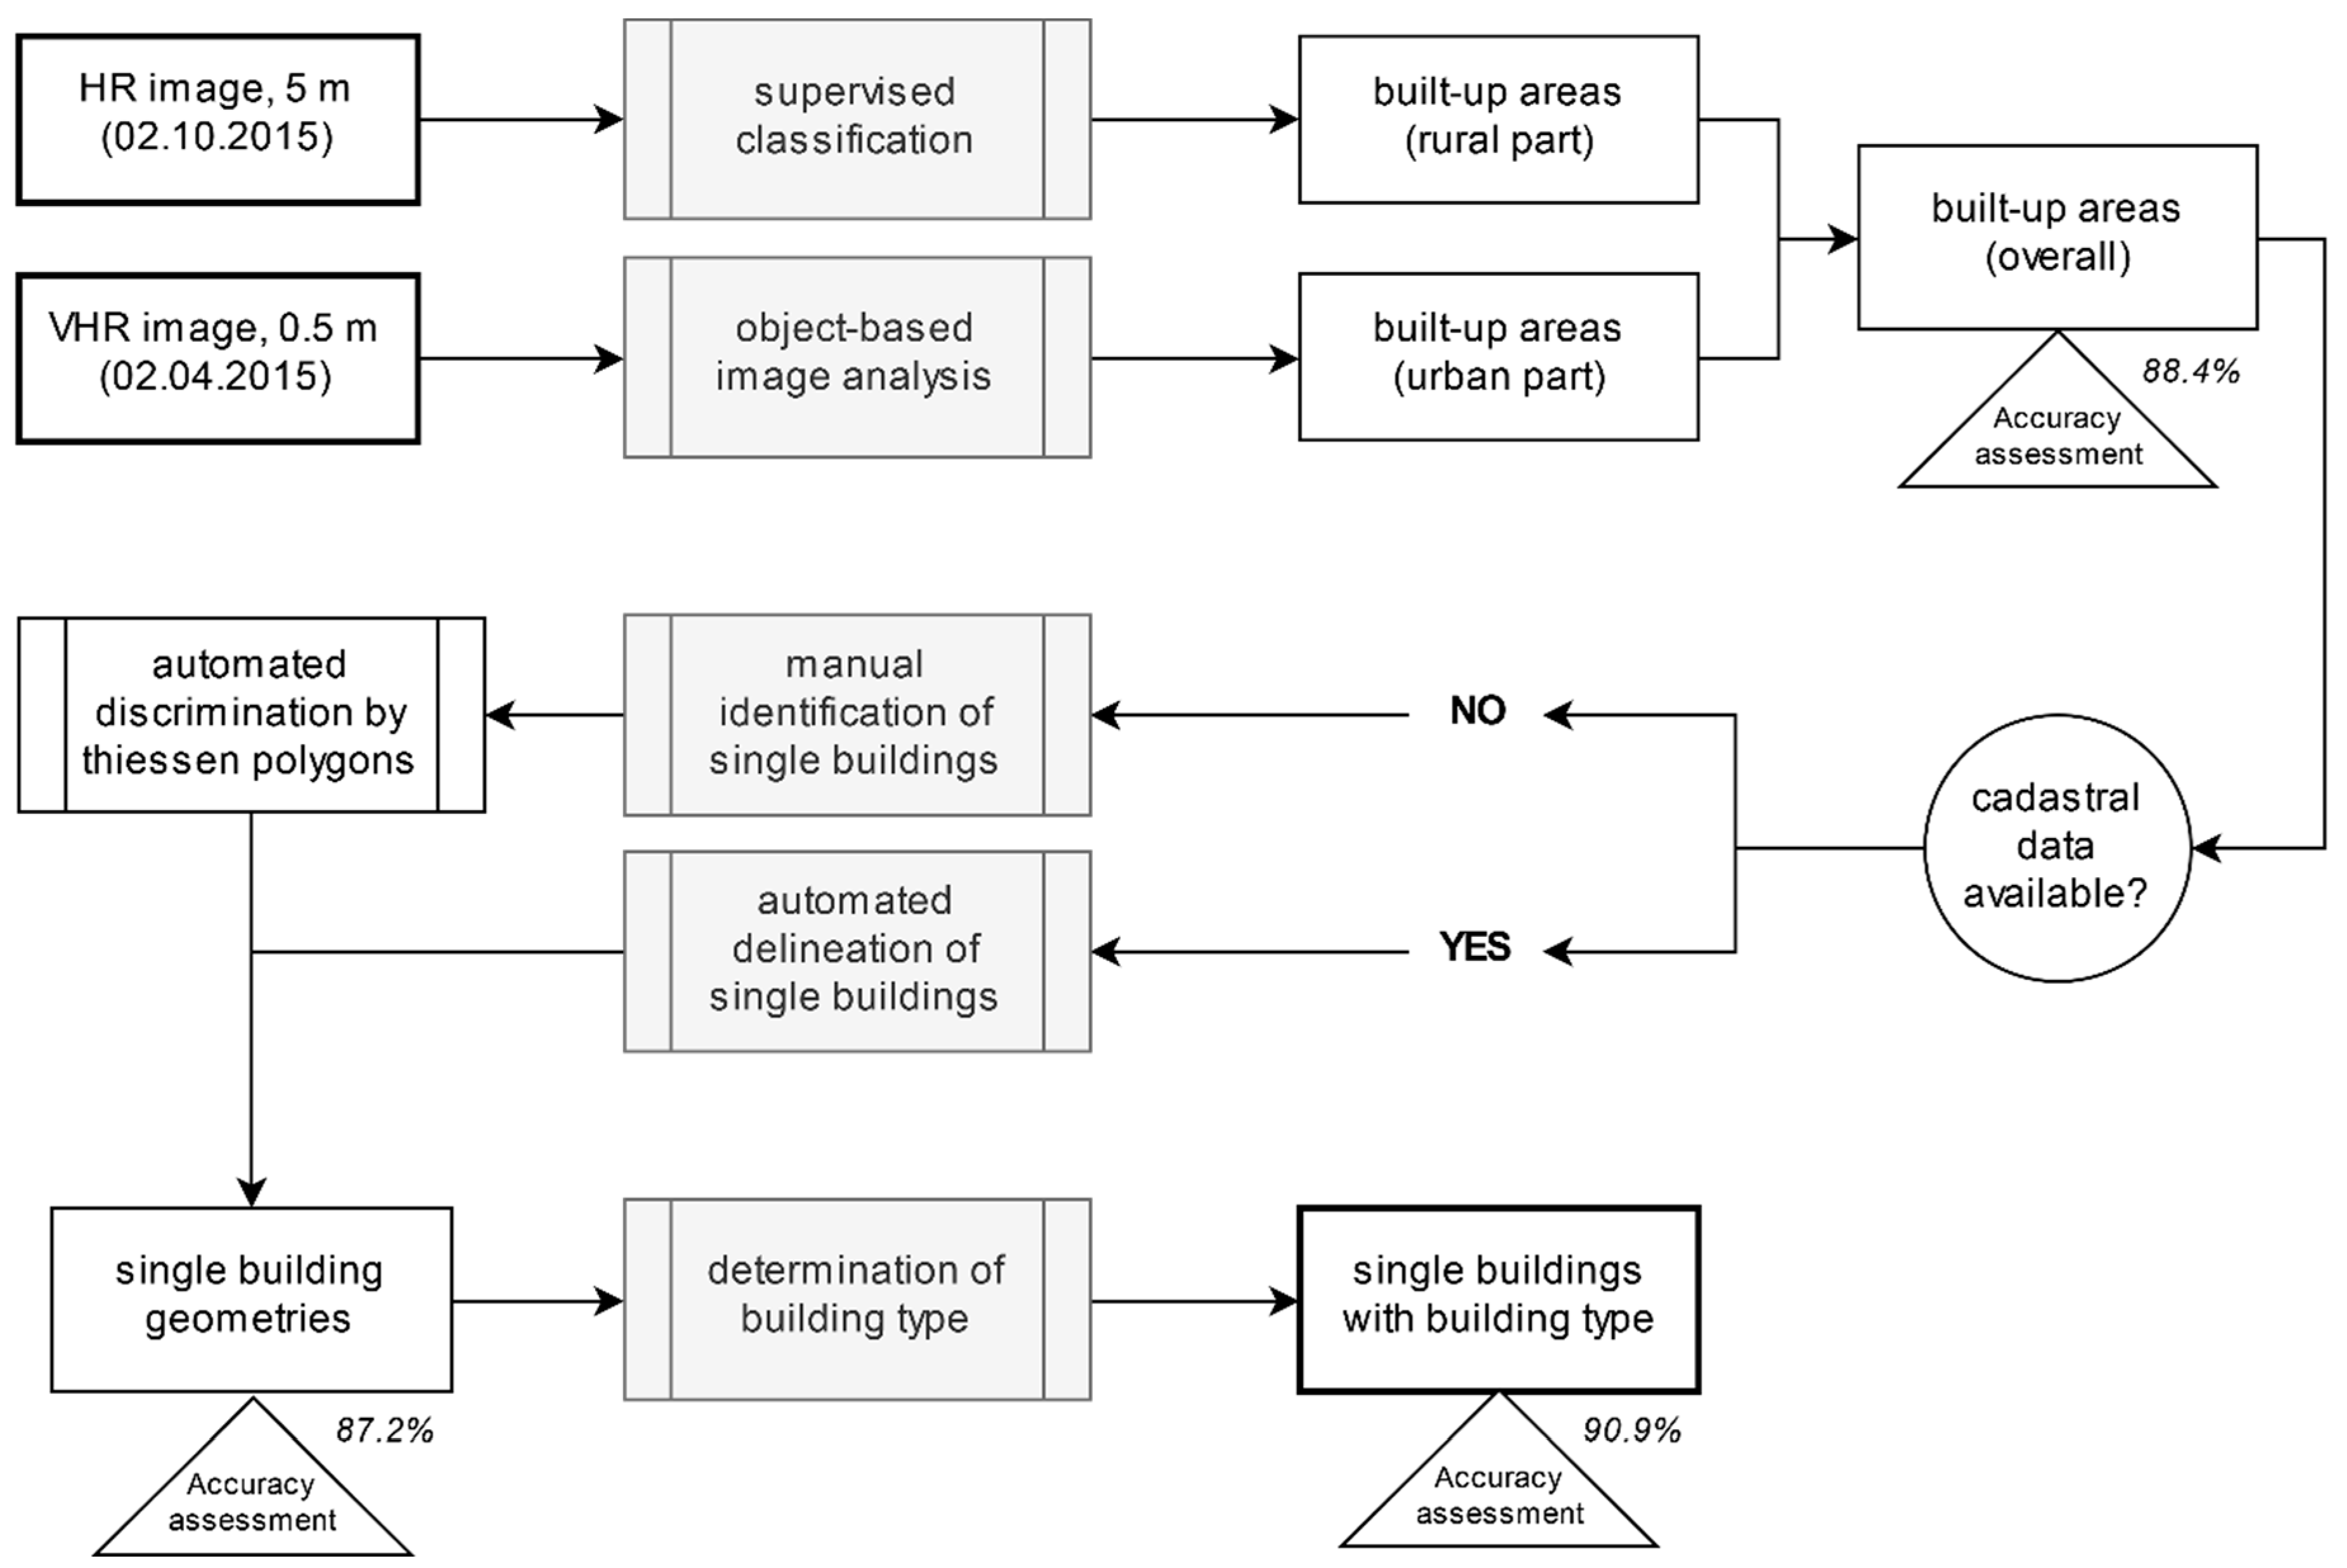
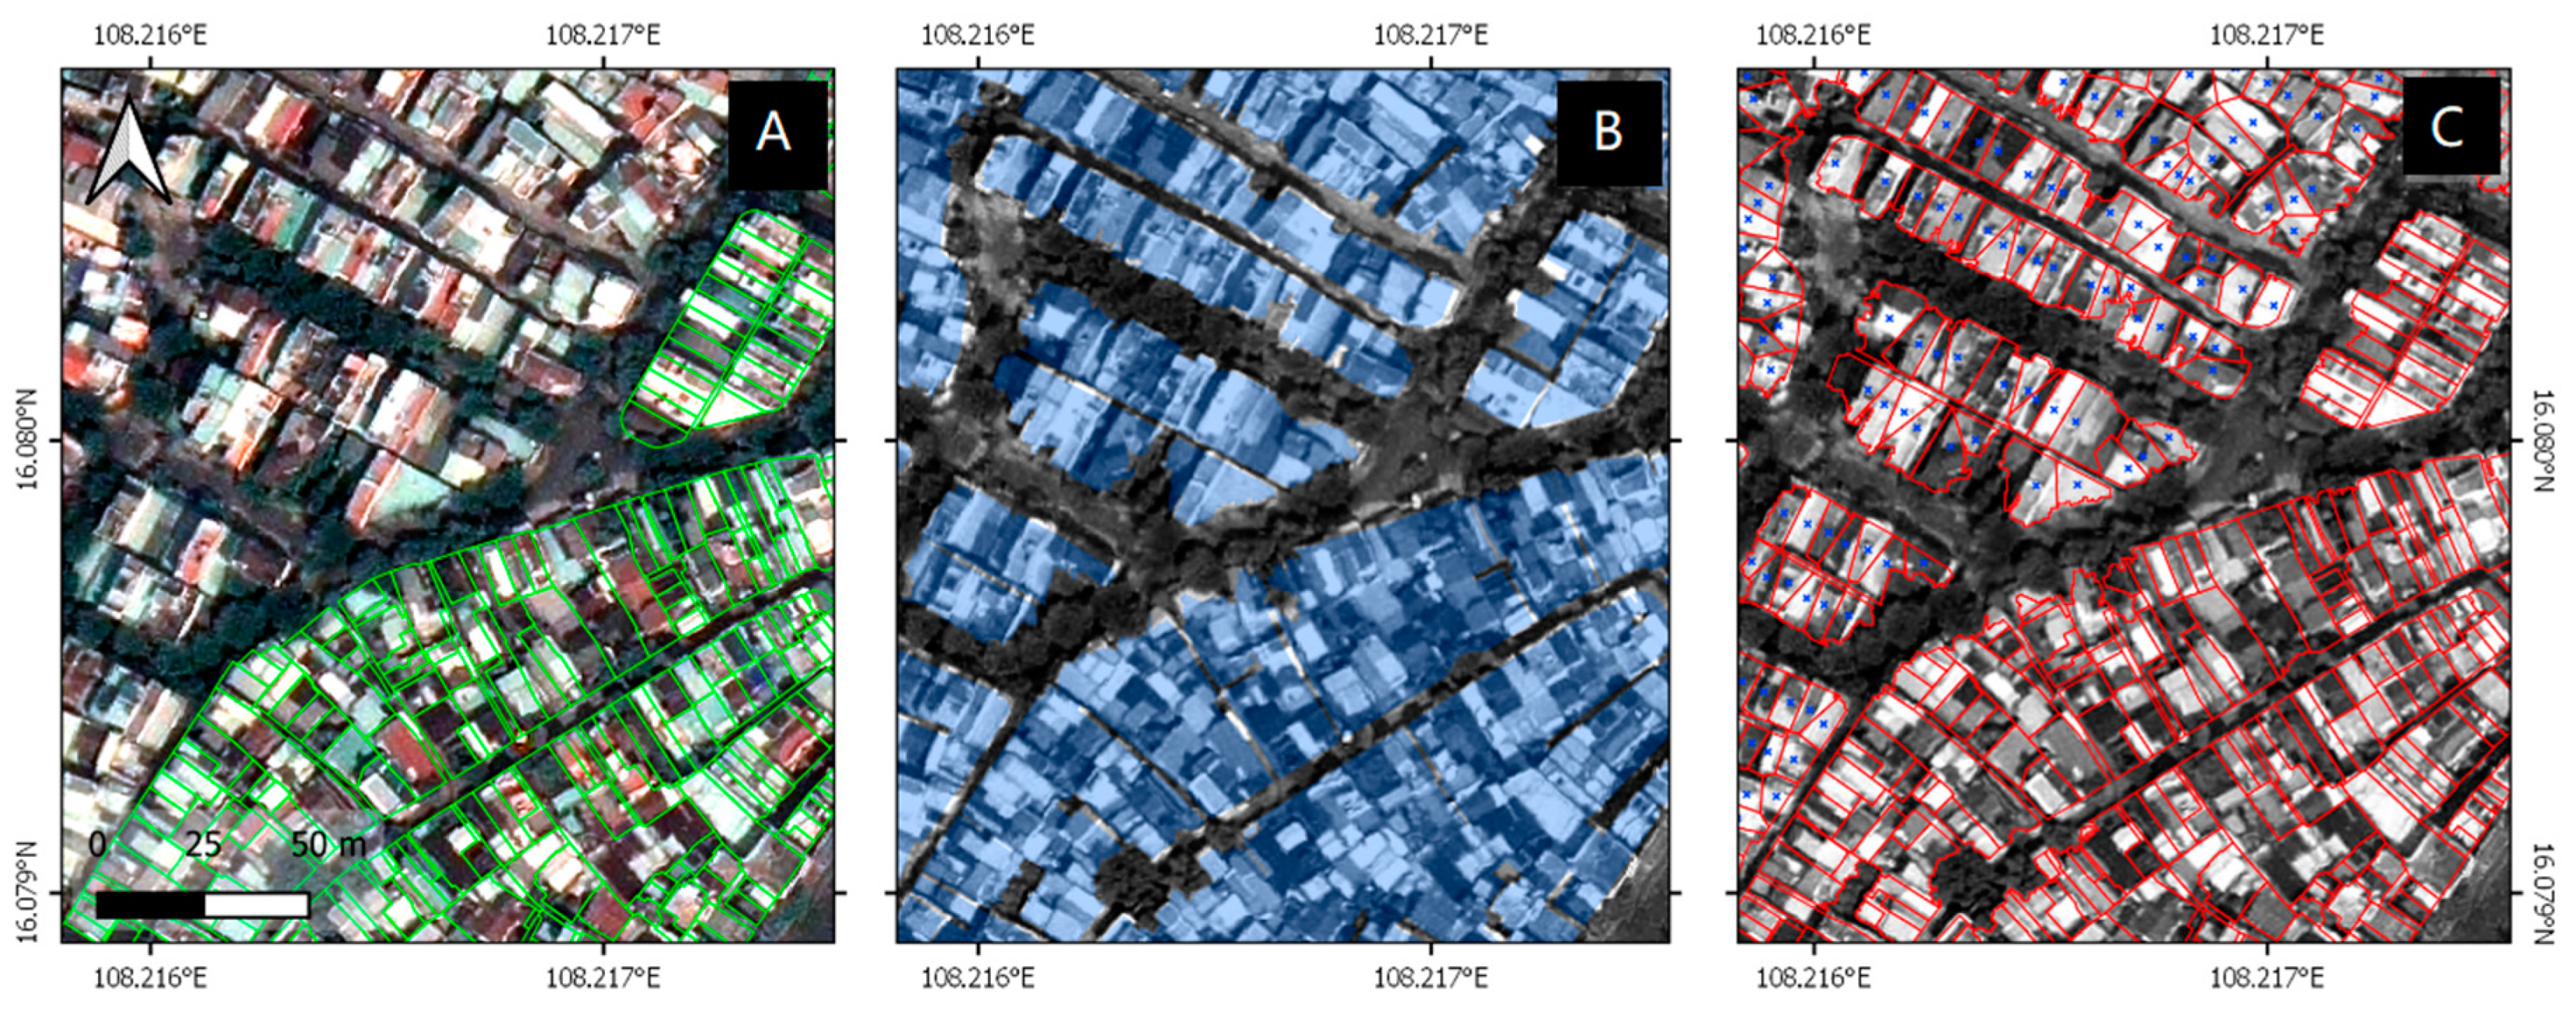
2.2.3. Identification of Building Types and Numbers on City Level

To estimate the total number of buildings in Da Nang, a semi-automatic approach based on the satellite images mentioned above was designed (Figure 2). Overall built-up areas and surface heights were extracted from the VHR image using object-based image analysis (OBIA), including image segmentation and rule-based classification as described by Warth et al. [52].
The result is a binary mask which determines if an area is built-up or not (Figure 3B). To also get estimates on built-up areas outside the extent of the VHR image in the rural areas of Da Nang, a supervised pixel-based approach was applied to the HR image. It was validated against independent training areas collected from Google Earth imagery resulting in a classification accuracy of built-up areas of 88.4% with slight underestimations of very small buildings of light construction materials which resulting from the lower spatial resolution and similar spectral characteristics of these rural buildings as their natural environment. Since large parts of Da Nang consist of densely built-up patterns of shophouses (Table 3, type #2), an automated delineation of individual buildings was not possible. To assess the size and number of single buildings in the entire city, cadastral data (Figure 3A) were used to split the built-up areas based on the assumption that parcel boundaries coincide with the demarcation of two adjacent buildings (Figure 3C, lower right part). Accordingly, each individual intersection was considered one building and marked by its centroid. For areas without cadastral data, the centres of each building were manually digitised from the VHR image based on visual interpretation (Figure 3C, blue marks). These marks were then used to construct Voronoi polygons (also called Thiessen polygons), as a spatial representation of all built-up areas closest to each point [53]. The resulting geometries were used to estimate the size and orientation of all buildings in areas where no cadastral boundaries were available (Figure 3C, upper left part). As a result of occasionally inaccurate spatial distribution of the manually digitised points, these geometries do not always fully represent the actual building shape but were found to accurately describe the building area to a large degree. To assess their accuracy, 50 building polygons were manually digitised, their area was computed and compared to the area of the corresponding Voronoi polygon. A general high agreement (R2 = 0.872) was found with high accuracies for buildings between 50 and 160 m2 which make up large parts of Da Nang and larger potential errors for very small (<50 m2) and very large (>200 m2) buildings. Further area error sources occurred for buildings whose built-up area was not estimated correctly (e.g., because they were partly covered by trees or their manually identified points were not digitised near the actual centre of the building), leading to rather triangular or compact shapes (Figure 3C, central part).

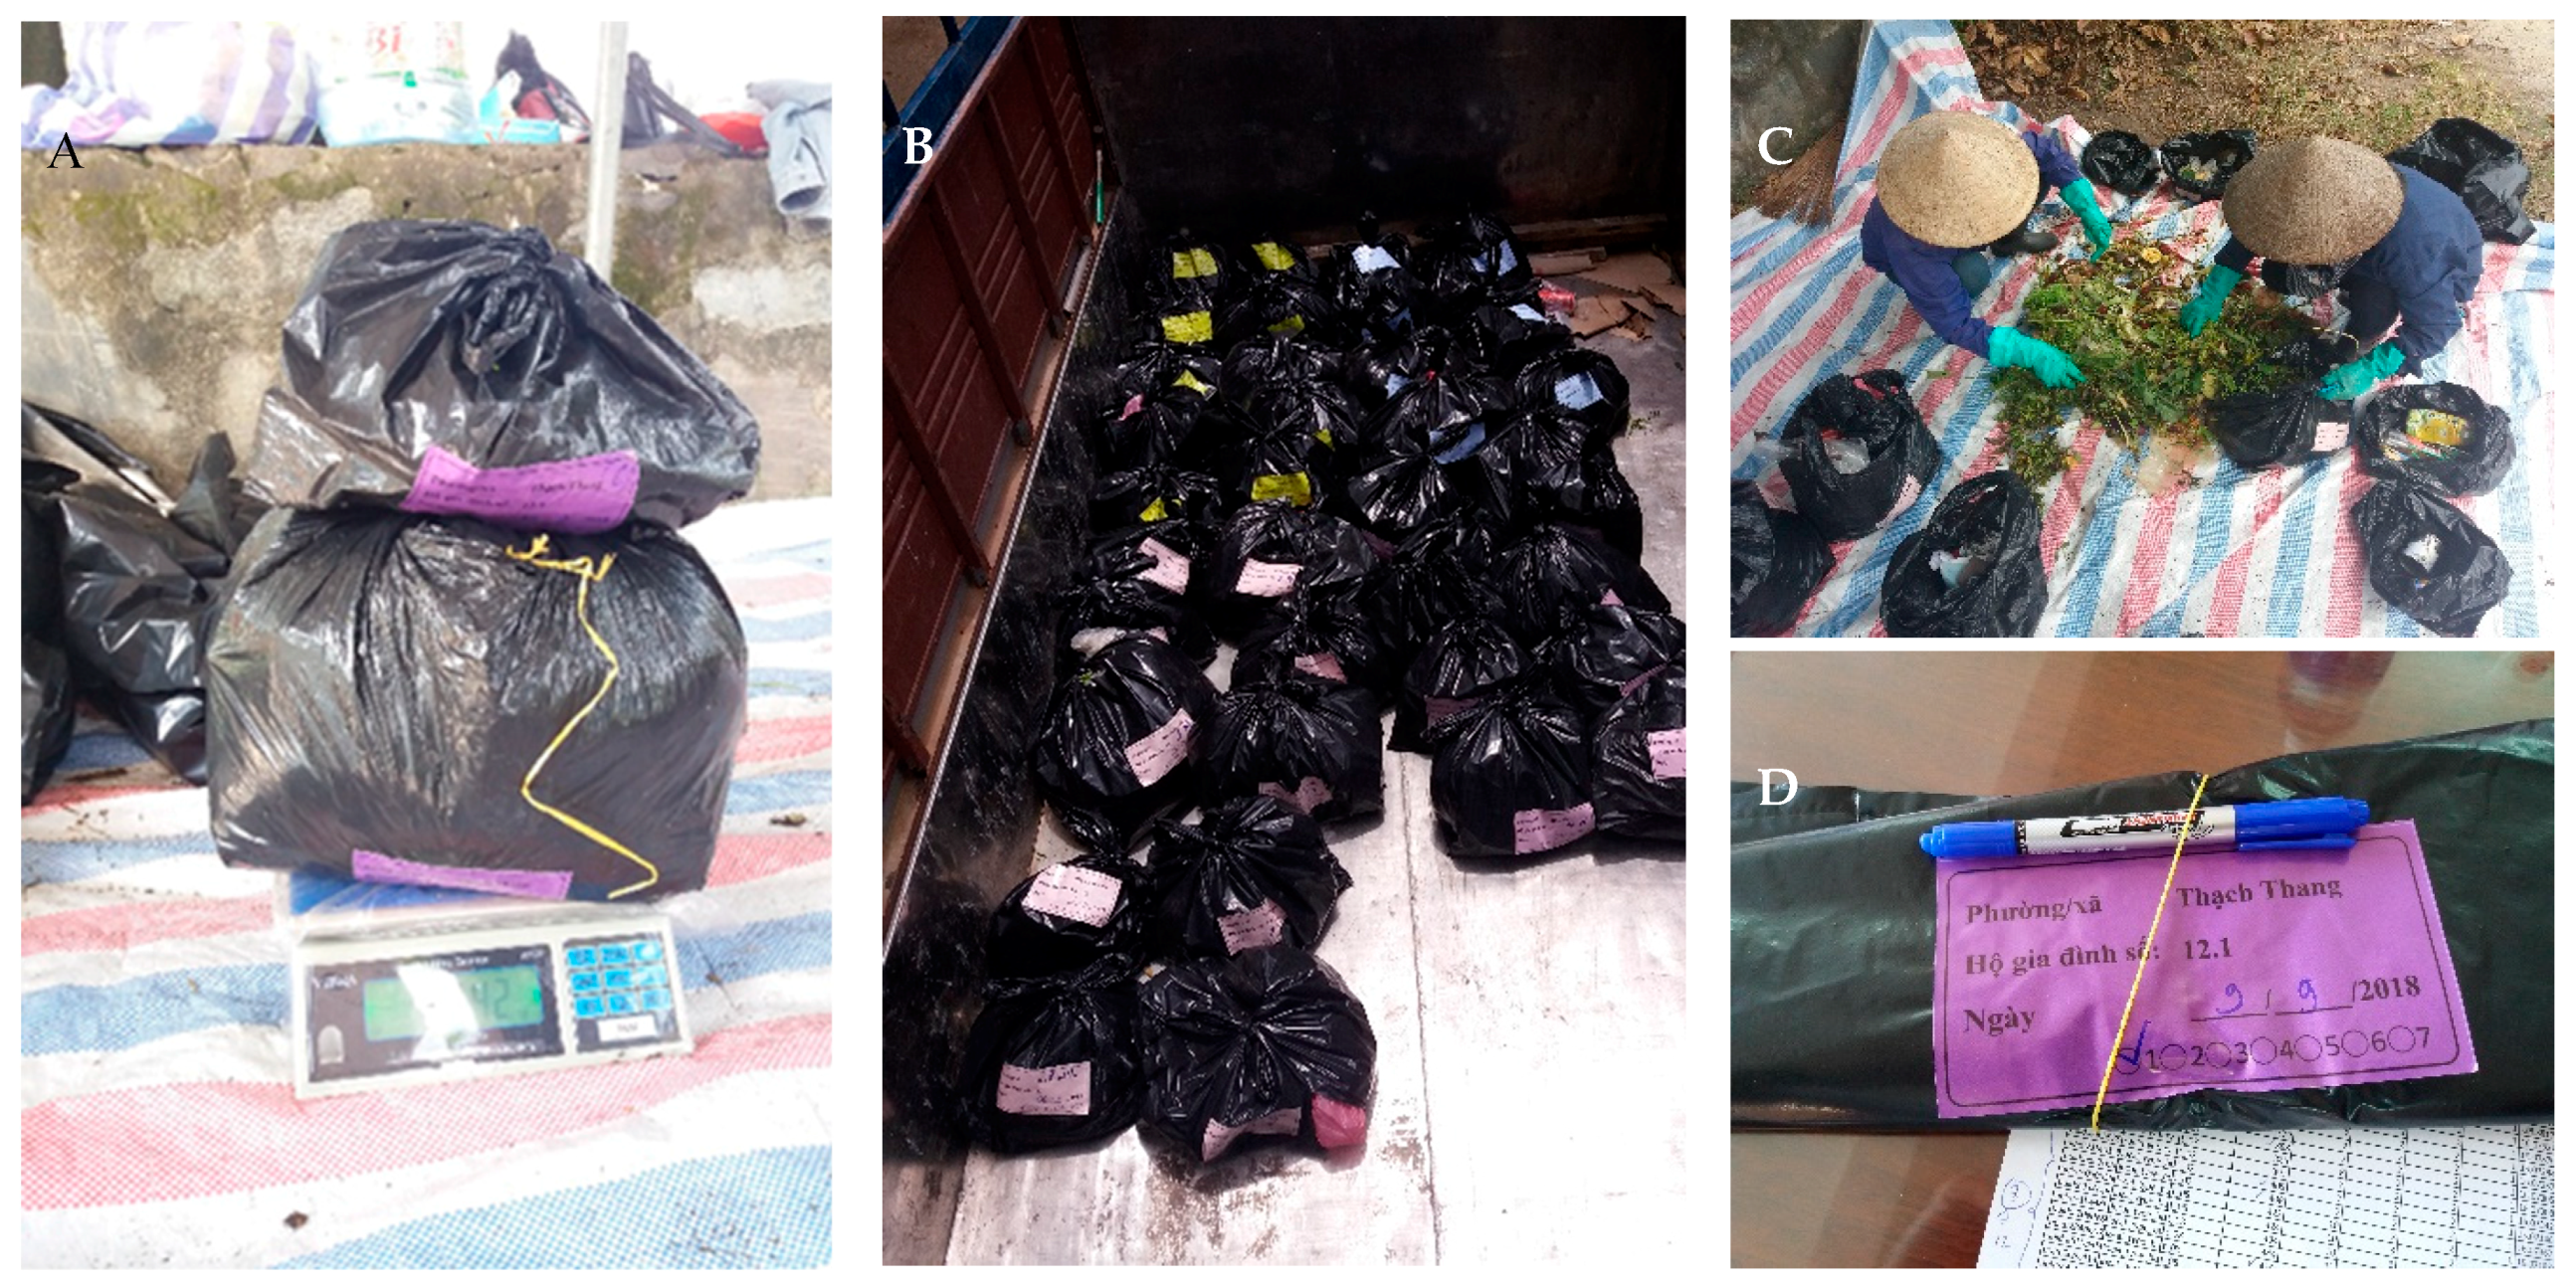
2.3. Determination of Household Solid Waste Generation Patterns

There is a basic subdivision of solid waste into organic and inorganic waste. For this survey, organic waste was further subdivided into kitchen and garden waste. Inorganic waste has the fractions of metals, paper, cardboard, composite packing, hygienic paper, glass, plastic, wood, textiles, ceramics/porcelain/mineral waste, hygiene products, hazardous wastes, electronic scrap, and other. In addition, metals, glass and plastic have subfractions of packing and non-packing (Table 4).
To generate statistically reliable data it is generally indispensable to determine the right sample size. Thanks to the groundwork regarding spatial analysis of housing and building structures, detailed information about the population size is available. The only difficulty in subdividing the basic population is the resulting larger sample required. Thus, the possibility of seeing the city as a whole is retained. The basic population (N) corresponds to all households in Da Nang. The margin of error (level of precision; e) should be ±10%, confidence or risk level 95%, degree of variability (distribution of attributes; p) 50%. A p value of 50% indicates the maximum level of variability in the population and leads to a more conservative sample size. However, we attempted to compile our sample in a similar distribution to the basic population. With ‘single local-type’ buildings also having the highest share and trying to have at least 10 samples of every building type, the true variability and the sample size could have been smaller. A confidence level of 95% leads to a z-score of 1.96. By using Equation (1) according to Israel [54], you can see that as the basic population increases, the sample size goes against the limit value of 100. To ensure that at least 100 valid datasets were obtained, the sample size for terrestrial data collection of HSW generation patterns was defined as 120.
Sample   Size :   n =   z 2 × p × ( 1 p ) e 2 1 + z 2 × p × ( 1 p ) e 2 1 N
The waste survey itself was carried out in September 2018. It consisted of two parts, one being a questionnaire and the other one a solid waste collection and measurement. To determine the scope of the survey, and to compile the questionnaire, waste experts and local stakeholders such as the Urban Environment Company (URENCO) of Da Nang and the Da Nang Institute for Socio-Economic Development (DISED) were consulted. The questionnaire was translated into Vietnamese language by local stakeholders. Ten questions were used to generate basic information about the household itself and its waste collection. With the help of the local knowledge of the DISED employees, the households of the sample were visited and interviewed over four days, from 5–8 September. Employees of URENCO supported the waste sampling by agreeing with the residents on a place where to pick up the HSW.
In addition to filling out the questionnaire, seven labelled garbage bags were handed over to each household. Residents were asked to place their daily generated household waste, provide information on the actual number of persons in the household of the respective day, and place the bagged HSW in the evening at the stipulated place in front of their house or apartment. The households were told not to put any waste from their shop or other external sources into the garbage bags. Recyclable materials, which they could otherwise sell, should be thrown into the garbage bag for the period of this week. The households received a small expense allowance as recompense. For the duration of one week (10–16 September) the garbage bags were picked up every morning by URENCO (Figure 4B). Then they were taken to the Khánh Sơn landfill, where an area was prepared for weighing and sorting. A tarpaulin was used to prepare the surface so that the waste bags could be emptied, and the waste sorted without any loss of material (Figure 4C). On the one hand, a pavilion served as protection from the sun and thus from high evaporation of the liquid components in the waste and, on the other hand, from the entry of liquid during rainfall. In order to achieve the most accurate result possible, an electronic table scale with a precision of 0.1 g was used (Figure 4A). With the arrival of the garbage bags, the weight of each bag was determined, which resulted in a generated amount of waste per household per day. This value was noted together with the other information of the label. This included the assignment of an identifying numbering to the household to be able to make an exact allocation, as well as the number of persons generating the waste on the specific date (Figure 4D). Freelancers of the landfill were hired to take the garbage of every ward (10 households) out of the garbage bags and to sort it into the mentioned fractions and weigh it (Figure 4C). These waste pickers were chosen due to their expertise. The weight of the garbage bags was always deducted and then added to the packing plastic fraction.

3. Results

3.1. Building Stock

The assessment of individual buildings resulted in a total number of 272,233 buildings for Da Nang. The building type was assigned based on thresholds applied to the characteristics: size, shape (relationship between width and length), roof colour and height (as extracted by the satellite imagery), and location within the city. To increase the accuracy of this rule-based prediction, the building types were manually refined based on visual interpretation. An accuracy assessment was performed based on the 975 building types identified during the field survey which resulted in an overall accuracy of 90.9%. As this measure does not taking into account the imbalanced distribution of building types within the city, error rates were calculated for each building type. As shown in Table 5, large parts of Da Nang consist of ‘single local’ buildings (87.2%), especially in the urban districts of Hải Châu, Cẩm Lệ, and Thanh Khê, where their share is above 95%. The share of ‘single basic’ and ‘single bungalows’ is accordingly higher in the more rural districts of Hòa Vang and Liên Chiểu. The highest share of ‘single villa’ buildings (2.4%) is found in Ngũ Hành Sơn, which has a higher share of touristic use. Table 5 shows that ‘single/multi local’ buildings have low errors of omission and commission because they could be determined quite well based on their characteristic shape and height. Larger misclassifications occur between ‘single local’, ‘single bungalow’, and ‘single villa’ buildings, leading to larger errors of omission and commission of the two latter classes. The same confusion was observed for the large building types with sizes above 500 m2 (multi modern, hall, special) but as these are not of public and commercial use, they were not part of the overall assessment of residential waste generation.

3.2. Waste Generation Patterns

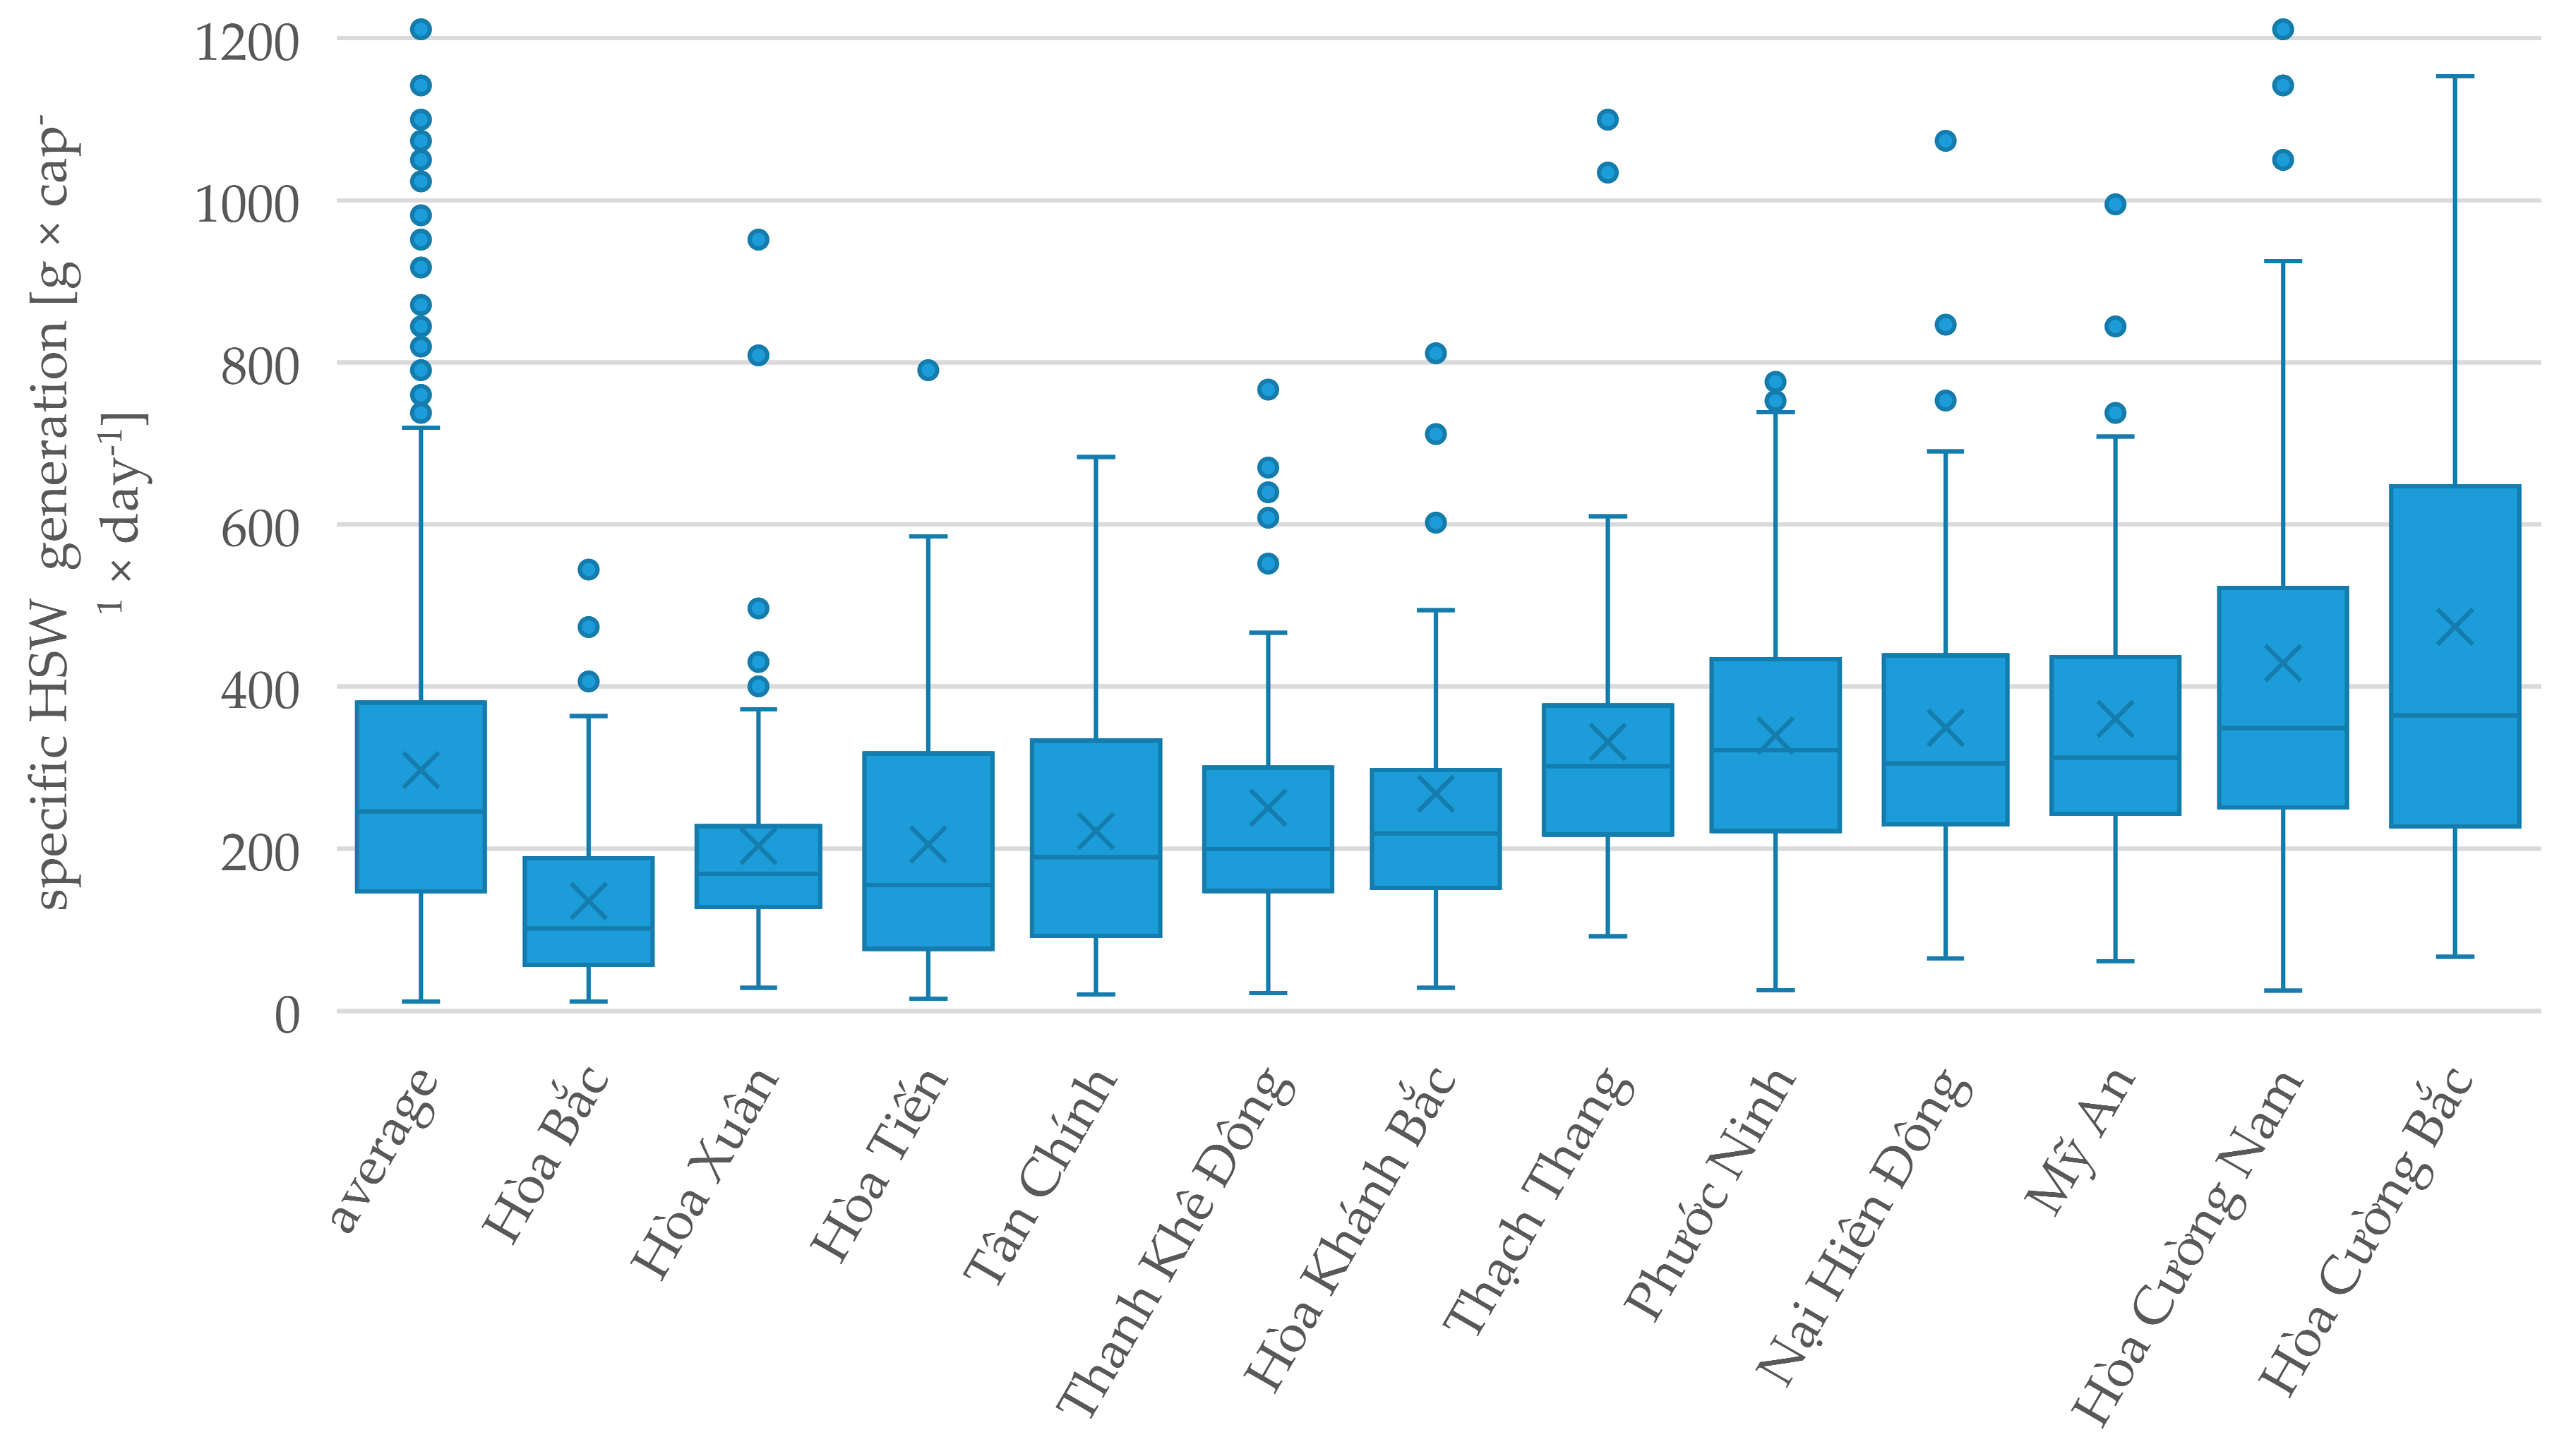
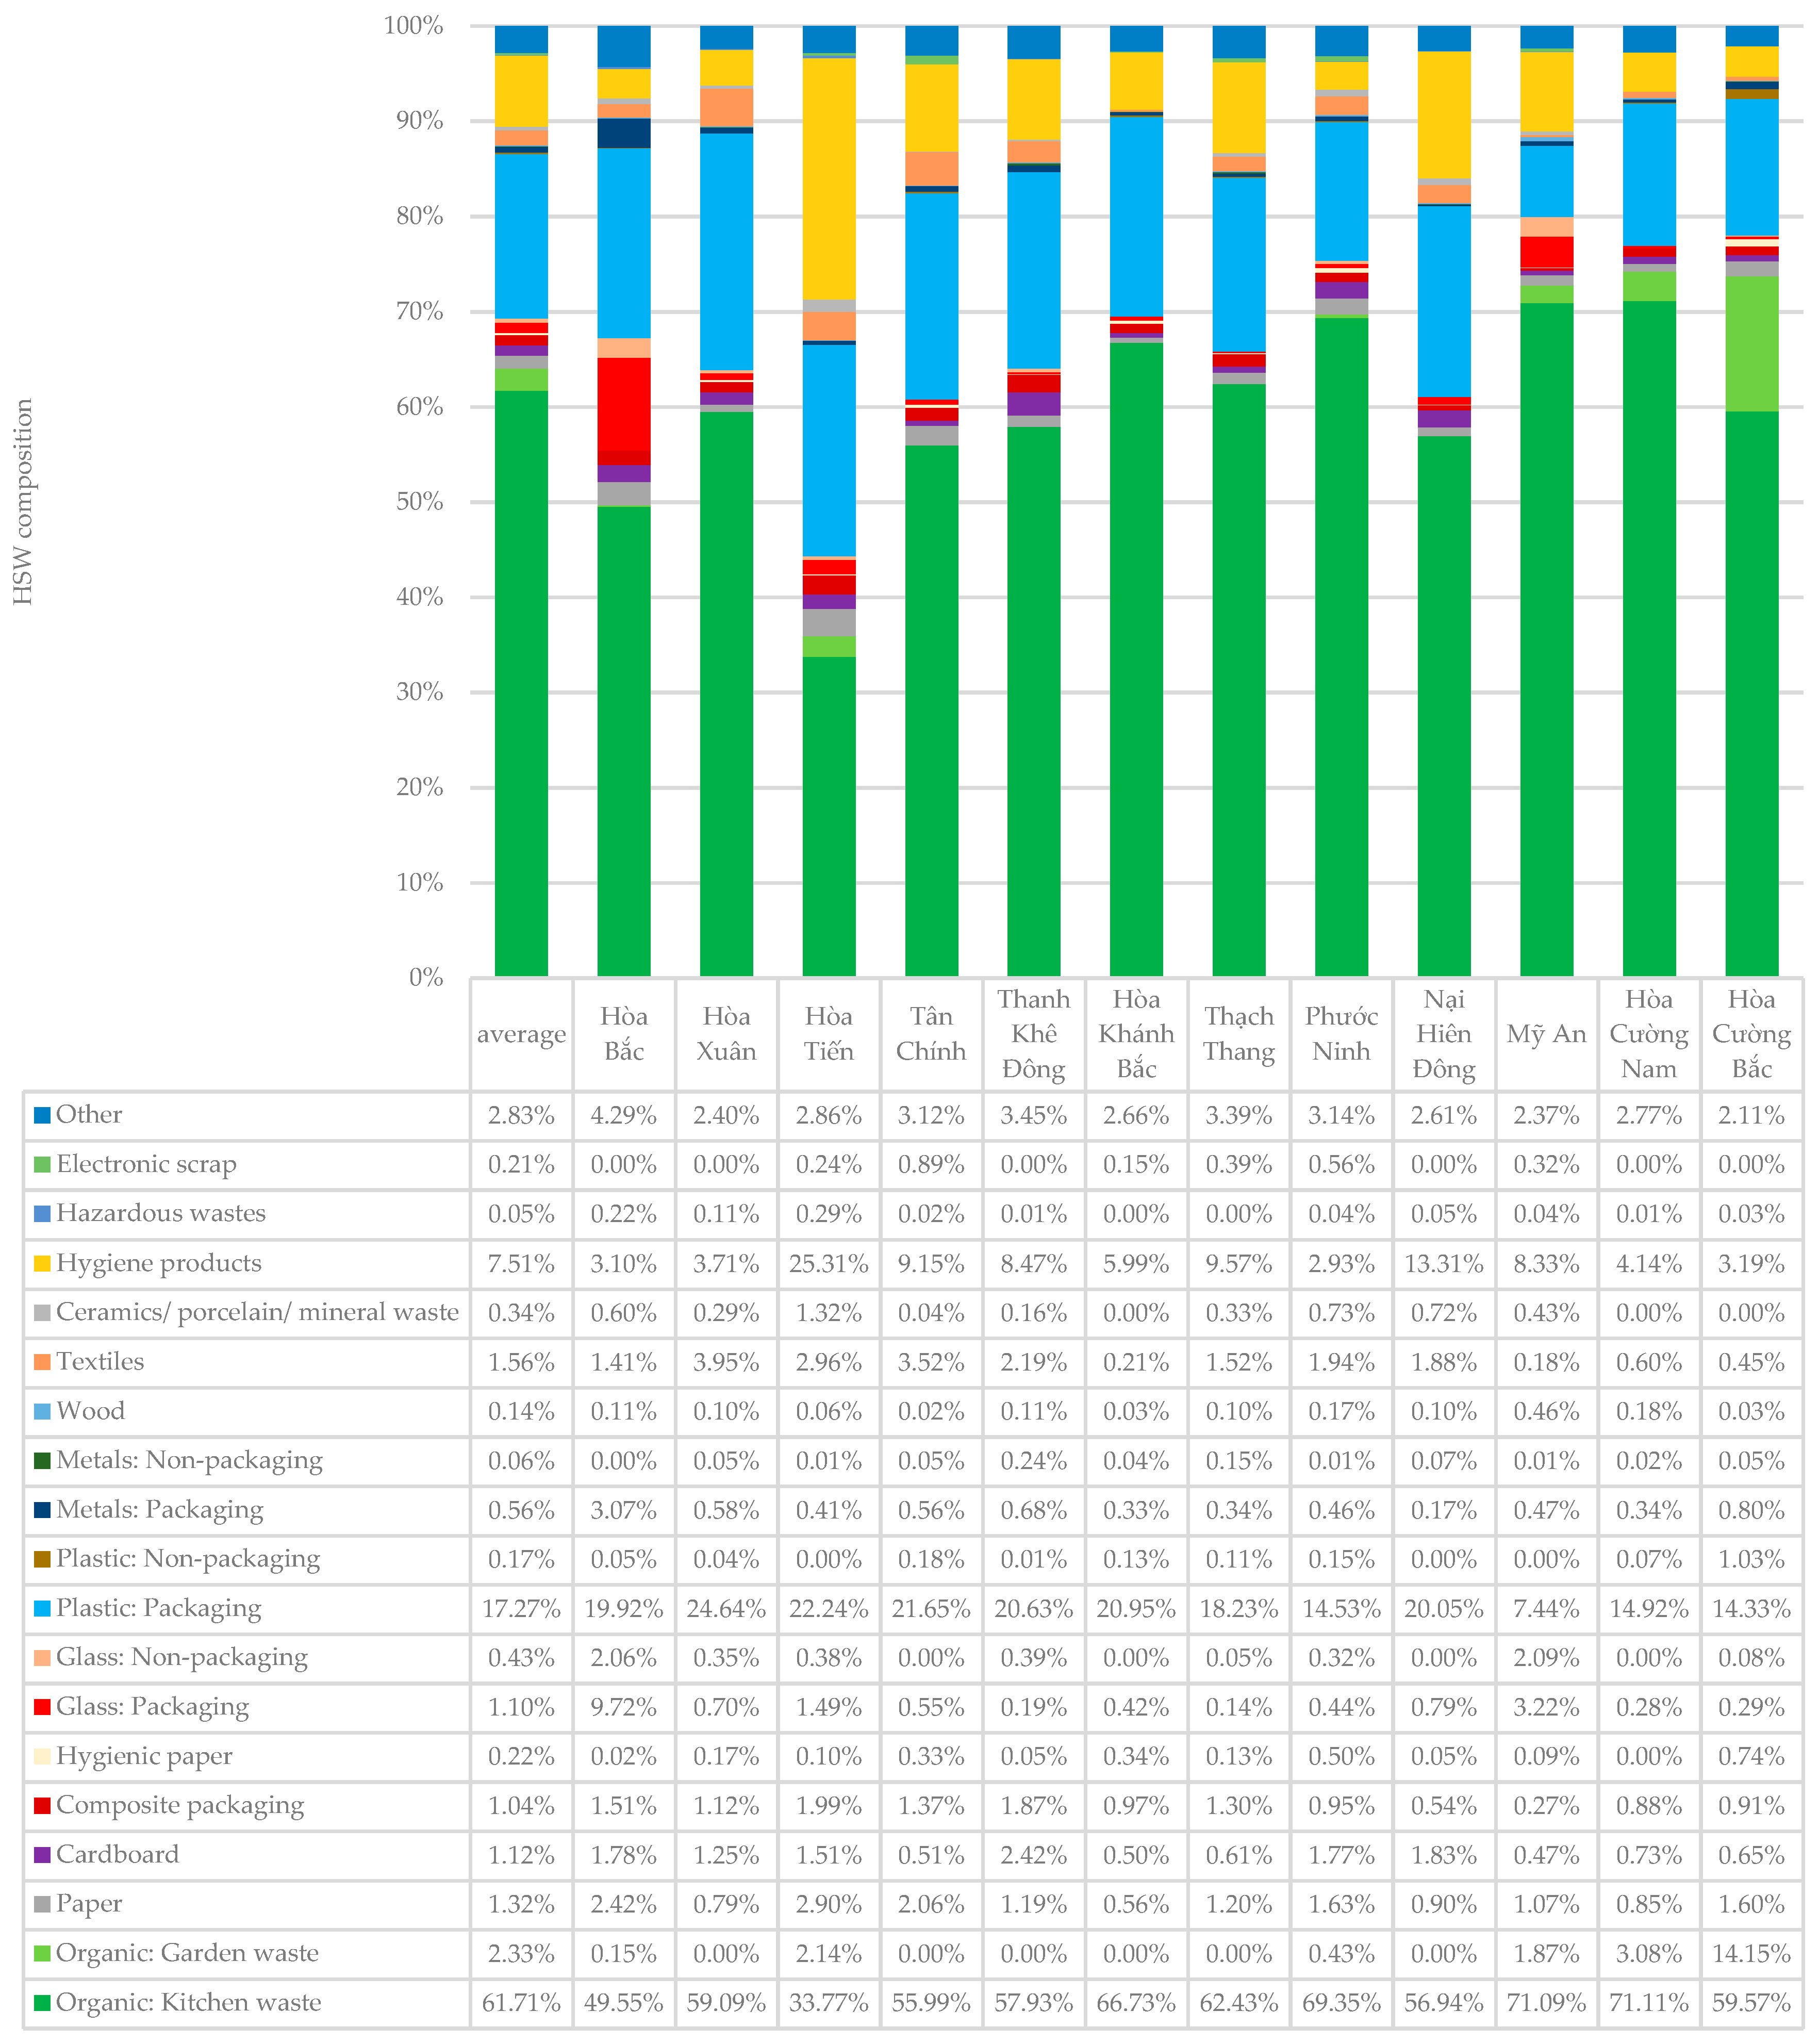
3.2.1. Generation Rate and Composition of Household Solid Waste in Wards of Da Nang

The average specific waste as generated by ward is depicted in Figure 5. It is highest in Hòa Cường Bắc and lowest in Hòa Bắc. The overall average is 297 g of HSW per capita per day. If the losses in sorting are considered, the value shrinks to 275 g daily per capita, which corresponds to a reduction by 7.4%. Around 50% of the wards observed were below and 50% above the mean value. If the standard deviation between the wards is analysed, it turns out that there are large differences in waste generation. With 417 g per capita each day the average specific value in Hòa Cường Bắc was more than three times the one of Hòa Bắc. The interquartile range is the smallest in Hòa Xuân with a value of 100 and the highest in Hòa Cường Bắc with 419.
The composition of HSW per ward is presented in Figure 6. It shows that organic waste accounts for a high proportion of all waste. On average, 61.71% is kitchen waste. The standard deviation is 0.105, which shows the largest differences between the wards with regard to all fractions. The proportion of kitchen waste in Hòa Tiến is only 33.77%, while it is 71.11% in Hòa Cường Nam. Hòa Cường Bắc shows a disproportionately high proportion of 14.15% garden waste. With 25.31% hygiene products, this share is also disproportionately high for Hòa Tiến. Looking at the absolute value of 47.58 g per person per day, it is approximately as high as that of Nại Hiên Đông. Kitchen waste has by far the largest share of solid waste in any ward, usually followed by packing plastic. Only Mỹ An and Hòa Tiến had relatively higher generation of the category hygiene products. All the other waste fractions were almost not present at all. Hòa Bắc showed with 9.7% unusually high generation of packing glass waste. Hazardous waste was always less than 0.3%.

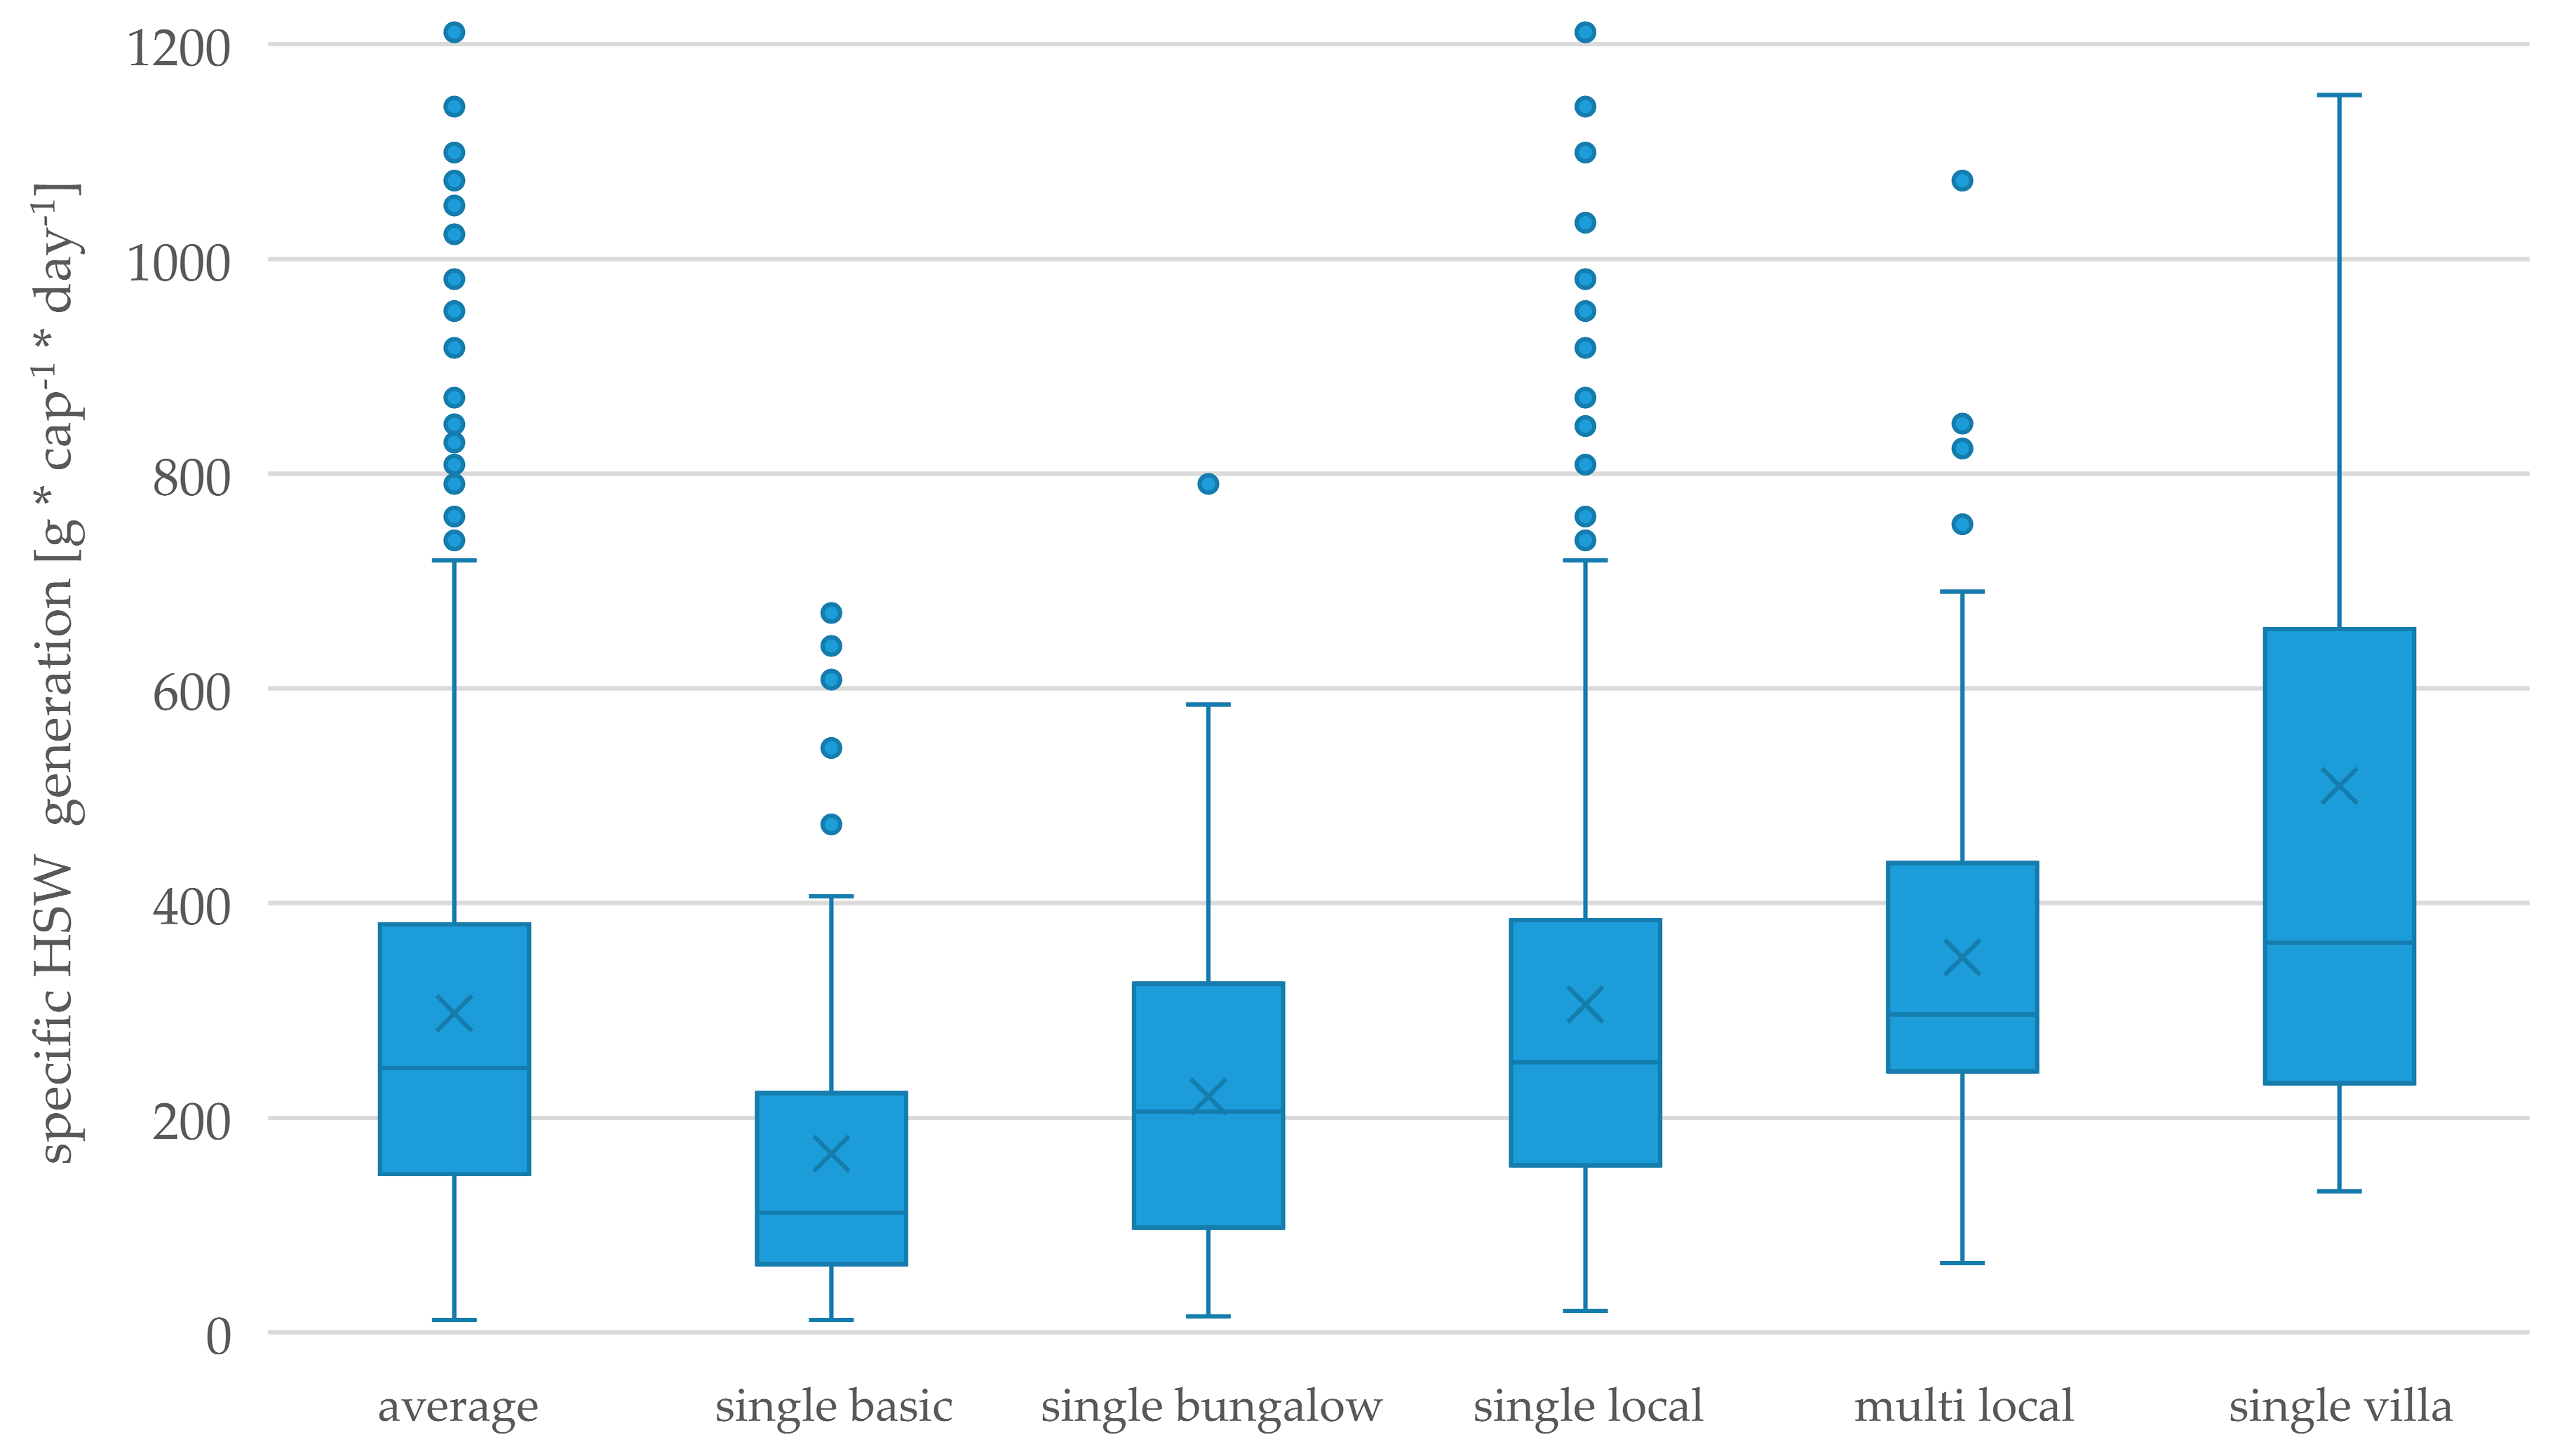
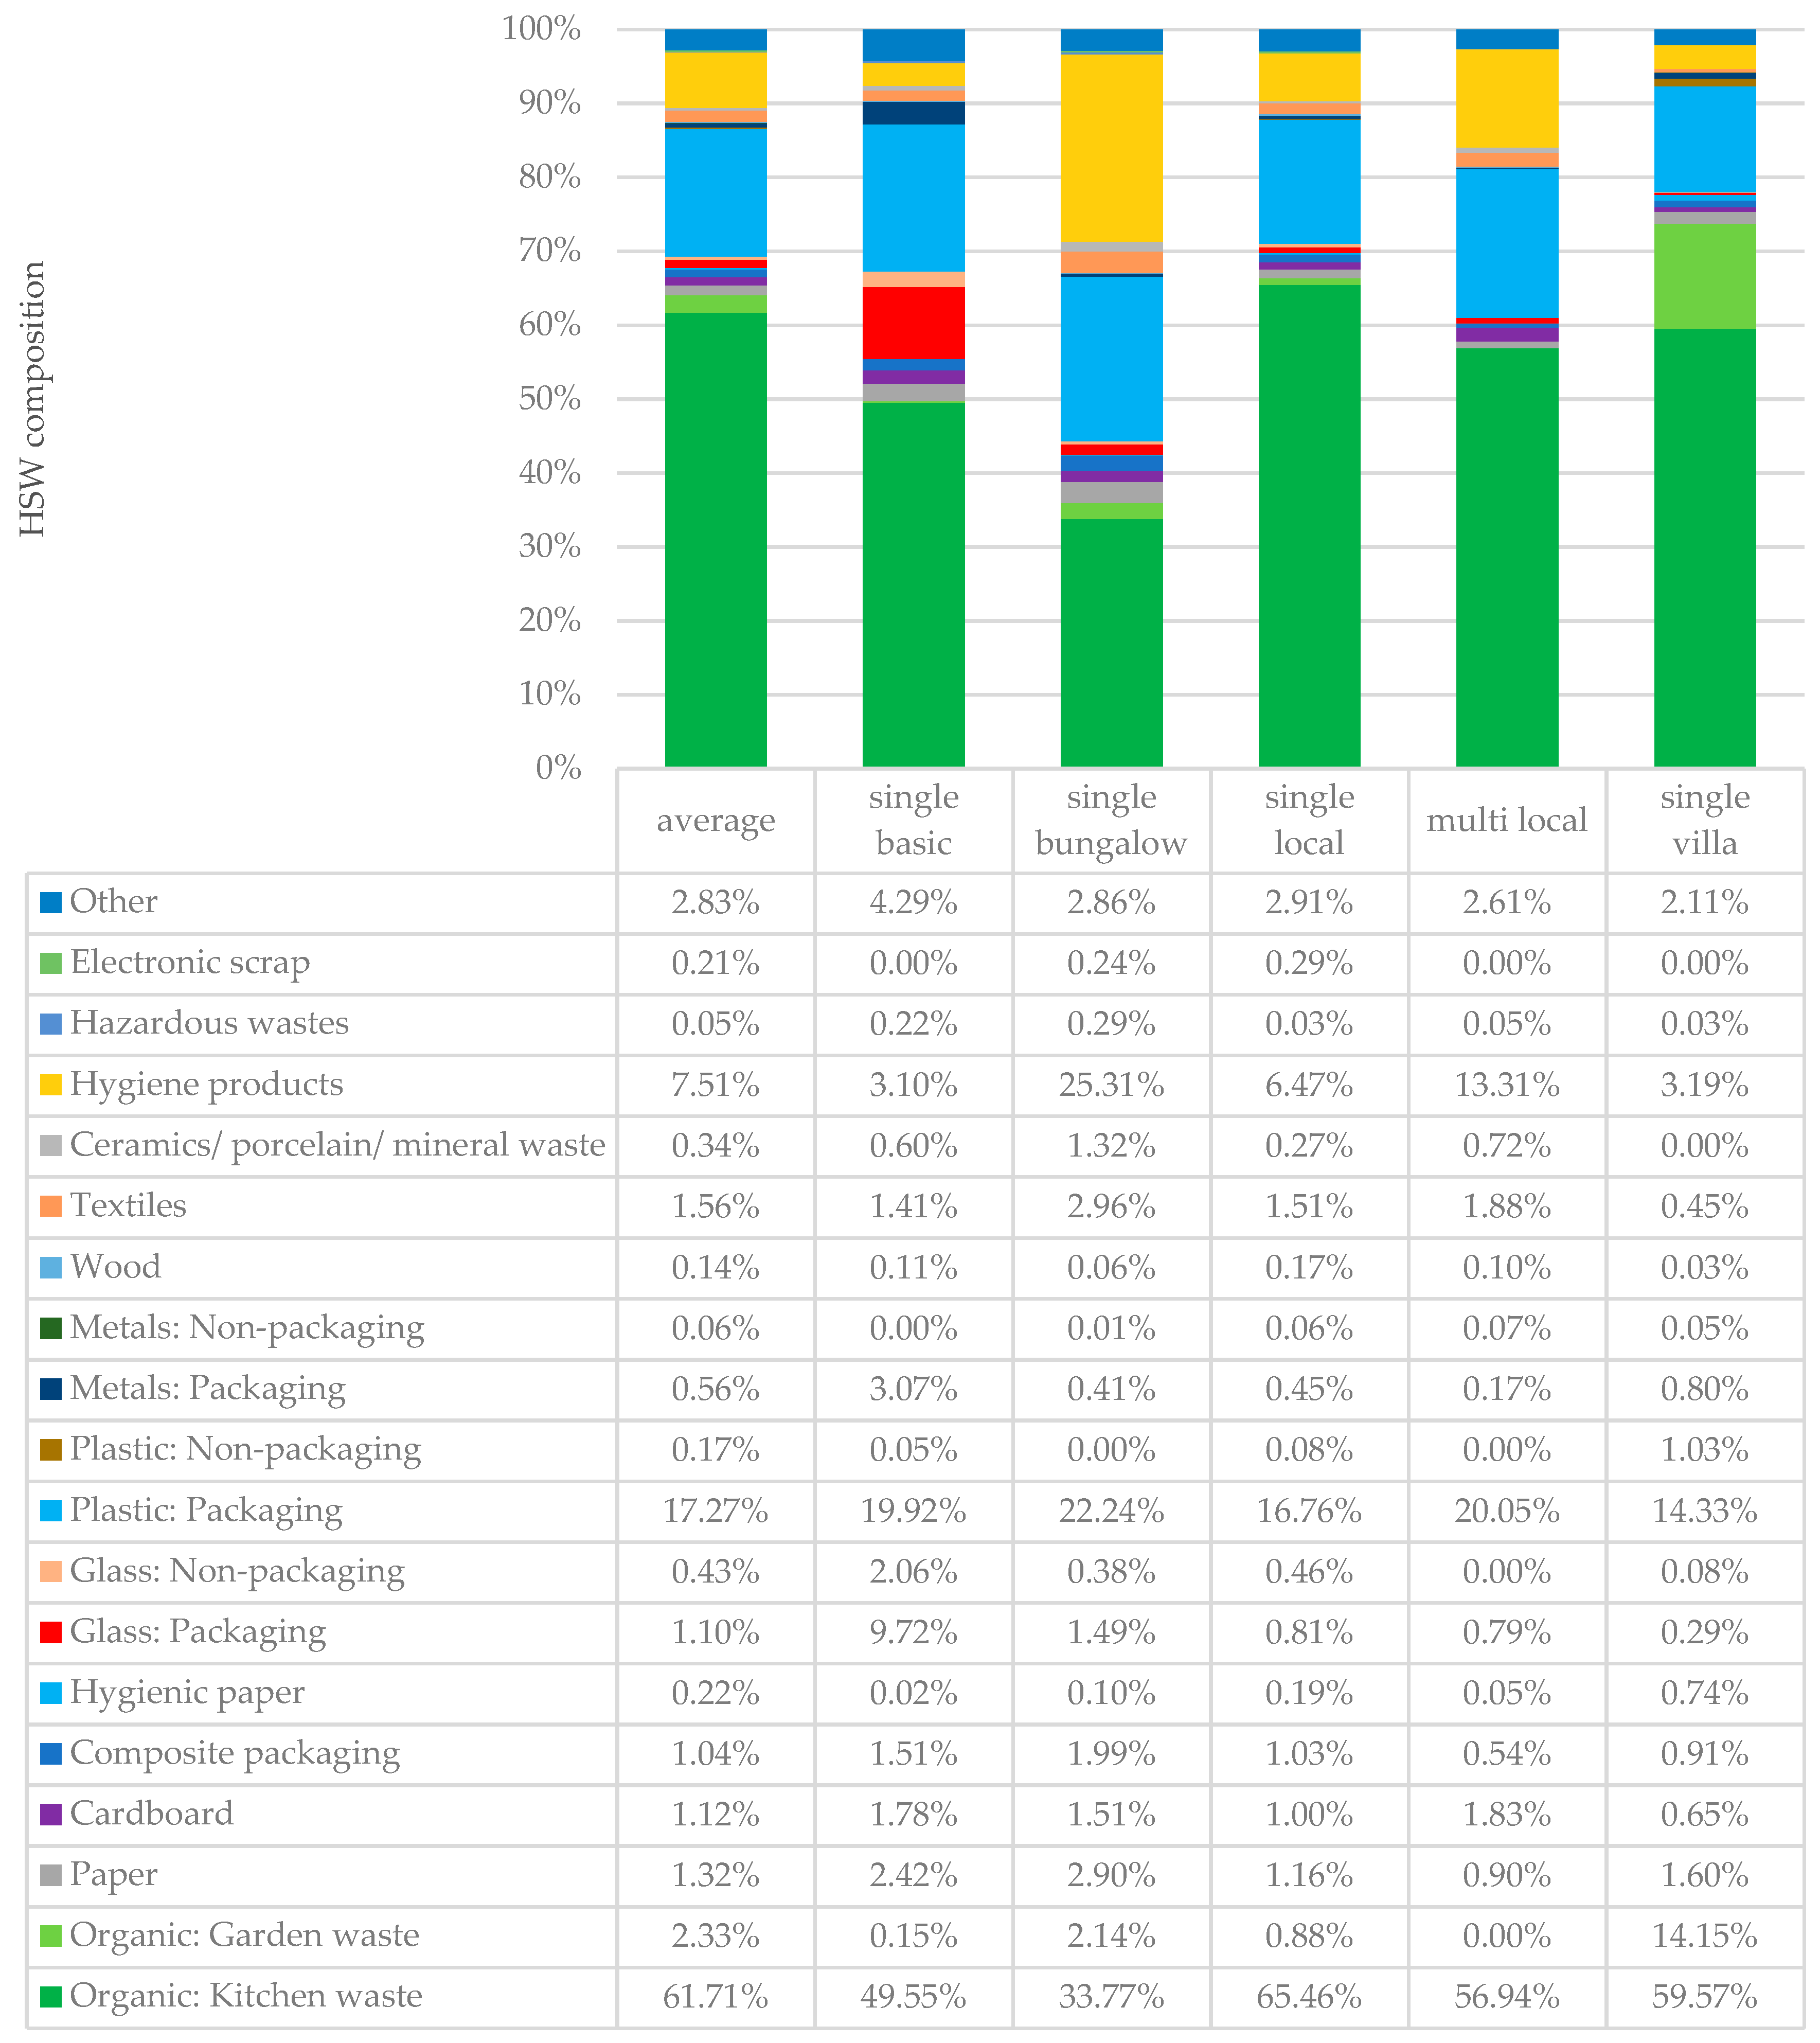
3.2.2. Solid Waste Generation and Composition Per Building Type

The average specific HSW generation rate over the whole sample size was 297 g per capita each day. If the individual building types are considered, an inhomogeneous picture emerges. An increase of median and mean from ‘single basic’ via ‘single bungalow’, ‘single local’, and ‘multi local’ to ‘single villa’ buildings can be seen in Figure 7. This clearly supports our hypothesis that building types can serve as a proxy for the socioeconomic conditions of the inhabitants, thus being a suitable proxy for their waste generation. The interquartile range is smallest at ‘single basic’ (159.50) and highest at ‘single villa’ buildings (422.64). Thus, the degree of dispersion is the highest at ‘single villa’. There are no outliers at the lower end. For a better visualization, the scaling of the ordinate has been chosen as shown in Figure 7. Thereby, not all outliers of ‘single villa’ and ‘single local’ buildings could be displayed.
The HSW composition by building type (Figure 8) shows that kitchen waste was always the largest fraction. With an average of 61.7%, it has the largest share at ‘single local’ (65.5%) and with 33.8% the smallest share at ‘single bungalow’. At 12.2%, the standard deviation is largest for this fraction. With 14.2%, garden waste has the largest share at ‘single villa’ and the smallest at ‘multi local’ buildings, where no garden waste was generated due to the absence of any garden. Packing plastic has the second largest share of all fractions except for ‘single bungalow’. There, hygiene products have a share of 25.3%, while packing plastic has 22.2%. Overall, the standard deviation for packing plastic is only 3.11%.

3.3. Extrapolation of HSW Generation for the Entire City of Da Nang

In the preceding chapters, the methodology and results on HSW generation were presented. The overall goal was to make a fast, precise, and valid estimation of the stock of buildings and, from there, an extrapolation to city level. This is dependent on the previously defined building types. Using this analysis, it is possible to estimate and extrapolate the HSW generation of the residents throughout Da Nang. Extrapolations on a smaller spatial scale or on single fractions are also possible. The following equation with the defined variables in Table 6 was used to extrapolate HSW generation:
HSW   generation   on   city   level = b = 1 n x b ×   y b f ×   z b .
Due to the small sample size, the average household size was not taken directly from our survey but adjusted by a factor of 0.67 in order to comply with the official statistics of an average of 3.6 persons per household [44]. The waste quantities generated at district level in Table 7 were calculated using the above formula. Thereby, in the Liên Chiểu district the most and in the Ngũ Hành Sơn the least HSW was generated. In total 301 tonnes per day, subsequently 109,844 tonnes per year, of HSW is estimated on city level.
If the composition of the HSW by district is considered in Da Nang, there are only marginal variations (Table 8). The absolute value can be calculated from this—on the one hand, again on district level and, on the other hand, on city level. This shows that approx. 70,000 tonnes of organic waste is generated annually. This is probably one of the largest unused resources from the HSW sector. Instead of putting this material in a landfill, composting or energetic utilisation could be expedient solutions. Depending on the composition of the organic material, electrical, mechanical, or thermal energy can be generated. Thermochemical, physicochemical, or biochemical conversion processes can be considered. Packaging plastic can either be recycled or reused. With almost 19,000 tonnes, there is also a very high potential here. The same applies to glass, where a total of approx. 1500 tonnes are produced annually. For paper (approx. 1500 t/year) and cardboard (approx. 1200 t/year), recycling would also be economically, socially, and environmentally worthwhile.

4. Discussion

As illustrated in the results sections, a reliable relationship between building types and waste generation could be established. The proposed method, combining remote sensing methods with terrestrial sampling, can be used to determine more precisely both the amount of household solid waste and its composition at city level or at any other spatial or organisational scale. This procedure can also be used to identify unused or underutilised resources in the city.
Reports by Vietnamese provinces in 2008 stated a range of 800–1200 g MSW generation per capita each day in cities like Da Nang [55]. According to a survey of Otoma et al. [56] in Da Nang in 2010 that also took place in September and included 50 households, it was 710 g per capita per day. With regard to the composition of solid waste, there were only minor deviations in comparison to the present study. Considering the official statistics of the city, the average specific MSW generation in 2015 is 896 g per capita each day. In consideration of the collection rate, 672 g MSW per capita each day ends up at the landfill. Nevertheless, we cannot compare HSW to MSW, especially the generated amount. The study of Thanh et al. [57] in a Mekong Delta city in 2012 focused especially on HSW and stated a generation rate of 285.28 g per capita per day. The value of the average HSW generation rate in our survey (297 g per capita per day) is at a similar magnitude and only 4.2% higher than that of Thanh et al. [57]. Thus, our method has proven to generate valid and realistic results. Nonetheless, there are some points that need to be noted for discussion.
The results show that building types are linked distinctively to different waste generation patterns. This is because households of higher income have the opportunity to buy a larger variety of goods, resulting in a higher amount of waste. However, there is still variation within the building types which prevent an accurate prediction of the overall residential waste generation of the city. One possible solution to reduce the standard variation within the building type 2 ‘single local’ is to attach spatial parameters to the surveyed buildings to test if they are correlated with high or low generation values. We disaggregated values of this building type by district which revealed that buildings in Hải Châu and Ngũ Hành Sơn had a significantly larger waste generation than in the other districts. However, this might also be related to the spatial sampling and correlated to other factors, such as the degree of touristic and commercial use of these parts of the town. A simple correlation of waste generation with building density around the surveyed houses alone did not reveal a clear pattern in our data. More factors describing urban structures and spatial use are required to reduce the variation here.
In looking at the waste collection and its method, there are also some points for discussion. Thus, we did not include a comparison of waste quantification and characterisation between dry season and rainy season. Thanh et al. [57] showed a seasonal fluctuation of less than 5% in a Mekong Delta city. We did not consider these marginal differences to be justified in carrying out a further resource-intensive waste survey at a different time of the year. Furthermore, the waste sorting process resulted in a weight loss of 7.4%. Despite the use of the tarpaulin and pavilion, this loss could not be reduced any further. The waste pickers swept the tarpaulin after each batch and weighed even the smallest particles, which we considered to be the fraction of ‘other’. Since the waste itself and even the tarpaulin had been wet after the sweeping together, it can be assumed that the weight loss is partially explainable by evaporation. Evaporation and leaching can hardly be completely prevented. The loss of weight due to dust cannot be precisely quantified either, but probably had a subordinate impact. Furthermore, it cannot be ensured that only organic waste and recyclable materials and nothing other than the household waste (e.g., small proportions of MSW) ended up in the bags. Some households may be partly dependent on sales of recycling materials or the use of organic materials (especially kitchen waste) as feed for their animals or as fertilizer for their crops. The latter may be the case in the rural area of Hòa Tiến, which would explain the low proportion of organic waste. In the case of Hòa Bắc, another rural area in the survey, garden waste accounts for a very small proportion of total waste. This is because the inhabitants either burn garden waste or compost it for their crops. The kitchen waste is considerably higher in this investigated area than in Hòa Tiến, partly due to the lower livestock feeding activity. However, all this was attempted to be reduced to a minimum by means of a detailed briefing and an appropriate reimbursement of expenses. In general, garbage is somehow a part of people’s privacy. Even if the waste collection was done anonymously and especially when sorting the waste of 10 households together, some households might be uncomfortable with parts of their waste. Accordingly, it cannot be excluded that these parts were disposed of elsewhere or at a subsequent date.
Probably the greatest uncertainties arise when the absolute value for the city is evaluated, instead of evaluating the specific value for household solid waste generation. Upscaling the data based on our survey would lead to a total HSW generation rate of 451 tonnes per day or rather 164,455 tonnes per year. This value is 49.72% above the estimated value of Table 7, which is due to the large differences in household sizes. The households in our sample had an average of 5.4 inhabitants, with official statistics assuming 3.6 [44]. Hence, it may be better to give a range than an absolute number. This would indicate that HSW is about one-third to one-half of MSW in Da Nang in 2015.
Besides the thematic aspects discussed in the previous paragraphs, there are also sources for potential errors and uncertainties resulting from the initial data and the employed geospatial methods: one reason for the discrepancy between the population numbers estimated based on building types as documented in this study and the officially reported numbers could also result from the use of parcel data to split the built-up areas into single buildings, as described in Section 2.3. In many parts of the city, a single building covers more than just one parcel and was falsely split into smaller parts. This led to potential overestimation of the total number of buildings, especially of the shophouse type (‘single local’), resulting in higher population numbers than were actually living in these parts of the city. Furthermore, both the number of households and the sizes of single households are presumably lower for local-type buildings in the centre of the city, because of the more intensive commercial use of these buildings, especially along the large roads. This could furthermore explain the overestimation of inhabitants as observed in this study.
Following the concept of reduce, reuse, and recycle, e.g., up to 70,000 tonnes of organic waste per year could be used for energy generation (fuels, electricity, heat, or cold). A modest method of energetic valorisation would be biogas production. The technical, ecological, and economic efficiency thereby significantly depends on the quality and quantity of biogas which, in turn, depend on various other parameters (e.g., level of digestibility, performance of conditioning/pretreatment considering trace compounds). This should be addressed in continuative research by application of detailed calculations, such as provided by Ferraro et al. [58] or Kuo and Dow [59]. Other possibilities of bioconversion of organic waste to energy gives for example Kiran et al. [60]. However, recyclables are also worth mentioning. Cleanliness, in particular, plays a role here. As soon as there is an overview of the quantities and thereby the earning possibilities, the city can consider certain possibilities of waste separation. Again, further calculations must follow, which can be done in future scientific work.
Lastly, the building types did not serve as an effective proxy for the HSW generation patterns of the inhabitants because the socioeconomic conditions of the people are not represented by the building type alone in Southeast Asian cities [61]. The fact that 87% of the buildings fall into the description of a ‘single/two-family local-type shophouse’ brings large variations regarding the waste generation and composition of these kinds of buildings as was assessed via the field surveys. To reduce these variations and uncertainties, other factors, such as socioeconomic wealth, cultural background, income, or ways of living have to be considered. This is already indicated by the different values of HSW generation in the survey areas (Figure 5). However, similar to waste generation itself, socioeconomic parameters were not available at the building or building block level, and it is hard to estimate or measure them without extensive field surveys. Therefore, we did not include them in our method, also to keep the presented approach transparent, generic, and transferable to other cities. In order to reduce the large variation regarding amount and composition of HSW within the most frequent building type, we tested the following spatial parameters as proxies for neighbourhoods with different socioeconomic attributes, which could be derived from the geospatial data: building density; distance to major roads; distance to the historic city centre; distance to hospitals and schools. Unfortunately, none of these parameters showed a significant correlation with the produced waste which could have been used to reduce the variations of HSW generation of the surveyed wards (Figure 5) or the defined building types (Figure 7). However, these tests have shown that the survey areas of the waste collection (Figure 1, red points) which are closer to the historical centre of Da Nang tend to have higher amounts of HSW, which can partly be explained by the higher density of wealthy people in this area. However, a definite conclusion on this hypothesis was not possible due to the clustered and heterogeneous spatial distribution of these survey areas. Further research should therefore place higher emphasis on this spatial component of HSW generation and its dependence on socioeconomic factors so that a more integrated relationship can be found between waste generation patterns and its contributing factors.

5. Conclusions

This study showed how empirical analyses accompanied with geospatial data analyses can lead to a better understanding of waste generation patterns in emerging metropolises in a fast, cost-effective, and adaptive way. As local authorities often lack precise and reliable information on waste generation, the proposed approach gives a more detailed image regarding the amount and composition of household solid waste generated in different building types and different parts of the cities. This information will help to develop a more effective and efficient infrastructure for recycling and waste disposal and a more sustainable use of waste as a valuable resource. The current waste collection rate of 75% show that the city is on a good way to achieve its self-declared target of 95% as part of its vision to become an environmental city [47].
Using building types as indicators to distinguish between households of high and low waste generation led to more differentiated numbers. However, it is important that the defined building types are somehow correlated to the socioeconomic status of the inhabitants. This is already challenging in Da Nang as the city largely consists of the same building type. This issue should be addressed in future studies to furthermore refine the waste generation of the ‘local-type’ building class by supplementary spatial parameters. In general, the combination of field surveys and remote sensing can help administrations of rapidly growing cities to develop a data infrastructure which is required for planning decisions. Furthermore, generated data can be updated at both regular intervals by the acquisition of new satellite images and a low price compared to time-consuming and expensive surveys at the entire city level.
This assessment of household solid waste generation and composition by building type in Da Nang, Vietnam will help to efficiently allocate resources to waste collection throughout the city, and improve the rate of waste collection. The proposed method helps to tackle the challenges that come along with urban growth regarding household solid waste. This underutilised resource offers multiple economic, environmental, and social opportunities. Having specific planning values is fundamental for following the concept of reduce, reuse, and recycle, and moving towards a circular economy [62] which is completely in line with several targets of the United Nations’ Sustainable Development Goals. With the proposed method for the assessment of household solid waste generation and composition, this study lays the foundation for more sustainable waste management and a more effective disposal infrastructure.

Author Contributions

Conceptualization, J.V.-G., A.B. and F.B.; methodology, J.V.-G., A.B., G.W. and F.B.; validation, J.V.-G., A.B. and F.B.; formal analysis, J.V.-G., A.B., G.W. and F.B.; investigation, J.V.-G., A.B., T.T.Q.B. and F.B.; resources, J.V.-G., A.B., G.W., T.T.Q.B. and F.B.; data curation, J.V.-G., A.B. and G.W.; writing—original draft preparation, J.V.-G., A.B. and F.B.; writing—review and editing, J.V.-G.; visualization, J.V.-G. and A.B.; supervision, F.B. and L.E.; project administration, A.B., F.B. and L.E.; funding acquisition, F.B. and L.E.

Funding

This research was supported by the German Ministry of Education and Research (Bundesministerium für Bildung und Forschung, BMBF) with the research project Rapid Planning, grant numbers 01LG1301J and 01LG1301K.

Acknowledgments

We acknowledge the support of AT-Verband, Stuttgart (ATV)—Association for an Advanced Socially and Environmentally Sound Technology Practice—in the preparation of the waste surveys. We also thank Edward Cahill for the language editing of the manuscript. Further thanks go to URENCO and DISED, who demonstrated their support with high human resources in every phase of data collection (questionnaire creation, surveys, waste collection and sorting, data management, provision of documents, etc.). Last, but not least, we also acknowledge the support of the local waste pickers, without whom the whole mission would not have been possible.

Conflicts of Interest

The authors declare no conflict of interest.

References

  1. United Nations. World Population Prospects: The 2017 Revision, Key Findings and Advance Tables; United Nations: New York, NY, USA, 2017. [Google Scholar]
  2. Gutberlet, J. Waste in the City: Challenges and Opportunities for Urban Agglomerations. In Urban Agglomeration; InTech: Rijeka, Croatia, 2018; ISBN 978-953-51-3897-6 or 978-953-51-3898-3. [Google Scholar] [Green Version]
  3. Climate Watch. Historical GHG Emissions. Global Historical Emissions; World Resources Institute: Washington, DC, USA, 2018; Available online: https://www.climatewatchdata.org (accessed on 6 September 2019).
  4. IPCC. Climate Change 2013—The Physical Science Basis Working Group I Contribution to the Fifth Assessment Report of the Intergovernmental Panel on Climate Change; Cambridge University Press: New York, NY, USA, 2013. [Google Scholar]
  5. UN-HABITAT. State of the Art of the World’s Cities 2012/2013—Prosperity of Cities; UN-Habitat: Nairobi, Kenya; Routledge: New York, NY, USA, 2012. [Google Scholar]
  6. Beigl, P.; Lebersorger, S.; Salhofer, S. Modelling municipal solid waste generation: A review. Waste Manag. 2008, 28, 200–214. [Google Scholar] [CrossRef] [PubMed]
  7. Kolekar, K.A.; Hazra, T.; Chakrabarty, S.N. A Review on Prediction of Municipal Solid Waste Generation Models. Procedia Environ. Sci. 2016, 35, 238–244. [Google Scholar] [CrossRef]
  8. General Statistics office of Vietnam. Preliminary Result of Vietnam Population and Housing Census 2019; General Statistics office of Vietnam: Ha Noi, Vietnam, 2019. [Google Scholar]
  9. CIESIN; IFPRI; World Bank; CIAT. Global Rural-Urban Mapping Project, Version 1 (GRUMPv1). Population Density Grid, 1st ed.; NASA Socioeconomic Data and Applications Center (SEDAC): Palisades, NY, USA, 2011. [Google Scholar]
  10. Doxsey-Whitfield, E.; MacManus, K.; Adamo, S.B.; Pistolesi, L.; Squires, J.; Borkovska, O.; Baptista, S.R. Taking Advantage of the Improved Availability of Census Data: A First Look at the Gridded Population of the World, Version 4. Pap. Appl. Geogr. 2015, 1, 226–234. [Google Scholar] [CrossRef]
  11. Dobson, J.E.; Bright, E.A.; Coleman, P.R.; Durfee, R.C.; Worley, B.A. LandScan: A Global Population Database for Estimating Populations at Risk. Photogramm. Eng. Remote Sens. 2000, 66, 849–857. [Google Scholar]
  12. Pesaresi, M.; Melchiorri, M.; Siragusa, A.; Kemper, T. Atlas of the Human Planet 2016. Mapping Human Presence on Earth with the Global Human Settlement Layer; EUR 28116 EN; Publications Office of the European Union: Luxembourg, 2016. [Google Scholar] [CrossRef]
  13. Freire, S.; Kemper, T.; Pesaresi, M.; Florczyk, A.; Syrris, V. Combining ghsl and gpw to improve global population mapping. In Proceedings of the 2015 IEEE International Geoscience and Remote Sensing Symposium (IGARSS), Milan, Italy, 26–31 July 2015; pp. 2541–2543. [Google Scholar]
  14. Lloyd, C.T.; Sorichetta, A.; Tatem, A.J. High resolution global gridded data for use in population studies. Sci. Data 2017, 4, 170001. [Google Scholar] [CrossRef] [Green Version]
  15. Tatem, A.J. WorldPop, open data for spatial demography. Sci. Data 2017, 4, 170004. [Google Scholar] [CrossRef]
  16. Palacios-Lopez, D.; Bachofer, F.; Esch, T.; Heldens, W.; Hirner, A.; Marconcini, M.; Sorichetta, A.; Zeidler, J.; Kuenzer, C.; Dech, S.; et al. New Perspectives for Improved Global Population Mapping arising from the World Settlement Footprint. Sustainability 2019. submitted. [Google Scholar]
  17. Amoah, B.; Giorgi, E.; Heyes, D.J.; van Burren, S.; Diggle, P.J. Geostatistical modelling of the association between malaria and child growth in Africa. Int. J. Health Geogr. 2018, 17, 7. [Google Scholar] [CrossRef]
  18. Dhewantara, P.W.; Mamun, A.A.; Zhang, W.Y.; Yin, W.W.; Ding, F.; Guo, D.; Hu, W.; Magalhaes, R.J.S. Geographical and temporal distribution of the residual clusters of human leptospirosis in China, 2005–2016. Sci. Rep. 2018, 8, 16650. [Google Scholar] [CrossRef]
  19. Weber, E.M.; Seaman, V.Y.; Stewart, R.N.; Bird, T.J.; Tatem, A.J.; McKee, J.J.; Bhaduri, B.L.; Moehl, J.J.; Reith, A.E. Census-independent population mapping in northern Nigeria. Remote Sens. Environ. 2018, 204, 786–798. [Google Scholar] [CrossRef]
  20. Barbier, E.B.; Hochard, J.P. Land degradation and poverty. Nat. Sustain. 2018, 1, 623–631. [Google Scholar] [CrossRef]
  21. Brown, S.; Nicholls, R.J.; Goodwin, P.; Haigh, I.D.; Lincke, D.; Vafeidis, A.T.; Hinkel, J. Quantifying Land and People Exposed to Sea-Level Rise with No Mitigation and 1.5 °C and 2.0 °C Rise in Global Temperatures to Year 2300. Earth’s Future 2018, 6, 583–600. [Google Scholar] [CrossRef]
  22. Aubrecht, C.; Özceylan, D.; Steinnocher, K.; Freire, S. Multi-level geospatial modeling of human exposure patterns and vulnerability indicators. Nat. Hazards 2012, 68, 147–163. [Google Scholar] [CrossRef]
  23. Tiecke, T.G.; Liu, X.; Zhang, A.; Gros, A.; Li, N.; Yetman, G.; Kilic, T.; Murray, S.; Blankespoor, B.; Prydz, E.B.; et al. Mapping the world population one building at a time. arXiv 2017, arXiv:1712.05839, 1–15. [Google Scholar]
  24. Grippa, T.; Linard, C.; Lennert, M.; Georganos, S.; Mboga, N.; Vanhuysse, S.; Gadiaga, A.; Wolff, E. Improving Urban Population Distribution Models with Very-High Resolution Satellite Information. Data 2019, 4, 13. [Google Scholar] [CrossRef]
  25. Mossoux, S.; Kervyn, M.; Soulé, H.; Canters, F. Mapping Population Distribution from High Resolution Remotely Sensed Imagery in a Data Poor Setting. Remote Sens. 2018, 10, 1409. [Google Scholar] [CrossRef]
  26. Mahabir, R.; Croitoru, A.; Crooks, A.; Agouris, P.; Stefanidis, A. A Critical Review of High and Very High-Resolution Remote Sensing Approaches for Detecting and Mapping Slums: Trends, Challenges and Emerging Opportunities. Urban Sci. 2018, 2, 8. [Google Scholar] [CrossRef]
  27. Lung, T.; Lübker, T.; Ngochoch, J.K.; Schaab, G. Human population distribution modelling at regional level using very high resolution satellite imagery. Appl. Geogr. 2013, 41, 36–45. [Google Scholar] [CrossRef]
  28. Wang, S.; Tian, Y.; Zhou, Y.; Liu, W.; Lin, C. Fine-Scale Population Estimation by 3D Reconstruction of Urban Residential Buildings. Sensors 2016, 16, 1755. [Google Scholar] [CrossRef]
  29. Steinnocher, K.; de Bono, A.; Chatenoux, B.; Tiede, D.; Wendt, L. Estimating urban population patterns from stereo-satellite imagery. Eur. J. Remote Sens. 2019, 52, 12–25. [Google Scholar] [CrossRef] [Green Version]
  30. Tomás, L.; Fonseca, L.; Almeida, C.; Leonardi, F.; Pereira, M. Urban population estimation based on residential buildings volume using IKONOS-2 images and lidar data. Int. J. Remote Sens. 2015, 37, 1–28. [Google Scholar] [CrossRef] [Green Version]
  31. Xie, J.; Zhou, J. Classification of Urban Building Type from High Spatial Resolution Remote Sensing Imagery Using Extended MRS and Soft BP Network. IEEE J. Sel. Top. Appl. Earth Obs. Remote Sens. 2017, 10, 3515–3528. [Google Scholar] [CrossRef]
  32. Bachofer, F.; Braun, A.; Adamietz, F.; Murray, S.; d’Angelo, P.; Kyazze, E.; Mumuhire, A.P.; Bower, J. Building Stock and Building Typology of Kigali, Rwanda. Data 2019, 4, 105. [Google Scholar] [CrossRef]
  33. Talent, M. Improving estimates of occupancy rate and population density in different dwelling types. Environ. Plan. B Urban Anal. City Sci. 2017, 44, 802–818. [Google Scholar] [CrossRef]
  34. Geiß, C.; Aravena Pelizari, P.; Marconcini, M.; Sengara, W.; Edwards, M.; Lakes, T.; Taubenböck, H. Estimation of seismic building structural types using multi-sensor remote sensing and machine learning techniques. ISPRS J. Photogramm. Remote Sens. 2015, 104, 175–188. [Google Scholar] [CrossRef]
  35. Tusting, L.S.; Bisanzio, D.; Alabaster, G.; Cameron, E.; Cibulskis, R.; Davies, M.; Flaxman, S.; Gibson, H.S.; Knudsen, J.; Mbogo, C.; et al. Mapping changes in housing in sub-Saharan Africa from 2000 to 2015. Nature 2019, 568, 391–394. [Google Scholar] [CrossRef]
  36. Jones, R.V.; Lomas, K.J. Determinants of high electrical energy demand in UK homes: Socio-economic and dwelling characteristics. Energy Build. 2015, 101, 24–34. [Google Scholar] [CrossRef] [Green Version]
  37. Singh, A. Remote sensing and GIS applications for municipal waste management. J. Environ. Manag. 2019, 243, 22–29. [Google Scholar] [CrossRef]
  38. Anilkumar, P.P.; Chithra, K. Land Use Based Modelling of Solid Waste Generation for Sustainable Residential Development in Small/Medium Scale Urban Areas. Procedia Environ. Sci. 2016, 35, 229–237. [Google Scholar] [CrossRef]
  39. Xiao, L.; Lin, T.; Chen, S.; Zhang, G.; Ye, Z.; Yu, Z. Characterizing Urban Household Waste Generation and Metabolism Considering Community Stratification in a Rapid Urbanizing Area of China. PLoS ONE 2015, 10, e0145405. [Google Scholar] [CrossRef]
  40. Vieira, V.; Matheus, D.R. The impact of socioeconomic factors on municipal solid waste generation in Sao Paulo, Brazil. Waste Manag. Res. 2018, 36, 79–85. [Google Scholar] [CrossRef] [PubMed]
  41. Zia, A.; Batool, S.; Chauhdry, M.; Munir, S. Influence of Income Level and Seasons on Quantity and Composition of Municipal Solid Waste: A Case Study of the Capital City of Pakistan. Sustainability 2017, 9, 1568. [Google Scholar] [CrossRef]
  42. Jadoon, A.; Batool, S.A.; Chaudhry, M.N. Assessment of factors affecting household solid waste generation and its composition in Gulberg Town, Lahore, Pakistan. J. Mater. Cycles Waste Manag. 2014, 16, 73–81. [Google Scholar] [CrossRef]
  43. Trang, P.T.T.; Dong, H.Q.; Toan, D.Q.; Hanh, N.T.X.; Thu, N.T. The Effects of Socio-economic Factors on Household Solid Waste Generation and Composition: A Case Study in Thu Dau Mot, Vietnam. Energy Procedia 2017, 107, 253–258. [Google Scholar] [CrossRef]
  44. General Statistics office of Vietnam. Statistical Yearbook of Vietnam 2018; General Statistics office of Viet Nam: Ha Noi, Vietnam, 2018. [Google Scholar]
  45. World Bank. Vietnam Urbanization Review; Technical Assistance Report; The World Bank in Vietnam: Hanoi, Vietnam, 2011. [Google Scholar]
  46. Dong, N.; Da Nang Residents Block Garbage Dump to Demand Its Relocation. VNExpress International 8 July 2019. Available online: https://e.vnexpress.net/news/news/da-nang-residents-block-garbage-dump-to-demand-its-relocation-3949341.html (accessed on 9 September 2019).
  47. Department of Natural Resources and Environment. Report on 10 Years Implementation of “Developing Da Nang—An Environmental City”; Department of Natural Resources and Environment: Da Nang, Vietnam, 2019. [Google Scholar]
  48. Da Nang People’s Committee. Solid Wastes Treatment Planning for Da Nang to 2030, Vision to 2050; Da Nang People’s Committee: Da Nang, Vietnam, 2016. [Google Scholar]
  49. Brunette, W.; Sundt, M.; Dell, N.; Chaudhri, R.; Breit, N.; Borriello, G. Open Data Kit 2.0: Expanding and refining information services for developing region. In Proceedings of the 14th Workshop on Mobile Computing Systems and Applications, Jekyll Island, GA, USA, 26–27 February 2013; p. 10. [Google Scholar]
  50. Weichelt, H.; Rosso, P.; Marx, A.; Reigber, S.; Douglass, K.; Heynen, M. White Paper: The RapidEye Red Edge Band 2014; Blackbridge: Berlin, Germany, 2014. [Google Scholar]
  51. Da Nang People’s Committee. Adjustment of Master Plan for Development of Da Nang City to 2030, Vision to 2050; Da Nang People’s Committee: Da Nang, Vietnam, 2012. [Google Scholar]
  52. Warth, G.; Braun, A.; Bödinger, C.; Hochschild, V.; Bachofer, F. DSM-based identification of changes in highly dynamic urban agglomerations. Eur. J. Remote Sens. 2019, 52, 322–334. [Google Scholar] [CrossRef] [Green Version]
  53. Brassel, K.E.; Reif, D. A procedure to generate Thiessen polygons. Geogr. Anal. 1979, 11, 289–303. [Google Scholar] [CrossRef]
  54. Israel, G.D. Determing Sample Size: Fact Sheet PEOD-6; University of Florida: Gainesville, FL, USA, 1992. [Google Scholar]
  55. Thai, N.T.K. Municipal Solid Waste Management in Vietnam Challenges and Solutions. In Municipal Solid Waste Management in Asia and the Pacific Islands: Challenges and Strategic Solutions; Pariatamby, A., Tanaka, M., Eds.; Springer: Singapore, 2014; ISBN 978-981-4451-72-7. [Google Scholar]
  56. Otoma, S.; Hoang, H.; Hong, H.; Miyazaki, I.; Diaz, R. A survey on municipal solid waste and residents’ awareness in Da Nang city, Vietnam. J. Mater. Cycles Waste Manag. 2013, 15, 187–194. [Google Scholar] [CrossRef]
  57. Thanh, N.P.; Matsui, Y.; Fujiwara, T. Household solid waste generation and characteristic in a Mekong Delta city, Vietnam. J. Environ. Manag. 2010, 91, 2307–2321. [Google Scholar] [CrossRef]
  58. Ferraro, A.; Massini, G.; Mazzurco Miritana, V.; Signorini, A.; Race, M.; Fabbricino, M. A simplified model to simulate bioaugmented anaerobic digestion of lignocellulosic biomass: Biogas production efficiency related to microbiological data. Sci. Total Environ. 2019, 691, 885–895. [Google Scholar] [CrossRef]
  59. Kuo, J.; Dow, J. Biogas production from anaerobic digestion of food waste and relevant air quality implications. J. Air Waste Manag. Assoc. 2017, 67, 1000–1011. [Google Scholar] [CrossRef]
  60. Uçkun Kiran, E.; Trzcinski, A.P.; Ng, W.J.; Liu, Y. Bioconversion of food waste to energy: A review. Fuel 2014, 134, 389–399. [Google Scholar] [CrossRef]
  61. Downes, N.K.; Storch, H.; Schmidt, M.; Van Nguyen, T.C.; Tran, T.N. Understanding Ho Chi Minh City’s urban structures for urban land-use monitoring and risk-adapted land-use planning. In Sustainable Ho Chi Minh City: Climate Policies for Emerging Mega Cities; Springer International Publishing AG: Cham, Switzerland, 2016; pp. 89–116. [Google Scholar]
  62. Schneider, P.; Anh, L.; Wagner, J.; Reichenbach, J.; Hebner, A. Solid Waste Management in Ho Chi Minh City, Vietnam: Moving towards a Circular Economy? Sustainability 2017, 9, 286. [Google Scholar] [CrossRef]
Figure 1. Study area: Da Nang, its districts (white lines, small labels) and neighbouring provinces (bright areas, large labels). The points of the data collection (Section 2.2) are shown by blue (building types, n = 802). and red (waste, n = 120) marks. The black dashed line indicates the extent of the very-high-resolution (VHR) satellite image (Section 2.2.3).
Resources 08 00171 g001
Figure 2. Identification of building geometries and building types in Da Nang.
Resources 08 00171 g002
Figure 3. Extraction of buildings from satellite imagery. (A) Original satellite imagery and cadastral boundaries (green lines, only available for parts of the city). (B) Built-up areas automatically extracted from the image indicated by blue shading. (C) Identification of single buildings (red lines) in areas with and without cadastral data. The blue marks indicate the manually digitised centroids of each identified building which were used to construct the outlines.
Resources 08 00171 g003
Figure 4. Impressions of the waste survey: (A) weighing, (B) collecting, (C) sorting, and (D) labelling.
Resources 08 00171 g004
Figure 5. Generation rate of household solid waste (HSW) in 12 exemplary wards in Da Nang. Note: Outliers above 1200 have been omitted in the figure.
Resources 08 00171 g005
Figure 6. Composition of HSW in 12 exemplary wards in Da Nang.
Resources 08 00171 g006
Figure 7. Generation rate of HSW by building type in Da Nang. Note: Outliers above 1200 have been omitted in the figure.
Resources 08 00171 g007
Figure 8. Composition of HSW by building type in Da Nang.
Resources 08 00171 g008
Table 1. Area, population, and population density in Da Nang by district [44].
Average PopulationAreaPopulation Density
District20142015201620172018 1km22018 (ppl/km2)
Liên Chiểu 154,893 158,239 162,297 166,833 180,293 74.522419
Thanh Khê 188,110 190,493 191,359 191,245 186,676 9.4719,712
Hải Châu 206,536 209,221 211,829 213,568 203,691 23.298746
Sơn Trà 148,712 153,631 159,536 166,262 157,184 63.392480
Ngũ Hành Sơn 74,868 76,120 77,747 80,255 87,260 40.192171
Cẩm Lệ 106,383 108,485 111,361 114,266 133,813 35.853733
Hòa Vang 128,151130,582131,125 131,641 131,827733.17180
Hoàng Sa-----305.00-
Total1,007,653 1,026,771 1,045,254 1,064,070 1,080,744 1284.88841
1 preliminary.
Table 2. Generation of municipal solid waste in Da Nang by district in tonnes (collection rate) [48].
No.Areas201120132015
IUrban272,459(85%)276,866(87%)314,027(76%)
1Hải Châu82,443(90%)78,619(92%)96,104(93%)
2Thanh Khê6258(89%)59,022(91%)72,439(91%)
3Cẩm Lệ2858(72%)30,731(74%)35,901(75%)
4Liên Chiểu3134(88%)35,059(93%)40,035(94%)
5Sơn Trà43,715(80%)4804(82%)59,534(82%)
6Ngũ Hành Sơn23,801(70%)25,396(74%)31,613(74%)
IISuburban15,716(53%)16,267(63%)21,599(66%)
Total288,175(83%)293,134(85%)335,626(75%)
Table 3. Identified building types with descriptions and statistics as collected in the surveys.
IDBuilding Type Name and StatisticsDescriptionRepresentative Reference Picture
1Single family basic type (n = 101)
average (standard deviation) of:
height: 2.3 m (2.6 m)
size 1: 57.7 m2 (39.1 m2)
length 1: 16.5 m (13.2 m)
width 1: 8.0 m (7.2 m)
persons/household 2: 4.3 (0.9)
Detached housing, with a mix of residential and commercial use. Low-rise with 1–2 floors. Comprised of wood, brickwork, and reinforced concrete, tin roof. Often located along small alleyways or in peri-urban locations. Resources 08 00171 i001
2Single/two-family local-type shophouse (n = 609)
average (standard deviation) of:
height: 3.9 m (3.1 m)
size 1: 85.1 m2 (60.3 m2)
length 1: 16.4 m (7.0 m)
width 1: 7.2 m (4.2 m)
persons/household 2: 5.8 (2.4)
Typical building type in Da Nang. Detached/semidetached/terraced shophouse. It is a 2–5 storey urban building, which allows a shop or other public activity at the street level, with residential accommodation on the upper floors. Resources 08 00171 i002
3Single/two-family bungalow type (n = 91)
average (standard deviation) of:
height: 4.0 m (1.5 m)
size 1: 101.6 m2 (55.4 m2)
length 1: 25.1 m (16.8 m)
width 1: 14.5 m (9.1 m)
persons/household 2: 4.7 (2.4)
Single family detached dwelling, low-rise 2–3 floors, built from brickworks and concrete, located in new urban districts. Resources 08 00171 i003
4Single/two-family villa-type
(n = 49)
average (standard deviation) of:
height: 5.1 m (3.7 m)
size 1: 211.8 m2 (174.1 m2)
length 1: 21.8 m (8.5 m)
width 1: 13.1 m (5.3 m)
persons/household 2: 4.3 (1.6)
Mostly single-family detached dwelling, sometimes 2–3 attached multifamily buildings, low rise, 2–4 floors, built from brickwork or concrete, located in newly developed urban areas. Resources 08 00171 i004
5Multifamily apartments, local-type (n = 58)
average (standard deviation) of:
height: 5.5 m (4.8 m)
size 1: 346.2 m2 (249.1 m2)
length 1: 30.3 m (14.1 m)
width 1: 14.6 m (7.3 m)
persons/household 2: 5.0 (1.8)
Multistorey/multi-unit apartments with more than three units. A commercial and/or public usage is possible. Traditional style of construction and local inhabitants. Resources 08 00171 i005
6 Multi-family apartments, modern type (n = 33)
average (standard deviation) of:
height: 8.3 m (10.0 m)
size 1: 854 m2 (1517.9 m2)
length 1: 43.4 m (28.3 m)
width 1: 23.8 m (19.4 m)
persons/household 3: -
Multistorey/multi-unit apartments with more than three units. Modern style of construction. This class only contains hotels and other mixed-use commercial buildings with non-local residents. Resources 08 00171 i006
7Hall (n = 16)
average (standard deviation) of:
height: 5.1 m (3.8 m)
size 1: 917.6 m2 (1654.0 m2)
length 1: 44.3 m (31.4 m)
width 1: 22.8 m (15.8 m)
persons/household 3: -
Large buildings with one to multiple storeys, non-residential use. Mostly markets, warehouses, or industrial buildings. Resources 08 00171 i007
8Outbuilding/shack (n = 5)
average (standard deviation) of:
height: 2.3 m (2.7 m)
size 1: 94.0 m2 (144.8 m2)
length 1: 16.8 m (17.0 m)
width 1: 7.9 m (4.6 m)
persons/household 3: -
A small, often rundown, non-residential building or an outbuilding with non-residential usage (e.g., storage, bicycle racks). Resources 08 00171 i008
9Special structure/other (n = 13)
average (standard deviation) of:
height: 5.4 m (5.0 m)
size 1: 552.1 m2 (928 m2)
length 1:39.3 m (24.0 m)
width 1: 22.1 m (14.8 m)
persons/household 3: -
Wide range of built-up structures with a predominant non-residential use. Resources 08 00171 i009
1 as retrieved from the footprints of the surveyed buildings as described in Section 2.3; 2 as retrieved from the waste data collection; 3 not assessed within the waste data collection
Table 4. Household solid waste types.
Waste FractionSub-FractionWaste FractionSub-FractionWaste Fraction
Organic:Kitchen wasteGlass:Packaging Wood
Garden wasteNon-packaging Textiles
PaperPlastic:Packaging Ceramics/porcelain/mineral waste
CardboardNon-packaging Hygiene products
Composite packaging Metals:Packaging Hazardous wastes
Hygienic paperNon-packaging Electronic scrap
other
Table 5. Number and share of building types in Da Nang and corresponding error rates.
IDBuilding Type Short NameNumber and Share of BuildingsError of OmissionError of Commission
1single basic1440 (0.5%)23.1%7.4%
2single local273,314 (87.2%) 0.7%6.5%
3single bungalow19,759 (7.3%)27.6%25.0%
4single villa2135 (0.8%)33.3%3.8%
5multi local1107 (0.4%)22.6%8.9%
6multi modern160 (0.1%)18.2%0.1%
7hall4820 (1.8%)31.3%35.5%
8outbuilding2432 (0.9%)20.0%33.3%
9special3066 (1.1%)36.4%56.3%
Table 6. Definition of variables to estimate HSW generation on city level.
Variable NameSymbolUnit of MeasureDefinition
Building type   b -Definition of the building types according to Table 3
Buildings x b AmountNumber of buildings within the city boundaries
Generation rate y b f g × cap−1 × day−1Arithmetic mean of HSW generation per capita per day of each fraction (kitchen waste, garden waste, paper, etc.)
Household size z b Persons/householdArithmetic mean of number of residents per household depending on the building type
Table 7. Building types per district and estimation of HSW generation in Da Nang.
#Building TypeCẩm Lệ Hải ChâuHòa VangLiên ChiểuNgũ Hành Sơn Sơn Trà Thanh KhêTotal
1single basic199 28 472 212 356 35 138 1440
2single local25,252 43,206 28,286 42,751 23,180 31,491 43,148 237,314
3single bungalow200 171 17,065 1145 828 307 43 19,759
4single villa170 225 135 471 643 367 124 2135
5multi local85 184 181 262 120 203 72 1107
6multi modern12 29 16 13 41 47 2 160
7hall345 567 1073 1554 446 668 167 4820
8outbuilding155 222 284 732 494 356 189 2432
9special126 571 1017 469 289 394 200 3066
sum of buildings26,544 45,203 48,529 47,609 26,397 33,868 44,083 272,233
HSW generation (t/day)31 52 46 53 29 38 52 301
HSW generation (t/year)11,171 18,996 16,819 19,243 10,727 14,033 18,856 109,844
Table 8. Average composition of HSW in Da Nang on district and city level.
Waste FractionSubfractionCẩm Lệ Hải ChâuHòa VangLiên ChiểuNgũ Hành Sơn Sơn Trà Thanh KhêCity AverageHSW Generation (t/year)
Organic:Kitchen waste65.03%65.26%53.53%64.46%64.00%65.02%65.35%62.90%69,088.51
Garden waste0.97%0.95%1.38%1.04%1.25%1.04%0.92%1.08%1182.95
Paper1.18%1.17%1.82%1.21%1.24%1.18%1.17%1.30%1428.26
Cardboard1.01%1.00%1.20%1.02%1.02%1.01%1.00%1.04%1145.35
Composite packaging 1.04%1.03%1.39%1.05%1.06%1.04%1.03%1.10%1211.40
Hygienic paper0.19%0.19%0.16%0.19%0.20%0.20%0.19%0.19%206.83
Glass:Packaging 0.88%0.82%1.15%0.87%0.95%0.82%0.84%0.91%999.25
Non-packaging 0.46%0.45%0.44%0.45%0.46%0.45%0.46%0.45%498.40
Plastic:Packaging 16.83%16.79%18.83%16.91%16.94%16.81%16.78%17.19%18,880.93
Non-packaging 0.09%0.09%0.05%0.09%0.10%0.09%0.09%0.08%92.79
Metals:Packaging 0.47%0.45%0.46%0.47%0.50%0.46%0.46%0.46%510.75
Non-packaging 0.06%0.06%0.04%0.06%0.06%0.06%0.06%0.06%66.20
Wood0.16%0.16%0.13%0.16%0.16%0.16%0.16%0.16%171.16
Textiles1.51%1.51%2.04%1.54%1.53%1.51%1.51%1.61%1768.00
Ceramics/porcelain/mineral waste0.28%0.27%0.66%0.29%0.30%0.28%0.27%0.35%381.27
Hygiene products6.59%6.55%13.42%6.94%6.99%6.65%6.48%7.87%8648.19
Hazardous wastes0.03%0.03%0.12%0.03%0.04%0.03%0.03%0.05%51.04
Electronic scrap0.28%0.28%0.26%0.28%0.27%0.28%0.28%0.28%304.50
Other2.92%2.91%2.90%2.91%2.91%2.90%2.91%2.91%3194.72
Total 100%100%100%100%100%100%100%100%109,843.81

