Iceland, an Open-Air Museum for Geoheritage and Earth Science Communication Purposes


1
Department of Human and Innovation Sciences, Insubria University, Via S. Abbondio 12, 22100 Como, Italy
2
Department of Earth and Environmental Sciences, University of Milan Bicocca, Piazza della Scienza 1, 20126 Milan, Italy
3
CRUST-Interuniversity Center for 3D Seismotectonics with Territorial Applications, 66100 Chieti Scalo, Italy
4
Department of Biological, Geological and Environmental Sciences, Bologna University, Via Zamboni 67, 40126 Bologna, Italy
*
Author to whom correspondence should be addressed.
Resources 2020, 9(2), 14; https://0-doi-org.brum.beds.ac.uk/10.3390/resources9020014
Submission received: 7 December 2019
/
Revised: 14 January 2020
/
Accepted: 28 January 2020
/
Published: 2 February 2020
(This article belongs to the Special Issue Geoheritage and Geotourism Resources)
Abstract
:Iceland is one of the most recognizable and iconic places on Earth, offering an unparalleled chance to admire the most powerful natural phenomena related to the combination of geodynamic, tectonic and magmatic forces, such as active rifting, volcanic eruptions and subvolcanic intrusions. We have identified and selected 25 geosites from the Snæfellsnes Peninsula and the Northern Volcanic Zone, areas where most of the above phenomena can be admired as they unfold before the viewers’ eyes. We have qualitatively assessed the selected volcano–tectonic geosites by applying a set of criteria derived from previous studies and illustrated them through field photographs, unmanned aerial vehicle (UAV)-captured images and 3-D models. Finally, we have discussed and compared the different options and advantages provided by such visualization techniques and proposed a novel, cutting-edge approach to geoheritage promotion and popularization, based on interactive, navigable Virtual Outcrops made available online.
1. Introduction
Geological heritage, better known as geoheritage, has been discussed and reviewed in a number of papers published over the last two decades [1,2,3,4,5,6,7]. Another key concept is geodiversity, which can be defined as “the variety of rocks, minerals, fossils, landforms, sediments and soils, together with the natural processes which form and alter them” [8]. Geoheritage comprises elements of geodiversity, which have scientific, cultural, educational value and can be promoted, popularized and protected through geoscience museums [9,10,11], geoparks [12,13,14] and geotourism [15,16,17,18,19].
The conservation of geoheritage, aimed at preserving the natural diversity of significant geological and geomorphological features, is a key activity documented and reviewed in a number of works [20,21,22,23,24].
Geoheritage is tightly associated with geological heritage sites, or geosites. These may preliminarily be defined as those parts of the geosphere that are important in terms of the understanding of Earth’s history; as far as their social relevance is concerned, they can be regarded as geological or geomorphological objects that may have a scientific, cultural, historical, aesthetic, social and economic value [25]. According to other works [26,27] on this topic, geosites are “geological objects or fragments of the geological environment exposed on the land surface, thus, accessible for visits and studies”. As both geology and geomorphology are included within the concepts of geodiversity, geoheritage and geoconservation, geosites encompass both geological and geomorphological features [28].
The most thorough classification of geosites was proposed in a milestone paper [29], in which the biological natural heritage was subdivided into the following categories: geological, geomorphological, structural, tectonic, mineralogical, paleontological, petrographic, sedimentological, stratigraphical and others. Complex geosites are a combination of two or more of the above categories. Geosites may be single outcrops, caves, quarries, mines, individual volcanic landforms and tectonic structures [27]. Based on their importance, they can be of global, national, regional or local relevance [30]. Geosites can be further classified [26] in terms of their spatial appearance (circumscribed sites like outcrops, linear features and aerially extended features such as peaks) and their dynamic state (inactive features/processes vs. active ones).
Over the last two decades, several authors have attempted to qualitatively and quantitatively assess the quality of geosites using a range of criteria. Most assessment efforts make reference to the scientific value [31]. This is made up of four subcriteria: rarity, representativeness, integrity [4,29,32] and also the level of current scientific knowledge about the geosite, reflected by the existence of published scientific studies [7]. Representativeness pertains to the exemplarity of a geosite in terms of the geological processes (active or inactive) represented there. Rarity is related to the uncommonness of the geosite at the regional or global level [32].
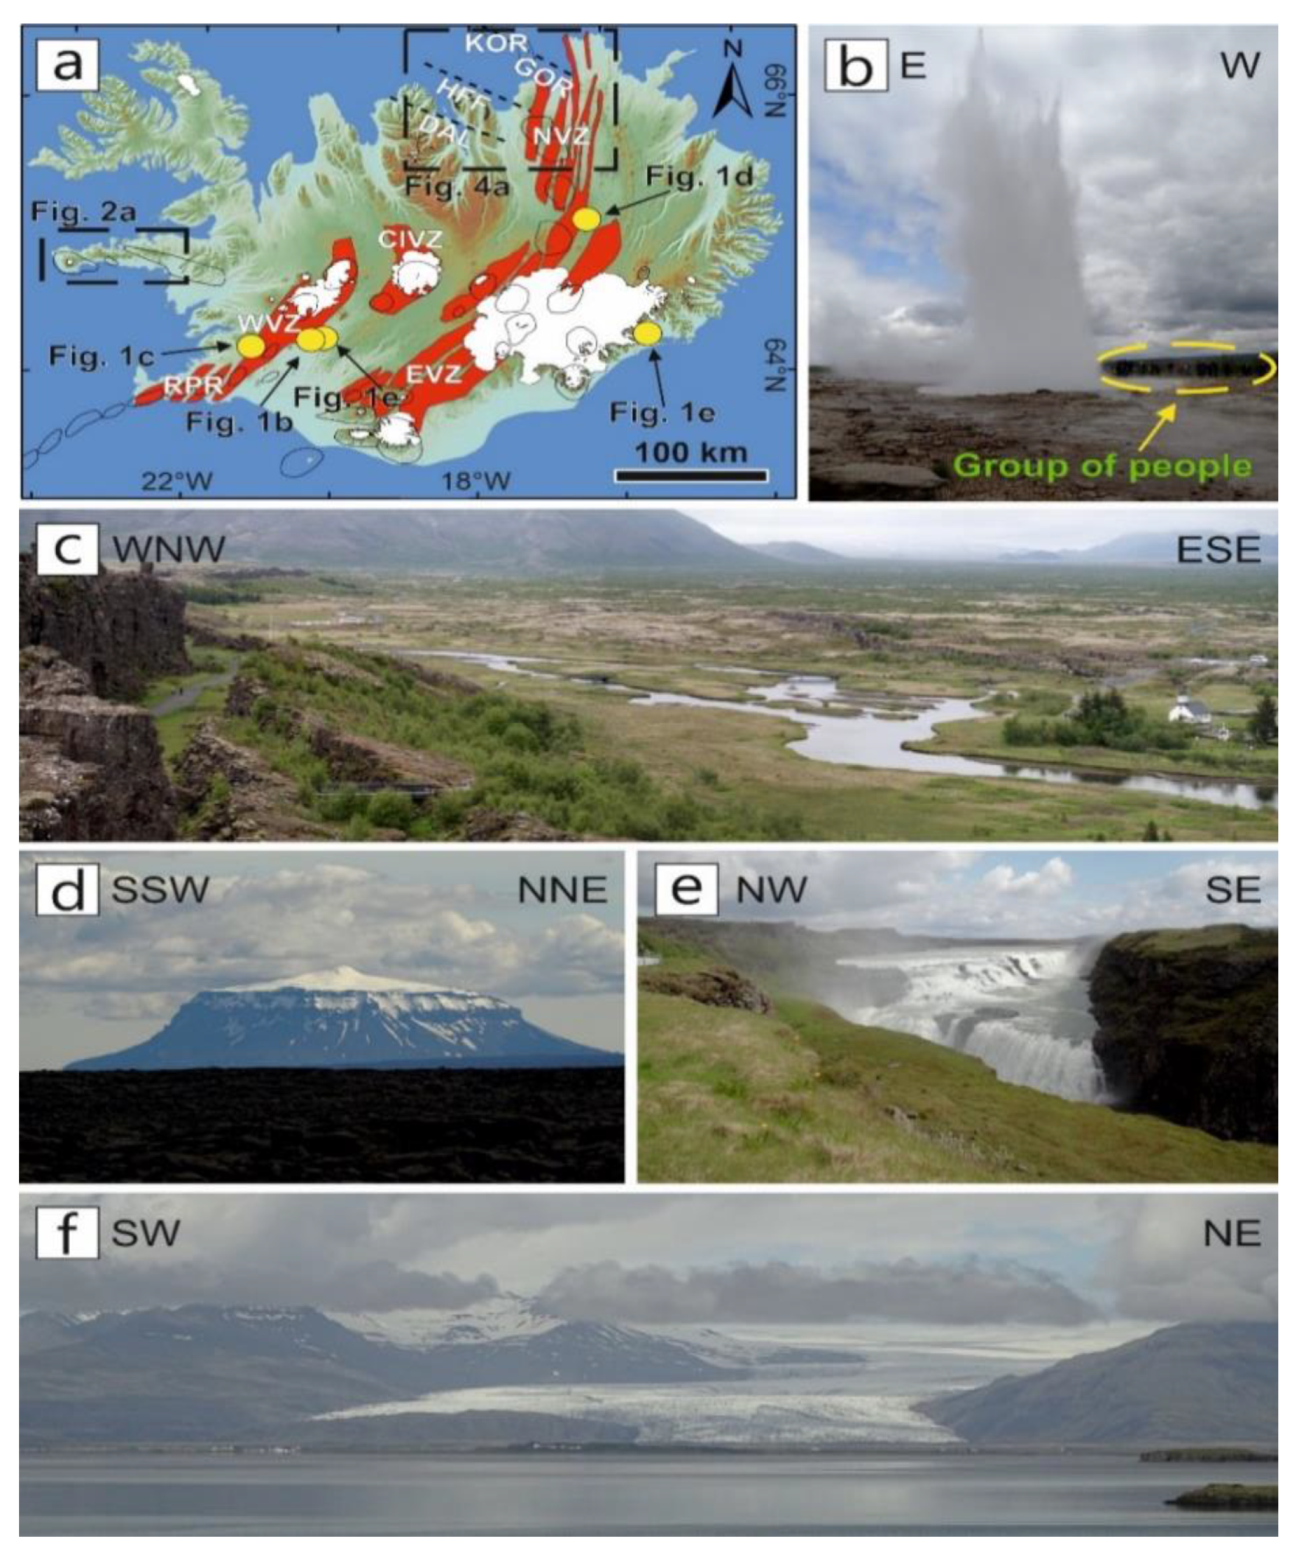
In addition to the scientific value, other values, defined as “additional” [33,34], can be individuated and assessed: ecological, cultural, aesthetic, economic and educational. The cultural value is composed of four subcriteria: religious, historical, artistic or literary and geohistorical importance [32]. Among the above additional values, particularly worthy of mention is the educational one, which may be defined [7] as the combination of the following elements: didactic relevance (how easily a geosite’s features might be understood by nonexperts), accessibility, safety and current exploitation of the geosite for education-related activities (excursions and guided tours). Moving on to the description of the area we selected for our work, Iceland (Figure 1a) is widely regarded as a natural laboratory, offering a seemingly endless variety of geosites. They include places where geothermal-related phenomena can be admired (geyser eruptions at Geysir, Figure 1b) and major landforms, such as presently active rift zones (the Thingvellir, majestic rift valley in SW Iceland, Figure 1c) and table mountains (e.g., the impressive Herdubreid, Figure 1d) and fluvial features like waterfalls (Gulfoss in SW Iceland, Figure 1e) and gigantic glaciers (such as Vatnajökull, the largest glacier in Europe, Figure 1f). Most of the above geological objects have a specific geoheritage-related importance and, at the same time, can be used for geoscience education and communication. Thanks to its stunning variety of volcanic, tectonic, fluvial and glacial features, of which the ones above are only a tiny, although meaningful, portion, Iceland is one of the top locations for geotourism at the worldwide level [35]. As geotourism may have profound impacts on the geodiversity of the country, awareness is being raised among the local scientific community about the need to strengthen geoconservation and foster sustainable geotourism. This may be accomplished through the establishment of new geoparks [36], following the example of the two UNESCO Global Geoparks (UGGp), Katla and Reykjanes, already present in the country. In this regard, among the recent events aimed at promoting geoconservation policies and values in Iceland, particularly worthy of mention is the VIII International ProGEO Symposium held in Reykjavík in September 2015 [37].
This paper is aimed at illustrating two major Icelandic geoheritage areas and showing their relevance for geosite popularization and promotion, as well as for educational and geoscience communication goals. We have selected these particular locations because, having carried out scientific research there over the last decade, we have had a chance, during our numerous field surveys, to work at hundreds of sites that may be considered relevant in terms of geoheritage. The two areas are (Figure 1a): A) the Snaefellsnes Peninsula (Figure 2 and Figure 3), comprising the world-famous Snæfellsjökull volcano, well-exposed subvolcanic bodies and related sheet swarms, as well as tectonically guided alignments of Holocene volcanic cones and B) the Northern Volcanic Zone (NVZ, Figure 4), where the following volcano–tectonic elements can be observed: (i) a textbook example of a triple–junction interaction between an onshore transform fault and an active rift system; (ii) the Theystareykir Fissure Swarm (ThFS), an active rift zone characterized by a central volcano, several major faults and a great number of eruptive fissures and (iii) the Krafla Fissure Swarm (KFS), another major rift zone also marked by the diffuse presence of eruptive fissures and dominated by the active Krafla Volcano.
With the purpose of showcasing a total of 25 geosites selected in the two areas, we made use of the following tools: (i) field photographs, some of which have been reworked by highlighting the most relevant features [6]; (ii) highly detailed images, captured by unmanned aerial vehicles (UAVs) and (iii) 3-D models of field outcrops, based on individual, UAV-captured pictures, further elaborated by using Structure-from-Motion photogrammetry techniques (SfM). The importance of UAV-based techniques as innovative and helpful tools for Earth Science research has been widely demonstrated in the last decade, as documented by Bonali et al. [39] and Fallati et al. [40].
Moreover, we have qualitatively evaluated the identified geosites by using three of the above cited criteria (scientific, cultural and educational) wherever they could be applied; such criteria were considered as most suitable for enabling us to carry out a preliminary, and by no means exhaustive, assessment. In two instances, we attempted to judge the aesthetic value as well. We need to point out that no attempt has been made to make a numerical assessment, as opposed to what has been done in other works [4,18,19,32,33], which were exclusively focused on the evaluation of geosites and geomorphosites.
2. Geological Setting of the Two Selected Areas
Iceland is the result of the combination of hot spot and mid-ocean ridge magmatism [41,42,43,44]. Its geological setting is characterized by the widespread presence of Neogene and Pleistocene basalts, bordering the active rift system that cuts through the island from SW to NNE (Figure 1a). All eruptions that occur on the island are associated with volcanic systems [45], which are made of swarms of faults, extension fractures and basaltic volcanoes; all have been formed due to plate–pull-induced mid-oceanic ridge activity and also as a result of magma upwelling from the Icelandic mantle plume. There are 30 presently-active volcanic systems, 40–150 km long and 5–20 km wide; all host central volcanic edifices. Analogous systems, nowadays extinct, are found in Iceland’s eroded Neogene and Pleistocene lava successions; 15 of these have been mapped and about 40 have been identified and located [45]. Extinct systems provide crucial information that, in turn, enables gaining insight into the possible 3-D structure and evolution of presently active ones and interpreting their dynamics. The following sections provide a brief geological and tectonic background on the two areas selected for their geoheritage-related importance, as well as for their suitability for geoscience communication purposes.
2.1. The Snaefellsnes Peninsula
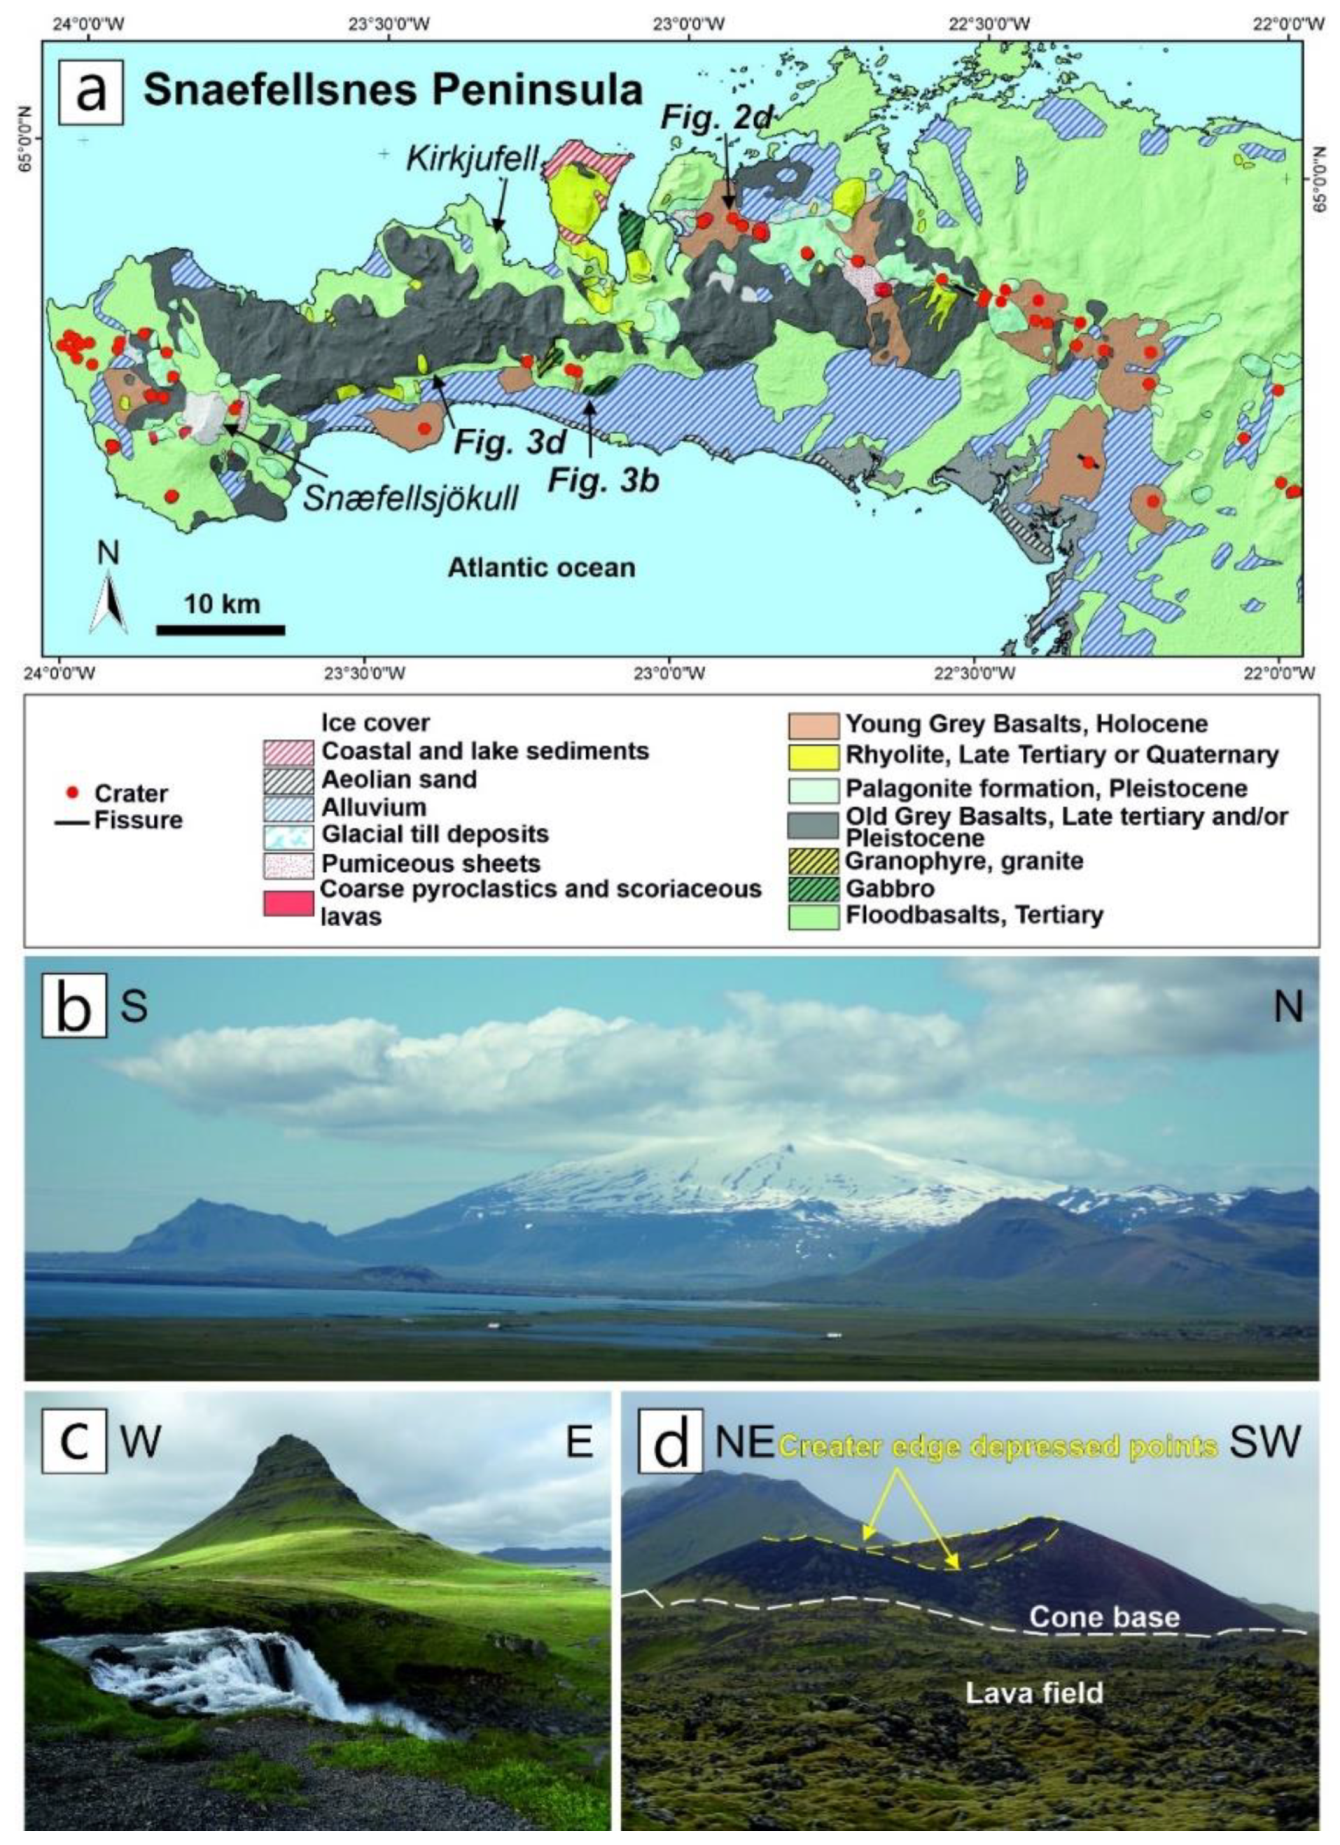
The 80-km-long and 10–30-km-wide Snaefellsnes Peninsula (Figure 2a) is home to three volcanic systems: (1) Snæfellsjökull Volcano (Figure 2b) on the peninsula’s westernmost tip, whose last eruptions are dated to 1750 BP; (2) the Lýsuhóll volcanic system, active in Holocene times and (3) the Ljósufjöll volcanic center, the easternmost of the three volcanic systems, with the latest eruptions dating back to 960 AD [46].
The rock successions cropping out across the peninsula are mainly basaltic lavas and palagonites, with ages ranging from the late Neogene to Holocene times (Figure 2a).
The effects of glacial erosion have unveiled three extinct magmatic complexes: the Midhyrna and Lysuskard intrusions near the peninsula’s southern coastline and the Kolgrafarmùli intrusion along its northern side; all intrusions were injected into Neogene basalts (Figure 2a). A fairly recent paper [47] focused on the central and eastern sector of Snaefellsnes, providing a detailed structural description of vertical dykes, inclined sheets and two shallow magma bodies; respectively, the Midhyrna gabbroic intrusion and the Lysuskard granophyric one (Figure 3).
2.2. The Northern Volcanic Zone
The Northern Volcanic Zone (NVZ) has been active since 8–9 Ma [48,49] and is composed of the following five N–S-striking rift zones (also called “fissure swarms”): Theystareykir, Krafla, Fremrinámar, Askja, and Kverkfjoll (Figure 4a). Each of these active rifts is made of 5–20-km-wide and 60–100-km-long swarms of extension fractures, dip–slip faults and a main volcano.
The Theystareykir Fissure Swarm (ThFS, Figure 4) is 10-km-wide and is cut by several N–S-striking normal faults (some with decametric dip–slip offsets) and by a huge number of extension fractures; it is also marked by the presence of the Theistareykjaburnga shield volcano [50,51]. The most prominent tectonic structure in the ThFS is the Gudfinnugja Fault (GF), a Holocene dip–slip fault that represents the westernmost edge of the rift system. This active rift zone is extensively covered by lava flows from Theistareykjaburnga, dated to about 14.5 ka BP [52,53]; the last eruption (so far) at this edifice led to the emplacement of the ‘Theystareykjahraun’ lava flows (younger than 2.4 ka BP).
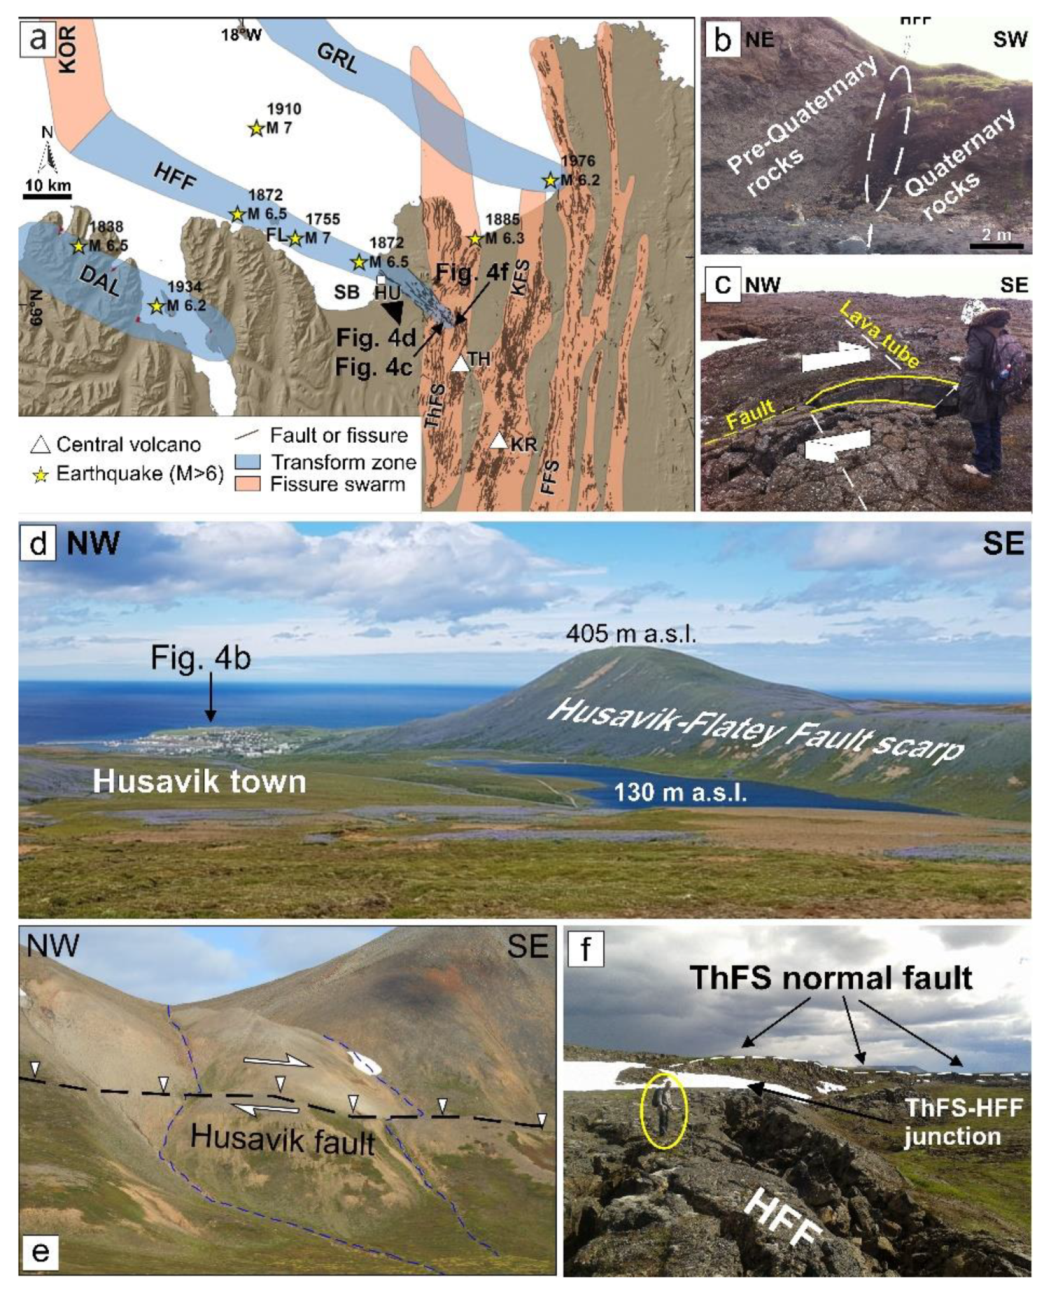
Another major tectonic feature in the NVZ is the Husavik–Flatey Fault (HFF), a major seismically active transform fault with a total length (comprising its offshore and onshore sections) of about 100 km [56]. The length of its emerged (onshore) section is 25 km [38,57]. This fault has been active at least during the last 7 Ma, producing a total estimated right-lateral displacement of 60 km [57]. Along with this impressive strike–slip component, the HFF has produced also a major dip–slip one; its total vertical displacement may amount to as much as 1.4 km/m [58].
What is more striking about the emerged section of the HFF is that it displays a unique tectonic structure similar to the ones that are documented along mid-oceanic ridges; what is normally hidden beneath sea level is fully visible here: the NW–SE-trending HFF connects with the N–S-trending Gudfinnugja normal fault, forming a textbook example of an emerged triple junction, which has been the subject of extensive field studies in the recent past [54,55,59,60,61,62,63,64].
The third area within the NVZ, suitable for illustrating several examples of volcanic and volcano–tectonic processes, is the Krafla Fissure Swarm (KFS), extending about 50 km towards the north and about 40 km towards the south from the Krafla Volcano (location in Figure 4a). This world-famous edifice is characterized by an 8-km-wide caldera that was formed following a paroxysmal eruption around 100 ka BP. Since the time of its formation, the caldera has expanded about 2 km in an E–W direction, owing to active processes of plate spreading and rifting. Within the KFS, it is possible to observe a great number of extension fractures and eruptive fissures, formed during repeated rifting events over the last 10 ka [39].
3. Methodologies for Image Collection and Processing
3.1. General Overview
Field observations and data collection are essential for geoscience research, teaching, outreach and popularization; however, very often, the study areas are characterized by difficult logistic conditions, due to the outcrops and landforms not being easily reachable [65]. In order to overcome these limitations, remotely captured images and derived models (3-D Digital Outcrop Models—DOMs, orthomosaics and Digital Surface Models—DSMs) have been increasingly used by the scientific community over the last decade, allowing for extensive collection of geological data in previously inaccessible areas [66]. In particular, the past few years have seen the steady development of unmanned aerial vehicles (UAV). These have become popular for scientific purposes, owing to the following reasons: (i) The most convenient data acquisition procedures and schedules can be chosen. (ii) The flight height can be adjusted so as to obtain the required (usually very high) spatial resolution. (iii) Flights can be repeated on a daily basis or also several times per day. (iv) Vertical rock cliffs, normally inaccessible to direct examination, can be examined in great detail. (v) Data acquisition is substantially less expensive than in the case of high-resolution satellite imagery. (vi) UAVs can be equipped with several types of sensors, designed for specific purposes. Thanks to the above, UAVs have been employed, over the past decade, to enhance knowledge of different types of geohazards, ranging from seismic [67,68] to landslide [69,70,71,72,73] to volcanic [74,75,76,77] and flood hazards [78,79]. With regard to the study of active tectonics and volcano–tectonics, focused on geological objects like those documented in the present work, after the first attempts with balloons [80], UAV-captured images have become a major option in the study of active faults [81,82,83,84,85,86,87,88]. In most of these works, the use of UAVs has been integrated by Structure-from-Motion (SfM) photogrammetry [89,90,91], a powerful technique to augment traditional methods used to gather outcrop data. Therefore, the combination of UAV-digital image collection and SfM photogrammetry has been increasingly applied to geological and environmental research [39,40]. In order to accomplish the goals of the present work, we have used the above techniques both for collecting images of the selected geosites, as well as constructing 3-D DOMs, which may be considered “Virtual Outcrops (VOs)” [92,93]. VOs can be defined as follows: “a 3-D representation of surface geology, but it does not contain subsurface information” [94]. This cutting-edge technique can be used for achieving the following overall purposes, all relevant to the present paper: (i) characterize, illustrate and assess geosites; (ii) communicate Earth Science by explaining ongoing, active geological processes and (iii) engage the younger generation, usually very attracted to innovative and interactive communication tools.
3.2. UAV Selection and Use
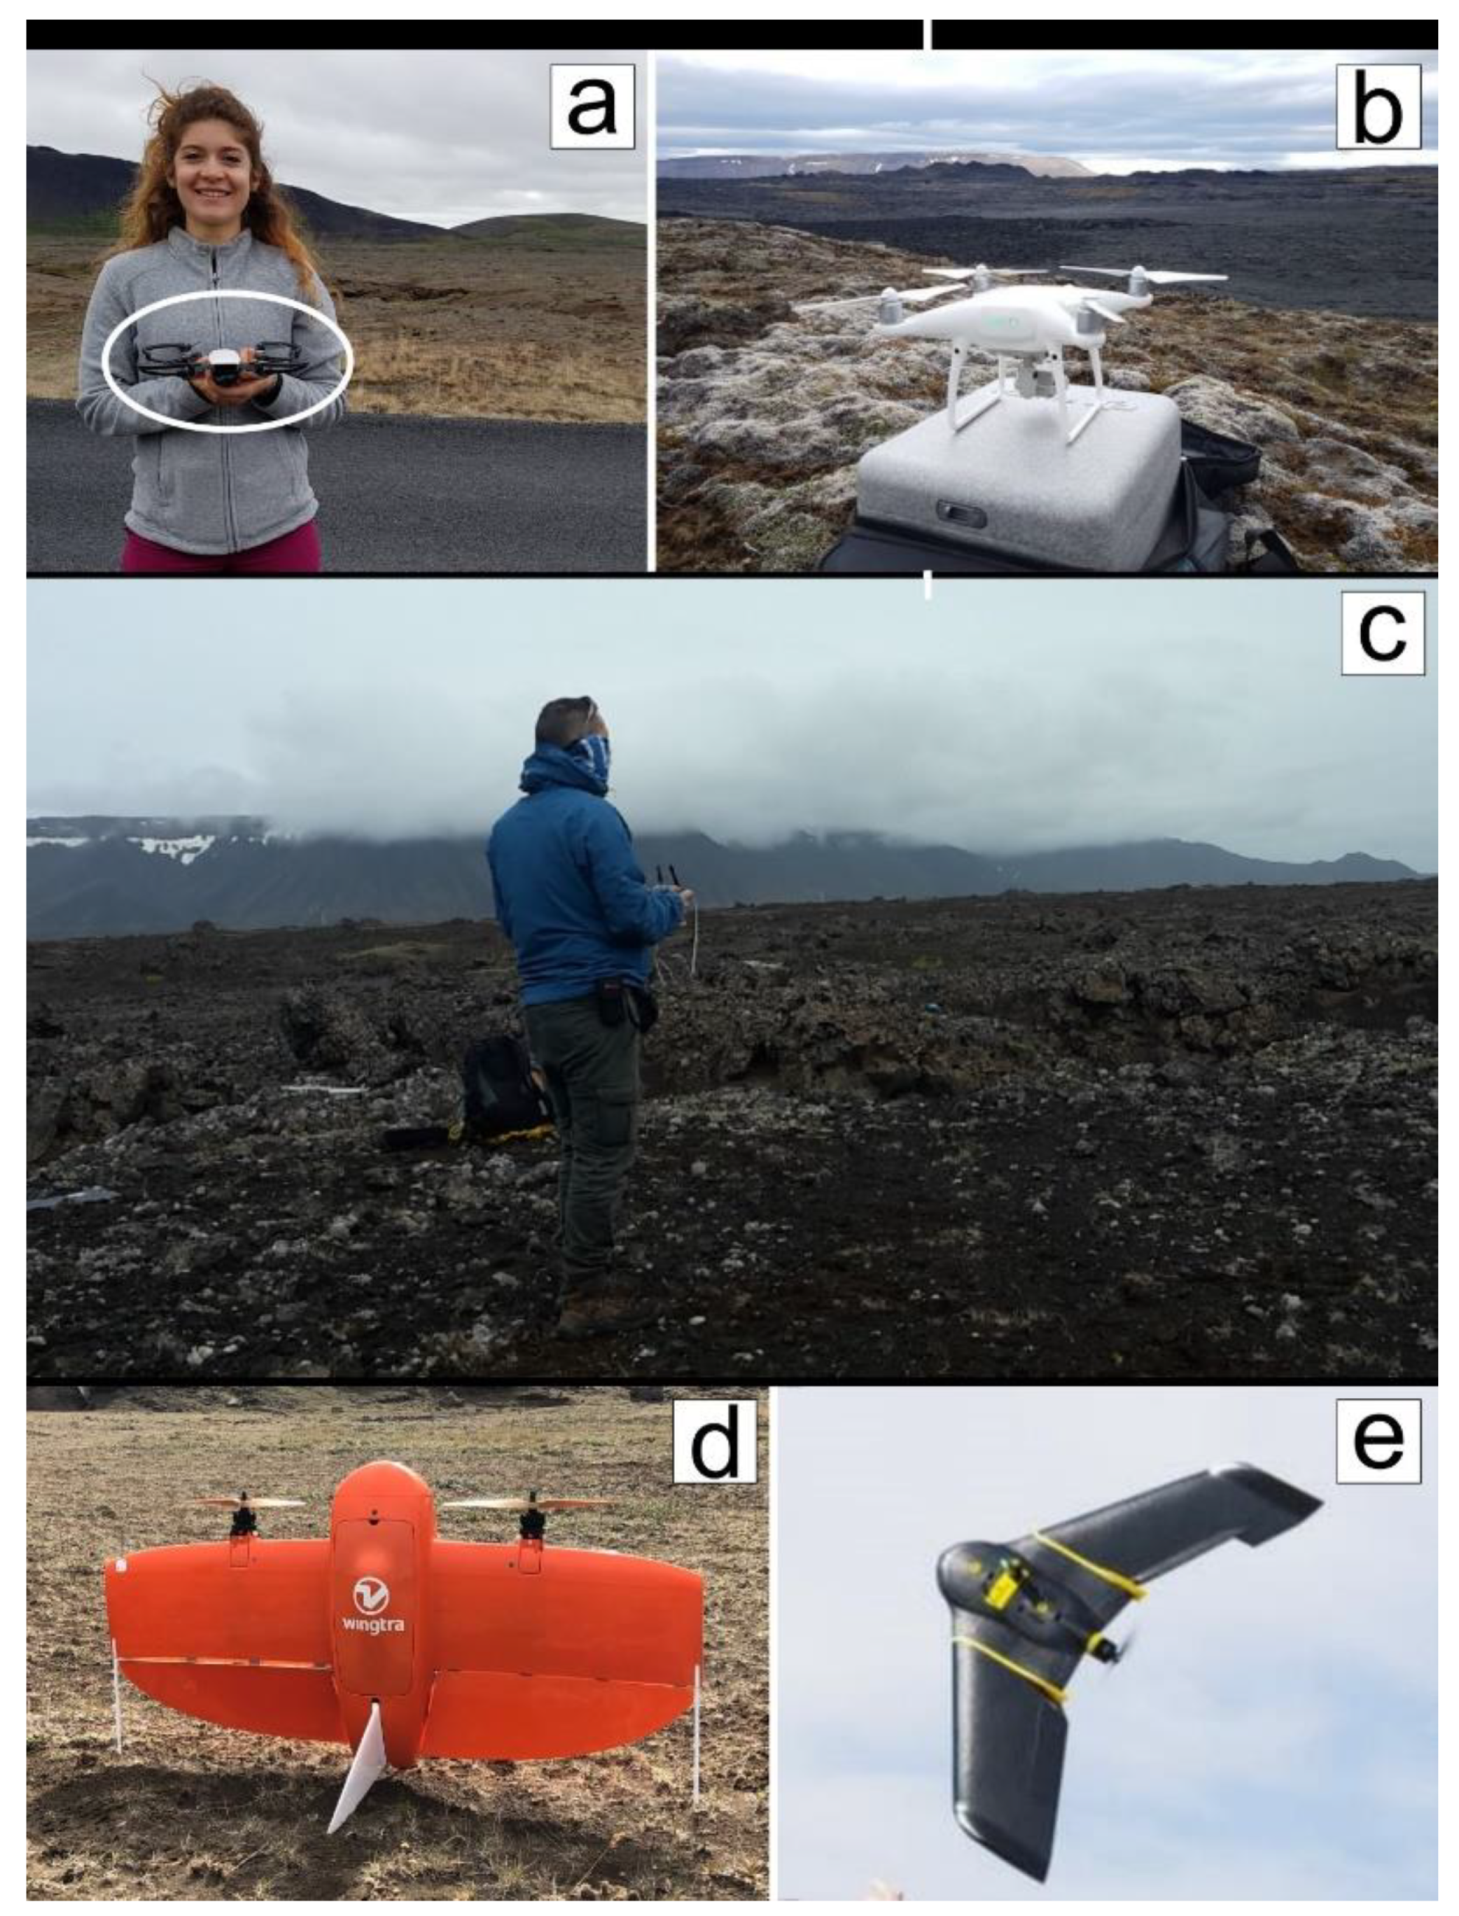
For the sake of the present work, we chose multirotor vehicles (Figure 5a,b), as they can be remotely controlled (e.g., Figure 5c), are characterized by very stable hovering, can be easily transported in the field and are less expensive than hybrid and fixed-wing models (e.g., Figure 5d,e). In addition to the above, multirotor models can fly at very low heights, thus, obtaining greater field resolution; most importantly, take-off and landing operations are smoother than for fixed-wing models, and this can prove to be crucial, especially when operating in difficult logistic terrains, such as lava flow outcrops or remote beach areas [39,40].
Considering the above, we selected two different types of multirotor UAVs: the DJI Phantom 4 PRO quadcopter and the smaller DJI Spark. The DJI Phantom 4 PRO (Figure 5b) is a 1.375-kg vehicle equipped with a 20 megapixel camera, EXIF information (Exchangeable Image file Format) and GPS coordinates, provided by the integrated satellite positioning systems GPS/GLONASS (refer to the WGS84 datum); it records 4K videos at 100 fps and supports a micro SD card with a maximum capacity of 128 GB. In this case, flight time is approximately 30 min. This model provides constantly stable flights thanks to the integrated GPS system, including position holding, altitude locking and stable hovering. Its transmission distance is up to 7 km. The DJI Spark (Figure 5a) is a 0.300-kg vehicle, also known as the “selfie drone”, equipped with a 12 megapixel camera, EXIF information (Exchangeable Image file Format) and GPS coordinates. In this case, flight time is approximately 16 min. Owing to its small size and low weight, this model is pretty useful for field research and 3-D DOM reconstruction focused on outcrops located in remote areas. The high resolution guaranteed by both instruments is a key asset for image collection, SfM processing, 3-D DOM and VO reconstruction for teaching, outreach and research purposes.
3.3. UAV-Based Structure-from-Motion: Data Collection (Part I)
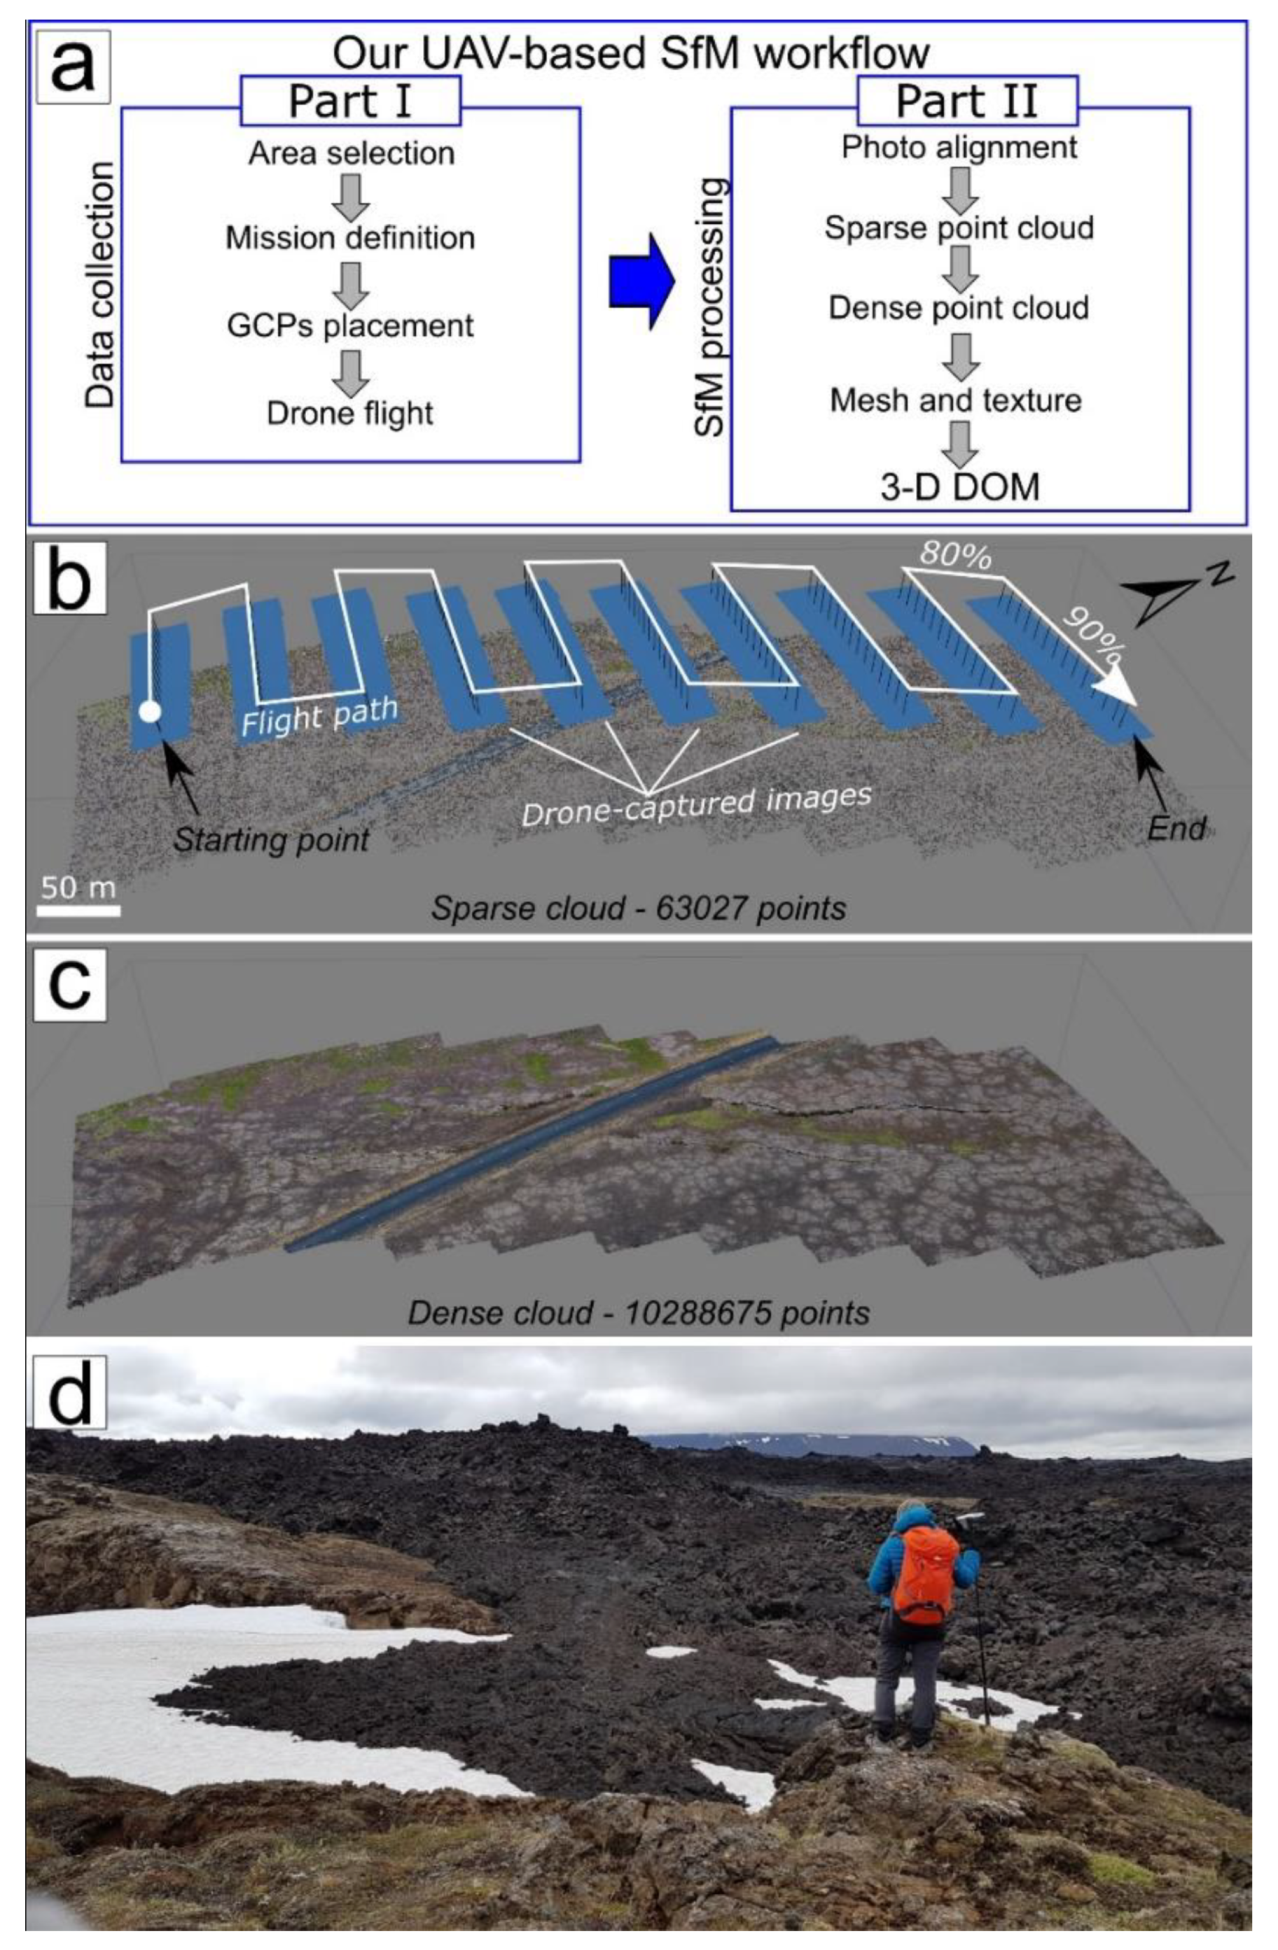
Our workflow aimed at 3-D DOM construction can be broken down in two parts (Figure 6a): (i) Part I pertains to data collection (digital image gathering and setup of ground control points—GCPs). (ii) Part II has been dedicated to data processing and model reconstruction. The first step has been devoted to defining the area to be surveyed and planning the details of the flight missions, such as path orientation. In doing this, care must be taken in considering wind direction, which may affect UAV flight performance. As the surveyed geological objects are situated in very remote areas, we made use of the smaller DJI Spark, managed through the DJI GO App. The UAV was manually controlled by the pilot for the entire duration of the mission; as shown in Figure 6b, a number of paths, parallel to each other, were planned. As suggested in recent works [39,95,96,97], UAV-captured photos should have an overlap of 90% along single paths and 80% in a lateral direction (e.g., Figure 6b), so as to obtain a better alignment of the images and reduce distortions on the resulting orthomosaics. During image collection for the goals of the present work, field photographs were taken from a height of 30 m by flying the drone at a speed of 2 m/s and obtaining an overlap consistently in a range of 90%–85% along paths and 80%–75% in a lateral direction; images were captured every 2 s (equal time interval mode) and in optimal light conditions suitable for the camera ISO range (100–1600). This was done to minimize the motion blur, avoid the rolling shutter effect and achieve well-balanced camera settings (exposure time, ISO and aperture); in this way, ensuring sharp and correctly exposed images (e.g., [98]).
Moreover, to reduce shadows around elevated features, we operated the drones when the sun was straight overhead (at zenith). Luckily, during the summer period in Iceland (July), the sun angle variation is minimal, and the exposure to sunlight is almost uniform during the central part of the day. In order to allow for the co-registration of datasets and the calibration of models resulting from SfM processing (e.g., [89,91,99,100]), World Geodetic System (WGS84) coordinates of, at least, four artificial ground control points (GCPs) were fixed near every corner of each surveyed area (an additional one was selected in the central part); this procedure helped to reduce the “doming” effect resulting from SfM processing. The GCPs were chosen as well-visible natural targets: stones, lava flow edges and piercing points along fractures; they were surveyed by using single frequency receivers in RTK configuration (with centimetric accuracy).
3.4. UAV-Based Structure-from-Motion: Data Processing and Model Reconstruction (Part II)
Part II has been dedicated to data processing aimed at 3-D DOM and Virtual Outcrop (VO) construction; the collected images were processed through Agisoft Metashape (Agisoft LLC, 11 Degtyarniy per., St. Petersburg, Russia, 191144), a commercial Structure-from-Motion software (SfM). This application has been increasingly used for both UAV and field-based SfM reconstructions, owing to its user-friendly interface, intuitive workflow and high quality of point clouds [101]. The SfM technique allowed us to identify matching features in different photos and combine them to create a sparse and a dense cloud (Figure 6b,c), an orthomosaic, a DSM and, eventually, 3-D DOMs as final products [89,102]. The steps leading to model construction are shown in Figure 6a; further details are provided hereunder. The first step was to obtain an initial low-quality photo alignment, only considering measured camera locations. Thereafter, we excluded the photos with quality value ˂0.5 (or out of focus) from further processing, as suggested by the software’s user manual. Following this initial quality check, ground control points (GCPs) were added to all photos, where available, so as to: (i) scale and georeference the point cloud (and thus, the resulting model); (ii) optimize extrinsic parameters, such as estimated camera locations and orientations and (iii) improve the accuracy of the final model. Images were then realigned, camera locations and orientations were better established and the sparse point cloud was computed by the software. The next phase consisted in reconstructing the dense point cloud (e.g., Figure 6d) from the sparse point one, using a mild-depth filtering and medium quality settings. The 3-D DOMs were finally created by generating the Tiled model (mesh and texture) through the Agisoft Metashape software. The resulting 3-D DOMs are characterized by a high-resolution texture always in the range of 1.0–1.5 cm/pixel.
4. Geosites in the Two Selected Icelandic Areas: Description and Assessment
4.1. Geosites in the Snæfellsnes Peninsula
The two most iconic geosites in the peninsula, which are worthy of mention also for their geotourism-related significance, are Snæfellsjökull Volcano and Kirkjufell. The former (Figure 2a,b), located at the westernmost edge of Snæfellsnes, is a majestic, snow and ice-capped composite edifice that rises to almost 1500 m a.s.l. This geosite can be evaluated by applying most of the above outlined criteria. In fact, it can be assessed in terms of its aesthetic value, which can be defined as the combination of two factors: visibility and structure [32]. A geosite’s visibility is greater when it can be clearly spotted from multiple viewpoints and also from a considerable distance. Structure, on the other hand, refers to the fact that features with a vertical development, such as isolated peaks, are generally perceived as the nicest [103]. This volcano fits both criteria, as it is an isolated peak that, being located at the tip of a peninsula, is perfectly visible from tens of kilometers away. As regards the scientific value, two subcriteria can be applied: firstly, the volcano was the subject of extensive scientific research (e.g., [104]) and, secondly, it is highly representative of the combination of volcanic and glacial processes. As far as the criterion “artistic or literary importance” is concerned, the volcano has also a cultural value; in fact, Snæfellsjökull was made famous by Jules Verne, who included it in his best-known science-fiction novel, Journey to the Center of the Earth (1864). Finally, this geosite has a major educational value, being easily accessible and located within Snæfellsjökull National Park (established in 2001), where guided tours to its glacier, as well as recreational/educational activities, are organized on a regular basis. Kirkjufell (“Church Mountain” in Icelandic) is a stunning, 468-m-high peak found on the northern coast of the peninsula, which, along with the beautiful waterfalls, is one of the most photographed natural features in Iceland (Figure 2a,c). This geosite has a considerable aesthetic value: firstly, it has a peculiar morphologic structure, clearly visible from a considerable distance (although not comparable to the much higher Snaefellsjökull Volcano). It is also very representative of glacial processes that, all over Iceland, carved thick piles of basaltic lava flows, to the point of creating impressive erosion-related landforms, such as Kirkjufell and many others. However, as opposed to its neighboring volcano, this geosite has not been the subject of scientific research in the past. In regard to its educational value, all the subcriteria can be applied: it is perfectly accessible, the processes that led to its formation can be easily understood and there are plenty of possibilities to take part in guided tours.
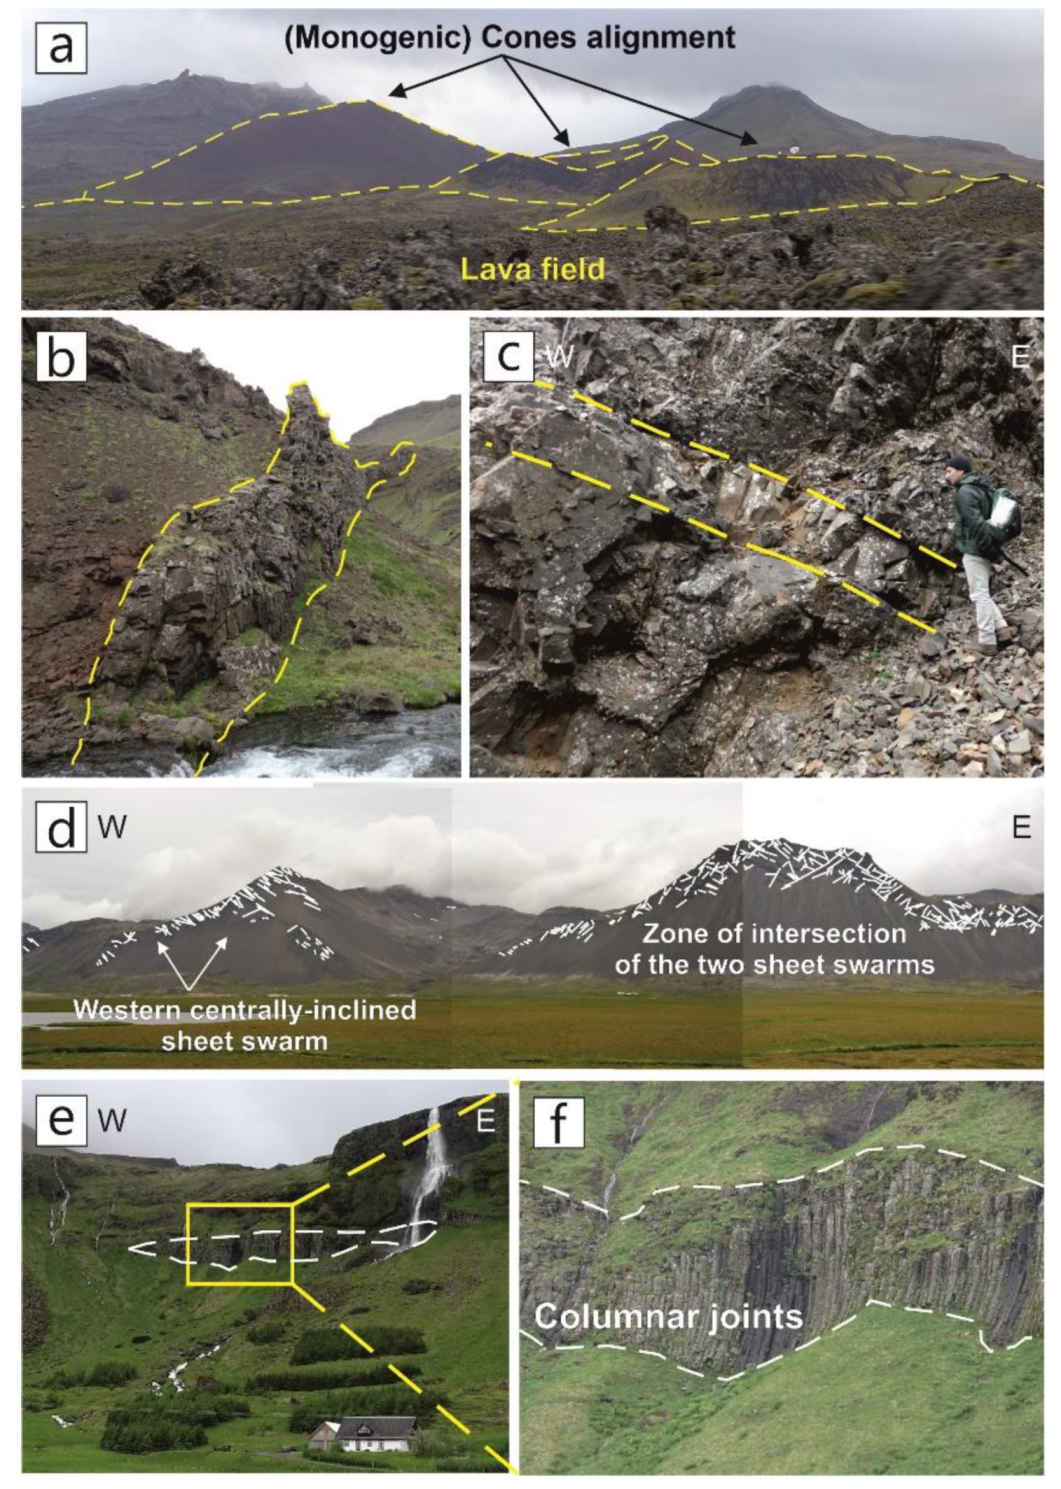
Along the northern coast of the peninsula, around 20 km east of Kirkjufell, another geosite that is worth highlighting is a scoria cone with a basal diameter of 550 m (Figure 2d), which is a perfect example of a continuous crater rim with two depressed points. The line ideally connecting the two depressed points is considered [105,106,107] to be parallel to the fracture in the substrate along which magma was rising, leading to the growth of the cone. Another way to define the most probable orientation of near-surface magma paths is to analyze the alignment of pyroclastic cones. In this respect, Tibaldi et al. [47] documented that 51 pyroclastic cones, clustered in groups of three or more (such as in Figure 3a), and mostly elliptical in plain view and are aligned in an approximately E–W direction, consistent with the trend of the whole Snaefellsnes Peninsula. As regards the assessment of this geosite, the scientific criterion that can be applied here is representativeness; this is a very clear example of the appearance of such scoria cones all over the country, and in many other volcanic regions of the world. With regard to the educational value, this site is easily accessible, but its didactic relevance is rather low, as it would be difficult to explain to nonexperts the topic of magma paths and their relation to the geometry of scoria cones, as well as to the alignment of multiple monogenetic edifices.
Along the central-southern coast of the peninsula, a very complex system of regional dykes crops out; dykes are major subvolcanic features [108] that are responsible for feeding fissure eruptions [74] and flank eruptions at volcanoes [109]. In some cases, they can also induce the destabilization of volcanic edifices, potentially leading to lateral collapse [110]. The outcrop in Figure 3b represents a geosite that is suitable for showing the geometry of dykes in the field.
On the southern side of the Senaefellsnes Peninsula are located the Midhyrna and Lysuskard intrusions, very clear examples of extinct magma chambers that once stored magma feeding eruptions at the surface. Of particular interest are the swarms of inclined sheets surrounding the two intrusions. Sheets are subvolcanic bodies that channel magma from a deep reservoir to the surface. In the field, they are clearly distinguishable from dykes, as the latter are almost always subvertical or vertical, whereas sheets are always dipping at a low angle. Iceland is one of the places on Earth where sheet swarms can be better observed and studied [108]. At Snaefells, as is the case in other locations in Iceland and at the Isle of Skye [111,112,113,114,115], the sheets are inclined towards the subvolcanic bodies from which they were injected. The outcrop in Figure 3c represents a geosite that may be functional for explaining the geometrical appearance (dipping at a shallow angle) of sheets in the field that are different from those of dykes (which are vertical or subvertical). In the central-southern portion of the peninsula, the 384 sheets that were mapped are arranged in a particular fashion around the Midhyrna and Lysuskard subvolcanic intrusions [47]. The two aligned ridges in Figure 3d can be considered a unique geosite (laterally extended for 3.8 km), which is key to pointing out a rather complicated process hardly ever observed in subvolcanic geology: the inclined sheets in the western part of the photograph preferentially dip to the E at a shallow angle towards the location of the Lysuskard composite doleritic–granopyric intrusion, which represents the magma chamber off which they were injected. In the central sector of Figure 3d, there is the intersection of two different swarms of sheets (highlighted as thin white lines), which dip towards either the W or the E. In the eastern zone (not included in Figure 3d), the sheets dip preferentially towards the Mydhirna doleritic intrusion. Another feature that is frequently possible to view in the Snaefellsnes Peninsula is represented by sills, subvolcanic intrusions with a subhorizontal attitude [108], concordant with the underlying and overlying host rocks (geosite in Figure 3e); especially worthy of attention is the presence of well-developed columnar joints that are formed during the cooling of magma (geosite in Figure 3f). At the scientific level, all the above geosites are highly representative of the subvolcanic processes that are common in volcanic regions, such as Iceland. All have been the subject of scientific research, leading to publications [47,116]. Moreover, they are easily accessible and, with the sole exception of the volcano–tectonic process leading to a sheet swarm intersection (Figure 3d), all could be suitable for teaching the basics of subvolcanic geology to a public of nonexperts.
4.2. Geosites in the Northern Volcanic Zone
Moving from W to E, the first geological feature in the NVZ is the aforementioned Husavik–Flatey Fault (HFF), an amazing example of an oceanic transform fault that can be observed along its emerged prolongation (Figure 4a). The HFF, together with the Grimsey and Dalvik lineaments, compose the so-called Tjornes Fracture Zone, which connects the NVZ to the Kolbeinsey Ridge (Figure 1a). The HFF has an impressive appearance in the field, separating pre-Quaternary from Quaternary volcanites (Figure 4b) and offsetting structures, such as lava tubes (Figure 4c), in a dextral sense. The clearest exposure of the fault is the one in Figure 4d, where the sheer size of the fault plane is visible in its completeness; here, the location of Husavik town a short distance away from this gigantic tectonic element provides an eerie reminder of the seismic hazard the town is prone to. Another view of the dextral displacement along the fault is given in Figure 4e, where the fault clearly offsets gullies and water divides. Figure 4f depicts the above-explained triple junction: the field photograph captures one of the few tectonic interactions, visible on Earth’s surface, between a transform fault (the HFF) and a rift system (the ThFS), whose northwesternmost fault (the Gudfinnudgja Fault) can be seen in the distance, with its about 30-m vertical offset [61].
The five tectonic geosites that have been introduced above are all of the linear type, as they are related to a strike–slip fault. They can be considered active geosites, as the HFF has produced four historical earthquakes in the last 200 years [61], and displacements along any sectors of this major fault may take place in the future. Their scientific value is considerable due to the following reasons: Firstly, they are highly representative of the appearance of a major strike–slip structure in the field. Secondly, they belong to a fault that has been documented in a great deal of high-profile publications, as mentioned above. They are also extremely rare at the scale of Iceland, because they belong to an oceanic transform fault that extends onshore, a process that takes place only in this portion of the island. It is worth noting that one of the five geosites in Figure 4 is rare also at the worldwide level—the textbook-example of an emerged triple junction shown in Figure 4f.
With regard to the educational value of the geosites, all are suitable for explaining the activity of a strike–slip fault. Particularly worthy of notice in this respect are the geosites in Figure 4c,d. The former is a very good example of the movements along a strike–slip fault, which are easy to visualize and understand thanks to the presence of a displaced lava tube. The gigantic fault plane in Figure 4d, on the other hand, is key to explaining the existence of a dip–slip component of movement superimposed on the strike–slip one. The geosites in Figure 4b,d are easily accessible, as opposed to the other three, which would require potential visitors to walk long distances across a harsh volcanic landscape. To our knowledge, none of the above geosites have been the focus of educational activities, probably also on account of the difficulty to access them. The second selected area in the NVZ is the Theystareykir Fissure Swarm (ThFS), marked by the presence of geosites that are representative of a number of active volcano–tectonic processes, such as faulting and fissuring, as well as the development of central volcanoes and associated geothermal areas.
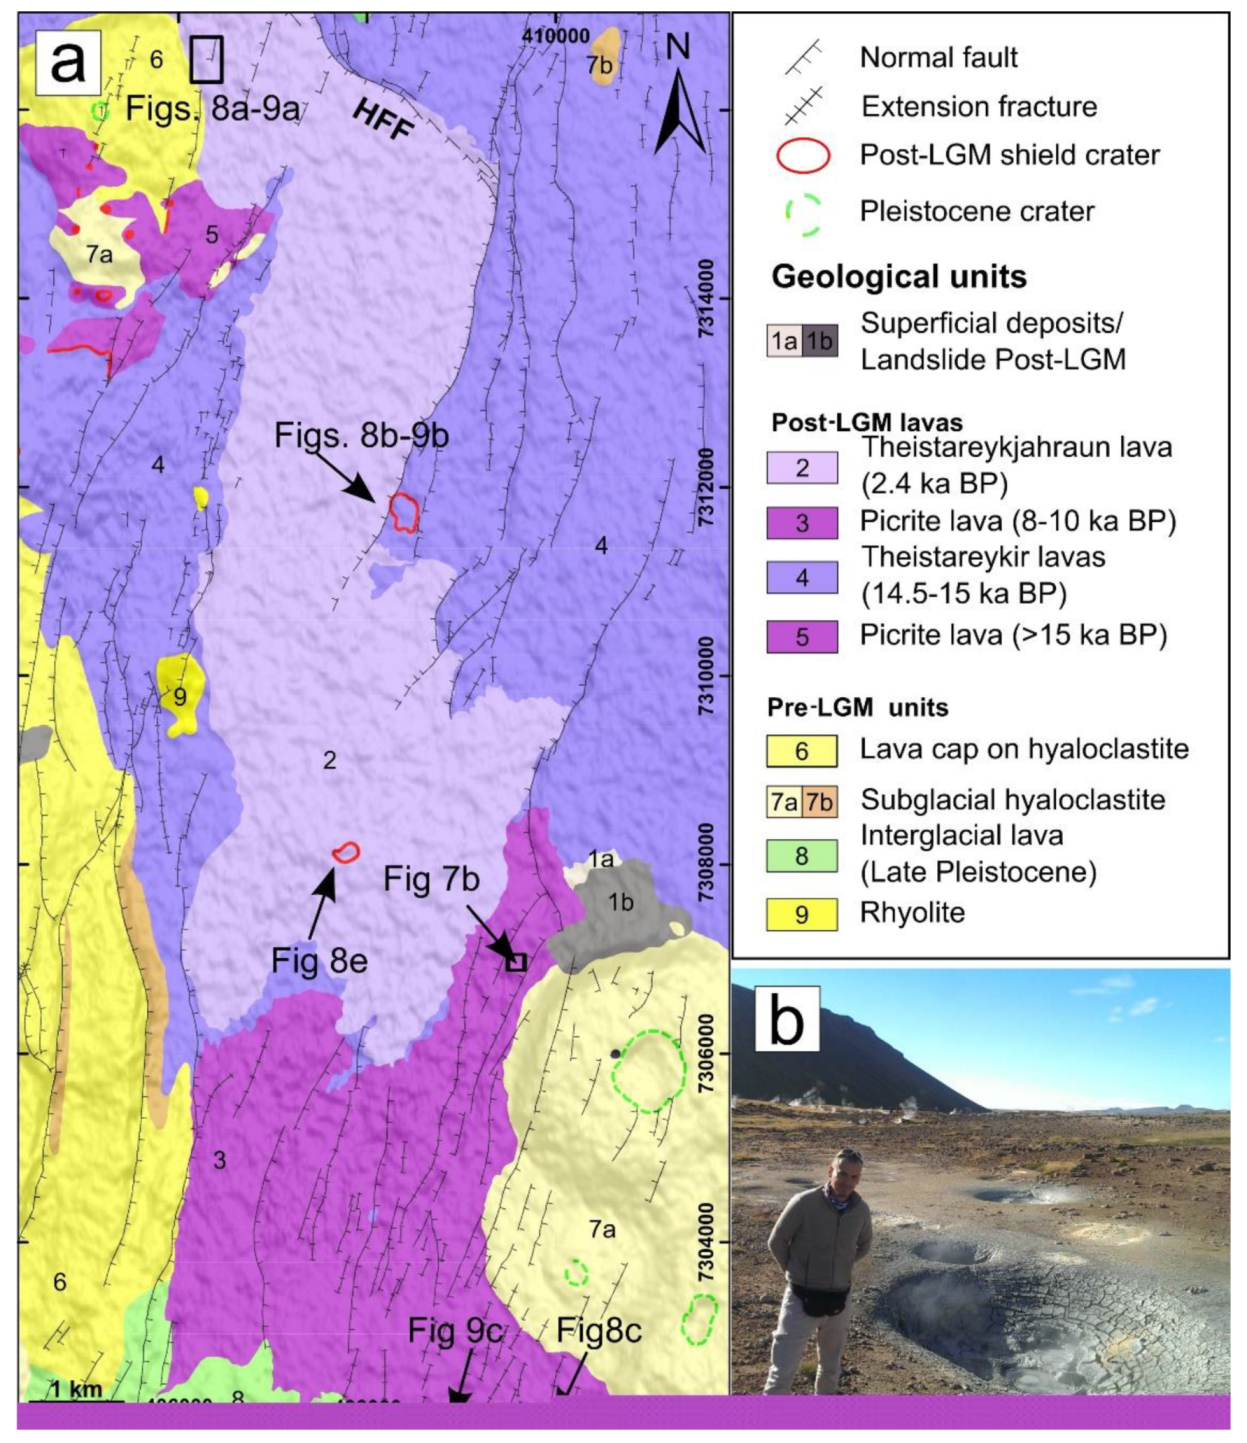
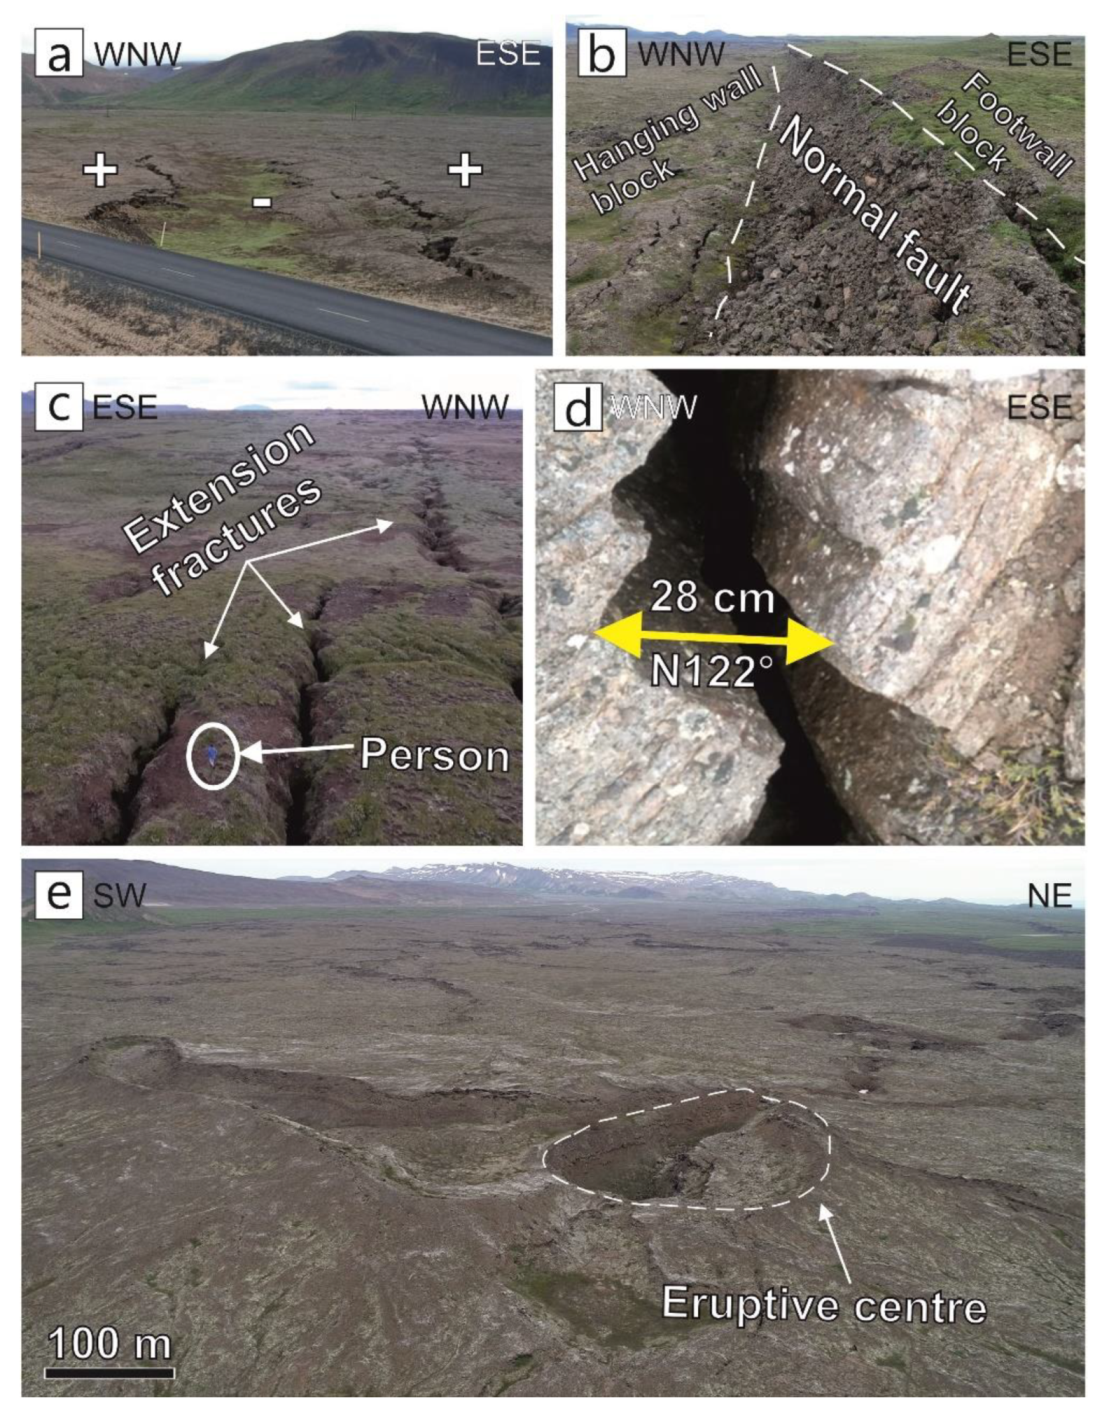
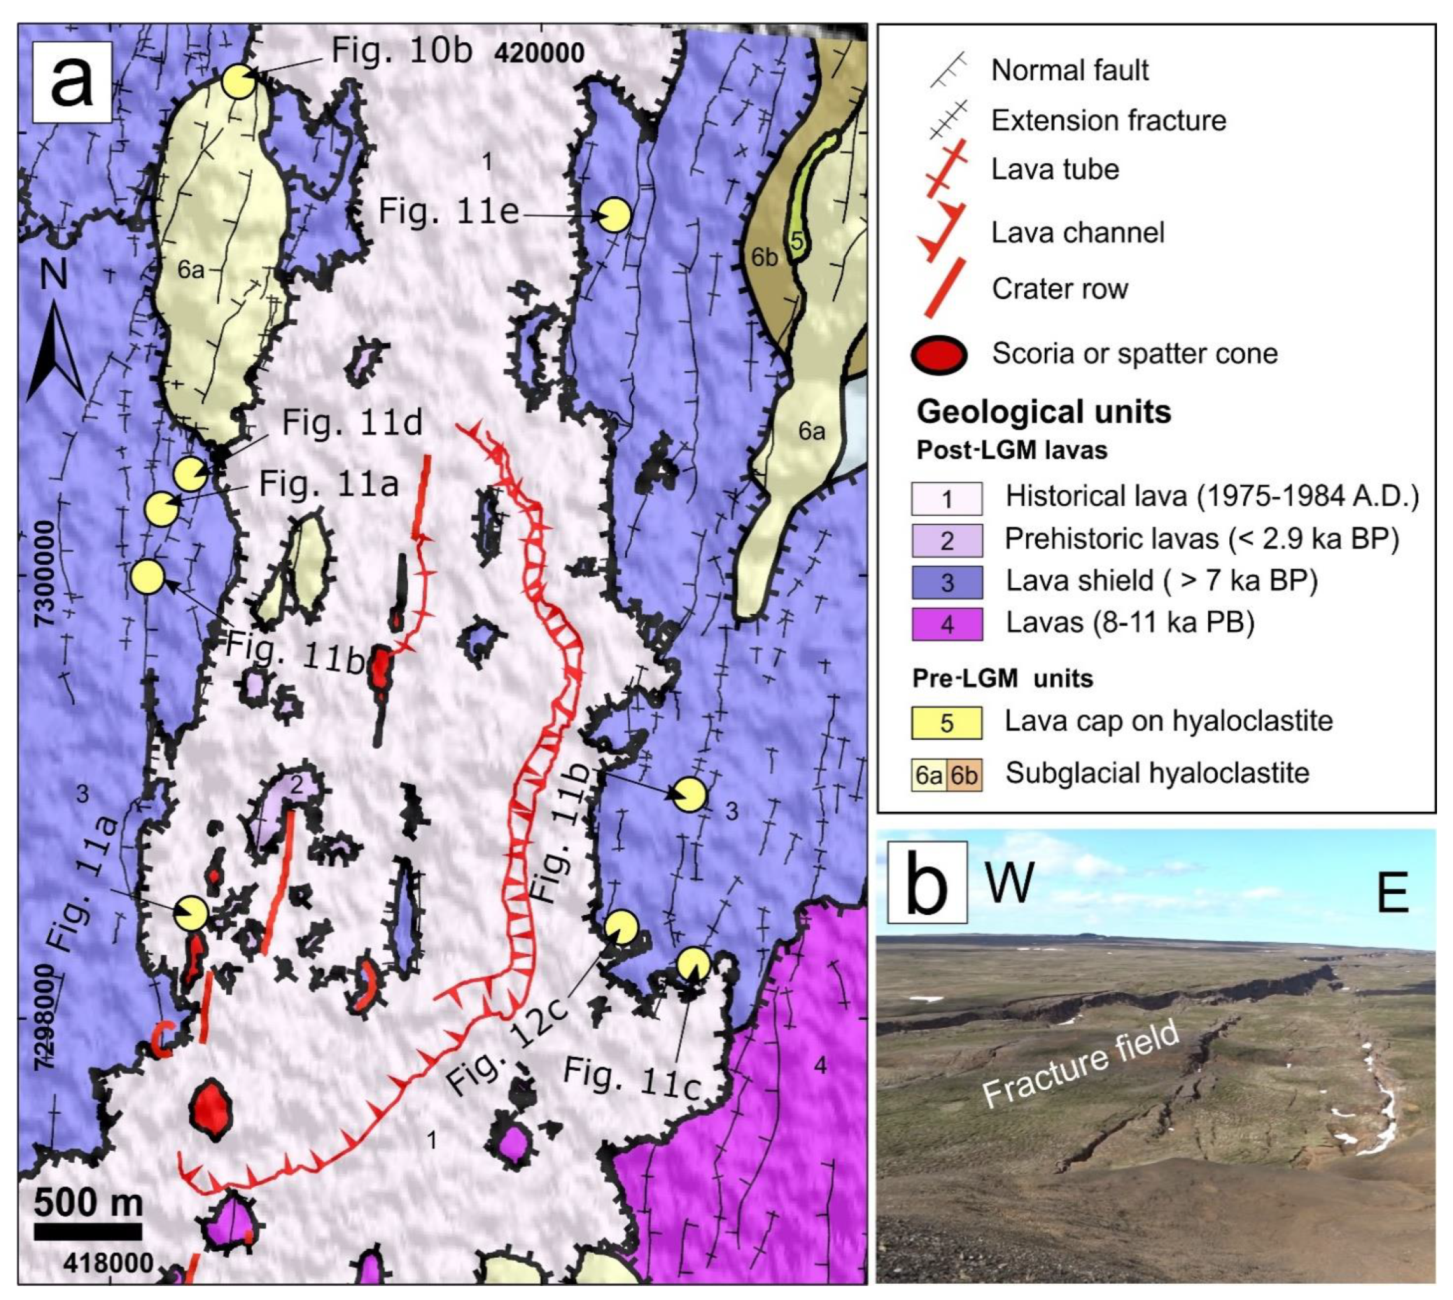
Figure 7a is the geological map of a portion of the ThFS about 15 km south of the triple junction; here, the older volcanic and volcanoclastic units pre-date the Last Glacial Maximum (LGM), whereas the younger ones were emplaced after the last deglaciation. In this area, we selected a few geosites, among which a geothermal area (Figure 7b), home to several pools of hot mud. Another geosite is a 30-m-wide and 300-m-long volcano–tectonic graben, described in detail in a recent paper [39]; this extensional structure (Figure 8a) is bounded by two main normal faults, striking NNE–SSW, affecting 2.4-ka-old lavas. Another image (Figure 8b) documents the offset (12 m) produced along one of the many dip–slip faults that compose this active rift system; a third UAV-captured image, depicting a fracture field (Figure 8c), enables observing a set of extension fractures, roughly parallel to each other, affecting older, pre-LGM lavas and marked by dilation amounts > 40 cm (in the range of 40 to 120 cm). A close-up field photograph (Figure 8d) visualizes one of the thousands of extension fractures affecting post-LGM lavas (with dilation from a few centimeters to about 40 cm); here, clear “piercing points” can be spotted, suitable for assessing the vector of fracture opening and the amount of dilation. Finally, Figure 8e shows the Stórihver recent volcanic cone, with a crater of 60 m in diameter.
Regarding the assessment of the six geosites (Figure 7b and Figure 8a–e), all have a major scientific relevance. In fact, they belong to an active rift that has been intensively investigated in the last three decades, as documented by several high-profile scientific publications, some of which are mentioned above. Moreover, all the selected geosites are highly representative of active processes, both geothermal and tectonic ones, the latter leading to the development of dip–slip faults and extension fractures. As opposed to the geothermal and tectonic geosites, which are all representative of presently active processes, the volcanic geosite displayed in Figure 8e is the result of a localized eruption that resulted in a monogenetic volcanic edifice that is nowadays extinct. With regard to rarity, none of the geosites can be regarded as uncommon, because most of Iceland is pervasively cut by faults and fractures and dotted with monogenetic cones in response to ongoing crustal extension and hot spot-related volcanism.
The above geosites could be undoubtedly used for didactic purposes, as they enable us to explain active extensional processes that can be easily understood thanks to the favorable exposure of the outcrops. However, the educational value of four out of five of the considered geosites is hampered by their limited accessibility; apart from the graben in Figure 8a, whose location is reachable by car, all the others are found in remote areas; moreover, the floor of the ThFS is riddled with gaping fractures and holes, which make the area relatively unsafe for nongeologists.
In order to overcome these limitations, we produce a series of 3-D models, as illustrated hereunder. The first example (Figure 9a) is a 3-D view of the 30-m-wide graben (cut by the road), previously shown in Figure 8a, which represents a typical effect of extensional tectonics across the ThFS.
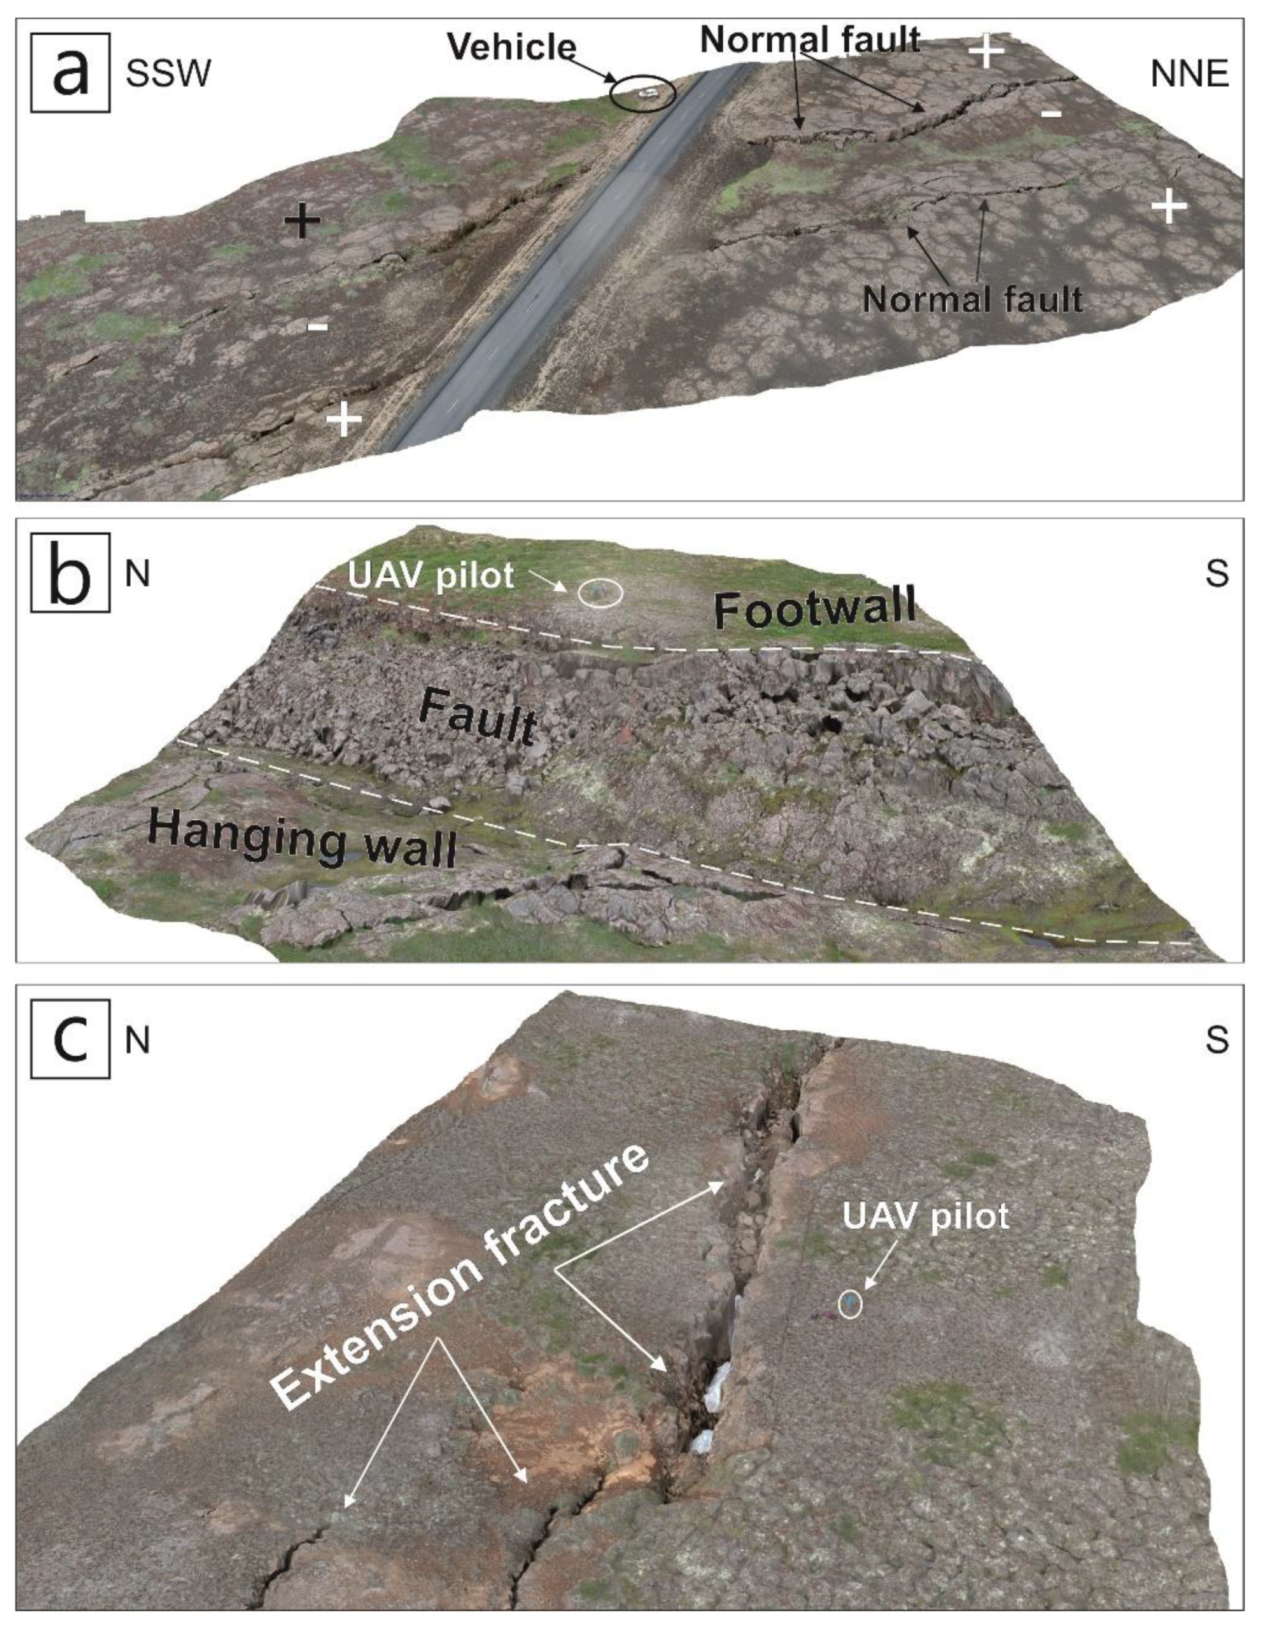
The 3-D model visualizes, with exceptional detail, the two sets of opposite-dipping normal faults that border the graben, as well as the low-lying floor of the volcano–tectonic structure. The model is also instrumental in highlighting that tectonic subsidence across the graben floor has developed in a differential fashion, as attested by the fault system to the WNW (upper part of the figure), marked by a greater offset than its counterpart to the ESE. The second 3-D model (Figure 9b) portrays the above-illustrated dip–slip fault (Figure 8b); here, the geometry of a recent, active dip–slip fault with a steeply-dipping fault plane separating two horizontal surfaces (the top of the footwall block and the hanging wall block, respectively) can be viewed in great detail. The third model (Figure 9c), aimed at providing a clearer picture of the effects of extensional tectonics, is focused on a segment of the previously shown fracture field (maximum opening 3 m) affecting pre-LGM lava units (Figure 8c).
The third area in the NVZ is a segment of the northern portion of the Krafla Fissure Swarm (KFS) at a location that is north of the Krafla central volcano. The geological map in Figure 10a enables us to observe that, as opposed to the ThFS, the KFS is marked by the presence of historical lava fields, as well as both historical and pre-LGM volcanic centers.
In particular, as reported by Hjartardóttir et al. [117], two major rifting episodes took place within the KFS in the last 1140 years: the 1724–1729 “Mývatn rifting episode” and the instrumentally recorded “Krafla rifting episode” (better known as “the Krafla Fires”), which occurred from 1975 to 1984. During both episodes, there were periods of strong earthquake activity and motions along a number of faults (accommodating the widening and subsidence along tectonic graben). During the “Krafla Fires”, the continuous emplacement of dykes resulted in the opening of eruptive fissures, which, in turn, led to lava fountaining and the outpouring of lava flows.
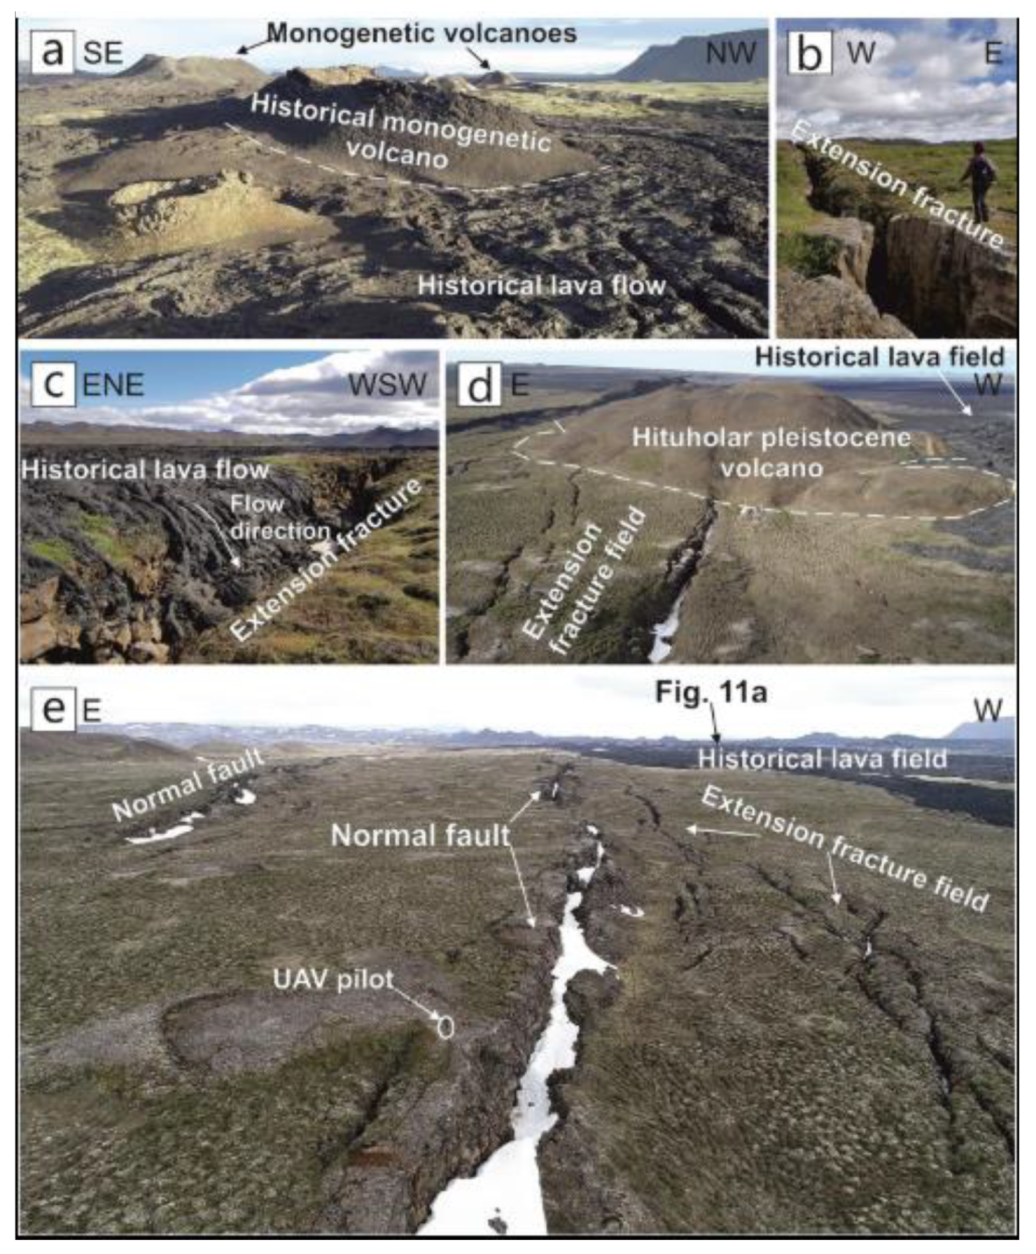
We individuated six geosites in this area: The first one, displayed in Figure 10b, is a textbook-example of a recent volcano–tectonic graben affecting post-LGM lava units bordered by two dip–slip faults that diverge from a common point (highlighted by a yellow circle in Figure 10a). The graben floor, with a maximum width of 90 m, is affected by active stretching, as testified to by the development of an extension fracture field. The other volcanic and tectonic geosites in the KFS are the following: a cluster of recent monogenetic volcanoes (scoria cones), two of which are visible in the background and one at the center of the image (Figure 11a). The larger cone in the foreground (350 m × 150 m) was formed in 1984, at the end of the “Krafla Fires” eruptive cycle [118].
Especially notable is a very recent pahoehoe lava flow, which was outpoured by the crater in the foreground. Another geosite is one of the typical extension fractures (with dilation between 1 and 1.5 m) formed within the lavas older than 7 ka (Figure 11b). As is the case in the ThFS, in the KFS, the wider extension fractures are found within the older lava units. In Figure 11c, a field photograph documents a historical lava flow (emitted during the “Krafla Fires”) coming from the left-hand side of the image, which partially infilled a 2-m-wide extension fracture. Figure 11d is a UAV-captured image, offering a chance to take a look at a geosite composed of the combination of a volcano and an extension fracture field. In the background of the image is the Hituholar volcanic edifice (500 m of basal diameter in E–W direction), made of hyaloclastites at the base and scattered pillow lavas in its upper portion. From its southern base, and extending southward, a fracture field cuts both through 12-ka-old lava units and the volcanic edifice. Finally, in Figure 11e, another UAV-captured image enables us to observe a geosite made of the two main extension-related structures that characterize active rift zones such as the KFS: These are N–S-trending dip–slip faults (marked by important offsets) and N–S to NNE-trending extension fractures, whose main characteristics are the absence of vertical displacement and the presence of a major dilation compatible to the regional extensional regime. The individual fault and the fractures composing the geosite in Figure 11e are approximately parallel and spaced about 130 m from each other.
As far as the assessment of the KFS geosites is concerned, all have a considerable scientific value, attested by the several research efforts and publications dedicated to this active rift zone and the recent volcanic episodes that took place there. All are representative of volcanic and tectonic processes within an active rift system. However, none can be considered rare, for the same reasons that were cited above in regard to the ThFS geosites.
Their educational relevance is generally high, though special mention has to be made to the two geosites in Figure 11a,c. The former is suitable for explaining a number of volcanic features (the geometry of monogenetic cones and the morphology of a recent lava flow) that may be easily understood also by nonexperts. The geosite in Figure 11c enables documenting of the interaction between volcanic (a lava flow) and tectonic processes (an extension fracture). However, as these geosites are located in remote areas (relatively unsafe as well, due to the presence of a great number of fractures and holes), their accessibility is limited, and their educational value is, therefore, greatly diminished.
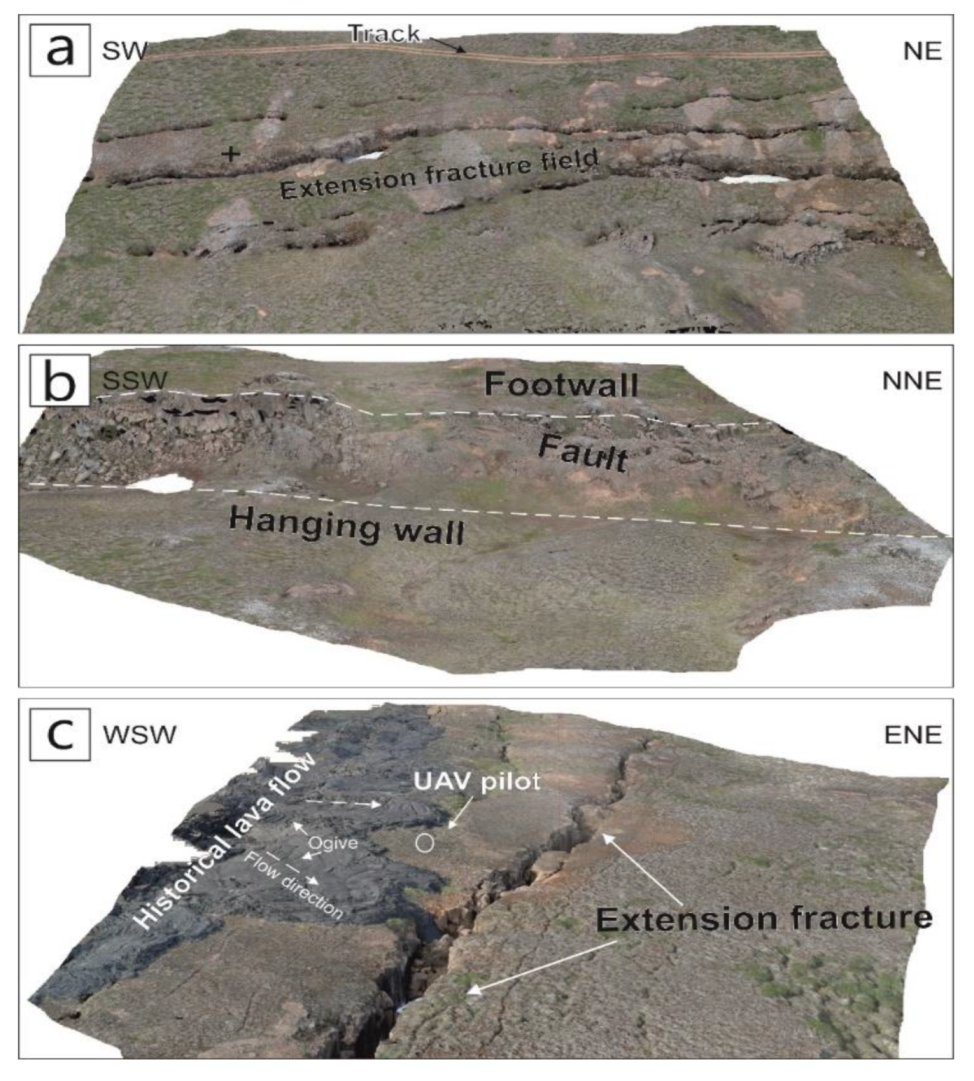
As was the case for some of the geosites in the ThFS, in this case, we created some 3-D models: The first one (Figure 12a) depicts a 100 m × 200 m area marked by the presence of a set of very long and wide (as much as 4 m) extension fractures cutting through 12-ka-old lavas. The 3-D model in Figure 12b depicts a major N–S-trending dip–slip fault (with a 10-m vertical offset) in a similar way as in Figure 9b. Finally, the model in Figure 12c is aimed at capturing a rather common, yet spectacular, occurrence in active rifts: a historical, basaltic, pahoehoe lava flow cascading into a 2.3-m-wide extension fracture. The viewer has a chance to take a look at the so-called ogives, particular structures (common in basaltic, pahoehoe lavas) produced by the bending of the crust during the movement of the underlying, still-molten lava; the convexity of the ogives points in the direction of the lava flow.
5. Discussion
5.1. Geosite Assessment
Our qualitative assessment of the geosites has been performed by following the guidelines contained in several key papers devoted to geoheritage and geotourism [4,6,7,15,19,25,26,27,29,30,31,33,119]. As a result of our work, it is possible to highlight that only one geosite, Snæfellsjökull Volcano, is characterized by all the values that we selected as most appropriate for the purpose of our work. Most of the criteria that have been used to assess the scientific value, and the additional values of Snæfellsjökull, have been applied to Kirkjufell, which, however, lacks a cultural value and has not been the subject of relevant scientific publications. These two geosites have been assessed also in terms of their aesthetic value, based on their visibility and prominent structures. In regard to the other sites in the Snæfellsnes Peninsula, all have a considerable scientific value and a potentially high educational value, enhanced by their accessibility and safety.
All the geosites in the NVZ, located in the three selected areas, have major scientific value, in that they are representative of tectonic and volcanic processes (most of which are active) documented in several scientific publications. In addition to that, the geosites along the HFF are very rare at the scale of Iceland, and the triple junction (Figure 4f) is extremely uncommon at the worldwide level.
With reference to the educational value, all of the considered geosites in the NVZ share the advantage of being suitable for teaching and communication purposes. In fact, they are outstanding outcrops or flat-lying surfaces, where volcanic and tectonic processes are visible in such a way as to be understood by the lay public as well. However, with the exception of two geosites along the HFF (Figure 4b,d) and one in the ThFS (Figure 8a), most are located in areas that are difficult to reach. Therefore, their educational value is diminished and it has been necessary to come up with strategies to communicate them, making them accessible in a “virtual” fashion, as illustrated in the following paragraph.
5.2. Geosite Visualization, Fruition and Communication
The selected geosites are situated in two Icelandic “milestone” areas: the Snæfellsnes Peninsula and the Northern Volcanic Zone. In describing the selected geosites, which are outcrops, geological objects and features at scales from a few centimeters to kilometers, we have made use of: (i) field photographs, (ii) highly detailed images captured by unmanned aerial vehicles (UAVs) and (iii) 3-D models elaborated by way of Structure-from-Motion techniques (SfM).
In the following section, we will highlight the advantages offered by each of the above types of visualization techniques. Starting with the first geoheritage area, the Snæfellsnes Peninsula, it is worth pointing out that, when studying the area back in 2012, our research team hadn’t experimented with UAV-based techniques yet. However, we believe that the field photographs provided above are effective in capturing some key examples of the Icelandic geoheritage. In particular, while Figure 2b,c display milestone geosites famous all over the world, Figure 2d and Figure 3a are suitable for introducing the concepts of monogenetic cone morphology and alignment as indicators of the direction of a feeding fracture below the surface; this, in turn, is the expression of the tectonic regime at the time of the development of the cones. In this particular case, it cannot be denied that a UAV-captured image would have made the observation of these geosites much clearer for the viewer. Regarding the other four field photographs in Figure 3 aimed at showing the geometry of subvolcanic intrusions in the field, in this case, a UAV-captured image wouldn’t be effective. In fact, a high-resolution field photograph taken from a distance of about two kilometers (such as the one in Figure 3d) is capable of communicating the concept of a sheet swarm intersection in a much more effective fashion.
With regard to the Northern Volcanic Zone, our research team has studied this area since 2015, a time period over which we have progressively used more and more UAV-captured images for visually describing outcrops and interpreting volcano–tectonic processes. The first figure, aimed at showcasing the importance of the Husavik–Flatey Fault (HFF), is composed exclusively of field photographs, two of which (Figure 4b,c) are the perfect choice in terms of showing details of the fault at the outcrop scale, including an example (Figure 4c) of right-lateral offset across a lava tube. With regard to Figure 4d, the selected picture, taken several kilometers away from the HFF fault plane, represents the best choice for communicating two geological concepts at the same time: the considerable size of the vertical offset along a giant transform fault like the HFF (the result of transtensional tectonics) and the level of seismic risk affecting the nearby town of Husavik, indicated by an arrow in the background. Figure 4e is another field-taken picture, useful to explaining the effects of strike–slip faulting on landforms. Here, we highlighted the fault trace by way of a black dashed line, as well as the offset of river gullies (with light-blue dashed lines).
In order to show the intersection between the HFF and the westernmost fault of the ThFS, the field picture in Figure 4f was taken from a perspective that allows us to “intuitively guess” the different orientations of the two faults and their connection in the location indicated by the black arrow. Unfortunately, we do not have any suitable UAV-captured image, nor do we have a 3-D model that would have made the contents of this geosite much more compelling and easy to communicate.
As we have surveyed other locations in the ThFS by using UAVs, Figure 8 provides a combination of field-based and drone-taken photographs. Figure 8a is an oblique, UAV-captured perspective that enables the viewer to take a look at the effects of extensional tectonics in the form of the development of a graben. Figure 8b is a field picture taken from the top of the footwall block of a dip–slip fault. The obliquity of this point of view is helpful in illustrating the geometry of this type of rifting-produced normal fault. Figure 8c is another UAV-captured image, which has the advantage of showing the scale of the process of extensional fracturing. As already underscored, in this case, extensional forces across these fractures have been at work for a very long time, as expressed by the extreme degree of dilation; on the contrary, only a close-up photograph like the one in Figure 8d can help visualize the process of extensional fracturing across very recent extensional fractures with centimetric dilation. A UAV-captured photograph like the one in Figure 8e, on the contrary, is the best option to offer a view across the flat-lying floor of the rift zone, punctuated by recent lava flows and scattered eruptive centers such as the one in the foreground.
As underscored in the previous paragraph, the educational value of the geosites in the ThFS is hampered by their limited accessibility. To make the most of the didactic relevance of the geosites illustrated in Figure 8a–c, we produced 3-D models by following the workflow outlined in Chapter 3. Figure 9 shows that 3-D models are even more effective than individual UAV-taken pictures in explaining volcano–tectonic concepts. Figure 9a represents a step forward in showing the structure of a graben. Here, the presence of the road that crosses this extensional structure aids in communicating the topic of geological hazards affecting man-made structures. Additionally, Figure 9b can be regarded as an improvement of the previous Figure 8b in terms of visualizing the process of dip–slip faulting. The same goes for Figure 9c, which allows us to view the effects of extensional fracturing and the extent to which the rifting processes have been opening the fractures over time (this is made possible by the scale, represented by the UAV pilot). With the purpose of enhancing the popularization and fruition of these three geosites in the ThFS, we uploaded three “Virtual Outcrops” [92,93,94] on the web. 3-D DOMs can also be navigated through Virtual Reality techniques, as described in recent contributions [95,97,120,121]. The geosite in Figure 9a is accessible in Virtual Outcrop format at [122]. The 3-D model in Figure 9b is accessible in Virtual Outcrop format at [123]. The geosite in Figure 9c is available as Virtual Outcrop at [124].
The online fruition of these Virtual Outcrops is greatly enhanced by the possibility to rotate the images and zoom in to examine the outcrops’ tiniest details. This way, it is possible to accomplish two key goals: firstly, to popularize the selected geosites, making them “accessible” and, thus, enhancing their educational value and, secondly, to communicate Earth Science topics to a potentially wider audience, including younger people usually very keen on technological and interactive applications.
With regard to the geosites in the Krafla Fissure Swarm (KFS), we also used a combination of three types of visualization techniques: Figure 10b is a field photograph that, taken from a volcanic ridge, provides a clear view of a graben, which is different from the one in the ThFS, as the faults bordering it have a curvilinear arrangement. All the geosites in Figure 11 have been illustrated through the combination of field pictures and UAV-captured photographs. Figure 11a, taken from the top of a slope, aids in showing two of the main features of active rift zones: monogenetic volcanoes and their effusive eruptive products, or lava flows. Figure 11b displays the amount of dilation produced by extensional fracturing, whereas Figure 11c is aimed at visualizing, from a short distance, the “encounter” between a lava flow and an extension fracture, a rather common occurrence in active rift zones where fracturing, faulting and lava outpouring are all guided by the combination of the regional, extensional regime and the presence of magma upwelling from underneath. A UAV-captured image (Figure 11d) is more helpful than a field picture in showing the coexistence of two different products of extensional tectonics: the growth of volcanic edifices (here represented by the Pleistocene-age Hituholar Volcano) and the development of extension fractures. Figure 11e is another example of how a UAV-taken photograph can make the difference in showing volcano–tectonic processes in a rift zone. The scale, represented by the UAV pilot standing on top of the fault’s footwall block, helps to point out the much more pervasive effects produced by faulting, in comparison to extensional fracturing.
Finally, Figure 12 is dedicated to 3-D models that, as already discussed, can play a paramount role in Earth Science communication. For example, Figure 12a is aimed at highlighting the presence of a man-made structure (the track) parallel to the trend of this fracture field. Figure 12b, just like the previously commented Figure 9b, works well to illustrate the geometry of a dip–slip fault and the displacement along it. Figure 12c provides a different perspective of the interaction between magmatic and tectonic processes. Here, it is possible to vividly illustrate (an added value with respect to Figure 11c) the movement of the lava flow, and also the structures produced by the lava, slowly creeping towards the gaping fracture.
As underscored for the ThFS, in order to enhance the popularization and fruition of three geosites in the KFS, we published three “Virtual Outcrops”. The geosite in Figure 12a is available in Virtual Outcrop format at [125]. The 3-D model in Figure 12b is available in Virtual Outcrop format at [126]. The geosite in Figure 12c is accessible in Virtual Outcrop at [127].
6. Conclusions
Among all the areas that compose the Icelandic “open-air geological museum”, we selected the Snaefellsnes Peninsula and the Northern Volcanic Zone (NVZ), which are home to a wide gamut of subvolcanic and volcano–tectonic outcrops and landforms, many of which can be considered potential geosites, as they reflect the multifaceted variety of the Icelandic geoheritage. Our purpose has been to document, describe and assess a number of geosites based on a set of criteria chosen from previous research efforts focused on geoheritage, geoconservation and geotourism. We have selected a total of 25 geosites, 8 in the Snæfellsnes Peninsula and 17 in the NVZ (five along the HFF, six in the ThFS and six in the KFS).
The qualitative assessment we performed can be summarized by pointing out that the majority of the geosites in both areas have a high scientific value. However, only the geosites in the Snæfellsnes Peninsula may be regarded as having an overall educational value, thanks to their accessibility; in the case of Snæfellsjökull Volcano and Kirkjufell, there is also the possibility, offered to visitors, to take part in guided tours and other educational activities. Of the 17 geosites in the NVZ, only three are easily accessible, and this hampers their educational value.
The promotion of geosites, especially those which are not easily accessible, can be achieved through an accurate work of illustration, description and popularization. To accomplish these goals, we have made use of a range of visualization techniques, from field photographs to highly detailed images captured by unmanned aerial vehicles (UAVs) and 3-D models of field outcrops produced by means of Structure-From-Motion (SfM) photogrammetry. At the same time as showcasing the selected geosites, we discussed and compared the advantages provided by the different types of image-taking techniques, from traditional ones such as field photographs to more advanced ones such as UAV-based photographs and 3-D models. Finally, with the aim of making it possible, for potential users, to interact with the geosites through Virtual Reality techniques, we have uploaded six Virtual Outcrops online.
This may represent a novel, cutting-edge approach to improve geoheritage popularization and geoscience communication, allowing for the engagement of a wider audience, with special reference to potential end-users from the younger generation.
Author Contributions
Original manuscript preparation, F.P.M., F.L.B. and C.V.; figure preparation, F.L.B.; supervision, F.P.M. All authors have read and agreed to the published version of the manuscript.
Funding
The present work was carried out in the framework of ILP Task Force II, “Structural and rheological constraints on magma migration, accumulation and eruption through the lithosphere” (2015–2019). It has also been carried out in the framework of ESA Project Nr. 38829 and MIUR project ACPR15T4_00098–Argo3D (http://argo3d.unimib.it/).
Acknowledgments
We are deeply grateful to three anonymous referees for their insightful comments and suggestions. We also acknowledge Alessandro Tibaldi for his feedback during the writing of this manuscript. This article is also an outcome of Project MIUR–Dipartimenti di Eccellenza 2018–2022. Agisoft Metashape is acknowledged for photogrammetric data processing. Fabio Marchese and Luca Fallati are acknowledged for ongoing scientific collaboration focused on UAV-based SfM techniques. Finally, this paper is an outcome of GeoVires, the Virtual Reality Lab for Earth Sciences, hosted at the Department of Earth and Environmental Sciences, University of Milan Bicocca, U4, Piazza della Scienza 4, 20126 Milan, Italy.
Conflicts of Interest
The authors declare no conflict of interest.
References
- Eberhard, R. Pattern and Process: Towards a Regional Approach to National Estate Assessment of Geodiversity; Technical Series No. 2; Eberhard, R., Ed.; Australian Heritage Commission and Environment Forest Taskforce: Canberra, Australian; Environment Australia: Canberra, Australian, 1997. [Google Scholar]
- Brocx, M.; Semeniuk, V. Geoheritage and geoconservation history, definition, scope and scale. J. R. Soc. West. Aust. 2007, 90, 53–87. [Google Scholar]
- Asrat, A.; Demissie, M.; Mogessie, A. Geoheritage conservation in Ethiopia: The case of the Simien mountains. Quaest. Geogr. 2012, 31, 7–23. [Google Scholar] [CrossRef] [Green Version]
- Fassoulas, C.; Mouriki, D.; Dimitriou-Nikolakis, P.; Iliopoulos, G. Quantitative assessment of geotopes as an effective tool for geoheritage management. Geoheritage 2012, 4, 177–193. [Google Scholar] [CrossRef]
- Wimbledon, W.A.P.; Smith-Meyer, S. Geoheritage in Europe and Its Conservation; Wimbledon, W.A.P., Smith-Meyer, S., Eds.; ProGEO: Oslo, Noruega, 2012; p. 405. [Google Scholar]
- Bruno, D.E.; Crowley, B.E.; Gutak, J.M.; Moroni, A.; Nazarenko, O.V.; Oheim, K.B.; Ruban, D.A.; Tiess, G.; Zorina, S.O. Paleogeography as geological heritage: Developing geosite classification. Earth Sci. Rev. 2014, 138, 300–312. [Google Scholar] [CrossRef]
- Brilha, J. Inventory and quantitative assessment of geosites and geodiversity sites: A review. Geoheritage 2016, 8, 119–134. [Google Scholar] [CrossRef] [Green Version]
- Dudley, N. Guidelines for Applying Protected Area Management Categories; Dudley, N., Ed.; IUCN: Gland, Switzerland, 2008. [Google Scholar]
- Reis, J.; Póvoas, L.; Barriga, F.J.A.S.; Lopes, C. Science education in a museum: Enhancing Earth Sciences literacy as a way to enhance public awareness of geological heritage. Geoheritage 2014, 6, 217–223. [Google Scholar] [CrossRef]
- Pasquaré Mariotto, F.; Venturini, C. Strategies and tools for improving Earth Science education and popularization in museums. Geoheritage 2017, 9, 187–194. [Google Scholar] [CrossRef]
- Venturini, C.; Pasquaré Mariotto, F. Geoheritage promotion through an interactive exhibition: A case study from the Carnic Alps, NE Italy. Geoheritage 2019, 11, 459–469. [Google Scholar] [CrossRef]
- De Grosbois, A.M.; Eder, W. Geoparks—A tool for education, conservation and recreation. Environ. Geol. 2008, 55, 465–466. [Google Scholar] [CrossRef]
- Mckeever, P.; Zouros, N.; Patzak, M. The UNESCO global network of national geoparks. In Geotourism. The Tourism of Geology and Landscape; Newsome, D., Dowling, R.K., Eds.; Goodfellow Publishers Ltd.: Oxford, UK, 2010; pp. 221–230. [Google Scholar]
- Pásková, M.; Zelenka, J. Sustainability management of unesco global geoparks. Sustain. Geosci. Geotourism 2018, 2, 44–64. [Google Scholar] [CrossRef]
- Panizza, M.; Piacente, S. Geomorphosites and geotourism. Revista Geográfica Acadêmica 2008, 2, 5–9. [Google Scholar]
- Newsome, D.; Dowling, R.K. Geotourism: The tourism of Geology and Landscape; Goodfellow Publishers Ltd.: Oxford, UK, 2010. [Google Scholar]
- Burek, C.V. The role of LGAPs (Local Geodiversity Action Plans) and Welsh RIGS as local drivers for geoconservation within geotourism in Wales. Geoheritage 2012, 4, 45–63. [Google Scholar] [CrossRef]
- Kubalíková, L. Geomorphosite assessment for geotourism purposes. Czech J. Tour. 2013, 2, 80–104. [Google Scholar] [CrossRef]
- Suzuki, A.; Takagi, H. Evaluation of geosite for sustainable planning and management in Geotourism. Geoheritage 2018, 10, 123–135. [Google Scholar] [CrossRef]
- Cleal, C.J. Geoconservation—What on Earth are we doing? In Regional Conference on Geoconservation: Geological Heritage in the South-European Europe Book of Abstracts; Hlad, B., Herlec, U., Eds.; Environmnetal Agency of the Republic of Slovenia: Ljubljana, Slovenia, 2007; p. 25. Available online: http://arsis.net/circular/ProGEO-Abstract.pdf (accessed on 22 February 2010).
- Burek, C.V.; Prosser, C.D. The History of Geoconservation: An introduction. Geol. Soc. London Spec. Pub. 2008, 300, 1–5. [Google Scholar] [CrossRef] [Green Version]
- Prosser, C.; Murphy, M.; Larwood, J. Geological Conservation: A Guide to Good Practice; English Nature: Peterborough, UK, 2011. [Google Scholar]
- Prosser, C.D. Our rich and varied geoconservation portfolio: The foundation for the future. Proc. Geol. Assoc. 2013, 124, 568–580. [Google Scholar] [CrossRef]
- Gordon, J.E. Geoheritage, Geotourism and the cultural landscape: Enhancing the visitor experience and promoting geoconservation. Geosciences 2018, 8, 136. [Google Scholar] [CrossRef] [Green Version]
- Reynard, E. Geosite. In Encyclopedia of Geomorphology; Goudie, A.S., Ed.; Routledge: London, UK, 2004. [Google Scholar]
- Ruban, D.A. Quantification of geodiversity and its loss. Proc. Geol. Assoc. 2010, 121, 326–333. [Google Scholar] [CrossRef]
- Ruban, D.A.; Kuo, I. Essentials of geological heritage site (geosite) management: A conceptual assessment of interests and conflicts. Nat. Nascosta 2010, 41, 16–31. [Google Scholar]
- Crofts, R.; Gordon, J.E. Geoconservation in protected areas. In Protected Area Governance and Management; Worboys, G.L., Lockwood, M., Kothari, A., Feary, S., Pulsford, I., Eds.; ANU Press: Canberra, Australia, 2015; pp. 531–568. [Google Scholar]
- Grandgirard, V. L’évaluation des géotopes. Geol. Insubr. 1999, 4, 59–66. [Google Scholar]
- Zorina, S.O.; Silantiev, V.V. Geosites, classification of. In Encyclopedia of Mineral and Energy Policy; Springer: Berlin/Heidelberg, Germany, 2014. [Google Scholar] [CrossRef]
- Lima, F.; Brilha, J.; Salamuni, E. Inventorying geological heritage in large territories: A methodological proposal applied to Brazil. Geoheritage 2010, 2, 91–99. [Google Scholar] [CrossRef] [Green Version]
- Reynard, E.; Fontana, G.; Kozlik, L.; Scapozza, C. A method for assessing “scientific” and “additional values” of geomorphosites. Geogr. Helv. 2007, 62, 148–158. [Google Scholar] [CrossRef]
- Coratza, P.; Giusti, C. Methodological proposal for the assessment of the scientific quality of of geomorphosites. Il Quat. 2005, 18, 307–313. [Google Scholar]
- Coratza, P.; Panizza, M. (Eds.) Geomorphology and Cultural Heritage; Memorie Descrittive Della Carta Geologica d’Italia; ISPRA: Rome, Italy, 2009; p. 87. [Google Scholar]
- Ólafsdóttir, R.; Tverijonaite, E. Geotourism: A systematic literature review. Geosciences 2018, 8, 234. [Google Scholar] [CrossRef] [Green Version]
- Ólafsdóttir, R.; Dowling, R. Geotourism and Geoparks. A tool for geoconservation and rural development in vulnerable environments: A case study from Iceland. Geoheritage 2014, 6, 71–87. [Google Scholar] [CrossRef]
- Ásbjörnsdóttir, L. The VIII international ProGEO symposium in reykjavík, 2015. Geoheritage 2018, 10, 139–142. [Google Scholar] [CrossRef]
- Einarsson, P.; Sæmundsson, K. Earthquake epicenters 1982–1985 and volcanic systems in Iceland: A map. In Í Hlutarins Eðli, Festschriftfor Þorbjörn Sigurgeirsson; Menningarsjóður, R., Sigfússon, Þ., Eds.; Menningarsjodur: Reykjavik, Iceland, 1987. [Google Scholar]
- Bonali, F.L.; Tibaldi, A.; Marchese, F.; Fallati, L.; Russo, E.; Corselli, C.; Savini, A. UAV-based surveying in volcano-tectonics: An example from the Iceland rift. J. Struct. Geol. 2019, 121, 46–64. [Google Scholar] [CrossRef]
- Fallati, L.; Polidori, A.; Salvatore, C.; Saponari, L.; Savini, A.; Galli, P. Anthropogenic Marine Debris assessment with Unmanned Aerial Vehicle imagery and deep learning: A case study along the beaches of the Republic of Maldives. Sci. Total Environ. 2019, 693, 133581. [Google Scholar] [CrossRef]
- Jacoby, W.; Gudmundsson, A. Hotspot iceland: An introduction. J. Geodyn. 2007, 43, 1–5. [Google Scholar] [CrossRef]
- Einarsson, P. Plate boundaries, rifts and transforms in Iceland. Jokull 2008, 58, 35–58. [Google Scholar]
- Jakobsdóttir, S.S.; Roberts, M.J.; Guðmundsson, G.B.; Geirsson, H.; Slunga, R. Earthquake swarms at Upptyppingar, North-east Iceland: A sign of magma intrusion? Stud. Geophys. Geod. 2008, 52, 513–528. [Google Scholar]
- Mjelde, R.; Digranes, P.; van Schaack, M.; Shimamura, H.; Shiobara, H.; Kodaira, S.; Næss, O. Crustal structure of the outer Vøring Plateau, offshore Norway, from ocean bottom seismic and gravity data. J. Geophys. Res. 2001, 106, 6769–6791. [Google Scholar] [CrossRef]
- Gudmundsson, A. Dynamics of volcanic systems in Iceland: Example of tectonism and volcanism at juxtaposed hot spot and mid-ocean ridge systems. Ann. Rev. Earth Planet. Sci. 2000, 28, 107–140. [Google Scholar] [CrossRef]
- Flude, S.; Burgess, R.; McGarvie, D.W. Silicic volcanism at Ljósufjöll, Iceland: Insights into evolution and eruptive history from Ar–Ar dating. J. Volcanol. Geotherm. 2008, 169, 154–175. [Google Scholar] [CrossRef]
- Tibaldi, A.; Bonali, F.L.; Pasquaré Mariotto, F.; Rust, D.; Cavallo, A.; D’Urso, A. Structure of regional dykes and local cone sheets in the Midhyrna-Lysuskard area, Snaefellsnes Peninsula (NW Iceland). Bull. Volcanol. 2013, 75, 764–780. [Google Scholar] [CrossRef]
- Young, K.D.; Jancin, B.; Orkan, N.I. Transform deformation of tertiary rocks along the Tjornes Fracture Zone, North Central Iceland. J. Geophys. Res. 1985, 90, 9986–10010. [Google Scholar] [CrossRef]
- Bergerat, F.; Angelier, J. Immature and mature transform zones near a hot spot: The South Iceland Seismic Zone and the Tjornes Fracture Zone (Iceland). Tectonophysics 2008, 447, 142–154. [Google Scholar] [CrossRef]
- Opheim, J.O.; Gudmundsson, A. Formation and geometry of fractures, and related volcanism, of the Krafla fissure swarm, northeast Iceland. Geol. Soc. Am. Bull. 1989, 101, 1608–1622. [Google Scholar] [CrossRef]
- Garcia, S.; Dhont, D. Structural analysis of the Húsavík-Flatey Transform Fault and its relationships with the rift system in Northern Iceland. Geodin. Acta 2005, 18, 31–41. [Google Scholar] [CrossRef] [Green Version]
- Slater, L.; McKenzie, D.; Gronvold, K.; Shimizu, N. Melt generation and movement under Theistareykir, NE Iceland. J. Petrol. 2001, 42, 321–354. [Google Scholar] [CrossRef] [Green Version]
- Stracke, A.; Zindler, A.; Salters, V.J.M.; McKenzie, D.; Blichert-Toft, J.; Albarède, F.; Gronvold, K. Theistareykir revisited. Geochem. Geophys. Geosyst. 2003, 4, 8507. [Google Scholar] [CrossRef]
- Tibaldi, A.; Bonali, F.L.; Einarsson, P.; Hjartardóttir, Á.R.; Pasquarè Mariotto, F.A. Partitioning of Holocene kinematics and interaction between the Theistareykir Fissure Swarm and the Husavik-Flatey Fault, North Iceland. J. Struct. Geol. 2016, 83, 134–155. [Google Scholar] [CrossRef]
- Bonali, F.L.; Tibaldi, A.; Pasquaré Mariotto, F.; Saviano, D.; Meloni, A.; Sajovitz, P. Geometry, oblique kinematics and extensional strain variation along a diverging plate boundary: The example of the northern Theistareykir Fissure Swarm, NE Iceland. Tectonophysics 2019, 756, 57–72. [Google Scholar] [CrossRef]
- Metzger, S.; Jonsson, S.; Danielsen, G.; Hreinsdottir, S.; Jouanne, F.; Giardini, D.; Villemin, T. Present kinematics of the Tjornes Fracture Zone, North Iceland, from campaign and continuous GPS measurements. Geophys. J. Int. 2013, 192, 441–455. [Google Scholar] [CrossRef]
- Gudmundsson, A. Infrastructure and evolution of ocean-ridge discontinuities in Iceland. J. Geodyn. 2007, 43, 6–29. [Google Scholar] [CrossRef]
- Gudmundsson, A.; Brynjolfsson, S.; Jonsson, M.T. Structural analysis of a transform fault-rift zone junction in North Iceland. Tectonophysics 1993, 220, 205–221. [Google Scholar] [CrossRef]
- Fjäder, K.; Gudmundsson, A.; Forslund, T. Dikes, minor faults and mineral veins associated with a transform fault in North Iceland. J. Struct. Geol. 1994, 16, 109–119. [Google Scholar] [CrossRef]
- Magnúsdòttir, S.; Brandsdòttir, B. 2011. Tectonics of the þeistareykir fissure swarm. Jokull 2011, 61, 65–79. [Google Scholar]
- Pasquaré Mariotto, F.; Bonali, F.L.; Tibaldi, A.; Rust, D.; Oppizzi, P.; Cavallo, A. Holocene displacement field at an emerged oceanic transform-ridge junction: The Husavik-Flatey Fault—Gudfinnugja Fault system, North Iceland. J. Struct. Geol. 2015, 75, 118–134. [Google Scholar] [CrossRef] [Green Version]
- Tibaldi, A.; Bonali, F.L.; Pasquaré Mariotto, F.A. Interaction between transform faults and rift systems: A combined field and experimental approach. Front. Earth Sci. 2016, 4, 33. [Google Scholar] [CrossRef] [Green Version]
- Tibaldi, A.; Bonali, F.L.; Pasquaré Mariotto, F.A.; Russo, E. Interplay between inherited rift faults and transcurrent structures: Insights from analogue models and field data from Iceland. Glob. Planet. Chang. 2018, 171, 88–109. [Google Scholar] [CrossRef]
- Tibaldi, A.; Bonali, F.L.; Pasquaré Mariotto, F.A.; Ranieri Tenti, L.M. The development of divergent margins: Insights from the North Volcanic Zone, Iceland. Earth Planet. Sci. Lett. 2019, 509, 1–8. [Google Scholar] [CrossRef]
- Jordan, B.R. A bird’s-eye view of geology: The use of micro drones/UAVs in geologic fieldwork and education. Geol. Soc. Am. Today 2015, 25, 50–52. [Google Scholar] [CrossRef]
- Pavlis, T.L.; Mason, K.A. The new world of 3D geologic mapping. Geol. Soc. Am. Today 2017, 27, 4–10. [Google Scholar] [CrossRef]
- Zekkos, D.; Manousakis, J.; Athanasopoulos-Zekkos, A.; Clark, M.; Knoper, L.; Massey, C.; Archibald, G.; Greenwood, W.; Hemphill-Haley, M.; Rathje, E.; et al. Structure-from-Motion based 3D mapping of landslides & fault rupture sites during 2016 Kaikoura earthquake reconnaissance. In Proceedings of the 11th U.S. National Conference on Earthquake Engineering, Integrating Science, Engineering & Policy, Los Angeles, CA, USA, 25–29 June 2018. [Google Scholar]
- Yao, Y.; Chen, J.; Li, T.; Fu, B.; Wang, H.; Li, Y.; Jia, H. Soil liquefaction in seasonally frozen ground during the 2016 Mw6. 6 Akto earthquake. Soil Dyn. Earthq. Eng. 2019, 117, 138–148. [Google Scholar] [CrossRef]
- Gong, J.H.; Wang, D.C.; Li, Y.; Zhang, L.H.; Yue, Y.J.; Zhou, J.P.; Song, Y.Q. Earthquake induced geological hazard detection under hierarchical stripping classification framework in the Beichuan area. Landslides 2010, 7, 181–189. [Google Scholar] [CrossRef]
- Rathje, E.M.; Franke, K. Remote sensing for geotechnical earthquake reconnaissance. Soil Dyn. Earthq. Eng. 2016, 91, 304–316. [Google Scholar] [CrossRef] [Green Version]
- Brook, M.S.; Merkle, J. Monitoring active landslides in the Auckland region utilising UAV/structure-from-motion photogrammetry. Jpn. Geotech. Soc. Spec. Publ. 2019, 6, 1–6. [Google Scholar] [CrossRef] [Green Version]
- Cignetti, M.; Godone, D.; Wrzesniak, A.; Giordan, D. Structure from motion multisource application for landslide characterization and monitoring: The champlas du col case study, sestriere, North-Western Italy. Sensors 2019, 19, 2364. [Google Scholar] [CrossRef] [Green Version]
- Warrick, J.A.; Ritchie, A.C.; Schmidt, K.M.; Reid, M.E.; Logan, J. Characterizing the catastrophic 2017 Mud Creek landslide, California, using repeat structure-from-motion (SfM) photogrammetry. Landslides 2019, 16, 1201–1219. [Google Scholar] [CrossRef]
- Müller, D.; Walter, T.R.; Schöpa, A.; Witt, T.; Steinke, B.; Gudmundsson, M.T.; Dürig, T. High-resolution digital elevation modeling from TLS and UAV campaign reveals structural complexity at the 2014/2015 holuhraun eruption site, Iceland. Front. Earth Sci. 2017, 5, 59. [Google Scholar] [CrossRef] [Green Version]
- Darmawan, H.; Walter, T.R.; Brotopuspito, K.S.; Nandaka, I.G.M.A. Morphological and structural changes at the Merapi lava dome monitored in 2012–2015 using unmanned aerial vehicles (UAVs). J. Volcanol. Geotherm. Res. 2018, 349, 256–267. [Google Scholar] [CrossRef]
- Favalli, M.; Fornaciai, A.; Nannipieri, L.; Harris, A.; Calvari, S.; Lormand, C. UAV-based remote sensing surveys of lava flow fields: A case study from Etna’s 1974 channel-fed lava flows. Bull. Volcanol. 2018, 80, 29. [Google Scholar] [CrossRef]
- De Beni, E.; Cantarero, M.; Messina, A. UAVs for volcano monitoring: A new approach applied on an active lava flow on Mt. Etna (Italy), during the 27 February–02 March 2017 eruption. J. Volcanol. Geotherm. Res. 2019, 369, 250–262. [Google Scholar] [CrossRef]
- Hashemi-Beni, L.; Jones, J.; Thompson, G.; Johnson, C.; Gebrehiwot, A. Challenges and Opportunities for UAV-based digital elevation model generation for flood-risk management: A case of Princeville, North Carolina. Sensors 2018, 18, 3843. [Google Scholar] [CrossRef] [Green Version]
- Langhammer, J.; Vackova, T. Detection and mapping of the geomorphic effects of flooding using UAV photogrammetry. Pure Appl. Geophys. 2018, 175, 3223–3245. [Google Scholar] [CrossRef]
- Johnson, K.; Nissen, E.; Saripalli, S.; Arrowsmith, J.R.; McGarey, P.; Scharer, K.; Williams, P.; Blisniuk, K. Rapid mapping of ultrafine fault zone topography with structure from motion. Geosphere 2014, 10, 969–986. [Google Scholar] [CrossRef]
- Angster, S.; Wesnousky, S.; Huang, W.L.; Kent, G.; Nakata, T.; Goto, H. Application of UAV photography to refining the slip rate on the Pyramid Lake fault zone, Nevada. Bull. Seismol. Soc. Am. 2016, 106, 2. [Google Scholar] [CrossRef] [Green Version]
- Deffontaines, B.; Chang, K.J.; Champenois, J.; Fruneau, B.; Pathier, E.; Hu, J.-C.; Lu, S.-T.; Liu, Y.C. Active interseismic shallow deformation of the Pingting terraces (Longitudinal Valley–Eastern Taiwan) from UAV high-resolution topographic data combined with InSAR time series. Geomat. Nat. Hazards Risk 2016, 8, 120–136. [Google Scholar] [CrossRef] [Green Version]
- Jiao, Q.; Jiang, W.; Zhang, J.; Jiang, H.; Luo, Y.; Wang, X. Identification of paleoearthquakes based on geomorphological evidence and their tectonic implications for the southern part of the active Anqiu–Juxian fault, eastern China. J. Asian Earth Sci. 2016, 132, 1–8. [Google Scholar] [CrossRef]
- Bi, H.; Zheng, W.; Ren, Z.; Zeng, J.; Yu, J. Using an unmanned aerial vehicle for topography mapping of the fault zone based on structure from motion photogrammetry. Int. J. Remote Sens. 2017, 38, 2495–2510. [Google Scholar] [CrossRef]
- Gao, M.; Xu, X.; Klinger, Y.; van der Woerd, J.; Tapponnier, P. High-resolution mapping based on an Unmanned Aerial Vehicle (UAV) to capture paleoseismic offsets along the Altyn-Tagh fault, China. Sci. Rep. 2017, 7, 8281. [Google Scholar] [CrossRef] [PubMed]
- Wu, F.; Ran, Y.; Xu, L.; Cao, J.; Li, A. Paleoseismological study of the Late Quaternary slip-rate along the South Barkol Basin Fault and its tectonic implications, Eastern Tian Shan, Xinjiang. Acta Geol. Sin. Engl. Ed. 2017, 91, 429–442. [Google Scholar] [CrossRef]
- Rao, G.; He, C.; Cheng, Y.; Yu, Y.; Hu, J.; Chen, P.; Yao, Q. Active normal faulting along the Langshan Piedmont Fault, North China: Implications for slip partitioning in the western Hetao Graben. J. Geol. 2018, 126, 99–118. [Google Scholar] [CrossRef]
- Trippanera, D.; Ruch, J.; Passone, L.; Jónsson, S. Structural mapping of dike-induced faulting in Harrat Lunayyir (Saudi Arabia) by using high resolution drone imagery. Front. Earth Sci. 2019, 7, 168. [Google Scholar] [CrossRef]
- Westoby, M.J.; Brasington, J.; Glasser, N.F.; Hambrey, M.J.; Reynolds, J.M. “Structure-from-Motion” photogrammetry: A low-cost, effective tool for geoscience applications. Geomorphology 2012, 179, 300–314. [Google Scholar] [CrossRef] [Green Version]
- Chesley, J.T.; Leier, A.L.; White, S.; Torres, R. Using unmanned aerial vehicles and structure-from-motion photogrammetry to characterize sedimentary outcrops: An example from the Morrison Formation, Utah, USA. Sediment. Geol. 2017, 354, 1–8. [Google Scholar] [CrossRef]
- James, M.R.; Robson, S.; d’Oleire-Oltmanns, S.; Niethammer, U. Optimising UAV topographic surveys processed with structure-from-motion: Ground control quality, quantity and bundle adjustment. Geomorphology 2017, 280, 51–66. [Google Scholar] [CrossRef] [Green Version]
- Xu, X.; Aiken, C.L.; Nielsen, K.C. Real time and the virtual outcrop improve geological field mapping. Eos Trans. Am. Geophys. Union 1999, 80, 317–324. [Google Scholar] [CrossRef]
- Tavani, S.; Granado, P.; Corradetti, A.; Girundo, M.; Iannace, A.; Arbués, P.; Muñozb, J.A.; Mazzoli, S. Building a virtual outcrop, extracting geological information from it, and sharing the results in Google Earth via OpenPlot and Photoscan: An example from the Khaviz Anticline (Iran). Comput. Geosci. 2014, 63, 44–53. [Google Scholar] [CrossRef]
- Trinks, I.; Clegg, P.; McCaffrey, K.; Jones, R.; Hobbs, R.; Holdsworth, B.; Holliman, N.; Imber, J.; Waggott, S.; Wilson, R. Mapping and analysing virtual outcrops. Vis. Geosci. 2005, 10, 13–19. [Google Scholar] [CrossRef]
- Gerloni, I.G.; Carchiolo, V.; Vitello, F.R.; Sciacca, E.; Becciani, U.; Costa, A.; Riggi, S.; Bonali, F.L.; Russo, E.; Fallati, L.; et al. Immersive virtual reality for earth sciences. In Proceedings of the 2018 Federated Conference on Computer Science and Information Systems (FedCSIS), Poznań, Poland, 9–12 September 2018; IEEE: Piscataway, NJ, USA, 2018; pp. 527–534. [Google Scholar]
- Varvara, A.; Nomikou, P.; Pavlina, B.; Pantelia, S.; Bonali, F.L.; Lemonia, R.; Andreas, M. The Story Map for Metaxa Mine (Santorini, Greece): A unique site where history and volcanology meet each other. In Proceedings of the 5th International Conference on Geographical Information Systems Theory, Applications and Management (GISTAM 2019), Heraklion, Crete, Greece, 3–5 May 2019; pp. 212–219. [Google Scholar]
- Krokos, M.; Bonali, F.L.; Vitello, F.; Antoniou, V.; Becciani, U.; Russo, E.; Marchese, F.; Fallati, L.; Nomikou, P.; Kearl, M.; et al. Workflows for virtual reality visualisation and navigation scenarios in Earth Sciences. In Proceedings of the 5th International Conference on Geographical Information Systems Theory, Applications and Management, GISTAM 2019, Heraklion, Crete, Greece, 3–5 May 2019; pp. 297–304. [Google Scholar]
- Vollgger, S.A.; Cruden, A.R. Mapping folds and fractures in basement and cover rocks using UAV photogrammetry, Cape Liptrap and Cape Paterson, Victoria, Australia. J. Struct. Geol. 2016, 85, 168–187. [Google Scholar] [CrossRef]
- James, M.R.; Robson, S. Straightforward reconstruction of 3D surfaces and topography with a camera: Accuracy and geoscience application. J. Geophys. Res. 2012, 117, F03017. [Google Scholar] [CrossRef] [Green Version]
- Turner, D.; Lucieer, A.; Watson, C. An automated technique for generating georectified mosaics from ultra-high resolution unmanned aerial vehicle (UAV) imagery, based on structure from motion (SfM) point clouds. Remote Sens. 2012, 4, 1392–1410. [Google Scholar] [CrossRef] [Green Version]
- Burns, J.H.R.; Delparte, D. Comparison of commercial structure-from-motion photogrammetry software used for underwater three-dimensional modeling of coral reef environments. Int. Arch. Photogramm. Remote Sens. Spat. Inf. Sci. ISPRS Arch. 2017, 42, 127–131. [Google Scholar] [CrossRef] [Green Version]
- Stal, C.; Bourgeois, J.; De Maeyer, P.; De Mulder, G.; De Wulf, A.; Goossens, R.; Hendrickx, M.; Nuttens, T.; Stichelbaut, B. Test case on the quality analysis of structure from motion in airborne applications. In 32nd EARSeL Symposium: Advances in Geosciences; European Association of Remote Sensing Laboratories (EARSeL): Mykonos, Greece, 2012. [Google Scholar]
- Grandgirard, V. Géomorphologie, protection de la nature et gestion du paysage. Thèse de Doctorat en Géographie, Université de Fribourg, Fribourg, Switzerland, 1997; p. 210. Available online: https://www.persee.fr/doc/karst_0751-7688_2000_num_35_1_2461_t1_0064_0000_2 (accessed on 31 January 2020).
- Kokfelt, T.F.; Hoernle, K.; Lundstrom, C.; Hauff, F.; van den Bogaard, C. Time-scale for magmatic differentiation at the Snaefellsjokull central volcano, western Iceland: Constraints from U-Th-Pa-Ra-disequilibria in post-glacial lavas. Geochem. Cosmochem. Acta 2009, 73, 1120–1144. [Google Scholar] [CrossRef]
- Corazzato, C.; Tibaldi, A. Fracture control on type, morphology and distribution of parasitic volcanic cones: An example from Mt. Etna, Italy. J. Volcanol. Geotherm. Res. 2006, 158, 177–194. [Google Scholar] [CrossRef]
- Bonali, F.L.; Corazzato, C.; Tibaldi, A. Identifying rift zones on volcanoes: An example from La Réunion Island. Indian Ocean. Bull. Volcanol. 2011, 73, 347–366. [Google Scholar] [CrossRef]
- Tibaldi, A.; Bonali, F.L. Intra-arc and back-arc volcano-tectonics: Magma pathways at Holocene Alaska-Aleutian volcanoes. Earth Sci. Rev. 2017, 167, 1–26. [Google Scholar] [CrossRef]
- Gudmundsson, A.; Pasquarè Mariotto, F.A.; Tibaldi, A. Dykes, Sills, Laccoliths, and Inclined Sheets in Iceland. In Physical Geology of Shallow Magmatic Systems; Breitkreutz, C., Rocchi, S., Eds.; Springer: Cham, Germany, 2014. [Google Scholar]
- Scudero, S.; De Guidi, G.; Gudmundsson, A. Size distributions of fractures, dykes, and eruptions on Etna, Italy: Implications for magma-chamber volume and eruption potential. Sci. Rep. 2019, 9, 4139. [Google Scholar] [CrossRef]
- Tibaldi, A.; Pasquaré Mariotto, F.; Papanikolaou, D.; Nomikou, P. Discovery of a huge sector collapse at the Nisyros volcano, Greece, by on-land and offshore geological-structural data. J. Volcanol. Geotherm. Res. 2008, 177, 485–499. [Google Scholar] [CrossRef]
- Pasquaré Mariotto, F.; Tibaldi, A. Structure of a sheet–laccolith system revealing the interplay between tectonic and magma stresses at Stardalur Volcano, Iceland. J. Volcanol. Geotherm. Res. 2007, 161, 131–150. [Google Scholar] [CrossRef]
- Tibaldi, A.; Vezzoli, L.; Pasquaré Mariotto, F.; Rust, D. Strike-slip fault tectonics and the emplacement of sheetelaccolith systems: The Thverfell case study (SW Iceland). J. Struct. Geol. 2008, 30, 274–290. [Google Scholar] [CrossRef]
- Tibaldi, A.; Pasquaré Mariotto, F. A new mode of inner volcano growth: The “flower intrusive structure”. Earth Planet. Sci. Lett. 2008, 271, 202–208. [Google Scholar] [CrossRef]
- Tibaldi, A.; Pasquaré Mariotto, F.; Rust, D. New insights into the cone–sheet structure of the Cuillin Complex, Isle of Skye, Scotland. J. Geol. Soc. 2011, 168, 689–704. [Google Scholar] [CrossRef]
- Bistacchi, A.; Tibaldi, A.; Pasquaré Mariotto, F.; Rust, D. The association of cone-sheets and radial dykes: Data from the Isle of Skye (UK), numerical modelling, and implications for shallow magma chambers. Earth Planet Sci. Lett. 2012, 339–340, 46–56. [Google Scholar] [CrossRef]
- Gianelli, G. Cumulus textures of the Midhyrna layered intrusion. Boll. Soc. Geol. Ital. 1972, 91, 419–438. [Google Scholar]
- Hjartardóttir, A.R.; Einarsson, P.; Bramham, E.; Wright, T.J. The Krafla fissure swarm, Iceland, and its formation by rifting events. Bull. Volcanol. 2012, 74, 2139–2153. [Google Scholar] [CrossRef]
- Thordarson, T.; Larsen, G. Volcanism in Iceland in historical time: Volcano types, eruption styles and eruptive history. J. Geodyn. 2007, 43, 118–152. [Google Scholar] [CrossRef]
- Kubalíková, L. Assessing geotourism resources on a local level: A case study from southern Moravia (Czech Republic). Resources 2019, 8, 150. [Google Scholar] [CrossRef] [Green Version]
- Bonali, F.L.; Tibaldi, A.; Russo, E.; Pasquaré Mariotto, F.; Marchese, F.; Fallati, L.; Savini, A.; Vitello, F.; Becciani, U.; Sciacca, E. Immersive virtual reality for studying volcano-tectonic features: A case study from the northern active rift zone of Iceland. In Geophysical Research Abstracts; EGU2019-1159. EGU General Assembly 2019; EGU: Vienna, Austria, 2019; Volume 21. [Google Scholar]
- Bonali, F.L.; Russo, E.; Savini, A.; Marchese, F.; Fallati, L.; Nomikou, P.; Varvara, A.; Kyriaki, D.; Di Mauro, B.; Colombo, R.; et al. Learning outcomes from the EGU 2018 Public Engagement grant “Shaping geological 3D virtual field-surveys for overcoming motor disabilities”. In Geophysical Research Abstracts; EGU2019-8118, EGU General Assembly 2019; EGU: Vienna, Austria, 2019; Volume 21. [Google Scholar]
- Sketchfab. Available online: https://skfb.ly/6PKqL (accessed on 8 January 2020).
- Sketchfab. Available online: https://skfb.ly/6PKqR (accessed on 8 January 2020).
- Sketchfab. Available online: https://skfb.ly/6PK7U (accessed on 9 January 2020).
- Sketchfab. Available online: https://skfb.ly/6PKqx (accessed on 9 January 2020).
- Sketchfab. Available online: https://skfb.ly/6PK7G (accessed on 11 January 2020).
- Sketchfab. Available online: https://skfb.ly/6PJIM (accessed on 11 January 2020).
Figure 1.
(a) Volcanic systems of Iceland, modified after [38]. RPR: Reykjanes Peninsula Rift, WVZ: Western Volcanic Zone, EVZ: Eastern Volcanic Zone, CIVZ: Central Iceland Volcanic Zone and NVZ: Northern Volcanic Zone. The circles indicate central volcanoes belonging to active volcanic zones. GOR: Grímsey Oblique Rift, HFZ: Húsavík–Flatey Transform Zone, DAL: Dalvík Zone and KOR: Kolbeinsey Ridge. (b) Geyser eruption in Geysir. (c) The Thingvellir National Park. (d) The Herðubreið table mountain. (e) The Gullfoss Waterfall. (f) The southeasternmost section of the Vatnajökull Glacier, viewed from Höfn (SE Iceland).

Figure 2.
(a) Geological map of the Snæfellsnes Peninsula, modified after [47]. (b) Panoramic view of glacier-capped, 1446-m-high Snæfellsjökull stratovolcano. (c) Kirkjufell, or “Church Mountain”. (d) Textbook example of a monogenetic volcano (scoria cone), with indication (yellow arrows) of the crater rim’s depressed points, useful for assessing the trend of the underlying magma-feeding fracture.

Figure 3.
Field photographs of geosites in the Snæfellsnes Peninsula. (a) The alignment of monogenetic cones is a clear indicator of the direction of the underlying dyke feeding the cone growth. (b) A 1.2-m-thick, steeply-dipping dyke. (c) A shallow-dipping sheet (person for scale). (d) Panoramic view of the sheet swarms, cross-cutting each other in the right-hand side of the picture. (e) The typical appearance of a sill, concordant with the bedding of the overlying and underlying lava units (house for scale). (f) Detail of the columnar joints formed during cooling of the magma.

Figure 4.
Tectonic setting of northeastern Iceland and main features of the onshore segment of the Husavik–Flatey Fault (HFF), modified after [54,55]. (a) The mid-Atlantic Ridge is offset by the Húsavık–Flatey Fault (HFF), as well as by the Grímsey (GRL) and Dalvík (DAL) Lineaments. Orange stripes locate volcano–tectonic rift zones, also called “fissure swarms”; the three westernmost ones are referred to as ThFS = Theystareykir Fissure Swarm, KFS = Krafla Fissure Swarm and FFS = Fremrinámar Fissure Swarm. Recent volcanoes are highlighted with white triangles. KR = Krafla Volcano and TH = Theistareykjaburnga Volcano. (b) Outcrop of the HFF along the coast, just north of Husavik (HU). Photo A. Tibaldi. (c) Western onshore termination of the HFF, across Husavik. Notice the huge, 270m-high fault scarp. (d) Right-lateral offset of a lava tube along the easternmost segment of the HFF. Photo A. Tibaldi. (e) Right-lateral offset of gullies along the HFF. (f) The triple junction between the HFF and the westernmost fault of the ThFS (person for scale).

Figure 5.
(a) The DJI Spark; person for scale. (b) The DJI Phantom 4 PRO. (c) Unmanned aerial vehicle (UAV) pilot remotely controlling the DJI Spark. (d) Hybrid UAV type; picture courtesy of Joël Ruch. (e) Fixed-wing UAV model.
Figure 5.
(a) The DJI Spark; person for scale. (b) The DJI Phantom 4 PRO. (c) Unmanned aerial vehicle (UAV) pilot remotely controlling the DJI Spark. (d) Hybrid UAV type; picture courtesy of Joël Ruch. (e) Fixed-wing UAV model.

Figure 6.
(a) Flow chart illustrating the different steps that led to the production of 3-D digital outcrop models (DOMs) using UAVs and Structure-from-Motion (SfM)-dedicated software. (b) Example of typical UAV flight paths, with indication that the suggested overlap among pictures is sparse. (c) Dense cloud generated by the SfM software. Computed camera positions are shown as blue rectangles and black lines indicate pitch angle and camera orientation. (d) Operator collecting ground control points (GCPs).

Figure 7.
(a) Geological map of a portion of the Theystareykir Fissure Swarm (ThFS) about 15 km south of the triple junction, modified after [39]. (b) Pools of hot mud in a geothermal area within the ThFS. LGM = Last Glacial Maximum.
Figure 7.
(a) Geological map of a portion of the Theystareykir Fissure Swarm (ThFS) about 15 km south of the triple junction, modified after [39]. (b) Pools of hot mud in a geothermal area within the ThFS. LGM = Last Glacial Maximum.

Figure 8.
Field and UAV-taken photographs in the ThFS. (a) A graben, with indication of the low-lying floor of the extensional structure. (b) Field picture documenting the magnitude of the offset (12 m) at a dip–slip fault. (c) The result of extensional fracturing (image courtesy of Fabio Marchese). (d) Close-up photographs of an extension fracture. Piercing points and amount of dilation are indicated by the yellow arrow. (e) Aerial view of the flat-lying floor of the rift zone. The crater of a recent eruptive center in the foreground (named Stórihver) is highlighted with a white dashed line (image courtesy of Fabio Marchese).

Figure 9.
3-D models of three geosites in the ThFS. (a) The graben in Figure 8a is represented here in a much more detailed fashion. Note the elongated area crossed by the road and lying at a lower altitude than the surrounding topographic surface. The vehicle for scale aids in understanding the size of this volcano–tectonic structure. (b) This is an improvement of the previous Figure 8b in terms of enabling the viewer to understand the process of dip–slip faulting. (c) The effects of extensional fracturing are clearly visible, as well as the amount of dilation across the fractures (UAV pilot for scale).

Figure 10.
(a) Geological map of a portion of the Krafla Fissure Swarm (KFS). (b) A field picture visualizing a graben, different from the one portrayed in Figure 8a and Figure 9a, as the faults bordering it have a curvilinear arrangement (the maximum width of the graben is 90 m).

Figure 11.
(a) UAV-captured image of a number of recent monogenetic volcanoes: two in the background and one at the center of the image (image courtesy of Fabio Marchese). (b) One of the extension fractures in the area. (c) A beautiful example of a recent lava flow. (d) UAV-taken photograph with the Hituholar volcanic edifice and a fracture field (image courtesy of Luca Fallati). (e) Aerial image with dip–slip faults and extension fractures (image courtesy of Luca Fallati).

Figure 12.
(a) 3-D models of volcano–tectonic structures in the KFS. (a) A set of very long and wide extension fractures. (b) The geometry of a N–S-trending dip–slip fault. (c) A historical pahoehoe lava flow cascading into an extension fracture. See text for a detailed explanation.
Figure 12.
(a) 3-D models of volcano–tectonic structures in the KFS. (a) A set of very long and wide extension fractures. (b) The geometry of a N–S-trending dip–slip fault. (c) A historical pahoehoe lava flow cascading into an extension fracture. See text for a detailed explanation.

© 2020 by the authors. Licensee MDPI, Basel, Switzerland. This article is an open access article distributed under the terms and conditions of the Creative Commons Attribution (CC BY) license (http://creativecommons.org/licenses/by/4.0/).
Share and Cite
MDPI and ACS Style
Pasquaré Mariotto, F.; Bonali, F.L.; Venturini, C. Iceland, an Open-Air Museum for Geoheritage and Earth Science Communication Purposes. Resources 2020, 9, 14. https://0-doi-org.brum.beds.ac.uk/10.3390/resources9020014
AMA Style
Pasquaré Mariotto F, Bonali FL, Venturini C. Iceland, an Open-Air Museum for Geoheritage and Earth Science Communication Purposes. Resources. 2020; 9(2):14. https://0-doi-org.brum.beds.ac.uk/10.3390/resources9020014
Chicago/Turabian StylePasquaré Mariotto, Federico, Fabio Luca Bonali, and Corrado Venturini. 2020. "Iceland, an Open-Air Museum for Geoheritage and Earth Science Communication Purposes" Resources 9, no. 2: 14. https://0-doi-org.brum.beds.ac.uk/10.3390/resources9020014
Note that from the first issue of 2016, this journal uses article numbers instead of page numbers. See further details here.