Sustainability Assessment of Food Redistribution Initiatives in Sweden
by
 ,
,
Pauline Bergström
1, 
Christopher Malefors
1,*,
Ingrid Strid
1,
Ole Jørgen Hanssen
2 and
Mattias Eriksson
1 1
Department of Energy and Technology, Swedish University of Agricultural Sciences, Box 7032, 75007 Uppsala, Sweden
2
Ostfold Research, Stadion 4, NO-1671 Kråkerøy, Norway
*
Author to whom correspondence should be addressed.
Resources 2020, 9(3), 27; https://0-doi-org.brum.beds.ac.uk/10.3390/resources9030027
Submission received: 15 January 2020
/
Revised: 27 February 2020
/
Accepted: 5 March 2020
/
Published: 9 March 2020
(This article belongs to the Special Issue Food Loss and Waste: The Challenge of a Sustainable Management through a Circular Economy Perspective)
Abstract
:Food banks that redistribute surplus food from retailers and the food industry to people in need are not a new concept globally, but their connection to food waste prevention is new. As a result, new types of food redistribution units are emerging and diversifying to find new target groups and distribution methods. The aim of this study was to identify and study surplus food redistribution units in Sweden, and then to assess the impact on several sustainability indicators for selected redistribution units, in order to increase knowledge on the types of values these redistribution concepts generate. The methods used for analyzing the scenarios were Environmental Life Cycle Assessment, Life Cycle Costing and Social Life Cycle Assessment. The results showed that providing food bags to socially exposed people generated the largest reduction of greenhouse gas emissions per kg of redistributed food (−1.2 kg CO2 eq./FU). Reprocessing surplus food to a high-quality end-product was attributed a high social value, due to job creation effects in the high number of working hours required per kg of redistributed food. With regard to economic impacts, all but two scenarios studied had monthly financial losses, and therefore needed other sources of financial support.
1. Introduction
Awareness of food waste is growing globally, and is regarded as such an important topic, that it is part of the United Nations (UN) Sustainable Development Goals (SDGs), where the aim is to: “By 2030, halve per capita global food waste at the retail and consumer levels and reduce food losses along production and supply chains, including post-harvest losses” [1]. The European Union (EU) has committed to implementing the SDGs, and is also working on reducing waste in general via a Waste Framework Directive 2008/98/EC (WFD), with a waste management hierarchy that ranks the prevention of waste, and is also preparing for re-use as its first and second priority, respectively [2]. However, the wastage of edible food is not just a waste management issue, but also raises critical equity questions, especially considering the large number of people globally who are living below the poverty line [3].
The Swedish government has addressed food waste and SDG target 12.3 in an action plan [4], which states that Sweden does not have a specific quantitative national goal that addresses food waste, but a goal is needed to strengthen prerequisites for the actors involved.
Strid [5] recommends that a Swedish national target should reflect the aim of the SDG target 12.3, while Karlsson and Röös [6] argue that at least a 50% reduction in food waste is needed for a sustainable future food system in Sweden. Apart from an official goal, opportunities are also needed for actors who deal with food, so that surplus food generated can be recirculated in order not to be wasted [5]. This could be part of the circular economy (CE) concept that is emerging as a strategy to achieve sustainable development, with proponents of CE claiming that it will help to achieve economic growth, and at the same time generate environmental and social sustainability [7,8]. Saving natural resources by preventing and minimizing waste is critical in CE integration. This has been studied by, e.g., Principato et al. [9], who examined food loss and waste throughout the pasta supply chain in Italy from a CE perspective. Furthermore, there are numerous units concerned with redistributing surplus food, which by operating, keeps resources within the system, and thereby prevents and minimizes the amount of waste that would otherwise be generated. Most food waste originates in later stages of the food chain, e.g., from actors such as restaurants and stores that cannot sell the food for various reasons, even though it is often still of good quality [10]. Different measures have been established to handle surplus food and reduce this type of food waste. Food donations and redistributing surplus food to people in need are not new, having been documented since the thirteenth century [11]. However, according to Hanssen et al. [12], food banks in the Nordic region were established later than in other countries in Europe, and the redistribution of food in Sweden has emerged from a willingness to help people in need, rather than to prevent food waste. As Sweden has a long tradition of high standards in social welfare, and has well-established social security support, there may not be a social need for food banks on a larger scale. Now, with ongoing discussions on how to prevent food waste in Sweden, food redistribution measures are being developed, not only to assist people in need, but also to prevent food waste. A broad spectrum of measures is being introduced, and the initiative to reduce food waste is being taken by different actors, including e.g., food stores or restaurants selling surplus food at a reduced price, or providing doggie bags. However, many measures originate from third-party organizations, e.g., donations from retail to charity organizations [13] or apps distributing information on where consumers can buy left-over food from restaurants at a reduced price [14]. All these redistribution units employ some kind of solution for bringing surplus food to an end-user, but they differ in the exact logistic link between the owner of surplus food and the final consumer. They also differ in the type of final consumer targeted, but since the organizations involved often have a social agenda, poor and exposed people are often the intended final consumers. The redistribution of surplus food is often seen as a win-win situation, but non-profit, third-party organizations that handle food redistribution have been criticized from a sociological perspective, as they may reduce the pressure on governments to address food insecurity and structural poverty [15]. Another aspect is that, although organizations such as food banks may contribute to food security, some recipients of surplus food experience emotions, such as shame or humiliation derived from the need to ask for help from these organizations, or receiving food that might have passed its expiry date [16].
Although waste prevention is the highest priority in the waste management hierarchy, only a few studies have focused on waste prevention systems [17]. Moreover, only a few studies have compared food waste solutions, where surplus food is still used as food, i.e., conversion to new products, donation and prevention (the highest priorities in the food waste hierarchy) [18]. The environmental impact of waste management has been commonly assessed (e.g., [18]), but according to Hellweg and Canal [19], there is an increasing demand for broader sustainability assessments, where the environment, society and the economy are integrated. Schneider [11] touches upon all three sustainability dimensions with regard to food donations, and concludes that donating edible food to people in need is an act of sustainability, since all three dimensions are met. However, Schneider [11] does not quantify the extent to which these dimensions are met, and it appears that actual assessments of all three dimensions of sustainability regarding food waste redistribution are lacking in the scientific literature. Studies like this could give valuable insights into food waste prevention, making it possible to prioritize different measures and market-based instruments to reduce food waste.
Therefore, it would be valuable to compare surplus food redistribution solutions where surplus food is still used for human consumption, and assess the environmental, social and economic impacts of these solutions in a life cycle perspective.
The aim of this study was to identify different types of surplus food redistribution units in Sweden, and assess the environmental, social and economic impacts of some of the basic concepts utilised in these units. The overall goal was to gain knowledge on the extent to which different concepts for food redistribution fulfil the three aspects of sustainability, and then contribute to sustainable development.
2. Materials and Methods
2.1. Identification of Redistribution Units and Scenario Development
Internet searches were conducted to find different types of surplus food redistribution units in Sweden. The criterion for including a redistribution unit in the study was that it was a third-party organization, i.e., not a retailer redistributing surplus food to regular customers. Thus, the surplus food is not sold or thrown away by the retailer, but instead donated or sold to or through the surplus food redistribution system. Material taken from redistribution units’ websites, and other digital information found regarding the redistribution units, were examined regarding the logistics for redistributing surplus food and the main socioeconomic target group.
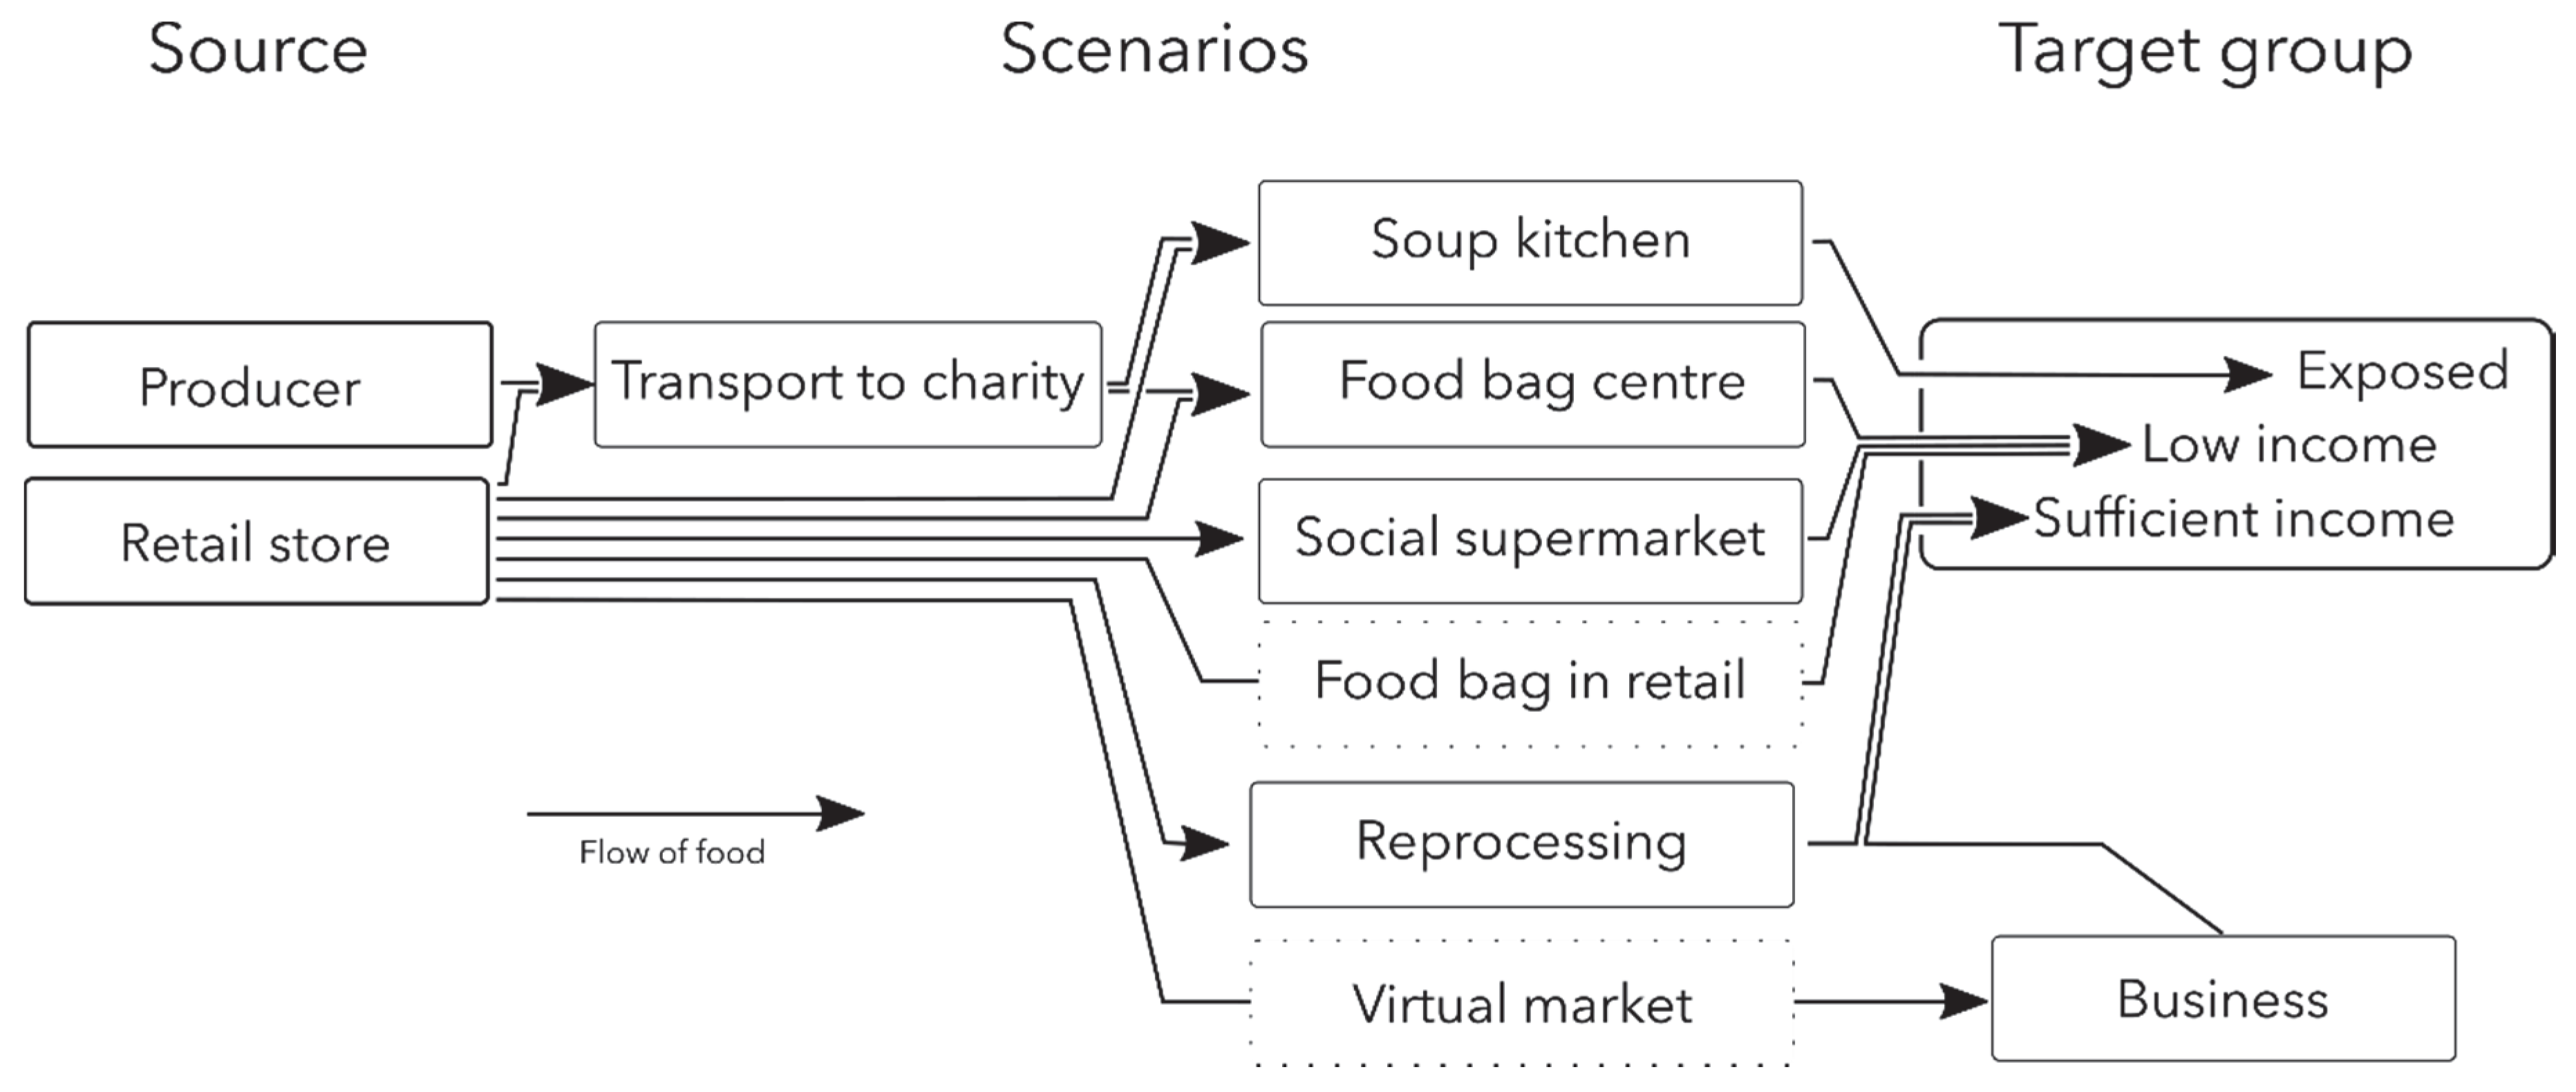
Of the 18 redistribution units identified, seven were selected for further assessment as examples of typical redistribution solutions. They represented different types of logistic systems and target groups, and so, based upon these redistribution units, seven ‘scenarios’ were formulated. We chose to call them scenarios, since they are not an exact representation of the actual units, which will evolve and therefore change over time, and also since we cannot claim to have captured all of the complexity related to food redistribution for each unit. When several redistribution units had similar characteristics, the unit closest to our workplace was selected for convenience when conducting a more in-depth investigation through personal interaction with representatives of the different redistribution units. Complementary information gathered from the units’ websites or other public sources acted as input data for assessment. Figure 1 displays the flow of food from a source, such as a retail store or food producer through the seven scenarios to its destination. The seven scenarios act as an interface to the end-users, who can be exposed people (the homeless or people who have no or limited possibilities to cook their meals), people with low income (but with access to a kitchen) or people who have sufficient income. According to Gram-Hanssen et al. [20], an “end-user” is the person consuming the surplus food, most often through charity organizations. In this study the term was extended to all final consumers of the surplus food handled by the redistribution units, irrespective of whether the end-user receives surplus food via charity organizations or through purchases. Thus, depending on the context, in this study the term end-user can refer to one or more of the three target groups: exposed people, people with low income, and people who have sufficient income.
The scenarios differ in scale, as some of the redistribution units work on a local level, and others can be categorized as national/regional food banks, although with different capacities. Gram-Hanssen et al. [20] define a food bank as “an organization that facilitates redistribution for several food-serving actors by running logistics and often storing large quantities of food at a centralised warehouse. The scale of operations is often regional and involves many food donors. Food banks do not serve food but act as redistribution operators”. The scenarios ‘Transport to charity’, ‘Food bag center’ and ‘Social supermarket’ fit the food bank definition quite well, but act on different geographical scales. The other scenarios provide different kinds of services, such as processing or serving food to various types of end-users with different types of needs and or means, or providing knowledge to end-users regarding the whereabouts of surplus food.
2.2. System Description
The seven scenarios were assessed using the methodology Environmental Life Cycle Assessment (E-LCA) for examining the environmental impacts [21,22], Social Life Cycle Assessment (S-LCA) for the social impacts, and the Life Cycle Costing (LCC) for the economic impacts. The functional unit (FU) in this study was ‘1 kg of redistributed surplus food at the gate of the retail/distributor’, and included a system expansion. Since not all surplus food is likely to pass through the various distribution, processing and serving processes steps intact, waste will occur at some point. In this study, a value of 20% waste was assumed for surplus food, as an estimate based on findings by Malefors et al. [23]. The capacity of each of the redistribution units assessed was also considered, as they redistribute different amounts of surplus food. The donated food was to a large extent bread, fresh fruits and vegetables and dairy products, but also included some meat products, a reflection of what is wasted in supermarkets according to Eriksson et al. [18,24,25,26], and sufficient to provide a healthy diet for the end consumers. This composition can of course vary to some extent, but was fairly consistent according to the assessed charity organizations.
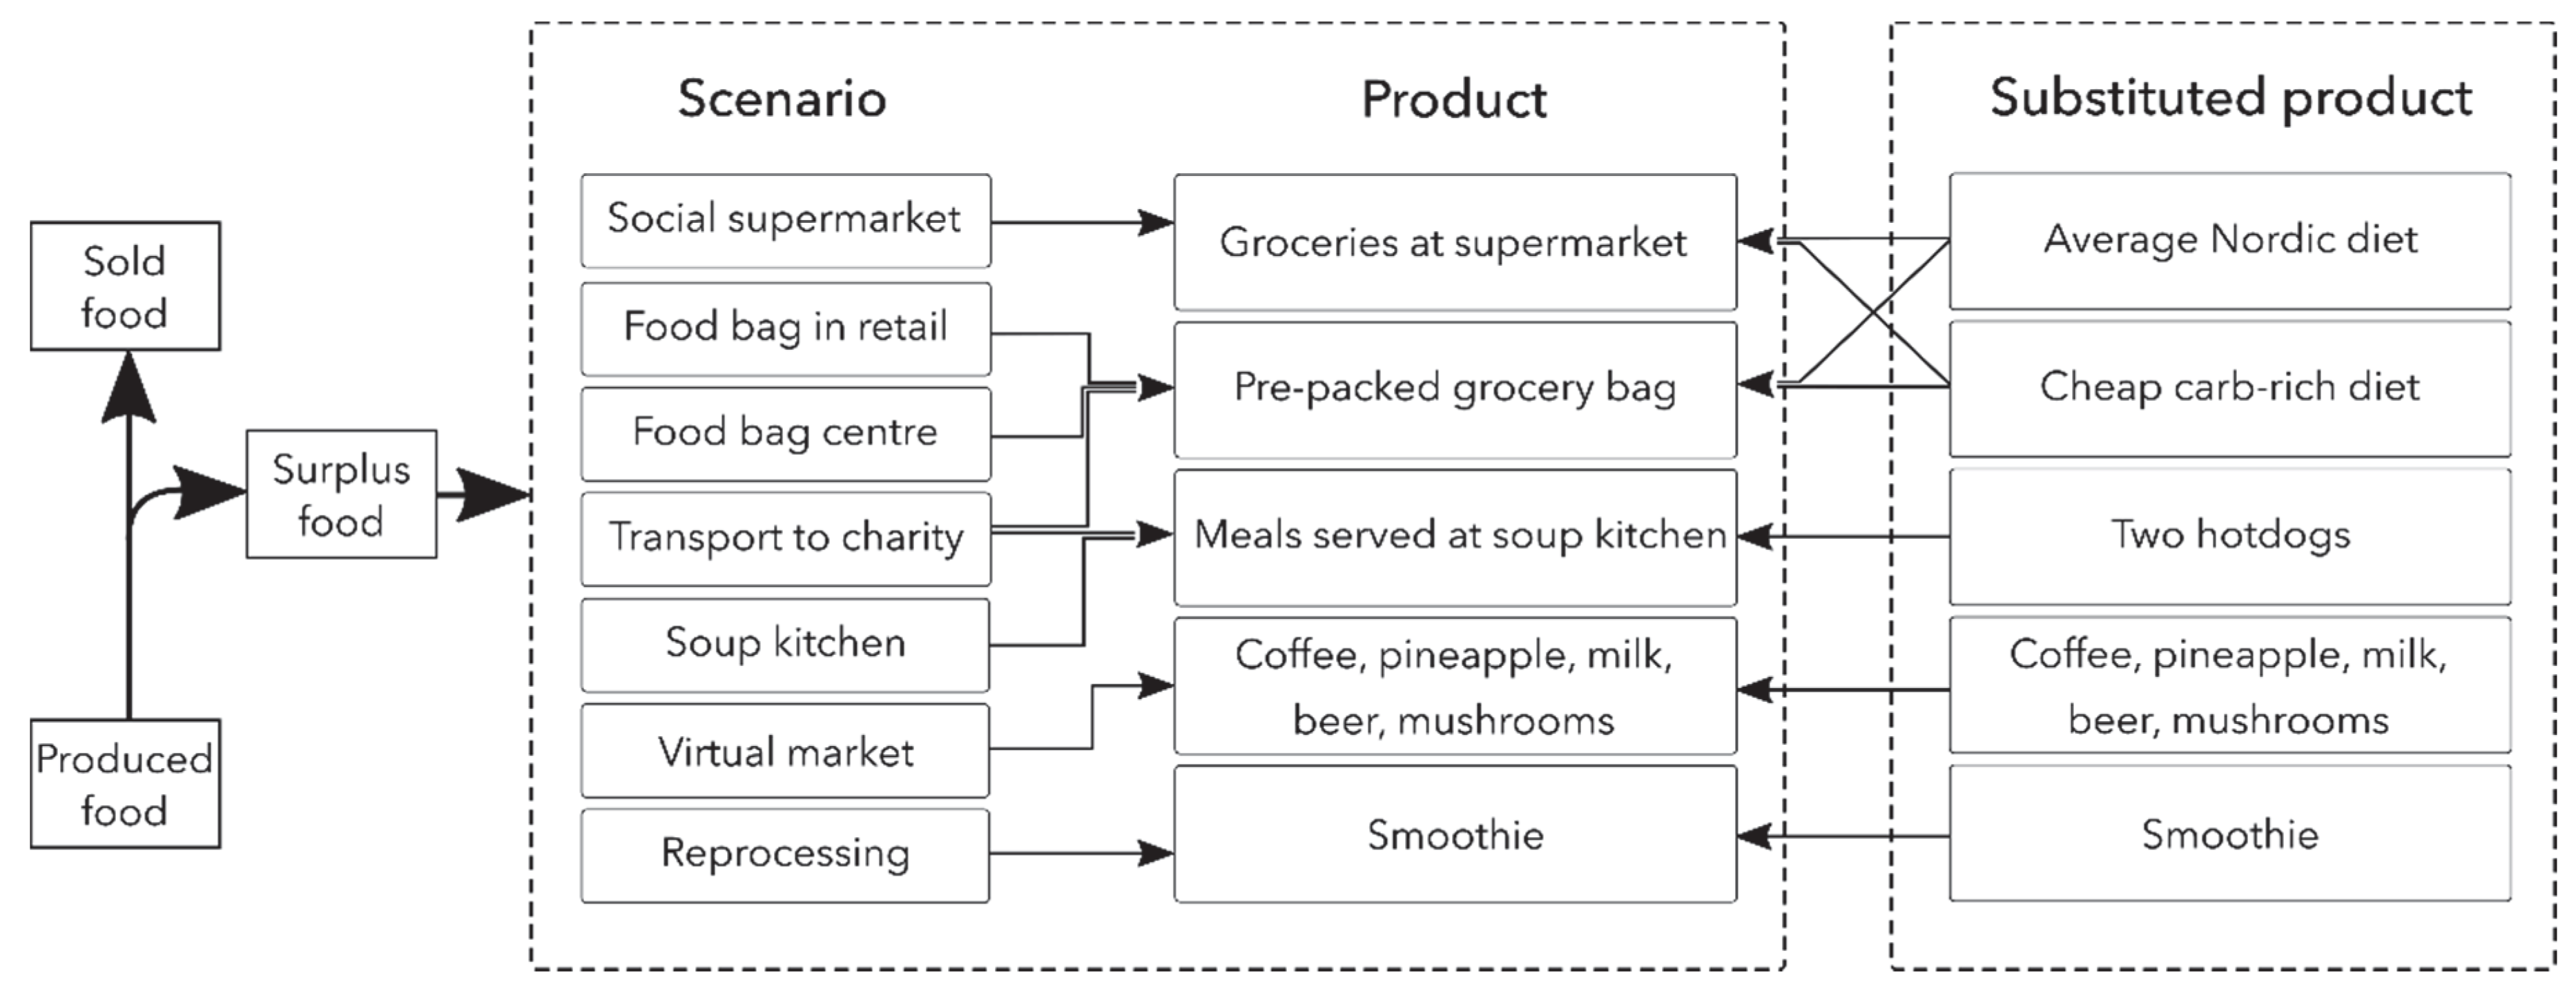
The seven scenarios were applied for the different surplus food redistribution units, which comprised the system studied (Figure 2). All scenarios were Swedish-based and set in a Swedish context, bearing in mind that people in Sweden do not face starvation in the same way as people in low-income-countries. Sweden has high standards of social welfare for its citizens, and thus the issue for many exposed people might be an addiction or falling outside the social safety net in the long-term, in socioeconomically insufficient conditions with lack of access to a balanced diet. For example, homeless addicts may drink alcoholic beverages that contribute to their daily intake of calories, but result in a low nutrient content in their diet.
The system included environmental impacts from the different processes that take place from the collection of surplus food at the retail/producer up until the food reaches the end-user. All processes that substitute a product were considered in the procedure of system expansion, where emissions were credited for products that do not need to be produced from virgin materials when a recycled alternative is available. These processes were:
- Transport food from retail/producer (transportation of collected surplus food from retail/producer)
- Energy for cooking (energy used by the redistribution units to cook/reprocess surplus food)
- Packaging (primary or secondary packages mainly used for transport purposes, provided by the redistribution units)
- End-user transport (transport of collected food by end-users)
- Substituted product (the food substituted by the surplus food redistributed by different scenarios in the system expansion). For the substituted food products, associated transport, packaging and energy for cooking were also substituted. This was done in the processes Substituted energy for cooking (substituted energy used to cook/reprocess surplus food in the system expansion, i.e., energy not used by the redistribution unit, but by other producers for the substituted product); Substituted packaging (substituted primary or secondary packaging mainly used for transport purposes in the system expansion, provided not by the redistribution units, but by other food actors for their substituted products); and Substituted end-user transport (transport of substituted products, collected by end-users in the system expansion).
Global Warming Potential (GWP) was used according to the Intergovernmental Panel on Climate Change (IPCC) values for a 100-year time horizon [27] to measure the environmental impact. According to Röös et al. [28], GWP/carbon footprint (CF) can be used as an indicator of environmental impacts for meat production, and thus the assumption was made that CF represented all environmental impacts in this study.
For the economic impact, the scope of the study included the following cost categories based on activity types: costs and revenues for transport, labor, products, packaging, premises and indirect costs, as well as government reimbursement within the scenarios. The economic impacts considered in this study applied to the redistribution units, and not to the government or end-user (even though they contribute revenue).
For the social impact, workers handling surplus food, and the end-users who eat the food, were included in the scope. Social drawbacks (e.g., child labor, unfair salary, excessive hours of work, shame etc.) for these stakeholders were not included. The categories and indicators used in S-LCA can vary depending on the aim of the study. In this study these were limited by choice. The chosen impact categories, stakeholder categories, subcategories, inventory indicators and level of impact for indicators are presented in Table 1. All social results were quantified using the methodological sheets for S-LCA [29] as inspiration.
The stakeholder categories Workers (impact category: job market value) and End-users (impact category: product value) were chosen due to the assumption that these categories have the greatest social impact for each scenario. However, these impact categories can be assumed to have different levels of impact for the inventory indicators. Maslow’s “hierarchy of needs” [30] can be used as a reference point. This hierarchy is often represented by a pyramid where more basic needs are found at the bottom, and which includes (from bottom to top): ‘Physiological needs’, ‘Safety’, ‘Love/belonging’, ‘Esteem’ and ‘Self-actualization’. For example, for workers, the social value for a person who has difficulties entering the job market (e.g., people with disabilities or people newly arrived in Sweden) is higher than for someone who does not have this difficulty. For end-users, this was based on the social value of receiving surplus food being higher if the person is exposed, with little or no income to buy food, rather than having the means to buy food. The results are therefore presented for each category separately, but with the assumption that redistributing surplus food to exposed people has a higher social value than redistributing it to low-income end-consumers, or end-consumers with sufficient income. The same principle of ranking was applied to work opportunities, by assuming that social jobs had the highest social value, followed by the number of jobs and the number of volunteer jobs.
2.3. Inventory Data and Scenarios
The inventory data collected from different surplus food redistribution units and used in the assessment of the scenarios are presented below. Since all investigated surplus food redistribution units are under constant development, the assessment should be considered as a snapshot of a practice that may or may not still be in use. All numbers/values used in the E-LCA, S-LCA and LCC assessments can be found in Appendix A, Appendix B and Appendix C, respectively. The scenarios described in Section 2.3.1, Section 2.3.2, Section 2.3.3 and Section 2.3.4 were based on charity organizations that function as nonprofit organizations, and whose primary objectives are to serve the common good [31]. The scenarios described in Section 2.3.5, Section 2.3.6 and Section 2.3.7 were developed through businesses that operate by redistributing food, or by processing food in various ways before it reaches the end-user. The businesses sell a service or a product, where the end-users are people who are exposed or have sufficient or low income, depending on the type of business.
2.3.1. Food Bag Center
The scenario ‘Food bag center’ was based upon Matkassen, which is a subunit within the City Mission in Uppsala. Matkassen started in 2017 and collects surplus food, receiving on average a total of 2.5 tons of surplus food each week. Matkassen keeps two tons of this food to redistribute in weekly bags of groceries to economically vulnerable people [30]. The remaining 0.5 ton is distributed to another subunit called Mikaelsgården (see Section 2.3.2). Matkassen distributes grocery bags that contain all types of food, except for cooked food and pre-made food, such as salads and sandwiches [32]. The content in the grocery bags varies, although most of the content is fruit and vegetables, bread and dry goods, with complementary protein sources (e.g., milk or meat), and hygiene products. The requirement for becoming a member of Matkassen is having an income lower than 9290 SEK per month [33], and currently there are 400 households (193 households with children) that are members [32]. The staff collect the surplus food, using a van, 3–5 times a week from 16 different food stores in Uppsala, and redistribute the groceries in bags made of a sturdier plastic (polypropylene). When members pick-up their grocery bag at the Matkassen premises, they return the empty bag from the previous week, and receive a new bag containing groceries that they take home. When receiving food donations, the need for purchasing food can be assumed to be reduced, meaning that the redistributed food replaces food produced from virgin materials. The food that was substituted by the grocery bags in this scenario was assumed to be 50% of an average Nordic diet [34], and 50% of a cheap carbohydrate-rich diet (0.5 kg CO2 eq./FU) distributed over 1 kg of food. This assumption was based on interviews with members and staff from Matkassen.
There are in total 28 people working with different tasks at Matkassen, but not all of them work every day. Some are employed by the City Mission, some are employed with the help of the Swedish Public Employment Service (SPES) or the Uppsala Municipality, and some are volunteers. Matkassen is financed by member fees, as well as private and company donations [32].
2.3.2. Soup Kitchen
The scenario ‘Soup kitchen’ was based on Mikaelsgården, the other subunit within the City Mission in Uppsala that redistributes surplus food. Mikaelsgården helps exposed people (e.g., homeless, addicts or people for other reasons outside the social security safety net) with, amongst other things, the opportunity to receive free meals. Mikaelsgården receives in total 0.78 tons of surplus food per week, 0.5 tons from Matcentralen and 0.28 tons from approximately eight other food actors (stores, caterers, bakeries) in Uppsala [35]. Depending on the food donor, Mikaelsgården receives fruit and vegetables, bread, coffee, cheese, pre-made salads and sandwiches, as well as pre-cooked meals. The staff at Mikaelsgården pick up the food by bicycle or car, or the food actors transport the surplus food to them [35].
The organization has around 60–100 guests per day (Monday to Friday) and serves 100–140 portions of food (breakfasts and lunches) per day. The food served for breakfast is a buffet, containing, e.g., sandwiches, coffee and yogurt.
For lunch, the guests are served a cooked meal (e.g., vegetable stew). The cooked meals are either reheated food from donations, or food that has been cooked from scratch at Mikaelsgården [35]. In the system expansion, it was assumed that the food substituted by the scenario was two hotdogs, comprising 180 g per kg food, as hotdogs represent one of the cheapest and most convenient, ready-to-eat foods commonly available in Sweden. Exposed people may also drink alcoholic beverages, such as beer, that contribute to the daily intake of calories to sustain them throughout the day [36]. However, this was not accounted for, as it was assumed that they would drink these beverages, regardless of whether they go to a charity organization for food or not.
There are 26 people who work at Mikaelsgården. Some are employed by the City Mission, some are employed with the help of Swedish Public Employment Service (SPES) or the Uppsala Municipality, and some are volunteers. Mikaelsgården is financed partly by Uppsala municipality and the second-hand stores run by the City Mission in Uppsala, as well as private and company donations [35].
2.3.3. Social Supermarket
The scenario ‘Social supermarket’ was based on one of the subunits of the City Mission in Stockholm, a social supermarket called Matmissionen located in Hägersten, Stockholm. One of the branches within this City Mission in Stockholm is Matcentralen, a logistics system for handling surplus food from different food actors in Stockholm that redistributes the food to, amongst others, Matmissionen, which opened in 2015. Matmissionen redistributes approximately 30 tons of surplus food every month, and works with 35 distributors within the food business [37]. Matcentralen disposes of all types of food, except food that has been “exposed to air”, such as food on a buffet. The surplus food from the different food actors is either collected by staff members from the City Mission Stockholm, or transported to Matmissionen by the donors themselves [34].
At the social supermarket, people with low income can become members (the requirement is to earn less than 9290 SEK (988.33 US dollars) per month), in order to purchase food at a reduced price, although non-members can also shop in the store without a discount [38]. The estimated number of members at Matmissionen is 3000–3500, although the number of people that shop in the food store in Hägersten varies. In March 2019, 1300 members purchased something in the store, and it was assumed that each of these 1300 members purchased groceries for 200 SEK/month, including four plastic bags for transportation purposes. The substituted food was assumed to be 50% of the average Nordic diet [34], and 50% of a cheap carb-rich diet (0.5 kg CO2 eq./FU) distributed over 1 kg of food. This was the same as in the scenario ‘Food bag center’, as both have similar end-users.
The store in Hägersten has five employees from the City Mission Stockholm itself, as well as approximately eight people in on-the-job training (salary paid by SPES). The aim of Matmissionen is to be financially self-supporting, but at the moment it receives help from other enterprises within the organization, for instance the second-hand stores, the surplus revenue from which sponsors the activities [37].
2.3.4. Food Bag in Retail
The scenario ‘Food bag in retail’ was based on Food2change, a nonprofit association started in 2016 that redistributes surplus food from 30 food stores to low-income people in 10 cities in Sweden [39]. The requirement for becoming a member of Food2change is to have a gross income lower than 13,000 SEK [40]. Currently there are 580 members [41], who can collect a bag of groceries with food, and hygiene products every week at different food stores for a fee of 500 SEK per half-year [40]. Included in the membership fee is a cotton bag that the members must bring into the store in order to collect their food. When redistributing surplus food, the staff members at Food2change go to the food store and await the members coming to pick up grocery bags. When all members (for their respective store) have arrived, the staff sort the groceries into the members’ bags [40]. The grocery bags contain all sorts of food, mostly dairy and processed meat products, along with fruit and vegetables [41].
In the system expansion, the substituted food was assumed to be 50% of the average Nordic diet [34], and 50% of the cheap carb-rich diet (0.5 kg CO2 eq./FU) distributed over 1 kg of food. This was the same as in the scenario ‘Food bag center’, as both have similar end-users.
In total, 109 persons work for Food2change. Three of these people are employed by Food2change with paid salary, while 106 are volunteers, of whom approximately 80% work with sorting and distributing food. Food2change is financed primarily by the membership fees, but also by private and company donations, and some government subsidies in order to pay their three employees [41].
2.3.5. Reprocessing
The scenario ‘Reprocessing’ was based on the company ReFood, which started making smoothies from surplus vegetables and fruits in 2018. The company collects 150–300 kg (more commonly in the lower end of the range) of vegetables and fruit per week, distributed over three pick-ups per week at four different food stores in Stockholm [42]. The company uses either an electric car, and a petrol-driven car, approximately 60% and 40% of the time, respectively, for collecting surplus food and delivering finished smoothies to various food actors in the Stockholm area [43]. ReFood currently makes three different smoothies, the recipes for which are presented in Appendix A. Each batch of smoothies is heated until the liquid reaches 74 °C, which takes about 15–30 min, and it is then kept heated for six more minutes to extend the expiry date [43]. In the system expansion, the food that was substituted by smoothies in this scenario was assumed to be a similar smoothie.
There are six employees at ReFood, of which three are full-time employees, and three are part-time employees. Three of the employees are recent immigrants, who might have difficulties entering the job market, and receive salary support from SPES. There is also one person working as a volunteer for approximately 12 h per week [43]. ReFood received economic support from Vinnova (Sweden’s innovation agency), in order to start the company. Moreover, ReFood is collaborating with the company Johan and Nyström, renting kitchen space with significant appliances from the company. Some kitchen equipment has been purchased, such as pots for heating the smoothie, and food processors to make the smoothies [43].
2.3.6. Virtual Market
The scenario ‘Virtual market’ was based on Foodloopz, a company started in 2016 that runs a website where other companies and organizations can advertise whether they have surplus food that they want to sell or donate to other organizations/companies. Foodloopz has five employees and 135 member-companies, including farmers, caterers, hotels, restaurants, student organizations, etc. Their service is available throughout Sweden, although currently most of the sales and donations are made in Stockholm or Gothenburg [44]. In 2017, Foodloopz helped to sell or donate a total of 70 tons of surplus food [45] for a fee, where donations made up a majority [44]. The amount of surplus food that is donated or sold per organization/company varies, depending on the selling or donating organization/company. Overall, the amount is often made up of larger quantities of food, e.g., beer, coffee, milk, pineapple and mushrooms, that range between 100 to 5000 kg in weight [44]. Transportation of the sold/donated food is handled by the seller/donor or receiving company/organization [44]. The average transport distance for one pick-up was assumed here to be 40 km, as most of the sales and donations are made within Stockholm or Gothenburg. The substituted food in the system expansion was assumed to be the same food items mentioned above (beer, coffee, milk, pineapple and mushrooms), distributed evenly over 1 kg of food.
2.3.7. Transport to Charity
The scenario ‘Transport to charity’ was based on Allwin, a transportation company functioning as a national food bank, which started in 2010, and that redistributes surplus food from 82 different food actors (Ica, Coop and Lidl) in Stockholm, Gothenburg, Lund and Malmö [46]. According to the Allwin website and other public sources, 66 of these food actors belong to either Lidl or Coop [47,48,49,50].
Allwin redistributes 1000 tons of surplus food yearly [51], including all types of food, except for frozen products [52]. The company charges the food actors that donate the surplus food an average monthly fee of 2.88 SEK per kg disposed surplus food [52], which is to cover employees, vehicles and fuel, and administrative costs for the company [51]. Moreover, Allwin collaborates with Samhall (a government organization that creates jobs for people with disabilities [53]), which handles all transportation for Allwin, collecting surplus food approximately five days a week, with a total of six drivers [52]. The collected surplus food is redistributed to charity organizations, such as the Swedish Church in the home city, and is given to people in need [46]. Exposed people that are served meals at soup kitchens, and people with low income that receive food bags, are both end-users at the Swedish church in Gothenburg [54]. It was assumed here that approximately 20% of this scenario’s end-users are exposed people, and 80% are people with low incomes. This was based on the respective proportions of redistributed food at both Matkassen and Mikaelsgården (2 tons/0.5 tons) in the Uppsala City Mission, where Matkassen and Mikaelsgården have similar end-users. The food that was substituted by this scenario was therefore assumed to be 80% of the equal distribution of the average Nordic diet [34], and the cheap carb-rich diet (0.5 kg CO2 eq./FU) distributed over 1 kg of food, as well as 20% of two hotdogs, comprising 180 g per kg food.
For the administrative tasks at Allwin there is one employee, who was assumed to have a salary of 25,000 SEK (2659.65 US dollars) per month. Samhall charges Allwin for 900 h of work per month, with a salary cost that matches the current collective agreement [52].
3. Results
The results are presented in two parts, one in which the different redistribution units in Sweden are categorized, and one assessing the environmental, social and economic impacts of the different scenarios based on the selected redistribution units.
3.1. Surplus Food Redistribution Units in Sweden
A total of 18 food redistribution initiatives distributed at different places in Sweden were identified (Table 2). Some of these redistribution units had several types of end-users and measures. Several units had users that were purchasers (12 out of 18 units), and most of the initiatives (11 out of 18) had measures that included the reprocessing of surplus food (into a product, e.g., juice, smoothie, or cooked food). The second most used measure was a digital marketplace (4 out of 18 units) and the least used measures were the food store, transport and grocery bags (each 2 out of 18 units).
3.2. Environmental Impacts
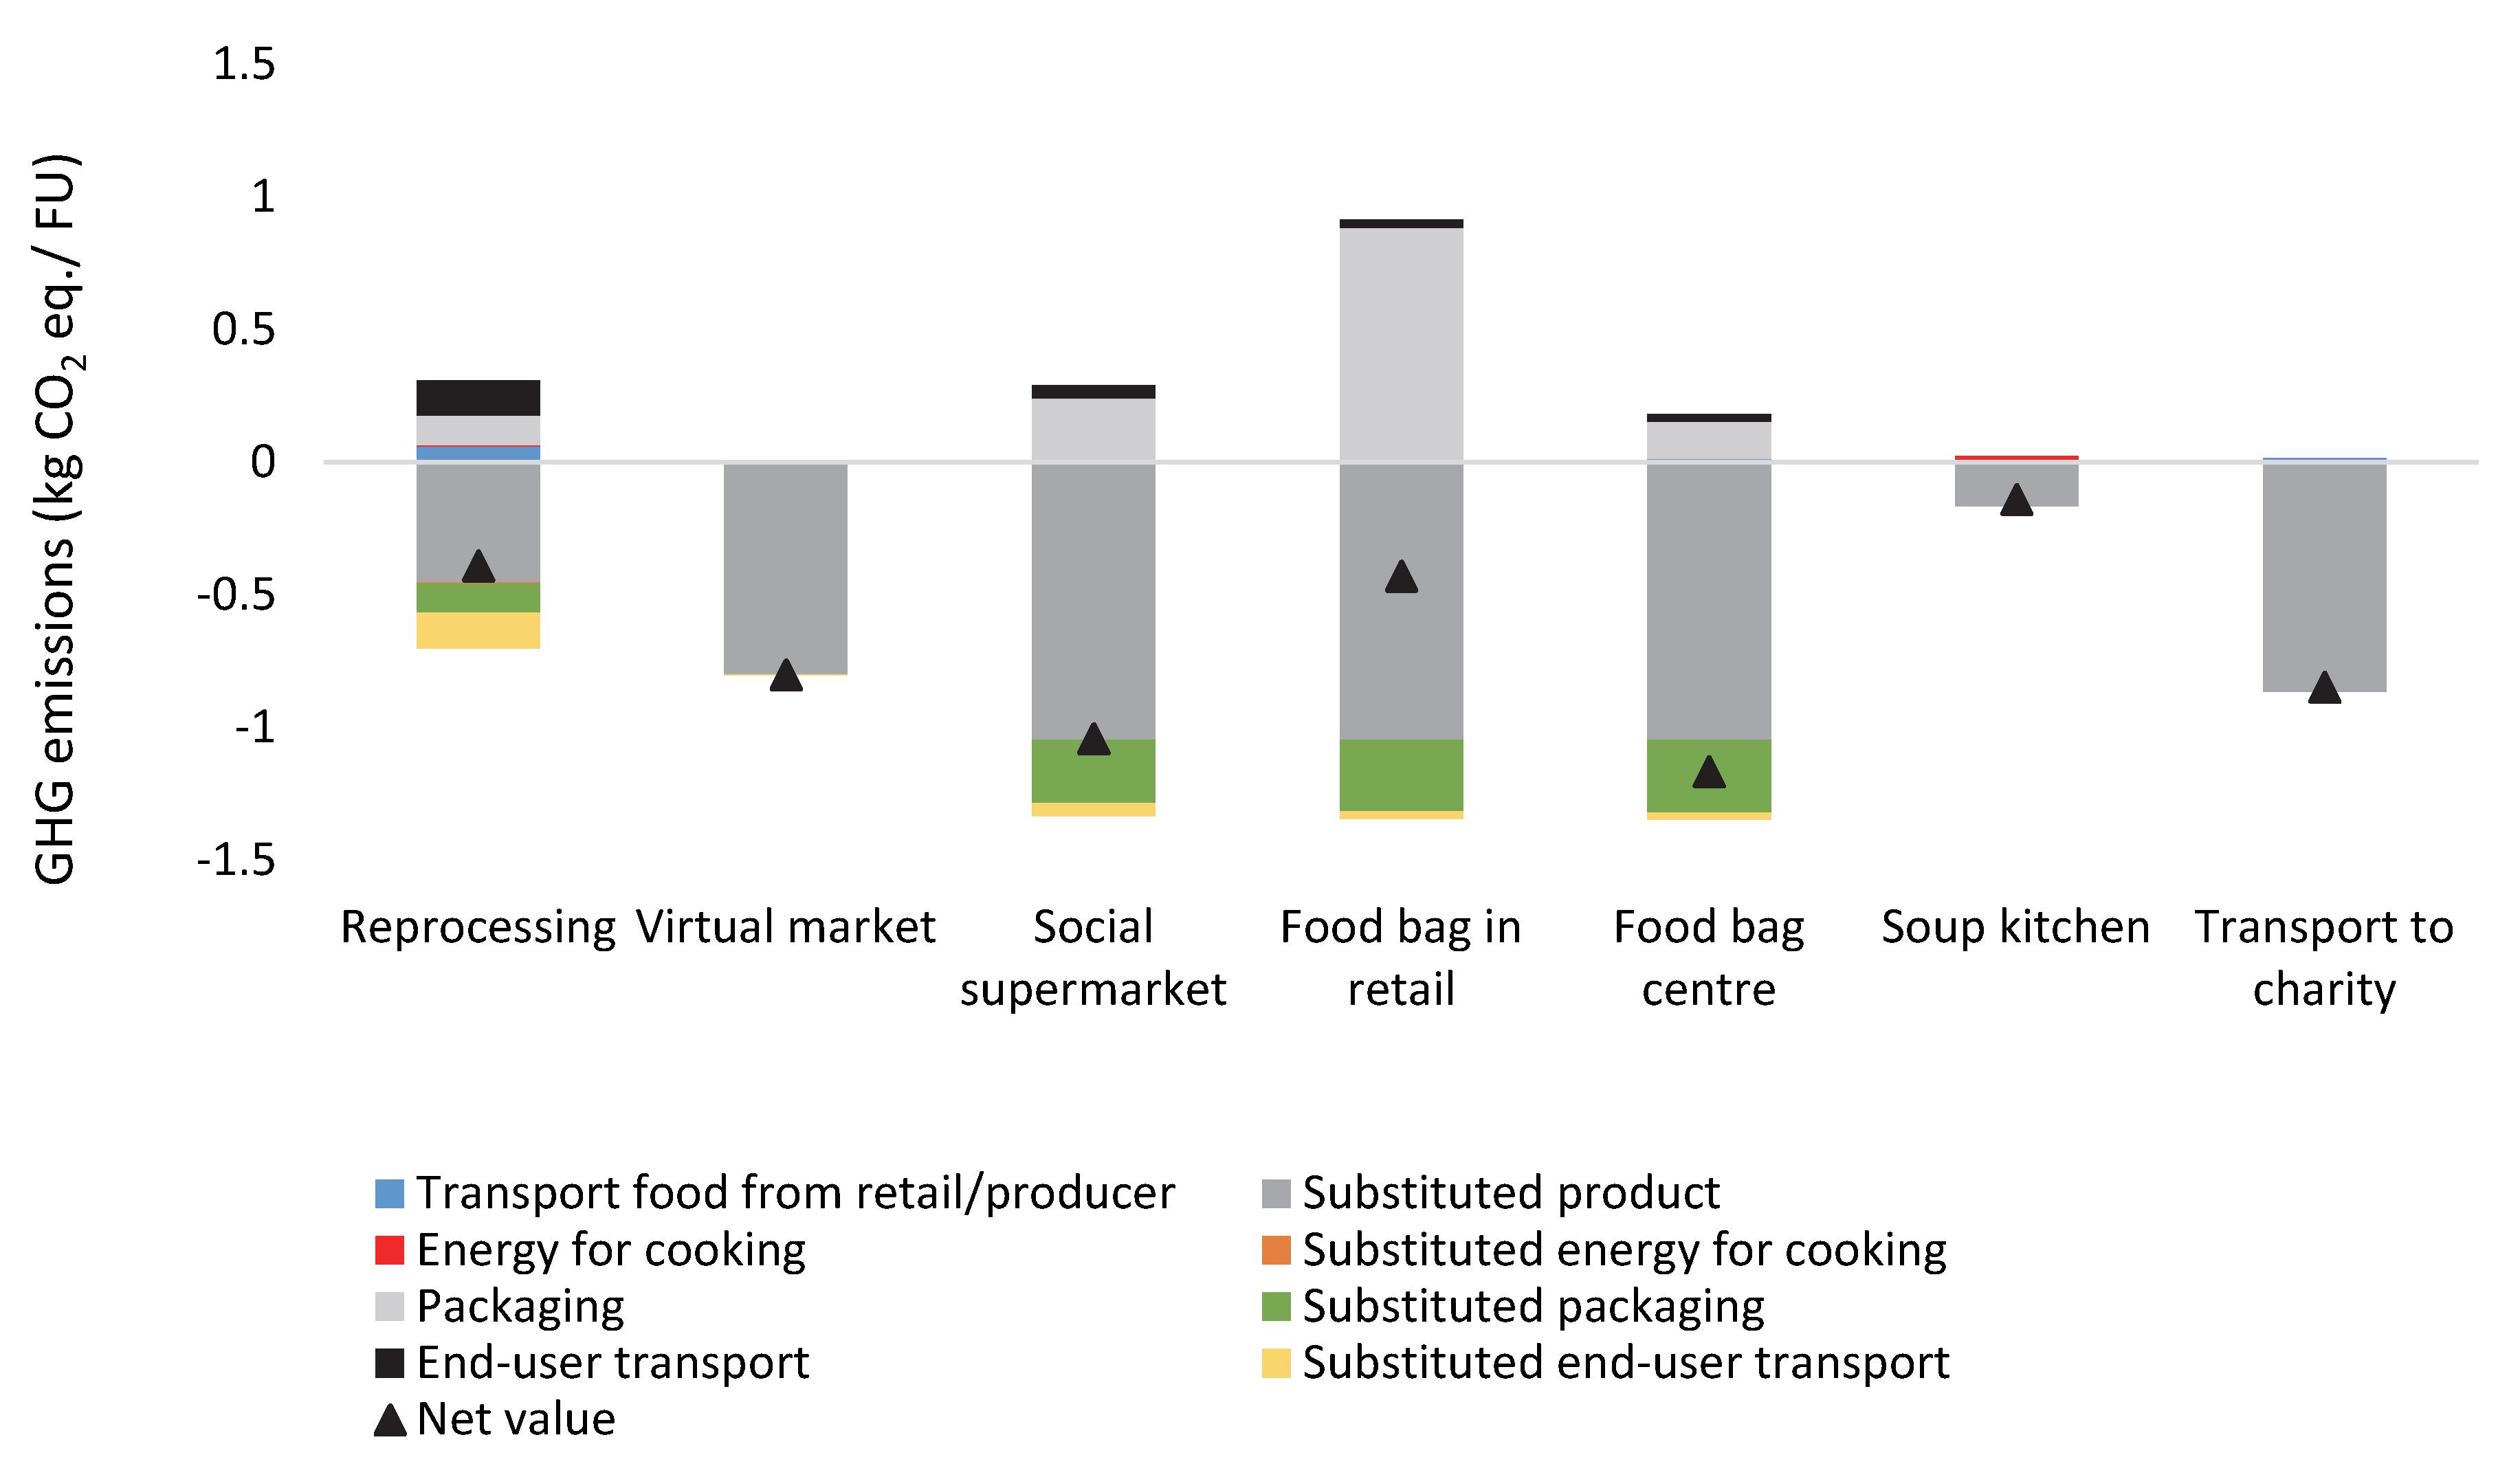
The different processes and the respective emissions for all scenarios are shown in Table 3. These different processes either generated emissions or created environmental savings, and therefore resulted in a net value for all scenarios. The net value ranged from −0.2 kg CO2 eq./FU for the ‘Soup kitchen’ to −1.2 kg CO2 eq./FU for the ‘Food bag center’, meaning that in total, the ‘Food bag center’ had more environmental savings than did the ‘Soup kitchen’, or the other scenarios. The environmental savings primarily resulted from the process Substituted product, since it avoided production from virgin material, and therefore gave the scenario an emission credit. The emissions generated originated mainly from the process Packaging, except in the scenario ‘Reprocessing’, where End-user transport generated slightly larger emissions.
The process Transport food from retail/producer had a significant impact for ‘Reprocessing’, as the emissions amounted to 0.06 kg CO2 eq./FU, but were less significant for the other scenarios (Figure 3). The higher impact of Transport food from retail/producer on ‘Reprocessing’ was mainly because a smaller amount of food was transported than in the other scenarios. The emissions for Energy for cooking were much lower overall than in the other processes, with an impact of 0.015 kg CO2 eq./FU for ‘Soup kitchen’ and 0.005 kg CO2 eq./FU for ‘Reprocessing’, which were also the only scenarios that were attributed these processes. Of the four scenarios that had emissions from the process Packaging, the most significant impact was seen for the ‘Food bag in retail’ (0.89 kg CO2 eq./FU), which uses cotton carrier bags. The scenarios ‘Social supermarket’, ‘Food bag center’ and ‘Reprocessing’ also had emissions in this process, generated by plastic bags (0.24 kg CO2 eq./FU), sturdier plastic bags (0.14 kg CO2 eq./FU) and glass bottles (0.11 kg CO2 eq./FU), respectively. The emissions in the process End-user transport had the most impact for ‘Reprocessing’, as in this scenario some end-users were assumed to take a car (resulting in higher emissions) to purchase their smoothie, in contrast to the other scenarios, where some end-users were assumed to take the bus (lower emissions). An exception was the ‘Virtual market’, as the process End-user transport was attributed to the selling/donating or receiving company that transports the surplus food from one place to another. Thus, large quantities of food are transported in a van, resulting in less emissions for the ‘Virtual market’ in this process. The “substituted” processes created environmental savings, as food from the redistribution units was assumed to replace food produced from virgin materials, and this therefore generated savings equal to the production of these virgin materials. The process Substituted product had the most significant impact for all scenarios, and ranged between −0.4 kg CO2 eq./FU for ‘Reprocessing’ and −1.04 kg CO2 eq./FU for three scenarios: ‘Social supermarket’, ‘Food bag center’ and ‘Food bag in retail’ (Figure 3). The sole scenario that was attributed emissions in the process Substituted energy for cooking was ‘Reprocessing’, as it had an identical product (smoothie) to the substituted product (smoothie) in the system expansion, and therefore the emissions were identical in the processes Energy for cooking and Substituted energy for cooking. In contrast, the ‘Soup kitchen’ did not have similar products in the system and the system expansion. The emissions in the process Substituted packaging were quite similar for the ‘Social supermarket’ (−0.24 kg CO2 eq./FU), ‘Food bag in retail’ (−0.27 kg CO2 eq./FU) and ‘Food bag center’ (−0.27 kg CO2 eq./FU), as all scenarios were assumed to use plastic bags. The process Substituted end-user transport had the same emissions as the process End-user transport, as these processes were based upon the same assumptions in both processes for all scenarios.
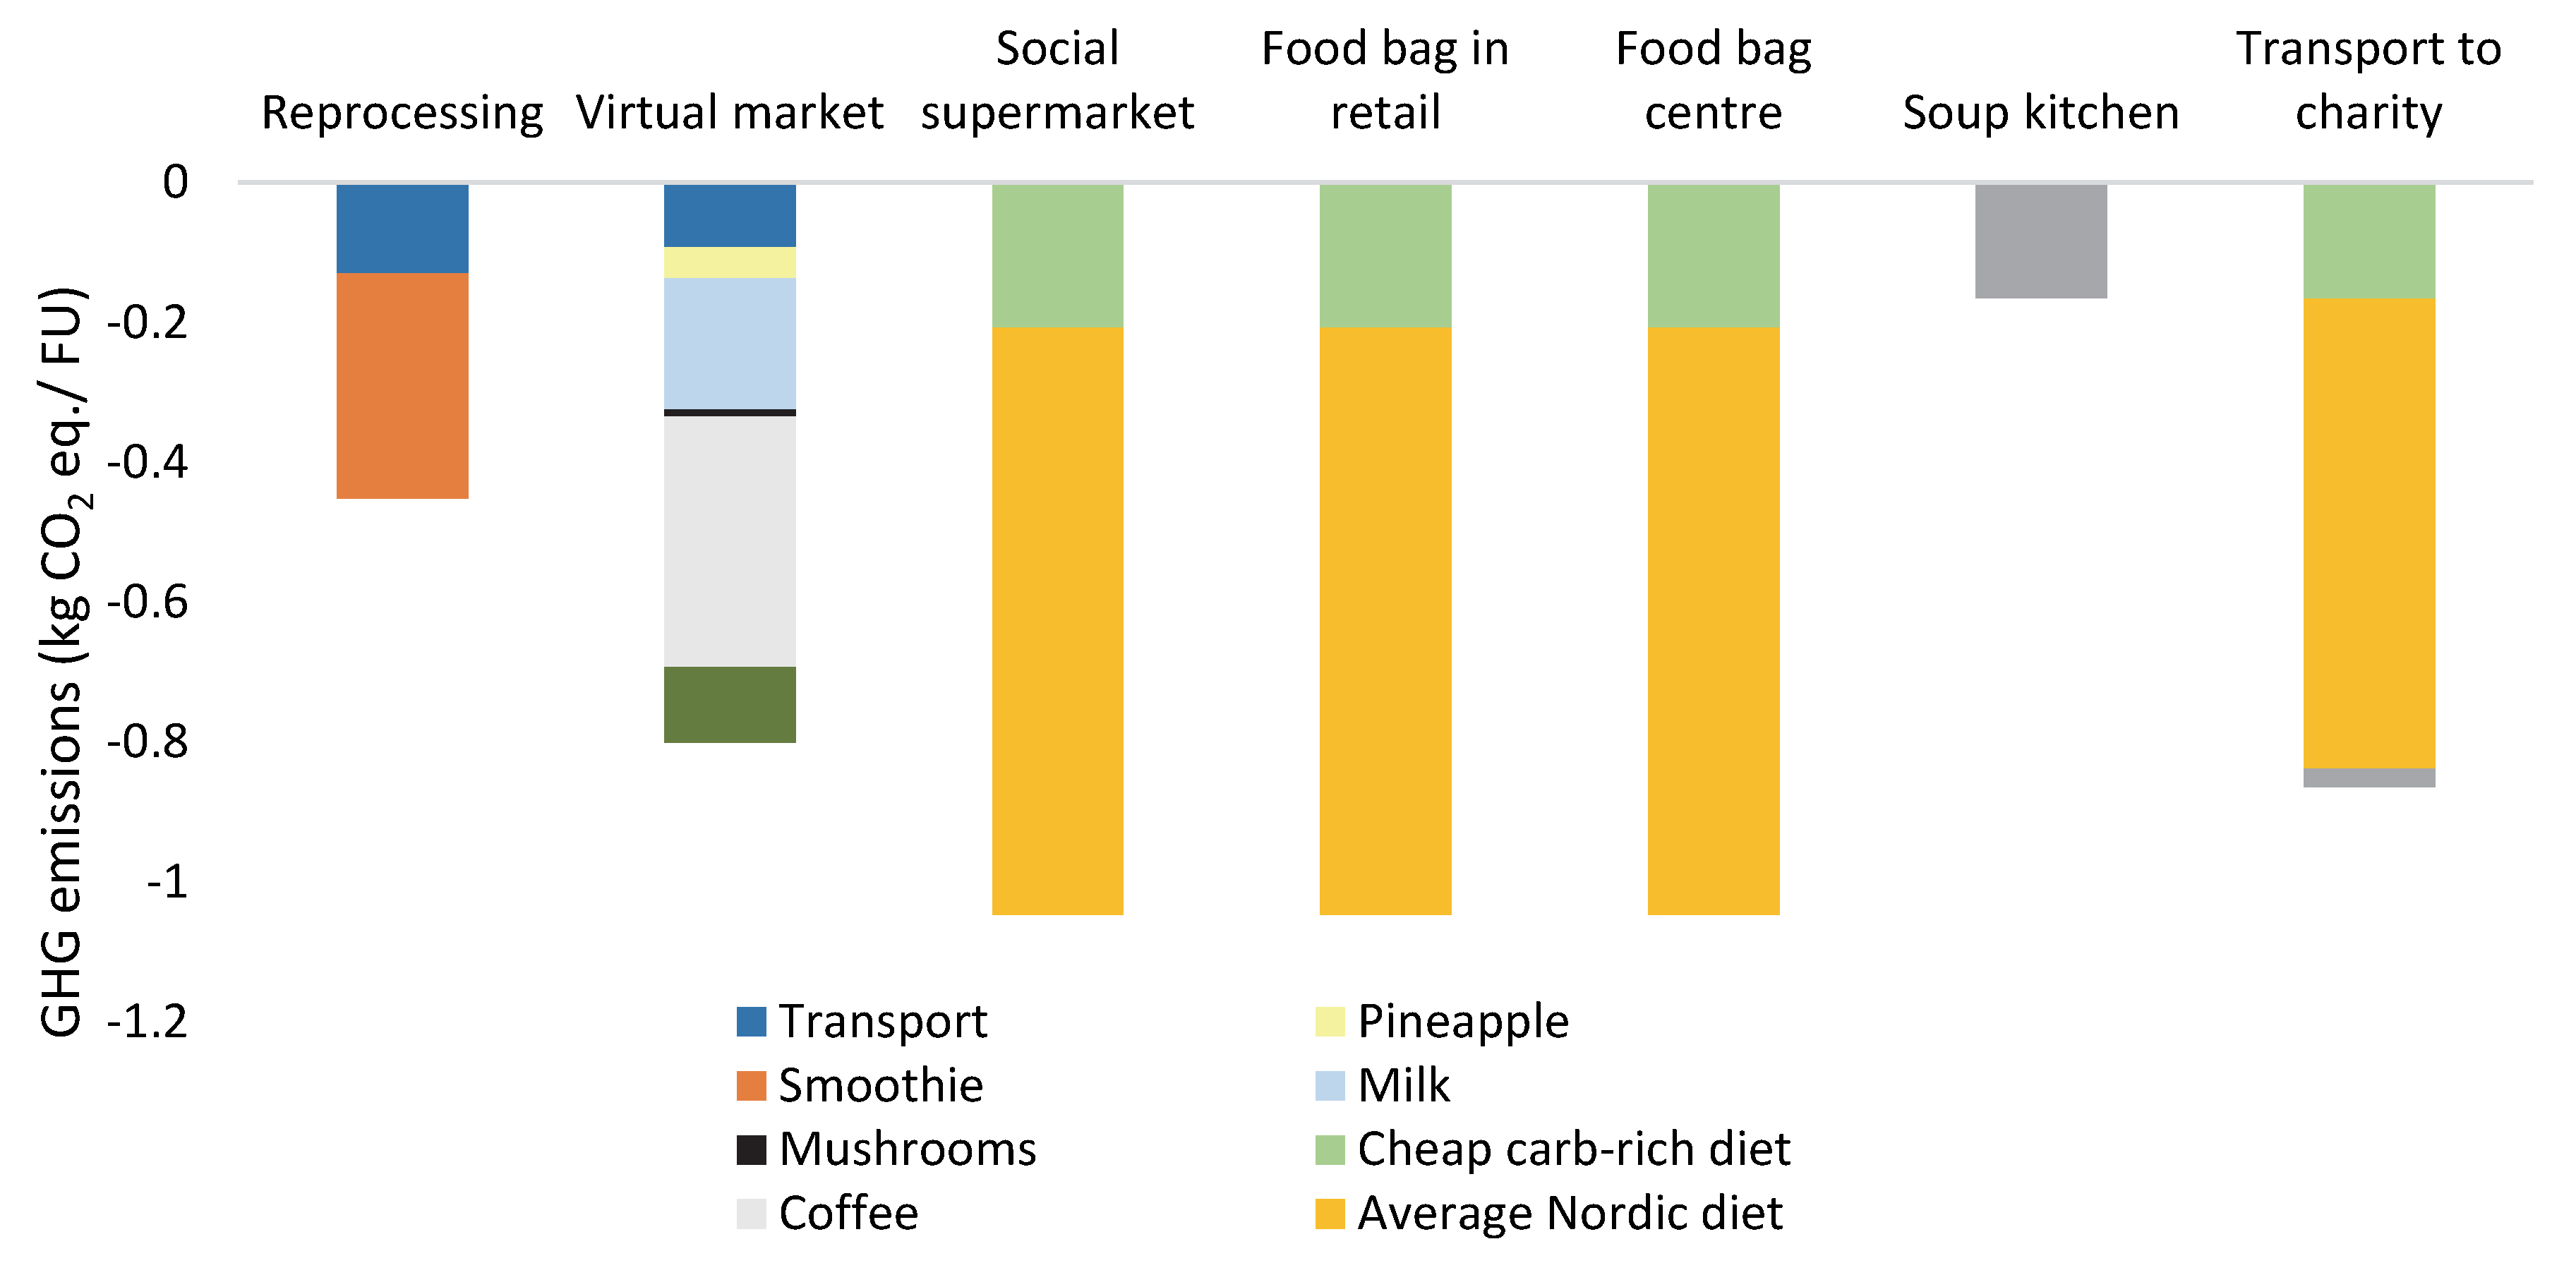
Of the results shown in Figure 3, the process Substituted product is also shown separately in Figure 4. The emissions that originated from the substituted food for each scenario ranged between −0.16 kg CO2 eq./FU for the ‘Soup kitchen’ and −1.04 kg CO2 eq./FU for the ‘Social supermarket’, ’Food bag in retail’ and ‘Food bag center’. For the latter three scenarios, the “Average Nordic diet” (2.1 kg CO2 eq./FU), which represented 50% of the end-users’ diet, had a considerable impact upon the results, while the “Cheap carb-rich diet” (0.5 kg CO2 eq./FU) had a much lower impact. The substituted product in the scenario ‘Soup kitchen’ was two hotdogs, comprising 180 g per kg of redistributed food, i.e., not contributing much to the environmental savings. The transportation of imported food to Sweden (only attributed to some of the food items) had a relatively minor impact on the results, with 0.09 kg CO2 eq./FU for the ‘Virtual market’ and 0.13 kg CO2 eq./FU for ‘Reprocessing’ (Figure 4).
3.3. Economic Impact
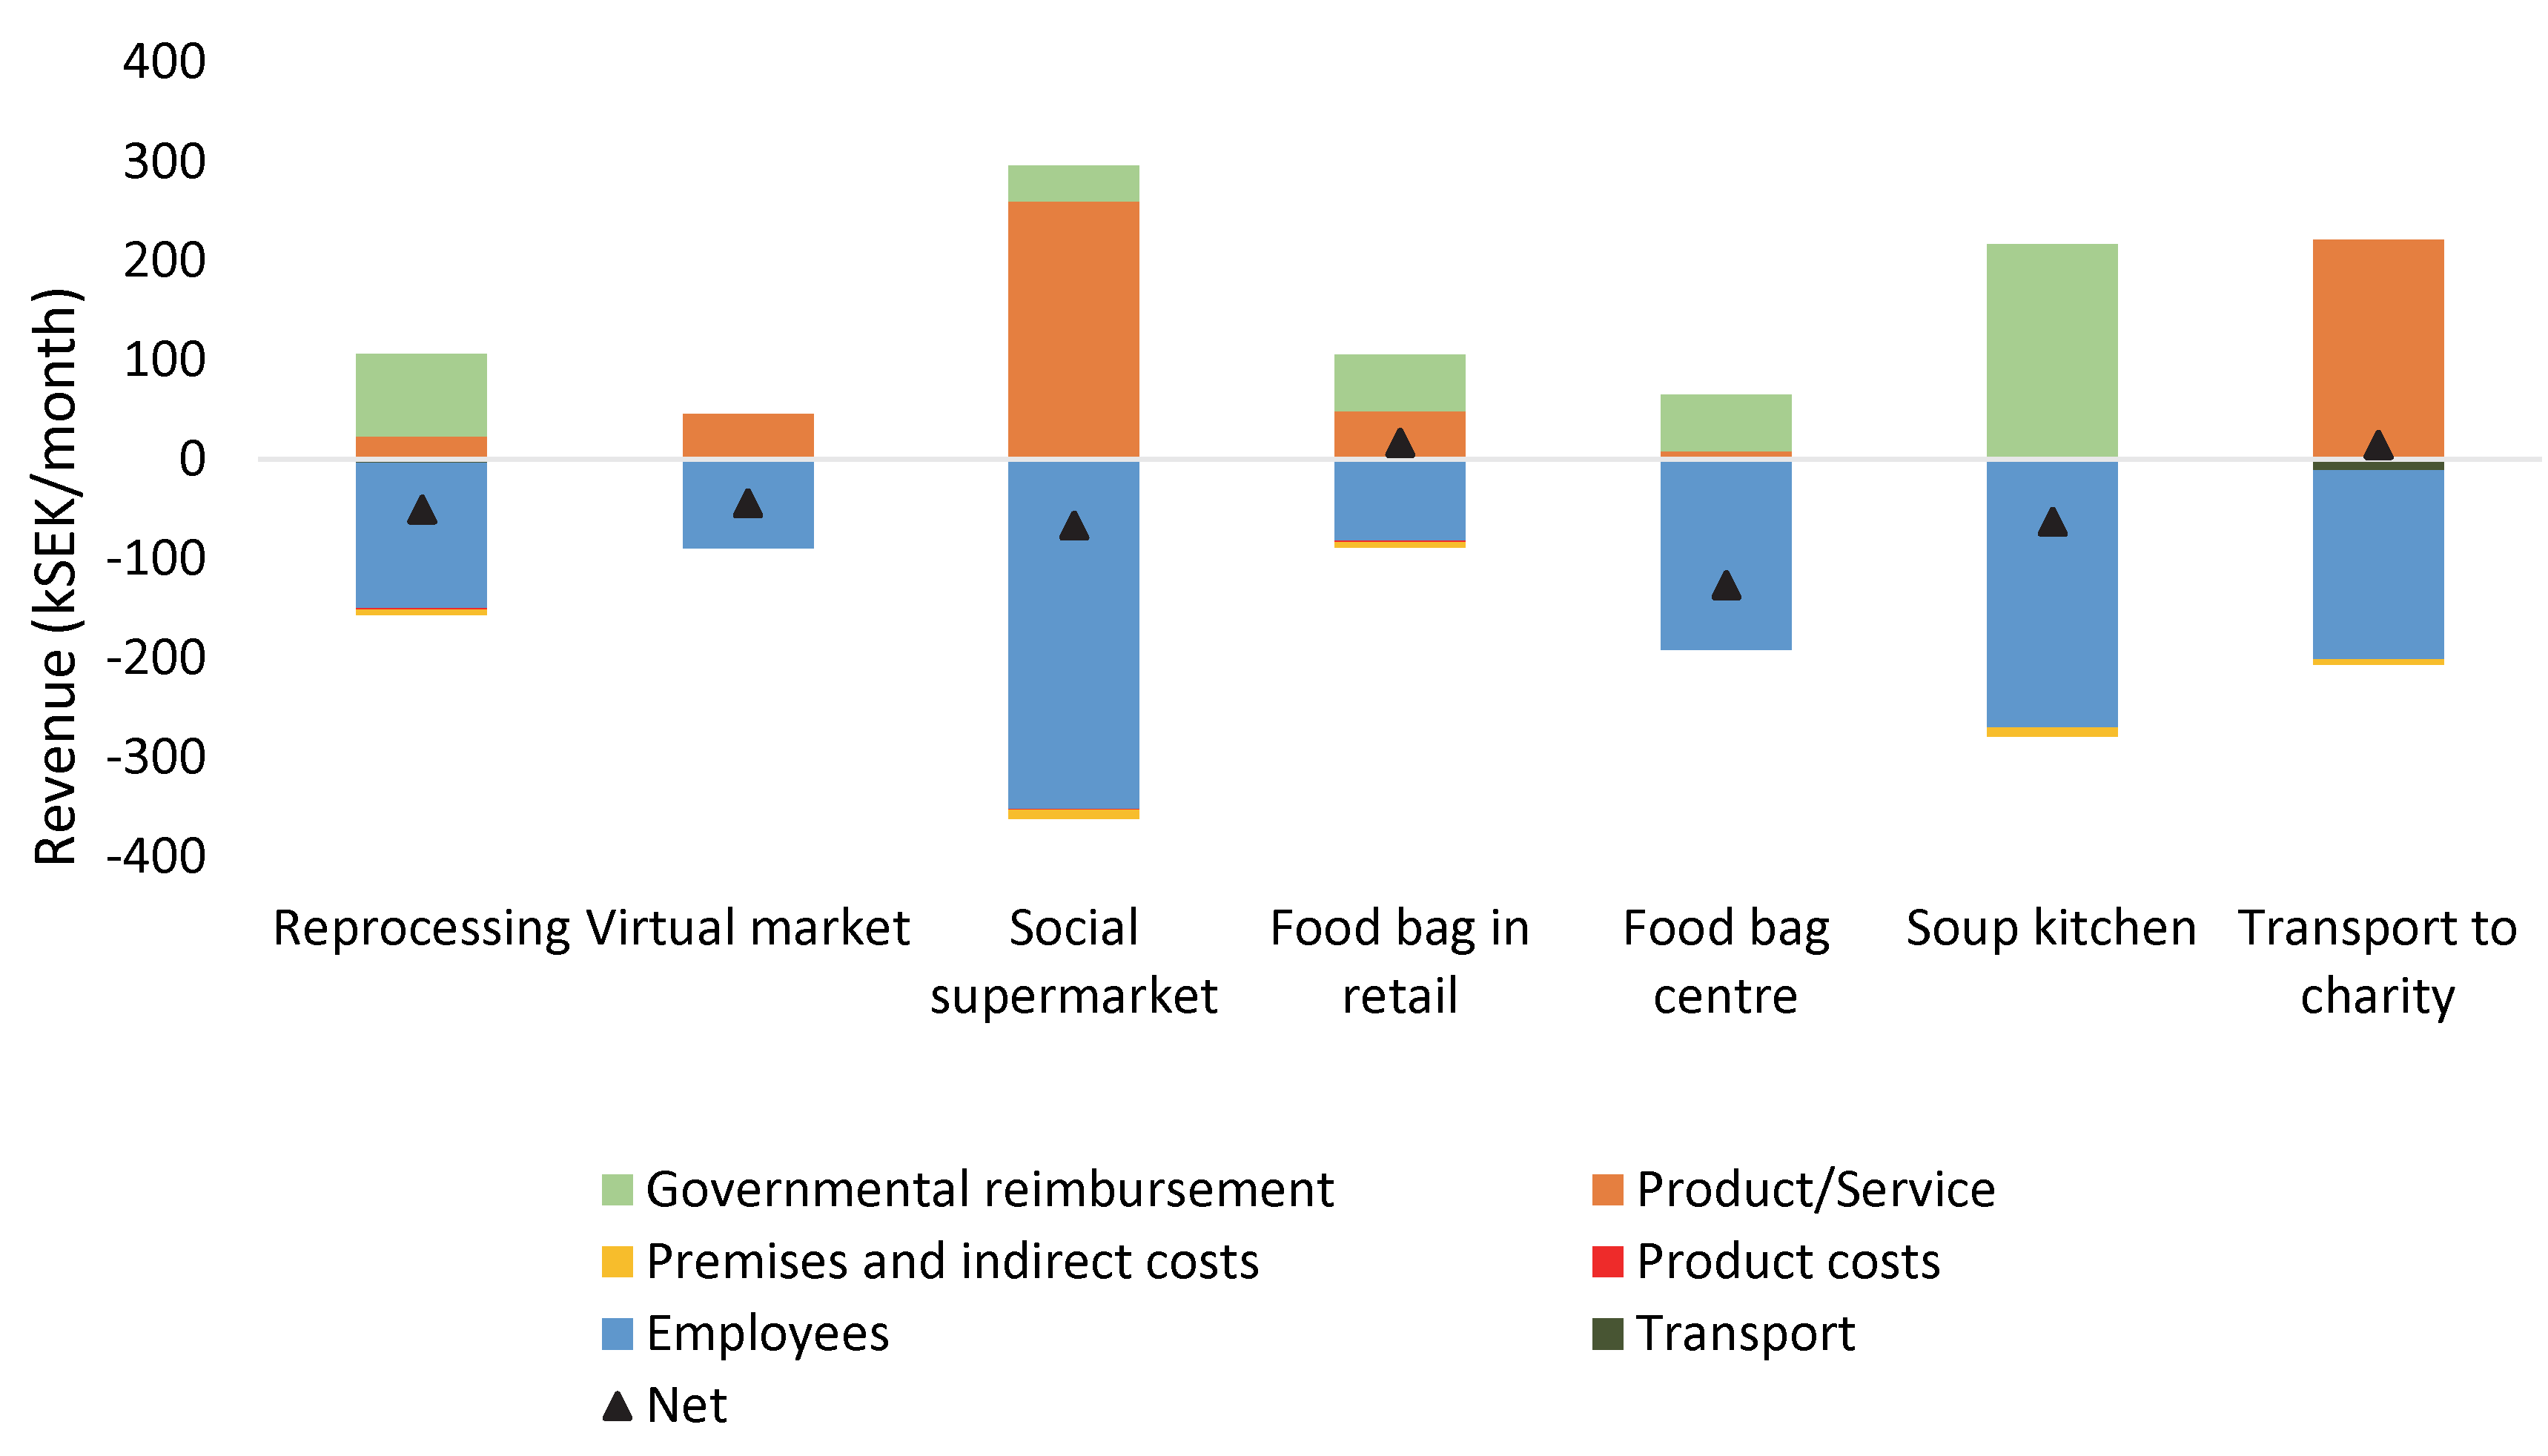
The processes, including costs and revenues for all scenarios, are compiled in Table 4. Two scenarios had positive net values, ‘Food bag in retail’ (17 kSEK) and ‘Transport to charity’ (15 kSEK). The scenario with the most negative net value was that of the ‘Food bag center’ (−127 kSEK), which had an overall low revenue for the processes Government reimbursement and Product/Service, and much higher costs for the process Employees.
The highest revenues for each scenario varied between Government reimbursement and Products/Services (Figure 5). ‘Social supermarket’ had the highest revenue for selling its product, i.e., groceries in its store for 260 kSEK per month, followed by ‘Transport to charity’ with a revenue of 222 kSEK per month. The largest Government reimbursement was attributed to the ‘Soup kitchen’ (217 kSEK per month), followed by ‘Reprocessing’, which was financially supported with 83 kSEK per month. Overall, the largest costs were associated with the process Employees for all scenarios, with ‘Social supermarket’ and ‘Soup kitchen’ with the highest costs, −351 kSEK and −270 kSEK per month, respectively. Product costs and Premises and indirect costs were in general low for all scenarios. The highest Product cost was attributed to ‘Reprocessing’ for producing glass bottles (2 kSEK per month), and the highest Premises and indirect costs were attributed to the ‘Social supermarket’ and ‘Soup kitchen’ (−9 kSEK per month).
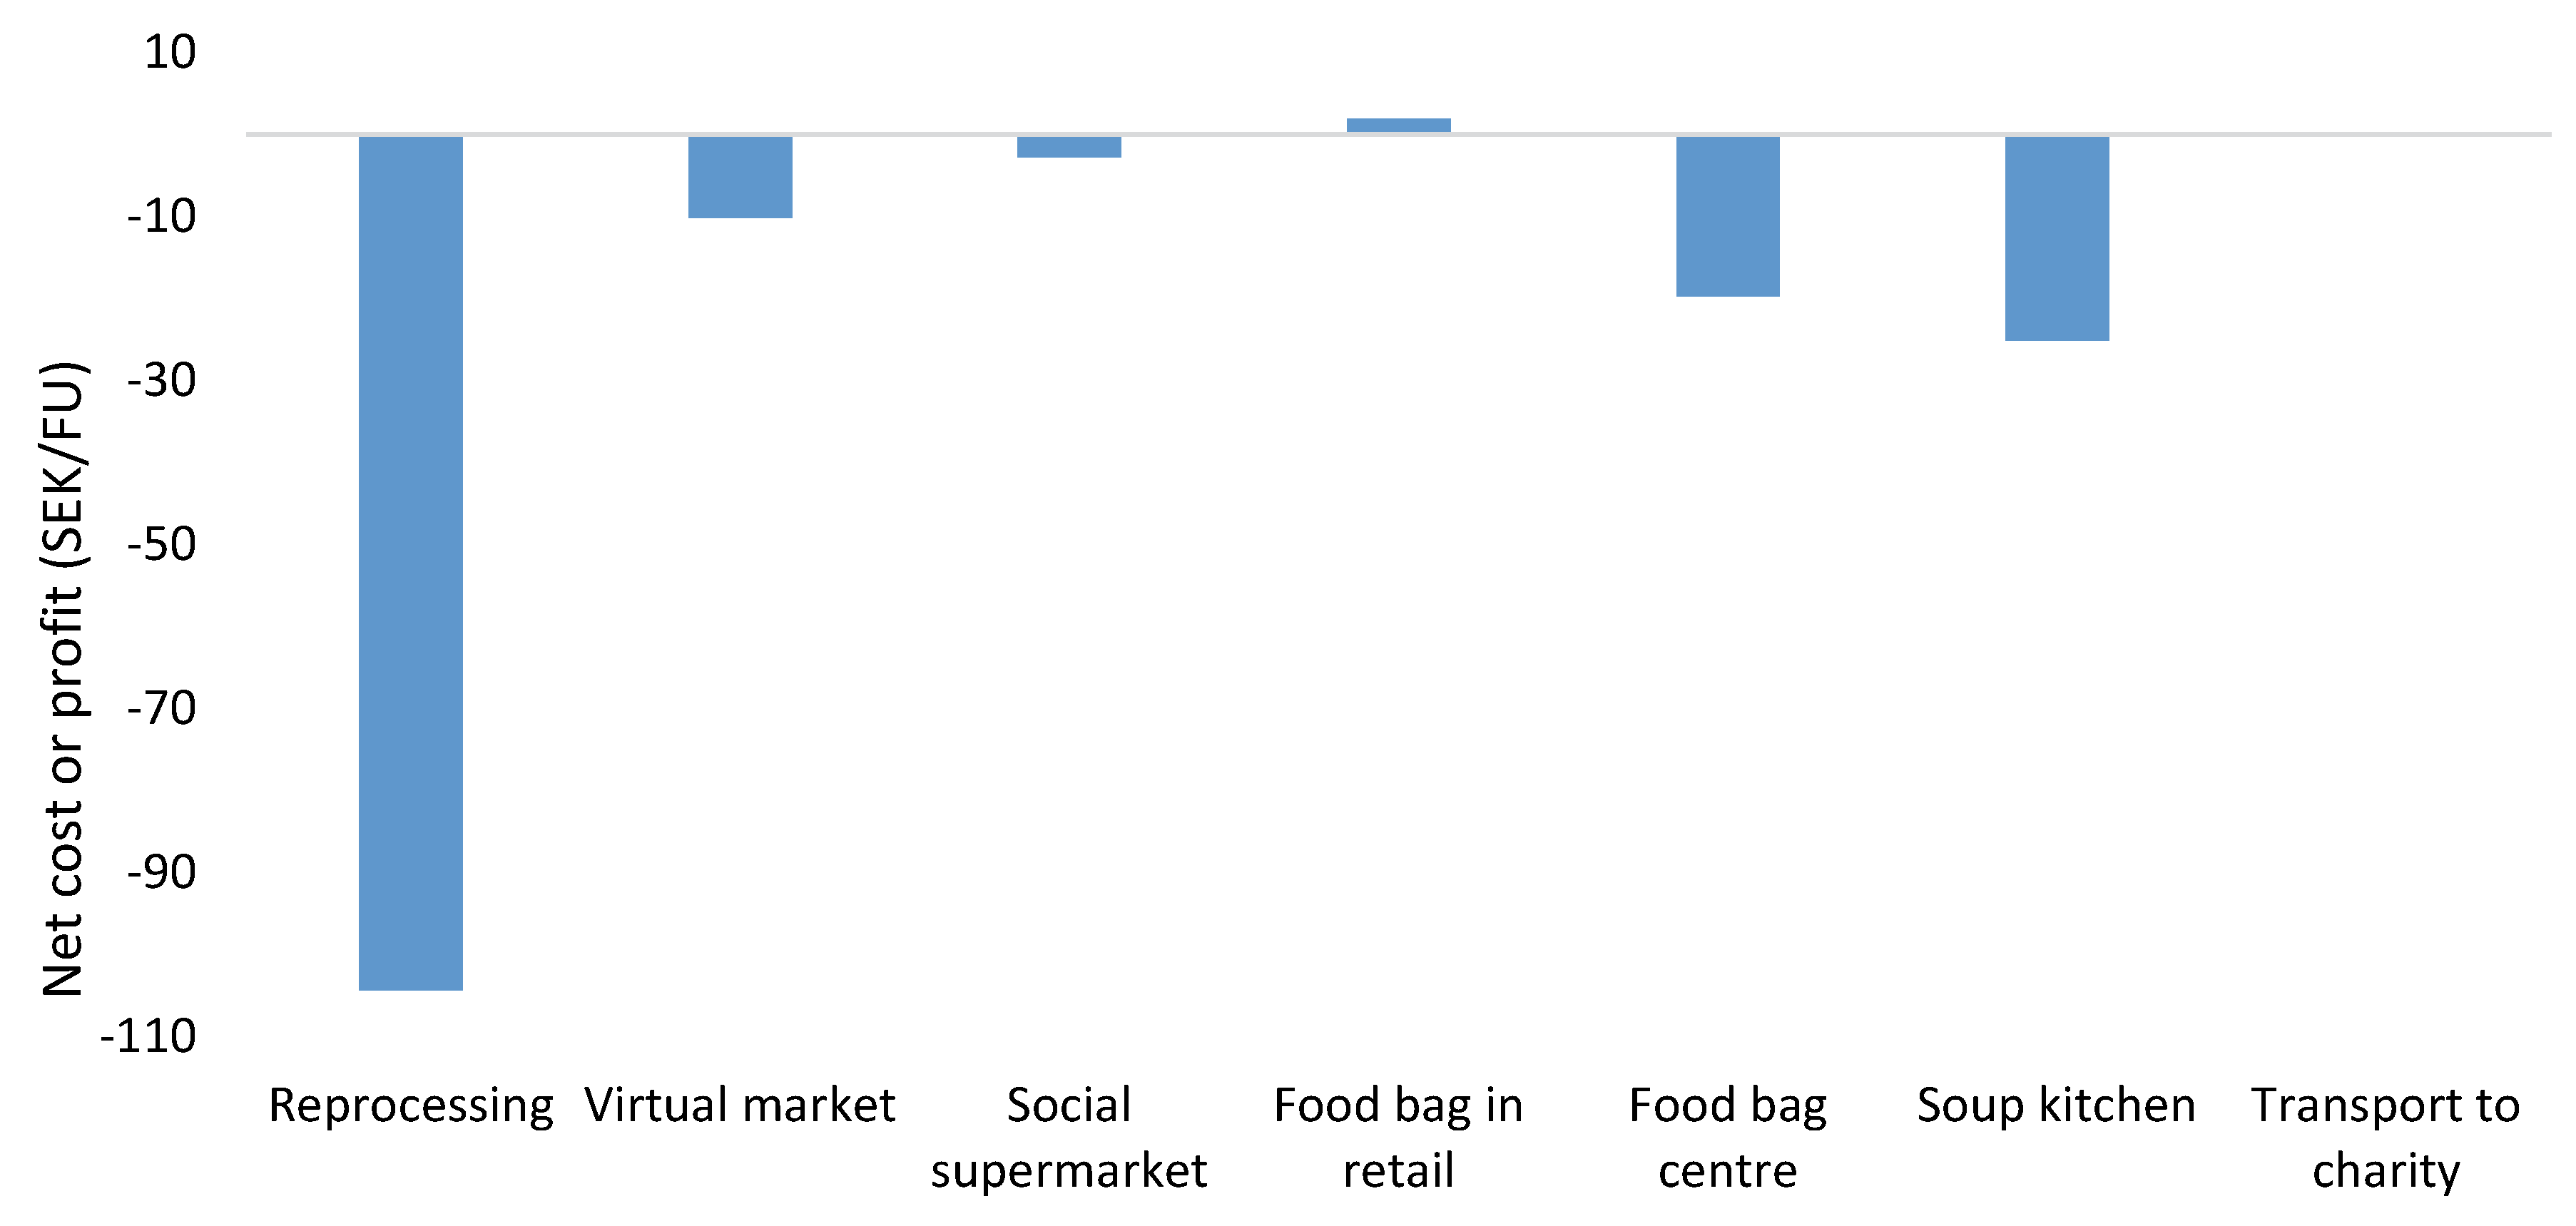
Figure 6 presents the monthly net value per 1 kg of food, where a positive value indicates that the scenario earns revenue per kg of food every month, and a negative value indicates that the scenario loses money per kg of food every month. The most significant results were found for the scenario ‘Reprocessing’, where the net value per kg of redistributed food was −104 SEK. ‘Reprocessing’ had a monthly net value of −50 kSEK (Table 4), and it redistributed a much lower amount of food than the other scenarios (Table 5), resulting in the marked difference between ‘Reprocessing’ and the other scenarios. Two scenarios earned revenue per kg of food; ‘Food bag in retail’ and ‘Transport to charity’, with a positive net value of 2 SEK per kg and 0.2 SEK per kg, respectively.
3.4. Social Impacts
The inventory indicators/processes are compiled in Table 5. ‘Transport to charity’ redistributed the largest amount of surplus food per week, 19,230 kg, and also had the most end-users (7690 + 30,770 people). ‘Reprocessing’ was the scenario that redistributed the least amount of food (150 kg per week), and also had the fewest end-users (200 people). The numbers of people shown in Table 5 are based on the numbers of members, purchasers or guests, i.e., end-users, in each scenario. For the scenarios in which members are entire households (‘Social supermarket’, ‘Food bag in retail’ and ‘Food bag center’), the number was multiplied by the average number of people per household in Sweden [55]. As information on the number of end-users for ‘Virtual market’ and ‘Transport to charity’ was lacking, the number of people that received food was an assumption based on the number of portions (each 0.5 kg) that each of these scenarios redistributed.
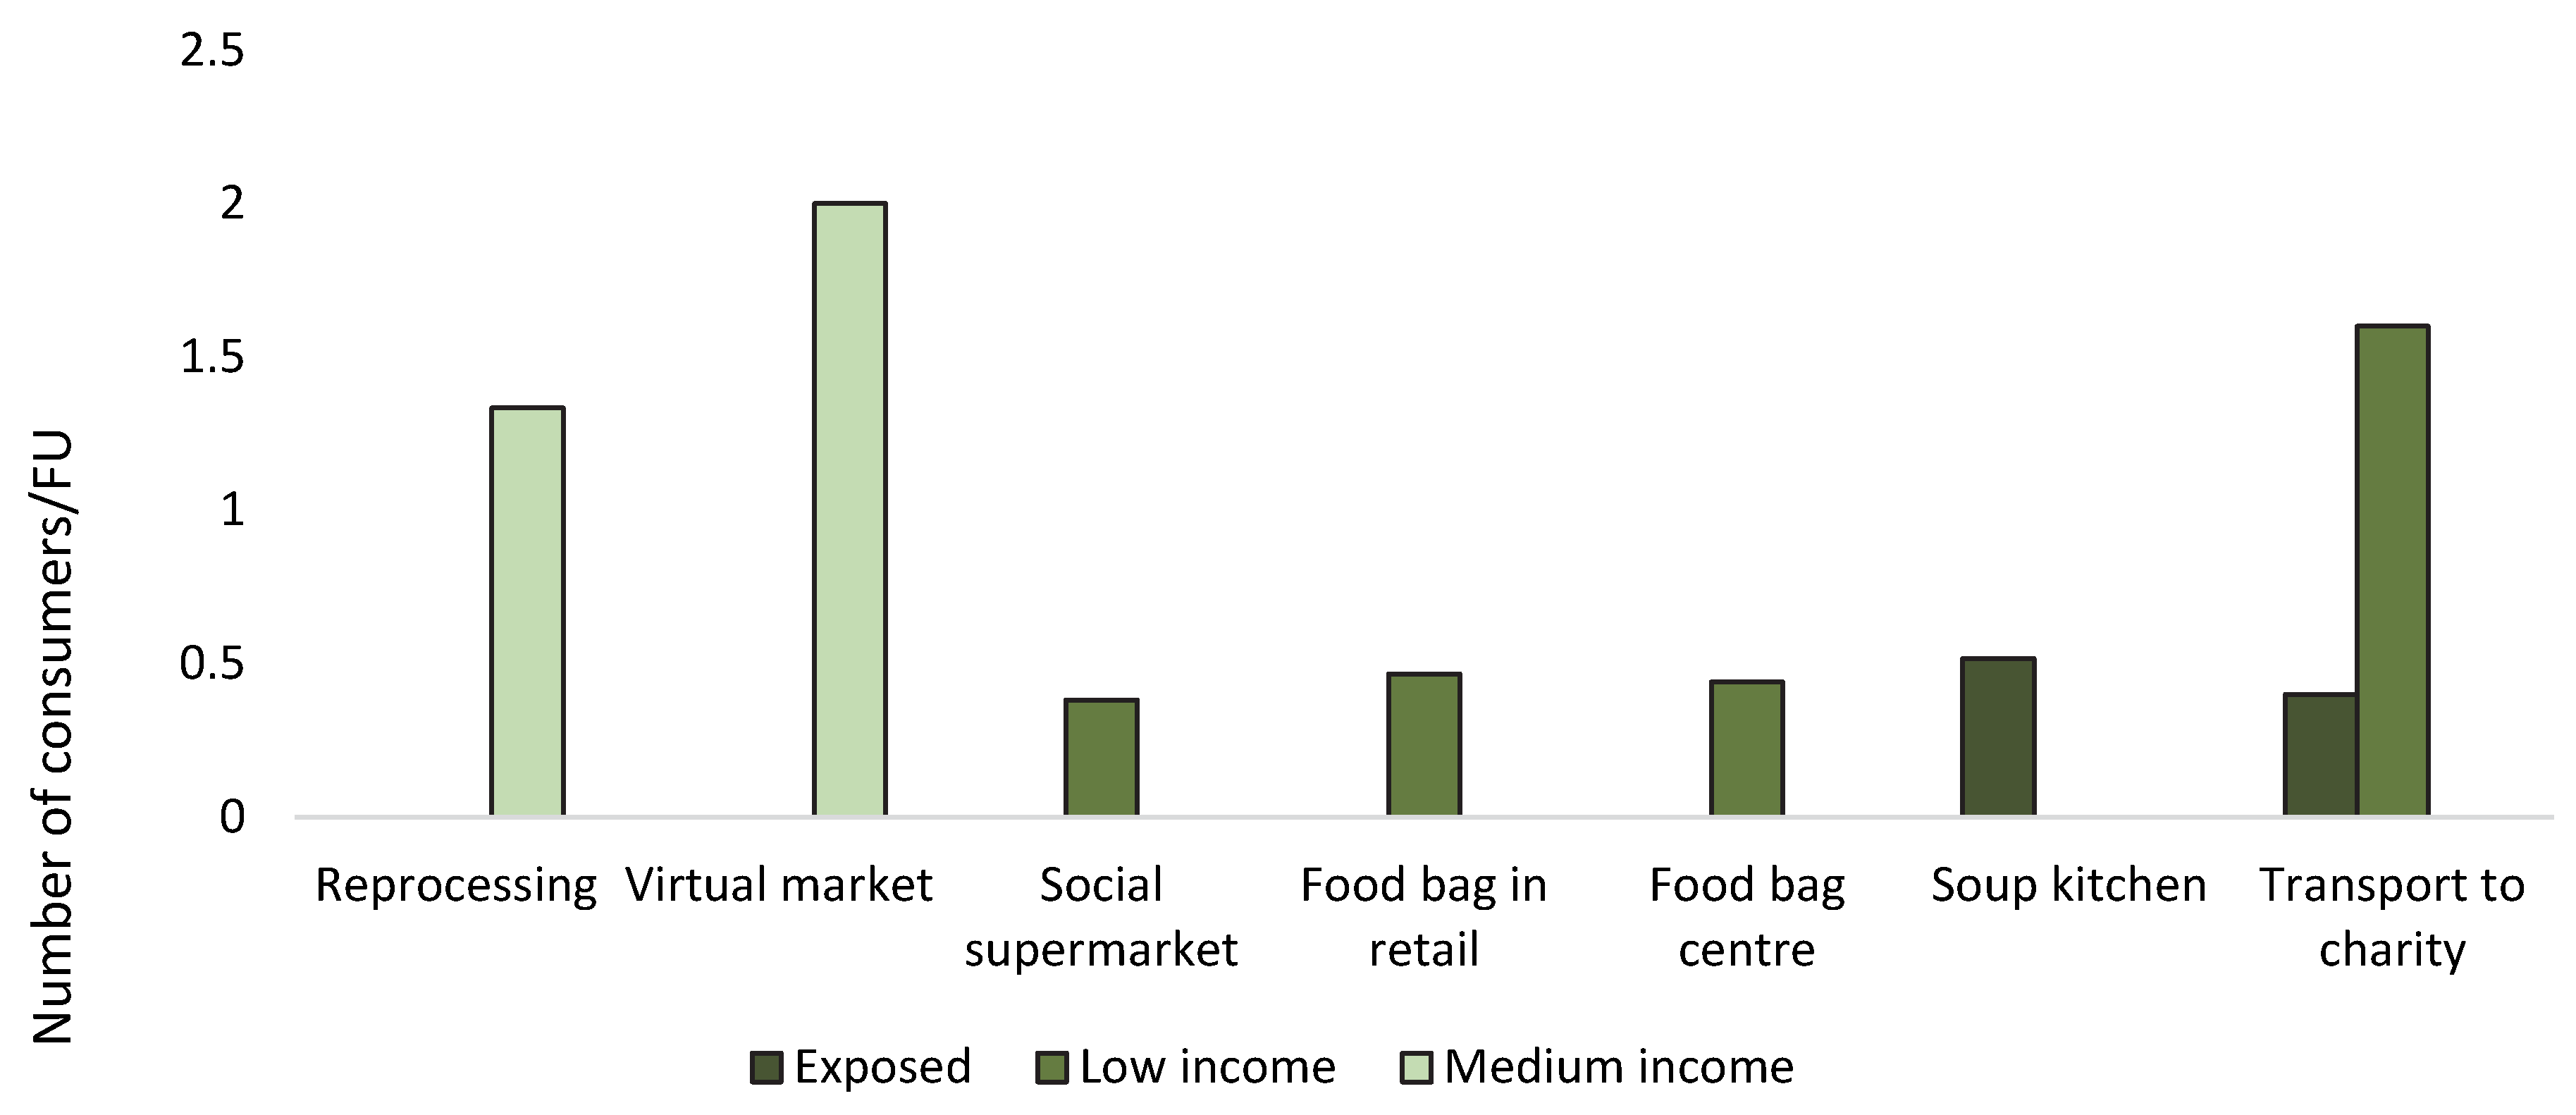
Figure 7 presents number of end-users per kg redistributed surplus food. ‘Virtual market’ and ‘Transport to charity’ had the most end-users per kg redistributed food and ‘Social supermarket’, ‘Food bag in retail’ and ‘Food bag center’ had the fewest; 0.48, 0.58 and 0.55 end-users per kg of redistributed food, respectively. A higher value indicates that the scenario redistributes a smaller amount of food to the individual end-user than scenarios with lower values, i.e., the ‘Social supermarket’ redistributes the largest amount of food to individual end-users. Note that this is partly due to the nature of the different scenarios, as some, e.g., this ‘Social supermarket’, redistribute entire grocery bags that contain a large amount of food to their end-users, while others, e.g., the ‘Transport to charity’, deliver to charity organizations serving one portion of food. One person could of course eat more than one portion of food per week in the scenarios that served food, although that assumption was not included in the analysis.
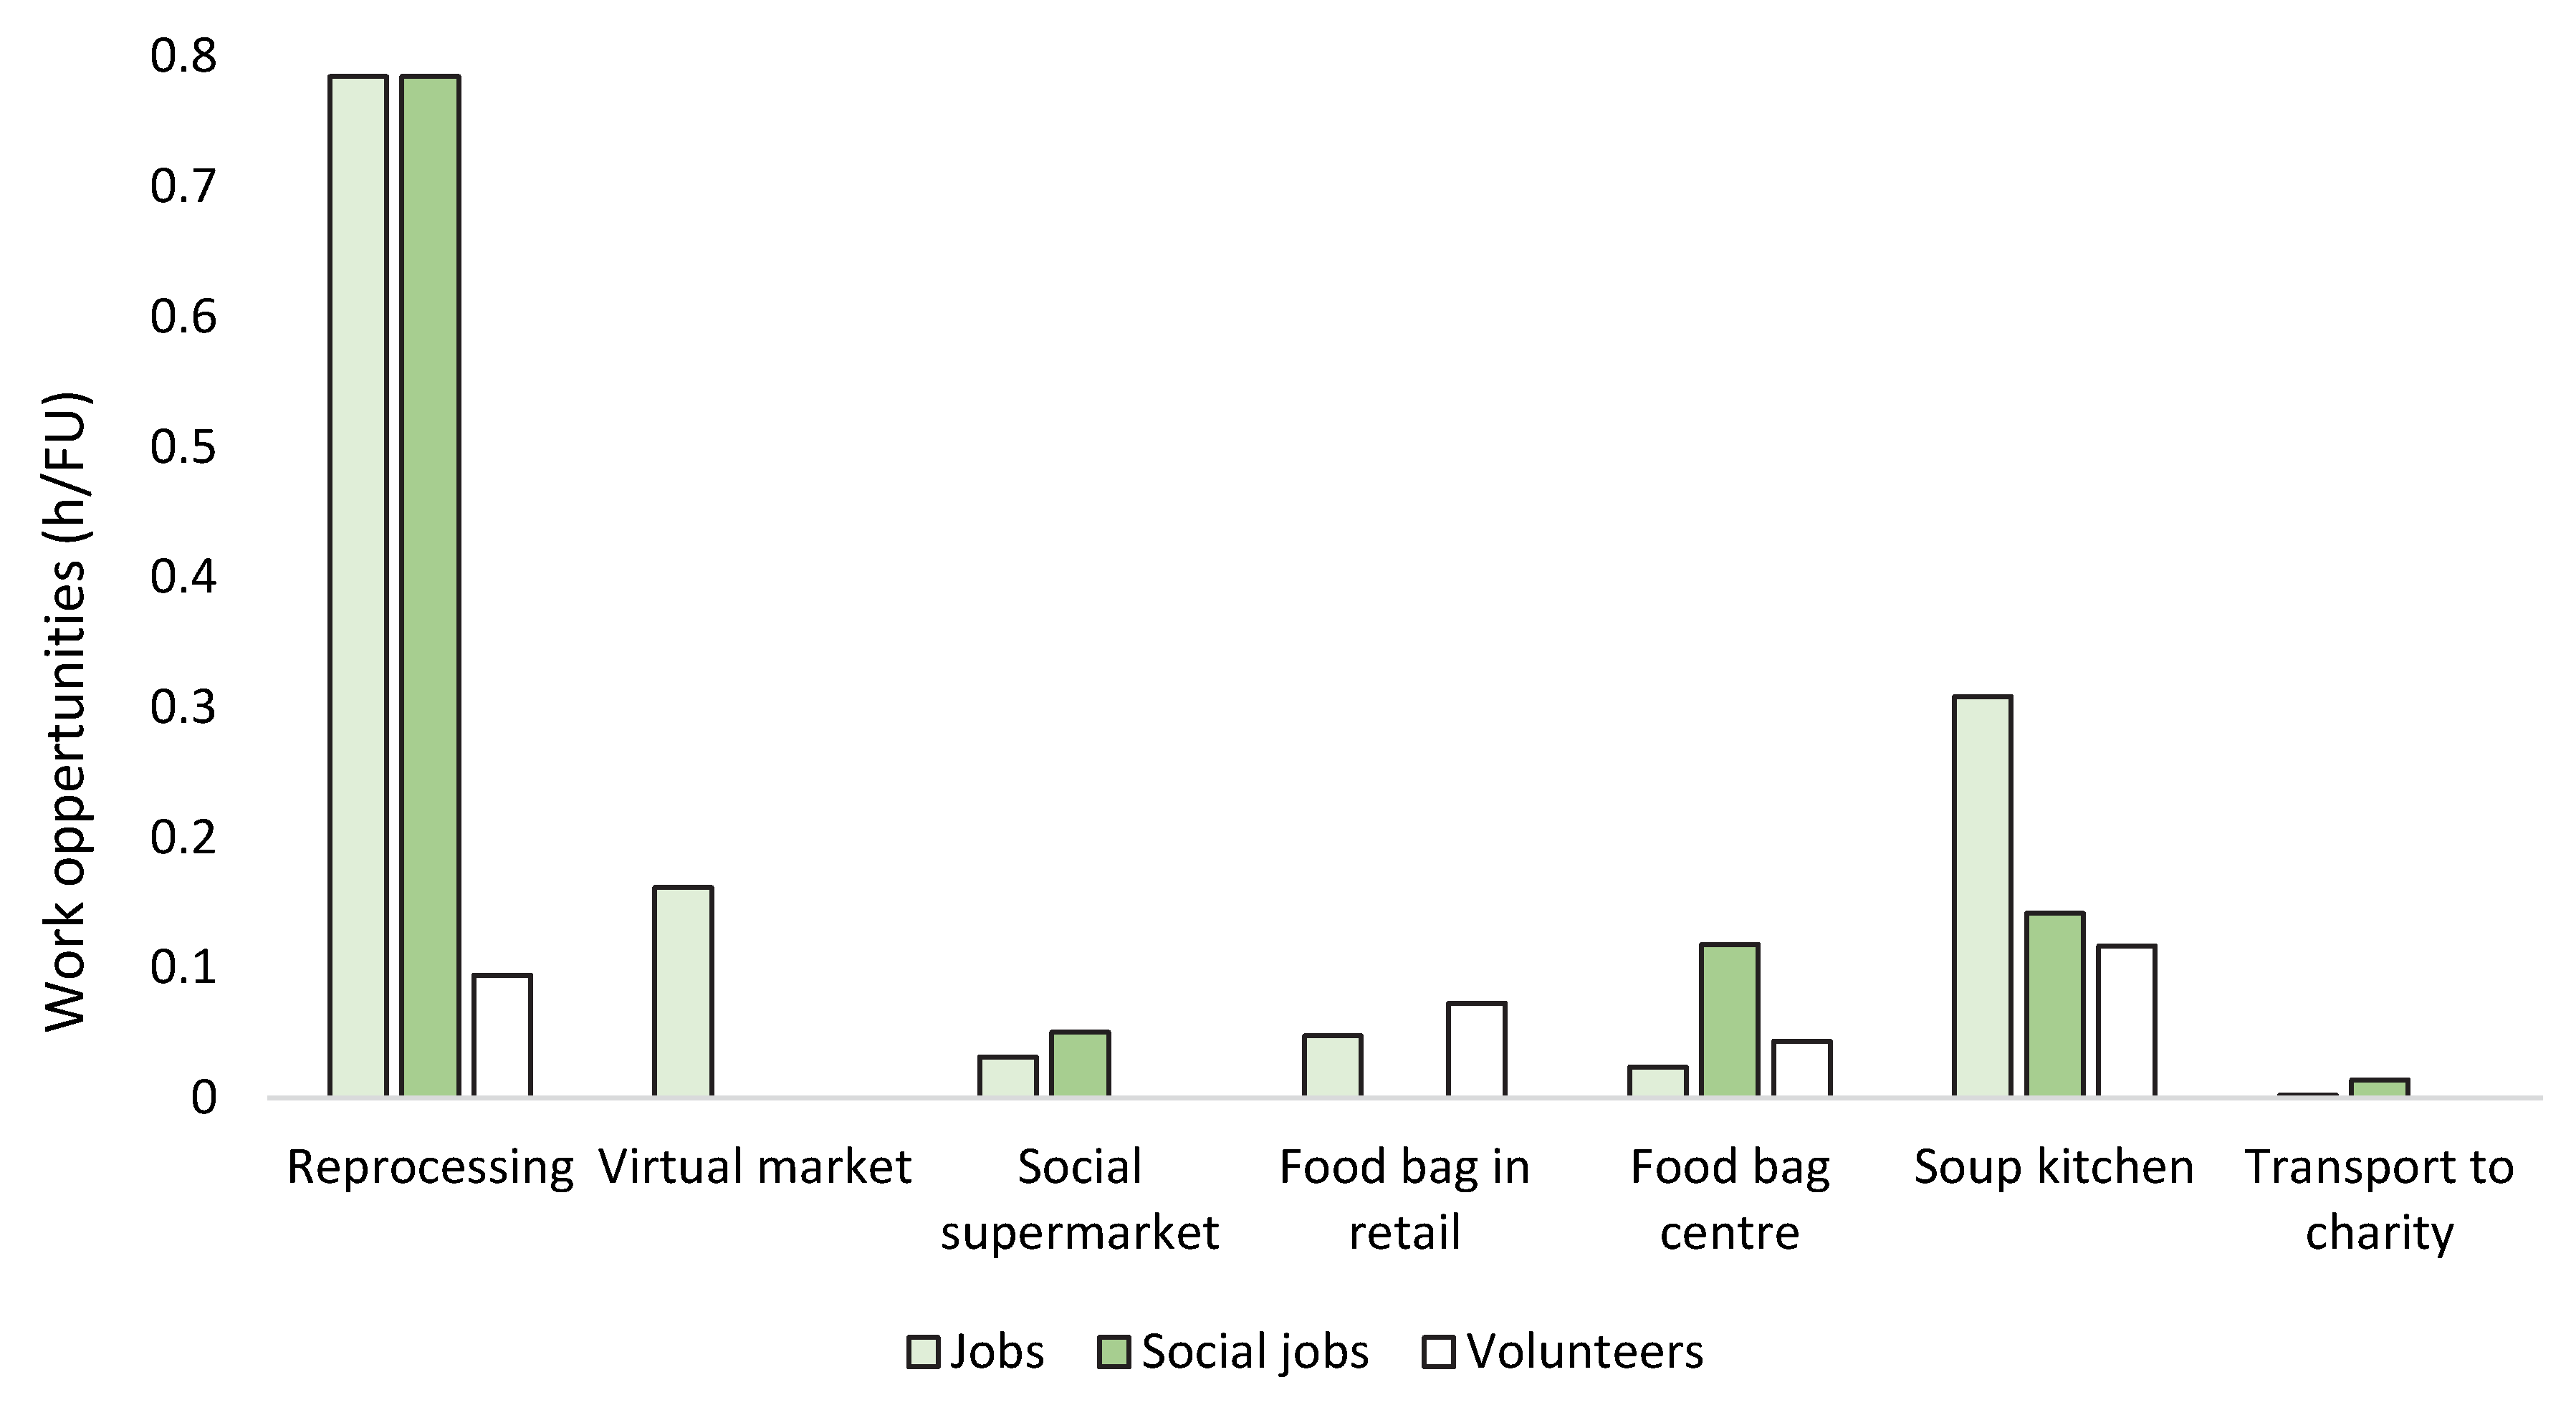
Figure 8 shows the number of total working hours divided by the amount of redistributed food for each scenario, where a lower value indicates that the scenario can redistribute more surplus food with less working hours, and a higher value indicates that the scenario can redistribute less surplus food per worked hour. On the other hand, a high value also indicates that the employees are attributed more working hours per kg of redistributed food, which might benefit the workers, as they gain more working hours. ‘Reprocessing’ had 1.6 worked hours per kg food, followed by ‘Soup kitchen’ with 0.6 h, while the value for the other scenarios ranged from 0.2 h for ‘Food bag center’ to 0.02 h for ‘Transport to charity’.
‘Transport to charity’ had the highest proportion of people taking part as a social job (86%), followed by ‘Social supermarket’ (62%) and ‘Reprocessing’ (43%), which was an inventory indicator attributed a high social value. Note that this ‘Transport to charity’ only takes care of the transportation of food, i.e., that it is part of the operational service in some of the other scenarios. ‘Transport to charity’ lacks the full organizational operation that other scenarios have, e.g., the ‘Food bag center’ handles everything from the collection to the sorting and redistribution of food, and is in need of various types of workers. Thus ‘Transportation to charity’ has a high proportion of people with social jobs, which might not be the case if this scenario included other activities and workers. The ‘Virtual market’ had the highest proportion of people with jobs (100%), followed by ‘Reprocessing’ (43%) and the ‘Social supermarket’ (38%), with a medium social value. The ‘Food bag in retail’ (97%) had the highest proportion of Volunteers, with a low social value.
4. Discussion
The scenarios studied were intended to represent the broad range of current surplus food redistribution units in Sweden (Table 2). All redistribution units are rather new and under development, and cover different areas of end-users, and measures which might be needed to cater for all types of end-users that exist on the market. Surplus food is traditionally redistributed to people in need, although not all food is suited for this type of end-user. The ‘Virtual market’, which redistributes large quantities of food, such as coffee or pineapple, might not be well suited for end-users who lack cooking facilities. On the other hand, market redistribution units could have organizations that help people in need as customers, and thereby provide help to those who might need it the most, such as establishments that run ‘Soup kitchens’, who receive food from various redistribution units.
The results for all scenarios differ, as the functions and capacities of each scenario are different. ‘Transport to charity’, a national food bank, has high capacity, but includes fewer processes than the other scenarios, and it is dependent upon other organizations to actually reach the end consumer. ‘Reprocessing’ is a completely different type of scenario, serving as a local reprocessing plant with low capacity, although including more processes in its system.
4.1. Environmental Impacts
Even though the parameters for each process were quite different in all scenarios, the net emissions did not differ greatly, ranging between −0.2 and −1.2 kg CO2 eq./FU (Table 3). The processes that had the overall most significant impact on the results were Substituted product and Packaging/Substituted packaging. It is evident that Substituted product in the system expansion had a large impact, as it lacked a corresponding process. The food in Substituted product was substituted by the scenario products, i.e., food that would have become food waste if not redistributed by the scenarios, and which therefore resulted in decreased emissions when used. Moreover, the food substituted by the scenarios analyzed in this study did not contain much in the way of animal products. If it had, the environmental savings would probably have been larger, which shows how significant the parameters are for this process. The smoothie produced by ‘Reprocessing’ had an impact of 0.4 kg CO2 eq./FU. This is comparable to findings by Spångberg & Eriksson [18], who analyzed a similar reprocessed product, chutney from surplus food, and obtained a value of 0.3–0.8 kg CO2 eq./FU, depending on the exact recipe of chutney.
For the ‘Food bag in retail’, Packaging generated more emissions than the process Substituted packaging generated environmental savings, although if the study had been extended over a longer period, this would probably have changed, as a cotton bag can be used far more times than a plastic bag, thus lowering the value for Packaging.
Rebound effects were not evaluated in this study, but it is very likely that they had an impact upon some of the results. For redistribution units targeting end-users with sufficient income, the possibility to buy food cheaper will likely result in higher total consumption and reduce the savings from avoiding food waste. For redistribution units focusing on end-users with low income or no income, the rebound effect is likely to be much smaller, since there is little scope for extra consumption among these groups, even after receiving donated food. The seasonality of surplus food generation was another factor not evaluated in this study due to previous studies on Swedish supermarket food waste [24,25,26,56], indicating a lack of seasonality, with the exception a few products connected to specific holidays. The main donated food types were bread, fresh fruits and vegetables. In the study, we also assumed that this relatively healthy food would replace a less healthy diet. Therefore, it is not the exact composition of the donated food that influences the result. But instead, the assumption that one mass unit of donated food can replace one mass unit of replaced food (= an alternative diet that would have been consumed if this redistribution would not take place). The consequence of this assumption is that a previous diet potentially including a lot of meat would change to a much more environmentally friendly one, based on products of vegetable origin. This means that the assumption in some cases must be considered as unrealistic, and that the more healthy products cannot complete with the less healthy (and potentially tastier) ones.
4.2. Social Impacts
The results of S-LCA can be considered in terms of the stakeholders, workers and end-users. The scenarios ‘Transport to charity’, ‘Social supermarket’, ‘Food bag center’, ‘Soup kitchen’ and ‘Reprocessing’ all employ workers with difficulties entering the job market, although the number of people that they employed varies. Providing work opportunities for people who have difficulties entering the job market is essential, as these people might not get another job opportunity, making organizations that supply these types of opportunities important, and they can possibly create other opportunities later.
The end-users that gain the most social value from receiving food are exposed people with little or no income, followed by people with low income. There was a clear difference between the capacity of ‘Transport to charity’ and the ‘Soup kitchen’, which had the same target group. The ‘Soup kitchen’ redistributed 775 kg food per week, while ‘Transport to charity’ redistributed 19,230 kg per week, which had a large impact on the number of people that can receive food through the scenario. The scenarios ‘Social supermarket’, ‘Food bag center’ and ‘Food bag in retail’ also gave a high social value, as they redistribute food to another target group, people with low income.
While this target group has some form of income, their monetary means are very limited, and it seems that many of them have children to support (e.g., the ‘Food bag center’ had 193 member households with children out of 400 households). If the members did not partake in the ‘Food bag center’, they would perhaps eat less food, or less nutritious food. The weekly bags provided by this ‘Food bag center’ contain a large proportion of vegetables and fruit, a valuable source of vitamins and minerals which are essential for a healthy diet.
Social drawbacks, e.g., shame or humiliation, were excluded from the analysis. The members of the redistribution unit “Matkassen” interviewed here all expressed gratitude for the unit, and said that they receive surplus food of good quality. The staff of “Matkassen” sort surplus food before distributing it in bags, throwing away food of low quality, which might result in less efficiency, due to food waste generation, but with the benefit of keeping quality standards high. Since the main donated food types were bread, fresh fruits and vegetables, the redistribution may provide an extra social benefit of improving the healthiness of the diet of the end consumers by providing a much higher intake of dietary fibers, vitamins and minerals then the assumed substituted food. However, this additional benefit was not included in the analyses since it would not be effortless to prove precisely what type of food replaces what for each individual. In addition, if all of the end consumers change their whole diet to a more healthy one, just because it is provided to a much lower price, or if they add foodstuff to the redistributed food because of its tastiness, rather than the nutritional need.
4.3. Economic Impacts
All but two scenarios, ‘Food bag in retail’ and ‘Transport to charity’, had monthly monetary losses. A scenario cannot be economically sustainable if the organization is losing money every month. However, there is some uncertainty regarding the costs and revenues of each of the scenarios. All of the costs were based upon information from redistribution unit websites, or they were obtained through interviews, although the costs are in many cases not precise, or are unknown, or are only estimates of what was provided, as companies might feel unwilling to share financial information. The scenarios ‘Social supermarket’, ‘Food bag center’ and ‘Soup kitchen’ also have revenues from company and private donations, as well as the advantage of distributing money to the respective scenario from another sector within the organization. This was not included in the assessment, as the values of these revenues are unknown. Including these values would probably give each of these scenarios a net monetary value that comes out even.
On a different note, it is questionable whether a company is economically sustainable if it needs monetary support from another organization. All scenarios, excluding ‘Virtual market’ and ‘Transport to charity’, receive some sort of monetary support from the government, counted as revenue in the LCC. Taking away this support might create a financial situation that is not economically sustainable for the scenarios. ‘Food bag center’, ‘Soup kitchen’ and ‘Food bag in retail’ have several volunteers working for them, lowering the costs for these organizations, especially ‘Food bag in retail’ (106 volunteers out of 109 workers). Without these volunteers, ‘Food bag in retail’ would have much higher costs, so it depends on volunteers to support itself.
4.4. Total Sustainability
The total sustainability performance of the scenarios depended on the parameters evaluated. The capacity of the scenarios matters, as there are large amounts of surplus food in Sweden, originating from, amongst others, the retail sector, where changes can clearly be made. If Sweden wants to reduce its food waste in terms of meeting the demands of target 12.3 in the SDGs, and follow the recommended 50% reduction by 2030, solutions that redistribute large amounts of surplus food are needed. However, this raises the ethical question of whether the future food system must rely on people in need to eat the surplus food. Moreover, this system would clash with another SDG goal, ‘No Poverty’ [57], which aims to reduce the amount of people living in poverty, i.e., the people that benefit from those units that redistribute surplus food. A system like this would initially work and meet both SDG goals. In the long run, however, if the reduction in food waste relies on people in need, and they become fewer in number, the system would disconnect.
The redistribution units upon which the scenarios are based are rather new, and still under development, so they might not have reached their full potential yet. In this identification of redistribution units in Sweden, various solutions and end-users that might be needed in Sweden, as they cover different areas of interest, were selected. Several of the scenarios assessed work with exposed people and people with low incomes, which are those target groups that gain high social value from receiving food, and would probably not get similar support elsewhere. However, these units are not designed to be profitable, since their main purpose is to support people, rather than earn money, and can therefore be seen as a way of investing money in social sustainability. In this context the ‘Social supermarket’, the ‘Food bag in retail’ and the ‘Food bag center’, could be ranged as the most sustainable redistribution systems, since they all, by intention, invest money to increase environmental and social sustainability, and they provide the full redistribution system from the donating organization to the end consumer. Despite this, it is important to point out that there seem to be both room and the need for other redistribution initiatives.
This study is limited to Swedish conditions, but some aspects of the result can be considered as general, and possible to apply also in other places. One such issue is the need for financing, as exemplified by the previously mentioned redistribution systems. However, it is not just these cases that need external financing, and often public funding is used to generate social values. So even if the food is donated for free, it is not for free to run a redistribution operation, since someone needs to pay, which is often done with their time as volunteers, by receiving private or public funding or running other business on the side to generate an income to support the social work. To score high on all scales of sustainability ranking seems to be too much to ask for, and we did not find any redistribution initiative that provided both social and environmental values, and at the same time, were profitable (or at least could cover the actual costs of redistribution). The claim by Schneider (2013) that all sustainability dimensions (environmental, societal, economic) are met by food donations to people in need, might have shortcomings. Trade-offs between the economy, environment and society were seen here for some of the scenarios. There are clear social benefits in redistributing surplus food to people in need, although the environmental benefits from redistributing surplus food to people in need may be lower than from redistributing surplus food to people with higher incomes. People with higher incomes can be expected to eat more animal products [58], with (in general) higher GHG emissions, than people with low income, and also greater amounts of food than exposed people. Thus, if people with higher income avoid purchasing food at retail, and instead purchase surplus food, the environmental benefit should be higher. Such a trade-off was not evident in this study, as the scenarios that have purchasers or companies as end-users do not have any animal products as the substituted product. There is a clear need for further research, as knowledge of the sustainability of surplus food redistribution to avoid food waste is incomplete, and needs to be developed further.
5. Conclusions
Eighteen third-party redistribution organizations that redistribute surplus food in Sweden were identified. These redistribution units were divided into seven different scenarios to evaluate the sustainability performance. From an environmental perspective, the scenarios ‘Social supermarket’ and ‘Food bag center’ generated the largest savings. In economic terms, the ‘Food bag in retail’ scenario gave the largest profit, but some units (i.e., the costliest ‘Food bag center’) are financed by other activities (e.g., second-hand stores) within the charity organization and therefore have a planned cost to generate social benefits. From a social perspective, the ‘Reprocessing’ scenario created the highest number of job opportunities per kg of redistributed food, while the ‘Transport to charity’ scenario reached the largest number of end-users with low or no income. However, the ‘Transport to charity’ scenario is dependent upon charity organizations distributing the surplus food to exposed people and low-income end-users.
It is difficult to say which type of surplus food redistribution unit contributes the most to sustainable development, and some can only work in symbiosis with other redistribution units to distribute the food, or to provide economic support. All of the units assessed contribute to the achievement of SDG target 12.3 on reduced food waste, and since surplus food redistribution is still an emerging market in Sweden, there seems to be room for all units to work in the same ecosystem to produce mutual benefits. However, in the longer perspective, the food waste reduction cannot be dependent upon people in need to utilize all the surplus food generated. The need to both reduce poverty, and to reduce the production of surplus food still needs to be addressed in order to achieve sustainable development.
Author Contributions
Conceptualization, C.M. and M.E.; Data curation, P.B.; Formal analysis, P.B., C.M., I.S. and M.E.; Funding acquisition, M.E.; Writing—original draft, P.B.; Writing—review and editing, P.B., C.M., I.S., O.J.H. and M.E. All authors have read and agreed to the published version of the manuscript.
Funding
This research was funded through the H2020 ERA-net Cofund on Sustainable Food Production and Consumption (SUSFOOD2) by the Swedish Research Council for Sustainable Development (Formas), grant number FR-2018/0001 and through the Research Council of Norway, grant number 284506.
Acknowledgments
The authors would like to thank all of the organizations that contributed information vital to the study.
Conflicts of Interest
The authors declare no conflict of interest. The funders had no role in the design of the study; in the collection, analyses, or interpretation of data; in the writing of the manuscript, or in the decision to publish the results.
Appendix A

Table A1.
Inventory data used in the Environmental Life Cycle Assessment (E-LCA). All of the values are presented in their original state, where 20% of food waste is not deducted.
Table A1.
Inventory data used in the Environmental Life Cycle Assessment (E-LCA). All of the values are presented in their original state, where 20% of food waste is not deducted.
| Scenario | Process | Amount | Data | Reference |
|---|---|---|---|---|
| Social supermarket | Food emissions 1 Cheap carb-rich diet Yoghurt Pasta Soft drink Bread Average Nordic diet Transport Collecting surplus food Shipment weight End-user transport (50% of purchasers) Food weight/pick-up Packaging High-density polyethylene (HDPE) Plastic bag Number of bags/year | 1.27 kg CO2 eq. 0.5 kg CO2 eq. 0.15 kg CO2 eq. 0.67 kg CO2 eq. 2.1 kg CO2 eq. 1543 km/week 650 kg 10 km/week/person 5.1 kg 1.58 kg CO2 eq. 67,600 bags | Van, Petrol E5 Swe, Euro 5 City bus, Diesel E5 Swe, Euro 5 SCR City bus, Diesel E5 Swe, Euro 5 SCR It is assumed that 1300 people use one bag/week for one year | [59] [60] [61] [62] [31] [63,64] [64] [65] |
| Food bag center | Food emissions Cheap carb-rich diet Yoghurt Pasta Soft drink Bread Average Nordic diet Transport Collecting surplus food Shipment weight End-user transport (50% of purchasers) Food weight/pick-up Packaging HDPE Plastic bag Number of bags/year Non-woven polypropylene bag Number of bags/year | 1.27 kg CO2 eq. 0.5 kg CO2 eq. 0.15 CO2 eq. 0.67 kg CO2 eq. 2.1 kg CO2 eq. 170 km/week 500 kg 5 km/week/person 5.8 kg 1.58 kg CO2 eq. 20,800 bags 21.51 kg CO2 eq. 800 bags | Van, Petrol E5 Swe, Euro 5 City bus, Diesel E5 Swe, Euro 5 SCR It is assumed 400 people use one bag/week for one year 400 people use two bags/week for one year | [59] [60] [61] [62] [31] [63,64] [64] [65] [65] |
| Food bag in retail | Food emissions Cheap carb-rich diet Yoghurt Pasta Soft drink Bread Average Nordic diet Transport End-user transport (50% of members) Food weight/pick-up Packaging HDPE Plastic bag Number of bags/year Cotton bag Number of bags/year | 1.27 kg CO2 eq. 0.5 kg CO2 eq. 0.15 kg CO2 eq. 0.67 kg CO2 eq. 2.1 kg CO2 eq. 5 km/week/person 4.7 kg 1.58 kg CO2 eq. 30,160 bags 271.53 kg CO2 eq. 580 bags | City bus, Diesel E5 Swe, Euro 5 SCR It is assumed that 580 people use one bag/week for one year 580 people use one bag for one year | [59] [60] [61] [62] [31] [64] [65] [65] |
| Soup kitchen | Food emissions Hot dog Pork Potato flour Bread Transport Collecting surplus food Shipment weight Energy Cooking Amount of food/batch Time for heating Nordic electricity mix, g/kWh, in 2009. | 3.4 kg CO2 eq. 0.66 kg CO2 eq. 0.67 kg CO2 eq. 37 km/week 120 kg 20 kg 1 h 130.5 g/kWh | Van, Petrol E5 Swe, Euro 5 E = c × m × ΔT + effect (1500) × heating time “Electricity production and distribution, taking into account net imports/exports” | [66] [67] [62] [63,64] [68] |
| Transport to charity | Food emissions Hot dog Pork Potato flour Bread Cheap carb-rich diet Yoghurt Pasta Soft drink Bread Average Nordic diet Transport Collecting surplus food Shipment weight | 3.4 kg CO2 eq. 0.66 kg CO2 eq. 0.67 kg CO2 eq. 1.27 kg CO2 eq. 0.5 kg CO2 eq. 0.15 kg CO2 eq. 0.67 kg CO2 eq. 2.1 kg CO2 eq. 1500 km/week 550 kg | Van, Petrol E5 Swe, Euro 5 | [66] [67] [62] [59] [60] [61] [62] [31] [63,64] |
| Reprocessing | Food emissions Recipe 1 Apple Water Beetroot 2 Lime (Lemon) 3 Cinnamon (Ginger) 4 Salt Recipe 2 Pepper 3 Apple Water Lime (Lemon) 3 Ginger 4 Chili 5 Turmeric (Ginger) 4 Recipe 3 Orange 3 Satsuma (Lemon) 3 Water Carrot Lemon 3 Ginger 4 Transport Food imports From port in Gothenburg, Sweden, to Stockholm, Sweden From Rome, Italy, to Stockholm Sweden From Sydney, Australia, to the port in Gothenburg, Sweden Transport from Visakhapatnam, India, to the port in Gothenburg, Sweden Transporting glass bottles From Berlin, Germany, to Stockholm, Sweden Collecting surplus food Food weight/pick-up End-user transport (30% of purchasers) Food weight/pick-up Energy Cooking Amount of food/batch Time for heating Nordic electricity mix, g/kWh, in 2009. Packages Glass bottle Number of bottles/year | 0.21 kg CO2 eq. Neglected 0.11 kg CO2 eq. 0.7 kg CO2 eq. 0.88 kg CO2 eq. Neglected 1.1 kg CO2 eq. 0.21 kg CO2 eq. Neglected 0.7 kg CO2 eq. 0.88 kg CO2 eq. 0.66 kg CO2 eq. 0.88 kg CO2 eq. 1 kg CO2 eq. 0.7 kg CO2 eq. Neglected 0.13 kg CO2 eq. 0.7 kg CO2 eq. 0.88 kg CO2 eq. 470 km 2546 km 22,250 km 14,851 km 1083 km 107 km/week 100 kg 5 km/week/person 6 kg 25 kg 0.6 h 130.5 g/kWh CO2, 0.308 kg CH4, 89.4 µg N2O, 0.000869 kg 10,400 bottles | Content in % 6 57.5% 20.5% 20% 1.5% 0.5% Neglected Content in % 7 35% 35% 27% 1.5% 0.5% 0.5% 0.5% Content in % 8 32% 27% 20% 16.5% 1.5% 3% Rigid truck with trailer 28–34 t, Diesel B5 SWE, Euro 4, cargo load factor 80% Rigid truck with trailer 28–34 t, Diesel B5 EU, Euro 4, cargo load factor 80% General cargo ship, dwt 30,000, cargo load factor 80% General cargo ship, dwt 30,000, cargo load factor 80% Rigid truck with trailer 28–34 t, Diesel B5 EU, Euro 4, cargo load factor 80% Van, Petrol E5 Swe, Euro 5 Car, petrol E5 Swe, Euro 4 E = c × m × ΔT + effect (1500) × heating time Electricity production and distribution, taking into account net imports/exports Packaging glass production, white—DE 160 g per bottle, 200 sold bottles/week for one year | [69] [70] [71] [72] [73] [69] [71] [72] [74] [72] [71] [71] [69] [71] [72] [63,64] [63,64] [64,75] [64,75] [63,64] [63,64] [64] [68] [76] |
| Virtual market | Food emissions Pineapple 9 Coffee Milk Mushrooms Beer 10 Transports Food imports From the port in Gothenburg, Sweden, to Stockholm, Sweden From London, UK, to Stockholm, Sweden From Sydney, Australia, to the port in Gothenburg, Sweden Transport from Limon, Costa Rica, to the port in Gothenburg, Sweden End-user transport Food weight/pick-up | 0.28 kg CO2 eq. 2.24 kg CO2 eq. 1.4 kg CO2 eq. 0.06 kg CO2 eq. 0.68 kg CO2 eq. 470 km 1743 km 22,250 km 9445 km 120 km 438 kg | Rigid truck with trailer 28–34 t, Diesel B5 SWE, Euro 4, cargo load factor 80% Rigid truck with trailer 28–34 t, Diesel B5 EU, Euro 4, cargo load factor 80% General cargo ship, dwt 30,000, cargo load factor 80% General cargo ship, dwt 30,000, cargo load factor 80% Van, Petrol E5 Swe, Euro 5 | [77] [78] [59] [74] [79] [63,64] [63,64] [64,75] [64,75] [64] |
1 Food items originate from Sweden with emissions presented from cradle to retail, if not otherwise stated. 2 From cradle to the port in Gothenburg, Sweden. Transport to retail (Stockholm) is added. 3 This food item originates from Italy, from cradle to gate. Transport from the gate (Italy) to retail (Stockholm, Sweden) is added. 4 Food item originates from RoW (the Rest of the World), which is assumed to be India. Transport to retail (Stockholm, Sweden) is added. 5 This food item originates from Australia, from cradle to gate. Transport to retail (Stockholm, Sweden) is added. 6 These numbers are approximated, using a similar recipe from Ica.se as a reference point (ICA 2019b). 7 These numbers are approximated, using a similar recipe from Brämhult as a reference point (Brämhult 2019a). 8 These numbers are approximated, using a similar recipe from Brämhult as a reference point (Brämhult 2019b). 9 Food item originates from Costa Rica. Transport to retail (Stockholm, Sweden) is added. 10 This food item originates from the United Kingdom. Transport to retail (Stockholm, Sweden) is added.
Appendix B
Table A2.
Inventory data used in the Social Life Cycle Assessment (S-LCA), where a full time employment was assumed to equal 40 h/week of work, with the exception of public holidays, and the Swedish minimum vacation time of five weeks.
Table A2.
Inventory data used in the Social Life Cycle Assessment (S-LCA), where a full time employment was assumed to equal 40 h/week of work, with the exception of public holidays, and the Swedish minimum vacation time of five weeks.
| S-LCA | ||||
|---|---|---|---|---|
| Scenario | Process | Amount | Data | Reference |
| Social supermarket | Employees five employees Jobs eight employees Social jobs | 5 × full-time 8 × full-time | On-the-job training | [34] [80] |
| Food bag center | Employees one employee Jobs five employees Social jobs 22 volunteers | 1 × full-time 5 × full-time 14 × 3 h/week 8 × 4 h/week | three employees on-the-job training two employees with salary support for security in employment | [29] [80] [81] |
| Food bag in retail | Employees three employees Jobs 106 volunteers | 3 × full-time 106 × 1.5 h/week | [38] | |
| Soup kitchen | Employees five employees Jobs three employees Social jobs 18 Volunteers | 5 × full-time 1 × full-time 1 × 80 percent of full-time 1 × 50 percent of full-time 15 × 5 h/week 3 × 0.5 h/week | Salary support for security in employment | [32] [81] |
| Transport to charity | Employees one employee Jobs six employees Social jobs | 1 × full-time 900 h/month for all workers | Works within Samhall | [49] |
| Reprocessing | Employees three employees Jobs three employees Social jobs one volunteer | 2 × full-time 1 × 50 percent of full-time 2 × full-time 1 × 50 percent of full-time 12 h/week | “Introduction jobs” | [40] [82] |
| Virtual market | Employees five employees Jobs | 5 × full-time | [41] |
Appendix C
Table A3.
Inventory data used in Life Cycle Costing (LCC).
| LCC | ||||
|---|---|---|---|---|
| Scenario | Process | Amount | Data | Reference |
| Social supermarket | COSTS Premises and indirect costs Employees 11 five employees Jobs eight employees Social jobs Product 1300 Plastic bags/week Transport Fuel and maintenance costs for vehicle REVENUE Government reimbursement Salary support from SPES Product Purchases at store Donations | 110,000 SEK/year 5 × 28,000 SEK/month 8 × 21,000 SEK/month 0.1 SEK/bag 18.5 SEK/10 km 8 × 150 SEK/day 200 SEK/person/month Unknown | Used as carrier for food by end-users 1543 km/week 8 × on-the-job training 1300 members | Assumption. Based on costs for Mikaelsgården’s premises [32] Assumption. Salaries range from 20,000–30,000 SEK for all employees at City Mission Uppsala [29] Assumption Assumption [83] [80] The amount of money spent/month is an assumption Stockholm City Mission receives financial support from private and company donations, as well as the City of Stockholm [34] |
| Food bag center | COSTS Premises and indirect costs Employees one employee Jobs five employees Social jobs 22 volunteers Product 800 Non-woven polypropylene bags/year Transport Fuel and maintenance costs for vehicle REVENUES Government reimbursement Salary support from SPES Product Member fee Donations | 0 SEK 1 × 28,000 SEK/month 5 × 21,000 SEK/month 0 SEK 0 SEK 18.5 SEK/10 km 3 × 150 SEK/day 2 × 19,100 SEK/month 2 × 2800 SEK/month 250 SEK/person/year Unknown | Used as a carrier for food by end-users 170 km/week 3 × on-the-job training 2 × salary support for security in employment 2 × development working skills 400 members | Premise rented for free, all material at location donated [29] Assumption. The salaries range from 20,000–30,000 SEK for all employees at City Mission Uppsala [29] Bags given for free from food stores [29] Assumption [83] [80] Assumption [81] Assumption [81] Uppsala City Mission [30] Uppsala City Mission receives financial support from private and company donations [29] |
| Food bag in retail | COSTS Premises and indirect costs Employees 3 employees Jobs 106 Volunteers Product Cotton bag Transport Fuel and maintenance costs for vehicle REVENUES Government reimbursement Salary support from SPES Product Member fee Donations | 5000 SEK 3 × 19,000 SEK/month 0 SEK 39 SEK/bag 0 SEK 3 × 19,100 SEK/month 1000 SEK/person/year Unknown | one bag per member Salary support for security in employment 580 members | Assumption [38] Assumption [84] Volunteers use own means of transportation to and from stores [38] Assumption. SPES (2019a) “The organization receives salary support from the government” [38] Receives private and company donations [38] |
| Soup kitchen | COSTS Premises and indirect costs Employees five employees Jobs three employees Social jobs 18 Volunteers Transport Fuel and maintenance costs for vehicle REVENUES Government reimbursement Salary support from SPES Support from Uppsala Municipality Donations | 110,000 SEK/year 5 × 28,000 SEK/month 1 × 21,000 SEK/month 1 × 16,800 SEK/month 1 × 10,500 SEK/month 0 SEK 18.5 SEK/10 km 1 × 19,100 SEK/month 1 × 15,280 SEK/month 1 × 9550 SEK/month 1 × 2800 SEK/month 1 × 2240 SEK/month 1 × 1400 SEK/month 2 million SEK/year Unknown | −1 full-time employee −1 employee works 80 percent −1 employee works 50 percent 37 km/week 3 × Salary support for security in employment 3 × Development working skills | [32] Assumption. The salaries range from 20,000–30,000 SEK for all employees at City Mission Uppsala [29] Assumption. The salaries range from 20,000–30,000 SEK for all employees at City Mission Uppsala [29] Assumption [83] Assumption [81] Assumption [81] [32] Receives private and company donations [32] |
| Transport to charity | COSTS Premises and indirect costs Employees one employee Jobs six employees Social jobs Transport Fuel and maintenance costs for vehicle REVENUES Product Service fee | 5000 SEK/month 1 × 25,000 SEK/month 120 SEK/hour 18.5 SEK/10 km 2.88 SEK/kg collected surplus food | 900 h/month 1500 km/week 19,230 kg/week | Assumption. The company does not use any premises but has indirect costs, e.g., administration [49] [49] [49,85] Assumption [83] [49] |
| Reprocessing | COSTS Premises/indirect costs Employees three employees Jobs three employees Social jobs one volunteer Product Glass bottle Transport Fuel and maintenance costs for vehicle REVENUES Government reimbursement Salary support from SPES Vinnova financial support Product Purchases of smoothie | 5000 SEK 2 × 23,200 SEK/month 1 × 11,600 SEK/month 2 × 17,500 SEK/month 1 × 8750 SEK/month 0 SEK 2.45 SEK/bottle 18.5 SEK/10 km 2 × 20,000 SEK/month 1 × 10,000 SEK/month 300,000 SEK 29 SEK/smoothie | −2 full-time employees −1 employee works 50 percent −2 full-time employees −1 employee works 50 percent 200 bottles/week 107 km/week “Introduction job” One-time payment 200 bottles/week | Assumption. Assumption. “All salaries are based on market salaries” [40] SCB [86] Assumption. SCB [87] Assumption Assumption [83] [82] [88] [40] |
| Virtual market | COSTS Premises and indirect costs Employees five employees Jobs REVENUES Product Service fee | 0 SEK 12,500 SEK/person 8.5 SEK/kg collected surplus food | 1346 kg/week | [41] Assumption. “Our employees receive between 0–150,000 SEK/year in salary” [41] Assumption. Prices from Sysav used as reference point to estimate service fee [89]. These prices range from 0.3–1.1 SEK per kg food [90], 10 times the average was assumed in this study. |
11 General payroll tax, 31.42% (STA 2019), and holiday pay according to the percentage rule, 12% (SFS 1977:480), are included for all employees.
References
- UN Goal 12: Sustainable Development Knowledge Platform. Available online: https://sustainabledevelopment.un.org/sdg12 (accessed on 25 May 2019).
- EC Directive 2008/98/EC on Waste (Waste Framework Directive) -Environment -European Commission. Available online: http://ec.europa.eu/environment/waste/framework/ (accessed on 19 April 2019).
- O’Connor, C.; Gheoldus, M.; Jan, O. Comparative Study on EU member States’ Legislation and Practices on Food Donation -Final Report; Bio by Deloitte, European and Economic Social Committee (EESC): Bruxelles, Belgium, 2014. [Google Scholar]
- Swedish National Food Agency. Fler Gör Mer! Handlingsplan för Minskat Matsvinn 2030; Swedish National Food Agency: Uppsala, Sweden, 2018; p. 38. [Google Scholar]
- Strid, I. Policy Brief: Matsvinn -Hur Ska Sverige Minska Det? SLU FUTURE FOOD: Uppsala, Sweden,, 2019. [Google Scholar]
- Karlsson, J.O.; Röös, E. Resource-efficient use of land and animals—Environmental impacts of food systems based on organic cropping and avoided food-feed competition. Land Use Policy 2019, 85, 63–72. [Google Scholar] [CrossRef]
- Ellen MacArthur Foundation; SUN; McKinsey Center for Business and Environment. Growth within: A Circular Economy Vision for a Competitive Europe; Ellen MacArthur Foundation: Cowes, UK, 2015. [Google Scholar]
- European Commission. Closing the loop -An EU action plan for the Circular Economy; European Commission: Brussels, Belgium, 2015. [Google Scholar]
- Principato, L.; Ruini, L.; Guidi, M.; Secondi, L. Adopting the circular economy approach on food loss and waste: The case of Italian pasta production. Resour. Conserv. Recycl. 2019, 144, 82–89. [Google Scholar] [CrossRef]
- SEPA. Matavfall i Sverige. Uppkomst och Behandling 2016; Swedish Environmental Protection Agency: Stockholm, Sweden, 2018. [Google Scholar]
- Schneider, F. The evolution of food donation with respect to waste prevention. Waste Manag. 2013, 33, 755–763. [Google Scholar] [CrossRef]
- Hanssen, O.J.; Ekegren, P.; Gram-Hanssen, I.; Korpela, P.; Langevad-Clifforth, N.; Skov-Olsen, K.; Silvennoinen, K.; Stare, M.; Stenmarck, Å.; Svanes, E. Food Redistribution in the Nordic Region. Experiences and Results from a Pilot Study; Nordic Council of Ministers: Copenhagen, Denmark, 2014. [Google Scholar]
- City Mission Stockholm Matsvinn Som Kommer Till Nytta | Stockholms Stadsmission. Available online: https://www.stadsmissionen.se/vad-vi-gor/matsvinn-som-kommer-till-nytta (accessed on 19 June 2019).
- ResQ Club ResQ Club–Inga Måltider till Spillo. Available online: https://www.resq-club.com/sv/ (accessed on 18 April 2019).
- Midgley, J.L. The logics of surplus food redistribution. J. Environ. Plan. Manag. 2014, 57, 1872–1892. [Google Scholar] [CrossRef]
- Van der Horst, H.; Pascucci, S.; Bol, W. The “dark side” of food banks? Exploring emotional responses of food bank receivers in the Netherlands. Br. Food J. 2014, 116, 1506–1520. [Google Scholar] [CrossRef]
- Laurent, A.; Bakas, I.; Clavreul, J.; Bernstad, A.; Niero, M.; Gentil, E.; Hauschild, M.Z.; Christensen, T.H. Review of LCA studies of solid waste management systems–Part I: Lessons learned and perspectives. Waste Manag. 2014, 34, 573–588. [Google Scholar] [CrossRef] [PubMed]
- Eriksson, M.; Spångberg, J. Carbon footprint and energy use of food waste management options for fresh fruit and vegetables from supermarkets. Waste Manag. 2017, 60, 786–799. [Google Scholar] [CrossRef] [PubMed]
- Hellweg, S.; Canals, L.M. Emerging approaches, challenges and opportunities in life cycle assessment. Science 2014, 344, 1109–1113. [Google Scholar] [CrossRef] [PubMed]
- Gram-Hanssen, I.; Hanssen, O.J.; Hultén, J.; Silvennoinen, K.; Werge, M.; Stenmarck, Å.; Aare, A.K. Food Redistribution in the Nordic Region: Phase II: Identification of Best Practice Models for Enhanced Food Redistribution; TemaNord; Nordic Council of Ministers: Copenhagen, Denmark, 2016; ISBN 978-92-893-4447-0. [Google Scholar]
- International Organization for Standardization. Environmental Management -Life Cycle Assessment -Principles and Framework; ISO 14040:2006; International Organization for Standardization: Geneva, Switzerland, 2006. [Google Scholar]
- International Organization for Standardization. Environmental Management -Life Cycle Assessment -Requirements and Guidelines; ISO 14044:2006; International Organization for Standardization: Geneva, Switzerland, 2006. [Google Scholar]
- Malefors, C.; Callewaert, P.; Hansson, P.-A.; Hartikainen, H.; Pietiläinen, O.; Strid, I.; Strotmann, C.; Eriksson, M. Towards a Baseline for Food-Waste Quantification in the Hospitality Sector—Quantities and Data Processing Criteria. Sustainability 2019, 11, 3541. [Google Scholar] [CrossRef] [Green Version]
- Eriksson, M.; Strid, I.; Hansson, P.-A. Food waste reduction in supermarkets–Net costs and benefits of reduced storage temperature. Resour. Conserv. Recycl. 2016, 107, 73–81. [Google Scholar] [CrossRef]
- Eriksson, M.; Strid, I.; Hansson, P.-A. Waste of organic and conventional meat and dairy products—A case study from Swedish retail. Resour. Conserv. Recycl. 2014, 83, 44–52. [Google Scholar] [CrossRef]
- Eriksson, M.; Strid, I.; Hansson, P.-A. Food losses in six Swedish retail stores: Wastage of fruit and vegetables in relation to quantities delivered. Resour. Conserv. Recycl. 2012, 68, 14–20. [Google Scholar] [CrossRef]
- Climate Change 2014: Synthesis Report. IPCC, Mayer, L., Intergovernmental Panel on Climate Change, Eds.; Intergovernmental Panel on Climate Change: Geneva, Switzerland, 2015; ISBN 978-92-9169-143-2.
- Röös, E.; Sundberg, C.; Tidåker, P.; Strid, I.; Hansson, P.-A. Can carbon footprint serve as an indicator of the environmental impact of meat production? Ecol. Indic. 2013, 24, 573–581. [Google Scholar] [CrossRef]
- Benoît-Norris, C.; Traverso, M.; Valdivia, S.; Vickery-Niederman, G.; Franze, J.; Azuero, L.; Ciroth, A.; Mazijn, B.; Aulisio, D. The Methodological Sheets for Sub-Categories in Social Life Cycle Assessment (S-LCA); UNEP: Paris, France, 2013. [Google Scholar]
- Maslow, A.H. A theory of human motivation. Psychol. Rev. 1943, 50, 370–396. [Google Scholar] [CrossRef] [Green Version]
- Reiling, H.T. Federal Taxation: What Is a Charitable Organization? Am. Assoc. J. 1958, 44, 525–598. [Google Scholar]
- Wahlby, J.; City Mission Uppsala Matcentralen, Uppsala, Sweden. Personal Communication, 2019.
- City Mission Uppsala Stadsmissionens Matkasse. Uppsala Stadsmission. Available online: https://uppsalastadsmission.se/verksamheter/matcentralen/stadsmissionens-matkasse/ (accessed on 8 March 2020).
- Saxe, H.; Larsen, T.M.; Mogensen, L. The global warming potential of two healthy Nordic diets compared with the average Danish diet. Clim. Chang. 2013, 116, 249–262. [Google Scholar] [CrossRef]
- Skantz, E.; City Mission Uppsala Mikaelsgården, Uppsala, Sweden. Personal Comminucation, 2019.
- Hjalmarsson, C. 36 Dagar På Gatan; Swedens Television: Stockholm, Sweden, 2018. [Google Scholar]
- Larsson, T.; Stockholm City Mission, Stockholm, Sweden. Personal Communication, 2019.
- City Mission Stockholm Matmissionen -Social Supermarket | Stockholms Stadsmission. Available online: https://www.stadsmissionen.se/vad-vi-gor/matmissionen (accessed on 7 October 2019).
- Food2change Statistik över Sverige Som Stoppar Matsvinnet Som är Svinnbra! | Food 2 Change. Available online: https://food2change.kollx.se/statistics/public (accessed on 19 June 2019).
- Food2change Medlemshandbok; 2017. Available online: https://www.food2change.se/uploads/5/0/3/3/50335987/medlemshandbok_f%C3%B6rsta_utg%C3%A5va.pdf (accessed on 8 March 2020).
- Asplund, E.; Food2Change, Västerås, Sweden. Personal Communication, 2019.
- ReFood Vårt Mål & Vision. Available online: https://www.refood.nu/ (accessed on 18 September 2019).
- Wictorson, H.; ReFood, Stockholm, Sweden. Personal Communication, 2019.
- Aronsen Beis, E.; Foodloopz, Solna, Sweden. Personal Communication, 2019.
- Foodloopz, OM. Available online: https://www.foodloopz.se/om (accessed on 19 June 2019).
- Allwin Allwin Tar Hand Om Sveriges Matsvinn. Available online: https://www.allwin.nu/ (accessed on 7 October 2019).
- Allwin Allwin Skriver Avtal Med LIDL Om 11 Butiker i Göteborg—Matsvinn Allwin. Available online: http://www.allwin.nu/nyheter/http://www.allwin.nu/2017/2/21/new-post-title-1 (accessed on 22 April 2019).
- Allwin LIDL Ansluter 11 Butiker i Malmö—Matsvinn Allwin. Available online: http://www.allwin.nu/nyheter/http://www.allwin.nu/2017/2/21/new-post-title-4 (accessed on 22 April 2019).
- Allwin LIDL Ansluterytterligare 36 Butiker i Stockholm—Matsvinn Allwin. Available online: http://www.allwin.nu/nyheter/http://www.allwin.nu/2017/2/21/new-post-title-2 (accessed on 22 April 2019).
- Coop Allwin och Coop Inleder Samarbete: Coop Skänker Mat Till Behövande | Coop Pressrum. Available online: https://pressrum.coop.se/allwin-och-coop-inleder-samarbete-coop-skanker-mat-till-behovande/ (accessed on 22 April 2019).
- Allwin Tjänst. Available online: https://www.allwin.nu/tjanst (accessed on 7 October 2019).
- Eisner, S.; Allwin, Gothenburg, Sweden. Personal Communication, 2019.
- Samhall Samhall–Sveriges Viktigaste Företag; Samhall: 2019. Available online: https://samhall.se/om-samhall/ (accessed on 9 March 2020).
- Holmer, B.; Swedish Church, Gothenburg, Sweden. Personal Communication, 2019.
- SCB Vanligast för Barn att bo i Småhus. Available online: http://www.scb.se/hitta-statistik/statistik-efter-amne/hushallens-ekonomi/inkomster-och-inkomstfordelning/hushallens-boende/pong/statistiknyhet/hushallens-boende/ (accessed on 15 October 2019).
- Eriksson, M.; Ghosh, R.; Mattsson, L.; Ismatov, A. Take-back agreements in the perspective of food waste generation at the supplier-retailer interface. Resour. Conserv. Recycl. 2017, 122, 83–93. [Google Scholar] [CrossRef]
- UN Goal 1: Sustainable Development Knowledge Platform. Available online: https://sustainabledevelopment.un.org/sdg1 (accessed on 29 October 2019).
- Swedish National Food Agency. Riksmaten -Vuxna 2010-11. Vad äter Svenskarna? Livsmedels- och Näringsintag Bland Vuxna i Sverige; Swedish National Food Agency: Uppsala, Sweden, 2012. [Google Scholar]
- Flysjö, A.; Aarhus Universitet; Faculty of Science and Technology. Greenhouse Gas Emissions in Milk and Dairy Product Chains: Improving the Carbon Footprint of Dairy Products; Aarhus University, Department of Agroecology: Tjele, Denmark, 2012; ISBN 978-87-92869-25-8. [Google Scholar]
- Röös, E.; Sundberg, C.; Hansson, P.-A. Uncertainties in the carbon footprint of refined wheat products: A case study on Swedish pasta. Int. J. Life Cycle Assess. 2011, 16, 338–350. [Google Scholar] [CrossRef]
- Amienyo, D.; Gujba, H.; Stichnothe, H.; Azapagic, A. Life cycle environmental impacts of carbonated soft drinks. Int. J. Life Cycle Assess. 2013, 18, 77–92. [Google Scholar] [CrossRef]
- Angervall, T.; Sonesson, U. Förenklad Metod för Klimat-/GWP-Beräkningar av Livsmedel. Slutrapport, Version 1; SIK -Institutet för Livsmedel och Bioteknik: Göteborg, Sweden, 2011. [Google Scholar]
- Google Google Maps. Available online: https://www.google.com/maps (accessed on 18 September 2019).
- NTM NTMcalc Advanced 4.0. Available online: https://www.transportmeasures.org/en/ (accessed on 18 March 2019).
- Environment Agency. Life Cycle Assessment of Supermarket Carrierbags: A Review of the Bags Available in 2006; Environment Agency: Bristol, UK, 2011; ISBN 978-1-84911-226-0. [Google Scholar]
- Cederberg, C.; Sonesson, U.; Henriksson, M.; Sund, V.; Davis, J. Greenhouse Gas Emissions from Swedish Production of Meat, Milk and Eggs 1990 and 2005; SIK -Institutet för livsmedel och bioteknik: Göteborg, Sweden, 2009; ISBN 978-91-7290-284-8. [Google Scholar]
- Usva, K.; Saarinen, M.; Katajajuuri, J.-M. Supply chain integrated LCA approach to assess environmental impacts of food production in Finland. Agric. Food Sci. 2009, 18, 460–476. [Google Scholar] [CrossRef]
- IVL Swedish Environmental Research Institute. Emissionsfaktor för Nordisk Elproduktionsmix; IVL Swedish Environmental Research Institute: Stockholm, Sweden, 2012. [Google Scholar]
- Davis, J. Emissions of Greenhouse Gases from Production of Horticultural Products: Analysis of 17 Products Cultivated in Sweden; SIK -Institutet för livsmedel och bioteknik: Göteborg, Sweden, 2011; ISBN 978-91-7290-301-2. [Google Scholar]
- González, A.D.; Frostell, B.; Carlsson-Kanyama, A. Protein efficiency per unit energy and per unit greenhouse gas emissions: Potential contribution of diet choices to climate change mitigation. Food Policy 2011, 36, 562–570. [Google Scholar] [CrossRef]
- Beccali, M.; Cellura, M.; Iudicello, M.; Mistretta, M. Life cycle assessment of Italian citrus-based products. Sensitivity analysis and improvement scenarios. J. Environ. Manag. 2010, 91, 1415–1428. [Google Scholar] [CrossRef] [PubMed]
- Audsley, E.; Brander, M.; Chatterton, J.C.; Murphy-Bokern, D.; Webster, C.; Williams, A.G. How Low can We Go? An Assessment of Greenhouse Gas Emissions from the UK Food System and the Scope Reduction by 2050. Report for the WWF and Food Climate Research Network. 2010. Available online: https://dspace.lib.cranfield.ac.uk/handle/1826/6503 (accessed on 7 March 2020).
- Cellura, M.; Longo, S.; Mistretta, M. Life Cycle Assessment (LCA) of protected crops: An Italian case study. J. Clean. Prod. 2012, 28, 56–62. [Google Scholar] [CrossRef]
- Maraseni, T.N.; Cockfield, G.; Maroulis, J.; Chen, G. An assessment of greenhouse gas emissions from the Australian vegetables industry. J. Environ. Sci. Health Part B 2010, 45, 578–588. [Google Scholar] [CrossRef]
- Sea-Distances.org Distances. Available online: https://sea-distances.org/ (accessed on 25 May 2019).
- Ecoinvent. Ecoinvent Version 3.5; 2018; Available online: https://www.ecoinvent.org/ (accessed on 8 March 2020).
- Ingwersen, W.W. Life cycle assessment of fresh pineapple from Costa Rica. J. Clean. Prod. 2012, 35, 152–163. [Google Scholar] [CrossRef]
- Bernard, K.; Rivera, J.; Soto, M.; Navichoc, D. Carbon Footprint across the Coffee Supply Chain: The Case of Costa Rican Coffee. J. Agric. Sci. Technol. 2013, 3, 151–175. [Google Scholar]
- Amienyo, D.; Azapagic, A. Life cycle environmental impacts and costs of beer production and consumption in the UK. Int. J. Life Cycle Assess. 2016, 21, 492–509. [Google Scholar] [CrossRef] [Green Version]
- SPES Erbjud Arbetsträning på din Arbetsplats. Available online: https://www.arbetsformedlingen.se/For-arbetsgivare/Anstall-med-stod/Arbetstraning.html (accessed on 18 September 2019).
- SPES Lönebidrag. Available online: https://www.arbetsformedlingen.se/For-arbetsgivare/Anstall-med-stod/Vara-anstallningsstod/Lonebidrag.html (accessed on 18 September 2019).
- SPES Introduktionsjobb–få Ditt Företag att Växa och gör Skillnad. Available online: https://www.arbetsformedlingen.se/For-arbetsgivare/Anstall-med-stod/Vara-anstallningsstod/Introduktionsjobb.html (accessed on 18 September 2019).
- The Swedish Tax Agency Traktamente och Bilersättningar. Från Och Med Inkomståret. 2018. Available online: https://www.skatteverket.se/download/18.b1014b415f3321c0de4eff/1512649453779/traktamente-och-bilersattningar-skv315-6-utgava08.pdf (accessed on 20 April 2019).
- Medtryck Kassar av Fairtrade-Certifierad, Ekologisk Bomull Med Reklamtryck. Available online: https://medtryck.com/bomullspasar/ekologisk-tygpase-fairtrade (accessed on 15 May 2019).
- LO Kollektivavtal Samhall 2017–2020. 2017. Available online: https://www.fastighets.se/siteassets/avtal-2017/samhall_2017-2020.pdf (accessed on 8 March 2020).
- SCB Lönesök–Hur mycket tjänar...? Available online: http://www.scb.se/hitta-statistik/sverige-i-siffror/lonesok/ (accessed on 18 September 2019).
- SCB Total Income from Employment and Business. 2017. Available online: http://www.scb.se/en/finding-statistics/statistics-by-subject-area/household-finances/income-and-income-distribution/income-and-tax-statistics/pong/tables-and-graphs/income--persons-the-entire-country/total-income-from-employment-and-business-2017--by-country-of-birth/ (accessed on 18 September 2019).
- Vinnova ReFood -Integration Genom Arbete | Vinnova. Available online: https://www.vinnova.se/p/refood---integration-genom-arbete/ (accessed on 15 May 2019).
- Foodloopz Så Funkar Det. Available online: https://www.foodloopz.se/sa-funkar-det (accessed on 19 June 2019).
- Sysav Priser | Sysav–Tar H+and Om och Återvinner Avfall. Available online: https://www.sysav.se/foretag/priser/ (accessed on 18 September 2019).
Figure 1.
Diagram illustrating the flow of surplus food from source (producer or retail store) through the seven scenarios (based on information from the 21 redistribution units identified), which act as an interface to different end-users who live in different economic conditions. The dashed lines for two of the scenarios indicate that food does not go through the redistribution unit physically; rather, the unit provides knowledge of where surplus food is located.

Figure 2.
Diagram of the system studied, which included seven different scenarios, their respective product/s and the end-users’ substituted food/product in the system expansion.
Figure 2.
Diagram of the system studied, which included seven different scenarios, their respective product/s and the end-users’ substituted food/product in the system expansion.

Figure 3.
Greenhouse gas (GHG) emissions from the different processes included in the seven scenarios.
Figure 3.
Greenhouse gas (GHG) emissions from the different processes included in the seven scenarios.

Figure 4.
GHG emissions per kg food from the process Substituted product in each of the seven scenarios.
Figure 4.
GHG emissions per kg food from the process Substituted product in each of the seven scenarios.

Figure 5.
Distribution of costs (negative values) and revenues (positive values) for individual processes included in the seven scenarios, including total net value.
Figure 5.
Distribution of costs (negative values) and revenues (positive values) for individual processes included in the seven scenarios, including total net value.

Figure 6.
Monthly net value per 1 kg of redistributed surplus food in the seven scenarios.

Figure 7.
Number of end-users per kg redistributed surplus food in the seven scenarios. The Level of impact for inventory indicator (see Table 1) is represented by different shades of green/white, where white = 1 (sufficient income), medium green = 6 (low income) and dark green = 10 (exposed person).

Figure 8.
Number of working hours per functional unit in the seven scenarios. The Level of impact for inventory indicator (see Table 1) is represented by different shades of green/white, where white = 1 (volunteers), light green = 2 (jobs) and medium green = 3 (social jobs).
Figure 8.
Number of working hours per functional unit in the seven scenarios. The Level of impact for inventory indicator (see Table 1) is represented by different shades of green/white, where white = 1 (volunteers), light green = 2 (jobs) and medium green = 3 (social jobs).

Table 1.
Outline of chosen stakeholder categories, impact categories, subcategories, inventory indicators.
Table 1.
Outline of chosen stakeholder categories, impact categories, subcategories, inventory indicators.
| Impact Categories | Stakeholder Categories | Sub-Categories | Inventory Indicators | ||
|---|---|---|---|---|---|
| Job market value | Workers | Work opportunities | Number of volunteers | ||
| Number of jobs | |||||
| Number of social jobs | |||||
| Product value | End-users | Food opportunities | Sufficient income 1 | kg of redistributed food | Number of people reached |
| Low income 2 | kg of redistributed food | Number of people reached | |||
| Exposed | kg of redistributed food | Number of people reached | |||
1 People with sufficient income are those with income higher than 13,000 Swedish kronor (SEK) (1383.02 US dollars) per month. This limit was chosen because a condition for becoming a member is to have an income lower than 9290 SEK per month for the initiatives Matmissionen and Matkassen, or 13,000 SEK per month for Food2change. 2 Lower than 13,000 SEK per month.
Table 2.
The 18 surplus food redistribution units identified in Sweden, the different types of end-users of these units and measures employed by the units marked with an X.
Table 2.
The 18 surplus food redistribution units identified in Sweden, the different types of end-users of these units and measures employed by the units marked with an X.
| Redistribution Unit | End-User | Measures | |||||||
|---|---|---|---|---|---|---|---|---|---|
| Purchaser | Members | Companies | Charity Organization | Virtual Market Place | Reprocessing | Food Store | Transport | Grocery Bags | |
| Allemansrätten | X | X | |||||||
| Allwin | X | X | |||||||
| Brödöl | X | X | |||||||
| Food2change | X | X | |||||||
| Foodloopz | X | X | |||||||
| Karma | X | X | |||||||
| Matakuten | X | X | |||||||
| Matsmart | X | X | X | ||||||
| ReFood | X | X | |||||||
| Rescued | X | X | |||||||
| ResQClub | X | X | |||||||
| ReTaste | X | X | |||||||
| Rude Food | X | X | |||||||
| Sopköket | X | X | |||||||
| Spill | X | X | |||||||
| The Salvation Army | X | X | |||||||
| The Swedish Church | X | X | |||||||
| Swedish organization of City Missions | |||||||||
| Matkassen | X | X | |||||||
| Mikaelsgården | X | X | |||||||
| Matmissionen | X | X | X | ||||||
Table 3.
Processes and emissions (kg CO2 eq./FU) for the different scenarios.
| Processes | Reprocessing | Virtual Market | Social Supermarket | Food Bag in Retail | Food Bag Center | Soup Kitchen | Transport to Charity |
|---|---|---|---|---|---|---|---|
| Transport food from retail/producer | 0.06 | - | 0.004 | - | 0.014 | 0.01 | 0.016 |
| Energy for cooking | 0.005 | - | 0.014 | - | |||
| Packaging | 0.11 | - | 0.24 | 0.89 | 0.14 | - | - |
| End-user transport | 0.13 | 0.001 | 0.05 | 0.03 | 0.03 | - | - |
| Substituted product | −0.45 | −0.8 | −1.04 | −1.04 | −1.04 | −0.16 | −0.86 |
| Substituted energy for cooking | −0.005 | - | - | - | - | - | - |
| Substituted packaging | −0.11 | - | −0.24 | −0.27 | −0.27 | - | - |
| Substituted end-user transport | −0.13 | −0.001 | −0.05 | −0.03 | −0.03 | - | - |
| Net result | −0.4 | −0.8 | −1 | −0.4 | −1.2 | −0.2 | −0.8 |
Table 4.
Costs and revenues (kSEK per month) deriving from processes included in the seven scenarios.
Table 4.
Costs and revenues (kSEK per month) deriving from processes included in the seven scenarios.
| Processes | Reprocessing | Virtual Market | Social Supermarket | Food Bag in Retail | Food Bag Center | Soup Kitchen | Transport to Charity |
|---|---|---|---|---|---|---|---|
| Government reimbursement | 83 | - | 36 | 57 | 57 | 217 | - |
| Product/Service | 23 | 46 | 260 | 48 | 8 | - | 222 |
| Premises/Indirect costs | −5 | - | −9 | −5 | - | −9 | −5 |
| Product costs | −2 | - | −0.5 | −2 | - | - | - |
| Employees | −145 | −90 | −351 | −81 | −191 | −270 | −191 |
| Transport | −4 | 0 | −1 | 0 | −1 | −0.3 | −11 |
| Net value | −50 | −44 | −66 | 17 | −127 | −62 | 15 |
Table 5.
Inventory indicators/processes for the different scenarios. The numbers refer to weekly redistributed surplus food.
Table 5.
Inventory indicators/processes for the different scenarios. The numbers refer to weekly redistributed surplus food.
| Processes | Reprocessing | Virtual Market | Social Supermarket | Food Bag in Retail | Food Bag Center | Soup Kitchen | Transport to Charity |
|---|---|---|---|---|---|---|---|
| Number of volunteers | 1 | 0 | 0 | 106 | 22 | 18 | 0 |
| Number of jobs | 3 | 5 | 5 | 3 | 1 | 5 | 1 |
| Number of social jobs | 3 | - | 8 | - | 5 | 3 | 6 |
| Number of people with sufficient income | 200 | 2700 | - | - | - | - | - |
| Number of people with low income | 2860 | 1270 | 880 | 7690 | |||
| Number of exposed people | 400 | 30,770 | |||||
| kg of redistributed food to target group | 150 | 1350 | 7500 | 2740 | 2000 | 780 | 19,230 |
© 2020 by the authors. Licensee MDPI, Basel, Switzerland. This article is an open access article distributed under the terms and conditions of the Creative Commons Attribution (CC BY) license (http://creativecommons.org/licenses/by/4.0/).
Share and Cite
MDPI and ACS Style
Bergström, P.; Malefors, C.; Strid, I.; Hanssen, O.J.; Eriksson, M. Sustainability Assessment of Food Redistribution Initiatives in Sweden. Resources 2020, 9, 27. https://0-doi-org.brum.beds.ac.uk/10.3390/resources9030027
AMA Style
Bergström P, Malefors C, Strid I, Hanssen OJ, Eriksson M. Sustainability Assessment of Food Redistribution Initiatives in Sweden. Resources. 2020; 9(3):27. https://0-doi-org.brum.beds.ac.uk/10.3390/resources9030027
Chicago/Turabian StyleBergström, Pauline, Christopher Malefors, Ingrid Strid, Ole Jørgen Hanssen, and Mattias Eriksson. 2020. "Sustainability Assessment of Food Redistribution Initiatives in Sweden" Resources 9, no. 3: 27. https://0-doi-org.brum.beds.ac.uk/10.3390/resources9030027
Note that from the first issue of 2016, this journal uses article numbers instead of page numbers. See further details here.