The Role of Hydrocarbons in the Global Energy Agenda: The Focus on Liquefied Natural Gas


Doctor of Engineering, Academic Supervisor of Research Center “The Arctic”, Saint Petersburg Mining University, Saint Petersburg 199106, Russia
Resources 2020, 9(5), 59; https://0-doi-org.brum.beds.ac.uk/10.3390/resources9050059
Submission received: 17 April 2020
/
Revised: 16 May 2020
/
Accepted: 19 May 2020
/
Published: 21 May 2020
(This article belongs to the Special Issue Resource Provision of the Sustainable Development under Global Shocks)
Abstract
:Presently, there is a paradoxical situation in the global energy market related to a gap between the image of hydrocarbon resources (HCR) and their real value for the economy. On the one hand, we face an increase in expected HCR production and consumption volumes, both in the short and long term. On the other hand, we see the formation of the image of HCR and associated technologies as an unacceptable option, without enough attention to the differences in fuels and the ways of their usage. Due to this, it seems necessary to take a step back to review the vitality of such a political line. This article highlights an alternative point of view with regard to energy development prospects. The purpose of this article is to analyse the consistency of criticism towards HCR based on exploration of scientific literature, analytical documents of international corporations and energy companies as well as critical assessment of technologies offered for the HCR substitution. The analysis showed that: (1) it is impossible to substitute the majority of HCR with alternative power resources in the near term, (2) it is essential that the criticism of energy companies with regard to their responsibility for climate change should lead not to destruction of the industry but to the search of sustainable means for its development, (3) the strategic benchmarks of oil and coal industries should shift towards chemical production, but their significance should not be downgraded for the energy sector, (4) liquified natural gas (LNG) is an independent industry with the highest expansion potential in global markets in the coming years as compared to alternative energy options, and (5) Russia possesses a huge potential for the development of the gas industry, and particularly LNG, that will be unlocked if timely measures on higher efficiency of the state regulation system are implemented.
1. Introduction
Recent decades have demonstrated an intensive development of theories, concepts and approaches related to various aspects of sustainable development such as circular economy [1], waste management [2], cleaner production [3], environmental economics [4], etc. Within these approaches, a special place is occupied by the fight against global warming, which is caused by human activities, namely by higher emissions of man-made greenhouse gases, mainly CO2 [5].
As a result of multiple environmental studies carried out in relation to the above concepts, it has been found that the energy sector is one of the main sources of greenhouse gas emissions among all types of human activity [6]. This fact has become one of the main reasons for combatting the already existing energy system [7], which is founded on hydrocarbon resources (HCR).
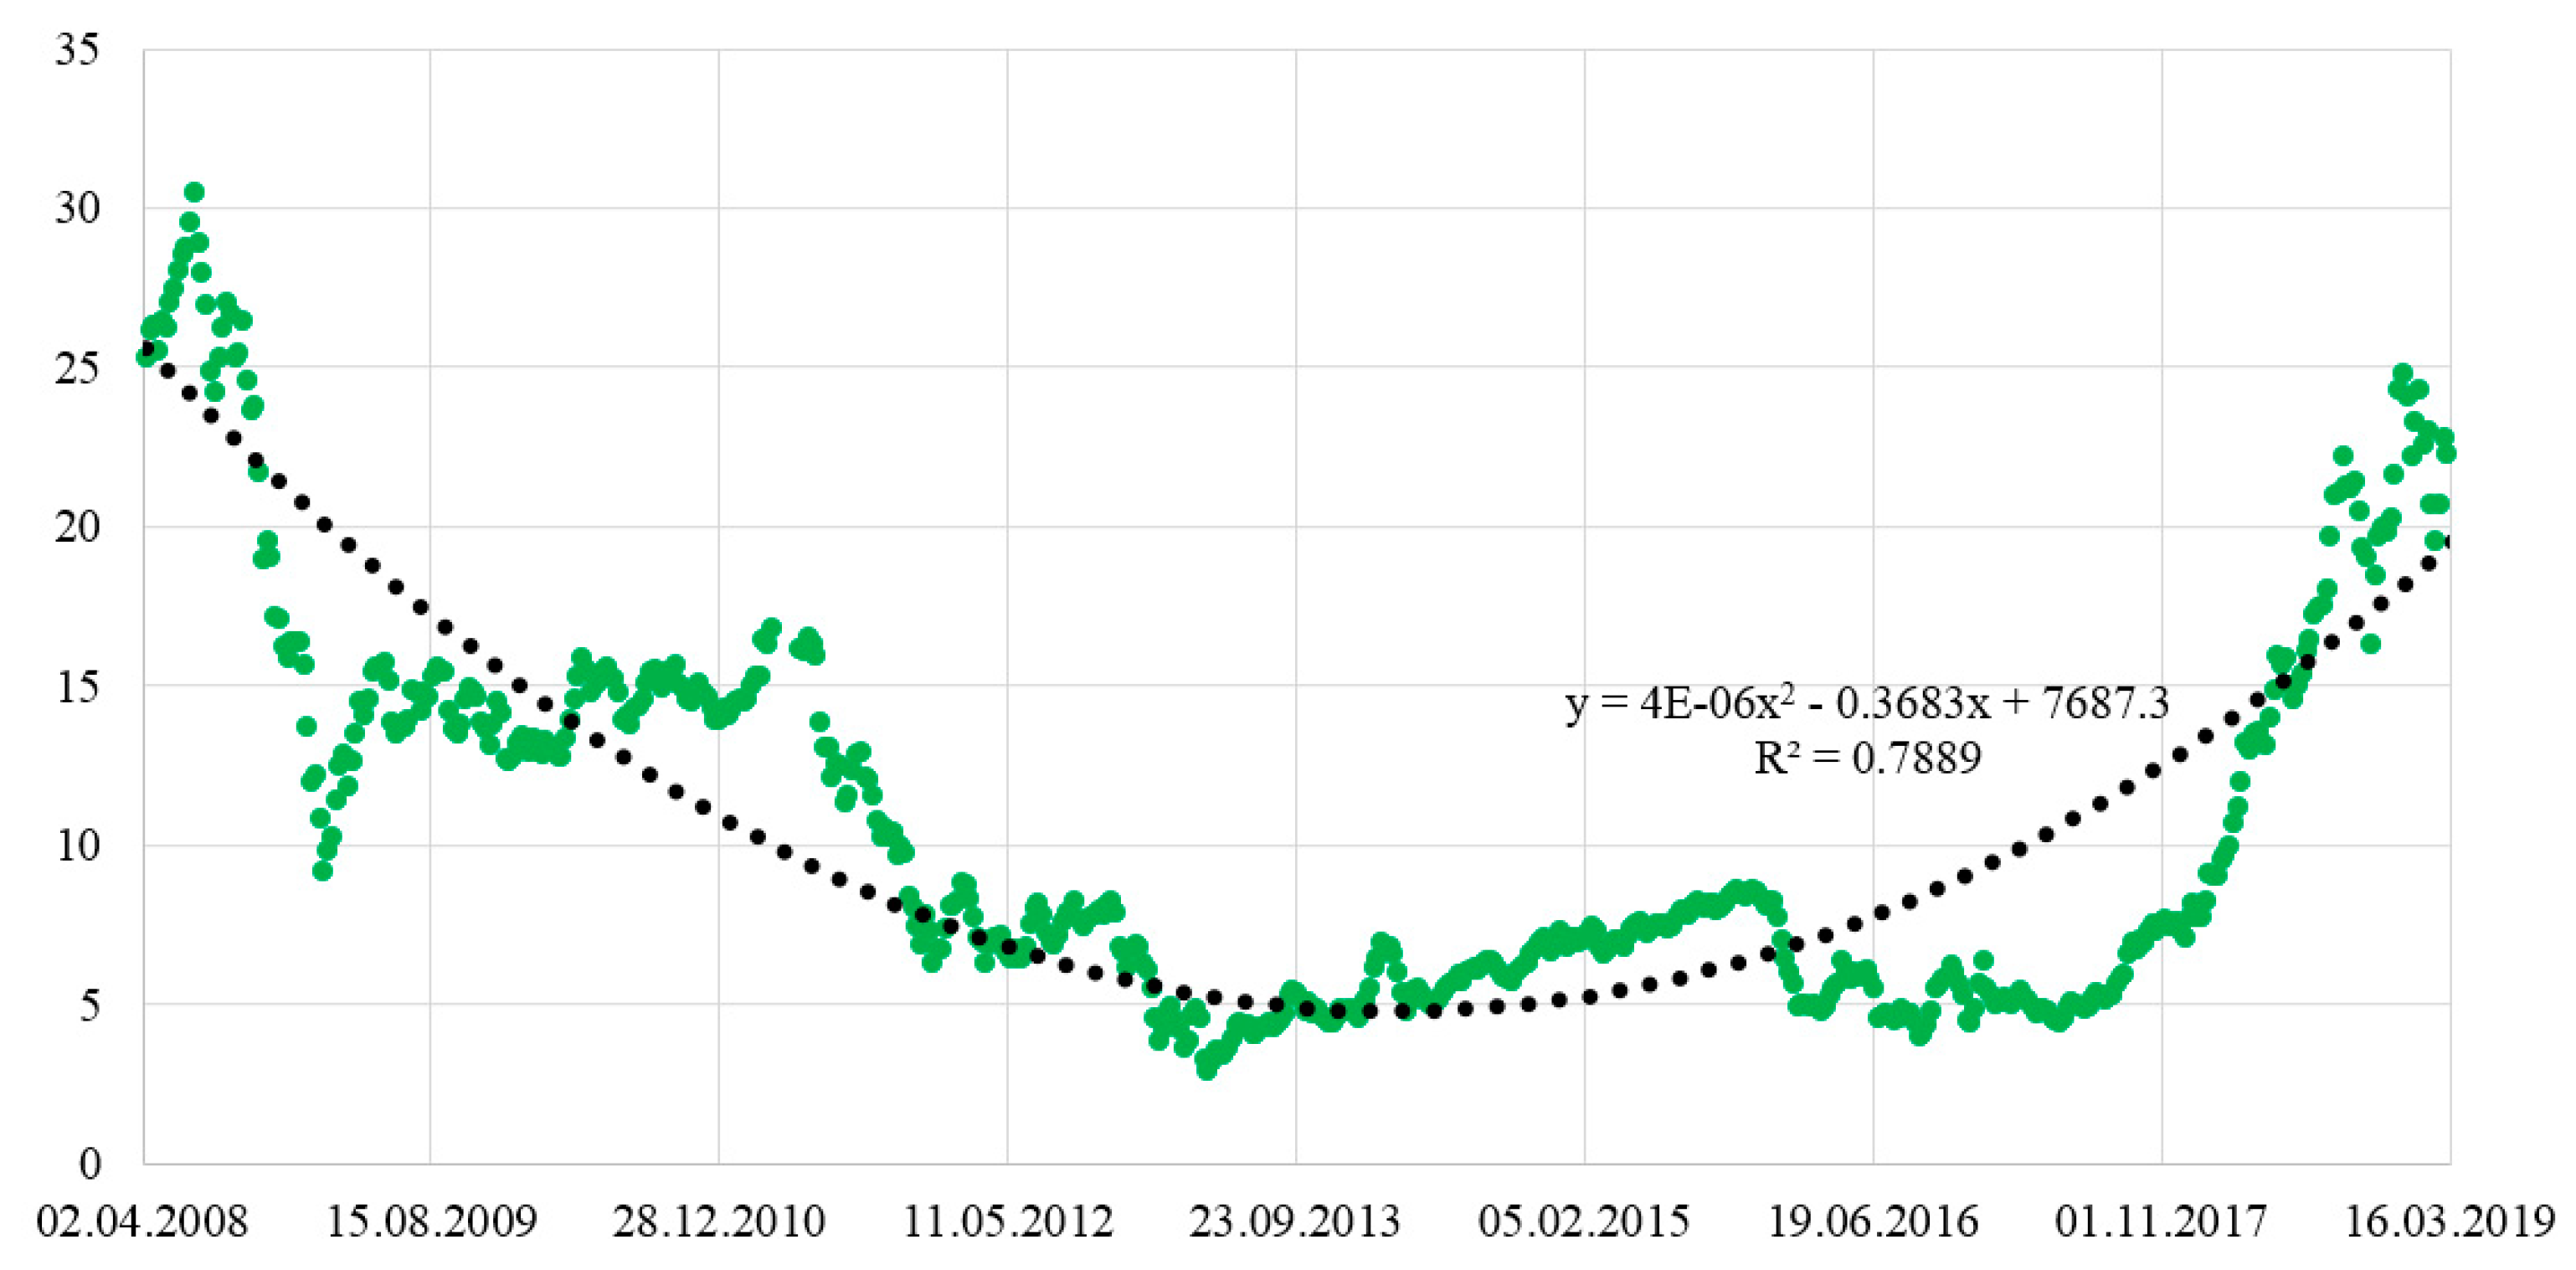
Examples of this combatting are seen in the political arena, where it is openly declared that the era of hydrocarbons is over, and we need to switch to alternative energy sources as quickly as possible. This assertion can be found in the declarations of the G7, the World Bank, the European Investment Bank and many other international corporations that restrict access of production and geological survey projects to the investment capital. An example of large-scale “anti-hydrocarbon” policy based on environmental taxes (Figure 1), can be seen in Europe, which has been continually criticized by the industry companies due to worsening investment climate and lower production profitability [8].
It is remarkable that the real activities of these international corporations significantly differ from their declared policy, as shown, for instance in [10,11,12]. For example, despite declarations, they continue to provide financial support for hydrocarbon energy projects, although indirectly.
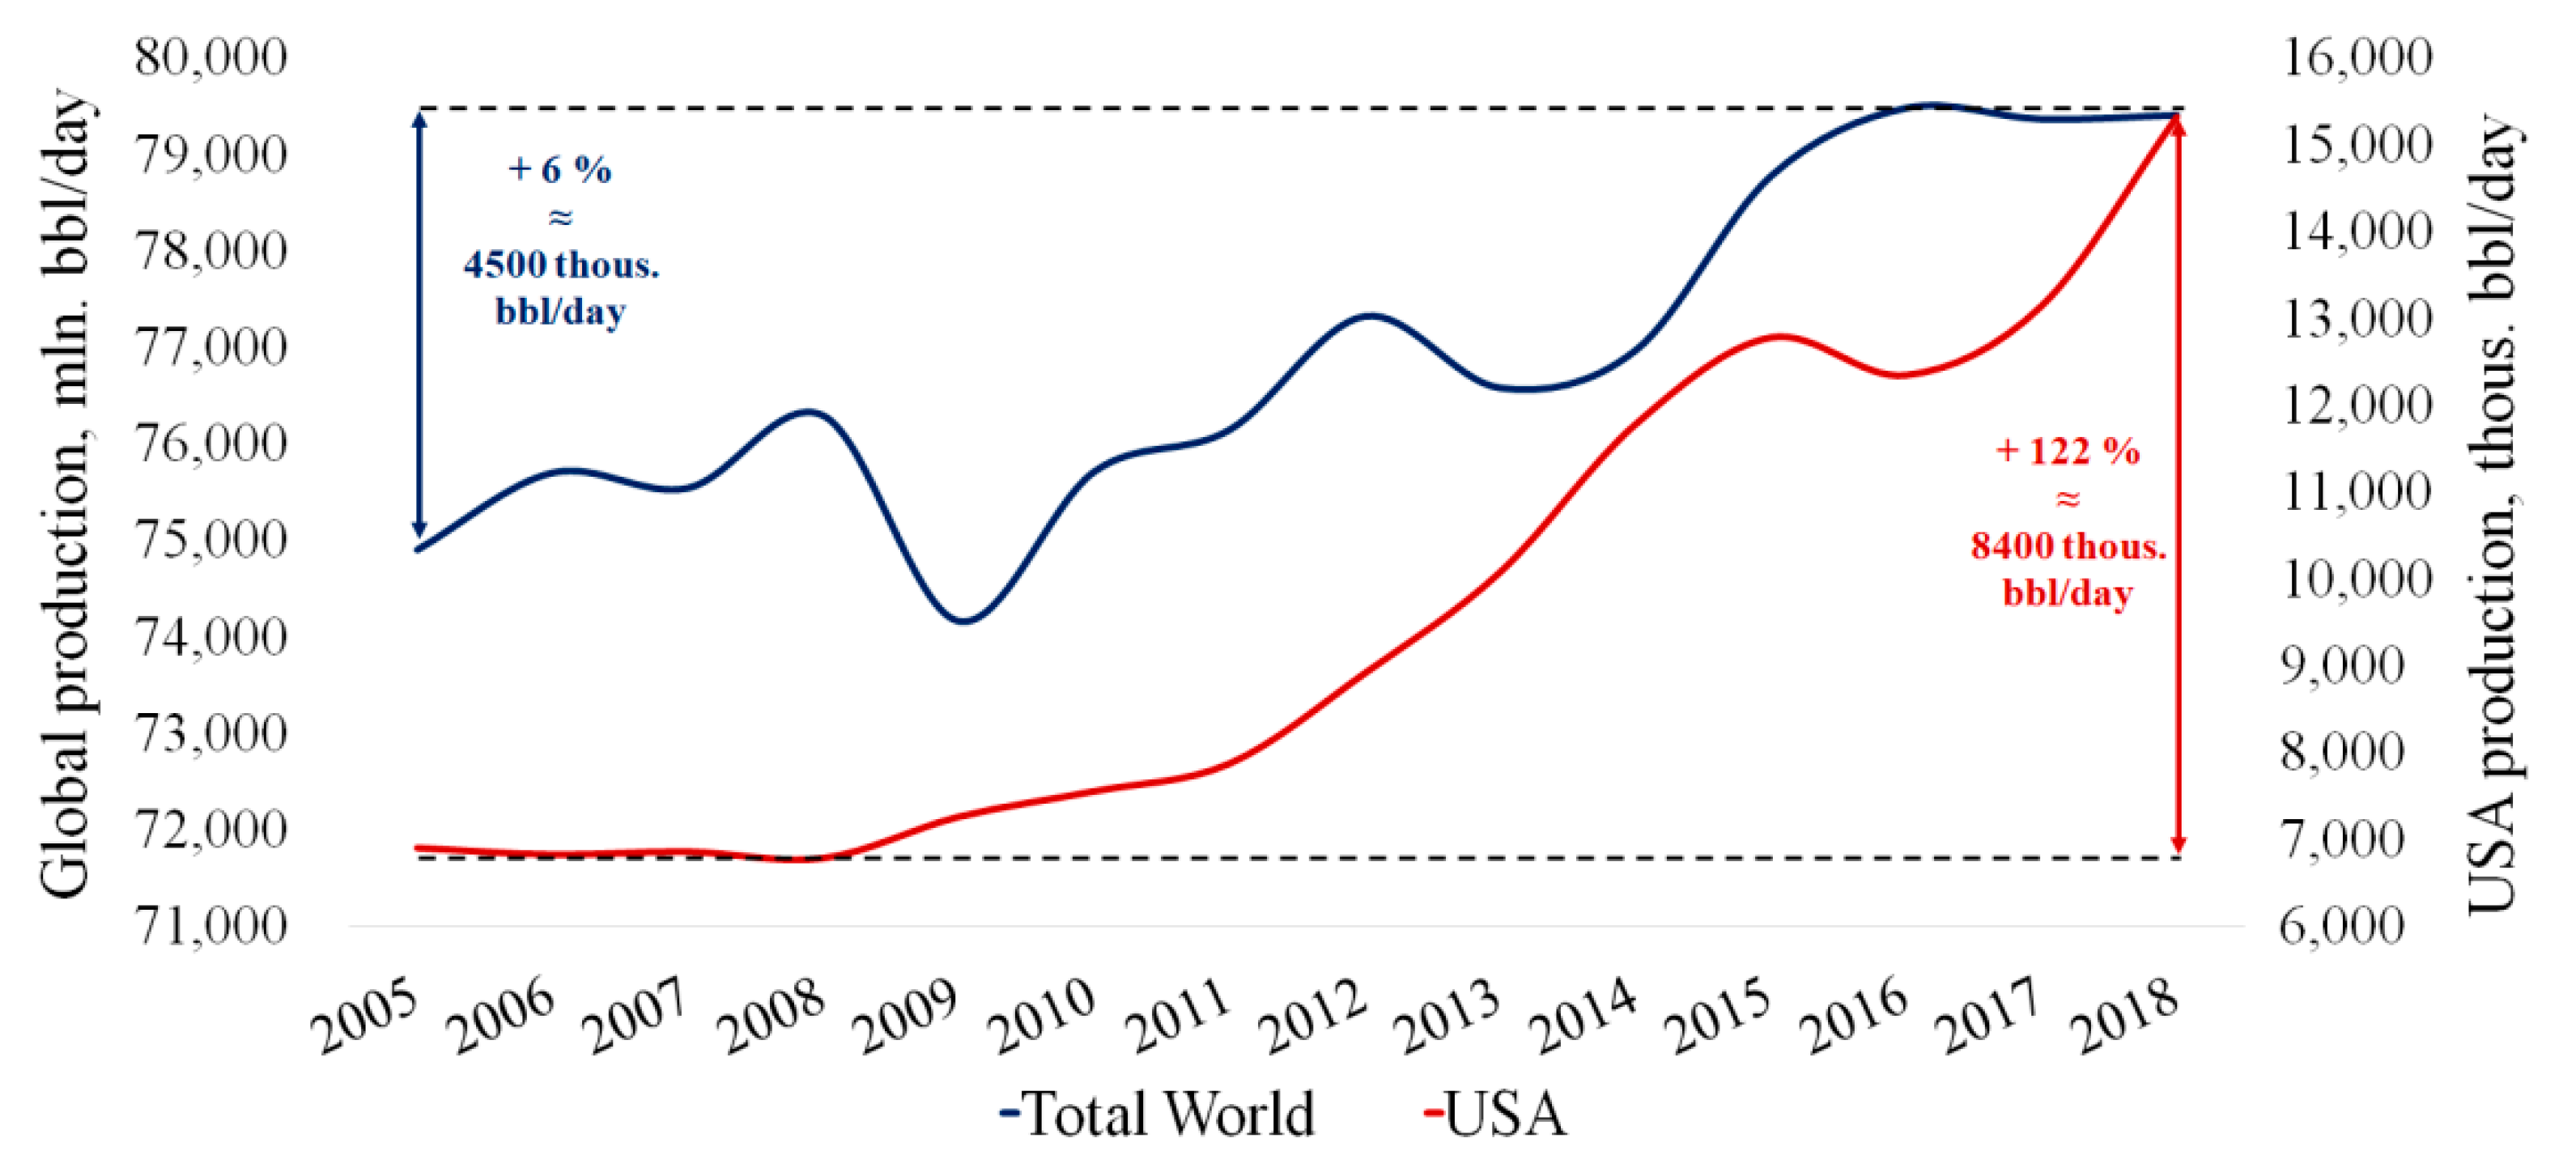
An increase of oil production volumes in the United States of America (USA) by 8410 thous. bbl/day for the period of 2015–2018, which is twice as high as total global increase in production over the same period, is a clear example of such two-track policy (Figure 2). At the same time, a major part of USA production is shale oil, which is much more cost-intensive than conventional oil. Additionally, according to the data of the State Energy Department [13], the USA has been implementing an extensive program in support of gas hydrates studies, which is related to prospective HCR.
Additionally, the collapse of oil prices in March 2020 has triggered a proactive purchase of cheap Arab Light oil by the USA and Urals oil by China to refill strategic reserves. These examples clearly show that there is no intention to decrease our activity in the hydrocarbon energy sector.
The real state and trends of the energy sector can be seen when considering forecasts of leading global companies, for example British Petroleum (BP), over different years (Table 1).
The Table shows that the forecast proportion of HCR in the global energy balance varies slightly despite milestones with respect to their substitution for alternative energy sources. The highest decrease is shown by coal (−6%), while the proportion of oil went up by 1–2%. The share of natural gas demonstrates minor fluctuations, contributing as little as 1–2%. Taken as a whole, and based on the latest BP report, the proportion of HCR (oil, coal and natural gas) in the global energy balance will amount to nearly 76% in 2035, which is equal to 12.9 bln toe. This means a guaranteed demand for HCR, as well as tougher competition and intensification of the struggle for access to them, resulting in HCR earning a status as a geopolitical resource that can be seen even today.
A somewhat different forecast based on plotting “Hubbert curves” is provided in [14], whereby the production peak of oil will occur in 2009–2021, of gas in 2024-2046, and of coal in 2042–2062. It should be noted that these results should be treated with some care, since Hubbert curves may be modified when affected by economic and technology factors. Nevertheless, similar results have been obtained by other authors [15,16]. Despite some variations within the ranges in years, all of the above forecasts came to the same conclusion: the production peak of the majority of HCR is still ahead of us.
It should be understood that all of the above scenarios expect that, within the next few years, oil and gas production volumes will increase due to fields with complex subsurface conditions or located in adverse climatic conditions. Pursuant to [17], the cost for development of such reserves can be 3–4 times greater than the conventional reserves of fields in the Middle East (production cost below 10 $/bbl). Taking into account current prices for oil (around 30 $/bbl), the development of such reserves may become economical in the case of state support or where there is intensification of technical progress rates in the production of hydrocarbons, incl. due to the digitalization of operating activities [18].
At this point, the main question is whether global regulators will be able to create the conditions required for reaching and passing the HCR production peak with regard to sustainable development principles [19], or whether industries will survive amid discriminatory financing of potentially attractive but presently non-competitive technologies.
This study presents the analysis of alternatives offered today for substitution of HCR and an assessment of their viability. The further contents of this article are organized as follows: Section 2 describes the main critical comments for HCR; Section 3 reviews the main alternative energy technologies and their strengths and weaknesses; Section 4 gives a consolidated description of the current position of HCR and a detailed analysis of liquified natural gas (LNG) development prospects as one of the most prospective HCRs; Section 5 contains conclusions and reasoning of the author.
2. Climate Change and Public Image of HCR as a Source of CO2 Emission
Climate change is definitely a significant issue on a global scale. There are two opposing opinions about its nature. The first opinion is that the main reason for Global Warming is the increase in the emission of technogenic greenhouse gases, mainly CO2. This is the most widespread point of view, which is partly explained by possibility of studying this phenomenon. To date, there have been many compelling studies [20], proving that mankind is provoking climate change on the planet through its activities. This has been reflected in strategic intergovernmental agreements aimed at decreasing the rate of temperature growth, such as the Paris agreement, which, however, may not be enough [21].
The main concern is that human activity may lead to the passing of a tipping point, after which climate stabilization will become impossible, even if the emissions of technogenic greenhouse gases were to be reduced [22]. Moreover, it has been shown [23] that there are many tipping elements that could lead to irreversible climate consequences. This creates confusion in the process of defining the strategic aims of global environmental activities and the ways to achieve them [24].
According to the International Energy Agency (IEA), volumes of CO2 emissions in 2019 amounted to 33 Gt, which is the peak value of all time. In addition, a significant part of these emissions is formed as a result of HCR use [25]. Multiple studies have been dedicated to the assessment of indirect losses [26] from the use of various HCR, for example: the use of land for the construction of power plants, accidents at production enterprises, servicing of nuclear waste sites, the higher probability of military conflicts due to rights of access to raw material resources, and many others. In accordance with several obsolete assessments, such factors may increase the cost of using energy resources by 0.29 $ (wind energy sector)–14.87 $ (coal) per 1 kWh [27]. However, to be relevant and useful, such assessments should be conducted on a regular basis and for different regions, with respect to the specifics of local legislation.
The second position on Global Warming suggests that the main drivers of climate change are not related to human activity, but are connected with natural reasons. For example, NASA believes that global warming is mainly caused by changes in the Earth’s orbit related to the sun. This opinion is based on the Milankovitch theory [28], which was initially ignored by the scientific community, but after the release of the study of Hays et al. [29], proving its validity in many aspects, much more attention has been given to it. However, it is extremely difficult to push this idea forward, due to objective technical and technological reasons.
Another example is related to the influence of natural disasters. In accordance with [30], the annual volumes of CO2 emissions caused by volcanic activity may amount to almost 0.05–0.3 Gt per year. Another CO2 source is fires. For example, in 2010, forest fires in Russia resulted in CO2 emissions of more than 0.25 Gt [31]. Following the results of [32], the annual volume of CO2 emissions caused by forest fires in Russia amounted to more than 0.12 Gt for the period of 1998–2010. Forest fires in Indonesia in 1997 produced from 0.81 to 2.57 Gt of CO2 [33]. CO2 emissions as a result of burning peatlands in South-Eastern Asia are estimated at 0.637–2.255 Gt per year [34]. These are some examples of natural factors influencing the higher volume of greenhouse gas emissions, while forest fires occur regularly, especially on peatlands. In addition, according to [35], the entire volume of carbon accumulated in the atmosphere is less than the basis point of total carbon on the planet, while 99% is underground. Emissions of other greenhouse gases (CH4, NOx, etc.) have been studied to a very limited extent [36,37,38,39], making it quite complicated to assess their volumes in a substantiated way.
The main critical argument towards the volumes is that they make up less than 10% of total man-made CO2 emissions. However, it should be taken into account that volcanic activity, as well as fires, has taken place for thousands of years, while mankind only started to emit such CO2 volumes in recent decades. At the same time, it is obvious that additional technogenic emission is not a way to balance the global carbon cycle [40], and the contribution of mankind has become more visible in recent centuries [41].
Based on this, society is fed the idea that we should immediately reject usage of HCR without details about the dependence of our economic stability on these resources. Such an approach is questionable, because, in fact, we have to find a consensus on the need to improve the environmental safety of the processes in this industry and to support its development.
Therefore, if the significance of HCR in the economy is indisputable, the political rhetoric in this field and the attempts to create a strongly negative perception of all HCR among the public, without attention given to the differences between fuels and between the technologies of their production and use, is a point of debate. Hence, it is a very important question: “Should we continue a discrimination policy towards the HCR due to their contribution to a global carbon emission, or should conditions for the sustainable development of this industry be created?”, since forecasted HCR production shows that they will play a significant role in the global economy for several decades in the future.
3. Alternative Energy Technologies. Problems and Prospects
Technological transformations, especially within such a key area as the energy sector, go hand in hand with the transition to a new technological order, which is a very long-term process that may take up to several decades [42]. The creation of conditions for the implementation of these transformations and transitions with minimum losses will be of high importance, both for the environment and the economy, i.e., in view of the sustainable development principles [43]. The variety of terms defining sustainable development in modern publications does not change its common nature, offered in 1987 [44], while the principles and methods of sustainable development mainly depend on a regulator, i.e., on politics and policy [45], and may be implemented on national, regional, and local and lower levels [46,47].
The entire list of factors influencing the implementation of transformations at every level can be roughly divided into the technology-readiness level, the regulatory-readiness level, and the market-readiness level [48]. However, despite the fact that the focus of key policy provisions can be made on the basis of climatic (Kyoto Protocol) and technological (Paris Agreement) considerations, the objective fact is that there are no reliable scientific results showing how exactly technological factors influence policy development [49]. In other words, the extent of the influence of technology readiness on the formation of policy and, as a result, on the readiness of the regulatory framework, is unknown.
Elimination of this gap in knowledge requires an interdisciplinary approach [50] with studies executed by international scientific groups. This is related to a need for deep modernization of the already established global infrastructure, and requires some strategic decisions on the support of certain technological niches (technological groups) to be supported by scientifically substantiated and realistic recommendations on the determination of overall vector of activities [51] and specific measures. For further analysis, the most promising technological niches were selected from among those available today [52,53,54], and are reviewed below.
3.1. Nuclear Energy Sector
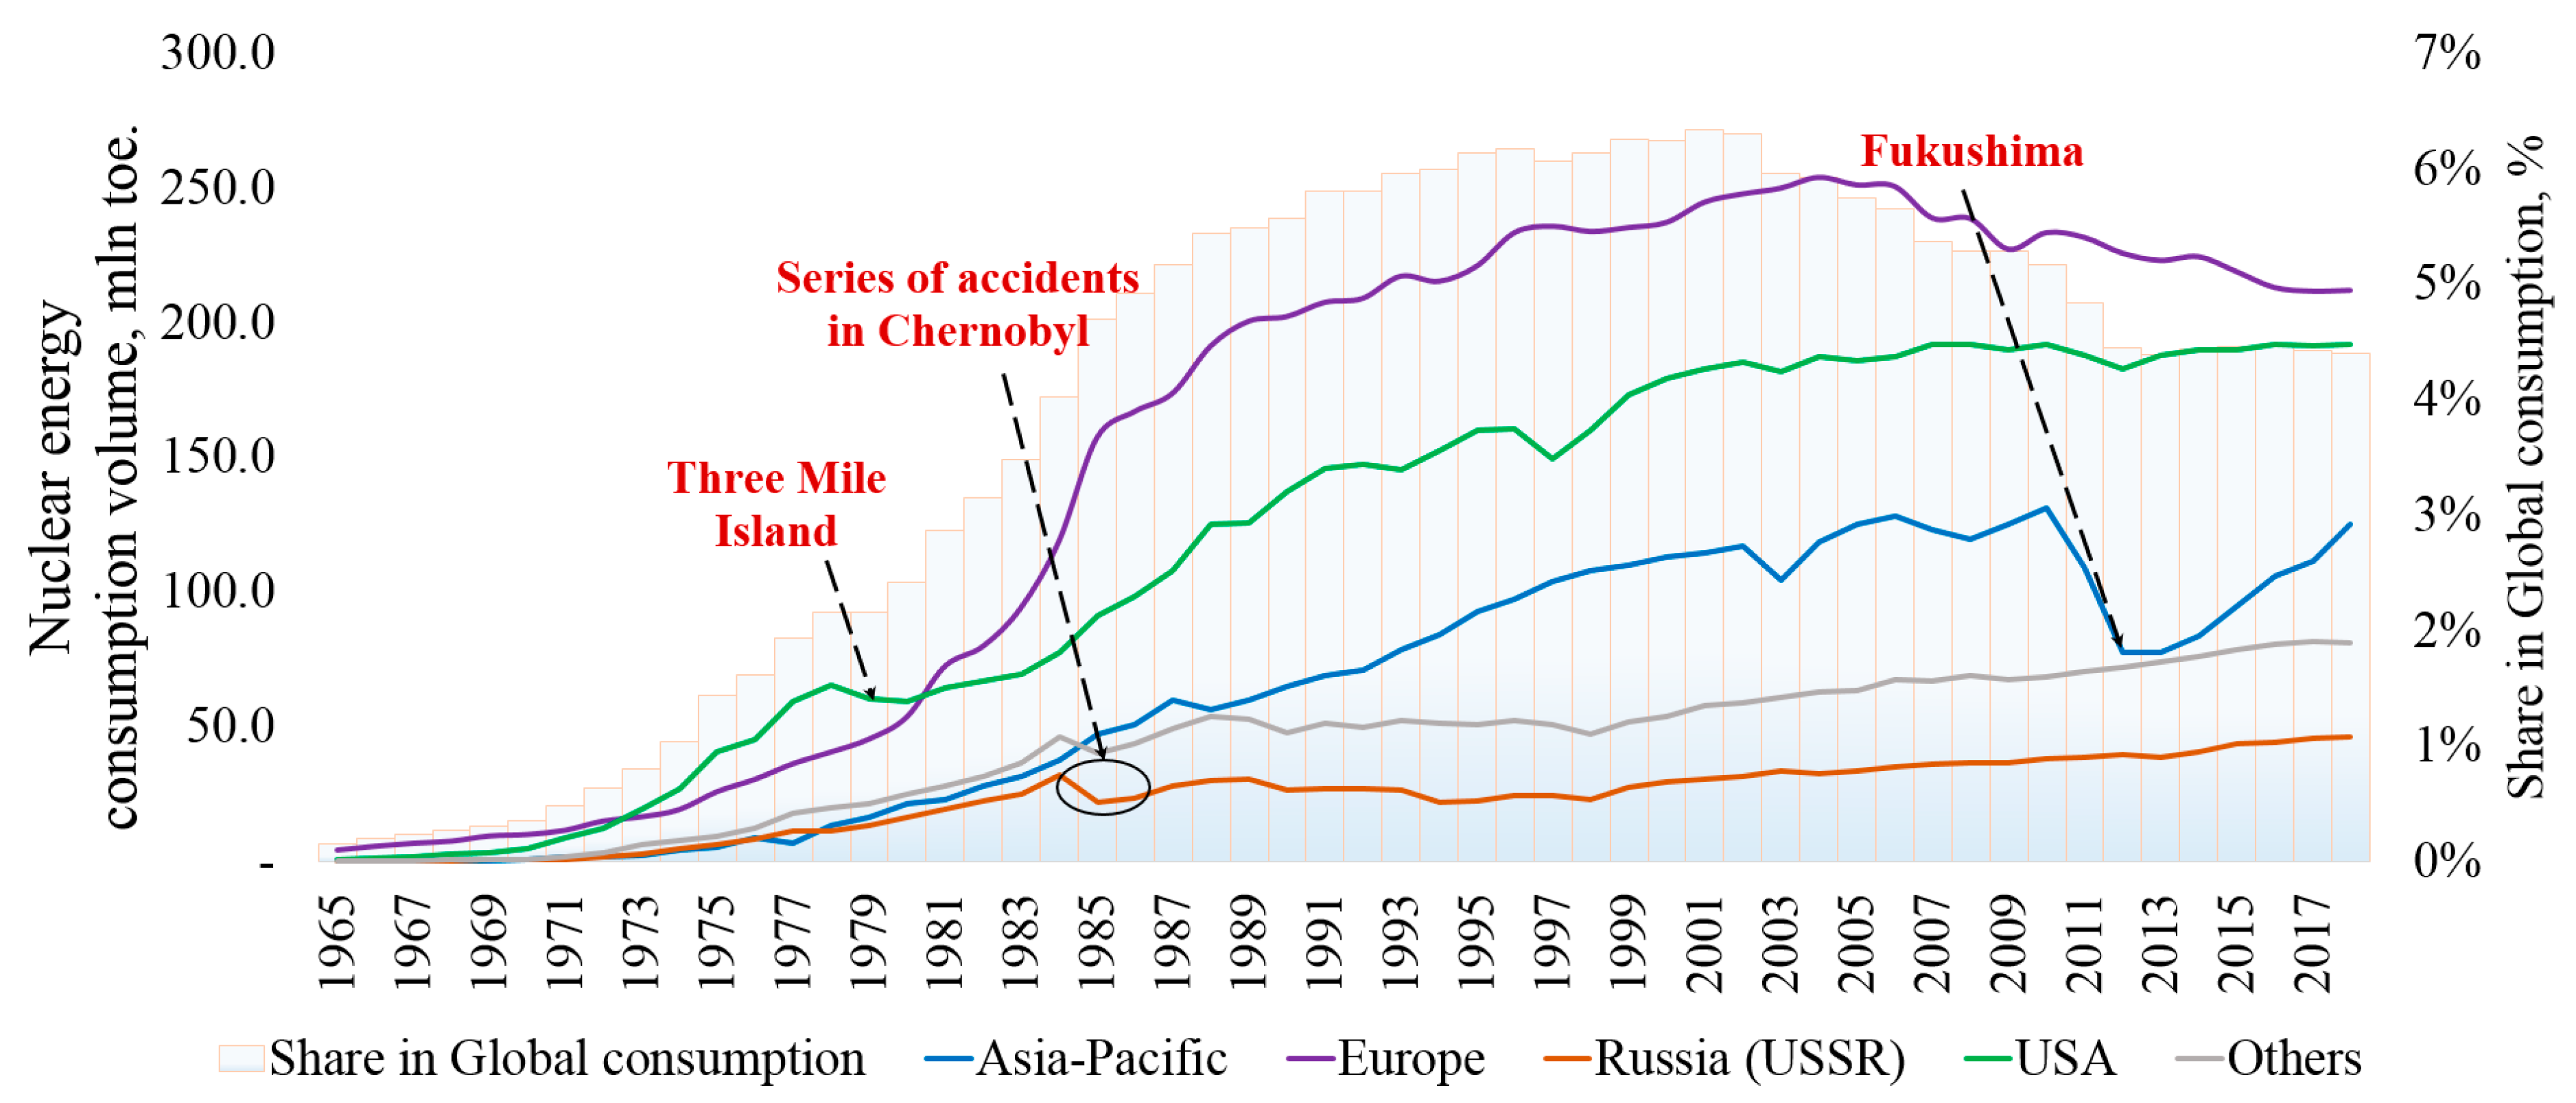
Nuclear industry, accounting for 4.5% in the global energy balance, has already made a considerable contribution to energy sector development (Figure 3), due to the relatively low cost of electricity generation [55]. The development dynamics of the nuclear energy sector differ greatly in various countries, because of varying available resources and access to alternative sources of energy, as well as project experience.
Prospects for its further development are questionable. On the one hand, the low production cost of energy generation, as well as the higher efficiency of the plants (the majority having a capacity use rate of more than 80%) [56], could mitigate the technological transformation of the energy sector. On the other hand, the diagram shows that sharp declines in nuclear energy generation are caused by accidents at plants that directly influence not only the energy generation process, but also produce fears on the expediency of the further use of nuclear energy. Here, for example, a final decision about the immediate decrease in the share of the nuclear energy in the country balance was taken by Germany in 2011 after the accident at Fukushima and the first-step measures included the shutdown of power units commissioned before the 1980s.
The problem of existing physical depreciation of energy generating facilities is topical for the nuclear energy sector even today. As of the end of 2018, the number of nuclear reactors in the world amounted to 450 [57], 281 of which (62.4%) were more than 30 years old, 26% were aged 10 to 30 years, and only 11.6% were younger than 10 years old. In accordance with IEA data [58], the highest average ages of nuclear plants are seen in the USA (39 years old), Europe (35 years old), Russia (31 years old) and Japan (29 years old). The highest shares of nuclear plants under 10 years old are observed in China (80%), India (40%), Russia (25%) and Korea (24%).
Strengthening security measures taken during the construction of the third-generation reactors enables the mitigation of risk of accidents, but increases the unitary cost of the generated energy (more than doubling the cost, compared to fully depreciated facilities) [59]. In general, with the increasing wear and tear of the reactor, the risk of unforeseen incidents increases, and therefore, activities in the field of nuclear energy should be accompanied by the availability of an appropriate license confirming the safety of power generating facilities.
It can be said that nuclear energy has some advantages compared to other energy technologies. First of all, a comparatively low energy generation cost with a minimal carbon footprint. Secondly, technology readiness with high technical efficiency. Thirdly, the technological scalability of both small- and large-scale capacities, which may ensure stable and uninterrupted energy generation.
Despite this, there are three key barriers that do not allow a significant expansion of nuclear plant usage. Firstly, the development of nuclear energy generation is associated with the development of nuclear weapons, which is a very negative and destabilizing factor [60].
Secondly, notwithstanding their higher reliability, global history knows examples of man-made catastrophes, which has produced a very adverse effect upon acceptance of the technology. To restore its image, great pains must be taken in terms of marketing and notifying society about the safety measures taken at modern energy generating facilities [61].
Thirdly, one of the most complicated problems is the handling of nuclear waste [62], requiring significant financial costs on the one hand and availability of hi-tech facilities preventing radioactive contamination of the environment on the other.
3.2. Renewable Energy Sector
Renewable energy sources (RES) are promising in the long-term development of the energy sector. As such, the question of their high use efficiency is one of the most discussed issues of recent decades. RES have several key features that ensure their high demand:
- RES are a group of primary energy resources that are considered inexhaustible for foreseeable future consumption. Moreover, they have an extensive geographical range to allow the creation and scaling of decentralized energy supply systems [63] and, as a result, avoid the problems related to the creation of centralized infrastructures.
- Theoretically, RES technologies are carbon-free, with some exceptions. Nevertheless, when considering them in view of the entire lifecycle, including the production and use of worn equipment, environmental issues become more controversial [64].
Despite differences in nature, the majority of RES have similar problems that do not allow them to be considered a complete substitution for HCR at the current stage of development.
- Similar to HCR, some RES have non-uniform geographical distribution. Significant differentiation can be seen even in one country [65]. Resources of wind and solar energy show the most wide-spread distribution in the world, though they do have certain restrictions.
- Another issue is dependence on favourable weather conditions, prediction of which is a complex scientific task. The most predictable sources are biomass, geothermal energy and hydro-energy due to their low dependence (or independence) on changeable weather conditions. This issue also determines the complexity of energy transformation process control and maintenance of required levels of effectiveness [66].
- The third issue is related to the immaturity of most RES-based technologies, which affects energy generation cost. The most cost-intensive options are solar and oceanic energy plants, with the electricity cost being an order of magnitude higher than that of HCR. The most competitive are large-scale hydro and wind plants, the energy cost of which is only a few times higher than that of HCR. Additionally, a comparatively low production cost of energy can be obtained during the processing of biomass, including peat, due to the high rate of its reserve base replenishment [67]. Low competitiveness in terms of price necessitates seeking ways of defining the project’s potential based on theoretical prospects, rather than on the completeness of technologies and potential profitability [68].
- The fourth, and probably main, issue with RES is the accumulation and storage of energy. Today, many technologies have been developed in this area, but there are objective problems with their effectiveness and possible storage period [69]. In accordance with market needs, RES development is impossible without these key stages of energy generation [70].
Coping with these four barriers is the main task of RES development proponents. Due to this, it is one of the most invested-in sectors today [71,72,73]. However, it should be taken into account that while seeking higher volumes of investment, one may forget that the efficiency of studies and innovation progress may grow disproportionately with the investment volume [74].
There are no studies of investment volume influencing their efficiency, due to objective problems of scientific and innovation activity assessment. Similar to market mechanisms, unlimited financing leads to a loss of competition, and this would result in lower quality and efficiency. The same can be applied in the global scientific sector; however, additional studies will be required to prove this.
A step towards the short-term global transition to RES is an attractive perspective, but hard to access due to some objective reasons [75]. Gradual transition is required, which can be objectively traced against a gradual decrease in the share of hydrocarbons in the global energy balance. Additionally, this transition must occur under the influence of objective competitive factors other than political influence and creation of artificial conditions for the displacement of existing hydrocarbon technologies.
3.3. Hydrogen Technologies
Hydrogen fuel is a potential solution for several energy generation issues typical of both RES and HCR. On the one hand, the production of hydrogen will enable the conversion, accumulation and storage of energy generated from any primary source in the long run. This will enable the use of hydrogen as a mobile energy carrier [76]. On the other hand, hydrogen is recognized as an environmentally clean secondary energy resource due to the lack of any pollutant emissions during its use [77]. Additionally, its energy intensity in relation to weight units is much higher than of any HCR.
Despite this, the hydrogen energy sector is in its primary stage of development and is not ready for large-scale implementation in the global energy system. There are several main factors hindering this process.
- Unlike HCR, hydrogen is a secondary energy resource since its production from the natural environment is hard to implement. Many concepts and technologies have been developed for generation of hydrogen [78], which can be provisionally divided into two groups: (1) based on RES, and (2) based on HCR. The first group uses thermochemical or biological processes. The second group uses HCR reforming and pyrolysis processes. The problem is that the majority of accessible technologies are not sufficiently tested for their industrial implementation.
- The cost of hydrogen production is quite high due to the initial stage of technology development and it does not allow competition with traditional HCR-based technologies. The study [79] includes a comparative analysis of 19 technologies for the production of hydrogen fuel. Based on this analysis, the authors drew several important conclusions in terms of the potential of the development of hydrocarbon resources. First of all, the reforming of the hydrocarbon feed has the highest energy efficiency among all of the options considered. Secondly, the exergy efficiency of hydrocarbon reforming is one of the highest (45–50%), with only biomass gasification being ahead of it (60%). Thirdly, it was shown that the cheapest hydrogen could also be obtained from the hydrocarbon feed, with a price of nearly 0.75 $/kg H2. The use of technologies such as water electrolysis will enable generation of hydrogen with a cost 1.5 times higher and more.
Price-specific advantages of hydrogen generation based on hydrocarbons can be seen in [80], as well, pursuant to which the generation based on natural gas varies from 1.34 $/kg (without CO2 sequestration) to 2.27 $/kg (with sequestration); and with coal: 1.34 $/kg to 1.64 $/kg; while the majority of other generation methods are 1.5–6 times more expensive. The generation of hydrogen based on methane pyrolysis is the most economically efficient option, enabling a price of 1.22 $/kg. The authors did not point out a single potentially leading production technology, but stated that the preference should be given to hybrid methods.
Equivalent results have also been obtained on the basis of a fuzzy logic method [81], proving that the highest technical and economic efficiency, as well as level of readiness and level of reliability, was typical for technical chains based on hydrocarbon resources.
- 3.
- Transportation and storage processes are the foils of the hydrocarbon energy sector [82]. An increase in the efficiency of the processes is related to the solution of two key issues: the transformation of hydrogen into a form with higher density (for example, liquefaction), and an increase in the safety of tanks and delivery systems. In addition, while the first problem already has some practical solutions, the issues of safe hydrogen handling have not yet been studied. However, nearly 70 mln t are produced, presently, and as a rule is used during the processing of metals.
Therefore, despite the prospects for hydrogen in the long run, the current level of global economic readiness for the development of hydrogen infrastructure is less than that of the renewable energy sector, due to: a complete absence of market mechanisms; the lack of technologies and infrastructure enabling the efficient generation, distribution and storage of hydrogen; huge problems with the safety of its use; and other [83] issues typical of technologies at the initial stages of development.
4. Hydrocarbon Resources. Focus on LNG
4.1. The Role of Hydrocarbons in the Energy Sector
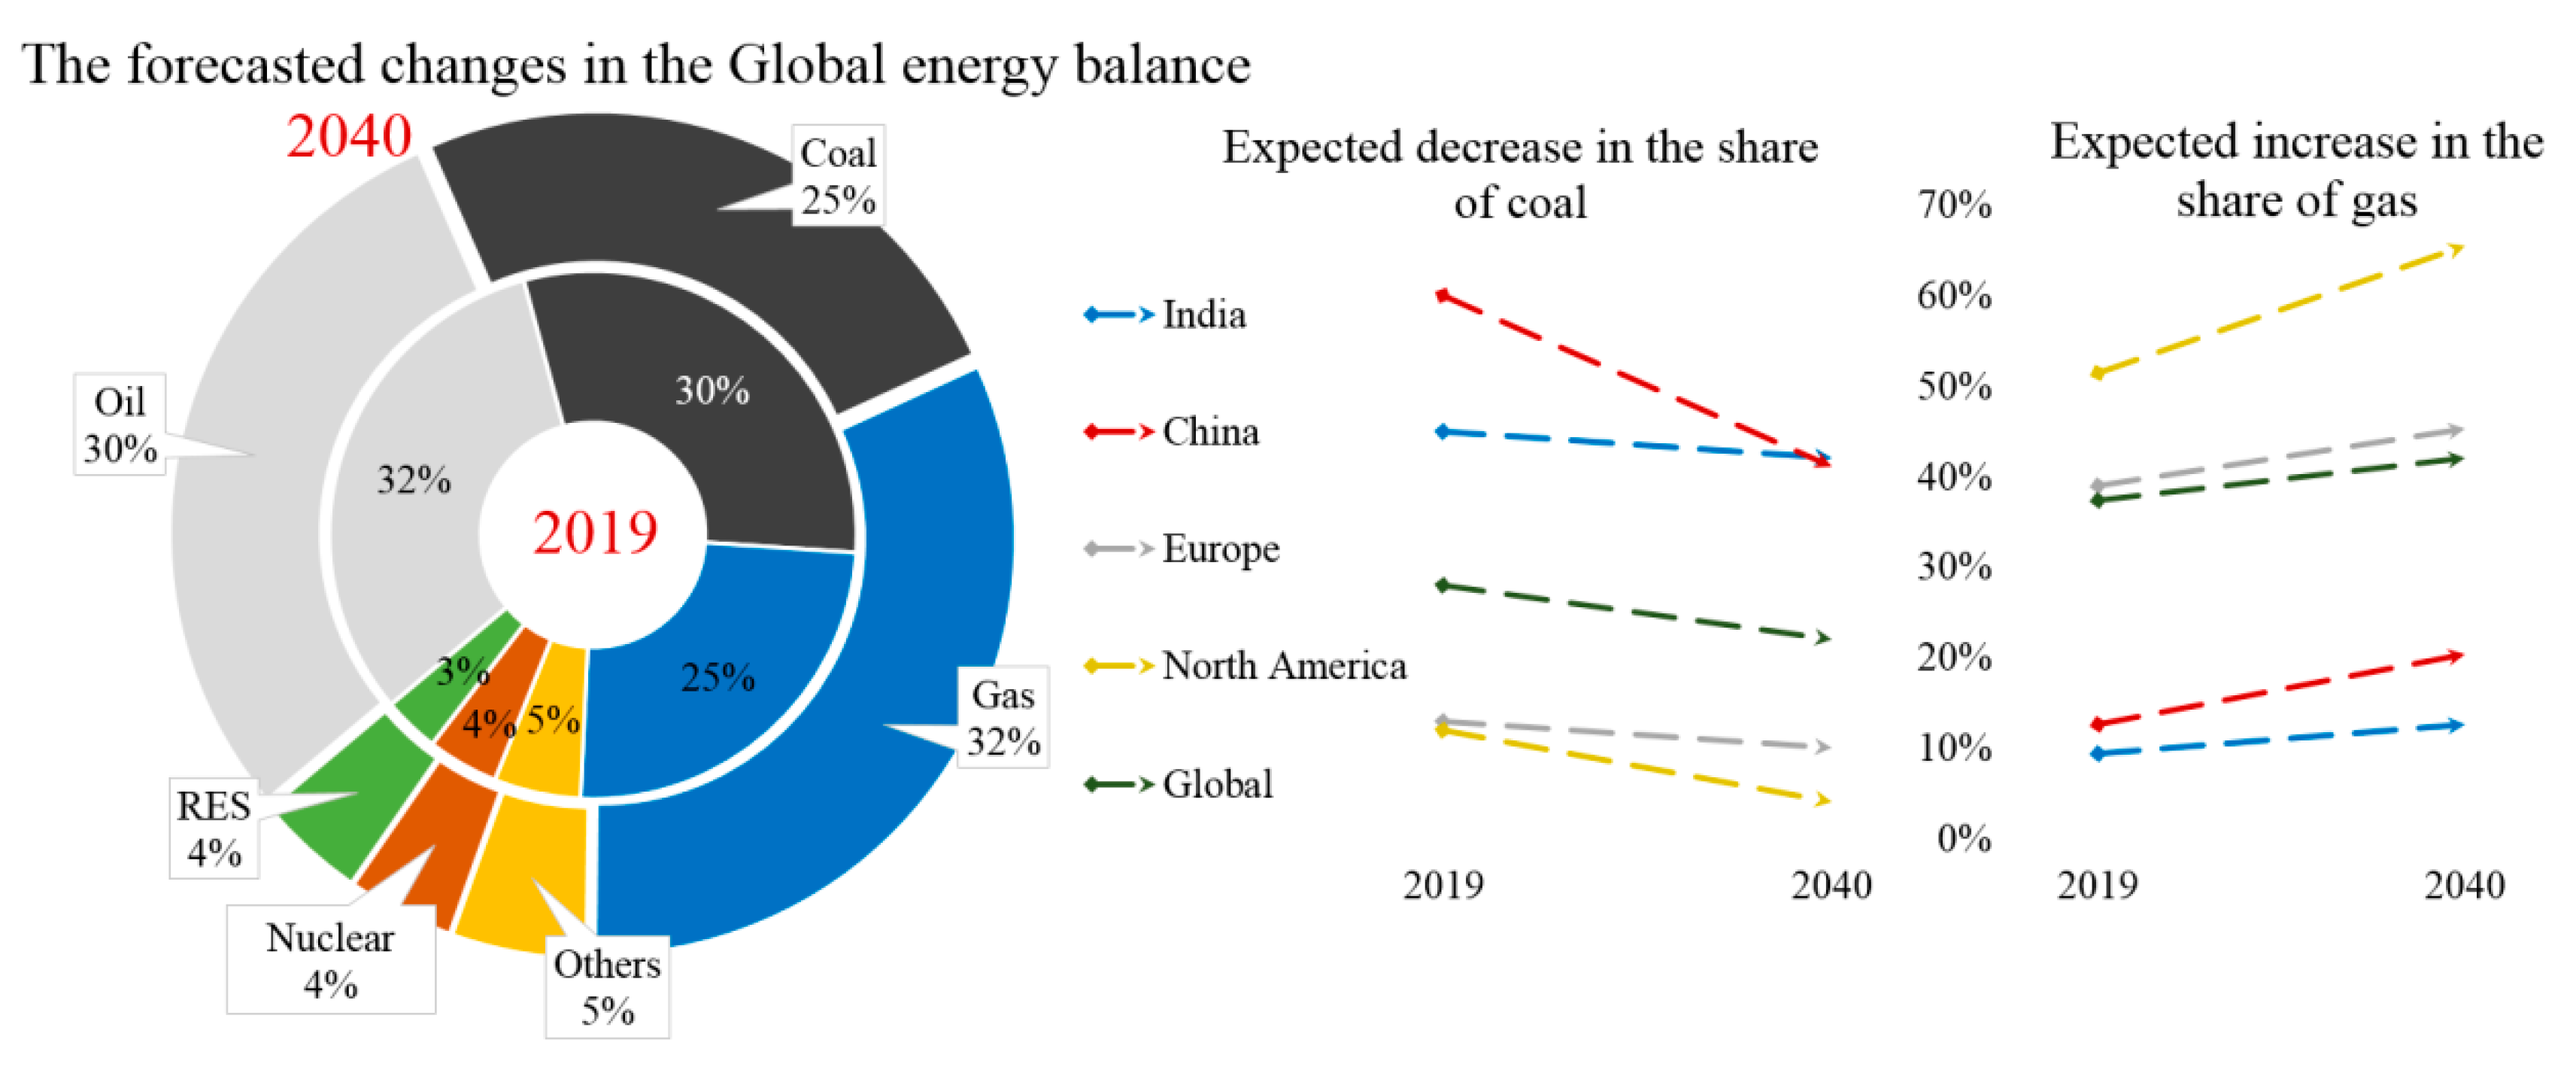
HCR have played an important role in the global economy for centuries. They are real drivers for the development of both industry and society as a whole. Currently, the most influential HCRs for the economy are coal, oil and natural gas. Due to external reasons related to the “greening” of global economies (not only the reduction of greenhouse gases emission), multiple technological transformations of industries will take place in the near future, mainly in the oil and coal industries, for the purpose of enhancing the raw material conversion ratio due to stronger vertical integration links with enterprises in the chemical industry. These transformations will lead to a change in the role of hydrocarbons in the global economy (Figure 4) and, most probably, to a partial substitution of some of them with alternative energy technologies.
HCR released due to such substitutions may be redirected to chemical facilities, but these processes require the development of international norms and standards of coal use, in order to improve its purity as an energy and chemical resource.
The economical prerequisites of such processes can be clearly seen in the oil industry, as they are associated with some negative factors that hinder its further development:
- There is no system for the international regulation of processes connected with the development of the traditional oil and gas sector, whether by increasing the effectiveness of internal processes or by integration with associated industries.
- Rapid depletion of the raw materials base of easy-to-recover reserves and, as a result, higher operating and investment costs. By some estimates, the refilling of reserve volumes trails behind the volumes of produced oil and gas resources by 20%–30% [85], which will lead to industrial stagnation and destabilization of the raw-material and associated markets in the long term.
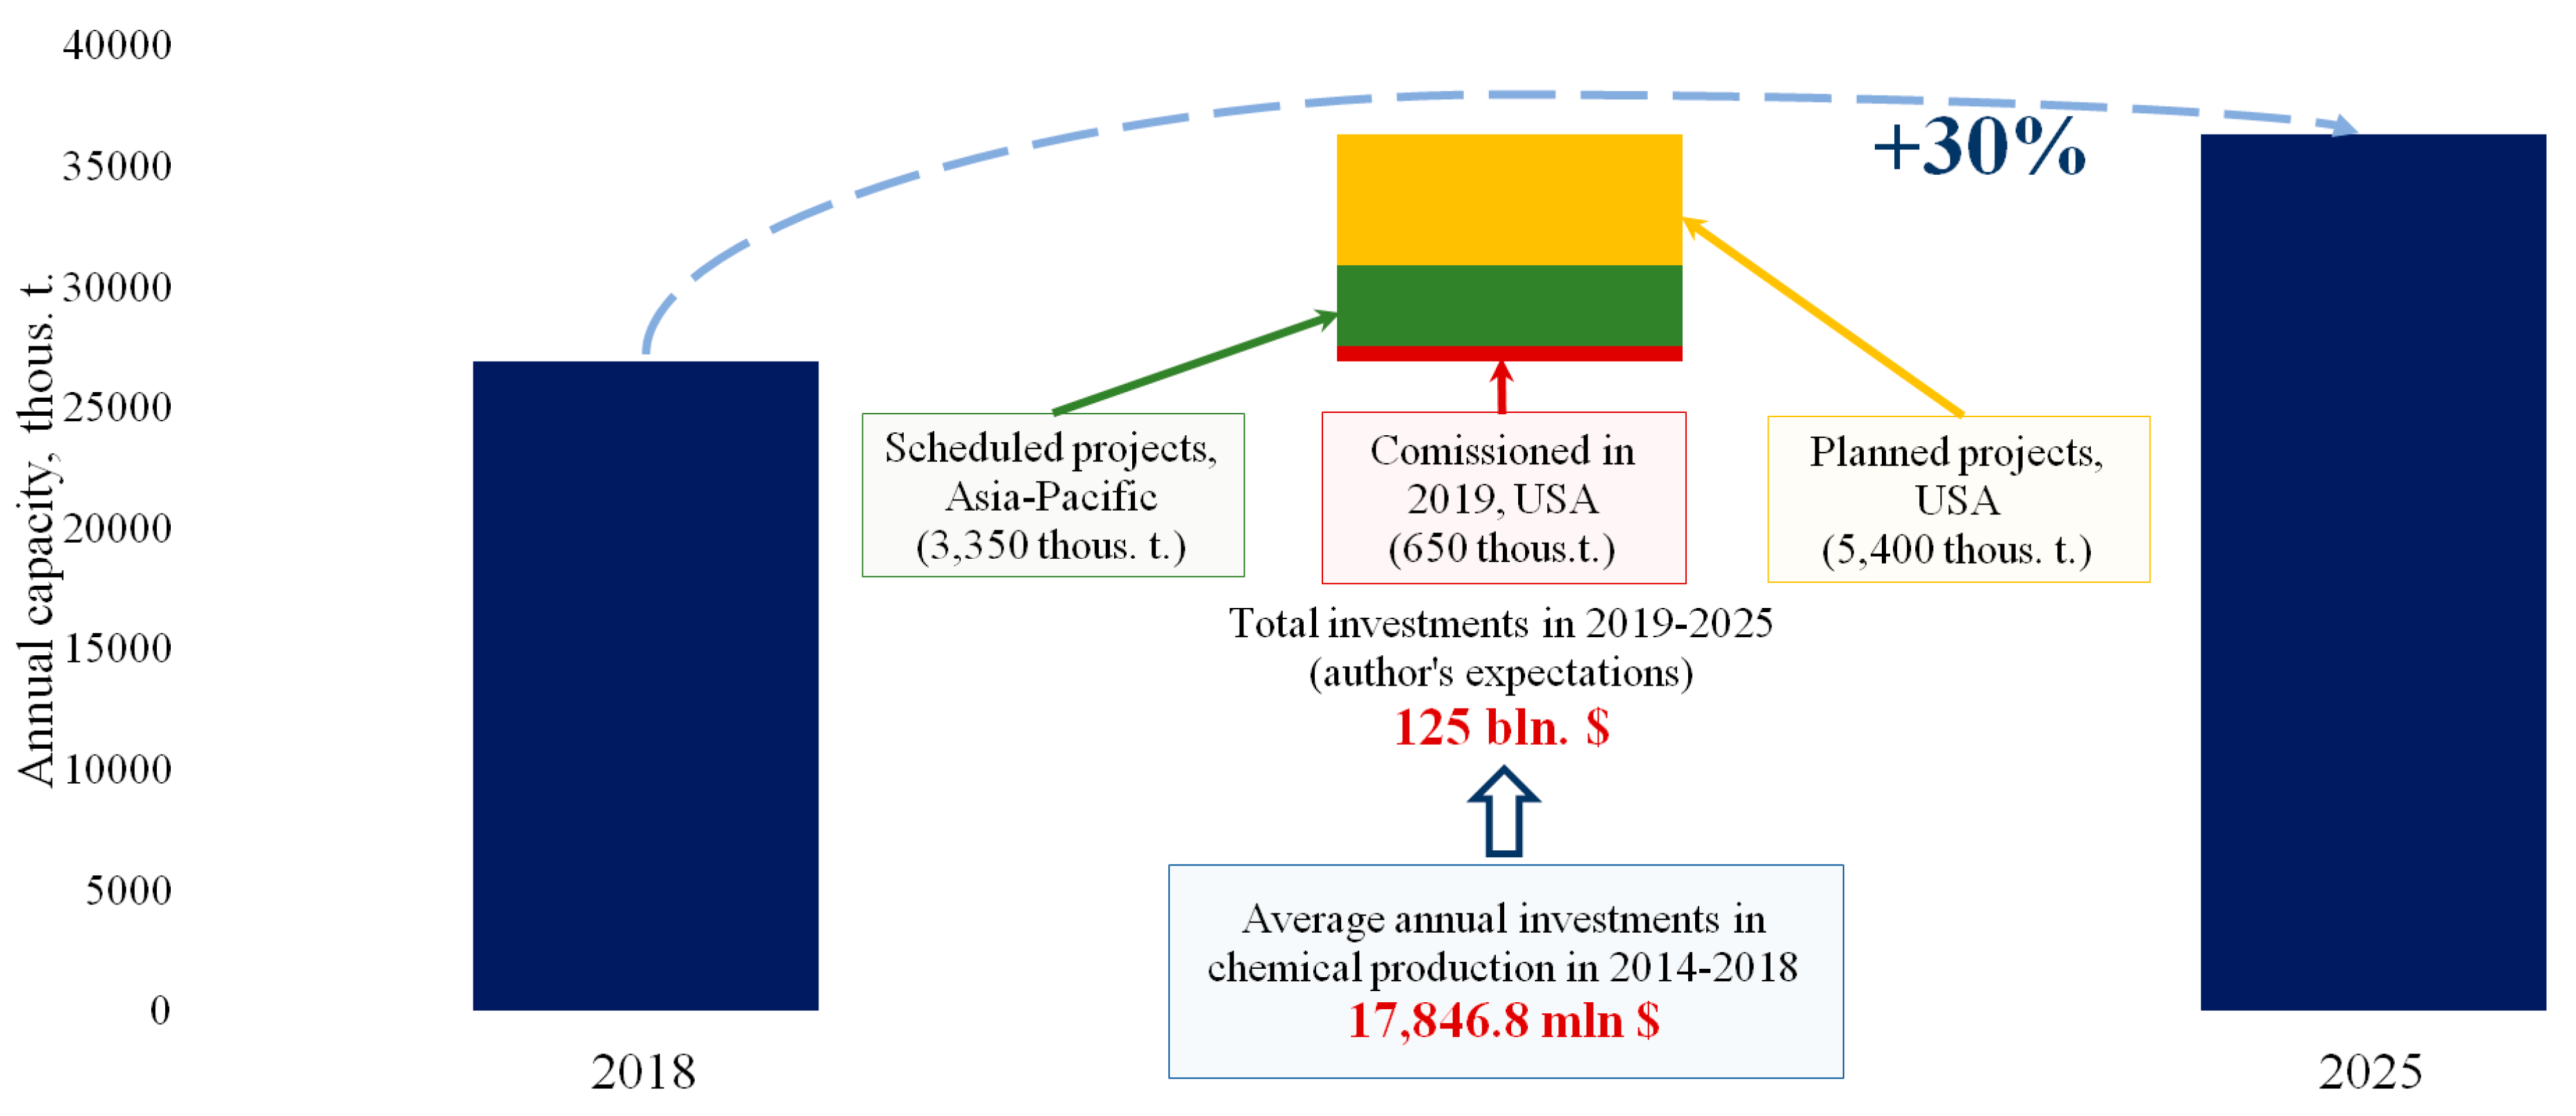
To some extent, these negative effects can be compensated by manufacturing of scientific-intensive products with high added value. Even today, oil and gas giants such as ExxonMobil (7th place in the C&EN 2018 rating of chemical companies [86]) implement large-scale investment programs in the area of chemical enterprises development (Figure 5).
- 3.
- The comparatively low level of oil recovery at multiple fields. The average value of the global recovery ratio is around 20%–40% [87]. In some cases, such rates are connected with the possibility of reorientation to new “effortless” reservoirs; however, such policies may become impracticable soon.
- 4.
- 5.
- The lack of commonly accepted indicators for assessment of oil and gas companies’ performance based on sustainable development principles [91]. For example, it is evident that using nuclear energy resources must be regulated and controlled at an international level. Due to this, it is not quite clear why hi-tech oil and gas industries bearing huge technological and environmental risks are completely self-regulated.
Unlike the oil and coal industries, the gas sector is on the rise and is demonstrating intensive expansion. This is due to both the cost performance of natural gas, which is slightly more expensive than oil, and environmental features. According to [92], CO2 intensity during the generation of 1 kWh of electricity from natural gas is nearly 450 g, which is almost a mean value between hydro power plants (10 g/kWh) and coal (1000 g/kWh). Therefore, natural gas is a somewhat “win–win” solution as it makes it possible to balance the interests of the “green” energy sector and hydrocarbon energy sector supporters.
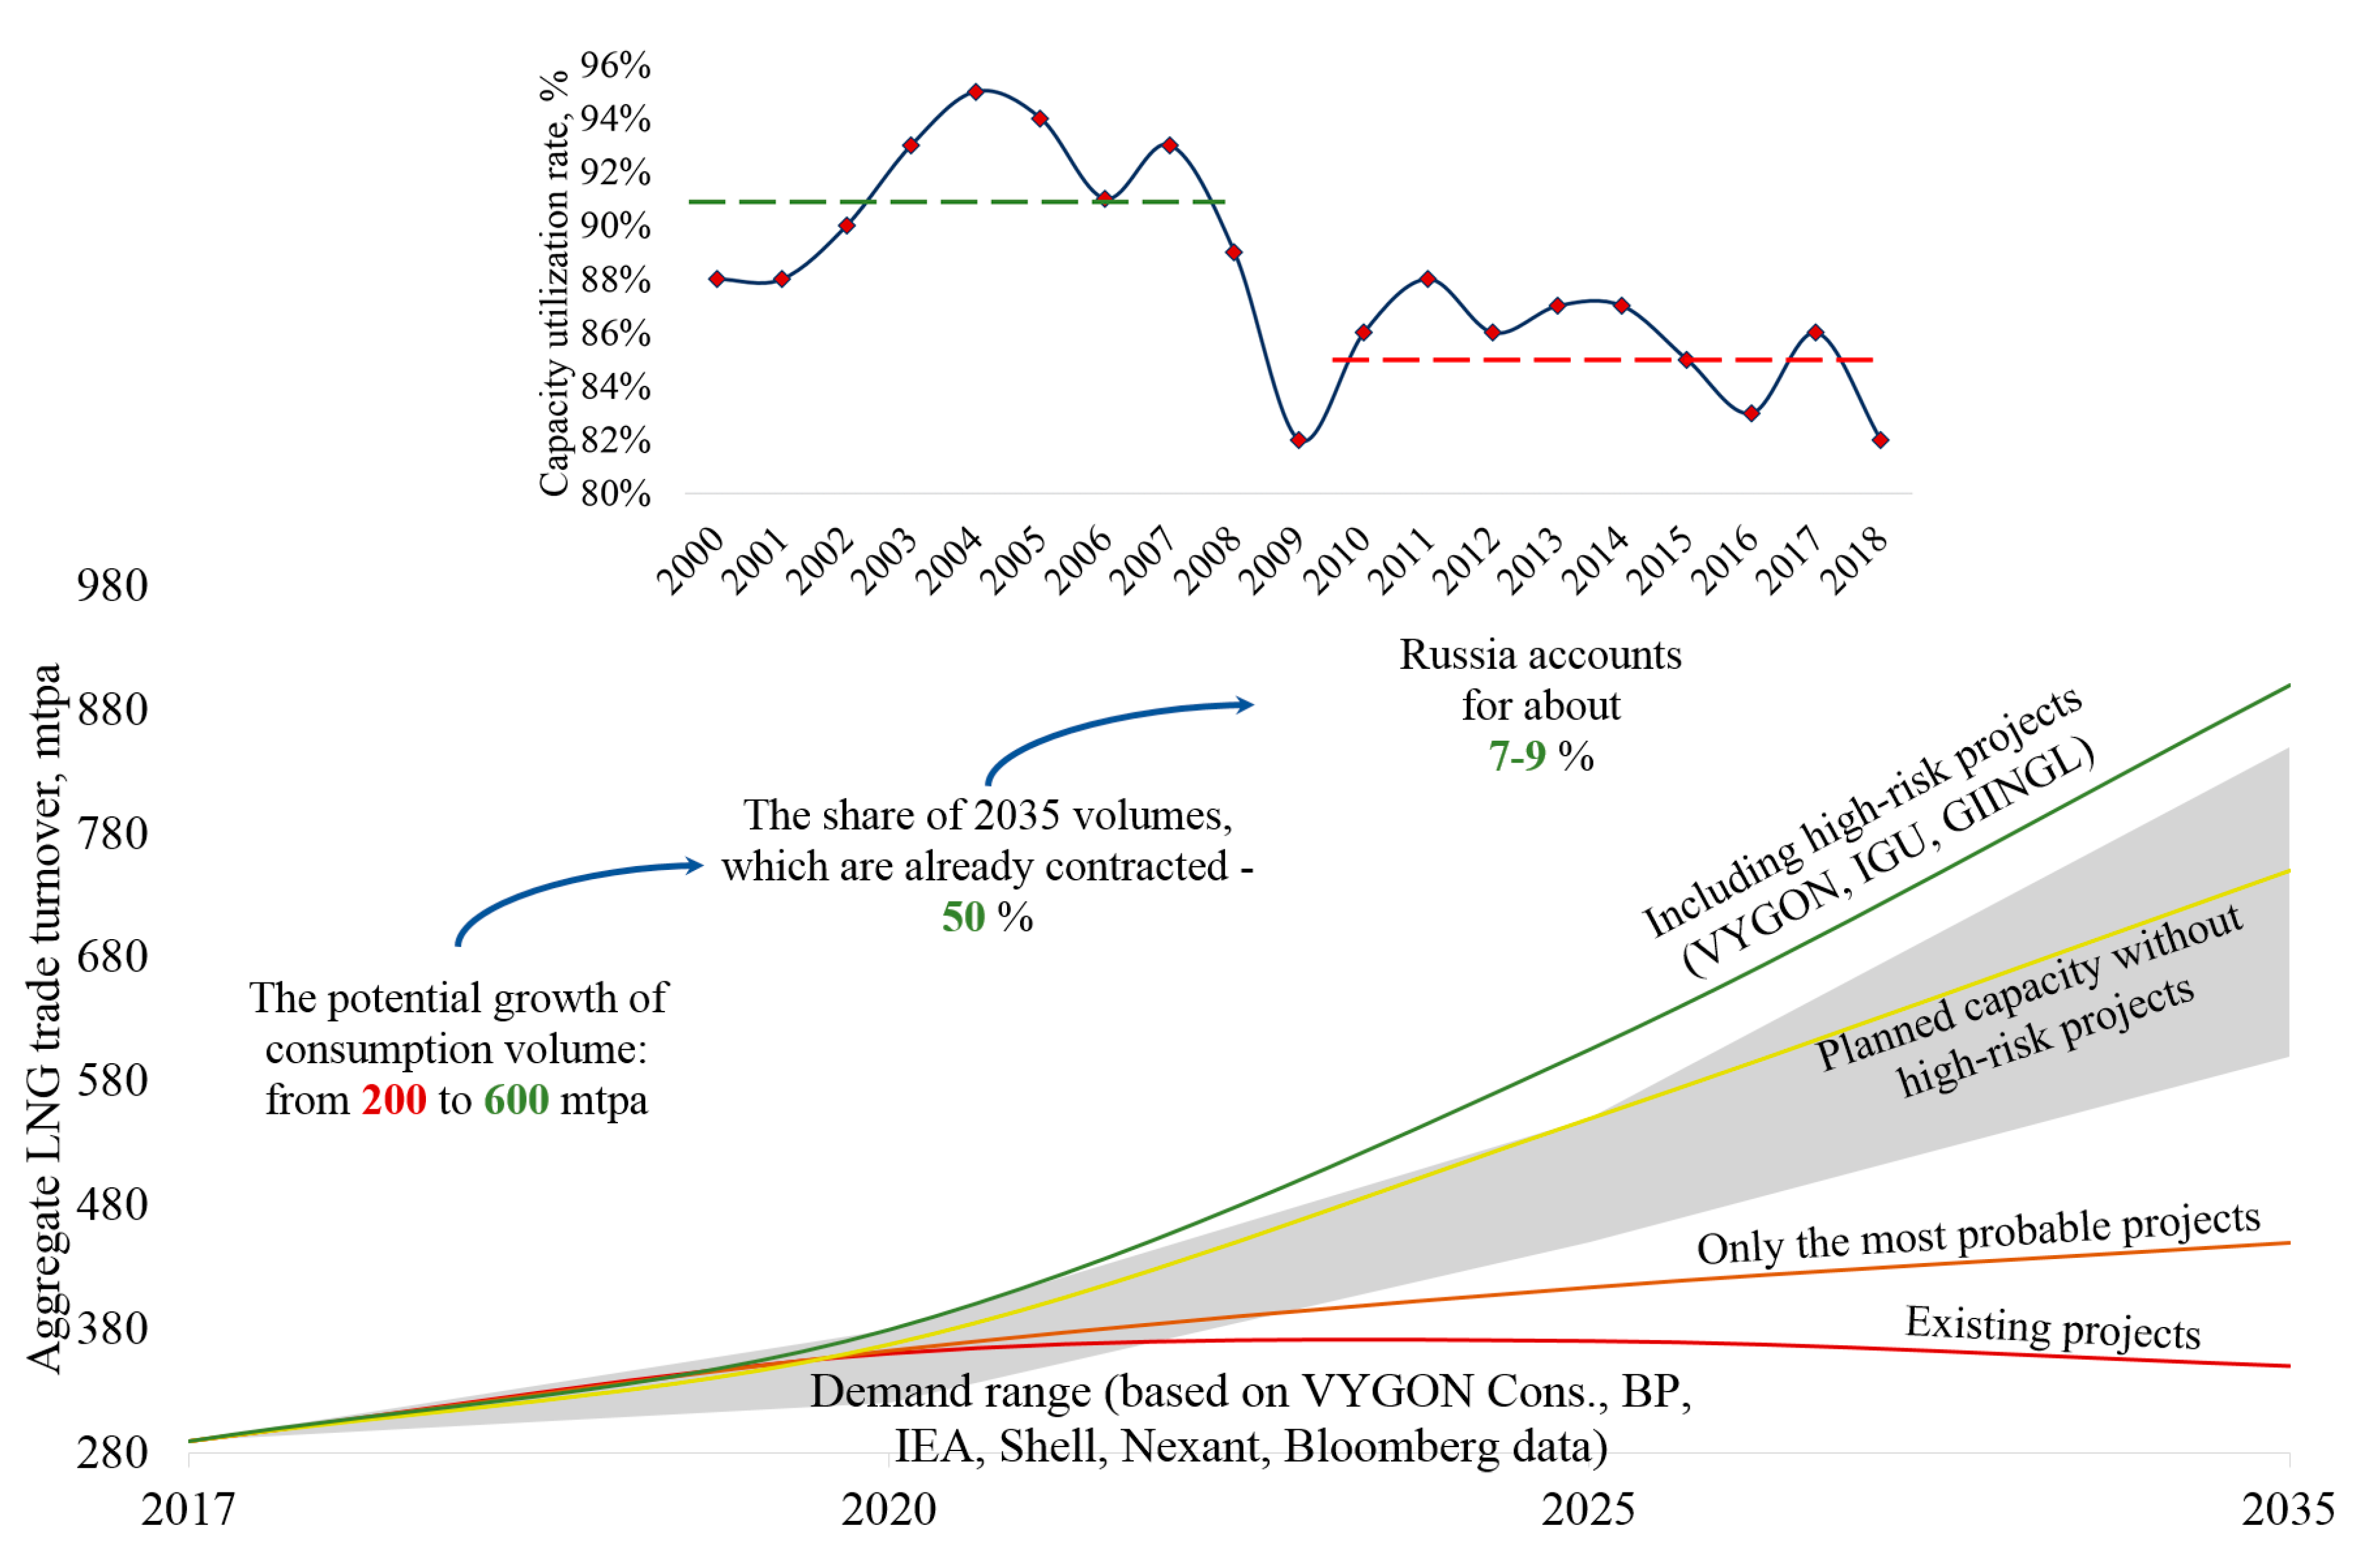
The gas industry is one of the most rapidly developing parts of the energy sector, which is mainly related to the intensive growth of capacities for the production of liquified natural gas (LNG), which have doubled every 10 years since 1998 [93]. Existing forecasts of LNG industry development provide for the increase in both demand and supply, though there is a certain probability of product surplus amounting up to 100 mln t per year [94], provided that all planned production facilities are commissioned and demand remains constant. If only the most probable projects are implemented, then by 2025 LNG shortage will amount to nearly 30 mln t. Figure 6 demonstrates these trends. Data were taken from various reports and publications of VYGON Consulting Co. [94], International Gas Union, International Group of Liquefied Natural Gas Importers (GIIGNL), and other agencies.
When planning production volumes, certain problems with capacity use should also be considered. Before the economic crisis of 2008, the average capacity use of plants amounted to nearly 91%. After 2008, increased interest in LNG industry development resulted in the redistribution of investments for the development of new projects. This caused the reduction of capacity use in existing plants. This trend may continue in the medium term, with fiercer competition and an ambition to displace the active players by creating new hi-tech production facilities.
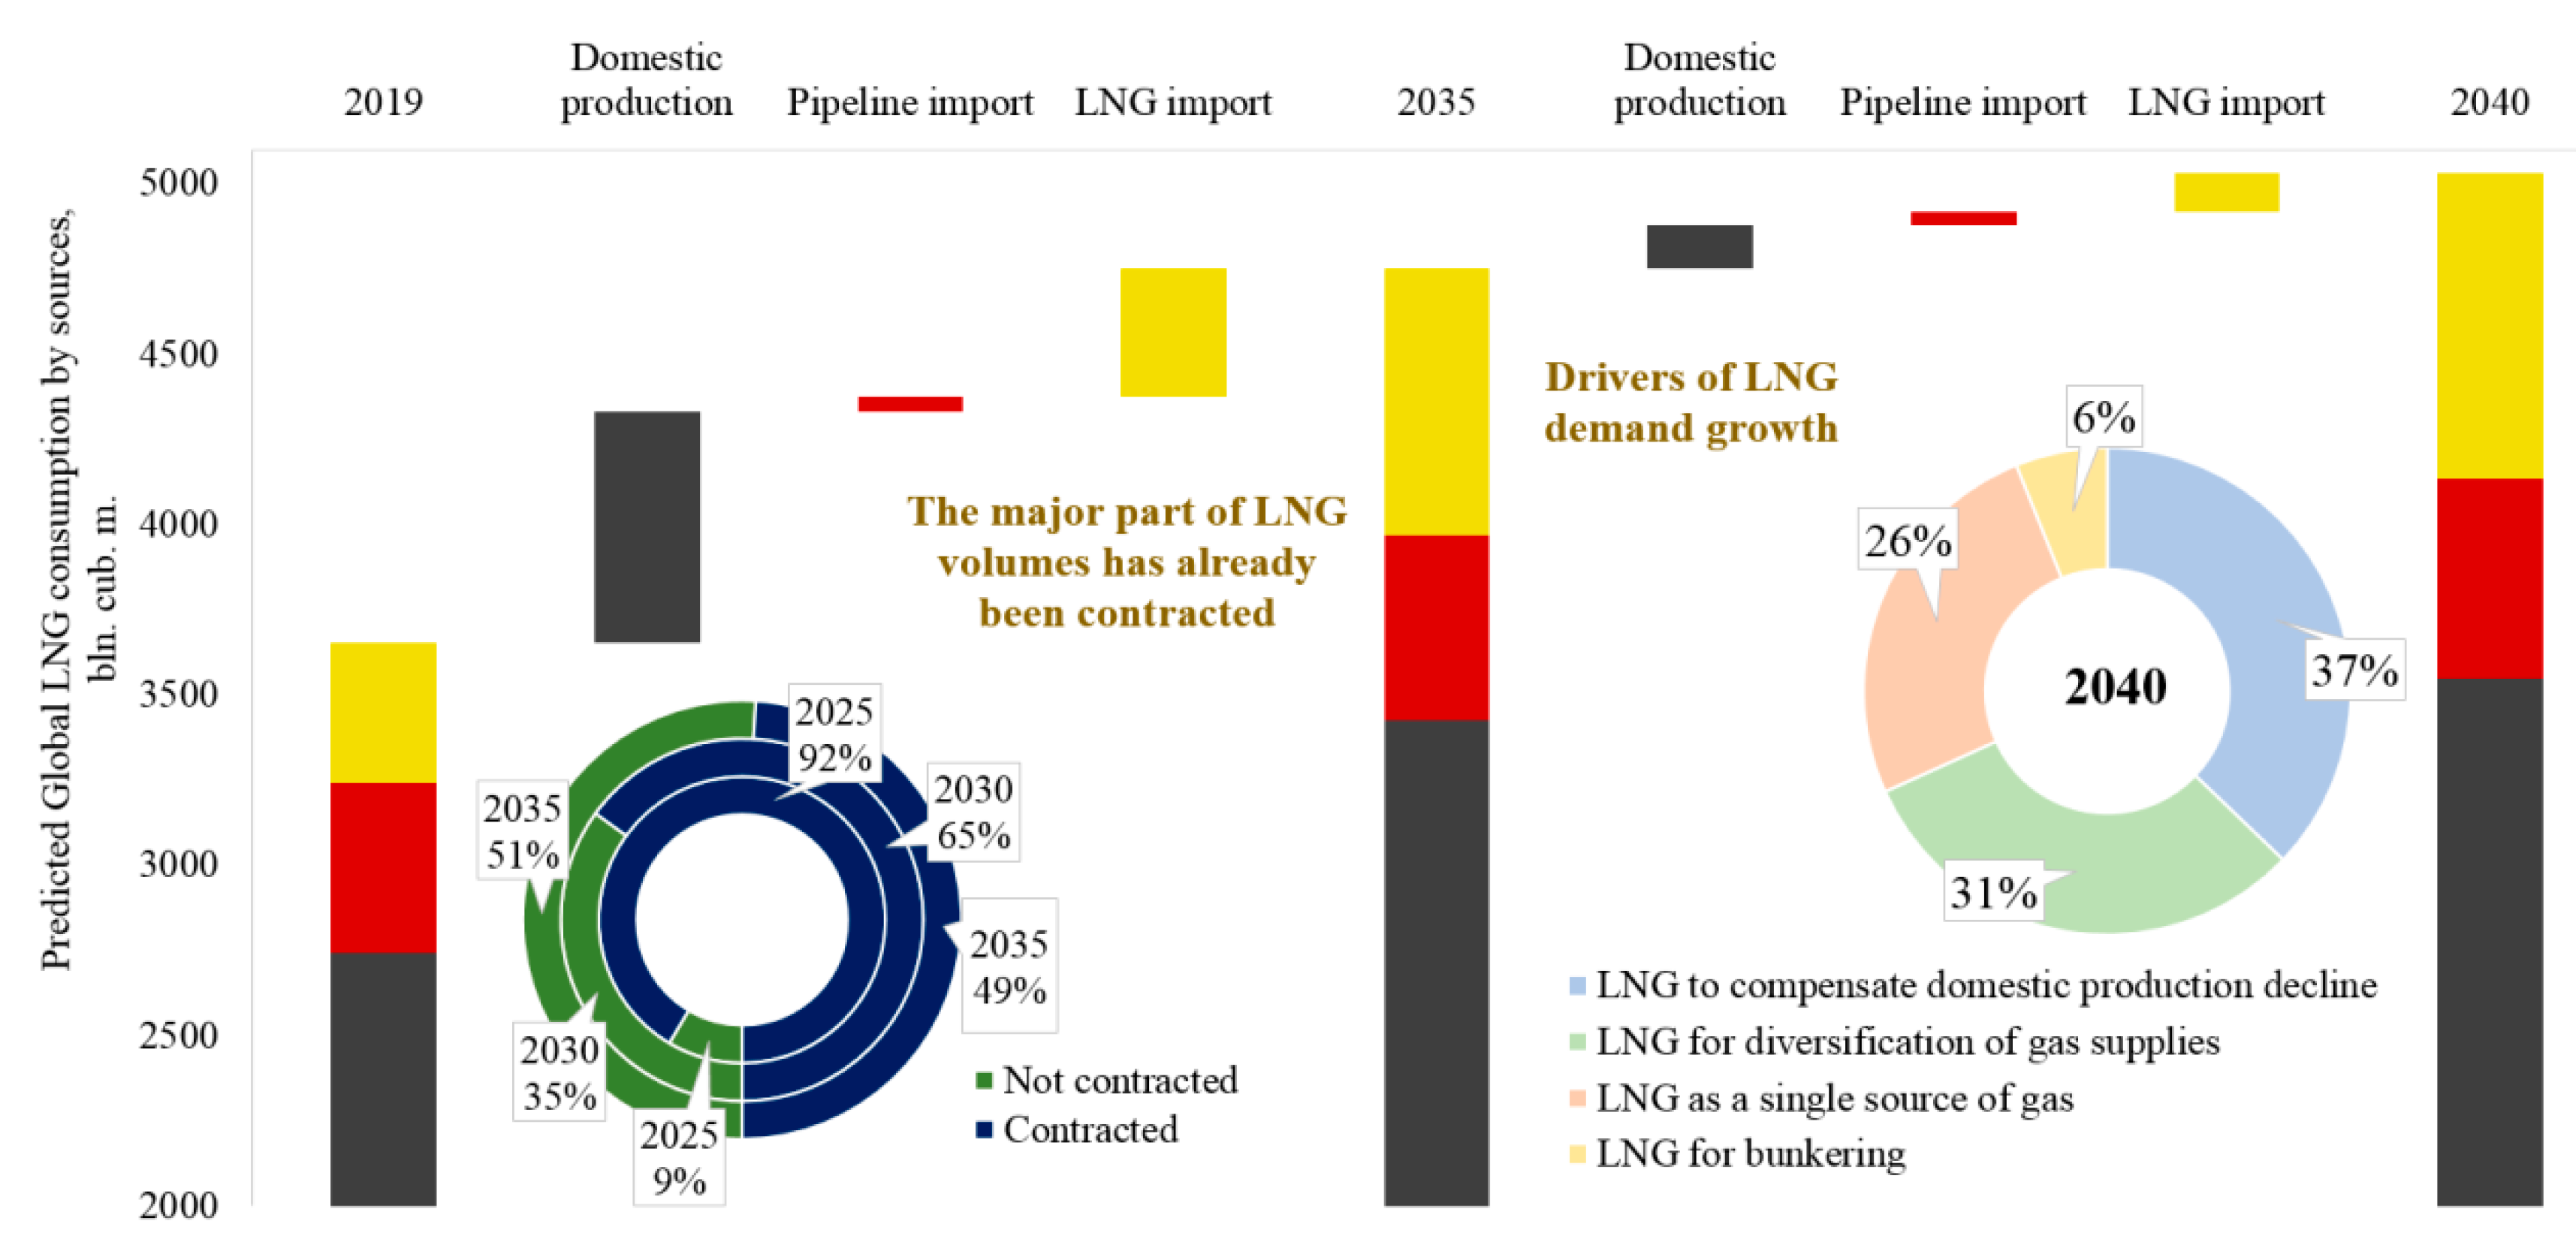
In accordance with Shell forecasts, LNG consumption may reach 800–900 bln m3 by 2040 (Figure 7); however, the main drivers of LNG demand growth are the necessity to compensate decreased domestic gas recovery and the need to diversify supplies. The reliability of the forecasts is confirmed by the fact that almost half of the prospective production capacity of LNG plants in 2035 has already been contracted (7%–9% of the contracts in Russia).
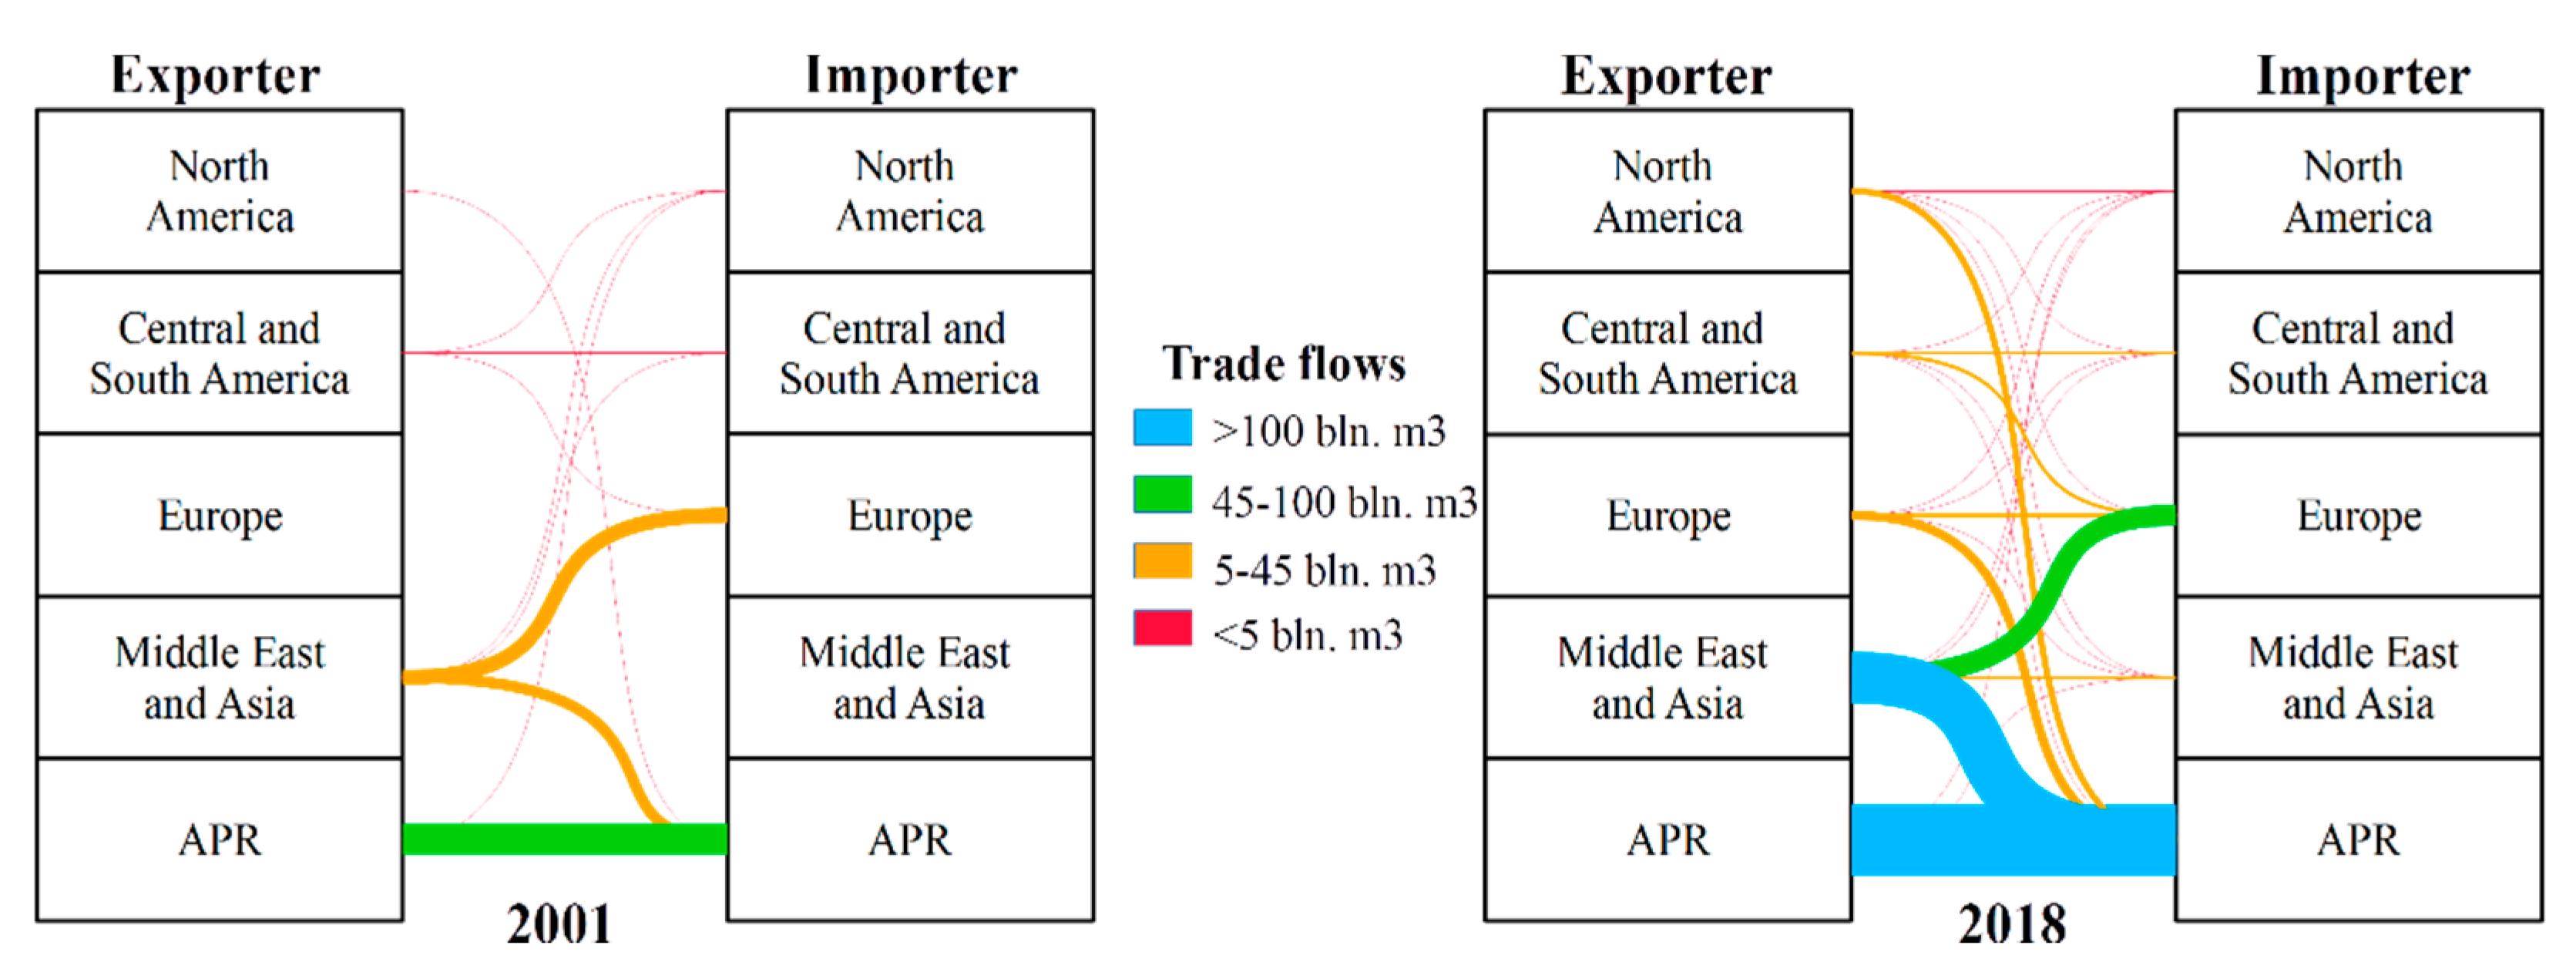
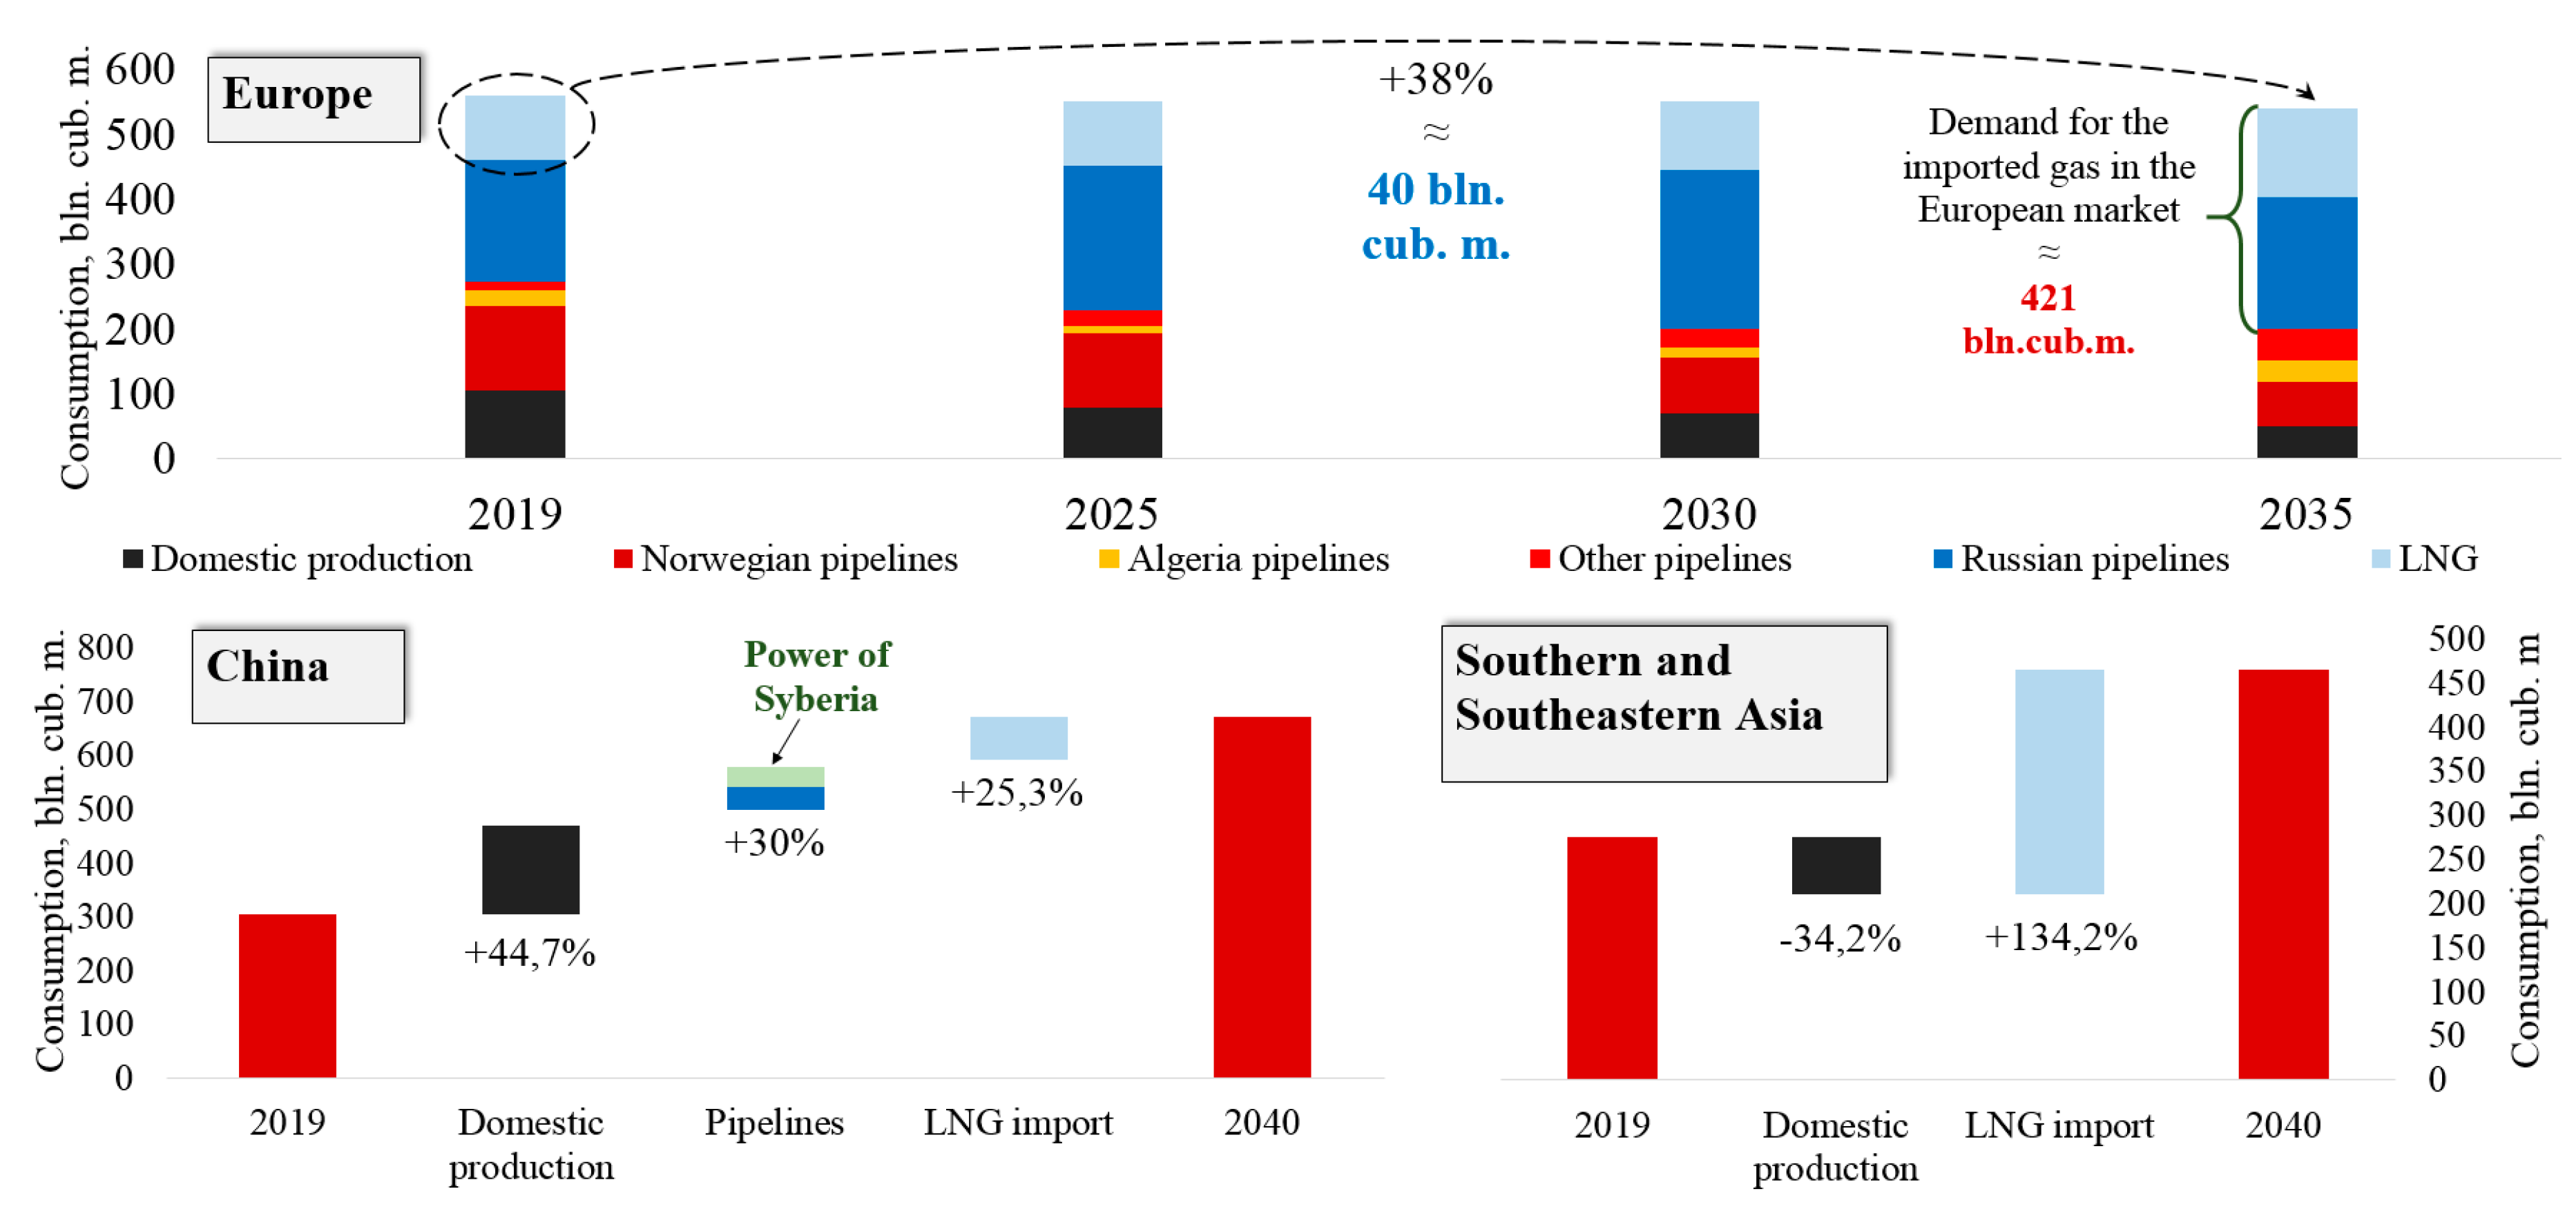
However, there is already a steady trend towards expanding the geography of LNG consumption (Figure 8), mainly due to Asia-Pacific Region (APR) countries (+220.6 bln m3), especially China (+73 bln m3).
Higher demand for LNG import in Asian countries (Figure 9) has mainly been driven by a rapid increase in energy consumption, but if the growth in China can be partially covered by domestic production (more than 160 bln m3) and pipeline supplies (nearly 110 bln m3), the countries of Southern and Southeastern Asia will mainly depend on external supplies (about 50% of expected consumption) in the near future.
In addition, the growing interest of the European Union in increasing LNG import is evident. The main reasons for increased interest in LNG in Europe are, firstly, the increasing energy needs of its countries. Secondly, a rapid decrease in the volume of domestic gas production at the Groningen field (the Netherlands) due to complex seismic conditions. While 53.87 bln m3 was produced in 2013, only 18.83 bln m3 was produced in 2018. The Dutch Government is still under pressure from the local community to completely stop natural gas production, which could happen as early as in 2022 [97]. Thirdly, a less rapid but stable decline in gas production in the United Kingdom and Norway, in the short term.
To compensate for the fall in domestic production and diversification in supplies, Europe is implementing an extensive program for the development of LNG facilities. Almost every European country with access to the sea has its own regasification terminals (15 countries), which imported 69 mln t of LNG in 2018 (15%–20% of the global market), with an average capacity use below 60% [98]. Total capacity of regasification terminals in Europe including pre-FEED projects may exceed 200 mln t per year in the nearest future [99].
4.2. The Role of Russia in the Development of the LNG Industry
The situation in the European market creates favourable conditions for increasing the share of Russian gas in the region. However, following the implementation of the “Nord Stream-2” (+55 bln m3 per year) and “Turkish stream” (+31.5 bln m3 per year) projects, a further growth in Russian pipeline gas supply seems unlikely, thus opening extensive prospects for the development of LNG. This suggests that Russian pipeline gas and LNG are not competitors on European markets.
At the same time, it is a mistake to believe that Russian gas supplies to Europe are completely protected from competition with the USA. In March 2020, the price of natural gas in the USA (Henry Hub) was 1.79 $/MBTU, and in the European market about 2.72 $/MBTU. When a spread of 2 or more $/MBTU is reached, LNG supplies from the USA could be profitable, and this situation has already been observed in 2017–2019. Given that gas consumption in Europe will grow at an accelerated pace in the coming years, it is likely that prices will rise, and competition risks will increase. This indicates the need to take urgent measures to increase the competitiveness of Russian natural gas export.
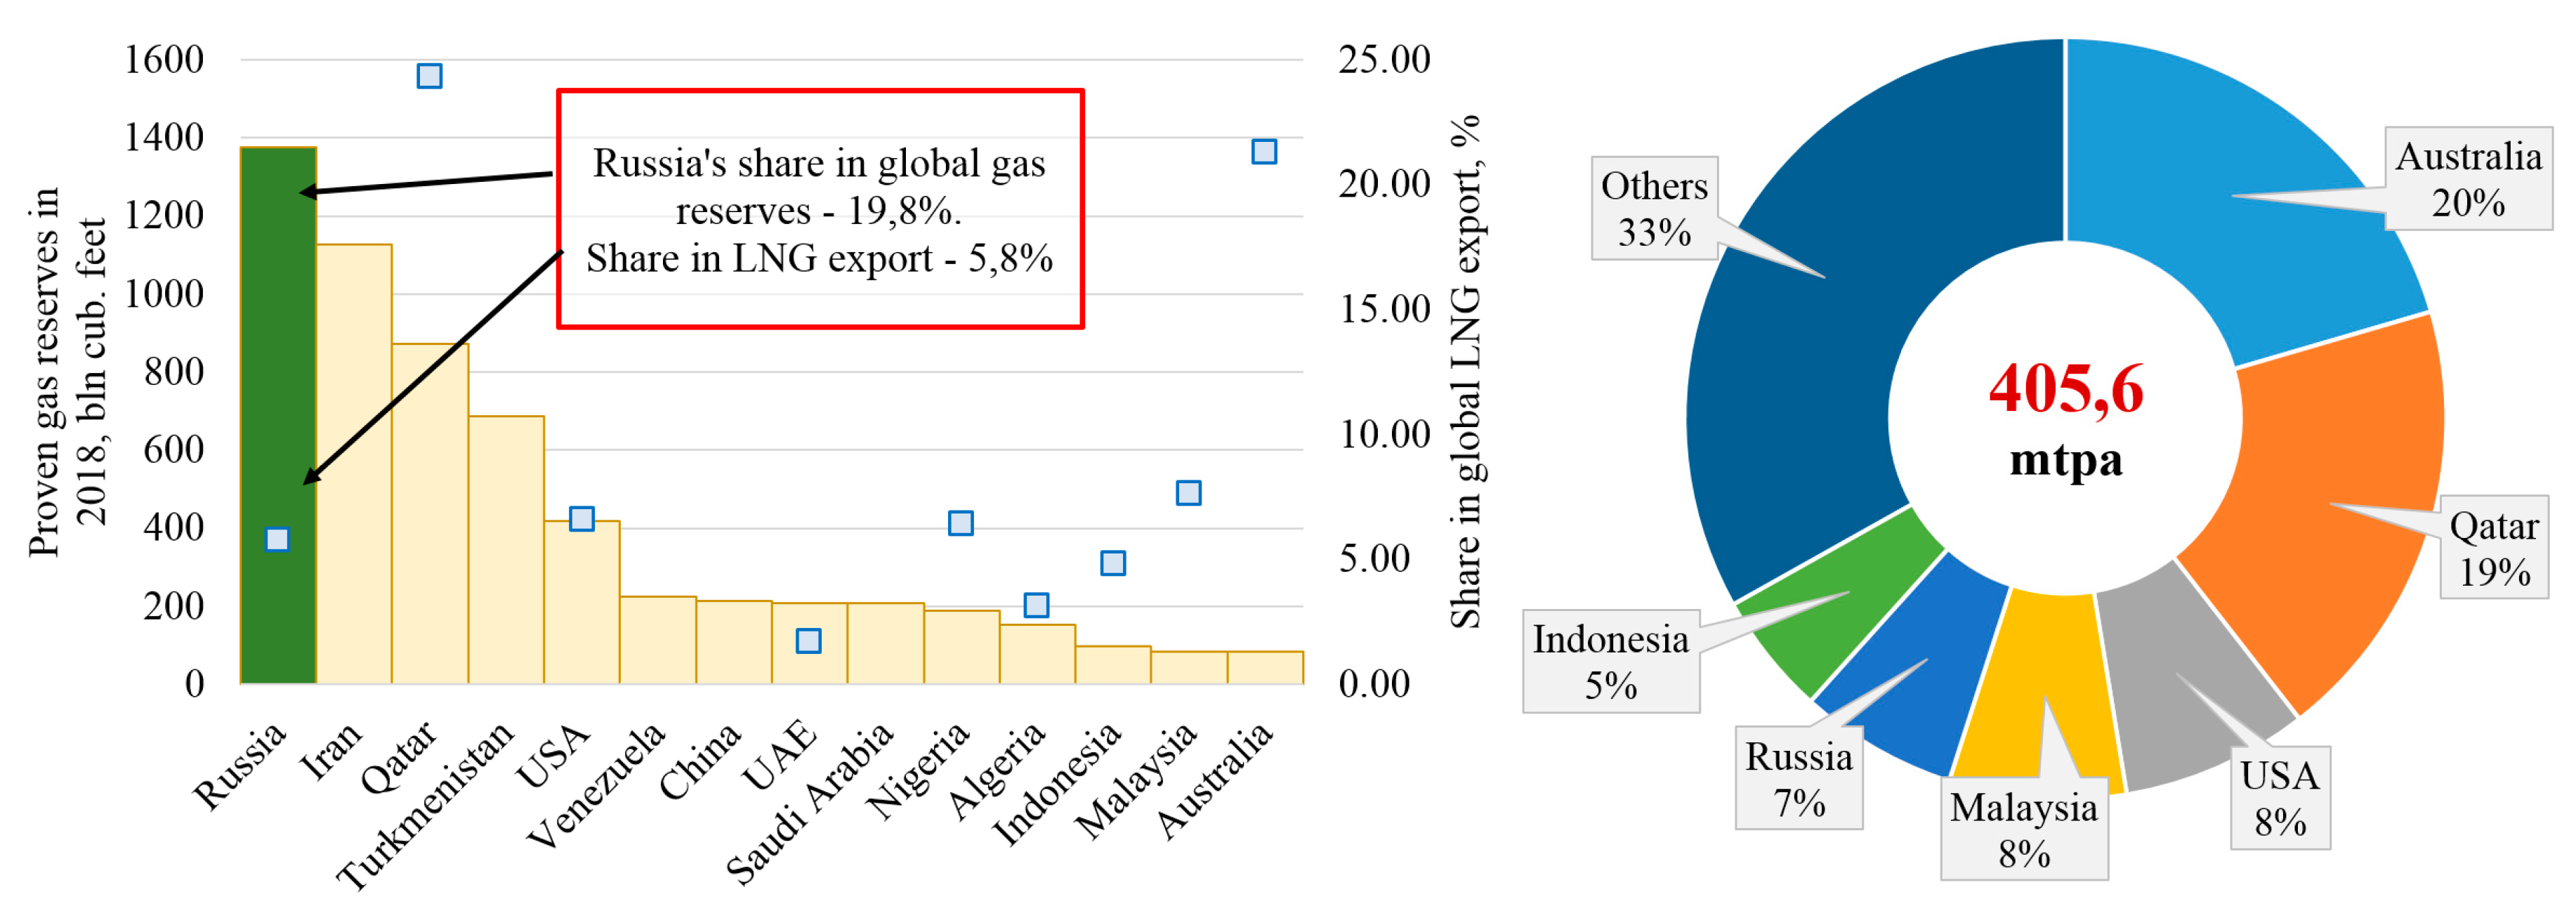
It is remarkable that even today a significant share of the increased LNG import to Europe is accounted for by Russia (with a more than 18% increase in 2018–2019), which has exclusively been regarded as pipeline gas supplier. The current situation demonstrates the inadequacy of this preconception, despite Russia’s share in the global export of LNG, which is still relatively low (Figure 10).
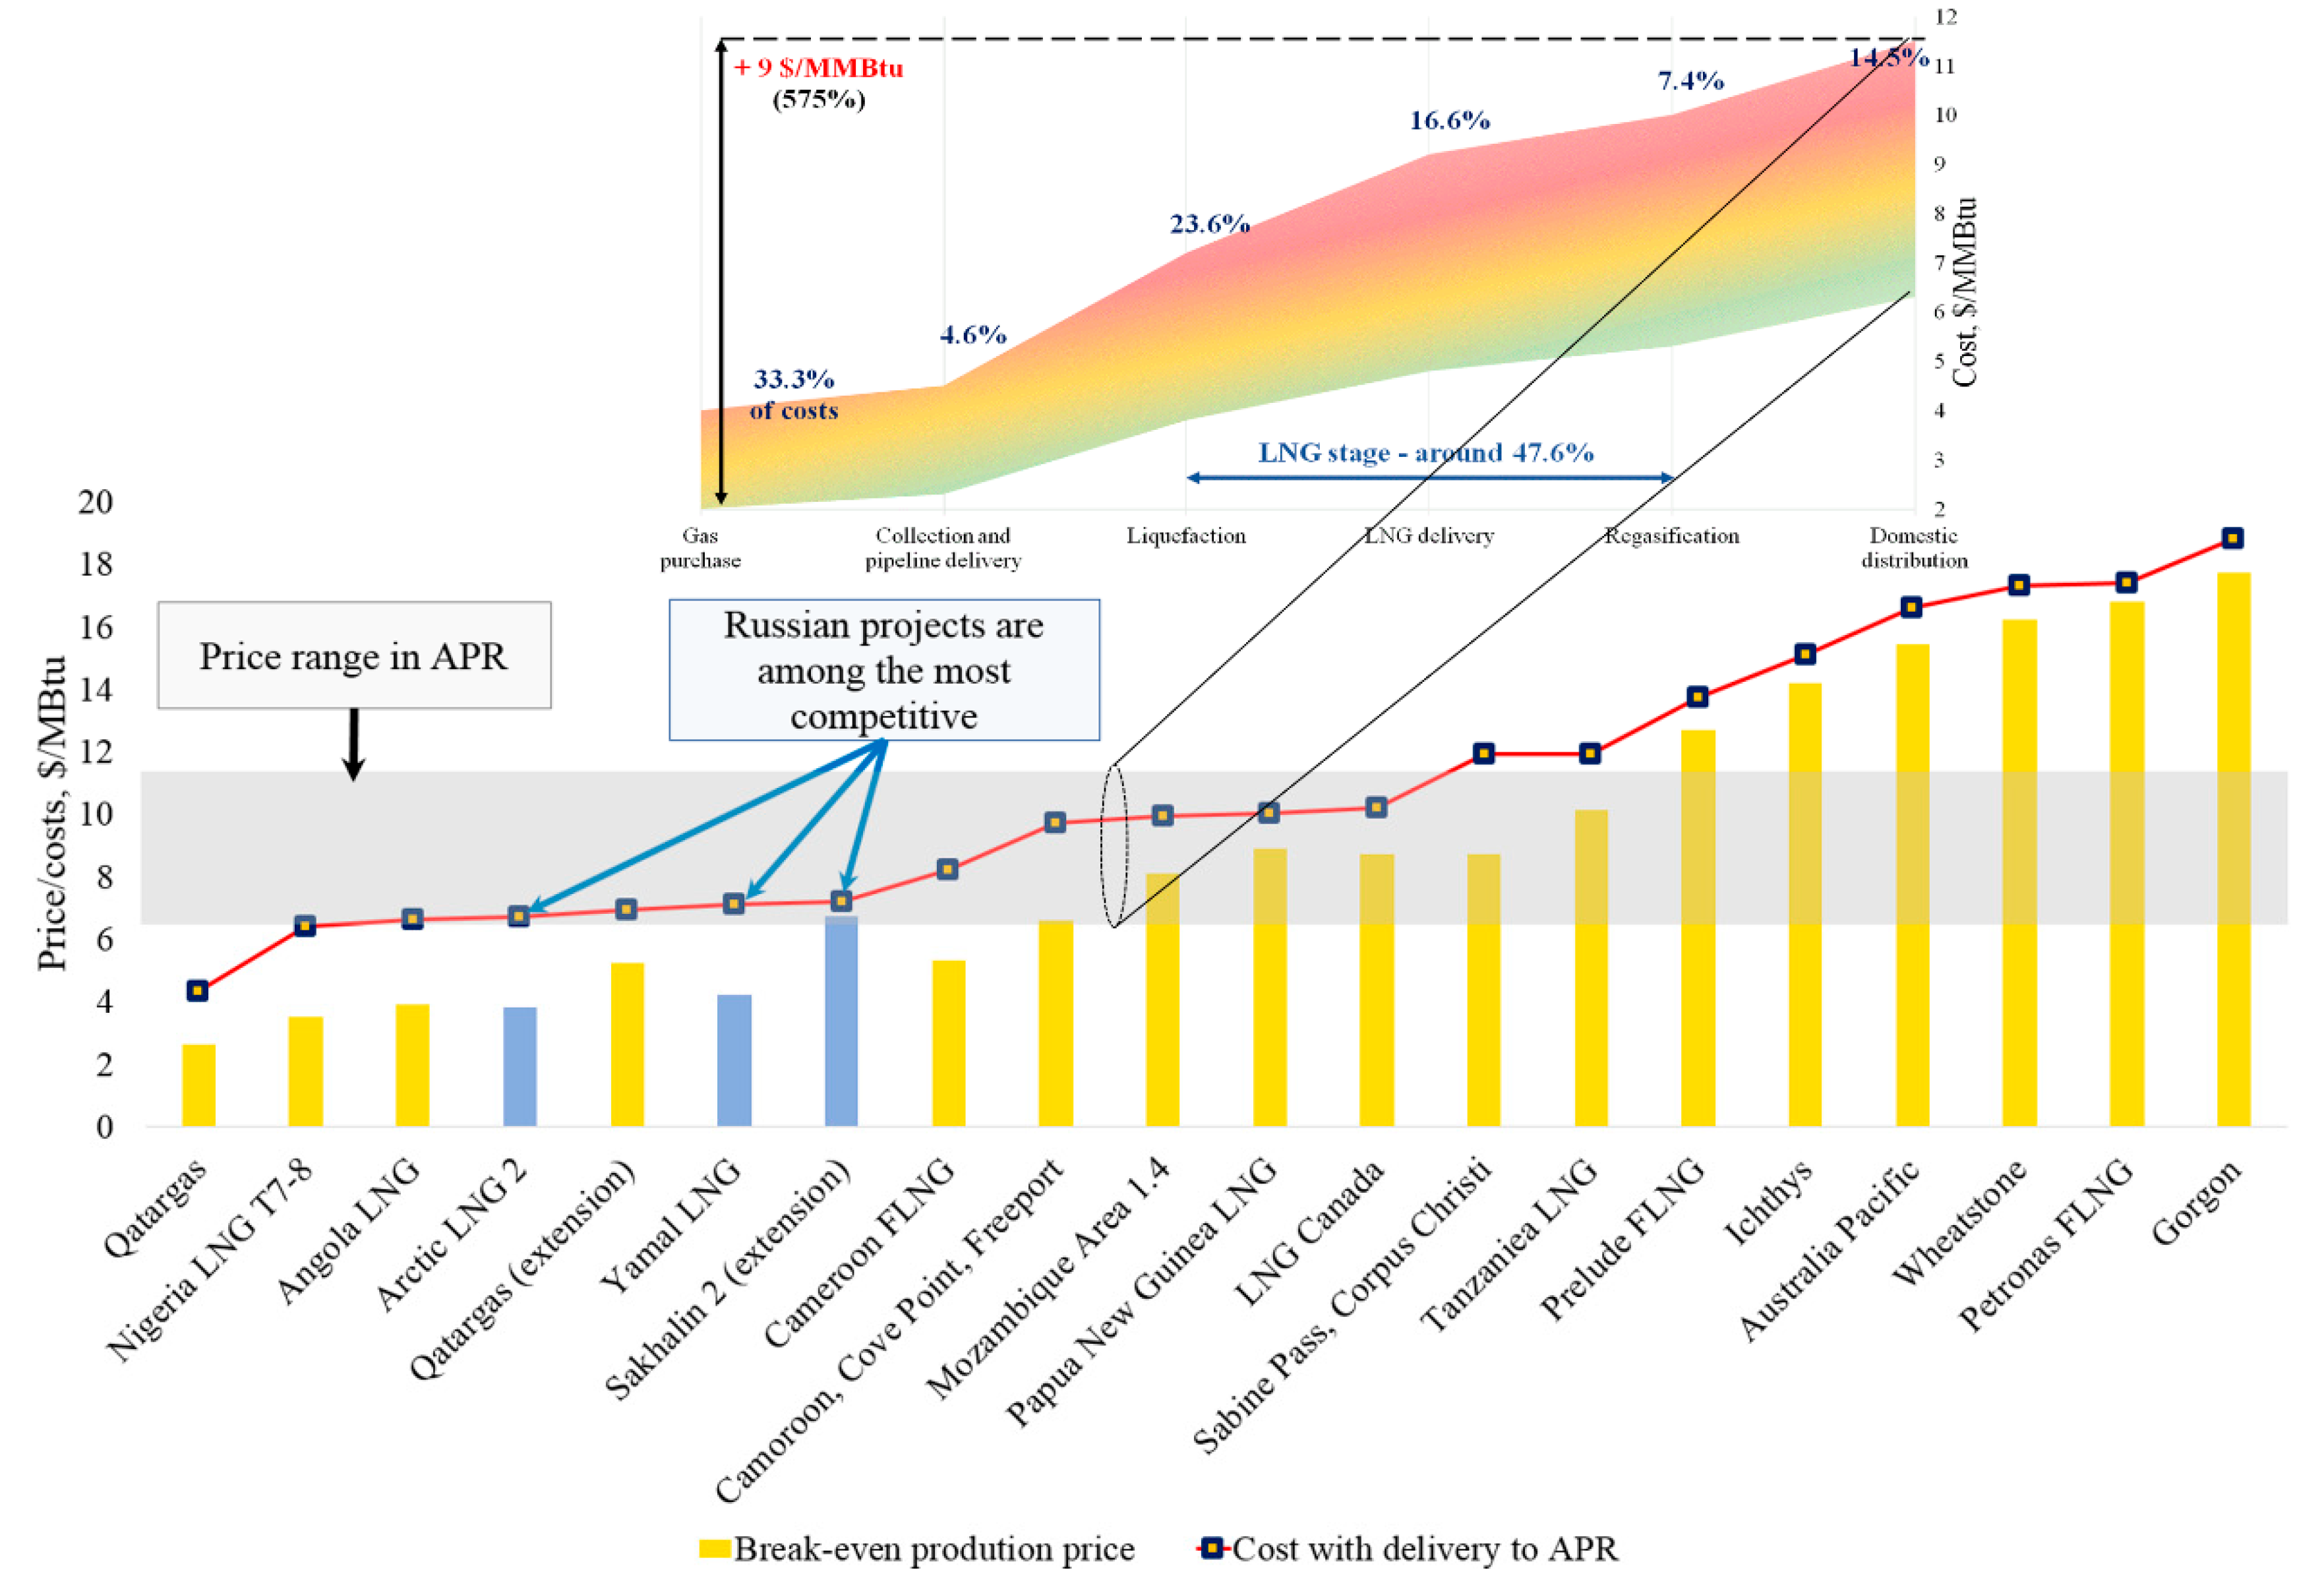
Similar prospects are also seen in Asian markets, the entry to which for a long time was only associated with the “Power of Siberia” (38 bln m3 for export) project development. However, as shown in Figure 9, the share of the project is just a small part of the potential growth of China’s gas consumption. Additionally, the markets of Southern and Southeastern Asia will be 50% supplied by imported LNG, which may be a favourable factor for Russia, since the efficiency of LNG production at Russian plants is among the highest in the world. This can be seen when comparing the cost of final products with delivery to APR (Figure 11).
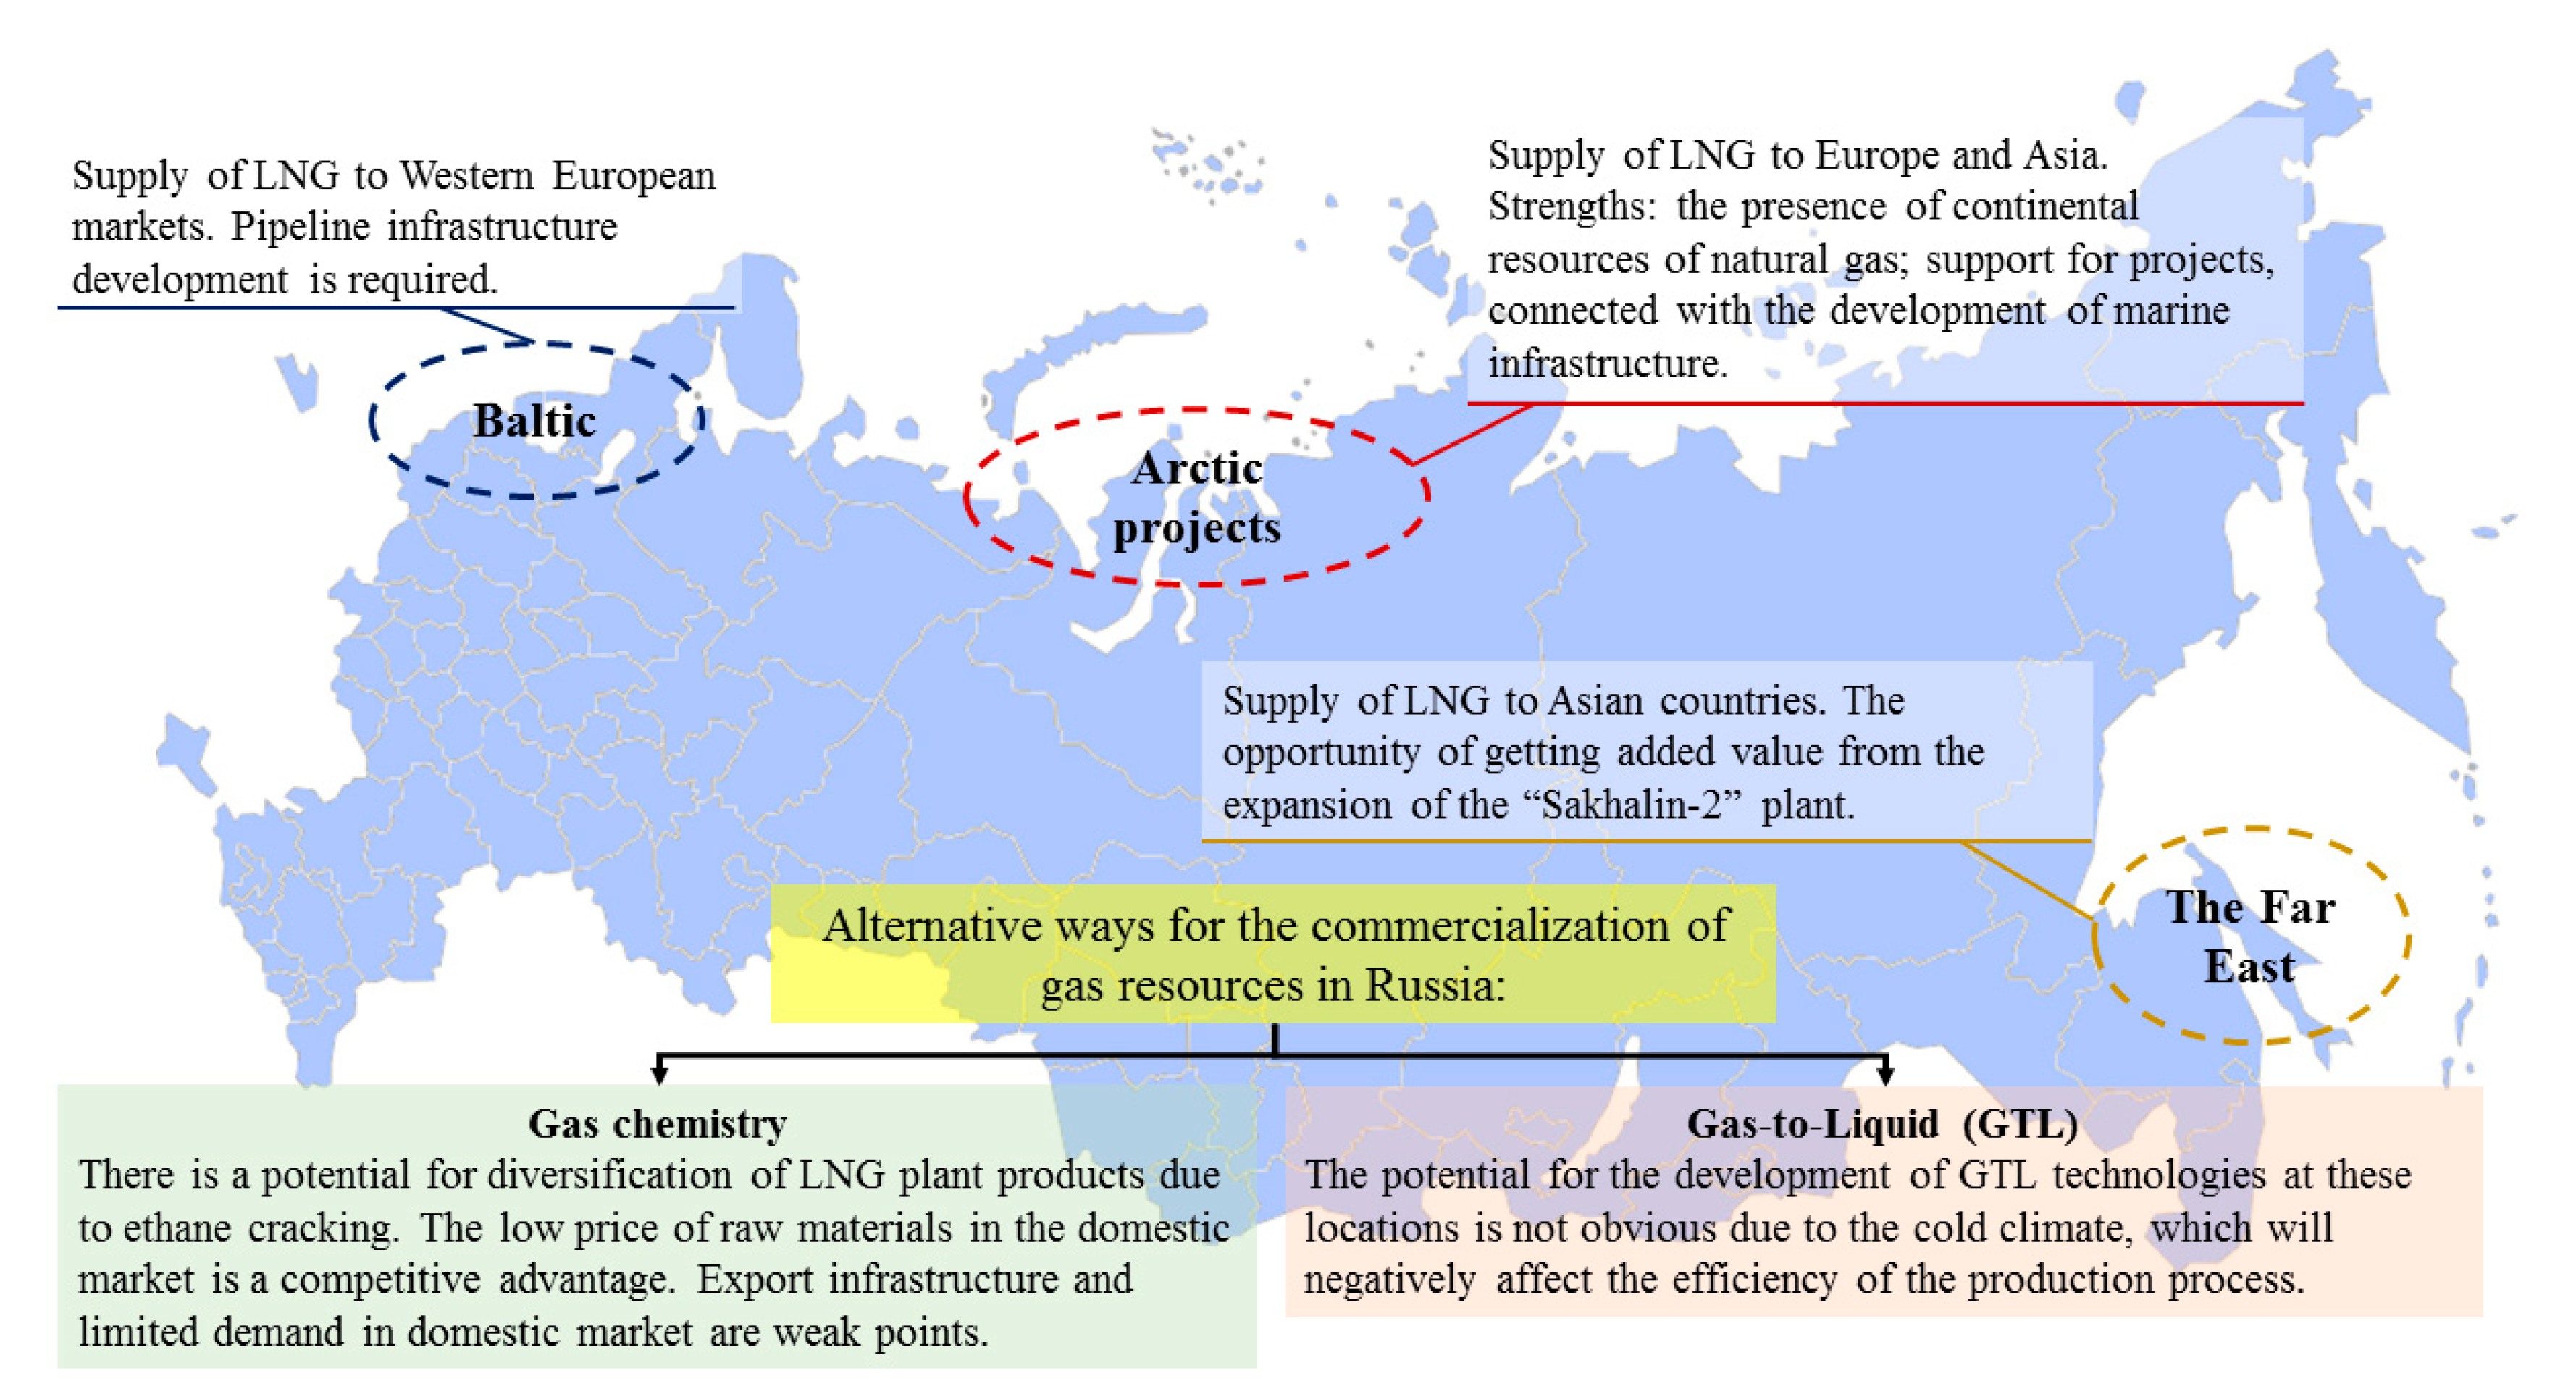
As a whole, Russia is implementing an extensive program to develop production capacities and to realize the potential of the LNG industry on global markets. By 2025, the total annual capacity of plants will amount to 61 mln t, excluding low-tonnage facilities, and by 2035, about 140 mln t [101,102,103,104,105]. In total, there are three key centres of the growing gas industry in Russia (Figure 12): the Baltic region (with a focus on Europe), the Far East (with a focus on Asian market), and Arctic regions (with a focus on both Europe and Asia).
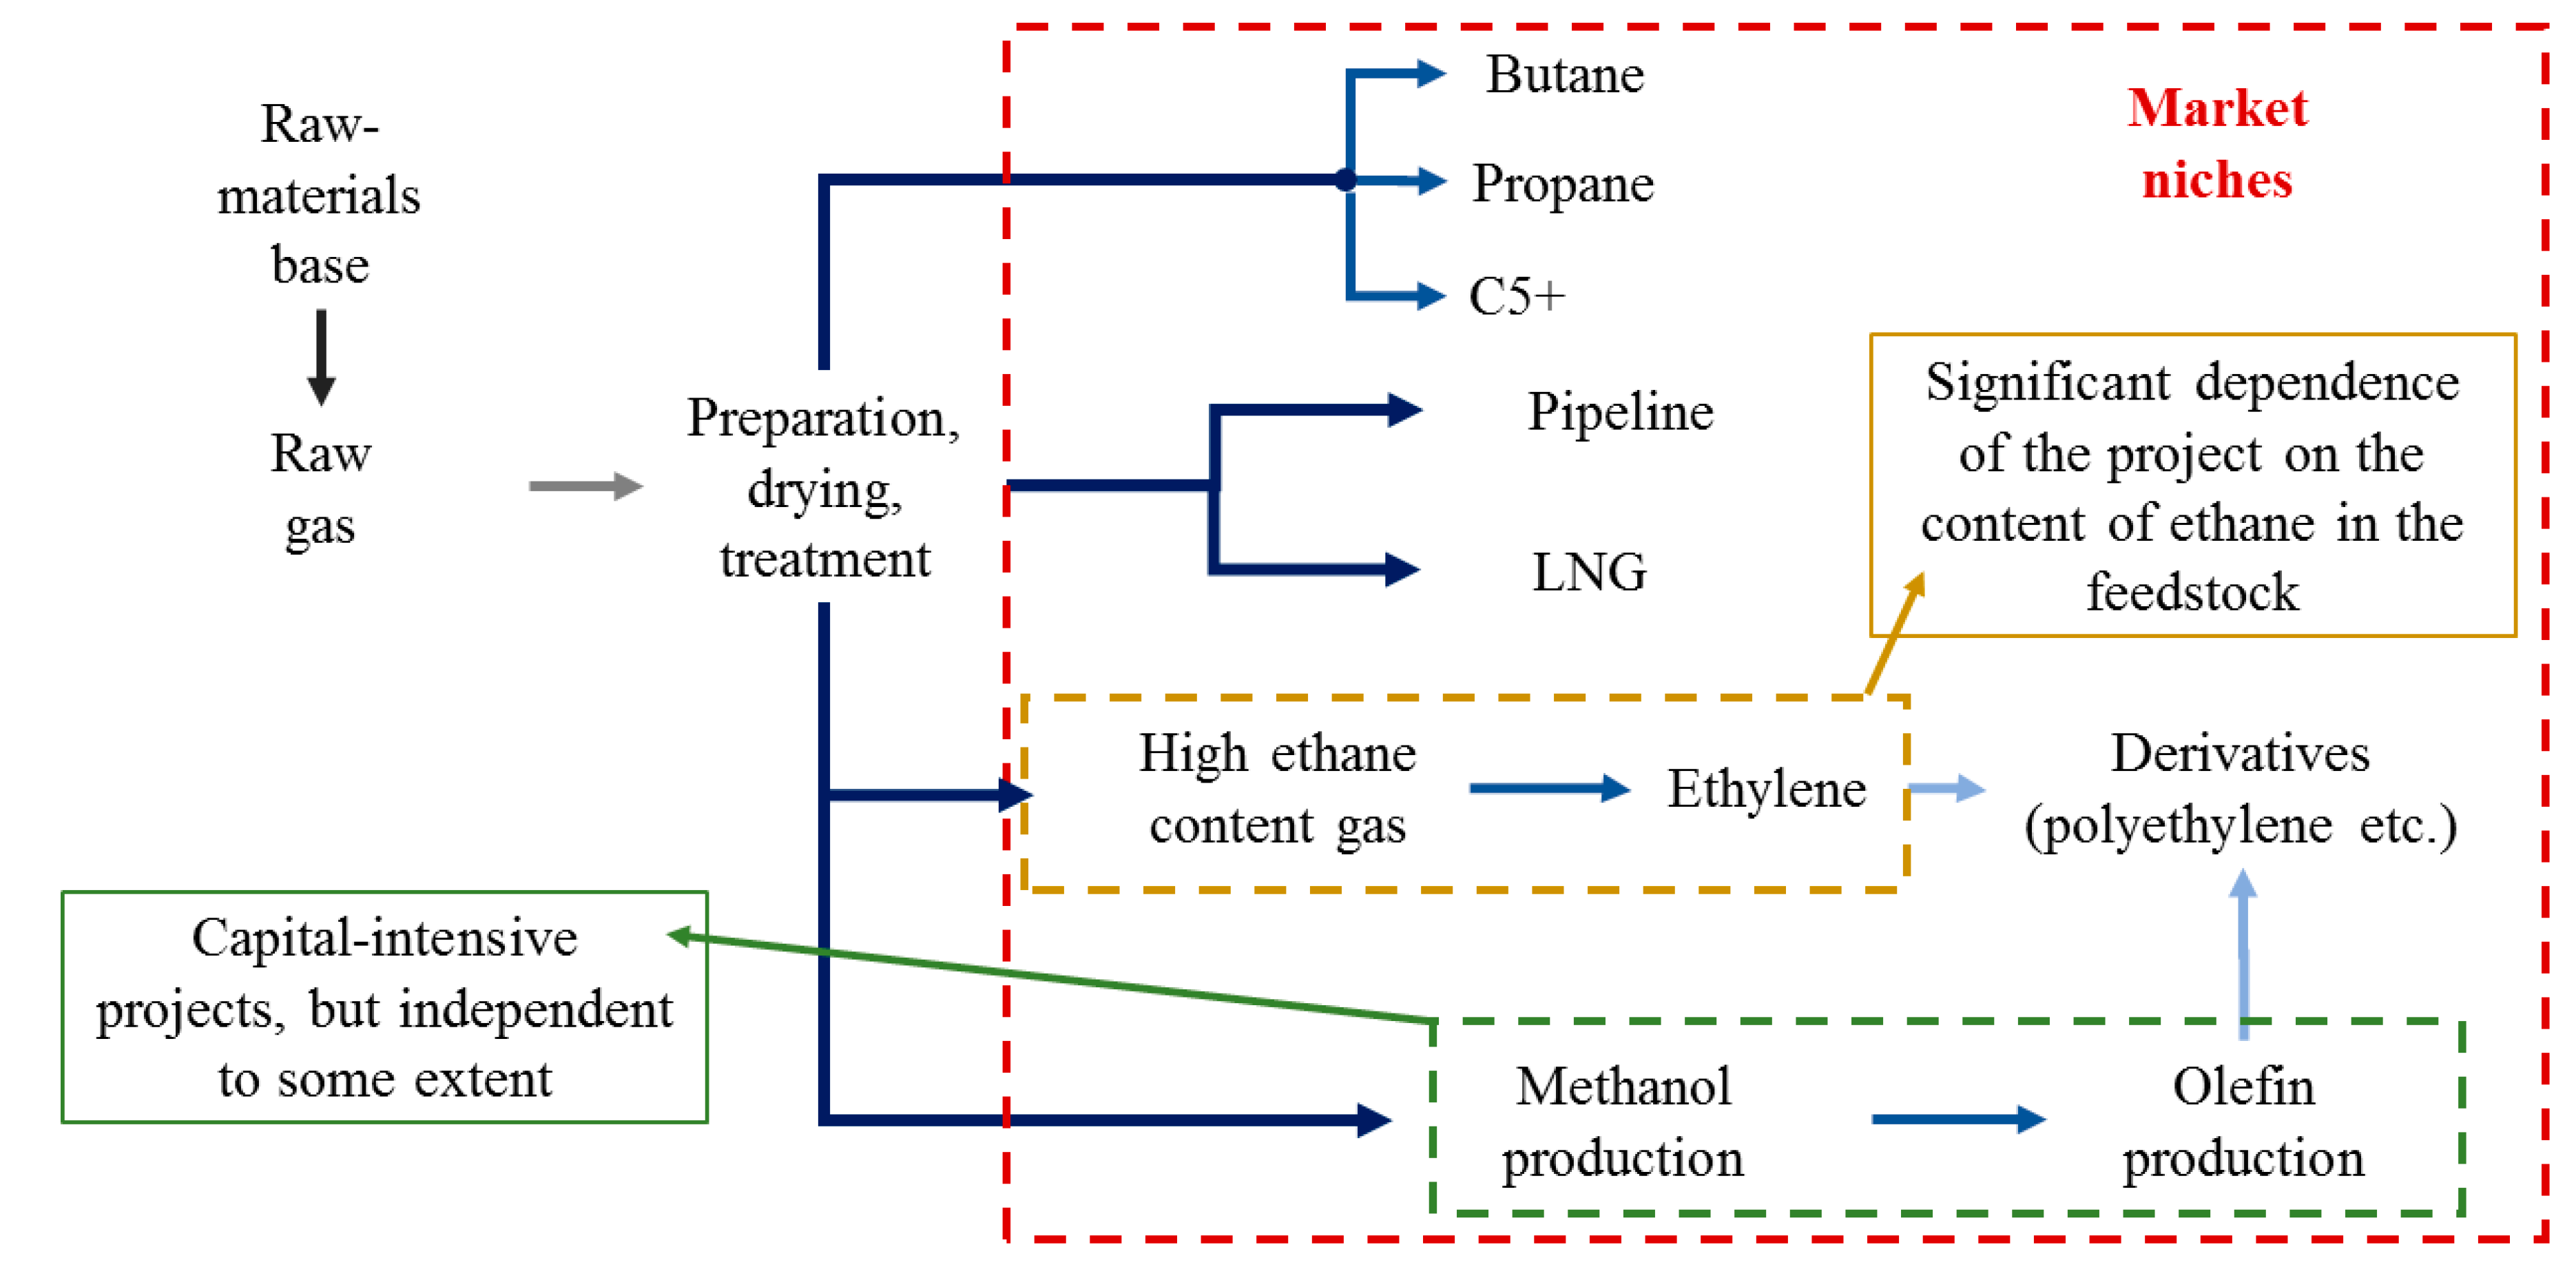
A basic factor for the development of these growth centres is to define efficient methods for monetization of gas industry products (Figure 13). Based on the current level of technological development, it can be concluded that LNG production is very promising and can be diversified due to gas chemical enterprises, which currently have a capacity use level below 65% [108]. This is due to a lack of export infrastructure and limited demand in the domestic market [109]. On the other hand, the forecast for the development of the methanol production industry alone is indicative of potential market growth by 50% before 2025 [110].
To ensure the stability of gas monetization schemes, it is necessary to ensure the stability of the raw materials base for such projects for at least 25–30 years, both through their implementation at the most promising existing fields and through the search for new sources of raw materials, which is normally associated with the Arctic regions being quite an ambiguous factor.
On the one hand, the potential resources of natural gas in the Arctic amount to nearly 30% of the global volume [111]. However, a major portion of the resources is concentrated in the Western part of the Russian Arctic zone [112], which will enable the supply of plants with volumes of raw materials sufficient to produce around 150 mln t LNG per year. This will theoretically ensure nearly 30% market growth. The location is also favourable, as it will allow entry into both European and Asian markets, as well as contribute to the development of the Northern Sea Route, which is important for the social and economic development of all Arctic regions.
On the other hand, implementation of projects in the Arctic is a very labour- and capital-intensive process due to the influence of natural, climatic and infrastructural factors, the mitigation of which requires state support. Moreover, the unit costs for Arctic hydrocarbon production projects may be 2–10 times higher than that in Southern regions, especially at offshore deposits [113]. The development of practical solutions to reduce the cost for the development of such fields [114] will be one of the main drivers for the development of the Arctic hydrocarbons.
5. Conclusions and Discussion
5.1. Global Energy Markets
The influence of the fuel and energy sector on the global economy is impossible to overestimate, because energy is a basis for the development of enterprises, industry and society as a whole. Today’s transformation processes in the energy sector need thorough control and attention from international regulators, as they are knowledge- and capital-intensive.
The allocation of significant volumes of financial, human and material resources for the development of alternative energy technologies is an integral part of the technological process [115], as confirmed by several studies in the field of building strategies and policies for the development of technological niches [116]. However, it should be understood that balanced political strategies must pay attention not only to projects with prospects in future decades, but to current operating and tactical needs.
In other words, instead of implementing a unilateral and comparatively simple policy of supporting one group of technologies, today’s infrastructure and dynamics of markets should be taken into account. Scientifically substantiated portfolio strategies should be developed [117] to include not only potentially promising technologies, but also to take current economic needs into consideration. The strategies should also determine methods and procedures for a smooth transition from the traditional use of HCR to its advanced conversion and gradual transition to alternative energy technologies, as soon as they are ready and competitive.
Creation of favourable conditions for the rational use of HCR may ensure sustainable development of the fuel and energy sector and, more importantly, may create conditions for the development of alternative technologies. This thesis is confirmed by the existing investments of the largest oil and gas companies [118], while the reverse process is impossible under current conditions due to the low competitiveness of alternative energy options.
This study tried to expand the discussion field formed around energy sector development and balance it with critical analysis of existing image of HCR. The following conclusions were made on the basis of this analysis:
- Today we face a paradoxical situation. International corporations and politicians calling for the need for an immediate transition from HCR to alternative energy technologies. However, the real activities of leading global economies show that they are not planning to decrease their footprint in the hydrocarbon energy sector and, moreover, they are expanding scientific and technical potential in geological surveying and the production of HCR.
- Environmental protection is one of the main barriers to sustainable development in the energy sector, which is unlikely to be eliminated within the next few decades due to our current level of technological development. The risk of climatic catastrophe is extremely high. At the same time, the lack of knowledge of the secondary theories of Global Warming mechanisms makes this issue even more complicated. On the one hand, we could have a chance to receive extra time to improve the environmental efficiency of our technologies. On the other hand, there is a risk that it is too late, and we will see the forecasted consequences much earlier than expected.
- The most promising alternative energy options include RES, nuclear energy, and hydrogen. Theoretically, each of these resources is able to solve the HCR environmental issue, but there are some concurrent critical disadvantages that prevent them from being a complete alternative in the observed future:
- -
- the majority of RES-based technologies will be non-competitive within the next ten to twenty years due to insufficient efficiency of energy conversion and storage processes;
- -
- the generation of nuclear energy is associated with significant risks of a mainly technical (environmental) nature, mitigation of which is impossible at present;
- -
- hydrogen itself is not an energy resource, as much as a method for storage and transportation of primary energy and its broad application requires a solution to safe-storage and transportation issues, a higher efficiency of production, the creation of new infrastructure and the development of market-interaction mechanisms.
- The global resource potential of the oil and gas industry as a whole is able to ensure the sustainable development of the world economy under the conditions of a better investment climate and the formation of an international regulation system for the sector. Here, special attention must be paid to ensuring good conditions for the development of hard-to-recover reserves in terms of geological and environmental factors.
- The vector for the development of oil and coal sector has shifted towards integration with the chemical industry to enable the diversification of sectoral enterprises activities, but their role in the energy sector will not be reduced within the next few decades.
- LNG production is the independent sector of the gas industry with the highest expansion potential in the long run. First of all, this can be attributed to the environmental and economical properties of LNG, which enable its consideration as a “win–win” solution for energy supply to satisfy even the strict requirements of European Union. Moreover, the flexibility of LNG logistic chains compared to pipelines is a very important factor.
Therefore, a comprehensive assessment of the potential for the implementation of new energy technologies shall be made in view of the needed preservation and development of the foundation of energy that is HCR. It should be noted that there has been no situation in the history of the energy sector in which new technology has completely displaced and substituted an older technology within a short period of time [119]. Gradual substitution is a conventional process that can be implemented at various rates, but on a long-term basis. Due to this, the immediate transition from HCR to alternative energy sources is not possible. The development of studies based on the agenda proposed in this article would create more realistic, viable and scientifically substantiated recommendations on the formation of climatic and energy policies, which are lacking today [120].
5.2. The Role of Russia in the Development of the LNG Industry
Russia has significant resource potential to develop LNG plants with a prospect to reach 140–160 mln t production capacity by 2030 (20% of the global market). Such intensive growth can be driven by limited prospects in the increase of Russian pipeline gas supplies to European countries as a result of the export’s monopolistic nature.
Export monopoly is not only a barrier to entering foreign markets, but also prevents the creation of a competitive environment within the industry. Due to this, its rate of development is much slower than the worldwide average values, which is indicative of the stagnation of the sector.
Today, the export monopolization factor does not yet negatively affect the LNG industry. However, promising markets mentioned herein could be closed for Russian companies, if the situation with state regulation of the sector remains unchanged.
In this context, the speed of decision-making is crucial, and governs what share of markets Russian companies will be able to occupy. Taking into account the fact that nearly 50% of the designed capacities of LNG plants has already been contracted until 2035, it is quite realistic that after 2025, the second part of demand will be covered for the next decade, and it is unlikely that there will be potential for new companies to enter the market.
A transition to market methods for regulating industry activities seems necessary and timely, since direct involvement of the state in the production activities of companies has failed. This will improve the performance of companies and, as a result, additional advantages will be gained both for the country’s budget and for the development of associated sectors, as well as social-economic infrastructure of the regions of the Russian Federation. Initially, switching to mechanisms for market regulation can be supported with tools such as golden shares, enabling the state to reserve the right to control only a few company operating aspects, but not to shape its future generally.
Funding
This research received no external funding.
Conflicts of Interest
The author declares no conflict of interest.
References
- Lieder, M.; Rashid, A. Towards circular economy implementation: A comprehensive review in context of manufacturing industry. J. Clean. Prod. 2016, 115, 36–51. [Google Scholar] [CrossRef]
- Kan, A. General characteristics of waste management: A review. Energy Educ. Sci. Technol. Part A-Energy Sci. Res. 2009, 23, 55–69. [Google Scholar]
- Riaz, A.; Zahedi, G.; Klemeš, J.J. A review of cleaner production methods for the manufacture of methanol. J. Clean. Prod. 2013, 57, 19–37. [Google Scholar] [CrossRef]
- Loiseau, E.; Saikku, L.; Antikainen, R.; Droste, N.; Hansjürgens, B.; Pitkänen, K.; Leskinen, P.; Kuikman, P.; Thomsen, M. Green economy and related concepts: An overview. J. Clean. Prod. 2016, 139, 361–371. [Google Scholar] [CrossRef]
- Van der Ploeg, F.; Withagen, C. Global Warming and the Green Paradox: A Review of Adverse Effects of Climate Policies. Rev. Environ. Econ. Policy 2015, 9, 285–303. [Google Scholar] [CrossRef]
- Abas, N.; Kalair, A.; Khan, N. Review of fossil fuels and future energy technologies. Futures 2015, 69, 31–49. [Google Scholar] [CrossRef]
- Chu, S.; Majumdar, A. Opportunities and challenges for a sustainable energy future. Nature 2012, 488, 294–303. [Google Scholar] [CrossRef]
- INEOS Group website. Open Letter to the European Commission President Jean-Claude Juncker. Available online: https://www.ineos.com/news/ineos-group/letter-to-the-european-commission-president-jean-claude-juncker/ (accessed on 12 February 2019).
- Sandbag Climate Campaign CIC. Available online: https://ember-climate.org/carbon-price-viewer/ (accessed on 12 February 2019).
- Asmelash, H. The G7’s Pledge to End Fossil Fuel Subsidies by 2025: Mere Rhetoric or a Sign of Post-Paris Momentum? Eur. Soc. Int. Law (Esil) Reflect. 2016, 5, 1–7. [Google Scholar] [CrossRef]
- Whitley, S.; Chen, H.; Doukas, A.; Gençsü, I.; Gerasimchuk, I.; Touchette, Y.; Worrall, L. G7 Fossil Fuel Subsidy Scorecard; International Institute for Sustainable Development: Winnipeg, MB, Canada, 2018; Available online: https://prod-edxapp.edx-cdn.org/assets/courseware/v1/0333e0d130fe95a336116caa1de2c98d/asset-v1:SDGAcademyX+CA001+1T2019+type@asset+block/6.R_Whitley__S__Chen__H__Doukas__A__et_al.__2018__G7_fossil_fuel_subsidy_scorecard._ODI_Report._London-_Overseas_Development_Institute.pdf (accessed on 12 February 2019).
- Burrows, L.; Kotani, I.; Zorlu, P.; Popp, R.; Patuleia, A.; Littlecott, C. G7 Coal Scorecard–Fifth Edition Coal Finance Heads for the Exit. 2019. Available online: https://0-www-jstor-org.brum.beds.ac.uk/stable/pdf/resrep21850.pdf (accessed on 12 February 2019).
- Department of Energy website. DOE Announces $3.8 Million Investment in New Methane Gas Hydrate Research. Available online: https://www.energy.gov/fe/articles/doe-announces-38-million-investment-new-methane-gas-hydrate-research (accessed on 12 September 2016).
- Maggio, G.; Cacciola, G. When will oil, natural gas, and coal peak? Fuel 2012, 98, 111–123. [Google Scholar] [CrossRef]
- Mohr, S.H.; Wang, J.; Ellem, G.; Ward, J.; Giurco, D. Projection of world fossil fuels by country. Fuel 2015, 141, 120–135. [Google Scholar] [CrossRef]
- Wang, J.; Feng, L.; Tang, X.; Bentley, Y.; Höök, M. The implications of fossil fuel supply constraints on climate change projections: A supply-side analysis. Futures 2017, 86, 58–72. [Google Scholar] [CrossRef]
- Dale, S. New economics of oil. ONE J. 2015, 1, 365. [Google Scholar]
- Makhovikov, A.B.; Katuntsov, E.V.; Kosarev, O.V.; Tsvetkov, P.S. Digital transformation in oil and gas extraction. In Proceedings of the Innovation-Based Development of the Mineral Resources Sector: Challenges and Prospects-11th conference of the Russian-German Raw Materials, Potsdam, Germany, 7–8 November 2018; pp. 531–538. [Google Scholar]
- Hoffert, M.I.; Caldeira, K.; Benford, G.; Criswell, D.R.; Green, C.; Herzog, H.; Jain, A.K.; Kheshgi, H.S.; Lackner, K.S.; Lewis, J.S.; et al. Advanced Technology Paths to Global Climate Stability: Energy for a Greenhouse Planet. Science 2002, 298, 981–987. [Google Scholar] [CrossRef] [PubMed] [Green Version]
- Masson-Delmotte, V.; Zhai, P.; Pörtner, H.O.; Roberts, D.; Skea, J.; Shukla, P.R.; Pirani, A.; Moufouma-Okia, W.; Péan, C.; Pidcock, R.; et al. Global warming of 1.5 C. In An IPCC Special Report on the Impacts of Global Warming of. 2018 October 8; IPCC: Geneva, Switzerland, 2018. [Google Scholar]
- Rogelj, J.; Den Elzen, M.; Höhne, N.; Fransen, T.; Fekete, H.; Winkler, H.; Schaeffer, R.; Sha, F.; Riahi, K.; Meinshausen, M. Paris Agreement climate proposals need a boost to keep warming well below 2 C. Nature 2016, 534, 631–639. [Google Scholar] [CrossRef] [Green Version]
- Steffen, W.; Rockström, J.; Richardson, K.; Lenton, T.M.; Folke, C.; Liverman, D.; Summerhayes, C.P.; Barnosky, A.D.; Cornell, S.E.; Crucifix, M.; et al. Trajectories of the Earth System in the Anthropocene. Proc. Natl. Acad. Sci. USA 2018, 115, 8252–8259. [Google Scholar] [CrossRef] [Green Version]
- Lenton, T.M.; Held, H.; Kriegler, E.; Hall, J.W.; Lucht, W.; Rahmstorf, S.; Schellnhuber, H.J. Tipping elements in the Earth’s climate system. Proc. Natl. Acad. Sci. USA 2008, 105, 1786–1793. [Google Scholar] [CrossRef] [Green Version]
- Schellnhuber, H.J.; Rahmstorf, S.; Winkelmann, R. Why the right climate target was agreed in Paris. Nat. Clim. Chang. 2016, 6, 649. [Google Scholar] [CrossRef]
- Jiang, X.; Guan, D. Determinants of global CO2 emissions growth. Appl. Energy 2016, 184, 1132–1141. [Google Scholar] [CrossRef] [Green Version]
- Sovacool, B.K. What are we doing here? Analyzing fifteen years of energy scholarship and proposing a social science research agenda. Energy Res. Soc. Sci. 2014, 1, 1–29. [Google Scholar] [CrossRef]
- Sundqvist, T. What causes the disparity of electricity externality estimates? Energy Policy 2004, 32, 1753–1766. [Google Scholar] [CrossRef]
- Berger, A. Milankovitch theory and climate. Rev. Geophys. 1988, 26, 624–657. [Google Scholar] [CrossRef] [Green Version]
- Hays, J.D.; Imbrie, J.; Shackleton, N.J. Variations in the Earth’s orbit: Pacemaker of the ice ages. Science 1976, 194, 1121–1132. [Google Scholar] [CrossRef] [PubMed]
- Fischer, T.P.; Arellano, S.; Carn, S.; Aiuppa, A.; Galle, B.; Allard, P.; Lopez, T.; Shinohara, H.; Kelly, P.; Werner, C.; et al. The emissions of CO2 and other volatiles from the world’s subaerial volcanoes. Sci. Rep. 2019, 9, 1–11. [Google Scholar] [CrossRef] [PubMed] [Green Version]
- Guo, M.; Li, J.; Xu, J.; Wang, X.; He, H.; Wu, L. CO2 emissions from the 2010 Russian wildfires using GOSAT data. Environ. Pollut. 2017, 226, 60–68. [Google Scholar] [CrossRef] [PubMed]
- Shvidenko, A.Z.; Shchepashchenko, D.G.; Vaganov, E.A.; Sukhinin, A.I.; Maksyutov, S.S.; McCallum, I.; Lakyda, I.P. Impact of wildfire in Russia between 1998–2010 on ecosystems and the global carbon budget. Dokl. Earth Sci. 2011, 441, 1678–1682. [Google Scholar] [CrossRef]
- Page, S.E.; Siegert, F.; Rieley, J.O.; Boehm, H.D.V.; Jaya, A.; Limin, S. The amount of carbon released from peat and forest fires in Indonesia during 1997. Nature 2002, 420, 61–65. [Google Scholar] [CrossRef]
- Hooijer, A.; Page, S.; Canadell, J.G.; Silvius, M.; Kwadijk, J.; Wosten, H.; Jauhiainen, J. Current and future CO2 emissions from drained peatlands in Southeast Asia. Biogeosciences 2010, 7, 1505–1514. [Google Scholar] [CrossRef] [Green Version]
- Lee, C.T.A.; Jiang, H.; Dasgupta, R.; Torres, M. A Framework for Understanding Whole-Earth Carbon Cycling. In Deep Carbon: Past to Present; Cambridge University Press: Cambridge, UK, 2019; pp. 313–357. [Google Scholar]
- Petrescu, A.M.R.; Van Beek, L.P.H.; Van Huissteden, J.; Prigent, C.; Sachs, T.; Corradi, C.A.R.; Dolman, A.J. Modeling regional to global CH4 emissions of boreal and arctic wetlands. Global Biogeochemical Cycles 2010, 24. [Google Scholar] [CrossRef] [Green Version]
- Zhang, B.; Zhao, X.; Wu, X.; Han, M.; Guan, C.H.; Song, S. Consumption-Based Accounting of Global Anthropogenic CH4 Emissions. Earth’s Future 2018, 6, 1349–1363. [Google Scholar] [CrossRef]
- Tian, W.; Wu, X.; Zhao, X.; Ma, R.; Zhang, B. Quantifying global CH4 and N2O footprints. J. Environ. Manag. 2019, 251, 109566. [Google Scholar] [CrossRef]
- Bloom, A.A.; Bowman, K.W.; Lee, M.; Turner, A.J.; Schroeder, R.; Worden, J.R.; Weidner, R.; McDonald, K.C.; Jacob, D.J. A global wetland methane emissions and uncertainty dataset for atmospheric chemical transport models (WetCHARTs version 1.0). Geosci. Model Dev. 2017, 10. [Google Scholar] [CrossRef] [Green Version]
- Canadell, J.G.; Le Quéré, C.; Raupach, M.R.; Field, C.B.; Buitenhuis, E.T.; Ciais, P.; Conway, T.J.; Gillett, N.P.; Houghton, R.A.; Marland, G. Contributions to accelerating atmospheric CO2 growth from economic activity, carbon intensity, and efficiency of natural sinks. Proc. Natl. Acad. Sci. USA 2007, 104, 18866–18870. [Google Scholar] [CrossRef] [Green Version]
- Steffen, W.; Broadgate, W.; Deutsch, L.; Gaffney, O.; Ludwig, C. The trajectory of the Anthropocene: The great acceleration. Anthr. Rev. 2015, 2, 81–98. [Google Scholar] [CrossRef]
- Fouquet, R. Path dependence in energy systems and economic development. Nat. Energy 2016, 1, 1–5. [Google Scholar]
- Capros, P.; Tasios, N.; De Vita, A.; Mantzos, L.; Paroussos, L. Transformations of the energy system in the context of the decarbonisation of the EU economy in the time horizon to 2050. Energy Strategy Rev. 2012, 1, 85–96. [Google Scholar] [CrossRef]
- Brundtland, G.; Khalid, M.; Agnelli, S.; Al-Athel, S.A.; Chidzero, B.; Fadika, L.M.; Hauff, V.; Lang, I.; Ma, S.; Marino de Botero, M.; et al. Our Common Future: The World Commission on Environment and Development; Oxford University Press: London, UK, 1987. [Google Scholar]
- Glavič, P.; Lukman, R. Review of sustainability terms and their definitions. J. Clean. Prod. 2007, 15, 1875–1885. [Google Scholar] [CrossRef]
- Vijayaraghavan, A.; Dornfeld, D. Automated energy monitoring of machine tools. Cirp Ann. 2010, 59, 21–24. [Google Scholar] [CrossRef] [Green Version]
- Yoon, H.S.; Kim, E.S.; Kim, M.S.; Lee, J.Y.; Lee, G.B.; Ahn, S.H. Towards greener machine tools–A review on energy saving strategies and technologies. Renew. Sustain. Energy Rev. 2015, 48, 870–891. [Google Scholar] [CrossRef]
- Kobos, P.H.; Malczynski, L.A.; La Tonya, N.W.; Borns, D.J.; Klise, G.T. Timing is everything: A technology transition framework for regulatory and market readiness levels. Technol. Forecast. Soc. Chang. 2018, 137, 211–225. [Google Scholar] [CrossRef]
- Schmidt, T.S.; Sewerin, S. Technology as a driver of climate and energy politics. Nat. Energy 2017, 2, 17084. [Google Scholar] [CrossRef]
- Rogge, K.S.; Reichardt, K. Policy mixes for sustainability transitions: An extended concept and framework for analysis. Res. Policy 2016, 45, 1620–1635. [Google Scholar] [CrossRef]
- Meadowcroft, J. What about the politics? Sustainable development, transition management, and long term energy transitions. Policy Sci. 2009, 42, 323. [Google Scholar] [CrossRef]
- Abergel, T.; Brown, A.; Cazzola, P.; Dockweiler, S.; Dulac, J.; Fernandez Pales, A.; West, K. Energy Technology Perspectives 2017: Catalysing Energy Technology Transformations; OECD: Paris, France, 2017. [Google Scholar]
- Abergel, T.; Brown, A.; Cazzola, P.; Dockweiler, S.; Dulac, J.; Pales, A.F.; Gorner, M.; Malischek, R.; Masanet, E.R.; McCulloch, S.; et al. Energy technology perspectives 2017: Catalysing energy technology transformations. 2017. Available online: https://www.cleanenergyministerial.org/sites/default/files/2018-07/English-ETP-2017.pdf (accessed on 12 February 2019).
- IRENA. Global Energy Transformation: A Roadmap to 2050; IRENA: Abu Dhabi, UAE, 2019. [Google Scholar]
- Ram, M.; Child, M.; Aghahosseini, A.; Bogdanov, D.; Lohrmann, A.; Breyer, C. A comparative analysis of electricity generation costs from renewable, fossil fuel and nuclear sources in G20 countries for the period 2015-2030. J. Clean. Prod. 2018, 199, 687–704. [Google Scholar] [CrossRef]
- Saito, S. Role of nuclear energy to a future society of shortage of e nergy resources and global warming. J. Nucl. Mater. 2010, 398, 1–9. [Google Scholar] [CrossRef]
- International Atomic Energy Agency. Nuclear Power Reactors in the World; Reference Data Series No. 2; IAEA: Vienna, Austria, 2019. [Google Scholar]
- IEA. Nuclear Power in a Clean Energy System; IEA: Paris, France, 2019; Available online: https://www.iea.org/reports/nuclear-power-in-a-clean-energy-system (accessed on 12 February 2019).
- Lovering, J.R.; Yip, A.; Nordhaus, T. Historical construction costs of global nuclear power reactors. Energy Policy 2016, 91, 371–382. [Google Scholar] [CrossRef] [Green Version]
- Dittmar, M. Nuclear energy: Status and future limitations. Energy 2012, 37, 35–40. [Google Scholar] [CrossRef]
- Hossain, M.K.; Taher, M.A.; Das, M.K. Understanding Accelerator Driven System (ADS) Based Green Nuclear Energy: A Review. World J. Nucl. Sci. Technol. 2015, 5, 287. [Google Scholar] [CrossRef] [Green Version]
- Ojovan, M.I.; Lee, W.E.; Kalmykov, S.N. An Introduction to Nuclear Waste Immobilization; Elsevier: Amsterdam, The Netherland, 2019. [Google Scholar]
- Yaqoot, M.; Diwan, P.; Kandpal, T.C. Review of barriers to the dissemination of decentralized renewable energy systems. Renew. Sustain. Energy Rev. 2016, 58, 477–490. [Google Scholar] [CrossRef]
- Asdrubali, F.; Baldinelli, G.; D’Alessandro, F.; Scrucca, F. Life cycle assessment of electricity production from renewable energies: Review and results harmonization. Renew. Sustain. Energy Rev. 2015, 42, 1113–1122. [Google Scholar] [CrossRef]
- Cherepovitsyn, A.; Tcvetkov, P. Overview of the prospects for developing a renewable energy in Russia. In 2017 International Conference on Green Energy and Applications (ICGEA); IEEE: Piscataway, NJ, USA, 2017; pp. 113–117. [Google Scholar]
- Dincer, I.; Acar, C. A review on clean energy solutions for better sustainability. Int. J. Energy Res. 2015, 39, 585–606. [Google Scholar] [CrossRef]
- Tcvetkov, P.S. The history, present status and future prospects of the Russian fuel peat industry. Mires Peat 2017, 19, 1–12. [Google Scholar] [CrossRef]
- Tan, R.R.; Aviso, K.B.; Ng, D.K.S. Optimization models for financing innovations in green energy technologies. Renew. Sustain. Energy Rev. 2019, 113, 109258. [Google Scholar] [CrossRef]
- Sabihuddin, S.; Kiprakis, A.E.; Mueller, M. A numerical and graphical review of energy storage technologies. Energies 2015, 8, 172–216. [Google Scholar] [CrossRef]
- Argyrou, M.C.; Christodoulides, P.; Kalogirou, S.A. Energy storage for electricity generation and related processes: Technologies appraisal and grid scale applications. Renew. Sustain. Energy Rev. 2018, 94, 804–821. [Google Scholar] [CrossRef]
- Dutton, J.; Pilsner, L. Delivering Climate Neutrality: Accelerating Eu Decarbonisation with Research and Innovation Funding. 2019. Available online: https://0-www-jstor-org.brum.beds.ac.uk/stable/pdf/resrep21732.pdf (accessed on 12 February 2019).
- Cabré, M.M.; Gallagher, K.P.; Li, Z. Renewable Energy: The Trillion Dollar Opportunity for Chinese Overseas Investment. China World Econ. 2018, 26, 27–49. [Google Scholar] [CrossRef]
- Murdock, H.E.; Gibb, D.; André, T.; Appavou, F.; Brown, A.; Epp, B.; Kondev, B.; McCrone, A.; Musolino, E.; Ranalder, L.; et al. Renewables 2019 Global Status Report. Available online: https://www.ren21.net/wp-content/uploads/2019/05/gsr_2019_perspectives_en.pdf (accessed on 12 February 2019).
- Kemeny, T. Does foreign direct investment drive technological upgrading? World Dev. 2010, 38, 1543–1554. [Google Scholar] [CrossRef]
- Gielen, D.; Boshell, F.; Saygin, D.; Bazilian, M.D.; Wagner, N.; Gorini, R. The role of renewable energy in the global energy transformation. Energy Strategy Rev. 2019, 24, 38–50. [Google Scholar] [CrossRef]
- Abdalla, A.M.; Hossain, S.; Nisfindy, O.B.; Azad, A.T.; Dawood, M.; Azad, A.K. Hydrogen production, storage, transportation and key challenges with applications: A review. Energy Convers. Manag. 2018, 165, 602–627. [Google Scholar] [CrossRef]
- Hosseini, S.E.; Wahid, M.A. Hydrogen from solar energy, a clean energy carrier from a sustainable source of energy. Int. J. Energy Res. 2020, 4, 4110–4131. [Google Scholar] [CrossRef]
- Cetinkaya, E.; Dincer, I.; Naterer, G.F. Life cycle assessment of various hydrogen production methods. Int. J. Hydrog. Energy 2012, 37, 2071–2080. [Google Scholar] [CrossRef]
- Dincer, I.; Acar, C. Review and evaluation of hydrogen production methods for better sustainability. Int. J. Hydrog. Energy 2015, 1109, 4–11111. [Google Scholar] [CrossRef]
- Nikolaidis, P.; Poullikkas, A. A comparative overview of hydrogen production processes. Renew. Sustain. Energy Rev. 2017, 67, 597–611. [Google Scholar] [CrossRef]
- Acar, C.; Beskese, A.; Temur, G.T. Sustainability analysis of different hydrogen production options using hesitant fuzzy AHP. Int. J. Hydrog. Energy 2018, 43, 18059–18076. [Google Scholar] [CrossRef]
- MA, J.; LIU, S.; ZHOU, W.; PAN, X. Comparison of Hydrogen Transportation Methods for Hydrogen Refueling Station. J. Tongji Univ. (Nat. Sci. ) 2008, 5, 615–619. [Google Scholar]
- Acar, C.; Dincer, I. Review and evaluation of hydrogen production options for better environment. J. Clean. Prod. 2019, 218, 835–849. [Google Scholar] [CrossRef]
- Royal Dutch Shell plc. Shell LNG Outlook 2020. 2020. Available online: https://www.shell.com/energy-and-innovation/natural-gas/liquefied-natural-gas-lng/lng-outlook-2020.html#iframe=L3dlYmFwcHMvTE5HX291dGxvb2sv (accessed on 12 February 2019).
- Litvinenko, V.S.; Kozlov, A.V.; Stepanov, V.A. Hydrocarbon potential of the Ural–African transcontinental oil and gas belt. J. Pet. Explor. Prod. Technol. 2017, 7, 1–9. [Google Scholar] [CrossRef] [Green Version]
- Tullo, A.H. C&EN’s Global Top 50 chemical companies of 2018. Chem. Eng. News 2019, 30–35. Available online: https://0-cen-acs-org.brum.beds.ac.uk/content/dam/cen/97/30/WEB/globaltop50-2018.pdf (accessed on 12 February 2019).
- Muggeridge, A.; Cockin, A.; Webb, K.; Frampton, H.; Collins, I.; Moulds, T.; Salino, P. Recovery rates, enhanced oil recovery and technological limits. Philos. Trans. R. Soc. A Math. Phys. Eng. Sci. 2014, 372, 20120320. [Google Scholar] [CrossRef] [Green Version]
- Exxon Mobil Financial Operating Review. 2018. Available online: https://corporate.exxonmobil.com/-/media/Global/Files/annual-report/2018-Financial-and-Operating-Review.pdf (accessed on 12 February 2019).
- Litvinenko, V.S.; Sergeev, I.B. Innovations as a Factor in the Development of the Natural Resources Sector. Stud. Russ. Econ. Dev. 2019, 30, 637–645. [Google Scholar] [CrossRef]
- Cherepovitsyn, A.; Lipina, S.; Evseeva, O. Innovative approach to the development of mineral raw materials of the arctic zone of the Russian federation. Zap. Gorn. Inst. /J. Min. Inst. 2018, 232, 438. [Google Scholar] [CrossRef]
- Cherepovitsyn, A.; Ilinova, A.; Evseeva, O. Stakeholders management of carbon sequestration project in the state-business-society system. Zap. Gorn. Inst. /J. Min. Inst. 2019, 240, 731. [Google Scholar] [CrossRef] [Green Version]
- Nugent, D.; Sovacool, B.K. Assessing the lifecycle greenhouse gas emissions from solar PV and wind energy: A critical meta-survey. Energy Policy 2014, 65, 229–244. [Google Scholar] [CrossRef]
- Tcvetkov, P.; Cherepovitsyn, A.; Makhovikov, A. Economic assessment of heat and power generation from small-scale liquefied natural gas in Russia. Energy Rep. 2020, 6, 391–402. [Google Scholar] [CrossRef]
- VYGON. Consulting Global LNG Market: Illusory Glut. 2018. Available online: https://vygon.consulting/upload/iblock/486/vygon_consulting_lng_world_balance_en_executive_summary.pdf (accessed on 12 February 2019).
- Dudley, B. BP Statistical Review of World Energy 2019; British Petroleum: London, UK, 2019. [Google Scholar]
- Dudley, B. BP Statistical Review of World Energy 2020; British Petroleum: London, UK, 2020. [Google Scholar]
- Savcenko, K.; Hornby, G. The future of European gas after Groningen. S&P Global Platts. 2020. Available online: https://www.spglobal.com/platts/plattscontent/_assets/_files/en/specialreports/naturalgas/groningen-european-gas-report.pdf (accessed on 12 February 2019).
- Howell, N.; Pereira, R. LNG in Europe. Current Trends, the European LNG Landscape and Country Focus. Gaffney, Cline Associates. Available online: https://www.europeangashub.com/wp-content/uploads/2019/10/DM-_6044045-v1-Article_LNG_in_Europe_HOWELL_PEREIRA.pdf (accessed on 12 February 2019).
- IGU. Global Gas Report 2019; International Gas Union: Barcelona, Spain, 2019; Available online: https://www.wgc2021.org/wp-content/uploads/2019/04/LNG2019-IGU-World-LNG-report2019.pdf (accessed on 12 February 2019).
- GIIGNL. The LNG Industry. Annual Report 2019. Available online: https://giignl.org/sites/default/files/PUBLIC_AREA/Publications/giignl_annual_report_2019-compressed.pdf (accessed on 12 February 2019).
- Belova, M.; Kolbikova, E.; Timonin, I. Russia’s place ona global LNG map. OilGas J. 2019, 74–81. Available online: https://vygon.consulting/upload/iblock/3c6/OGJR_2019_04_small.pdf (accessed on 12 February 2019).
- S&P Global Platts. 2019 Review and 2020 Outlook. 2019. Available online: https://www.spglobal.com/platts/plattscontent/_assets/_files/en/specialreports/oil/platts_2020_outlook_report.pdf (accessed on 12 February 2019).
- McKinsey. Global gas and LNG Outlook to 2035. 2018. Available online: https://www.mckinsey.com/solutions/energy-insights/global-gas-lng-outlook-to-2035/~/media/3C7FB7DF5E4A47E393AF0CDB080FAD08.ashx (accessed on 12 February 2019).
- Henderson, J.; Yermakov, V. Russian LNG: Becoming a Global Force. Working Paper; Oxford Institute for Energy Studies: Oxford, UK, 2019; 37 p. [Google Scholar] [CrossRef]
- Hashimoto, H. 2020 Gas Market Outlook. In 434th Forum on Research Works; The Institute of Energy Economics: Tokyo, Japan; Available online: https://globallnghub.com/wp-content/uploads/2020/01/8787.pdf (accessed on 23 December 2019).
- IEEJ. EPRINC The Future of Asian LNG 2018 (The Road to Nagoya); The Institute of Energy Economics: Tokyo, Japan, 2018; Available online: https://eneken.ieej.or.jp/data/8140.pdf (accessed on 12 February 2019).
- IGU. Global Gas Report 2018; International Gas Union: Barcelona, Spain, 2018; Available online: https://www.snam.it/export/sites/snam-rp/repository/file/gas_naturale/global-gas-report/global_gas_report_2018.pdf (accessed on 12 February 2019).
- Althouse Group. Overview of the gas processing industry in Russia. 2019. Available online: https://althausgroup.ru/wp-content/uploads/2019/10/Analiz-rynka-produktov-gazopererabotki.pdf (accessed on 12 February 2019). (In Russian).
- Bilfinger Tebodin. The Russian Chemical Market; Market study report; The Embassy of the Kingdom of the Netherlands; Bilfinger Tebodin: Moscow, Russia, 2018; Available online: https://www.pronline.ru/Handlers/ShowRelisesFile.ashx?relizid=6998&num=2 (accessed on 12 February 2019).
- VYGON Consulting. Gas Chemistry of Russia. Part 1. Methanol: So far only plans. 2019. Available online: https://vygon.consulting/upload/iblock/f22/vygon_consulting_russian_methanol_industry_development.pdf (accessed on 12 February 2019). (In Russian).
- Gautier, D.L.; Bird, K.J.; Charpentier, R.R.; Grantz, A.; Houseknecht, D.W.; Klett, T.R.; Sørensen, K. Assessment of undiscovered oil and gas in the Arctic. Science 2009, 324, 1175–1179. [Google Scholar] [CrossRef] [PubMed] [Green Version]
- Viacheslav, Z.; Alina, I. Problems of unconventional gas resources production in arctic zone-Russia. Espacios 2018, 39, 42. [Google Scholar]
- Brecha, R.J. Logistic curves, extraction costs and effective peak oil. Energy Policy 2012, 51, 586–597. [Google Scholar] [CrossRef]
- Litvinenko, V.; Trushko, V.; Dvoinikov, M. Method of construction of an offshore drilling platform on the shallow shelf of the Arctic seas. Russian Patent 2704451 С1, 28 October 2019. (In Russian). [Google Scholar]
- Bumpus, A.; Comello, S. Emerging clean energy technology investment trends. Nat. Clim. Chang. 2017, 7, 382–385. [Google Scholar] [CrossRef]
- Kivimaa, P.; Kern, F. Creative destruction or mere niche support? Innovation policy mixes for sustainability transitions. Res. Policy 2016, 45, 205–217. [Google Scholar] [CrossRef] [Green Version]
- Schmidt, T.S.; Sewerin, S. Measuring the temporal dynamics of policy mixes–An empirical analysis of renewable energy policy mixes’ balance and design features in nine countries. Res. Policy 2019, 48, 103557. [Google Scholar] [CrossRef]
- Pickl, M.J. The renewable energy strategies of oil majors–From oil to energy? Energy Strategy Rev. 2019, 26, 100370. [Google Scholar] [CrossRef]
- Sovacool, B.K. How long will it take? Conceptualizing the temporal dynamics of energy transitions. Energy Res. Soc. Sci. 2016, 13, 202–215. [Google Scholar] [CrossRef] [Green Version]
- Peters, G.P. The’best available science’to inform 1.5 C policy choices. Nat. Clim. Chang. 2016, 6, 646. [Google Scholar] [CrossRef] [Green Version]
Figure 1.
Average carbon tax rate in Europe, Euro/t. CO2 [9].
Figure 1.
Average carbon tax rate in Europe, Euro/t. CO2 [9].

Figure 2.
Global and USA oil production dynamics. Based on BP Energy Overviews.

Figure 3.
Dynamics of nuclear energy generation volumes. Based on BP Energy Overviews.

Figure 4.
Forecasted change in the global energy balance. Based on [84].
Figure 4.
Forecasted change in the global energy balance. Based on [84].

Figure 5.
Increase in production of chemicals by ExxonMobil. Based on [88].
Figure 5.
Increase in production of chemicals by ExxonMobil. Based on [88].

Figure 6.
Expected production and consumption of LNG (bottom) and capacity use of LNG-plants in 2000–2018 (top).
Figure 6.
Expected production and consumption of LNG (bottom) and capacity use of LNG-plants in 2000–2018 (top).


Figure 8.
Change in geography of LNG flows. Based on BP Energy Overviews.

Figure 9.
Expected gas consumption in various regions. Based on Shell LNG Outlooks.

Figure 10.
Russia’s share in the global LNG market (on the left) and total LNG capacity of global plants in 2019 (on the right). Based on [100].
Figure 10.
Russia’s share in the global LNG market (on the left) and total LNG capacity of global plants in 2019 (on the right). Based on [100].


Figure 12.
Prospective centres of the growing gas industry in Russia and options for gas resource commercialization.
Figure 12.
Prospective centres of the growing gas industry in Russia and options for gas resource commercialization.

Figure 13.
Conceptual scheme for commercialization of gas industry products.


Table 1.
The comparison of BP Energy Overviews (EO) for the period of 2014–2019.
| Indicator | EO14 | EO15 | EO16 | EO17 | EO18 | EO19 |
|---|---|---|---|---|---|---|
| Proportion of HCR as primary energy sources in 2025, incl.: | ||||||
| oil, % | 30 | 30 | 30 | 30 | 31 | 31 |
| gas, % | 24 | 25 | 24 | 24 | 25 | 24 |
| coal, % | 30 | 29 | 27 | 27 | 25 | 24 |
| Proportion of HCR as primary energy sources in 2035, incl.: | ||||||
| oil, % | 27 | 28 | 29 | 29 | 29 | 29 |
| gas, % | 26 | 27 | 26 | 25 | 27 | 26 |
| coal, % | 27 | 27 | 25 | 24 | 22 | 21 |
| Aggregate consumption of energy resources in 2035, bln toe | 17.6 | 17.5 | 17.3 | 17.2 | 17.1 | 17 |
© 2020 by the author. Licensee MDPI, Basel, Switzerland. This article is an open access article distributed under the terms and conditions of the Creative Commons Attribution (CC BY) license (http://creativecommons.org/licenses/by/4.0/).
Share and Cite
MDPI and ACS Style
Litvinenko, V. The Role of Hydrocarbons in the Global Energy Agenda: The Focus on Liquefied Natural Gas. Resources 2020, 9, 59. https://0-doi-org.brum.beds.ac.uk/10.3390/resources9050059
AMA Style
Litvinenko V. The Role of Hydrocarbons in the Global Energy Agenda: The Focus on Liquefied Natural Gas. Resources. 2020; 9(5):59. https://0-doi-org.brum.beds.ac.uk/10.3390/resources9050059
Chicago/Turabian StyleLitvinenko, Vladimir. 2020. "The Role of Hydrocarbons in the Global Energy Agenda: The Focus on Liquefied Natural Gas" Resources 9, no. 5: 59. https://0-doi-org.brum.beds.ac.uk/10.3390/resources9050059
Note that from the first issue of 2016, this journal uses article numbers instead of page numbers. See further details here.