1. Introduction
Annual production of natural aggregates in Poland in 2018 exceeded 320 million tonnes. About 100 million tonnes constituted crushed-stone aggregates and 220 million tonnes were gravels and sands [
1]. The rising trend in mining and production of aggregates can be generally observed since the beginning of this century, especially for its first decade [
1,
2] However, an unavailability of appropriate quality aggregated in some areas of the country is among the constant concern of aggregate product recipients and builders [
3]. The problem is more complex and concerns many aggregate products’ manufacturers all over the world. The changeable quality of individual deposits is significant, even within a relatively small region of a given country, not to mention diversification in specific countries. The problem is even more significant due to the high amount of aggregate produced worldwide. It is very hard to obtain accurate data, but experts assess this volume for 20 to even 40 billion tons. Quality of raw materials constitute a significant problem, especially in terms of impurities’ content. Natural aggregates often contain clay and dust impurities that need to be removed prior to their industrial utilization. These impurities also affect the crushing and screening operations and, thus, an overall processing effectiveness of crushed-stone aggregates. Industrial practice shows that it is quite often not economical to treat the finer fractions of aggregate without the application of suitably efficient washing technology and, as a result, such a material is stored in heaps. However, the most common clay contaminations can be removed from the material in washing operations [
4] that are present in purification of many types of both natural and artificial aggregates [
5]. It also appears that removing fine impurities reduces prior aggregate processing and reduces dust pollution in mineral processing plant, which has also a positive environmental impact [
6,
7]. Many investigations on aggregate washing also show that the washing sludge can be utilized in brick production [
8,
9,
10], building ceramics [
11], and artificial aggregates [
12,
13]. However, despite the above issues, the technologies effective in removal of impurities from aggregates are of a key significance in their processing circuits [
14,
15,
16,
17].
Washing operations can be realized through application of screens with spray nozzles. Sword and drum washers can be also used due to an intensive mixing of the raw material in the working chamber of a device and elimination of the clay lumps and other unnecessary impurities [
18,
19]. The high-pressure washing technology has found its applications in sand and gravel washing as well as in removal of contaminations from aggregates from recycling with particle size up to 120 mm [
4,
20]. Working principles of such a washer are based on the high-pressure water stream that penetrates particle pores, flushes and breaks agglomerates, and at the same time introduces motion of feed material particles. This results in obtaining an effect of mechanical friction, which has a very positive impact on the final result of the washing process. The feed is fed to the hopper by means of a belt conveyor, from where it goes into the washing chamber. In the upper part of the chamber rotates a rotor, equipped with spray nozzles supplying water under a high pressure, 40–200 bar (40–200 MPa).
Despite a relatively long time of existence of this technology in the mineral processing practice, the number of published investigations on the issue is not high. Capacity of the device ranges from 50 to even 400 Mg/h and feed material feeding intensity varies and depends on the level of its contamination [
21,
22]. Investigations over water and energy consumption during washing operations show that high-pressure washing technology is more beneficial in unit consumption of both energy and water, comparing to other washing devices [
23]. For example, popular sword washers utilize, on average, from 0.4 to 0.75 kWh per tonne of feed material while in a high-pressure washer analogous consumption is within the range of 0.3–0.5 kWh/Mg. In terms of water consumption, respective data is as follow: Sword washer, 0.5–1.0 m
3/Mg; high-pressure washer, 0.12–0.2 m
3/Mg [
23,
24].
From the scope of further utilization of carbonate aggregate in a concrete mix, it is important that the material is clean. If there is too much clay in the mix, it tends to create a swelling effect that can lead to potential cracking in the future. The contact layer between aggregate and cement slurry is one of the most vulnerable areas in concrete. Many of the properties of concrete, both mechanical and durability, are determined by the properties of the components used, as well as the connections between the individual components of the concrete composite. [
25,
26]
The main purpose of the paper was to investigate a work effectiveness of the high-pressure washing device on an example of gravel and limestone crushed-stone aggregates washed in laboratory scale. The other object of research was to build a model of a washer operation that is helpful in optimization of device effectiveness through adjustment of selected operational parameters of washer and feed material characteristics. The obtained results were verified in pilot-scale conditions.
2. Materials and Methods
The research program was carried out in two stages. Primary tests were performed in laboratory scale, and further verification tests, with a limited number and variability of operating parameters, were carried out in a pilot-plant scale. In addition, control samples of concrete were made using washed and unwashed limestone aggregate, and then they were exposed to computer tomography in order to assess the quality of the binder-aggregate bond.
The research program was based on the methodology of the factorial experiment [
27]. The primary variable parameter of the device was an operating pressure (P) in the washer. The variable parameters characterizing the material were a percentage content of impurities in the feed (Imp_f), particle size composition (Dmax), and susceptibility of impurities to their removal (Ws) from the washed material. For the set of factors (independent variables) adopted in this manner, the dependent variable was defined as the efficiency of removing impurities from feed. The measure of this effectiveness was the percentage of the removed dust fraction with particle size below 0.063 mm, constituting impurities, described by Equation (1).
A laboratory-scale investigative program included 72 single tests in total. This number resulted from the number of independent variables adopted for investigations and the number of variability levels for a particular parameter:
Operating pressure in the washer P (three levels of variability);
Maximum particle of feed Dmax (three levels of variability);
Percentage content of impurities in feed Imp_f (three levels of variability);
Susceptibility of impurities for washing Ws, (three levels of variability); and
Type of washed material Mat (limestone and gravel aggregate).
For each configuration of independent variables, the washing efficiency (Ef) was calculated and such data were an input material for the model calculations. The general model of effectiveness determined on the basis of the research can be written with using Equation (2).
where:
Ef—effectiveness of impurities’ washing from feed, (%);
P—operating pressure in the washer, (bar);
Imp_f—percentage content of dust fraction below 63 μm in feed material, (%);
Dmax—maximum particle of feed, (mm);
Ws—susceptibility of impurities for washing/washing resistance, (no unit);
Mat—type of material.
The washing susceptibility index was estimated on the bases of instruction issued by the Canadian Ministry of Land and Natural Resource Operations [
28]. The document describes methodology and procedures of qualitative description of impurities. The rank from 1 to 3 is assigned for an individual sample. However, the assessment is subjective and is based on the experience of the person conducting the procedure. The obtained value is a specific feature of the tested sample and is constant for the individual material/sample.
Laboratory-scale tests were carried out in a 300-mm-diameter, high-pressure washing drum made of a slotted sieve with a 1- × 35-mm mesh (
Figure 1). The installation was equipped with a rotary drive with a gear and a set of spray nozzles delivering washing water under a given pressure, the working range of which was 0–200 bar. Under the drum there was a tank draining water with washed impurities with an optical sensor counting the solid fraction particles in the washed water. The sample for a single test was representatively separated from the raw material in the amount of about 3500 g. Prior to the washing tests, the feed moisture was measured and particle size analysis was performed. Core test was carried out three times on each sample at the accepted setting of pressure value. The obtained results for individual pressures were averaged.
The water used during the washing tests was a technological water accessible on site. The pH was not determined. However, due to application of high-pressure pumps in the circuit, there was a demand of limitation in the content of particles below 0.1 mm, which could not be higher than 100 mg/dm3.
The material for laboratory investigations was a gravel and crushed-stone carbonate aggregate (limestone). The gravel aggregate was a raw material from domestic deposits. The material had a particle size composition from 0 to 40 mm, and the dusty impurities’ content in feed ranged from 1.21% to 23% by weight (
Table 1). In mineral aggregate production, of more importance is the particle size of impurities than their mineral composition. More detailed investigations on composition of impurities were not carried out; however, clay constituted more than 40%. Apart from the clay, also silt and sand could be identified.
The second type of material was the limestone, with particle size from 0 to 40 mm, and impurities’ content ranging from 2.09% to 29.96% (
Table 2). The structure of impurities was varied, from the dispersed feed covering the particle surface through inclusions in the gaps and pores to compact, plastic lumps.
The feed material in pilot-scale tests constituted a limestone with particle size 0–40. The samples were characterized by an average and high content of impurities, ranging from 3.6% to 31%, which took both an easily removable dispersed form and the compact, plastic lumps with high resistance to disintegration and removal (
Table 3).
Pilot plant-scale investigations were carried out in the Hydro-Clean HC 350 washer (
Figure 2) equipped with a feeding hopper, a drainage screen with a spraying installation, and supporting elements in the form of a pipeline system supplying and discharging the washed water and the control system. Eight tests in total were carried out and the washing effectiveness, measured by degree of impurities’ removal from the feed material, calculated according to Equation (1), was calculated for each single test.
3. Results
3.1. Washing Intensity vs. Washing Time
Figure 3 shows an average intensity of impurities’ washing out, determined on the basis of the tests, in relationship to the pressure in the washer. The analysis of the picture shows that the impurities from the feed were removed the most quickly at the highest operating pressure value. The maximum particle size of washed particles was 0.5 mm, which was determined by the output gap of the washing drum. It can be also noticed that the relationship between the operating pressure in the washer and the duration of the process was hyperbolic, which confirmed the results of previous studies in this field [
29].
3.2. Laboratory Washing of Gravel Aggregate
Results of washing effectiveness in individual tests carried out for the gravel aggregate are presented in
Table 4.
When assessing the efficiency of the washing process for the gravel aggregate, it can be seen that the obtained results were either low or very high in terms of efficiency. The relatively fewest number of results were obtained with average effectiveness, i.e., with values between 75% and 85%. Very high effectiveness refers to the tests with the washer pressure of 100 and 150 bars. Hence, it can be seen that this type of aggregate is relatively easy in removal of dust impurities, provided that the appropriate (i.e., not too low) pressure is applied. The results in the form of a histogram are presented in
Figure 4.
On the bases of obtained results, a regression model of gravel aggregate washing effectiveness was calculated. A general form of the model is given in Equation (3) and detailed results of regression analysis are presented in
Table 5.
The value of an individual coefficient, i.e., a0, a1, a2, a3, and a4, (second column,
Table 5) is statistically significant in the model when the probability (last column of
Table 5) does not exceed an accepted level of significance (α). For the purposes of calculations presented in the paper, a confidence level value (1 − α) equals 0.95. Therefore, when the value in the last column of
Table 5 is greater than 0.05, the coefficient is considered as statistically insignificant and removed from the model. Insignificance of individual coefficient statistically means that it does not contribute an important impact on dependent value Y (washing effectiveness). Inspecting the modeling results presented in
Table 5, it can be seen that coefficient a4 is statistically insignificant because its probability error equals 0.291 and is higher than 0.05.
Insignificant coefficient a4 is connected with the variable characterizing the resistance of impurities’ particles for washing. In the next step of regression procedure, the variable is removed and re-calculation of the model is carried out. Results of regression with an updated set of independent variables are presented in
Table 6. Inspecting the results, it is clear that now all variables are statistically significant because their values of statistical error do not exceed 0.05.
The R squared (R2) value equals 0.844, which means that variables accepted in the model characterize reality in 84.4%, on average. There are some other factors, not incorporated in the model, that describe the reality in further at 15.6%. The value of standard error (SE) equals 0.073, which means that the modeling results can vary from real conditions by 7.3%, on average. The final form of the model is given by Equation (3).
Equation (4) shows that the parameter connected with the maximum size of feed, Dmax, has the highest unit impact of operational washing effectiveness of the device. The relationship between Y and Dmax is inversely proportional, which means that the finer particle, the higher the effectiveness of the washing process. For example, decreasing of maximum feed particle by 1 mm theoretically increases the process effectiveness by 1.13%. However, if we consider the fact that a unit change of operational pressure in the washer is 50 bars, then the pressure P is of the greatest impact on the process effectiveness in the model (3). For example, an increase in pressure value from 50 to 100 bars theoretically increases the washing efficiency by 10%, approximately.
3.3. Laboratory Washing of Crushed-Stone Aggregate
The results obtained for limestone are characterized by a rather high or very high washing efficiency. The fewest number of results were obtained with washing effectiveness lower than 70%, with average with values between 75 and 85%. Only in three cases was the obtained washing efficiency lower than 70%. A histogram of results is presented in
Figure 5.
Complete results of limestone crushing aggregate washing tests in laboratory scale are presented in
Table 7 and results of modeling are shown in
Table 8. The values marked in red font indicate variables statistically insignificant at the accepted level of confidence.
As can be seen, the coefficient a2, standing for the variable “Imp_f”, is statistically insignificant as the value in the last column of the table is higher than 0.05. Thus, in the next stage of modeling, the variable “Imp_f” was withdrawn from the model. The new modeling results are presented in
Table 9.
The R2 value equals 0.727 and standard error SE = 0.110. The final form of the model is given in Equation (5).
The variable with the greatest unit significance is the washing resistance Ws, but if, as for gravel aggregate, it is assumed that the pressure changes not by 1 but by 50, then the weight of two independent variables, i.e., operating pressure and washing resistance, is almost the same.
3.4. Results of Pilot-Scale Tests
Three independent variables were present in the pilot-scale model: Percentage content of impurities in feed, maximum particle size of feed, and washing susceptibility of impurities. Thus, a general form of regression model will be as given by Equation (6). Results of modeling are given in
Table 10 and regression model is presented in Equation (7).
Model determination index, R
2 = 0.88, and standard error SE = 0.066. Only one variable, content of impurities in feed, appeared insignificant in the model. The corrected model is presented in Equation (8) and detailed results are given in
Table 11.
3.5. Analysis of Concrete Quality
Aggregate dusts can be considered as a full-value component of the concrete mix in the form of a filler, improving rheological properties and even creating new concrete phases. On the other hand, it is different in the case of the presence of dust in the aggregate as contamination. By sticking to the particle surface, the aggregate is isolated from the cement grout and the contact zone is weakened. The harmfulness of dusts largely depends on their composition. Crystallites of clay minerals are particularly disadvantageous in this respect, as they are characterized by a large specific surface and layered structure, which favors swelling and adsorption of various chemical compounds (e.g., carboxylates) that are part of the cement modifiers. These properties destroy the bond between the cement matrix and the aggregate. Therefore, it is extremely important to use washed aggregate in the production of concrete mixtures [
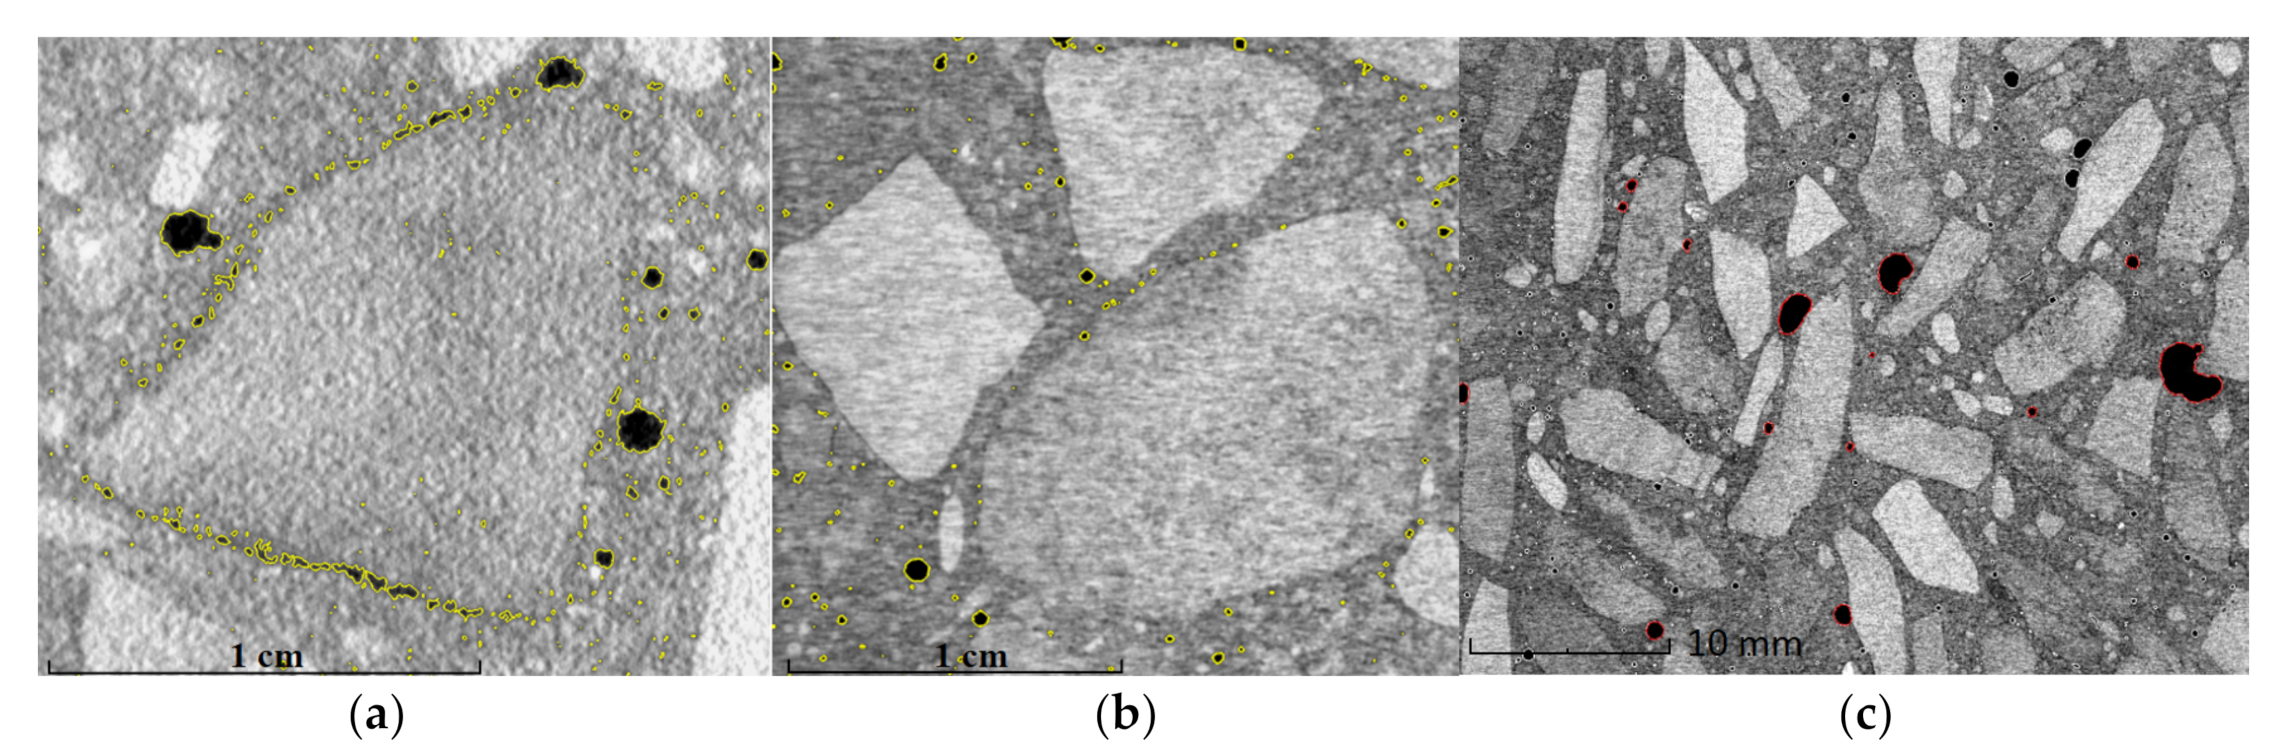
30]. Washing of aggregates is of particular importance in the case of carbonate aggregates because, due to the mechanism of their formation, clay layers may occur in the structure of the deposit. In order to confirm the practical significance of the results of aggregate washing, two samples of concrete mixes were made: The one based on aggregate not subjected to the high-pressure washing process and the second. The analysis of sample by means of computer tomography was then made (
Figure 6).
Imaging tests were performed with the use of tomograph model vtomex m300 GE. The test consists of directing a beam of X-ray onto a sample and registering its intensity on the detector. Creating an image involves measuring the absorption of radiation that passes through the sample. The concrete samples were placed on a rotating table and kept relatively stationary: The radiation cannon and detector, after the 360° full rotation of the sample, obtained a complete picture of the structure. The reconstruction was made using Volume Graphic’s VGStudio Max program (version 2.2).
Inspecting
Figure 6a, there can be seen particles of unwashed aggregate with debonding porosity, i.e., pores formed at the border between aggregate and cement can be observed. Such porosity is a very unfavorable phenomenon. The pores present in the contact layer affect the greater permeability of concrete in this zone, causing lowering of the strength, frost resistance, and other functional parameters [
31].
Aspects of quality and durability of bonds between an aggregate and binder were not considered because the main focus concerned the washing technology. However, investigations on effects of geometrical properties of particles on the quality of the contact zone binder-aggregate were initially carried out. Based on some very preliminary results, it is possible to say that particle shape does not affect the porosity. In case the material contains clayish impurities, small pores appear in the contact layer and they isolate aggregate from the cement.
The porosity of the concrete, resulting from absorbing air while making a mixture, looks different. Flat particles introduce turbulent movement into the mortar and large contact pores are formed at the particle boundaries (
Figure 6c), and, in case of cubic particles, this process is limited. Computer tomography allows distinguishing different types of pores observed in hardened concrete.
Figure 6c shows washed aggregates with flat particles. An absence of fine pores at the surface of the particles (on the contact layer) and the presence of large ones, especially in the corners of the irregular aggregate, can be observed. An impact of mineralogical composition on the washing process and the subsequent quality of concrete mixes is under testing.
4. Discussion of Results
Summary of regression models obtained for all type of conducted tests (lab-scale gravel, lab-scale limestone, pilot-scale limestone) are presented in
Table 12.
The obtained modeling results for individual samples were similar and confirmed the practical observations of the authors. The operating pressure in the washer turned out to be the parameter with the most significant impact on the washing process efficiency. The relationship between pressure, P, and washing effectiveness, Y, was directly proportional, i.e., for higher operating pressure values, higher washing efficiency was observed. However, with further increasing of the pressure, relatively lower increases in washing efficiency were observed, which is also confirmed in literature [
29]. Investigations on the effectiveness of various high-pressure devices also indicated that this relationship can be well described by the hyperbolic or logarithmic function [
32].
For the limestone samples, the content of dust impurities in feed was not significant for the washing efficiency Y. The same conclusions were obtained for both laboratory tests and the verifying pilot-scale processes. This may result from the type of impurities accompanying the limestone aggregates and their different washing susceptibility, where the content of the contaminants is not that important but the possible difficulty in their removal is. The relationship between the washing efficiency and the resistance of impurities to washing, Ws, was inversely proportional and the coefficient for this parameter had the highest value. This parameter determined the effectiveness of the process, measured by the degree of dust impurities’ removal from the limestone at the given value of pressure in the washer device. The modeling results were consistent for both laboratory and pilot-scale tests.
The results of all the washing tests carried out showed an inversely proportional relationship between the particle size distribution of feed and the effectiveness of aggregate washing in the high-pressure washer. This means that a relatively higher efficiency was obtained for a finer material, but the effect of the particle size distribution here was low. Additionally, there may be an important factor of feed particle uniformity, i.e., for narrow particle size fractions the washing efficiency may be higher, but this aspect was not examined in this article.
The fitting of the obtained models to reality, measured by the value of the coefficients of model determination, R2, was high and ranged from R2 = 0.727, obtained for limestone in laboratory conditions, to R2 = 0.88, obtained for washed limestone in pilot-scale tests. Model accuracy for gravel was R2 = 0.84.
Particles after washing in the high-pressure washer were characterized by lower contamination on the surface and, thus, allowed for a significant reduction in the unfavorable phenomenon of debonding porosity in concrete mixes (
Figure 6b). If washed carbonate aggregates are used in concrete, a hydrated calcium-carbonate-aluminate-phase is formed in the contact layer (C
3A·CaCO
3·11H
2O) [
26]. The amount of this phase formed in the cement-aggregate contact layer decreases with moving away from the aggregate grain surface. As a result of this reaction, a contact layer with a more compact microstructure, lower porosity, and permeability is formed in the concrete, which results in greater strength and adhesion to the carbonate aggregate and increased resistance to sulphate corrosion.
5. Conclusions
Results of investigations presented in the paper show that washing process effectiveness depends on the washing device operational parameters, feed characteristics, and type of impurities. Results of laboratory tests show that effectiveness of washing for crushed and gravel aggregates were almost identical. Average effectiveness for crushed limestone aggregate achieved in the testing program was 84.05%, while the same value for the gravel aggregate was 83.98%. For the reason that also standard deviations for both types of aggregates were similar (15.35 and 13.08, respectively), it can be stated that the type of aggregate can be regarded as a parameter with relatively lower impact of effectiveness of a high-pressure washing process.
Both series of laboratory tests confirmed that operating pressure in the washing device has the greatest impact on the obtained effectiveness. The feed characteristics measured through maximum particle size were inversely proportional to process effectiveness, as well as the resistance of impurities for their removal from the material.
From a practical point of view, especially in the concrete industry, the process of aggregate washing is of a fundamental importance. The contact layer between the unwashed aggregate and the binder is characterized by the highest porosity in the entire volume of the cement grout, the obvious effect of which is lower strength compared to the matrix and, thus, faster deterioration of the material.
The obtained results also showed convergence of model achieved in pilot scale with laboratory experiments. These models make it possibly to optimize and control the washing process effectiveness through adjusting of certain process parameters. The models can be developed and extended through application of a larger number of operational parameters. However, it needs to be taken into consideration that too many variables in the model may decrease its determination level. Thus, the process of selection of potential variables to the model should be carried out carefully. The other practical aspect of the issue can be the shape of the functional relationship between independent and dependent variables. More advanced techniques can be applied and nonlinear regression method may be used, but this was out of the scope of the presented investigations. The authors will consider analysis of this problem in future works.
Author Contributions
Conceptualization, D.S. and J.Ł.; methodology D.S.; software, A.S. (Agnieszka Saramak) and D.F.; validation, T.G., A.S. (Agnieszka Saramak), and D.F.; formal analysis, D.S. and A.S. (Agnieszka Saramak); investigation, J.Ł., T.L., and A.S. (Agata Stempkowska); resources, J.Ł.; data curation, A.S. (Agnieszka Saramak) and K.L.; writing—original draft preparation, D.S.; writing—review and editing, A.S. (Agnieszka Saramak), T.G., D.F., A.S. (Agata Stempkowska), and K.L; visualization, J.Ł., A.S. (Agnieszka Saramak), A.S. (Agata Stempkowska), and T.G., supervision, D.S. All authors have read and agreed to the published version of the manuscript.
Funding
The article is the result of the National Center for Research and Development (NCBiR) project: Competition No. 1 under Sub-measure 4.1.4 “Application projects” of POIR in 2017, titled: “Opracowanie i budowa zestawu prototypowych urządzeń technologicznych do budowy innowacyjnego układu technologicznego do uszlachetniania kruszyw mineralnych wraz z przeprowadzeniem ich testów w warunkach zbliżonych do rzeczywistych”. Project is co-financed by the European Union from the sources of European Regional Development Fund under Measure 4.1 of the Intelligent Development Operational Program 2014–2020.
![Resources 09 00119 i001]()
Conflicts of Interest
The authors declare no conflict of interest.
References
- Kozioł, W.; Baic, I. Rock mining in Poland—Current status and conditions for development. Inżynieria Miner. 2018, 2, 65–72. [Google Scholar]
- Galos, K. Changes on the natural crushed aggregates market in Poland after 2000. Work. Min. Inst. Wrocław Uniw. Sci. Technol. 2009, 125, 43–61. [Google Scholar]
- Kozioł, W. Mining and production of gravel and sand aggregates in central area. Surowce Masz. Bud. 2020, 2, 62–69. [Google Scholar]
- Naziemiec, Z. Efficiency of washing aggregates in different washing devices. Work. Inst. Glass Ceram. Build. Mater. 2010, 3, 163–176. [Google Scholar]
- Naziemiec, Z.; Pichniarczyk, P.; Saramak, D. Current Issues of Processing and Industrial Utilization of Chalcedonite. Inz. Miner. 2017, 1, 89–96. [Google Scholar]
- Saramak, A.; Naziemiec, Z. Determination of dust emission level for various crushing devices. Min. Sci. 2019, 26, 45–54. [Google Scholar]
- Arrowsmith, A.; Ashton, N. Air pollution control from the mineral processing industries. Miner. Eng. 1991, 4, 1071–1080. [Google Scholar] [CrossRef]
- Kłosek-Wawrzyn, E.; Łoj, G.; Bugaj, A. Waste sludge from washing dolomite aggregates as a raw material for brick production. Min. Res. Manag. 2019, 35, 37–48. [Google Scholar]
- Naziemiec, Z.; Gawenda, T. Building aggregates production from lime industry waste. Min. Inst. Work. Wroclaw Univ. Technol. 2005, 105, 41–46. [Google Scholar]
- Gonzales-Corrochano, B.; Alonso-Azcarate, J.; Rodas, M. Characterization of lightweight aggregates manufactured from washing aggregate sludge and fly ash. Resour. Conserv. Recycl. 2009, 53, 571–581. [Google Scholar] [CrossRef]
- Kłosek-Wawrzyn, E.; Bugaj, A. Research on the possibility of using sludges from washing dolomite and limestone aggregates in the building ceramics technology. Miner. Resour. Manag. 2018, 34, 65–82. [Google Scholar]
- Al-Otaibi, S.; Al-Bahar, S.; Al-Fadala, S.; Al-Fahad, F.; Abduljaleel, A. Recycling sand-wash fines as synthetic lightweight aggregates. Proc. Inst. Civil Eng. Constr. Mater. 2020, 173, 89–98. [Google Scholar] [CrossRef]
- Morenno-Maroto, J.M.; Gonzales-Corrochano, B.; Alonso-Azcarate, J.; Rodriguez, L.; Acosta, A. Development of lightweight aggregates from stone cutting sludge plastic wastes and sepiolite rejection from agricultural and environmental purposes. J. Environ. Manag. 2017, 200, 229–242. [Google Scholar] [CrossRef] [PubMed]
- Naziemiec, Z. Processing and Testing of Mineral Aggregates; AGH Publishing House: Cracow, Poland, 2019; pp. 1–299. [Google Scholar]
- Gawenda, T. Innovative technologies of the regular particle aggregates production. Min. Sci. 2015, 22, 45–59. [Google Scholar]
- Gawenda, T.; Naziemiec, Z.; Walerak, A. Investigations on selected properties of aggregates from ceramic waste and concrete produced with their participation. Annu. Set Env. Prot. 2013, 15, 2003–2021. [Google Scholar]
- Drew, L.J.; Langer, W.H.; Sachs, J.S. Environmentalism and natural aggregate mining. Nat. Resour. Res. 2002, 11, 19–28. [Google Scholar] [CrossRef]
- Battaglia, A. Dewatering of Beneficiation Products and Water Circuits in Washers; Mining and Metallurgy Publ. House: Katowice, Poland, 1963. [Google Scholar]
- Kobiałka, R.; Naziemiec, Z. Rock raw materials washing—Technological and operational assessment. Min. Inst. Work. Wroclaw Univ. Technol. 2000, 91. [Google Scholar]
- Palombo, S.; Varela, J. High pressure washing technology Hydro-Clean. In Proceedings of the 12th International Conference on Tailings and Mine Waste, Vail, CO, USA, 19–22 October 2008; pp. 113–114. [Google Scholar]
- Zlatev, M. Untersuchung und Bewertung der im Hochdruckreinigungssystem HAVER Hydro-Clean verwendeten Beanspruchungsgrößen. Miner. Process. 2018, 3. Available online: https://www.at-minerals.com/de/artikel/at_Reinigungsprozess_3139591.html (accessed on 25 September 2020).
- Naziemiec, Z.; Gawenda, T.; Łagowski, J. Effectiveness of natural aggregates washing processes carried out in various washing units. BMP Surowce Masz. Bud. 2010, 4. [Google Scholar]
- Łagowski, J. Influence of Operational Parameters of High-Pressure Washing Process of Aggregates on Its Results. Ph.D. Thesis, AGH, Faculty of Mining and Geoengineering, Cracow, Poland, December 2019. [Google Scholar]
- Zlatev, M. Reducing Water and Energy Consumption. Process. Worldw. 2014, 2. [Google Scholar]
- Stempkowska, A.; Wójcik, Ł.; Izak, P.; Staszewska, M.; Mastalska-Popławska, J. Investigation of post-industrial pollutions’ immobilization in a hydraulic self-solidifying clay-cement binder. IOP Conf. Ser. Mater. Sci. Eng. 2018, 427, 1–10. [Google Scholar] [CrossRef] [Green Version]
- Małolepszy, J. Skały węglanowe jako cenne źródło kruszyw do betonu. BTA Architektura 2008, 2, 64–69. [Google Scholar]
- Tumidajski, T.; Saramak, D. Methods and Models of Mathematical Statistics in Mineral Processing; AGH Publishing House: Cracow, Poland, 2009; pp. 1–304. [Google Scholar]
- Canadian Ministry of Land and Natural Resource Operations. Estimating Soil Texture in the Field. Available online: https://www.for.gov.bc.ca/isb/forms/lib/fs238.pdf (accessed on 24 September 2020).
- Łagowski, J.; Lubieniecki, T.; Saramak, D. Assessment of run of the aggregates washing process in the high-pressure washer depending on the operating pressure. Inżynieria Miner. 2013, 14, 49–54. [Google Scholar]
- Lo, C.Y.; Chowdhury, S.H.; Doh, J.H. Recycled aggregate concrete prepared with water-washed aggregates—An investigative study. In Proceedings of the 22nd Australasian Conference on the Mechanics of Structures and Materials, Sydney, Australia, 12–14 December 2012; pp. 1143–1146. [Google Scholar]
- Fladr, J.; Bily, P.; Trtik, T.; Chylik, R.; Hrbek, V. Influence of washing of crushed aggregate on mechanical properties of high-performance concrete containing supplementary cementitious materials. Solid State Phenom. 2020, 309, 26–30. [Google Scholar] [CrossRef]
- Saramak, D. The influence of chosen ore properties on efficiency of HPGR-based grinding circuits. Miner. Resour. Manag. 2011, 27, 33–44. [Google Scholar]
Figure 1.
Installation for laboratory washing tests: (
a) Working chamber of the washer with spray nozzles, (
b) sample prepared for washing tests, (
c) outflow of washed water with the optical sensor [
23].
Figure 1.
Installation for laboratory washing tests: (
a) Working chamber of the washer with spray nozzles, (
b) sample prepared for washing tests, (
c) outflow of washed water with the optical sensor [
23].
Figure 2.
Pilot-scale washing installation Hydro-Clean HC 350 device: (
a) Feeder, (
b) washing unit, (
c) de-watering screen, (
d) power source [
19].
Figure 2.
Pilot-scale washing installation Hydro-Clean HC 350 device: (
a) Feeder, (
b) washing unit, (
c) de-watering screen, (
d) power source [
19].
Figure 3.
Average number of washed particles of impurities during the process for various washing pressures.
Figure 3.
Average number of washed particles of impurities during the process for various washing pressures.
Figure 4.
Histogram of washing effectiveness values achieved for the gravel aggregate in laboratory scale.
Figure 4.
Histogram of washing effectiveness values achieved for the gravel aggregate in laboratory scale.
Figure 5.
Histogram of washing effectiveness values achieved for the limestone crushed aggregate in laboratory scale.
Figure 5.
Histogram of washing effectiveness values achieved for the limestone crushed aggregate in laboratory scale.
Figure 6.
Image of aggregate used in cement production without washing (a) and after high-pressure washing (b) and with irregular particles (c), obtained by computer tomography.
Figure 6.
Image of aggregate used in cement production without washing (a) and after high-pressure washing (b) and with irregular particles (c), obtained by computer tomography.
Table 1.
Set of gravel aggregate samples for laboratory washing tests.
Table 1.
Set of gravel aggregate samples for laboratory washing tests.
| Sample Number | Maximum Particle (mm) | Feed Impurities (%) | Washing Resistance |
|---|
| 1 | 40 | 4.74 | 3 |
| 2 | 40 | 5.48 | 2 |
| 3 | 40 | 3.43 | 1 |
| 4 | 40 | 17.37 | 3 |
| 5 | 40 | 23.94 | 2 |
| 6 | 40 | 10.3 | 1 |
| 7 | 32 | 1.21 | 3 |
| 8 | 32 | 6.03 | 2 |
| 9 | 32 | 2.43 | 1 |
| 10 | 32 | 16.21 | 3 |
| 11 | 32 | 19.03 | 2 |
| 12 | 32 | 13.45 | 1 |
Table 2.
Set of limestone aggregate samples for laboratory washing tests.
Table 2.
Set of limestone aggregate samples for laboratory washing tests.
| Sample Number | Maximum Particle (mm) | Feed Impurities (%) | Washing Resistance |
|---|
| 1 | 40 | 14.70 | 3 |
| 2 | 40 | 6.69 | 2 |
| 3 | 40 | 2.09 | 1 |
| 4 | 40 | 20.30 | 3 |
| 5 | 40 | 27.1 | 2 |
| 6 | 40 | 21.31 | 1 |
| 7 | 32 | 9.93 | 3 |
| 8 | 32 | 8.61 | 2 |
| 9 | 32 | 6.72 | 1 |
| 10 | 32 | 29.96 | 3 |
| 11 | 32 | 25.9 | 2 |
| 12 | 32 | 20.67 | 1 |
Table 3.
Set of limestone samples subjected to pilot-scale tests.
Table 3.
Set of limestone samples subjected to pilot-scale tests.
| Maximum Particle (mm) | Feed Impurities (%) | Washing Resistance |
|---|
| 40 | 22.0 | 1 |
| 40 | 31.0 | 2 |
| 40 | 3.6 | 1 |
| 40 | 9.5 | 2 |
| 32 | 21.5 | 1 |
| 32 | 26.7 | 2 |
| 32 | 9.9 | 1 |
| 32 | 10.3 | 2 |
Table 4.
Results of gravel washing tests in laboratory scale. Values of impurities are given by weight.
Table 4.
Results of gravel washing tests in laboratory scale. Values of impurities are given by weight.
| Sample Number | Pressure (bar) | Feed Impurities (%) | Product Impurities (%) | Y (%) |
|---|
| 1 | 50 | 4.74 | 2.3 | 51.48 |
| 100 | 1.1 | 76.79 |
| 150 | 0.4 | 91.56 |
| 2 | 50 | 5.48 | 1.9 | 65.33 |
| 100 | 1.1 | 79.93 |
| 150 | 0.5 | 90.88 |
| 3 | 50 | 3.43 | 0.9 | 73.76 |
| 100 | 0.7 | 79.59 |
| 150 | 0.3 | 91.25 |
| 4 | 50 | 17.37 | 5.5 | 68.34 |
| 100 | 2.9 | 83.30 |
| 150 | 1.8 | 89.64 |
| 5 | 50 | 23.94 | 2.4 | 89.97 |
| 100 | 1.1 | 95.41 |
| 150 | 0.4 | 98.33 |
| 6 | 50 | 10.3 | 5.1 | 50.49 |
| 100 | 2.9 | 71.84 |
| 150 | 1.5 | 85.44 |
| 7 | 50 | 1.21 | 0.4 | 66.94 |
| 100 | 0.2 | 83.47 |
| 150 | 0.1 | 91.74 |
| 8 | 50 | 6.03 | 1.7 | 71.81 |
| 100 | 0.9 | 85.07 |
| 150 | 0.3 | 95.02 |
| 9 | 50 | 2.43 | 0.9 | 62.96 |
| 100 | 0.3 | 87.65 |
| 150 | 0.1 | 95.88 |
| 10 | 50 | 16.21 | 1.9 | 88.28 |
| 100 | 1.4 | 91.36 |
| 150 | 1 | 93.83 |
| 11 | 50 | 19.03 | 1.9 | 90.02 |
| 100 | 0.9 | 95.27 |
| 150 | 0.5 | 97.37 |
| 12 | 50 | 13.45 | 0.6 | 95.54 |
| 100 | 0.2 | 98.51 |
| 150 | 0.1 | 99.26 |
Table 5.
Results of multiple regression calculations—gravel aggregate, first step.
Table 5.
Results of multiple regression calculations—gravel aggregate, first step.
| Coefficient | Coefficient Value | Estimation Error of Coefficient | t-Stud Value | Probability Error |
|---|
| a0 | 99.085 | 11.173 | 8.868 | >0.0001 |
| a1 | 0.205 | 0.030 | 6.843 | >0.0001 |
| a2 | 0.788 | 0.172 | 4.587 | >0.0001 |
| a3 | −1.131 | 0.288 | −3.928 | 0.0004 |
| a4 | −1.621 | 1.509 | −1.074 | 0.291 |
Table 6.
Results of multiple regression calculations—gravel aggregate, second (and final) step.
Table 6.
Results of multiple regression calculations—gravel aggregate, second (and final) step.
| Coefficient | Coefficient Value | Estimation Error of Coefficient | t-Stud Value | Probability Error |
|---|
| a0 | 95.986 | 10.82 | 8.868 | >0.0001 |
| a1 | 0.204 | 0.030 | 6.82 | >0.0001 |
| a2 | 0.761 | 0.170 | 4.470 | >0.0001 |
| a3 | −1.130 | 0.288 | −3.91 | 0.0004 |
Table 7.
Results of limestone feed washing in laboratory scale. Values of impurities are given by weight.
Table 7.
Results of limestone feed washing in laboratory scale. Values of impurities are given by weight.
| Sample Number | Pressure (bar) | Feed Impurities (%) | Product Impurities (%) | Y (%) |
|---|
| 1 | 50 | 14.7 | 5.4 | 63.27 |
| 100 | 3.1 | 78.91 |
| 150 | 1.9 | 87.07 |
| 2 | 50 | 6.69 | 1.1 | 83.56 |
| 100 | 0.5 | 92.53 |
| 150 | 0.2 | 97.01 |
| 3 | 50 | 2.09 | 0.5 | 76.08 |
| 100 | 0.2 | 90.43 |
| 150 | 0.1 | 95.22 |
| 4 | 50 | 20.3 | 10.6 | 47.78 |
| 100 | 7.9 | 61.08 |
| 150 | 4.2 | 79.31 |
| 5 | 50 | 27.1 | 11 | 59.41 |
| 100 | 5 | 81.55 |
| 150 | 3 | 88.93 |
| 6 | 50 | 21.31 | 4.5 | 78.88 |
| 100 | 2.7 | 87.33 |
| 150 | 1.9 | 91.08 |
| 7 | 50 | 9.93 | 6.1 | 38.57 |
| 100 | 3.9 | 60.73 |
| 150 | 2.7 | 72.81 |
| 8 | 50 | 8.61 | 1.9 | 77.93 |
| 100 | 1 | 88.39 |
| 150 | 0.3 | 96.52 |
| 9 | 50 | 6.72 | 0.5 | 92.56 |
| 100 | 0.2 | 97.02 |
| 150 | 0.1 | 98.51 |
| 10 | 50 | 29.96 | 2.2 | 92.66 |
| 100 | 1.2 | 95.99 |
| 150 | 0.5 | 98.33 |
| 11 | 50 | 25.9 | 1.9 | 92.66 |
| 100 | 0.9 | 96.53 |
| 150 | 0.3 | 98.84 |
| 12 | 50 | 20.67 | 1.3 | 93.71 |
| 100 | 0.9 | 95.65 |
| 150 | 0.2 | 99.03 |
Table 8.
Results of multiple regression calculations—crushed limestone aggregate, first step.
Table 8.
Results of multiple regression calculations—crushed limestone aggregate, first step.
| Coefficient | Coefficient Value | Estimation Error of Coefficient | t-Stud Value | Probability Error |
|---|
| a0 | 114.092 | 16.868 | 6.764 | >0.0001 |
| a1 | 0.171 | 0.044 | 3.88 | 0.0005 |
| a2 | 0.322 | 0.212 | 1.511 | 0.14 |
| a3 | −0.900 | 0.426 | −2.111 | 0.043 |
| a4 | −10.913 | 2.297 | −4.394 | 0.0001 |
Table 9.
Results of multiple regression calculations—crushed limestone aggregate, second (and final) step.
Table 9.
Results of multiple regression calculations—crushed limestone aggregate, second (and final) step.
| Coefficient | Coefficient Value | Estimation Error of Coefficient | t-Stud Value | Probability Error |
|---|
| a0 | 119.517 | 16.813 | 7.108 | >0.0001 |
| a1 | 0.171 | 0.045 | 3.81 | 0.0006 |
| a3 | −0.961 | 0.432 | −2.222 | 0.033 |
| a4 | −9.124 | 2.250 | −4.055 | 0.0003 |
Table 10.
Results of multiple regression calculations—crushed limestone aggregate, first step.
Table 10.
Results of multiple regression calculations—crushed limestone aggregate, first step.
| Coefficient | Coefficient Value | Estimation Error of Coefficient | t-Stud Value | Probability Error |
|---|
| a0 | 137.9036 | 11.68744 | 11.7993 | >0.0001 |
| a1 | −0.74567 | 0.408131 | −1.82703 | 0.14 |
| a2 | −0.26124 | 0.103177 | −2.53196 | 0.06 |
| a3 | −11.9691 | 2.720575 | −4.39946 | 0.01 |
Table 11.
Results of multiple regression calculations—crushed limestone aggregate, second (and final) step.
Table 11.
Results of multiple regression calculations—crushed limestone aggregate, second (and final) step.
| Coefficient | Coefficient Value | Estimation Error of Coefficient | t-Stud Value | Probability Error |
|---|
| a0 | 121.5716 | 9.121208 | 13.32846 | >0.0001 |
| a2 | −0.27044 | 0.124844 | −2.16623 | 0.08 |
| a3 | −11.4844 | 3.28013 | −3.50119 | 0.017 |
Table 12.
Summary results of modeling.
Table 12.
Summary results of modeling.
| Type of Test | Pressure
P | Feed Impurities Imp_f | Max. Particle Dmax | Washing Resistance Ws |
|---|
| Gravel, lab | 0.204 | 0.706 | −1.13 | Not significant |
| Limestone, lab | 0.171 | Not significant | −0.961 | −9.124 |
| Limestone, pilot | Not tested | Not significant | −0.27 | −11.48 |
© 2020 by the authors. Licensee MDPI, Basel, Switzerland. This article is an open access article distributed under the terms and conditions of the Creative Commons Attribution (CC BY) license (http://creativecommons.org/licenses/by/4.0/).

 ,
, 


