Smart Agricultural Machine with a Computer Vision-Based Weeding and Variable-Rate Irrigation Scheme


Department of Biomechatronics Engineering, National Pingtung University of Science and Technology, Pingtung 91201, Taiwan
*
Author to whom correspondence should be addressed.
Robotics 2018, 7(3), 38; https://0-doi-org.brum.beds.ac.uk/10.3390/robotics7030038
Submission received: 4 June 2018
/
Revised: 1 July 2018
/
Accepted: 17 July 2018
/
Published: 19 July 2018
(This article belongs to the Special Issue Agricultural and Field Robotics)
Abstract
:This paper proposes a scheme that combines computer vision and multi-tasking processes to develop a small-scale smart agricultural machine that can automatically weed and perform variable rate irrigation within a cultivated field. Image processing methods such as HSV (hue (H), saturation (S), value (V)) color conversion, estimation of thresholds during the image binary segmentation process, and morphology operator procedures are used to confirm the position of the plant and weeds, and those results are used to perform weeding and watering operations. Furthermore, the data on the wet distribution area of surface soil (WDAS) and the moisture content of the deep soil is provided to a fuzzy logic controller, which drives pumps to perform variable rate irrigation and to achieve water savings. The proposed system has been implemented in small machines and the experimental results show that the system can classify plant and weeds in real time with an average classification rate of 90% or higher. This allows the machine to do weeding and watering while maintaining the moisture content of the deep soil at 80 ± 10% and an average weeding rate of 90%.
1. Introduction
Traditional agricultural models utilize inefficient and labor intensive human labor. When automation and mechanization technology matured, tractors replaced moving farming machines in place of livestock. This was a solution to solve the issues of insufficient labor and the aging farming population [1]. Today’s automated tilling machines are mainly categorized as planting and irrigation equipment; however, plant nursery operations often include weeding, the spreading of fertilizers, and watering as they are critical cultivation tasks.
To complete weed control tasks, machine devices such as weed mowers or spray machines can be used and operated via manual control or tractors [2]. However, these methods require indiscriminate spraying, watering, or weed removal operations. When utilized in inter-row or intra-row weed removal, human error can often cause damage to crops and excessive watering can lead to the rotting of roots or leaves. In the early stages, the use of herbicides does not suppress weed growth effectively, due to the diversity of weed varieties and the issue of drug resistance. Next, inadequate dosage control can adversely affect the soil and crop growth. This is also true for watering and fertilizing. Lastly, these machines are powered by petrol engines that can cause air pollution and harm our health. Therefore, the variable rate spraying with herbicides and the development of smart weeding machines are the most common practices in recent years.
At present, many studies focus on the design and experiment of the smart weeding machine, including the use of digital cameras to capture large-scale field images and the adoption of machine vision technique to find rows of crops and to perform weeding operations [3,4,5,6]. The shape descriptors in combination with the fuzzy decision-making method are also employed to classify weed species [7].
Besides, several researches also concentrate on the implementation and testing of automatic weeding machines including the use of proximity sensors to identify crop positions [8,9,10] or the use of robots with visual imaging capabilities to locate the position of weeds and employ a special steerage hoe [11,12], tube stamp [13], or laser device [14,15] to remove the weeds. In addition, a combination of chemical and mechanical methods are also utilized to destroy the weeds [16]. Some modular weeding mechanisms are also implemented [17]. These smart weeding machines rely on the performance of the machine vision system to conduct weeding and visual guidance. However, the uncertainty factors, including illumination and different colors of leaf or soil, affect the performance of the machine vision system [18]. The results of Hamuda et al. (2013) and Yang et al. (2015) indicated that HSV-based image processing methods improve the robustness of the machine’s vision [19,20], and these methods can reduce the effect of natural illumination during image processing. Some studies also propose good classification methods that depict the difference between shades of green from varying brightness or contrast for green crops [21,22]. In 2018, Shu et al. proposed a method that was based on color space conversion and multi-level threshold [23]. It can be used to segment the vegetation under shadowy conditions and has been proven to be feasible in real-world applications. Some start-up companies in the market, such as ecoRobotix and Blue River (which was acquired by John Deer in 2017), have the ability to develop smart machines which selectively use herbicides to destroy weeds [24,25]. The use of this method can reduce the amount of herbicide and decrease the damage to the soil. Some other applications using machine vision technology, such as fruit sorting or harvesting, have also been presented in recent years [26,27].
Today, the machine vision technology has been sensibly applied to the field to separate crops from weeds, and can be used as a useful tool for precision agriculture in the future. Nevertheless, such technology still needs to be effectively integrated into the machine. Inappropriate integration practices can result in the unstable and inaccurate performance of the robot. Besides, as the machines that were mentioned above only possessed weeding functions, and other tasks required different machinery, they thus lack flexibility.
To address this issue, this paper proposes a multi-functional smart machine (Supplementary Materials) that can automatically remove weeds while also allowing for variable rate irrigation. The digital camera device of this machine can capture images of growth areas under the machine in real time and use HSV and adaptive threshold methods to distinguish crops from weed areas and estimate the wet distribution area of the surface soil (WDAS), such that the machinery can automatically respond to specific areas with weeding or watering. This scheme allows for the removal of weeds while leaving the crop unharmed. In addition, the modularized mechanism can be used to provide different functions, such as turning soil or sowing. Furthermore, the use of the fuzzy logic control method determines the amount of water that is given to crops depending on the soil moisture content of the root depth and the wet distribution area of the surface soil to ensure that the soil maintains the appropriate moisture rate.
This paper is organized as follows: Section 2 details the procedures and the steps in designing the method, including image processing, variable rate irrigation, and multi-tasking operations; Section 3 describes the design method of the operating mechanism and the computer vision system; Section 4 contains the experimental results and the discussion, while the final chapter contains the conclusion.
2. Materials and Methods
The scheme that is proposed in this paper includes the use of the image processing technique to classify crops and weeds and also to estimate the WDAS, the fuzzy logic control method to obtain the pulse width modulation (PWM) level to drive the water pump, and multi-tasking processes to execute weeding and variable rate irrigation.
2.1. Image Processing Technique
Since brightness and color contrast differ in each image, the adaptive threshold method uses brightness and color values to automatically adjust the threshold level that is required during the segmentation process, such that the feature can be successfully extracted and classified from the image.
2.1.1. Weed/Plant Classification
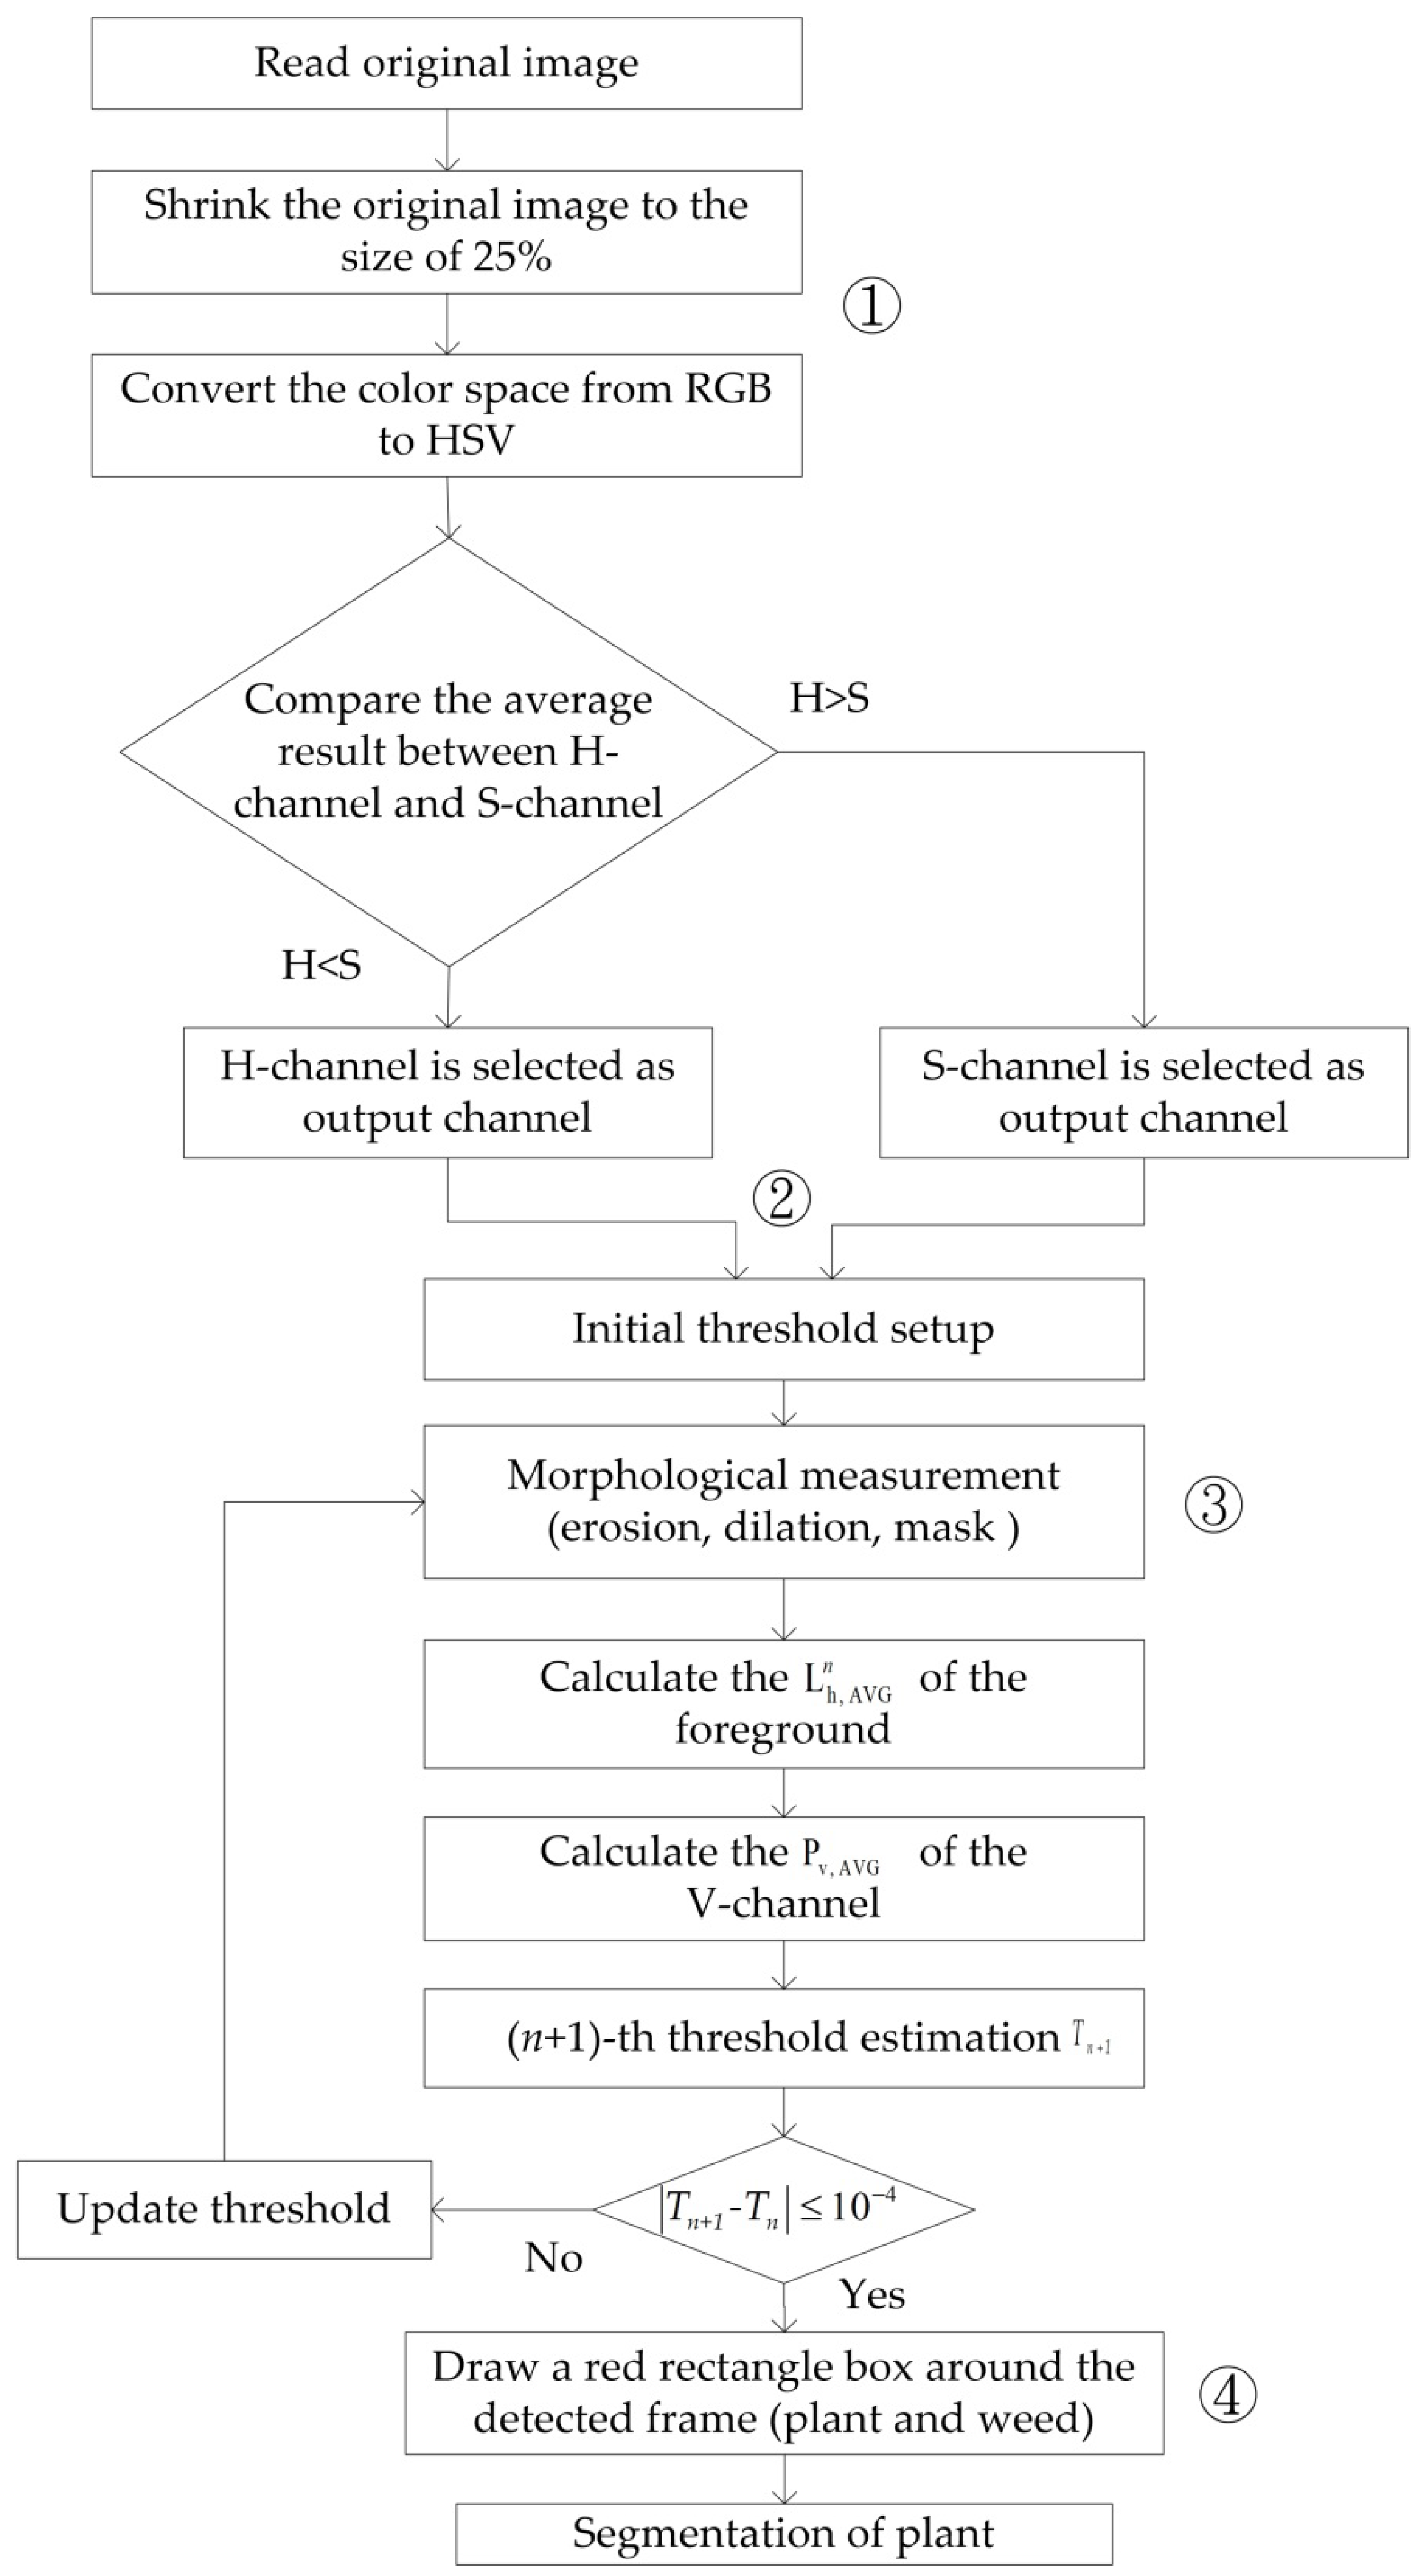
The flowchart of image processing with the adaptive threshold method is depicted in Figure 1. The colors of an image are often described using red (R), green (G), and blue (B) as the three primary colors which are combined to form the RGB color space. This expression method can be used to convey the color of every single pixel in the image in relation to the red, green, and blue channels; however, it is not easy to obtain pixel luminance, saturation, and hue with this method, and thus, a hue (H), saturation (S), and value (V) (known as HSV) color model can better emulate the human perception of color than an RGB model. This is why the 8-bit digital image that is captured by the camera is converted from RGB to HSV during image pre-processing. It is assumed that the image has been shrunk by 25% (see Figure 2a) and that the new image’s dimensions are length (I) × width (J) or a binary matrix and that every pixel in the matrix , where i = 1, 2, 3…, I and j = 1, 2, …, J, shows red, green, and blue color values that are represented as , , and , and that these values are between 0 and 225. Equation (1) represents the HSV color space and the pixels hue value , saturation value , and value in the color space and their conversion relationship with the RGB color model.
where , .
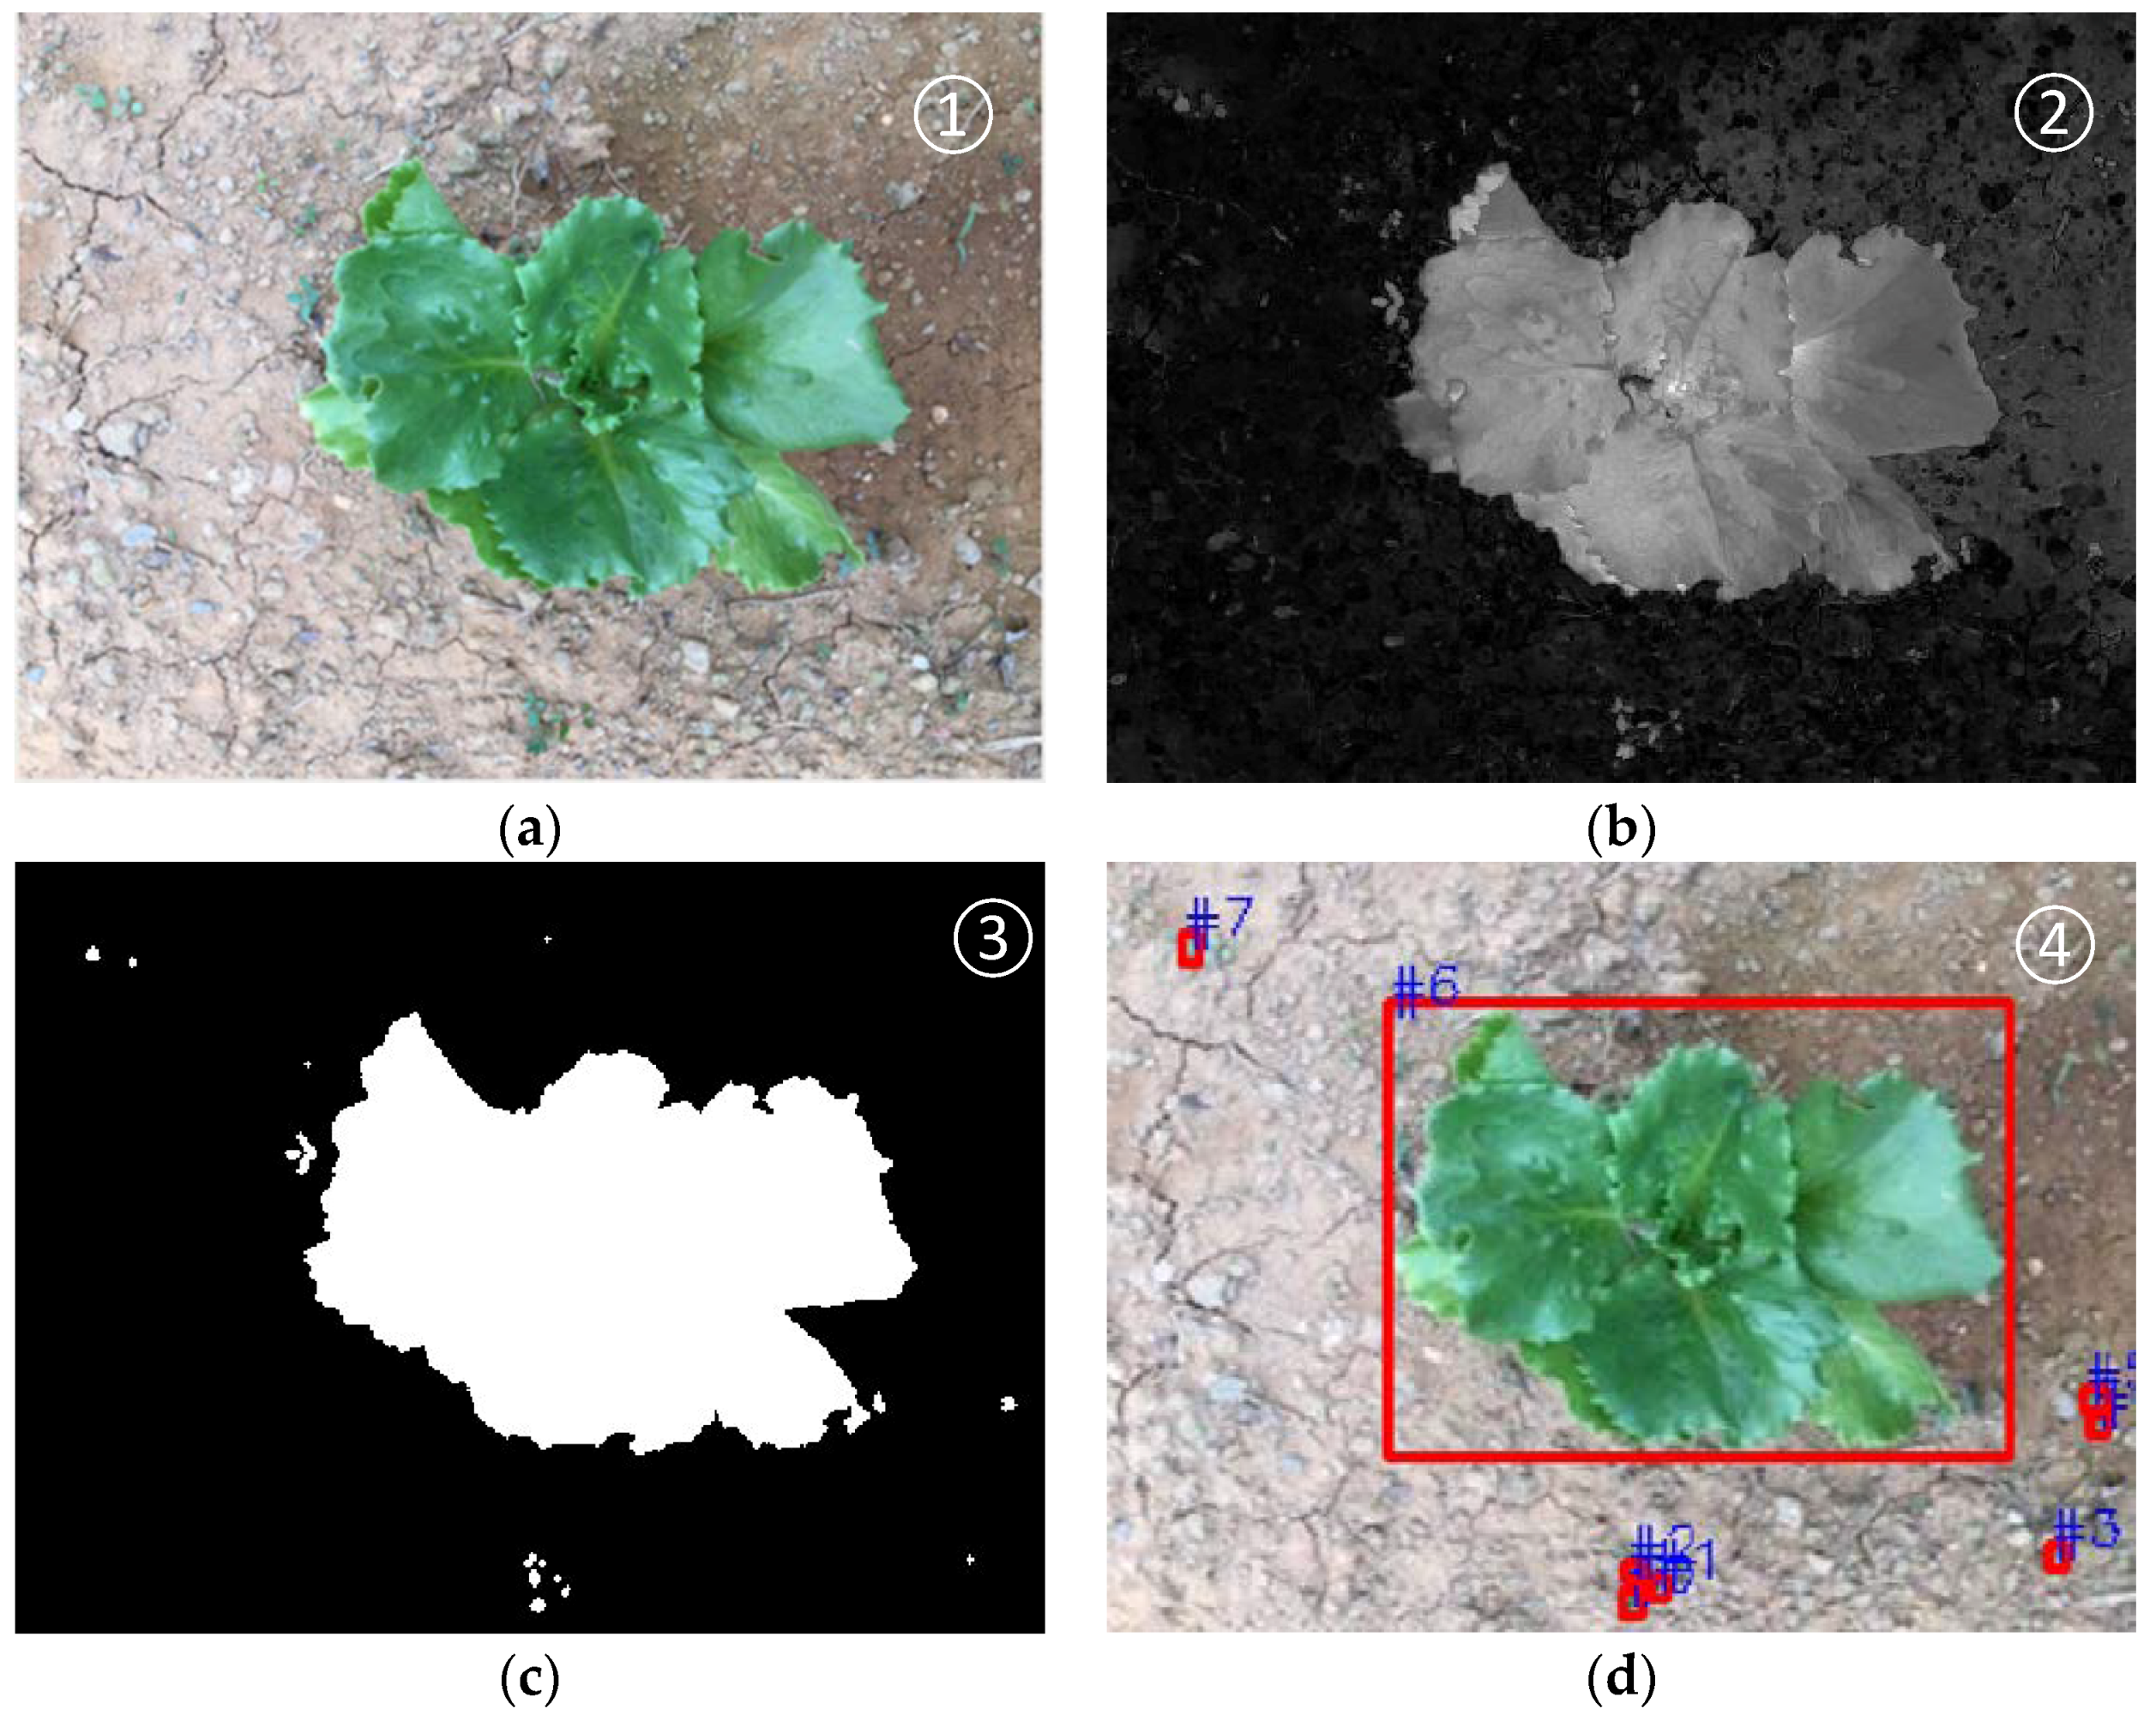
Next, the adaptive thresholding method is employed to create the binary image from the H-channel or S-channel of the HSV image. First, the plants and weeds are defined as target objects with a similar color and it is assumed that the obtained information only contains green plants and the color of soil (background), then the average hue value and the average saturation value are calculated from the H-channel and S-channel, respectively. Second, the less of the two average values above is selected to become the desired output channel (see Figure 2b). The selection of the lesser average value can prevent too much soil in the image from being mistaken as a green object. On the other hand, it is easy to reach the segmentation process by taking the lesser average value than by taking a larger value.
Third, the initial threshold is set as () and the binary segmentation process for the channel then begins. Assume that the threshold is defined as
where represents the average hue value in the target area within the image that is filled with plants and weeds, this value is between 0 and 1; the average value of brightness on the V-channel is represented as . The final threshold will be obtained once the termination condition is achieved during the binary segmentation process. This optimization method can effectively separate the image background and objects with an iteration process. After that, the morphology method is used on the binary image to emphasize the target features of the image with processing steps that include masking, erosion, dilation, connected-component labeling, or local descriptors (see Figure 2c). Finally, connected markings are then utilized to mark the position of the plant and weeds and to count the number of weeds (see the Figure 2d). The red box signifies plant and weed, whereas blue signifies the serial number of green objects. The plants are acquired by using the maximum area method from the binary image and the remaining are weeds.
2.1.2. Soil Surfaces Moisture Content Estimation
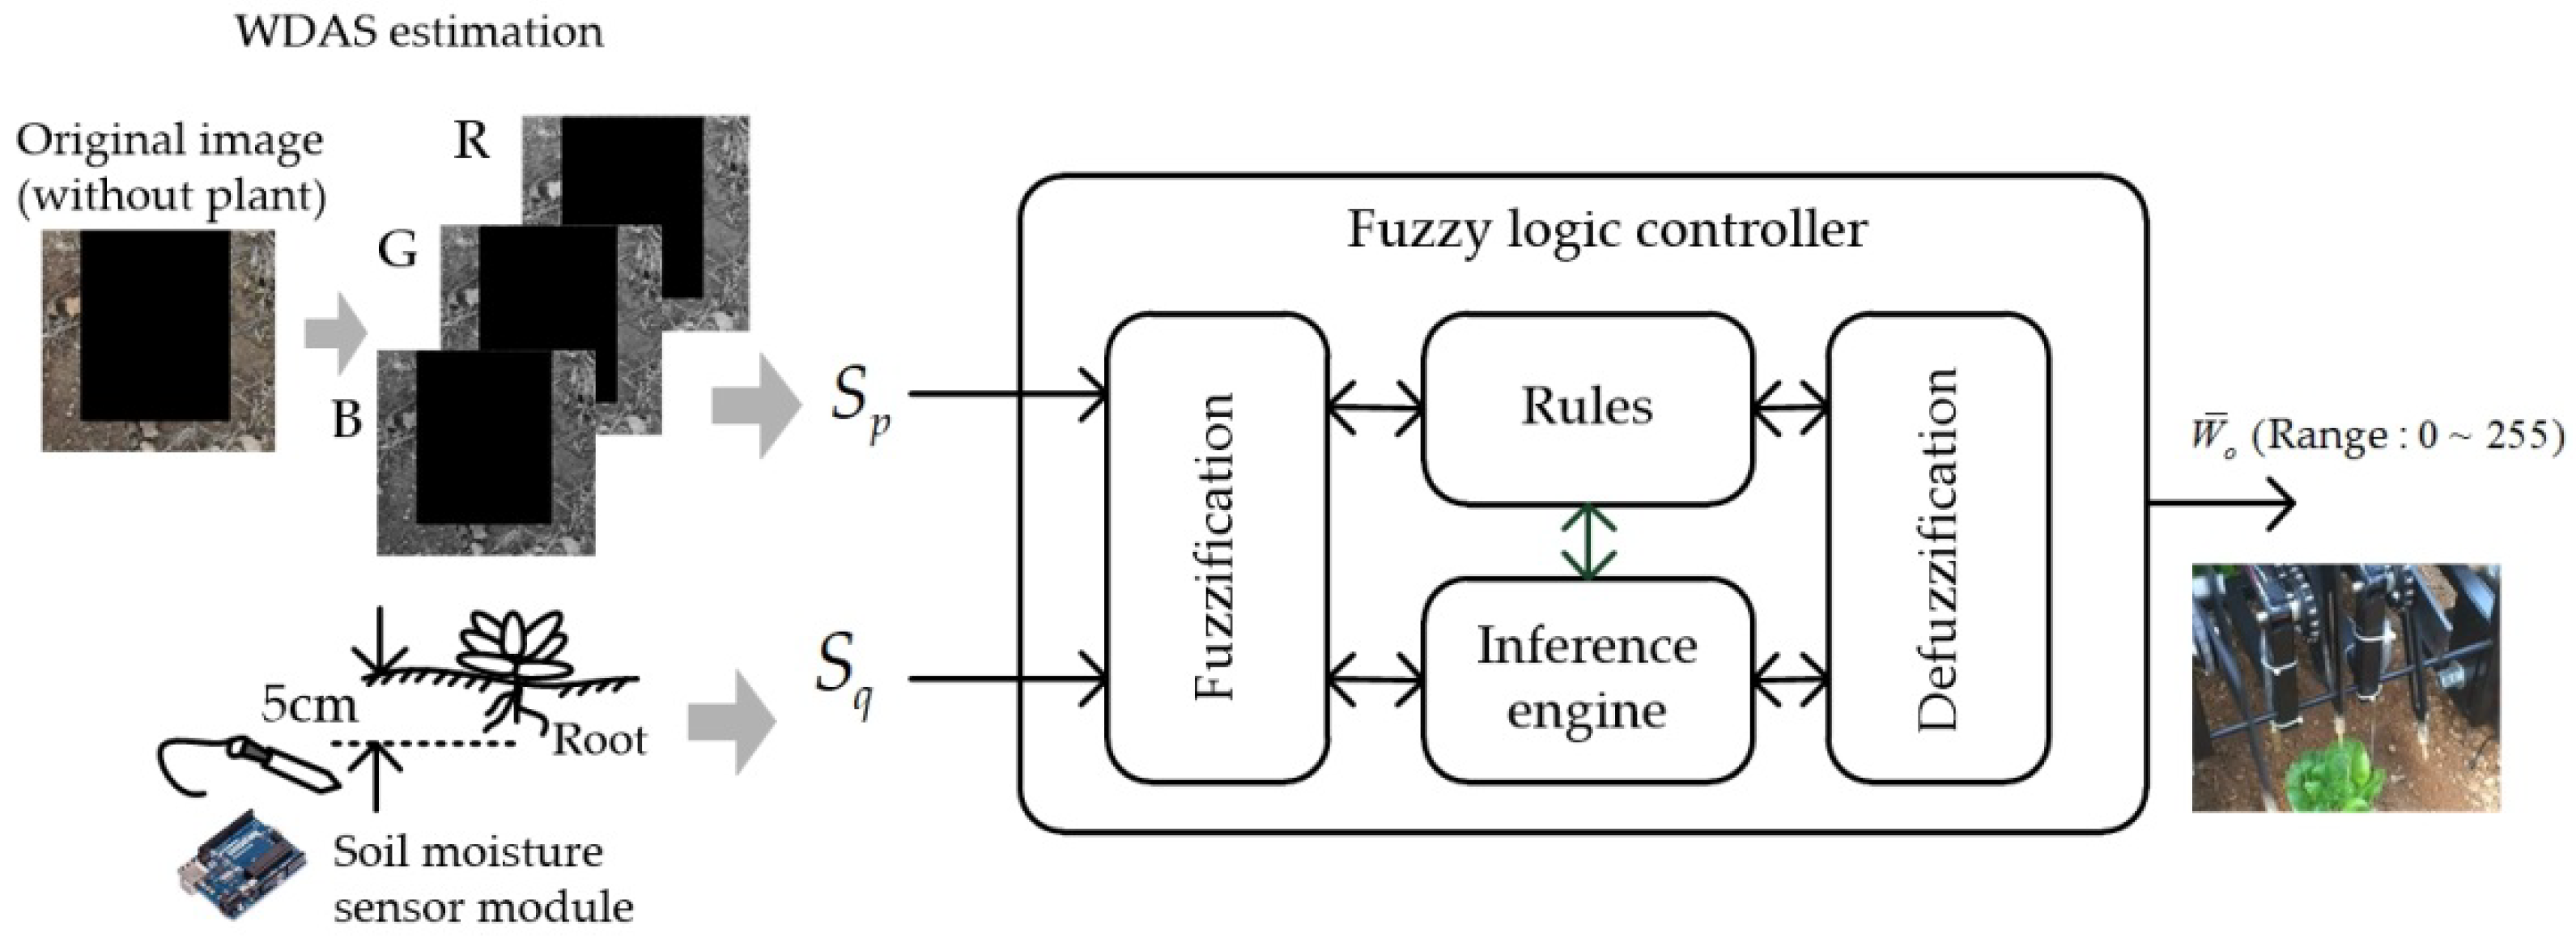
Excessive or insufficient soil moisture content at the roots of the plants can affect plant growth. In addition, the appropriate control of moisture content of soil surfaces can delay the growth rate of weeds. The image processing method is also utilized to estimate the WDAS by first using the area description sub-operation method to convert the green objects in ROI of the image into black objects. Next, with only the soil images (small quantities of weeds are not considered), the average R, G, and B channels of the soil image are calculated, and the three values are then averaged and defined as WDAS. A larger value indicates that the color of the soil tends to be dark brown. It means that the larger this WDAS is, the bigger the surface value that is occupied by wet soil. Conversely, the smaller the value, the greater the area that is occupied by dry soil. This method provides similar performance compared to that of the previous proposed method in [28].
2.2. Variable Rate Irrigation Method
Fuzzy logic controller (FLC) utilize linguistic rules that are based on professional experience and utilize inference methods to make fuzzy comprehensive decisions [29,30]. In this paper, WDAS () and Soil Moisture Content (SMC; ) are input variables of the controller, while the output variable is the PWM drive voltage () that controls the speed of the pump. Figure 3 demonstrates the variable rate irrigation method using FLC.
The is acquired by the moisture sensor which is inserted in the soil under the roots of the plant. The fuzzy set utilizes the types of triangle and trapezoid membership functions that are served as fuzzy set and each fuzzy set has a linguistic label that is used for definitions. The labels contain: wet (W), normal (N), dry (D), high (H), mid (M), and low (L). Variable values address the corresponding degree values in each fuzzy set. Table 1 details the input/output variables of the fuzzy sets and their membership function distribution area.
Table 1, , , and depict the physical values corresponding to the three vertexes of the triangular membership function. The symbol is extra vertexes for trapezoidal membership function. , , and depict the WDAS, SMC, and PWM output variable. Then, the analysis of the fuzzy inference is executed, which is the core of the fuzzy logic control. The aim is to match the membership function degree to the input variable and perform the intersection and union operation that is established by the simulated inference rule for decision-making. The paper employs the [maximum-minimum method] of the Mamdani fuzzy model for inference. The fuzzy rule syntax is “[If]…and…[then]…”. The expert experience are used to establish a rule database as shown in Table 2. For example, the depiction of the fuzzy rule in Table 2 is as follows.
Rule 1: If {( is W) and ( is L)} then {( is H)}
Rule 2: If {( is W) and ( is M)} then {( is L)}
Rule 3: If {( is W) and ( is H)} then {( is L)}
…
Rule 9: If {( is D) and ( is H)} then {( is L)}
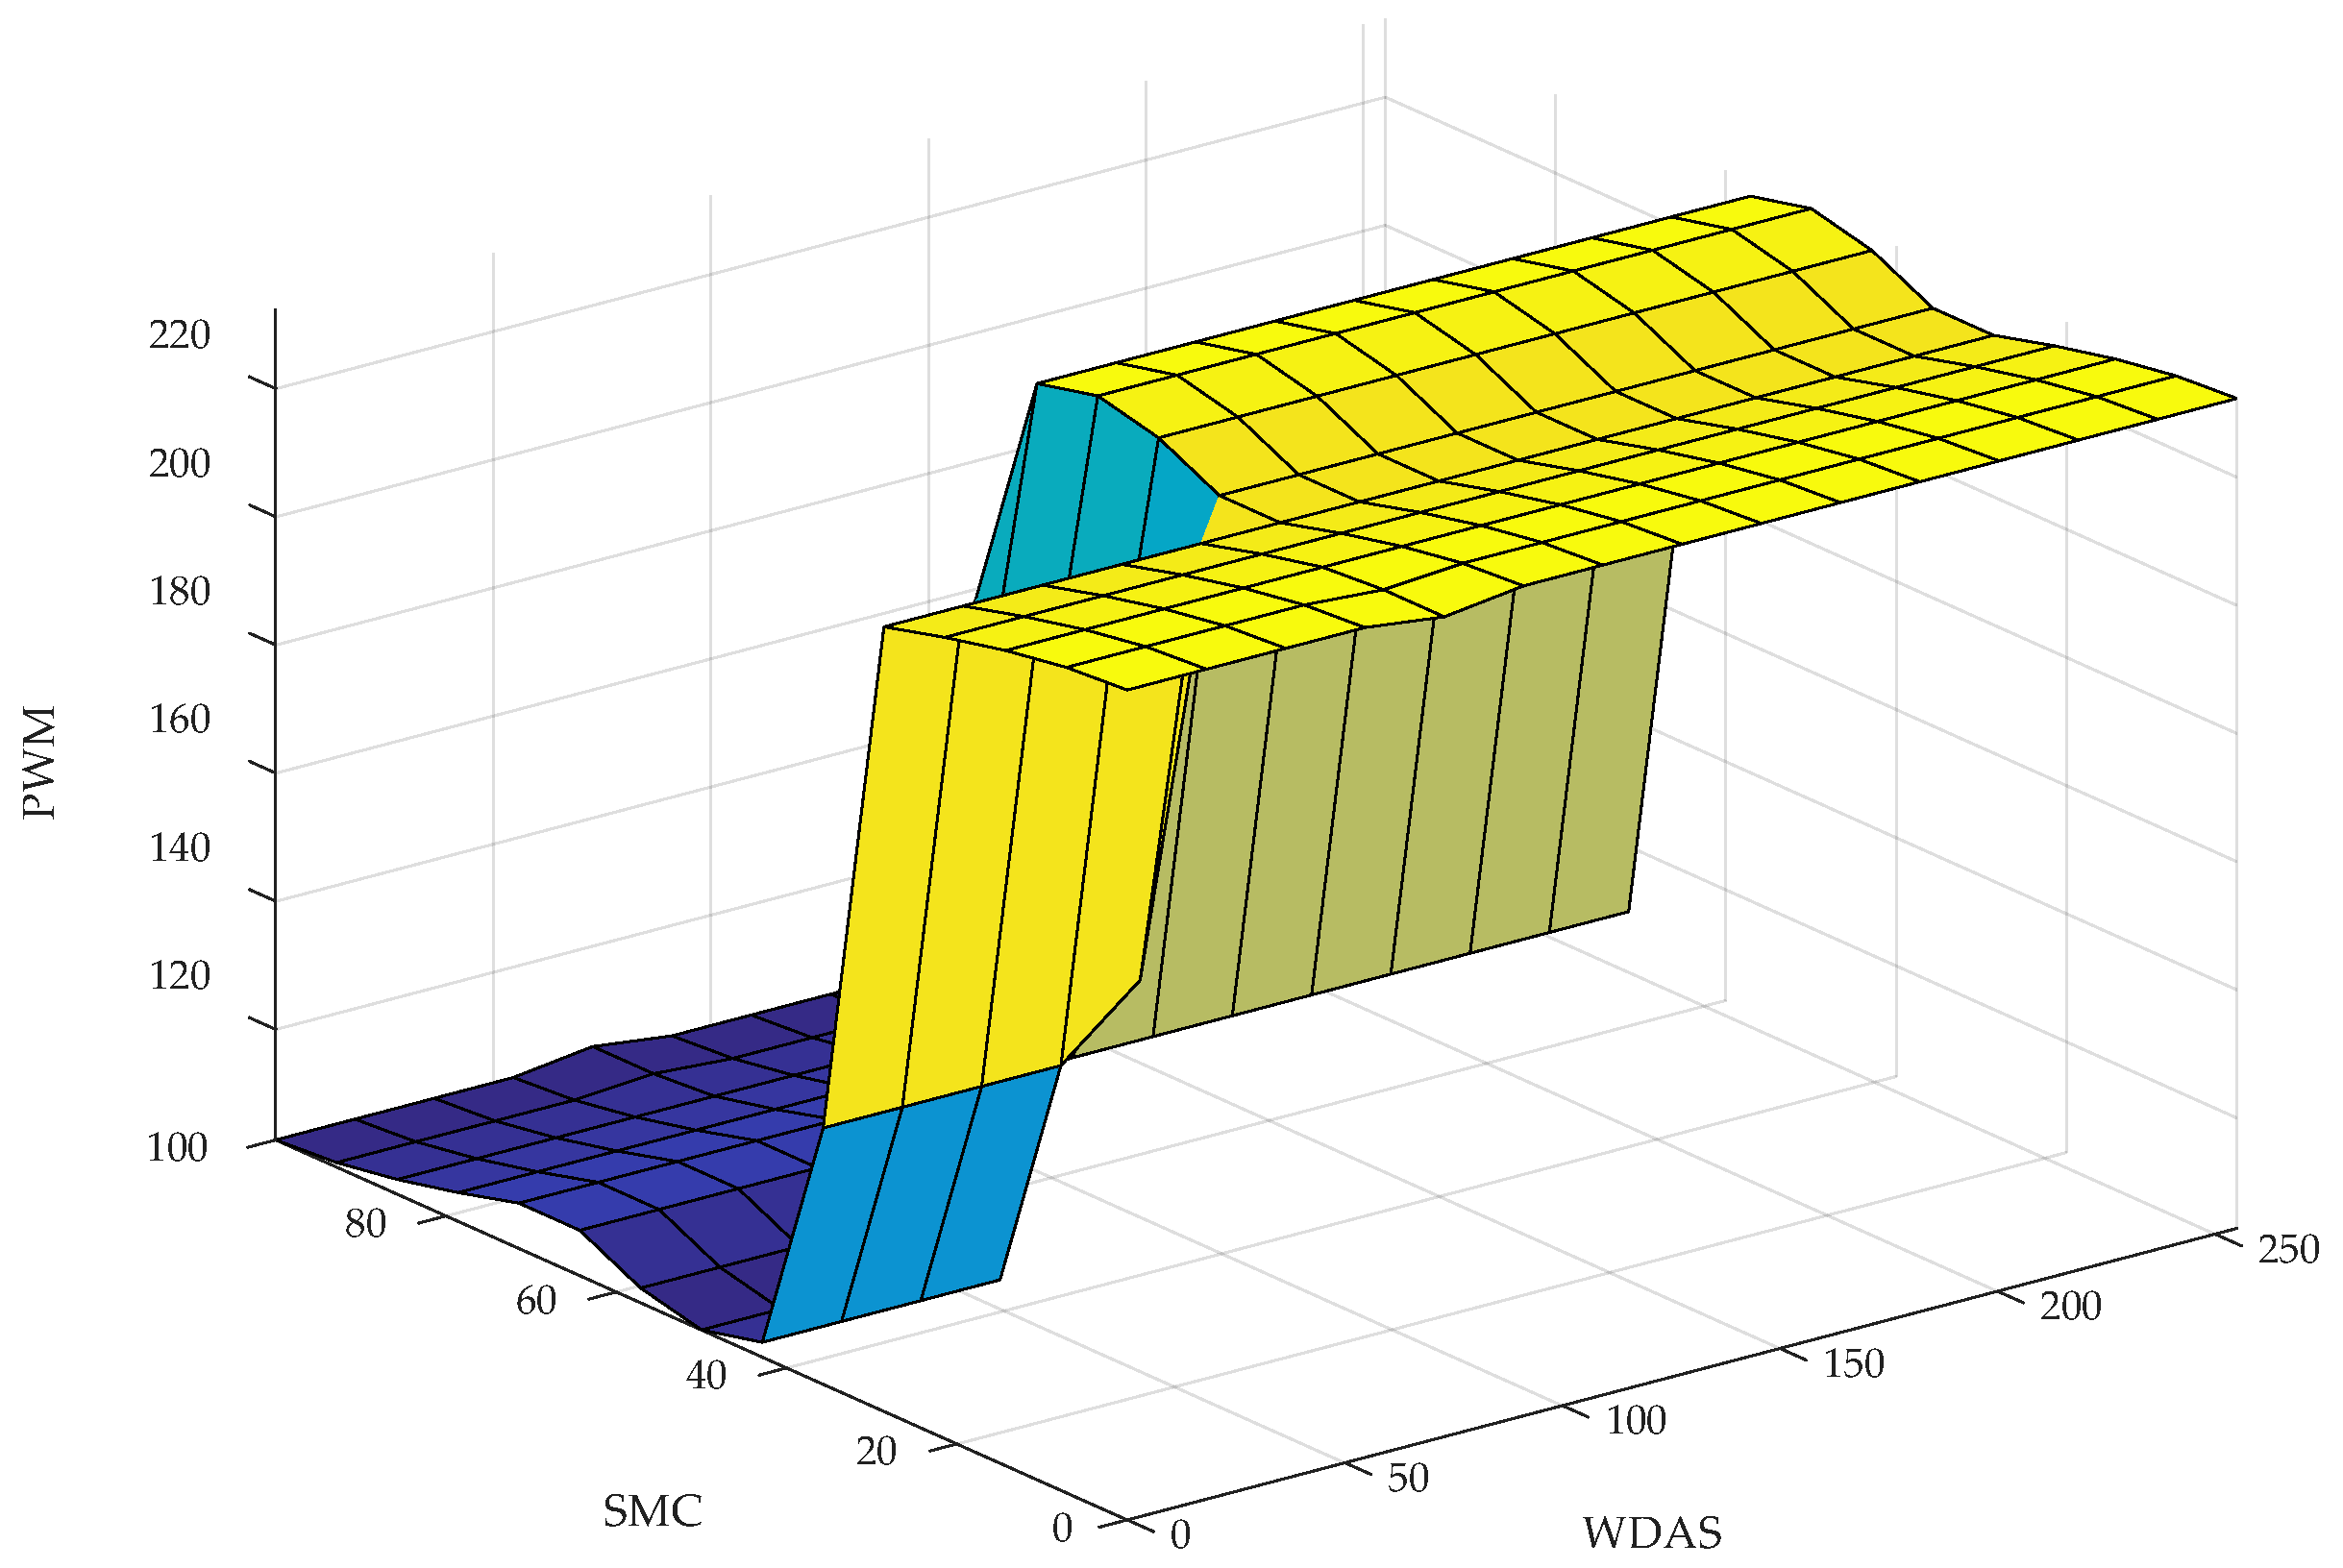
Figure 4 shows the rules surface of FLC.
Finally, a weighted average formula is used to infer the completed fuzzy output for the conversion to a crisp output , otherwise known as defuzzification. The fuzzy inference algorithms are programmed in the Matlab simulink toolbox.
2.3. Multi-Tasking Process
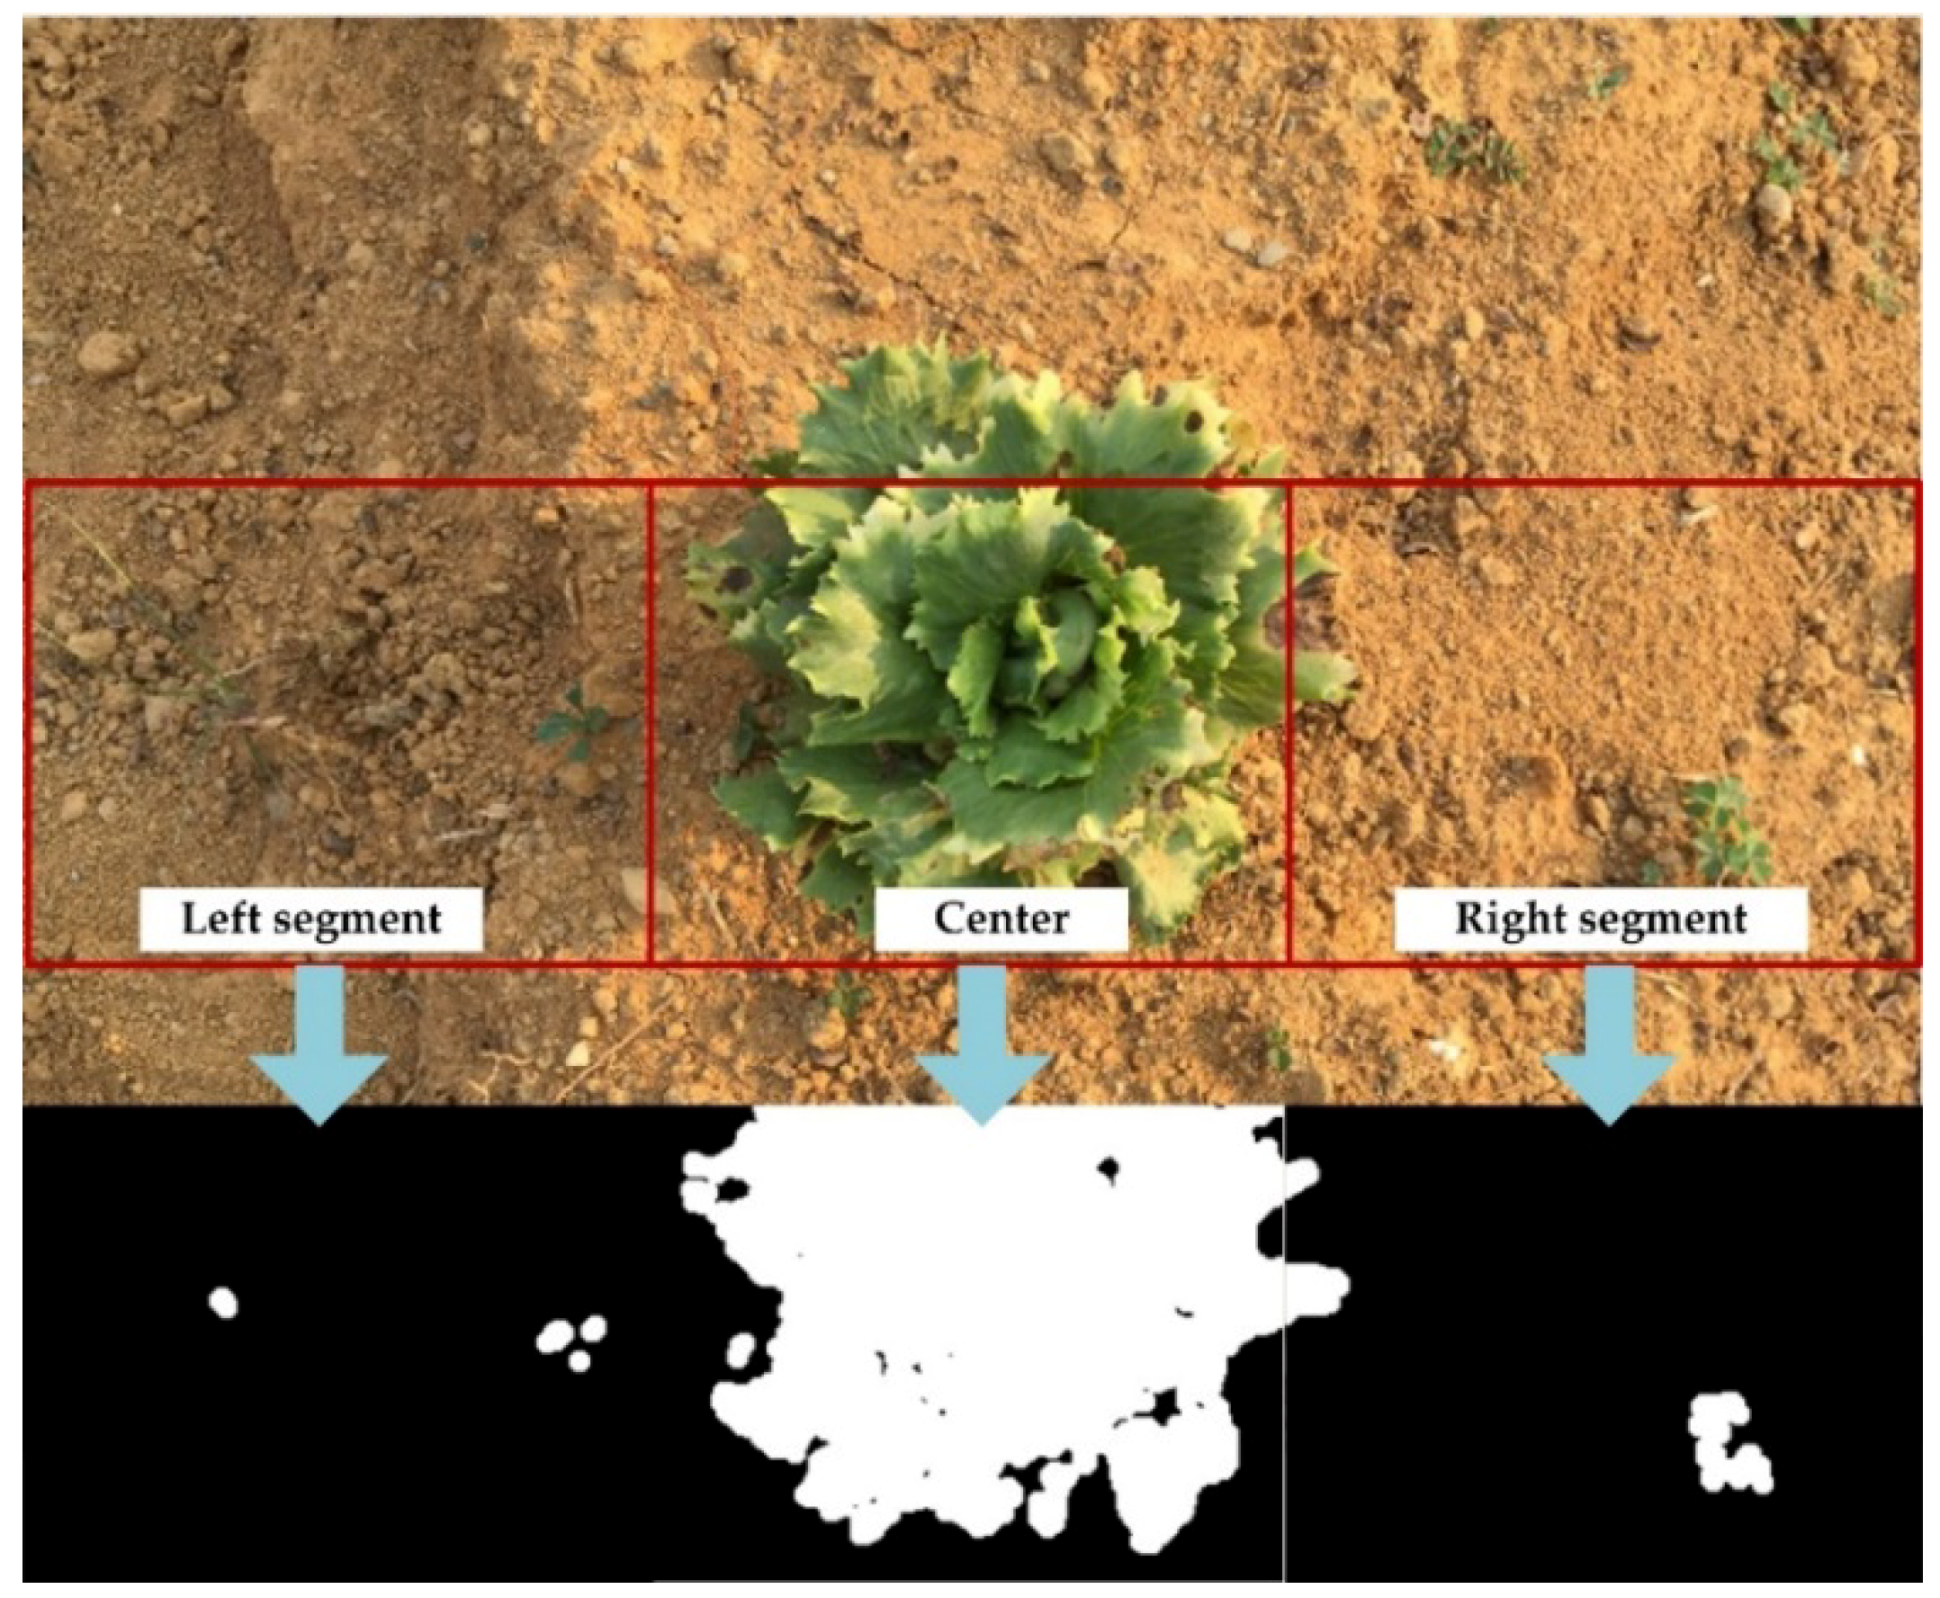
First, the region of interest (ROI) within the image is divided into the left, middle, and right segments, as shown by the red frames of Figure 5. The middle segment is for plant identification, while the left and ride segments are for weed identification. The image processing method is used to obtain the identification results of each segment, including the wet distribution area of the surface soil in the ROI. Next, the identification results in these three areas are binary coded. When the code value for a segment is “1”, it means that there is a weed or plant in the segment, while “0” means that there are no plants or weeds in the segment. As the middle segment is the plant area, it is identified as the segment that contains the plant and will not be weeded. The left and right segments will be weeded when the output value is “1”. The operation process first removes the weed and then disperses water through the pump with values between 0 and 255 as defined by the FLC, so as to regulate the input voltage of the pump to achieve the variable rate irrigation.
3. Description of the Mechatronics System
The proposed mechatronics system includes the frames of the machine, the weeding and watering mechanism, the image and soil moisture sensor, the actuator, and the graphical user interface (GUI).
3.1. Mechanism Design
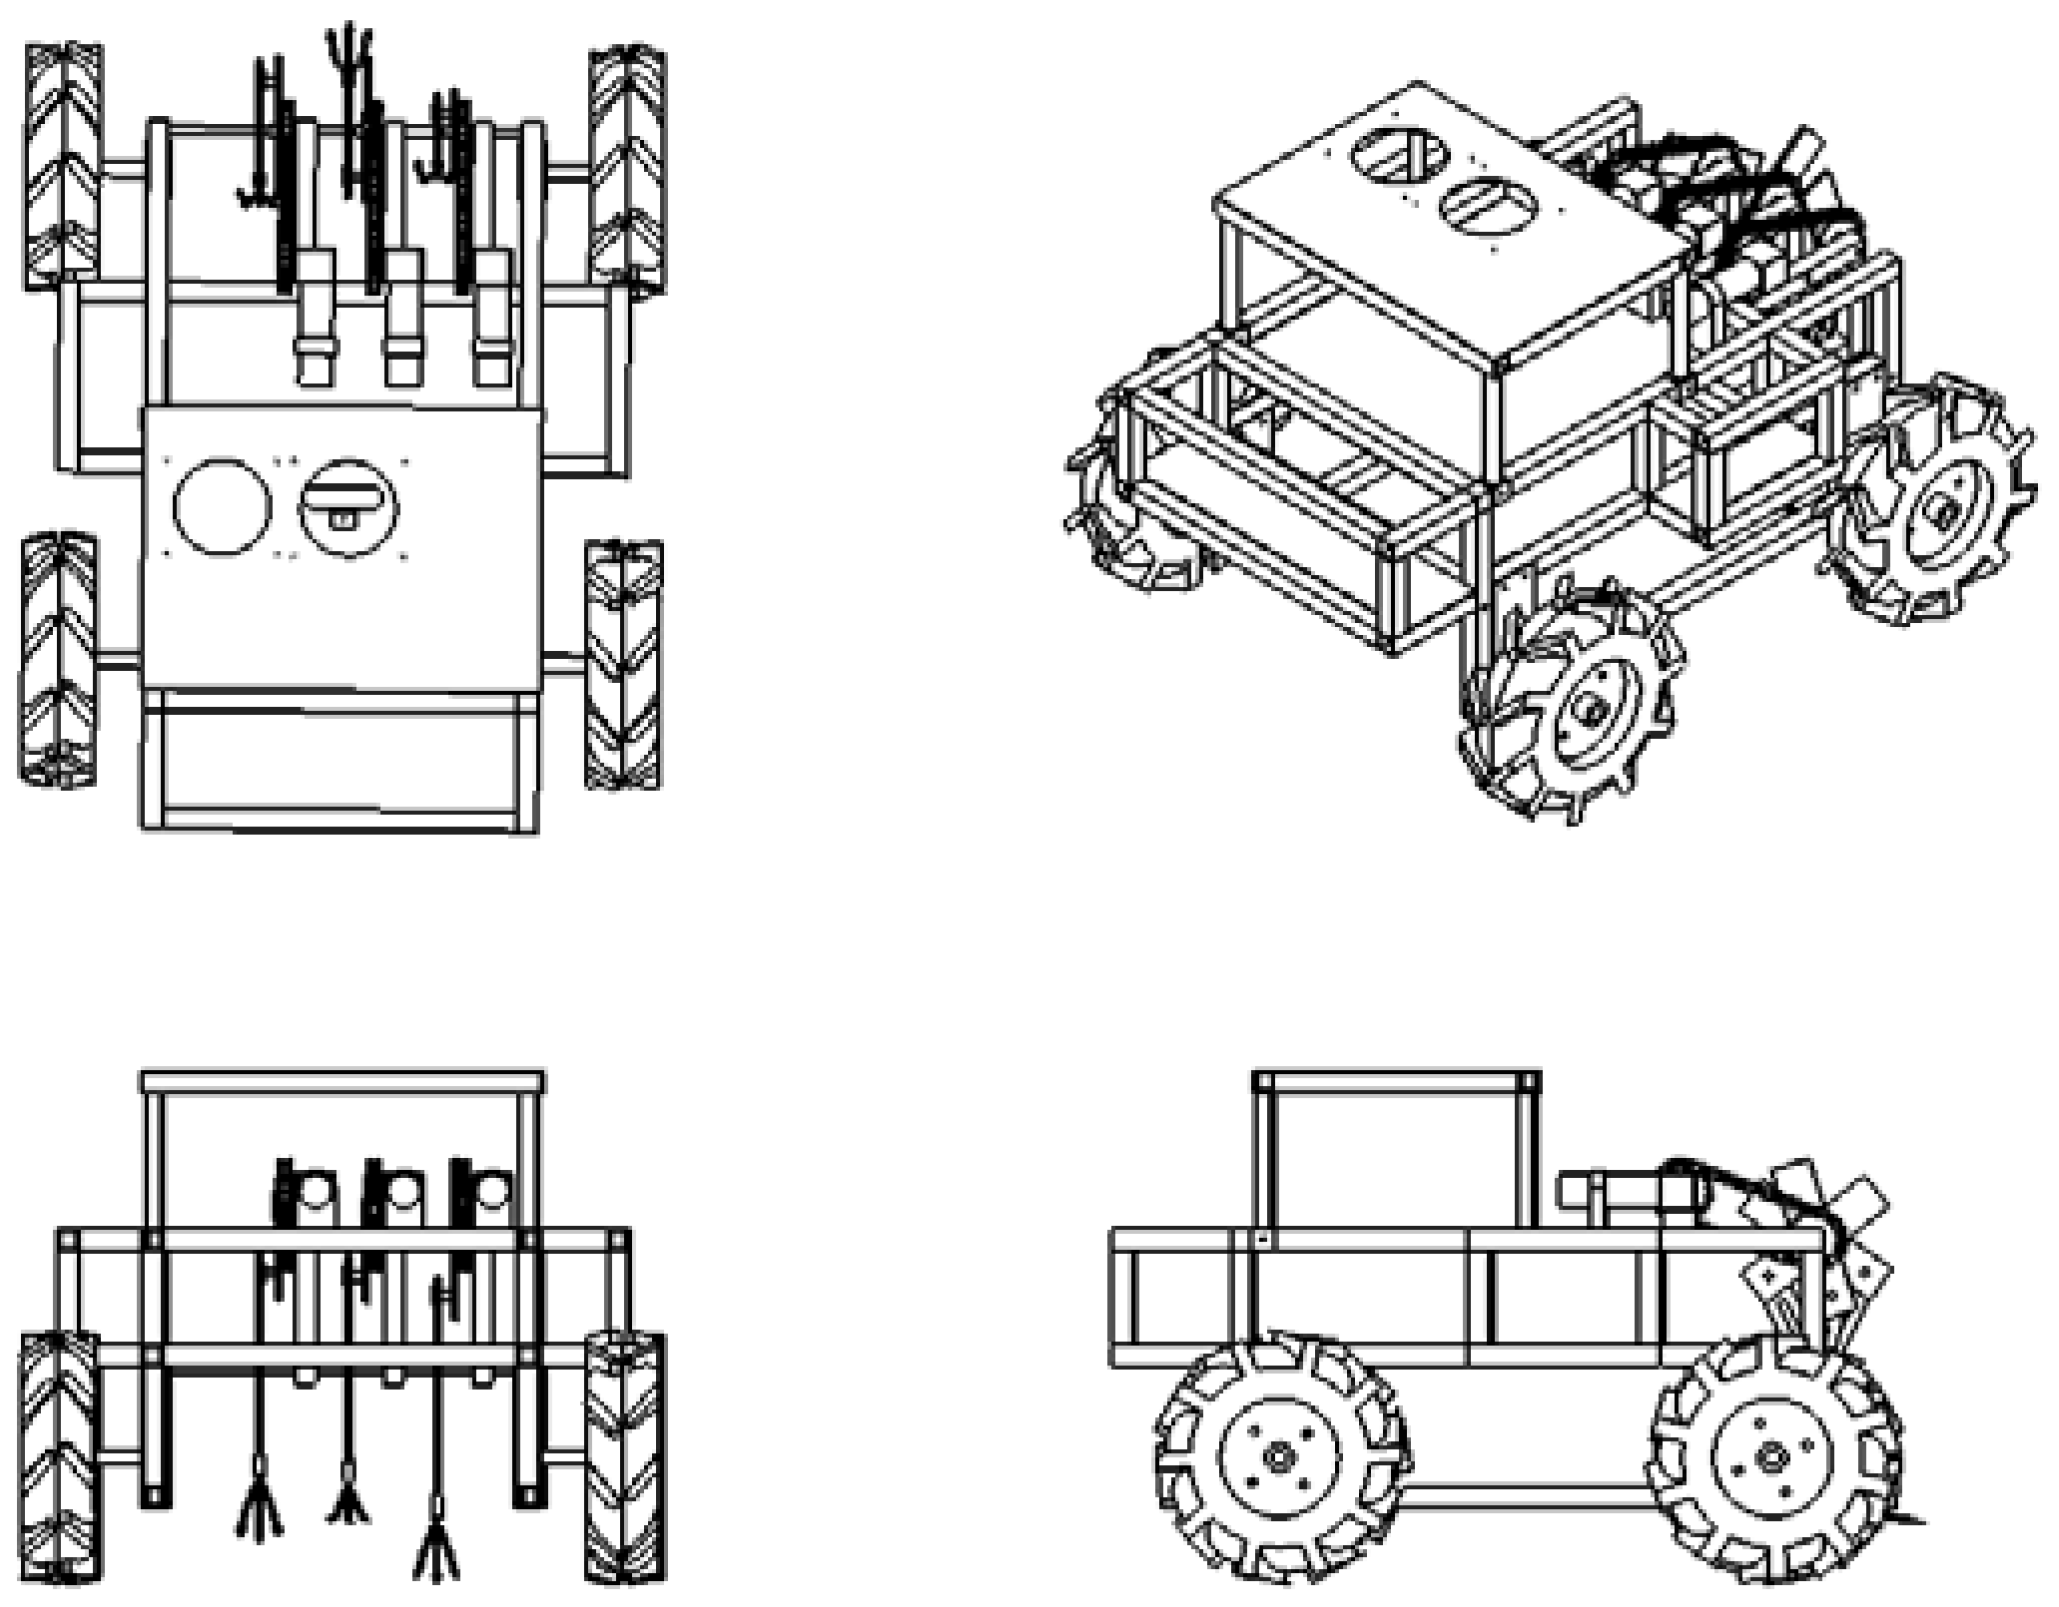
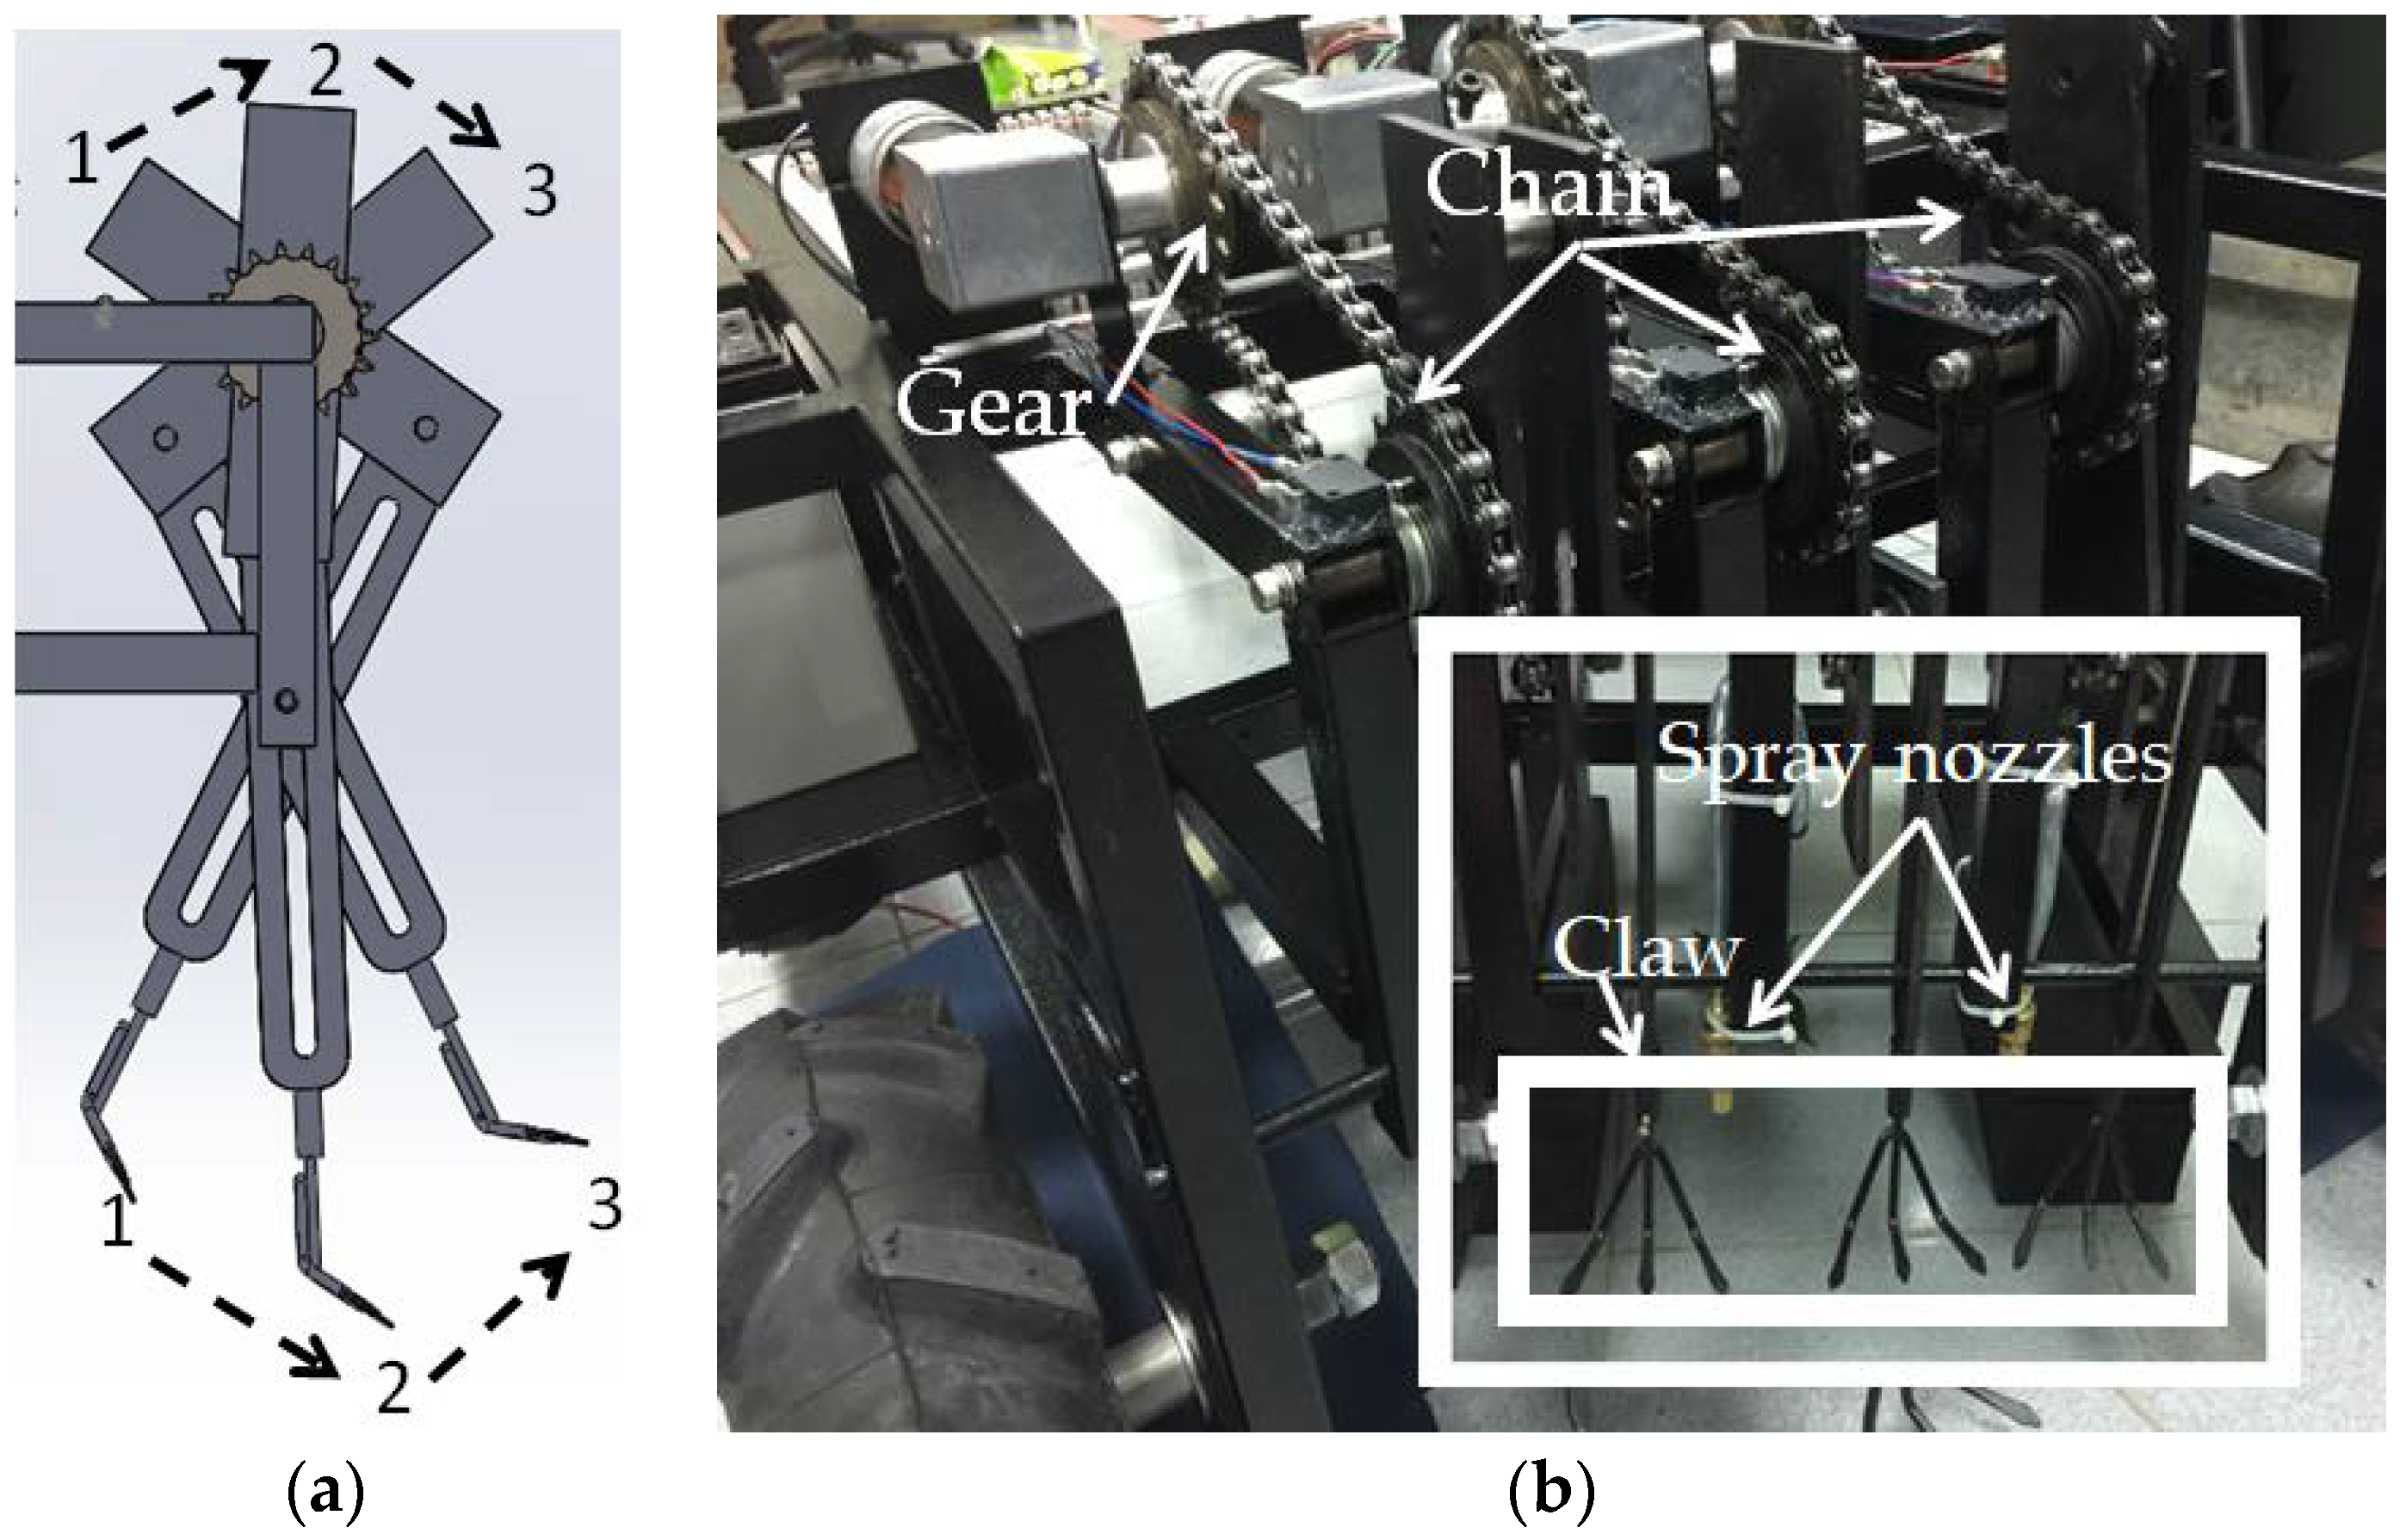
The drawing of the prototype design of the machine is as shown in Figure 6. The body of the machine is assembled from multiple black iron support frames combined with herringbone patterned wheels with a diameter of 300 mm. The dimensions of the body are 988 mm (L) × 806 mm (W) × 449 mm (H). The weeding mechanism is constructed from a linkage device, chain, gear, and a depth-adjustable mechanism. The motor drives the gear and the chain to pull the three-pronged weeding device in an arc to flick the soil backwards (see Figure 7a) and simultaneously remove the weeds. The mechanism is height adjustable and convenient for tilling soil. Three weeding mechanisms are replicated to facilitate the comprehensive coverage of the cultivation areas. The metal tubes on both sides of the weed remover are equipped with spray nozzles that are equipped with two sets of water pumps (see Figure 7b) that draw out water from the water tank in the back of the machine to irrigate the soil on both sides of the plant.
3.2. Hardware/Software System Implementation
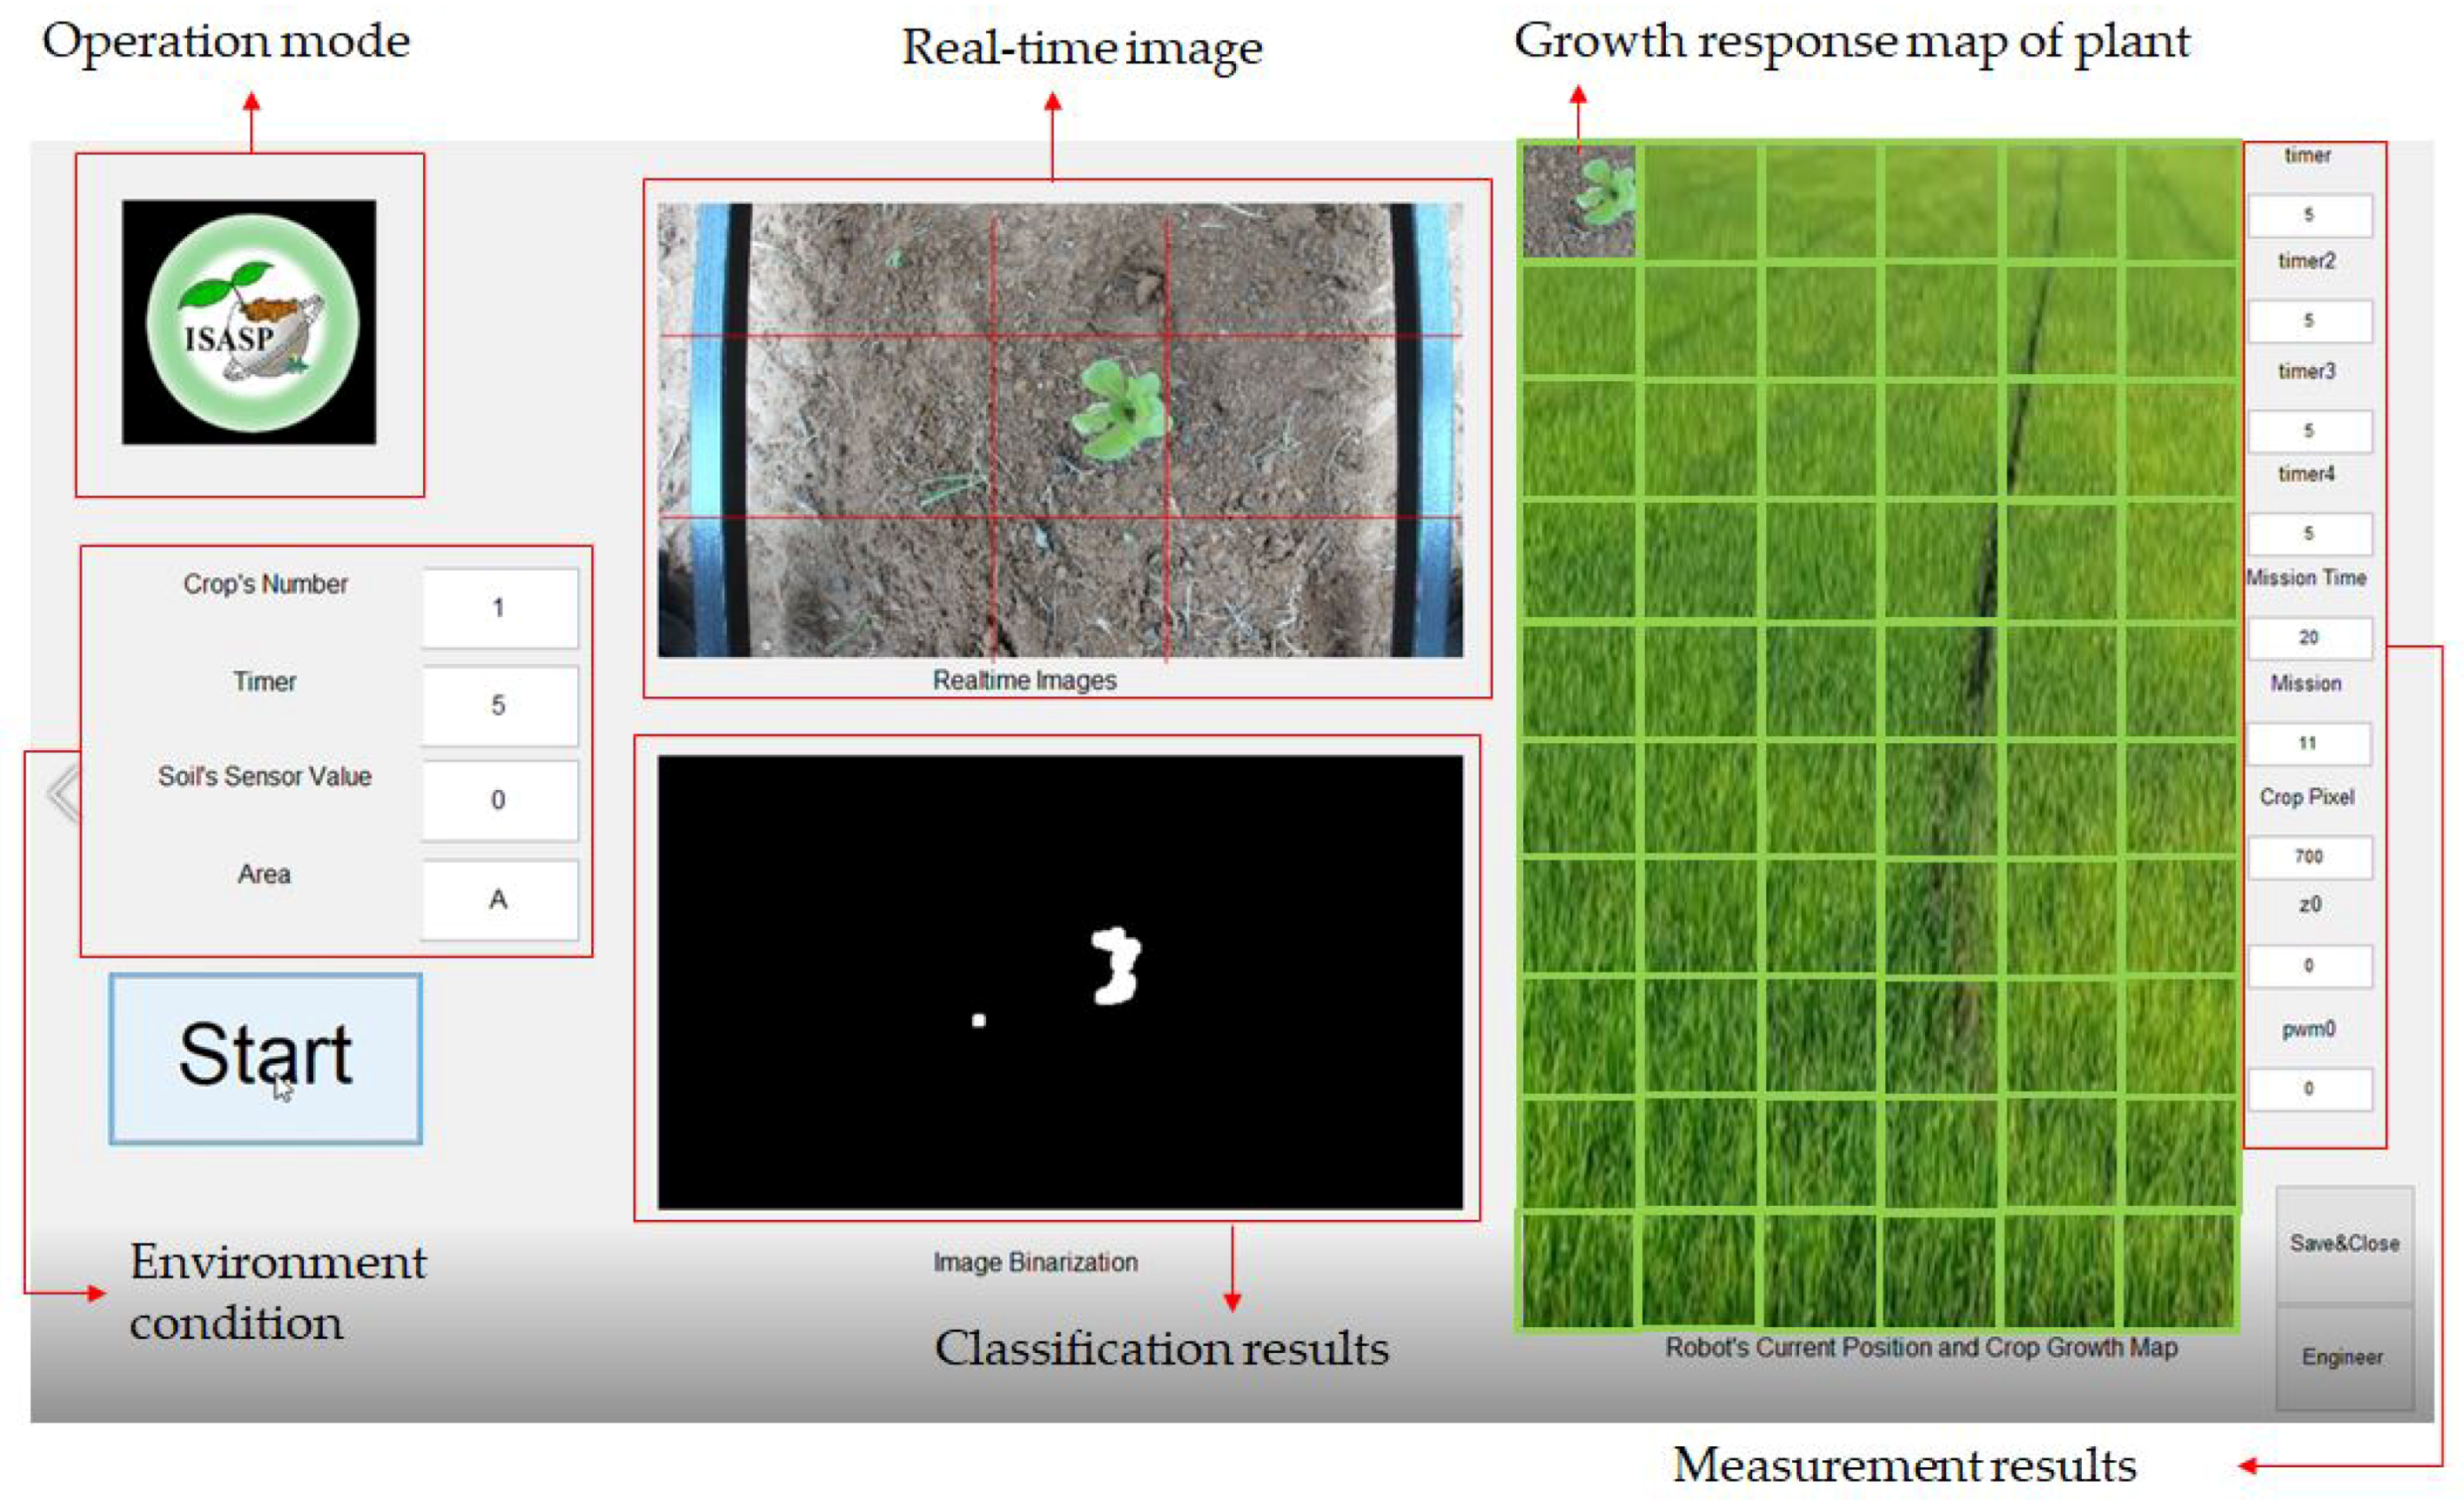
A laptop computer serves as the main processing unit that is used for executing the image classification and fuzzy logic inference. The data for the soil moisture content that is received from the soil moisture sensor can be wirelessly transmitted to the sub-microcontroller, and the data is transferred via a universal serial bus (USB) interface to the main processing unit for the fuzzy logic inference operation. The results are transmitted to the main microcontroller, which then transmits the PWM signal to drive the pump and performs the variable rate irrigation. There is an additional graphical user interface (GUI) that allows for the real time observation of the ROI area to display the crop and weed dispersion, the completed rows, and the soil moisture rate of this operation. It allows the user to start and stop the system execution. The main controller program of the GUI will begin the detection and the classification of the target within the different segments of ROI, along with the estimation of WDAS (see Figure 8). The multi-tasking process (as shown in Section 2.3) will be executed once the detection and classification process is finished. In addition, the growth response map of the plant shows that the image of each plant will be recorded in the database during the experiment in the whole field.
4. Results and Discussion
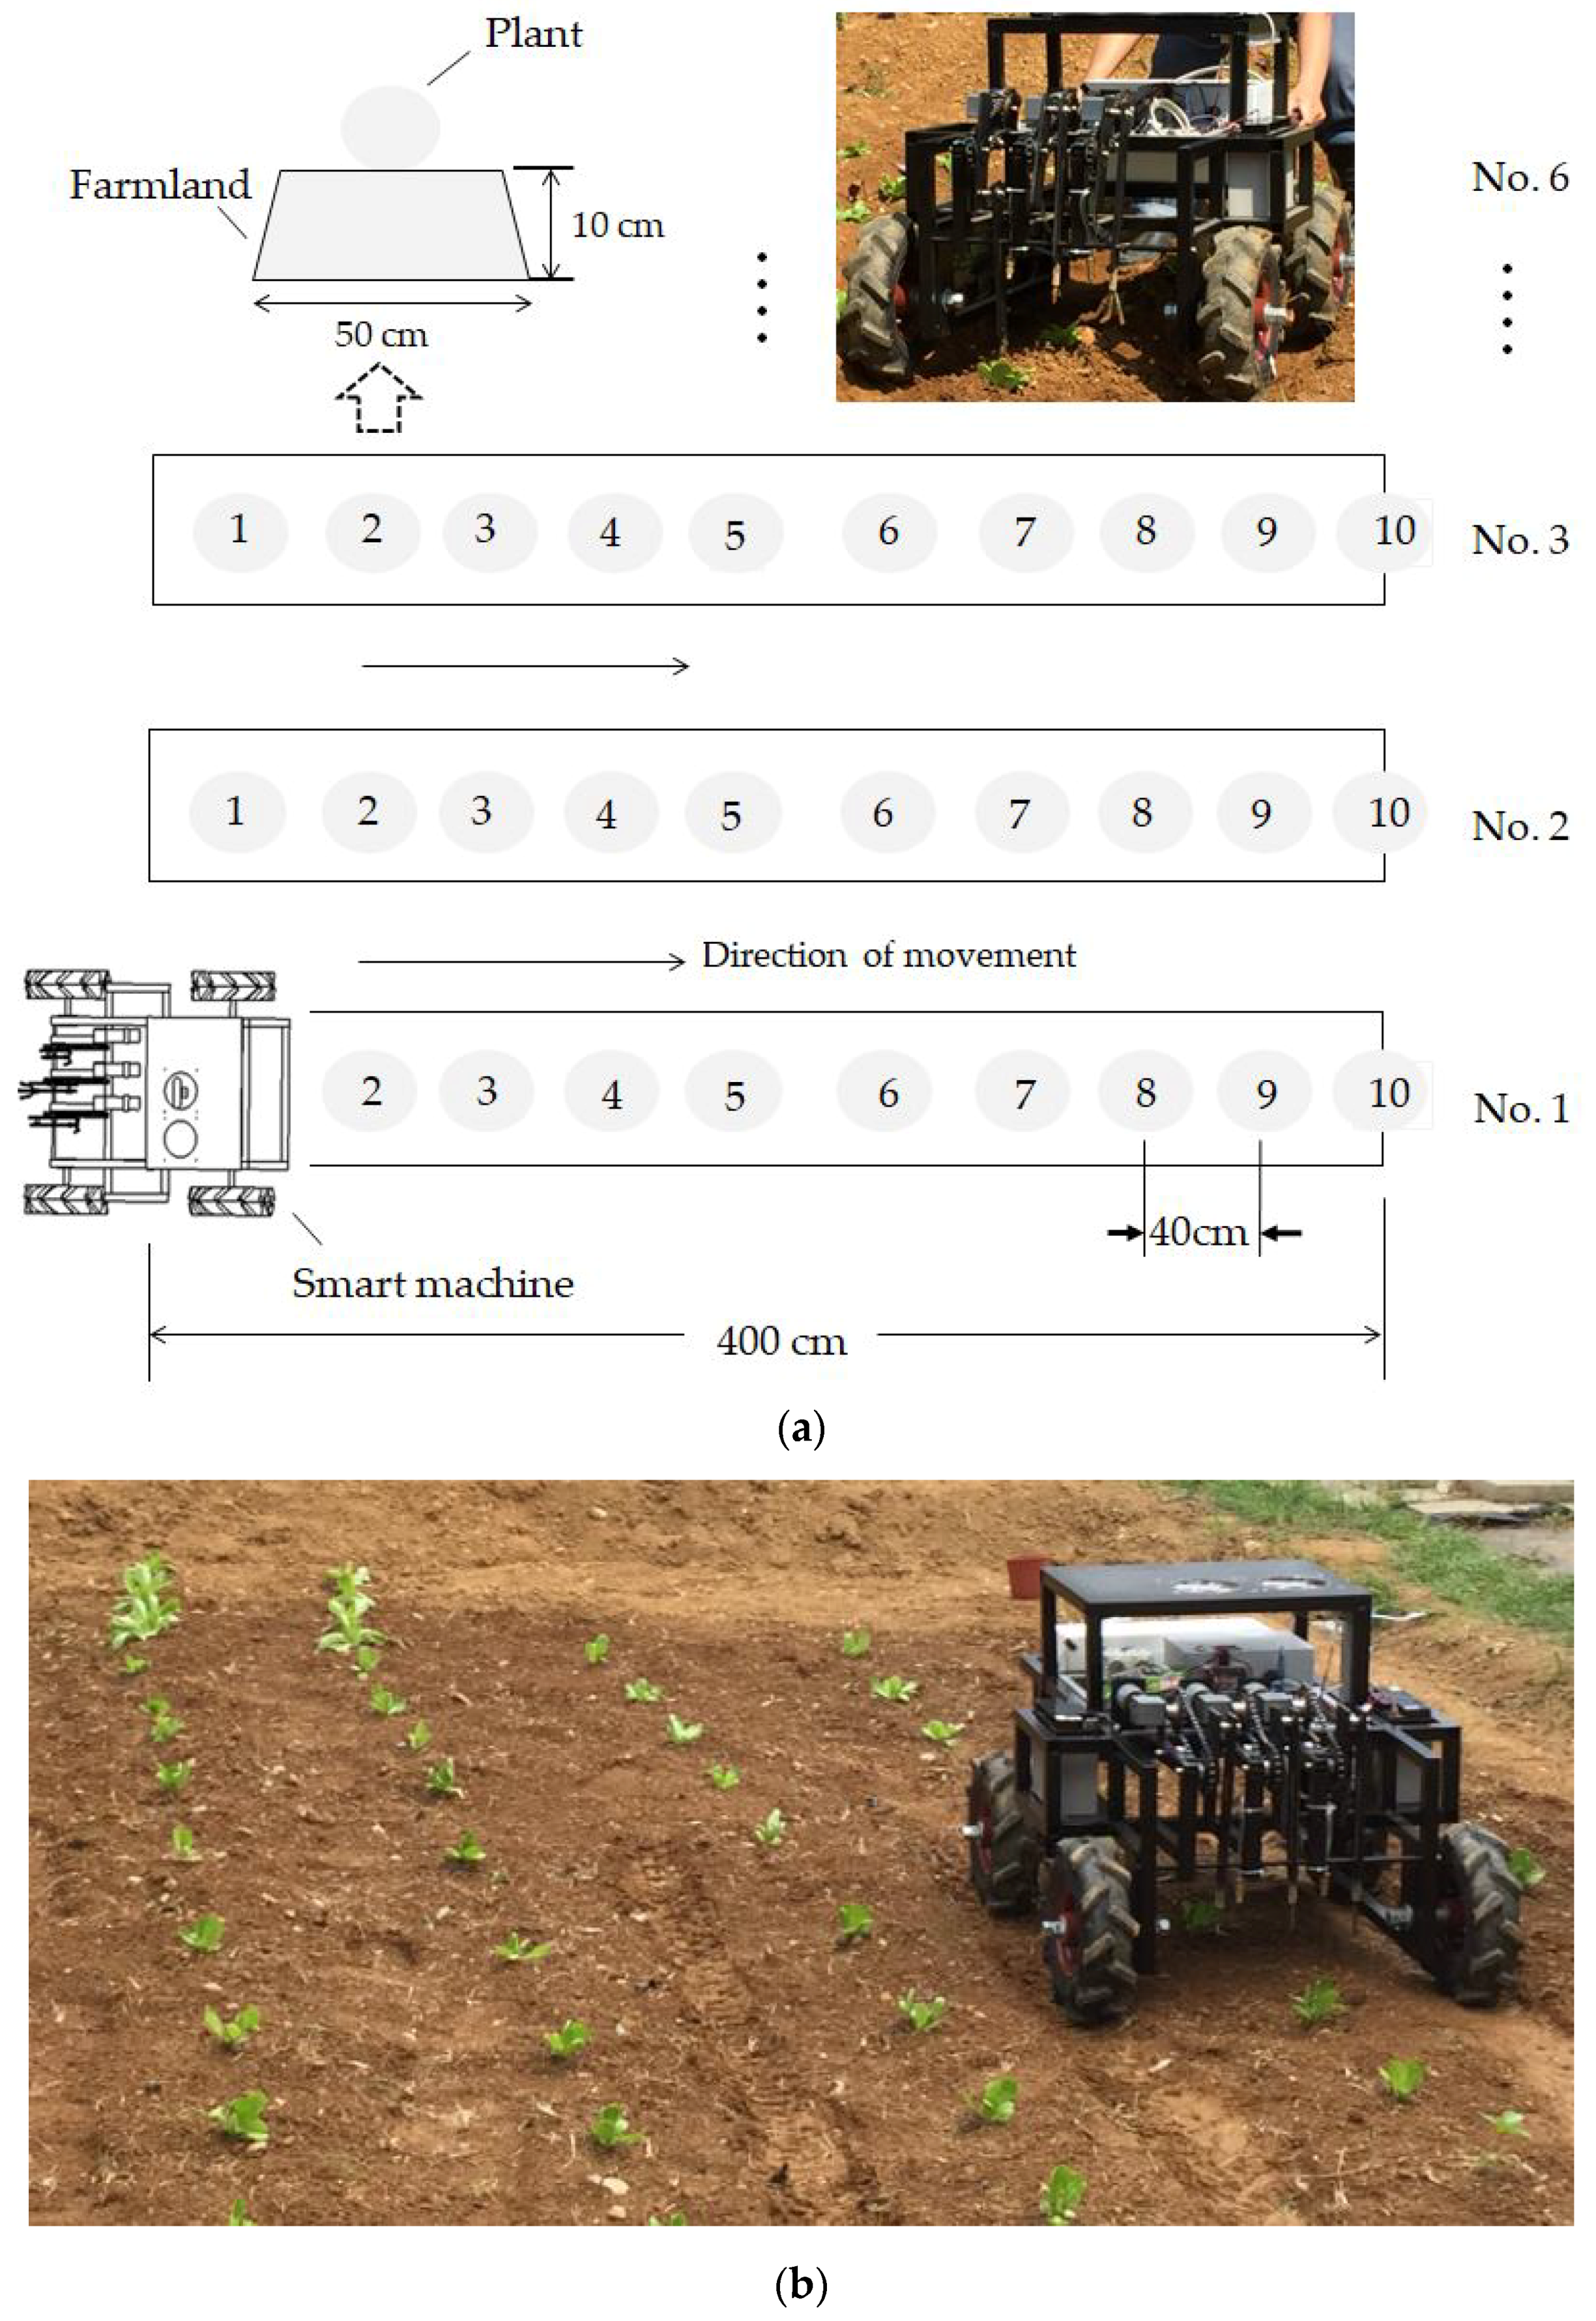
The site of the experiment is at an empty field (situated in front of a building within the school of bio-electromechanical engineering) (longitude: 120.6059°, latitude: 22.6467°). The square field is 4 m in length and width and contains six crop rows that each have 10 butter lettuces. The lettuces are spaced 40 cm apart (as shown in Figure 9) from each other and three experiments were conducted in the area to verify the performance of the system:
4.1. Scenario 1
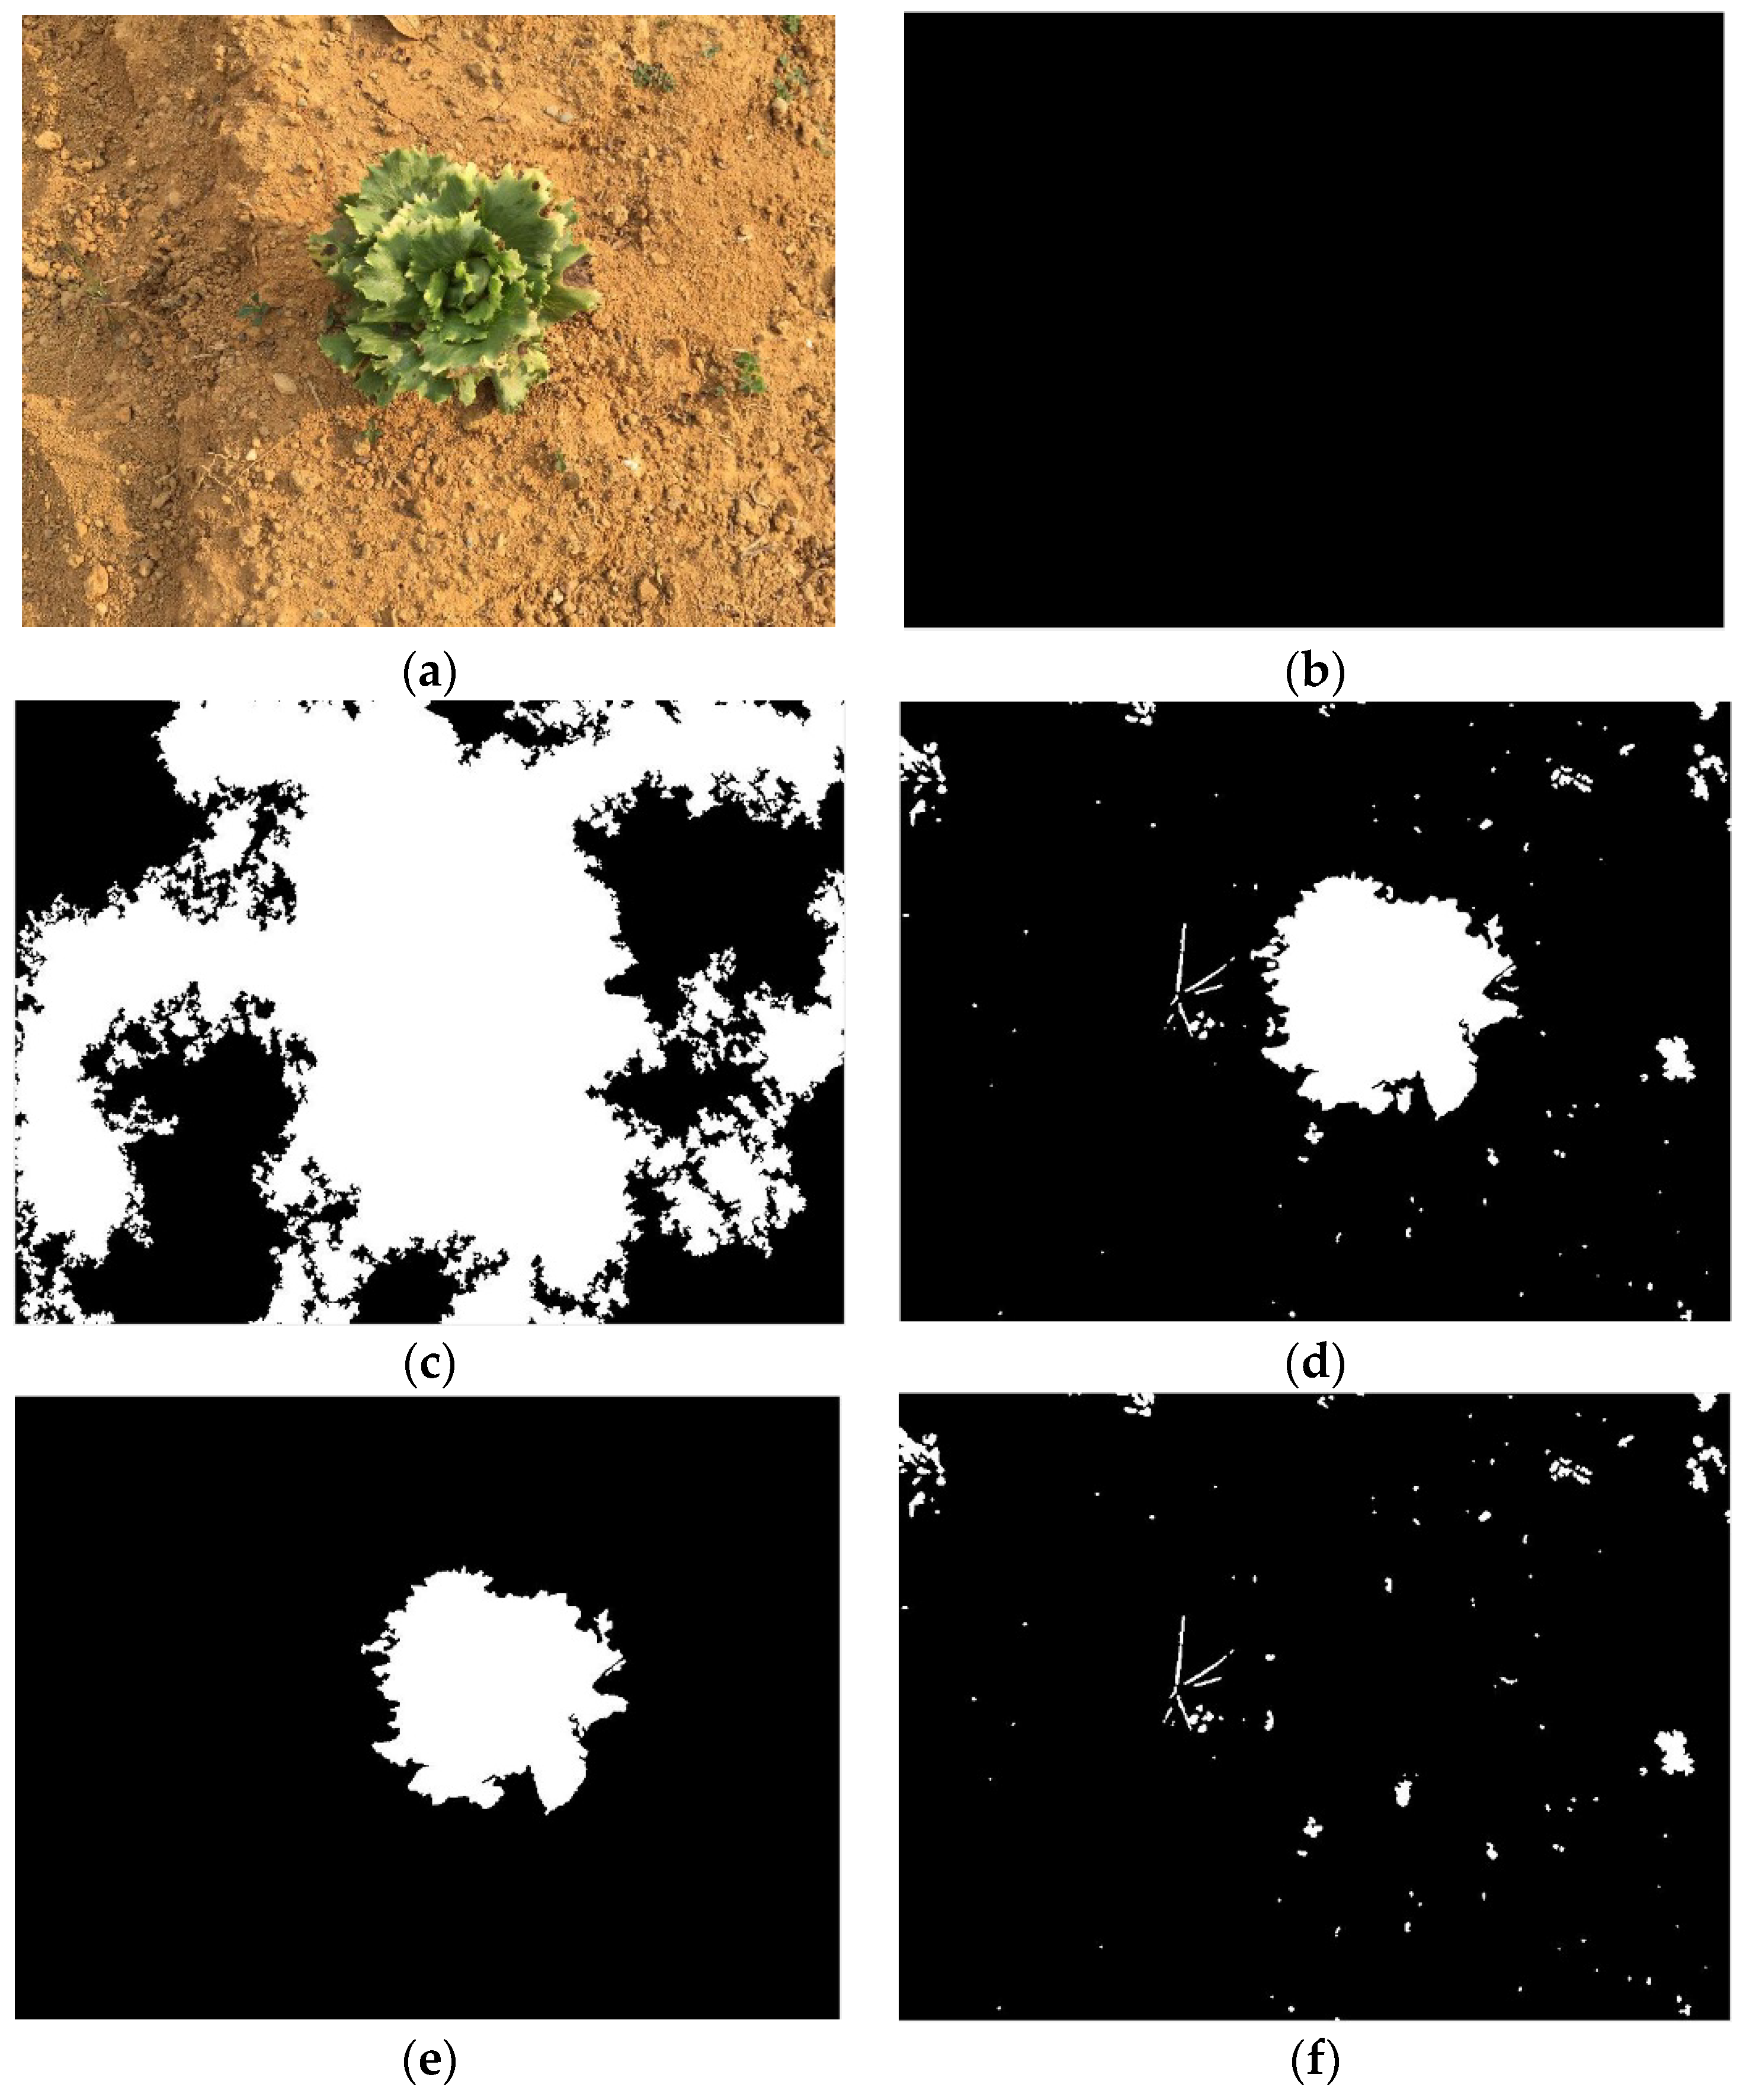
First, the crop and weed categorization was manually performed on the same row of plants at one-hour intervals between 10 A.M. and 4 P.M. Equation (2) was used to find the appropriate image processing computation threshold value so that the method could conduct categorization under different degrees of environmental lighting. The number of weeds that were grown in the area were then calculated as a means to verify the identification capabilities of the algorithm. Figure 10 displays the classification results at 3 P.M. The results show that the weed classification rate is between 90.0 and 95.2%, while the crop classification rate is 100%.
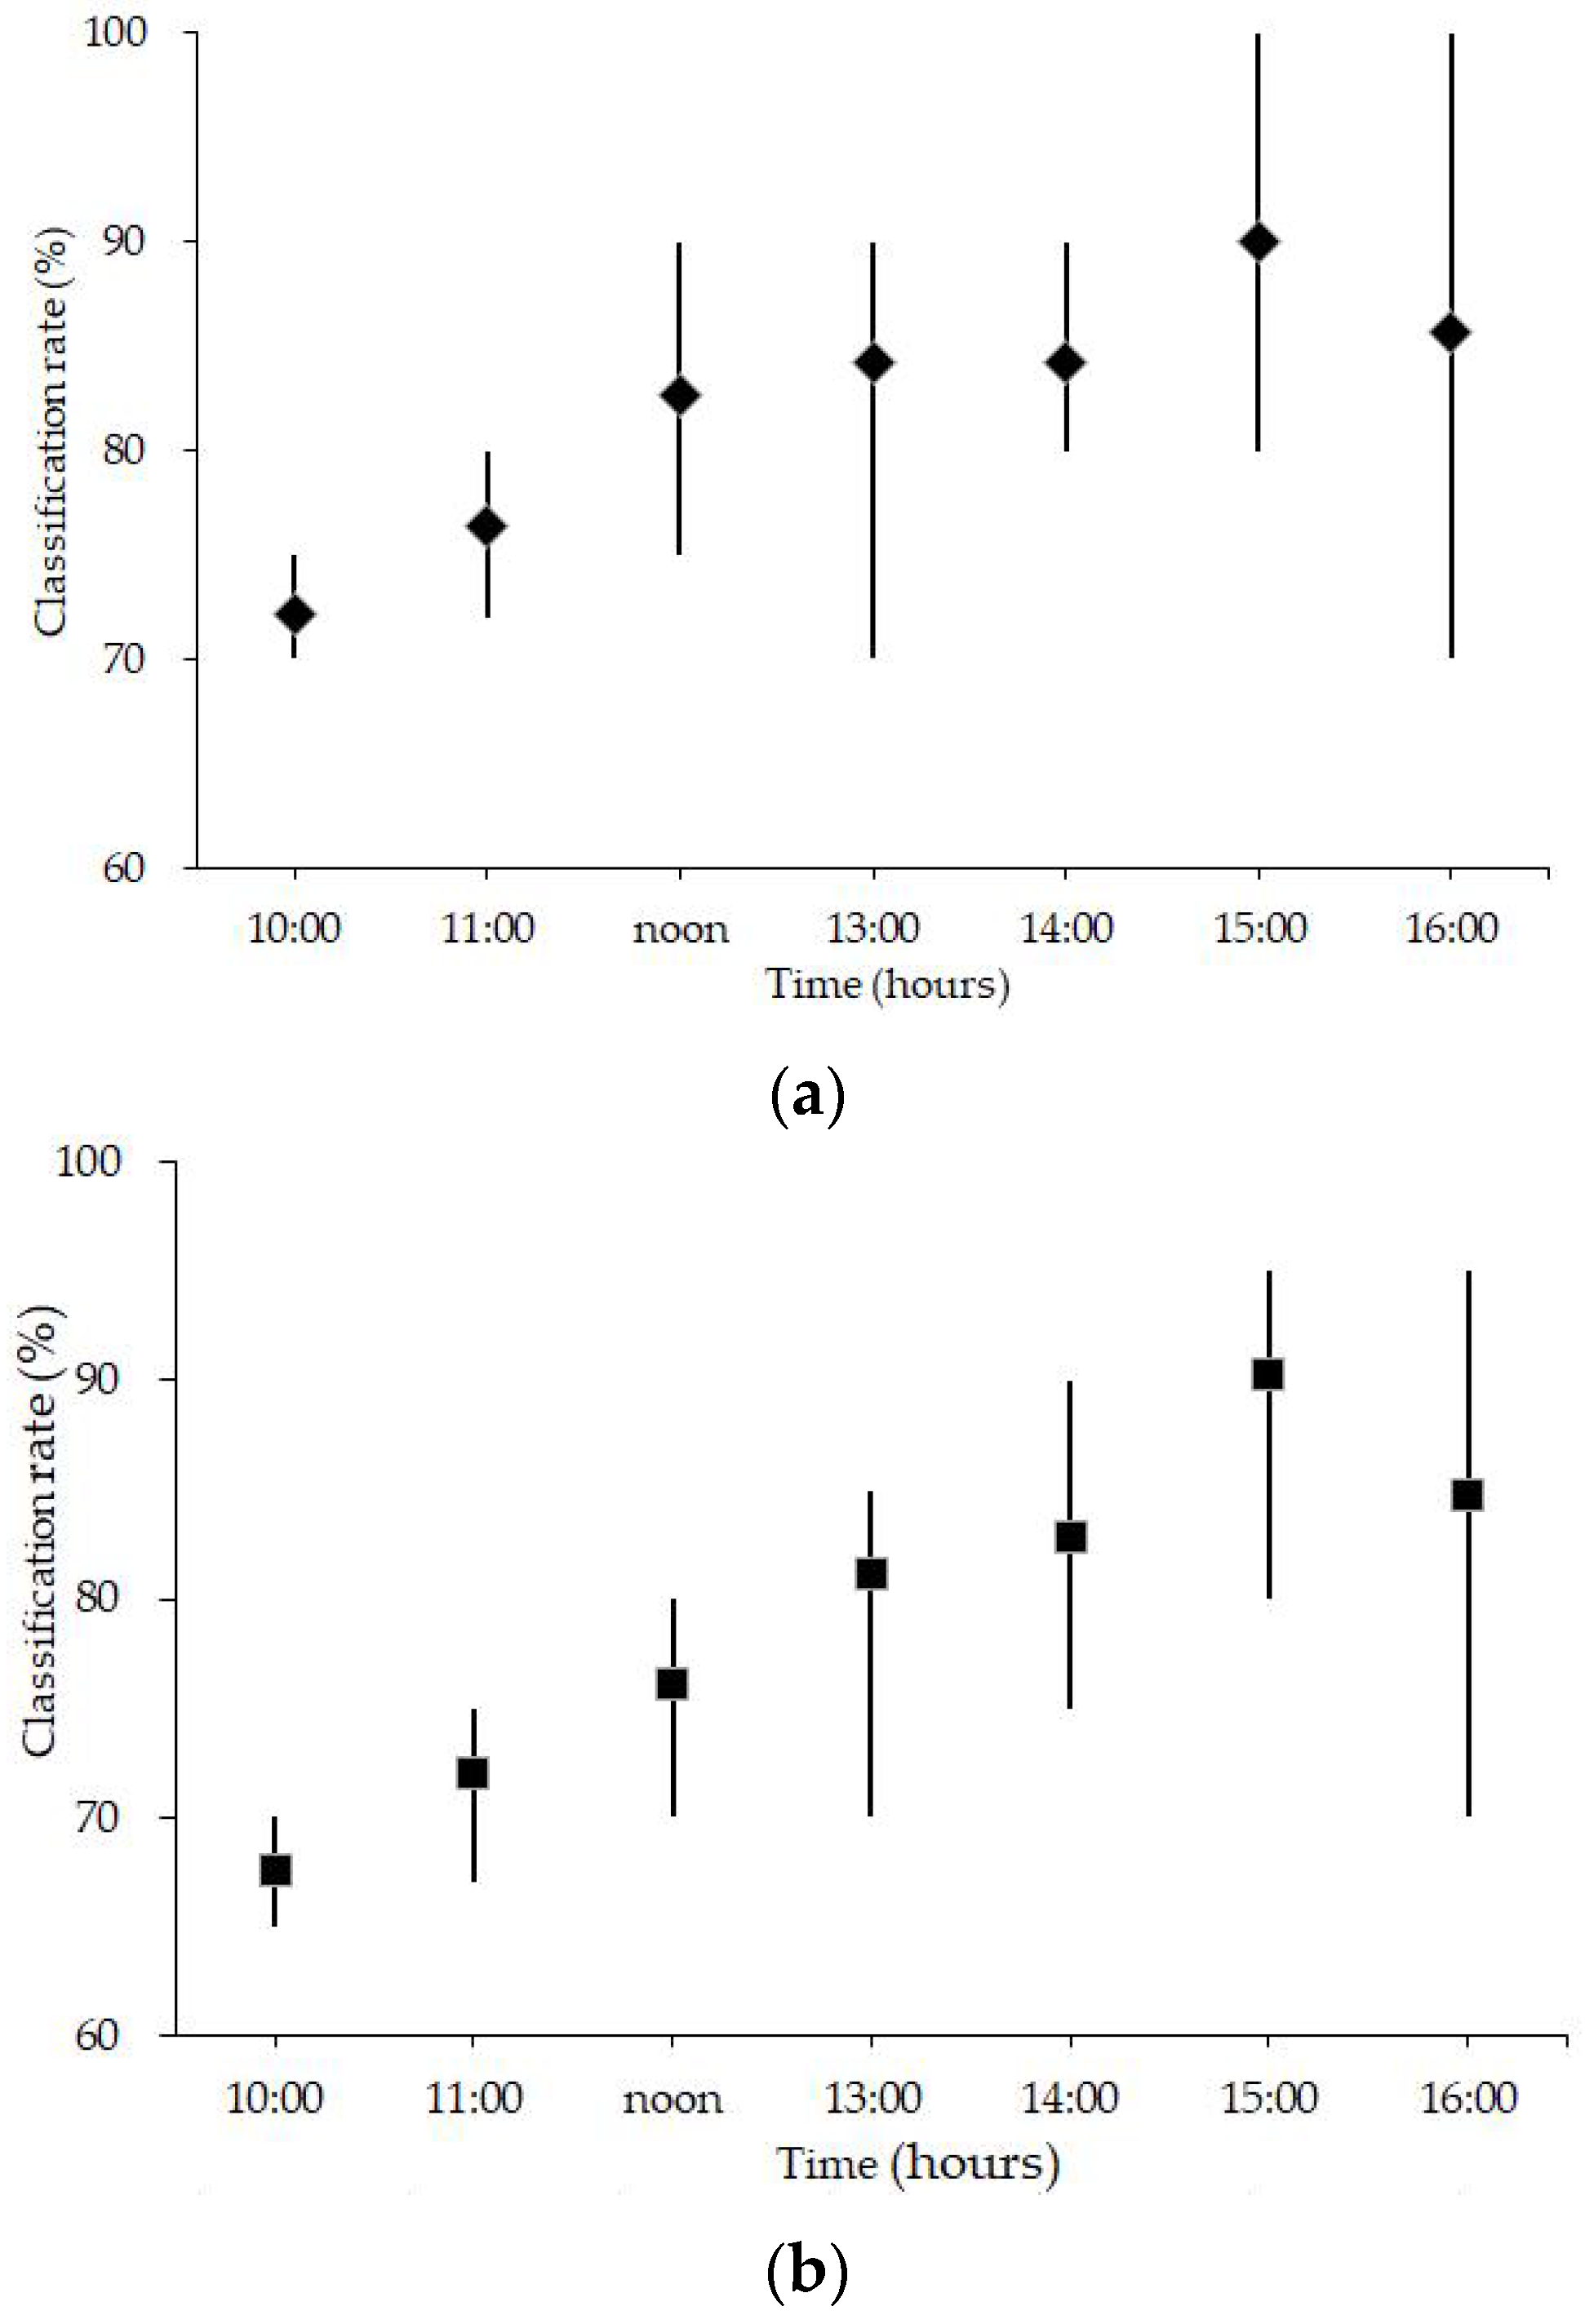
Next, the camera on the machine randomly captured 10 images every hour in the growth area between 10:00 in the morning and 16:00 in the afternoon. The image data was collected over a period of seven days, with the weather each day being sunny with clouds. Figure 8 shows the classification results of the plants and weeds at each time point. From the figure, we can see that the classification results of the plants (Figure 11a) and weeds (Figure 11b) are better in the afternoon, achieving a classification rate of up to 80% or higher. However, more variation is shown in Figure 8 in the classification results in the afternoon, which takes place due to the low irradiation angle of the sunshine and seasonal short daylight.
4.2. Scenario 2
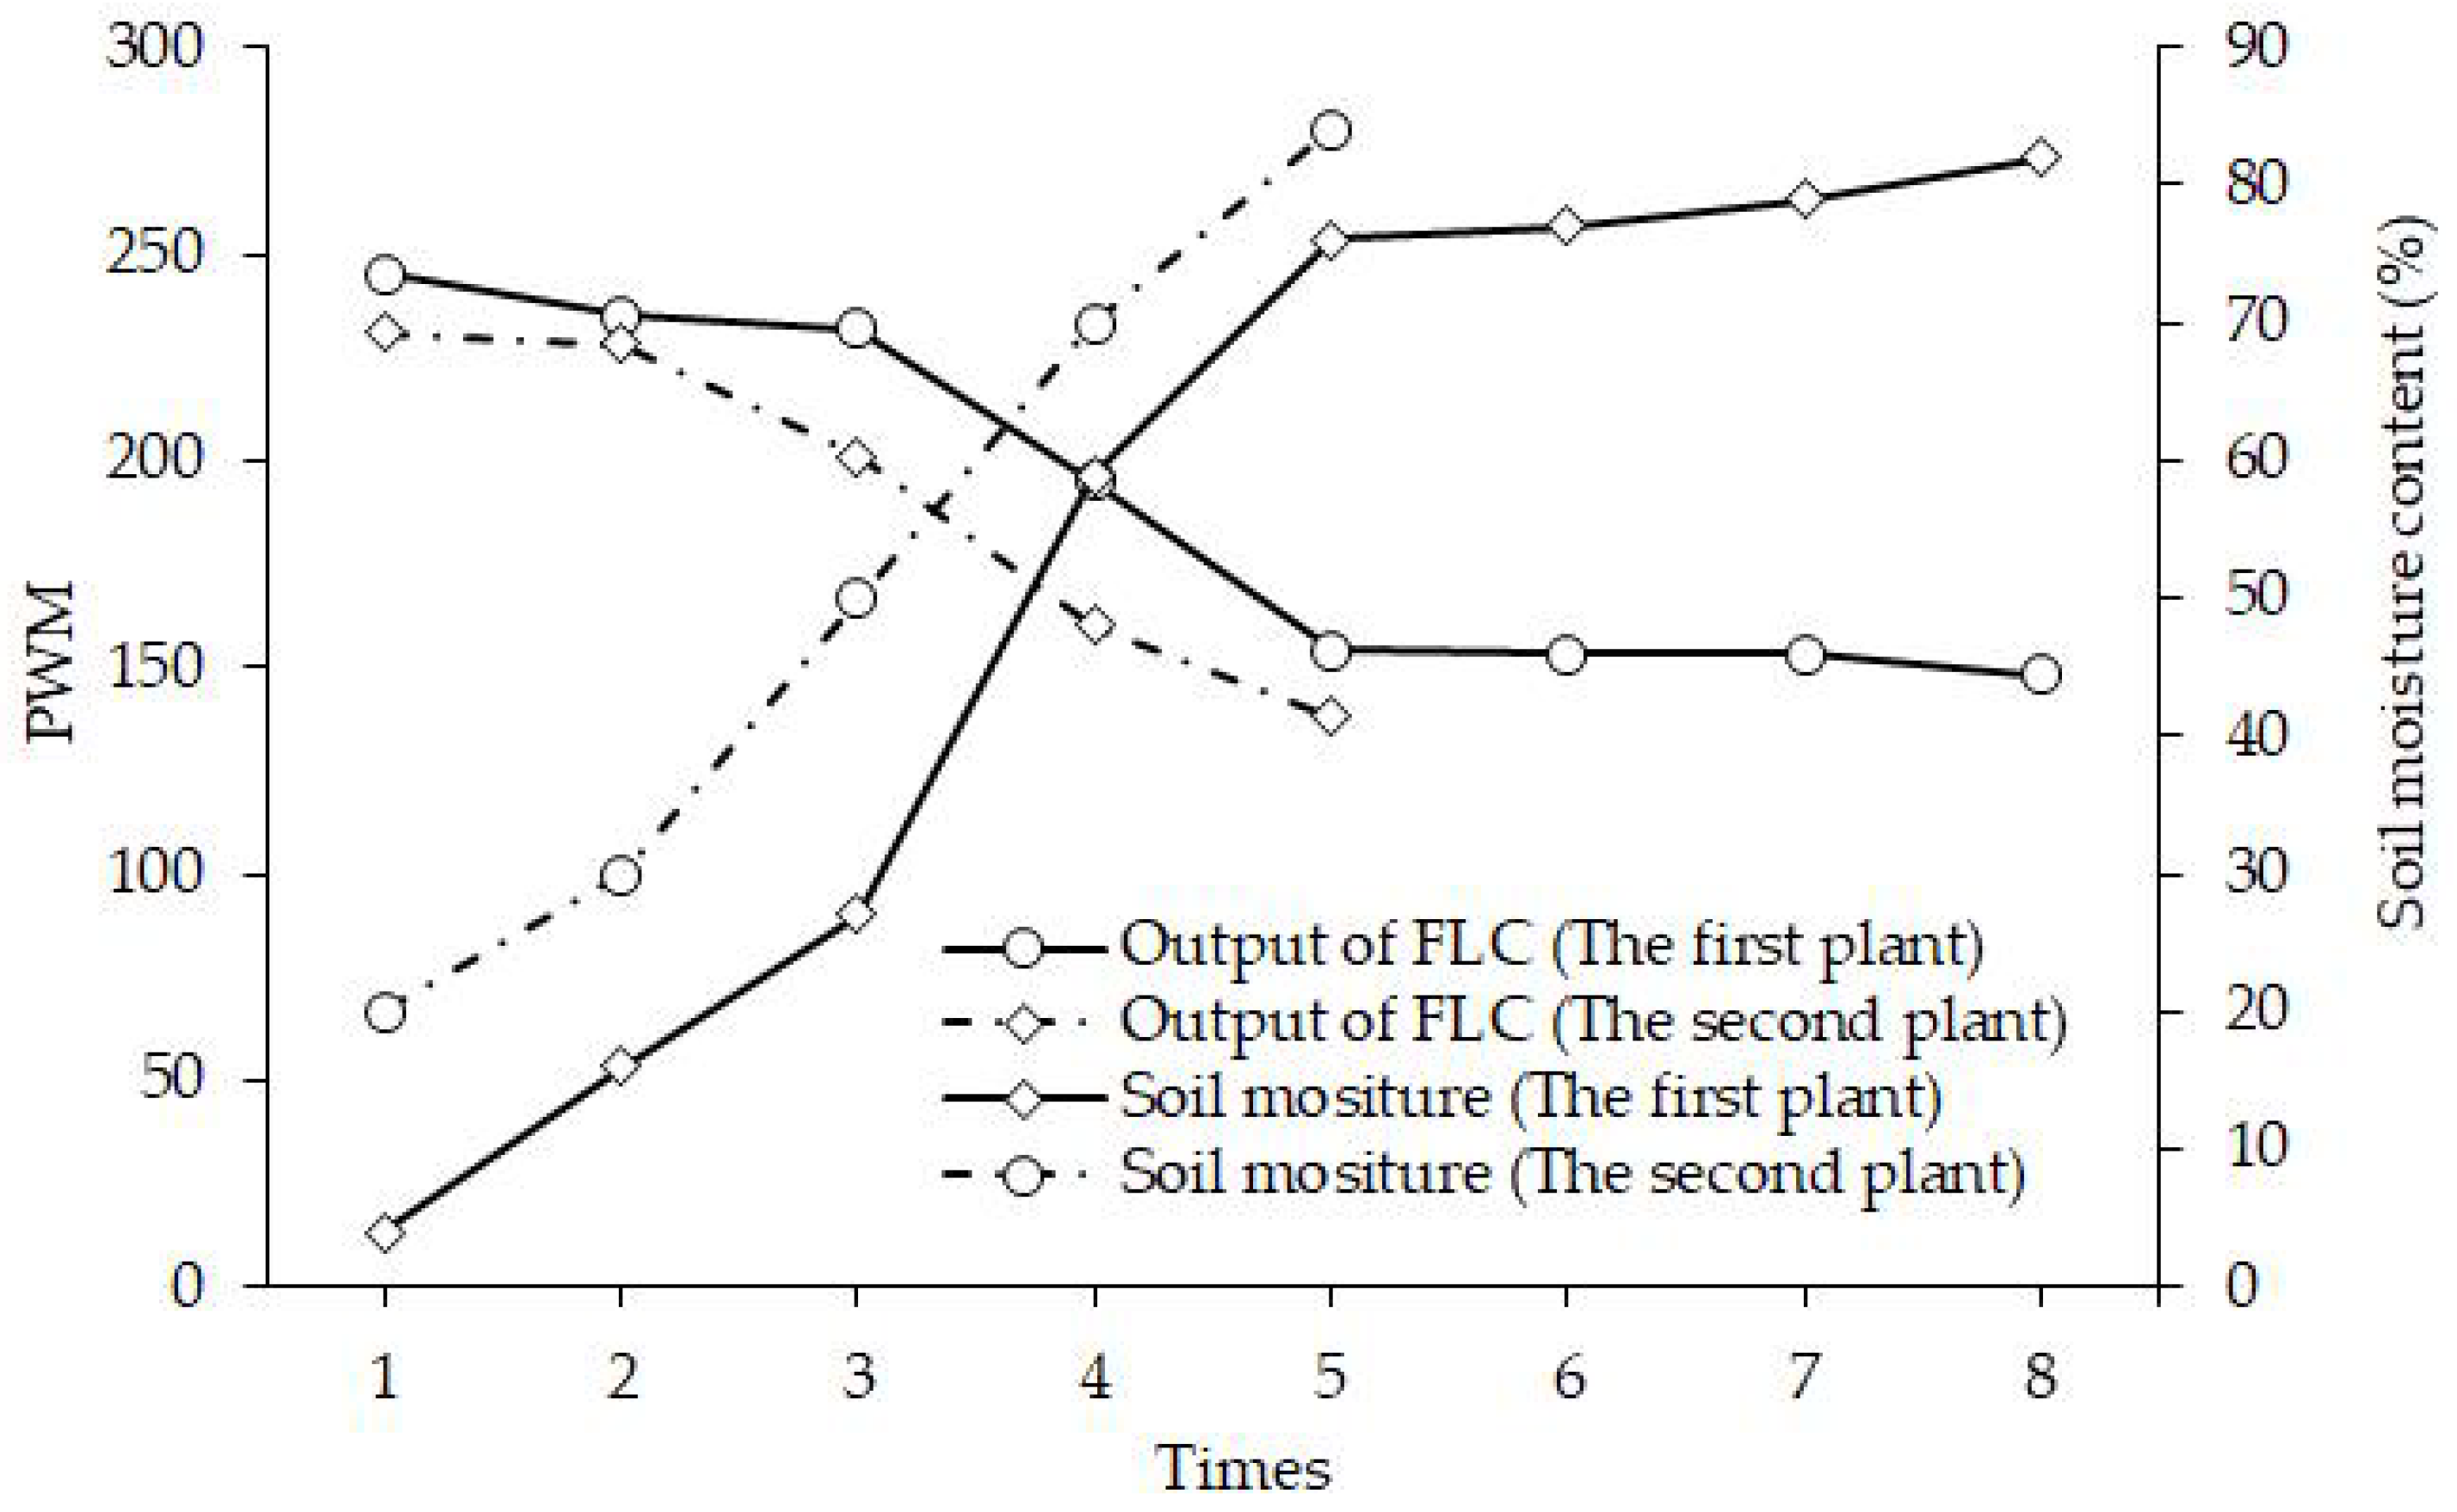
This experiment is carried out to evaluate the performance of the variable rate irrigation method that is proposed in this paper. Soil moisture sensors were installed around the roots of an entire row of plants (5 cm deep below the soil level) with wireless transmission devices to transmit the sensor values to the computer, so as to obtain the PWM signal for controlling the watering pump. Ten plants were used for testing. Figure 12 shows the soil moisture control results from the watering of two plants which were chosen randomly. The initial soil moisture content levels of these two plants were 4% and 20%. For the first plant, FLC activated the pump eight times for a total duration of 25.5 s and achieved a soil moisture level of 80%. For the second plant, FLC activated the pump five times for a total of 19.5 s. Based on the calculations, the variable rate irrigation device can achieve a soil moisture control range of 80 ± 10%.
4.3. Scenario 3
In order to test the correction rate of the actions that were conducted through the multi-tasking measurement, each plant in the area was observed for the actions that require completion, after which an assessment was carried out to determine if the machine actually completed these tasks within the designated area in order to assess the correctness of the machine operations.
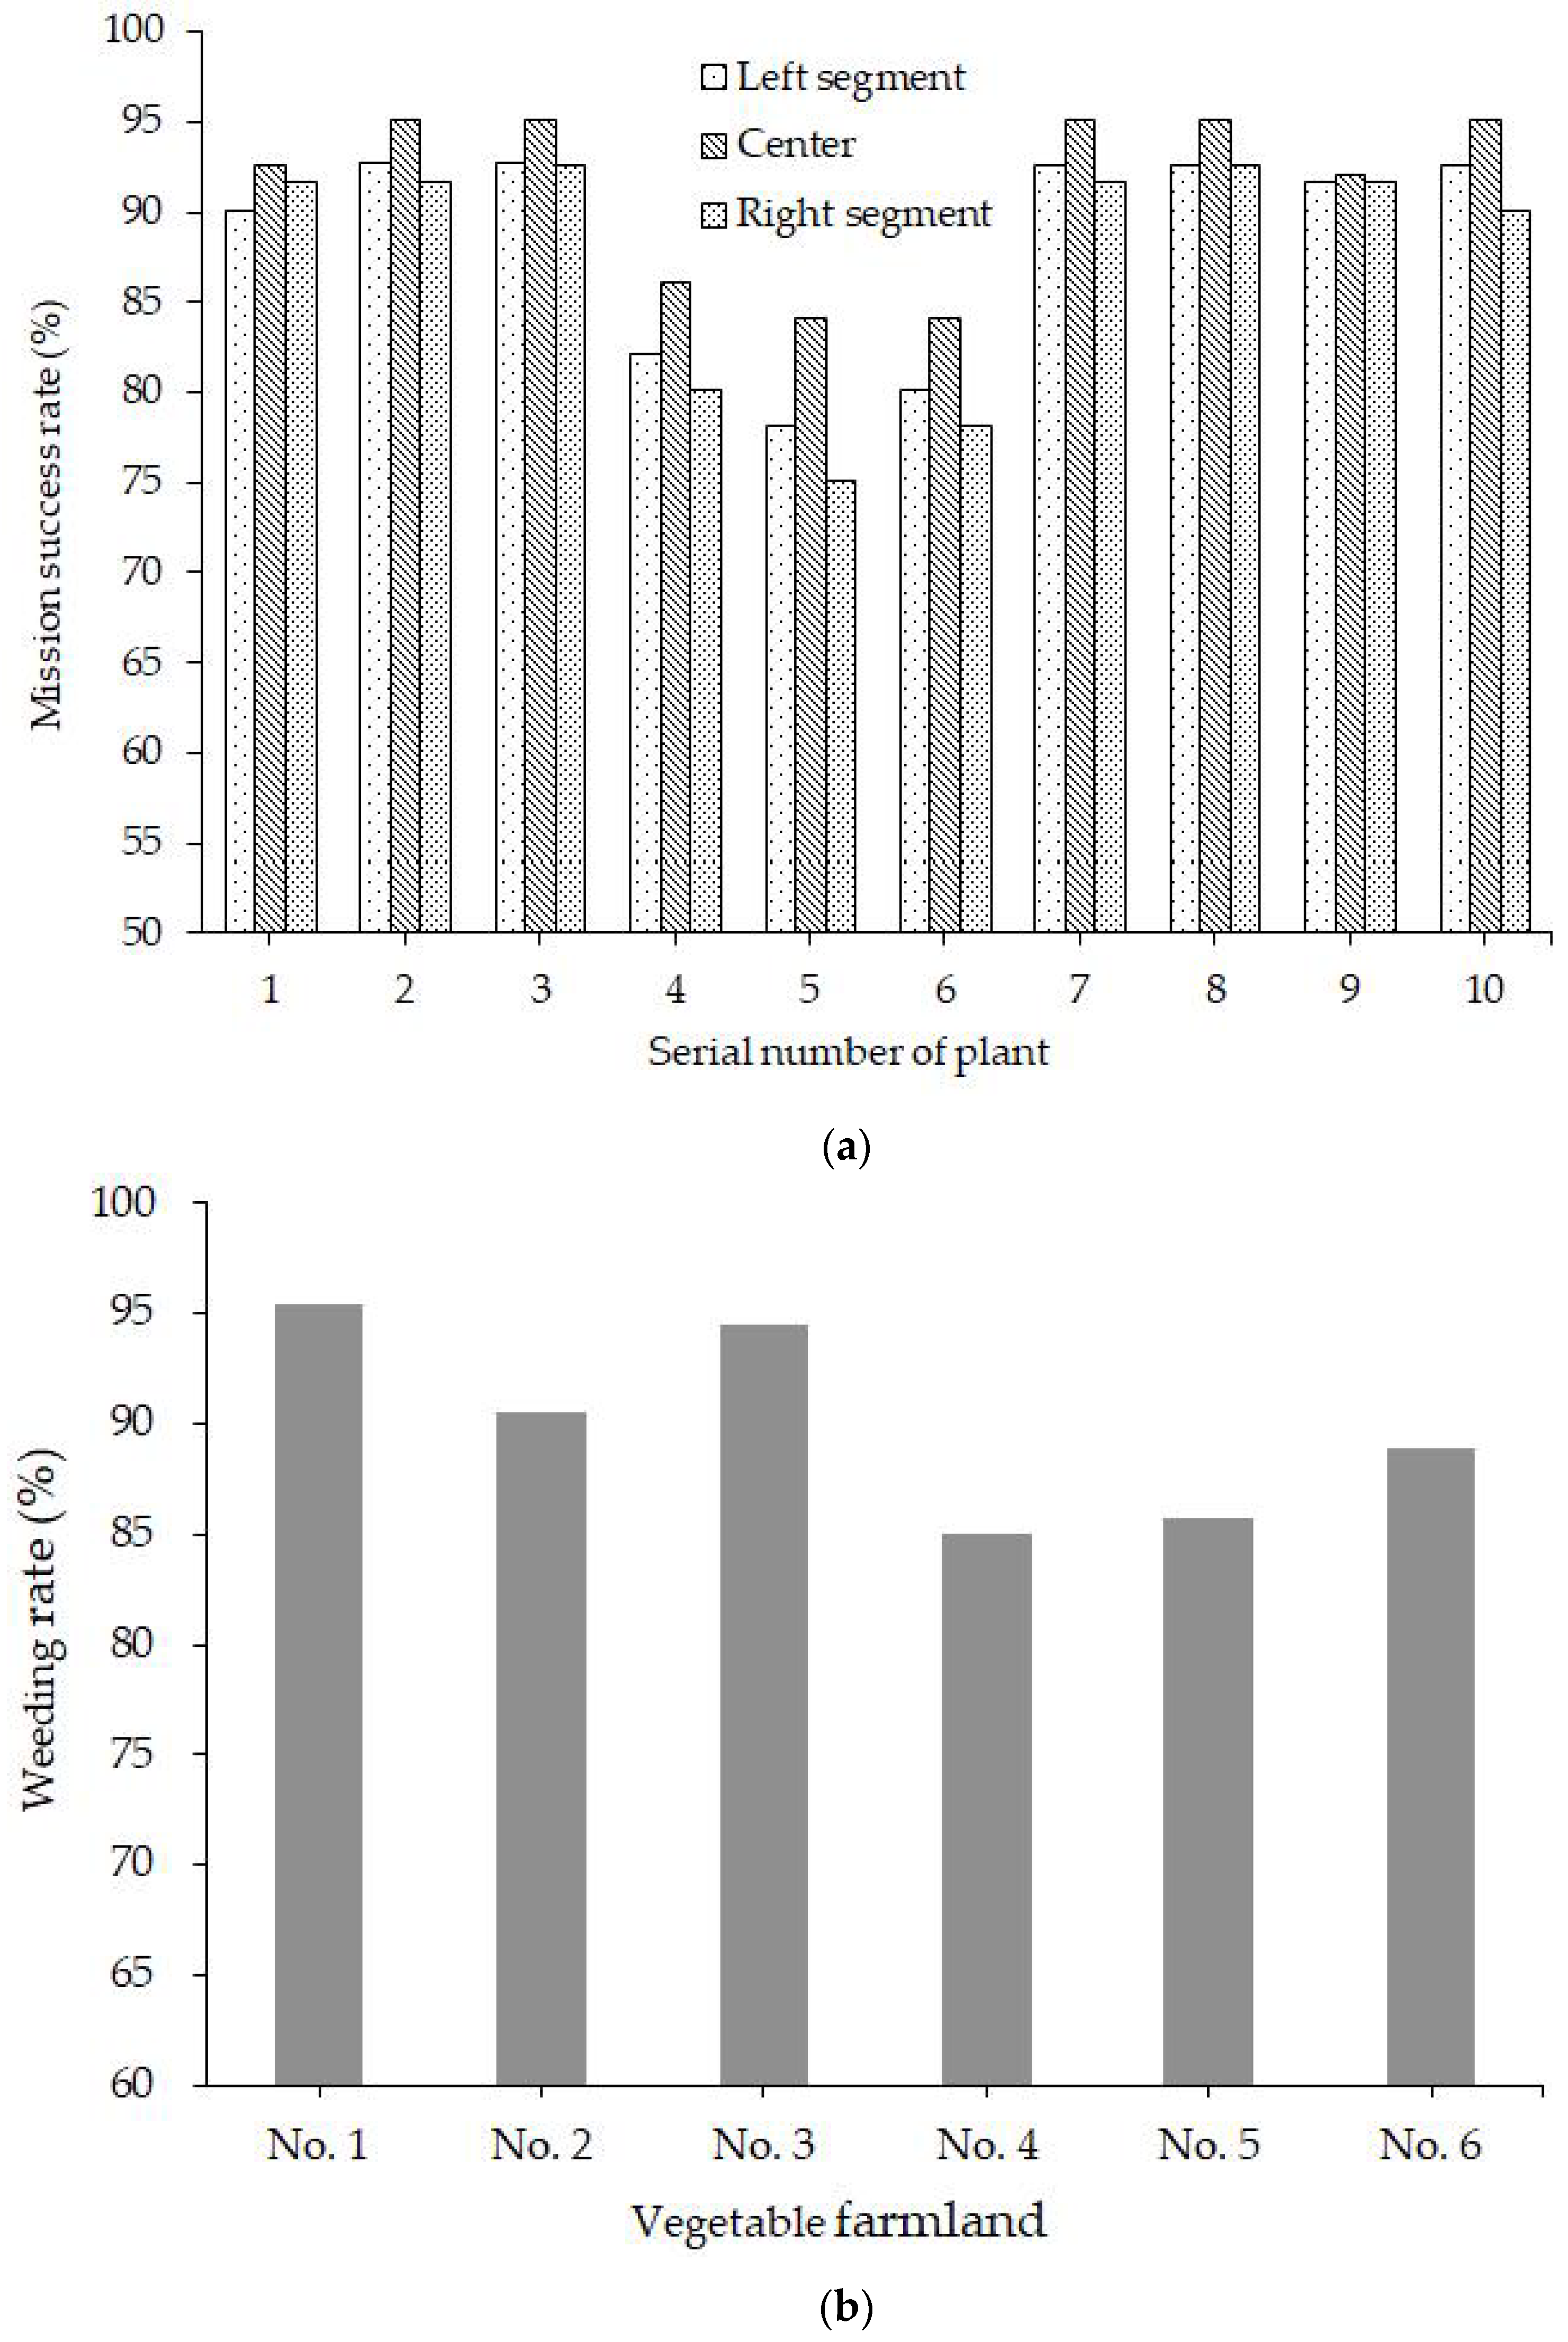
First, the machine was transported to the test area (field) and was placed at the starting position with its Logitech digital webcam focused on the first plant. The plant was placed in the center of the ROI in the graphical user interface (GUI). Then, the GUI activation button was pressed, at which point the indicator icon on the GUI became red. When the classification procedure was completed for the first plant, the indicator icon turned green. Next, the machine was manually pushed to the next plant and the process above was repeated. When changing rows, the stop button was pressed and the machine was re-activated after being moved to the next row. Figure 13a represents the operation success rate of the left, center, and right segments in the ROI when it was operating in the field. The figure shows that the mission success rate reaches a maximum of 95% and a minimum of 75%.
Figure 13b represents the weeding rate for each row of plants and shows that the average rate was about 90%. The total number of plants for measurement was 60. The weeding rate is defined as , with and representing the number of weeds before and after machine operation. It should be noted that the number of weeds in each row of the field was first counted manually.
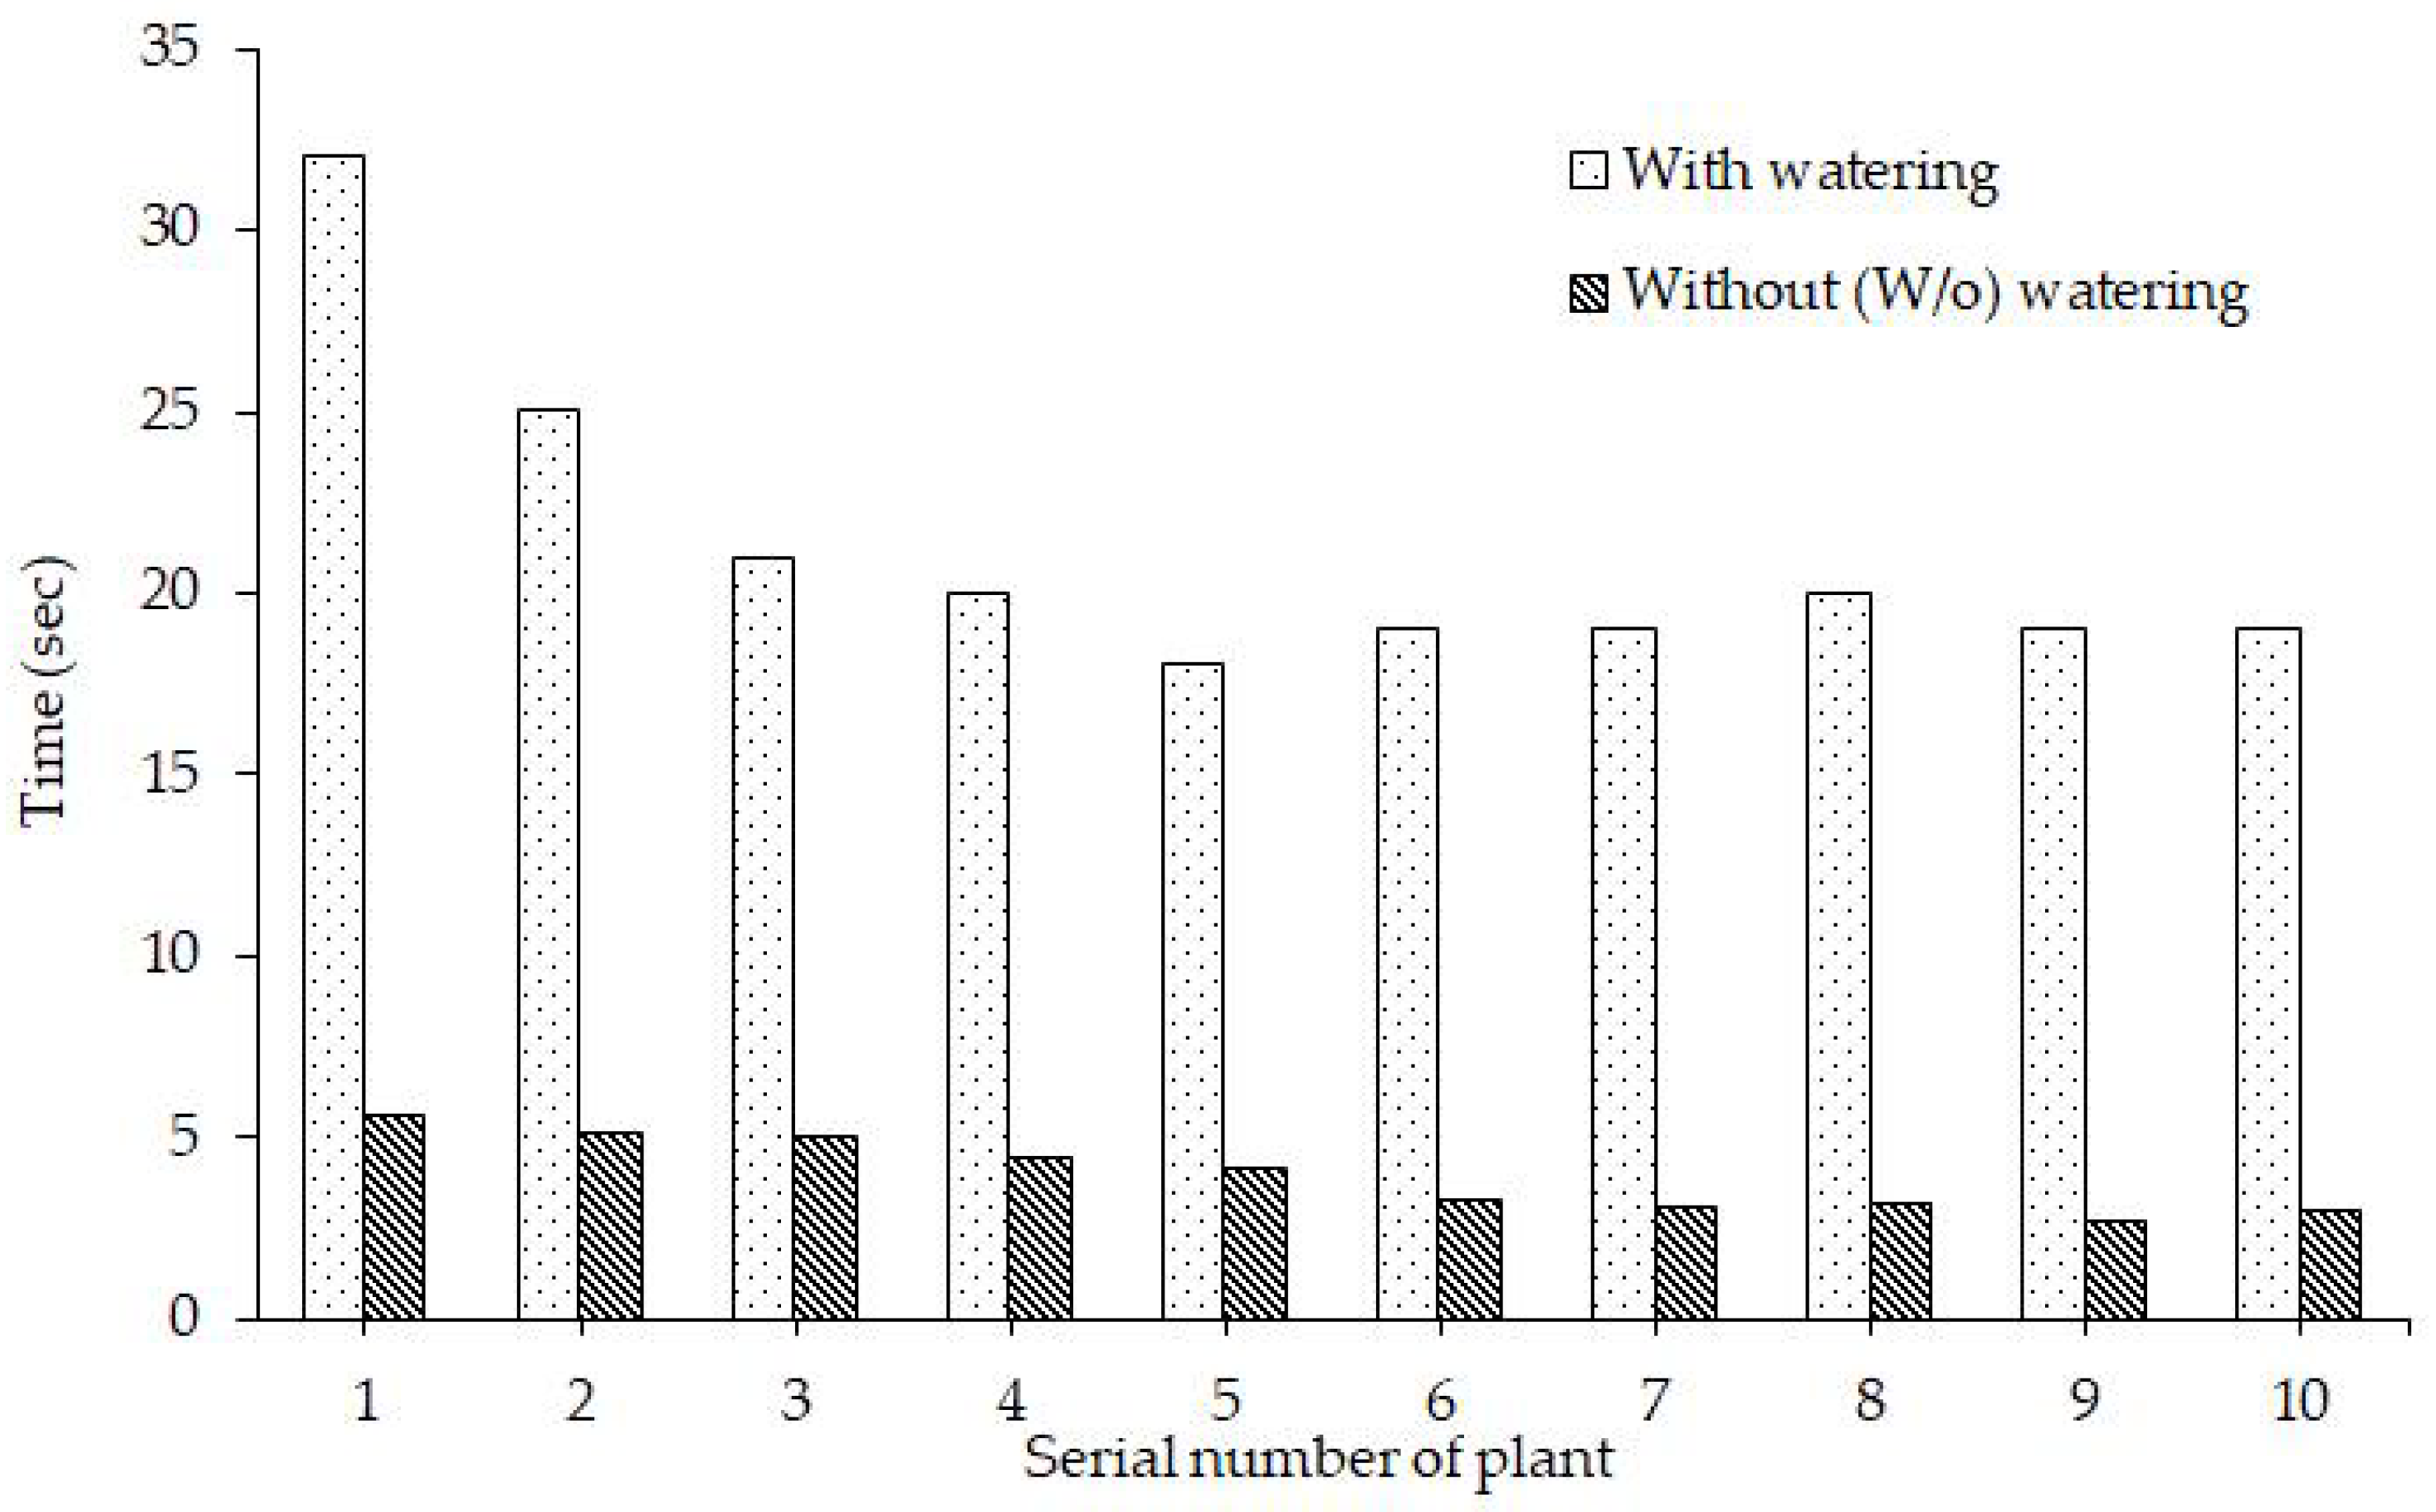
Next, the measurement time of each plant for cultivation task within rows of plants is evaluated. The tasks included the processing of 10 plants for each row and a total of six rows of plant were made. The operation time for each plant during the six rows was averaged (included the variable rate irrigation and no watering) to obtain the results as shown in Figure 14. The figure shows that the operation time for the first and second plants in each row is longer than that for the other plants. It is inferred that this is caused by the more iteration times for searching for the optimal threshold during the image identification process. The figure shows that it takes 15~26 s to water each plant and the entire operation time averages at 3.5 min. However, if the machine does not conduct watering operations, the time for a single row averages at approximately 40 s.
5. Conclusions
The multi-tasking farm machine that was proposed in this paper can be attached to an automated guided vehicle to implement consistent field operations in a small field. The experimental results show that the average weeding rate is 90%, and that the average wet distribution area of surface soil can be maintained at 75%. Although variable rate irrigation requires a longer operation time at this stage, this method could save water and it is believed that once hardware processing speeds increase in the future, this problem can be solved. The multi-tasking strategy that was proposed in this paper can also be expanded to different cultivation tasks and used in conjunction with the relevant farming equipment (such as seed planting, fertilizer, and chemical sprays) to achieve the objectives of maintained standardized field operations and the conservation of manpower.
Supplementary Materials
The following are available online at https://0-www-mdpi-com.brum.beds.ac.uk/2218-6581/7/3/38/s1, Video S1: Smart Ag Machine.
Author Contributions
The original concept and method of the research were provided by C.-L.C.; he also wrote the paper, supervised the work, and designed the experiments at all of the stages. The model simulation, software program development, control system establishment, field experiment conduction, and image data analysis were evaluated by K.-M.L. Both authors have read and approved the final paper.
Funding
This work has been supported by an earmarked fund for the Ministry of Science and Technology (MOST 106-2221-E-020-011).
Acknowledgments
The authors would like to thank Wei-Chen Chen for their contribution during the field cultivation experiment shown in this research. Besides, many thanks are due to anonymous reviewers for their valuable comments to refine this paper.
Conflicts of Interest
The authors declare no conflict of interest.
References
- Sims, B.; Heney, J. Promoting smallholder adoption of conservation agriculture through mechanization services. Agriculture 2017, 7, 64. [Google Scholar] [CrossRef]
- Pullen, D.; Cowell, P. An evaluation of the performance of mechanical weeding mechanisms for use in high speed inter-row weeding of arable crops. J. Agric. Eng. Res. 1997, 67, 27–34. [Google Scholar] [CrossRef]
- Hemming, J.; Nieuwenhuizen, A.T.; Struik, L.E. Image analysis system to determine crop row and plant positions for an intra-row weeding machine. In Proceedings of the CIGR International Symposium on Sustainable Bioproduction, Tokyo, Japan, 19–23 September 2011; pp. 1–7. [Google Scholar]
- Burgos-Artizzu, X.; Ribeiro, A.; Guijarro, M.; Pajares, G. Real-time image processing for crop/weed discrimination in maize fields. Comput. Electron. Agric. 2011, 75, 337–346. [Google Scholar] [CrossRef] [Green Version]
- Amir, H.; Kargar, B. Automatic weed detection system and smart herbicide sprayer robot for com fields. Int. J. Res. Comput. Commun. Technol. 2013, 2, 55–58. [Google Scholar]
- Choi, K.H.; Han, S.K.; Han, S.H.; Park, K.H.; Kim, K.S.; Kim, S. Morphology-based guidance line extraction for an autonomous weeding robot in pddy fields. Comput. Electron. Agric. 2015, 113, 266–274. [Google Scholar] [CrossRef]
- Herrera, P.J.; Dorado, J.; Ribeiro, A. A Novel Approach for Weed Type Classification Based on Shape Descriptors and a Fuzzy Decision-Making Method. Sensors 2014, 14, 15304–15324. [Google Scholar] [CrossRef] [PubMed] [Green Version]
- Cordill, C.; Grift, T. Design and testing of an intra-row mechanical weeding machine for corn. Biosyst. Eng. 2011, 110, 247–252. [Google Scholar] [CrossRef]
- Andujar, D.; Weis, M.; Gerhards, R. An ultrasonic system for weed detection in cereal crops. Sensors 2012, 12, 17343–17357. [Google Scholar] [CrossRef] [PubMed]
- Perez-Ruiz, M.; Slaughter, D.; Fathallah, F.; Gliever, C.; Miller, B. Co-robotic intra-row weed control system. Biosyst. Eng. 2014, 126, 45–55. [Google Scholar] [CrossRef]
- Tillett, N.; Hague, T.; Grundy, A.; Dedousis, A. Mechanical within row weed control for transplanted crops using computer vision. Biosyst. Eng. 2008, 99, 171–178. [Google Scholar] [CrossRef]
- Gobor, Z. Mechatronic system for mechanical weed control of the intra-row area in row crops. KI-Künstliche Intell. 2013, 27, 379–383. [Google Scholar] [CrossRef]
- Langsenkamp, F.; Sellmann, F.; Kohlbrecher, M.; Trautz, D. Tube Stamp for mechanical intra-row individual Plant Weed Control. In Proceedings of the 18th World Congress of CIGR, Beijing, China, 16–19 September 2014. [Google Scholar]
- Blasco, J.; Aleixos, N.; Roger, J.M.; Rabatel, G.; Molto, E. Robotics weed control using machine vision. Biosyst. Eng. 2002, 83, 149–157. [Google Scholar] [CrossRef]
- Xiong, Y.; Ge, Y.; Liang, Y.; Blackmore, S. Development of a prototype robot and fast path-planning algorithm for static laser weeding. Comput. Electron. Agric. 2017, 142, 494–503. [Google Scholar] [CrossRef]
- Bawden, O.; Kulk, J.; Russell, R.; McCool, C.; English, A.; Dayoub, F.; Lehnert, C.; Perez, T. Robot for weed species plant-specific management. J. Field Robot. 2017, 34, 1179–1199. [Google Scholar] [CrossRef]
- McCool, C.; Beattie, J.; Firn, J.; Lehnert, C.; Kulk, J.; Bawden, O.; Russell, R.; Perez, T. Efficacy of mechanical weeding tools: A study into alternative weed management strategies enabled by robotics. IEEE Robot. Autom. Lett. 2018, 3, 1184–1190. [Google Scholar] [CrossRef]
- Teixido, M.; Font, D.; Palleja, T.; Tresanchez, M.; Nogues, M.; Palacin, J. Definition of linear color models in the RGB vector color space to detect red peaches in orchard images taken under natural illumination. Sensors 2012, 12, 7701–7718. [Google Scholar] [CrossRef] [PubMed]
- Hamuda, E.; Ginley, B.; Glavin, M.; Jones, E. Automatic crop detection under field conditions using the HSV colour space and morphological operations. Comput. Electron. Agric. 2017, 133, 97–107. [Google Scholar] [CrossRef]
- Yang, W.; Wang, S.; Zhao, X.; Zhang, J.; Feng, J. Greenness identification based on HSV decision tree. Inf. Proc. Agric. 2015, 2, 149–160. [Google Scholar] [CrossRef]
- Romeo, J.; Pajares, J.; Montalvo, M.; Guerrero, J.; Guijarro, M. A new expert system for greenness identification in agricultural images. Expert Syst. Appl. 2013, 40, 2275–2286. [Google Scholar] [CrossRef]
- Arroyo, J.; Guijarro, M.; Pajares, G. An instance-based learning approach for thresholding in crop images under different outdoor conditions. Comput. Electron. Agric. 2016, 127, 669–679. [Google Scholar] [CrossRef]
- Suh, H.K.; Hofstee, J.W.; Henten, E.J. Improved vegetation segmentation with ground shadow removal using an HDR camera. Precis. Agric. 2018, 19, 218–237. [Google Scholar] [CrossRef]
- Keely, M.; Ehn, E.; Patzoldt, W. Smart Machines for Weed Control & Beyond. In Proceedings of the 65th West Texas Agricultural Chemicals Institute Conference, Lubbock, TX, USA, 13 September 2017; Available online: http://www.plantmanagementnetwork.org/edcenter/seminars/2017AgChemicalsConference/SmartMachinesWeedControl/SmartMachinesWeedControl.pdf (accessed on 28 June 2018).
- Tanner, S. Low—Herbicide Robotic Weeding. World Agri—Tech Innovation Summit London, 17–18 October 2017. Available online: http://worldagritechinnovation.com/wp-content/uploads/2017/10/EcoRobotix.pdf (accessed on 25 June 2018).
- Amatya, S.; Karkee, M.; Zhang, Q.; Whiting, M.D. Automated detection of branch shaking locations for robotic cherry harvesting using machine vision. Robotics 2017, 6, 31. [Google Scholar] [CrossRef]
- Cubero, S.; Lee, W.S.; Aleixos, N.; Albert, F.; Blasco, J. Automated systems based on machine vision for inspecting citrus fruits from the field to postharvest—A review. Food Bioprocess Technol. 2016, 9, 1623–1639. [Google Scholar] [CrossRef]
- Chang, C.; Lin, K.; Fu, W. An intelligent crop cultivation system based on computer vision with a multiplex switch approach. In Proceedings of the ASABE Annual International Meeting, Spokane, WA, USA, 16–19 July 2017. [Google Scholar]
- Zadeh, L.A. A rationale for fuzzy control. J. Dyn. Syst. Meas. Control 1972, 94, 3–4. [Google Scholar] [CrossRef]
- Lee, C.C. Fuzzy logic in control system: Fuzzy logic controller. I. IEEE Trans. Syst. Man Cybern. 1990, 20, 404–418. [Google Scholar] [CrossRef]
Figure 1.
Flowchart for the image processing with the adaptive threshold method.

Figure 2.
Flowchart of image processing. (a) Original image; (b) output channel; (c) feature extraction; (d) mark the position of the plant and weeds.
Figure 2.
Flowchart of image processing. (a) Original image; (b) output channel; (c) feature extraction; (d) mark the position of the plant and weeds.

Figure 3.
The diagram of the variable rate irrigation system.

Figure 4.
Rule surface for FLC.

Figure 5.
Illustration of the range of region of interest in the digital image.

Figure 6.
Prototype design of the proposed multi-functional farming robot.

Figure 7.
Weeding mechanism and sprayer. (a) Linkage device; (b) weed mechanisms and sprayer.

Figure 8.
The layout of GUI for the smart machine.

Figure 9.
(a) The layout of experiment site and the appearance of the farm machine; (b) Smart machine to be used for cultivating work in the field.
Figure 9.
(a) The layout of experiment site and the appearance of the farm machine; (b) Smart machine to be used for cultivating work in the field.

Figure 10.
Classification results of the image using the proposed image processing method at 3 p.m. (a) original image (10 a.m.); (b) initial threshold ; (c) threshold update (second iterations); (d) final iteration; (e) pixel that belongs to the plant is highlighted in white; (f) pixel that belongs to the weeds is highlighted in white.

Figure 11.
Classification results for the image processing technique with adaptive threshold (a) plant; (b) weed.
Figure 11.
Classification results for the image processing technique with adaptive threshold (a) plant; (b) weed.

Figure 12.
Number of waterings in relation to the number of variable rate irrigations and soil moisture.
Figure 12.
Number of waterings in relation to the number of variable rate irrigations and soil moisture.

Figure 13.
(a) Measurement results with the proposed system for each of the ten plants; (b) weeding rate in different vegetable farmland.
Figure 13.
(a) Measurement results with the proposed system for each of the ten plants; (b) weeding rate in different vegetable farmland.

Figure 14.
The average measurement of time for each of the ten plants in one row.


Table 1.
Input and output values and linguistic labels.
| , , , | Linguistic Labels | , , | Linguistic Labels | , , | Linguistic Labels |
|---|---|---|---|---|---|
| [0, 0, 91, 109] | W | [0, 0, 40] | H | [0, 0, 145] | L |
| [97, 105, 113, 0] | N | [30, 50, 70] | M | [135, 170, 200] | M |
| [100, 118, 255, 255] | D | [60, 100, 100] | L | [185, 255, 255] | H |
Table 2.
Fuzzy logic inference table.
| W | N | D | ||
|---|---|---|---|---|
| (SMC) | L | H | H | H |
| M | L | M | H | |
| H | L | L | L | |
© 2018 by the authors. Licensee MDPI, Basel, Switzerland. This article is an open access article distributed under the terms and conditions of the Creative Commons Attribution (CC BY) license (http://creativecommons.org/licenses/by/4.0/).
Share and Cite
MDPI and ACS Style
Chang, C.-L.; Lin, K.-M. Smart Agricultural Machine with a Computer Vision-Based Weeding and Variable-Rate Irrigation Scheme. Robotics 2018, 7, 38. https://0-doi-org.brum.beds.ac.uk/10.3390/robotics7030038
AMA Style
Chang C-L, Lin K-M. Smart Agricultural Machine with a Computer Vision-Based Weeding and Variable-Rate Irrigation Scheme. Robotics. 2018; 7(3):38. https://0-doi-org.brum.beds.ac.uk/10.3390/robotics7030038
Chicago/Turabian StyleChang, Chung-Liang, and Kuan-Ming Lin. 2018. "Smart Agricultural Machine with a Computer Vision-Based Weeding and Variable-Rate Irrigation Scheme" Robotics 7, no. 3: 38. https://0-doi-org.brum.beds.ac.uk/10.3390/robotics7030038
Note that from the first issue of 2016, this journal uses article numbers instead of page numbers. See further details here.