Detection of Land Subsidence Associated with Land Creation and Rapid Urbanization in the Chinese Loess Plateau Using Time Series InSAR: A Case Study of Lanzhou New District

 ,
,
Abstract
:
1. Introduction
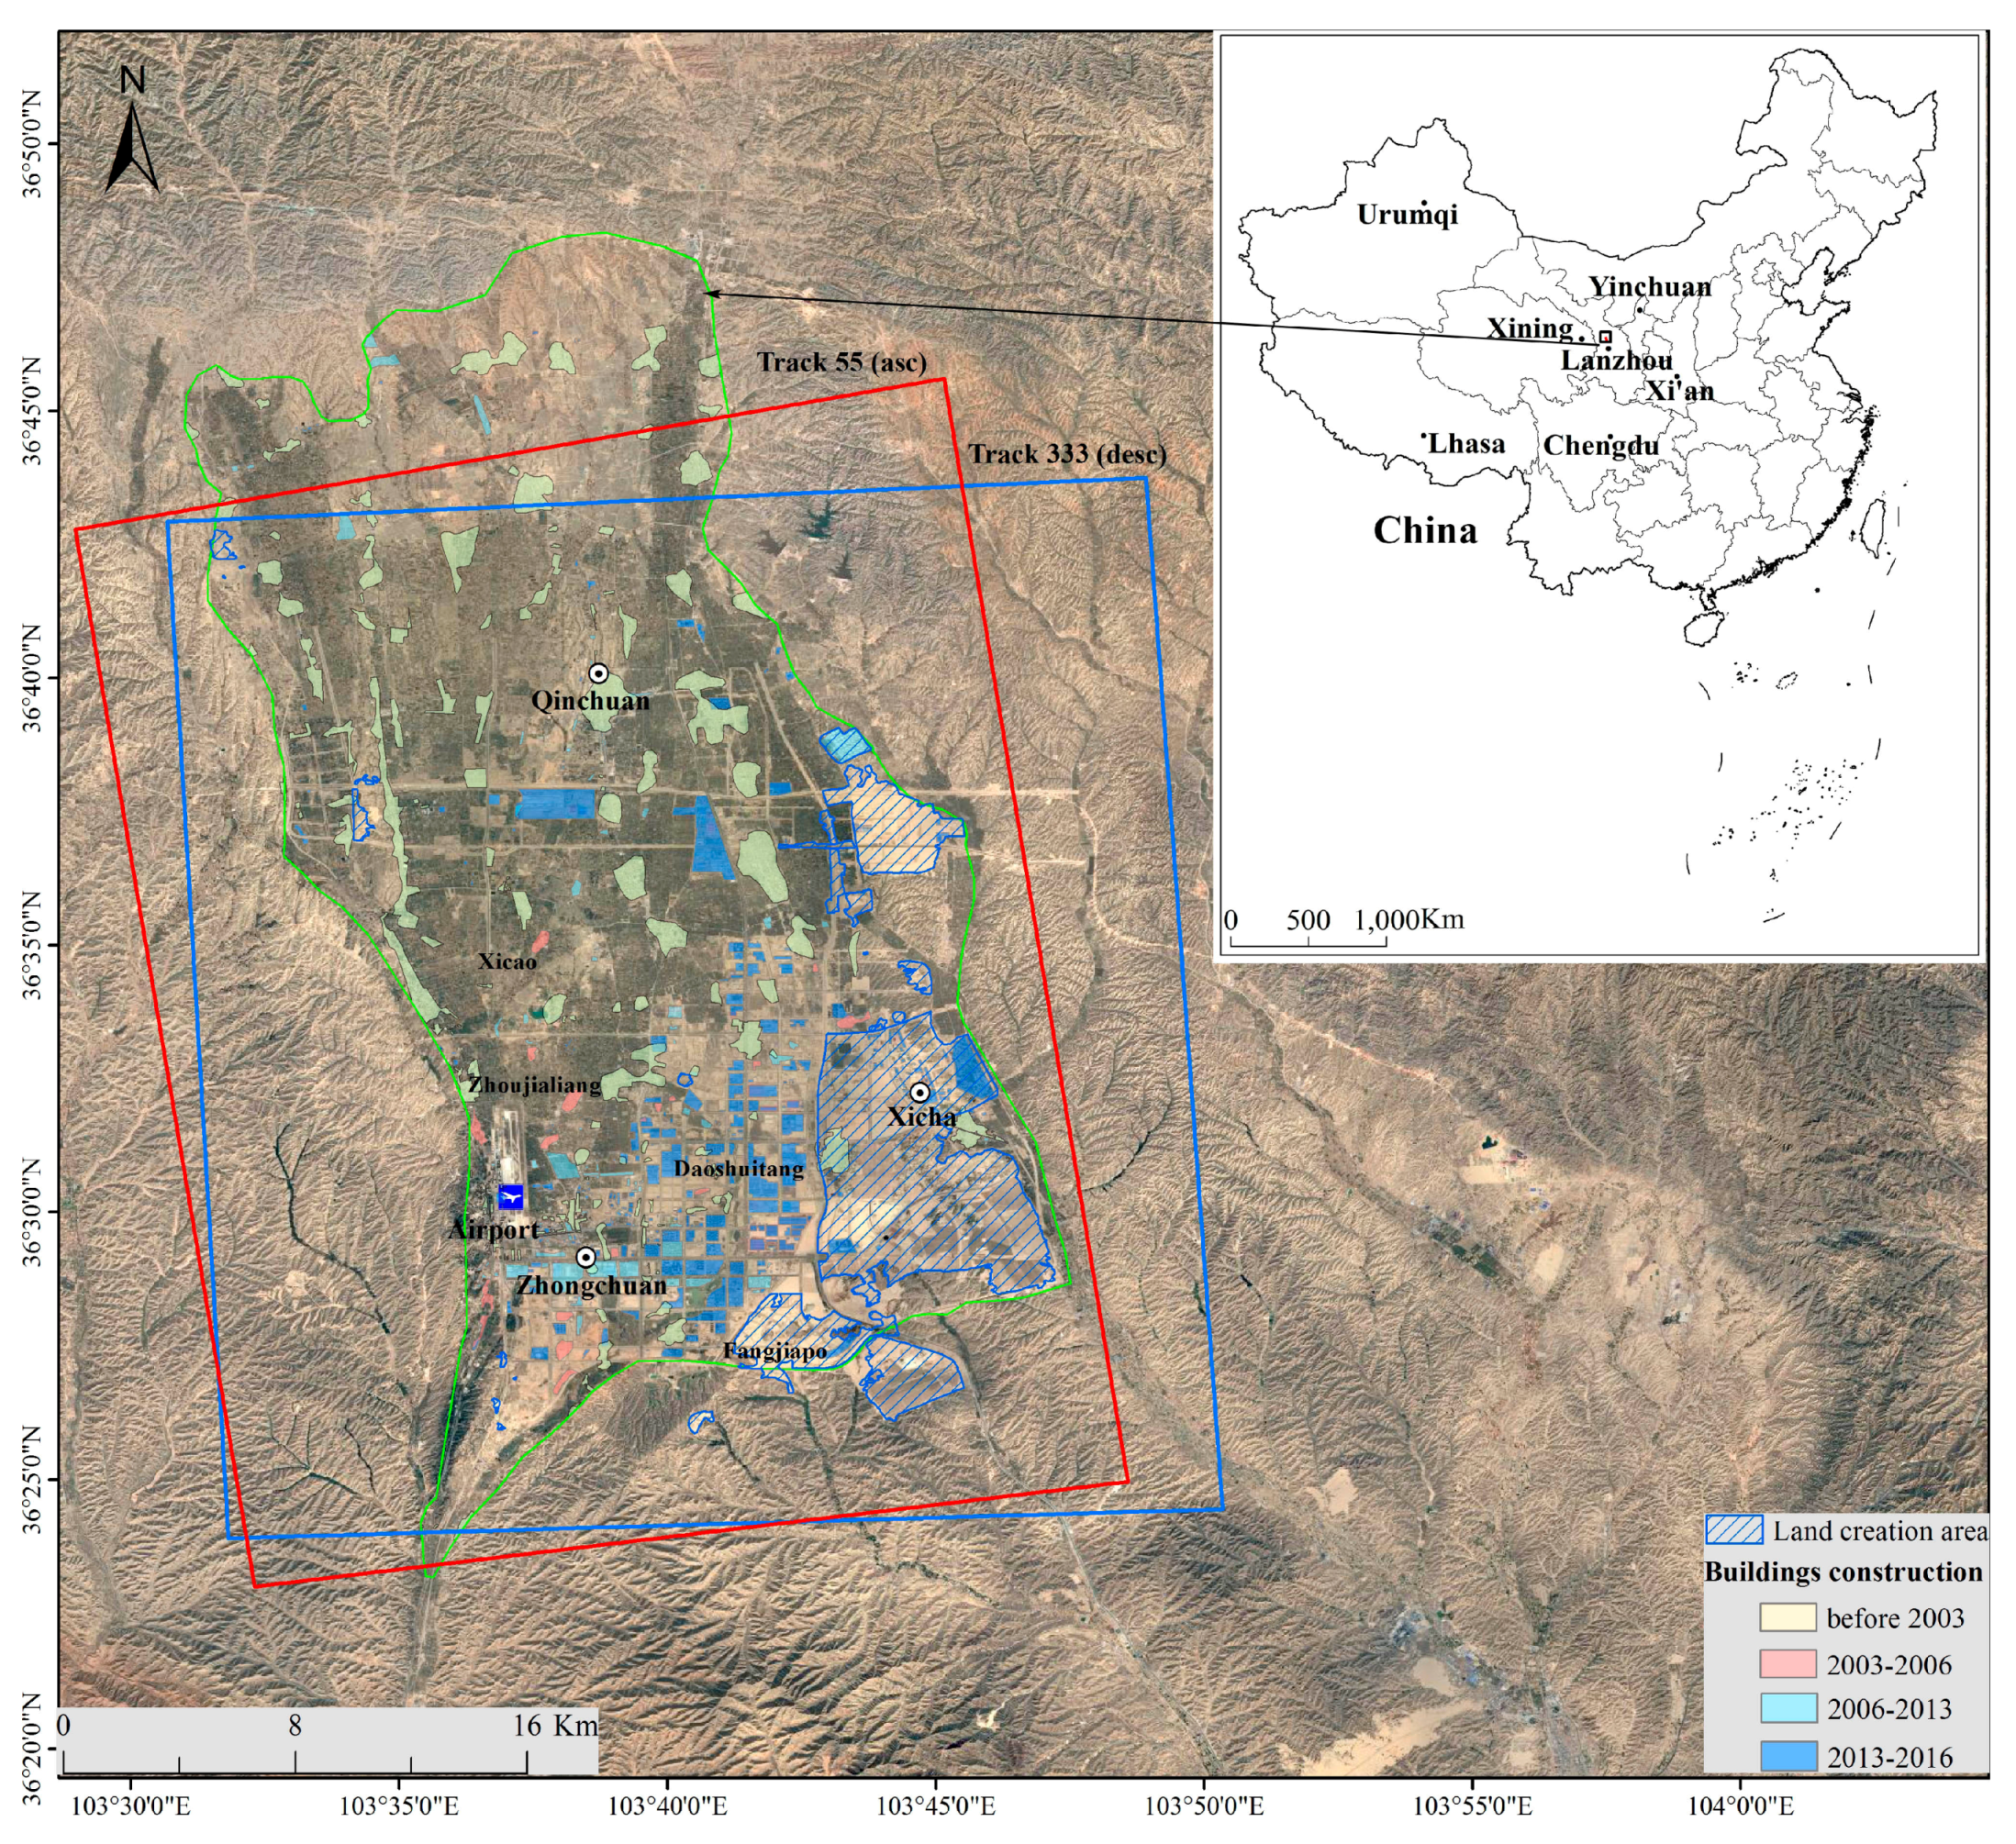
2. Study Area
3. Data and Methods
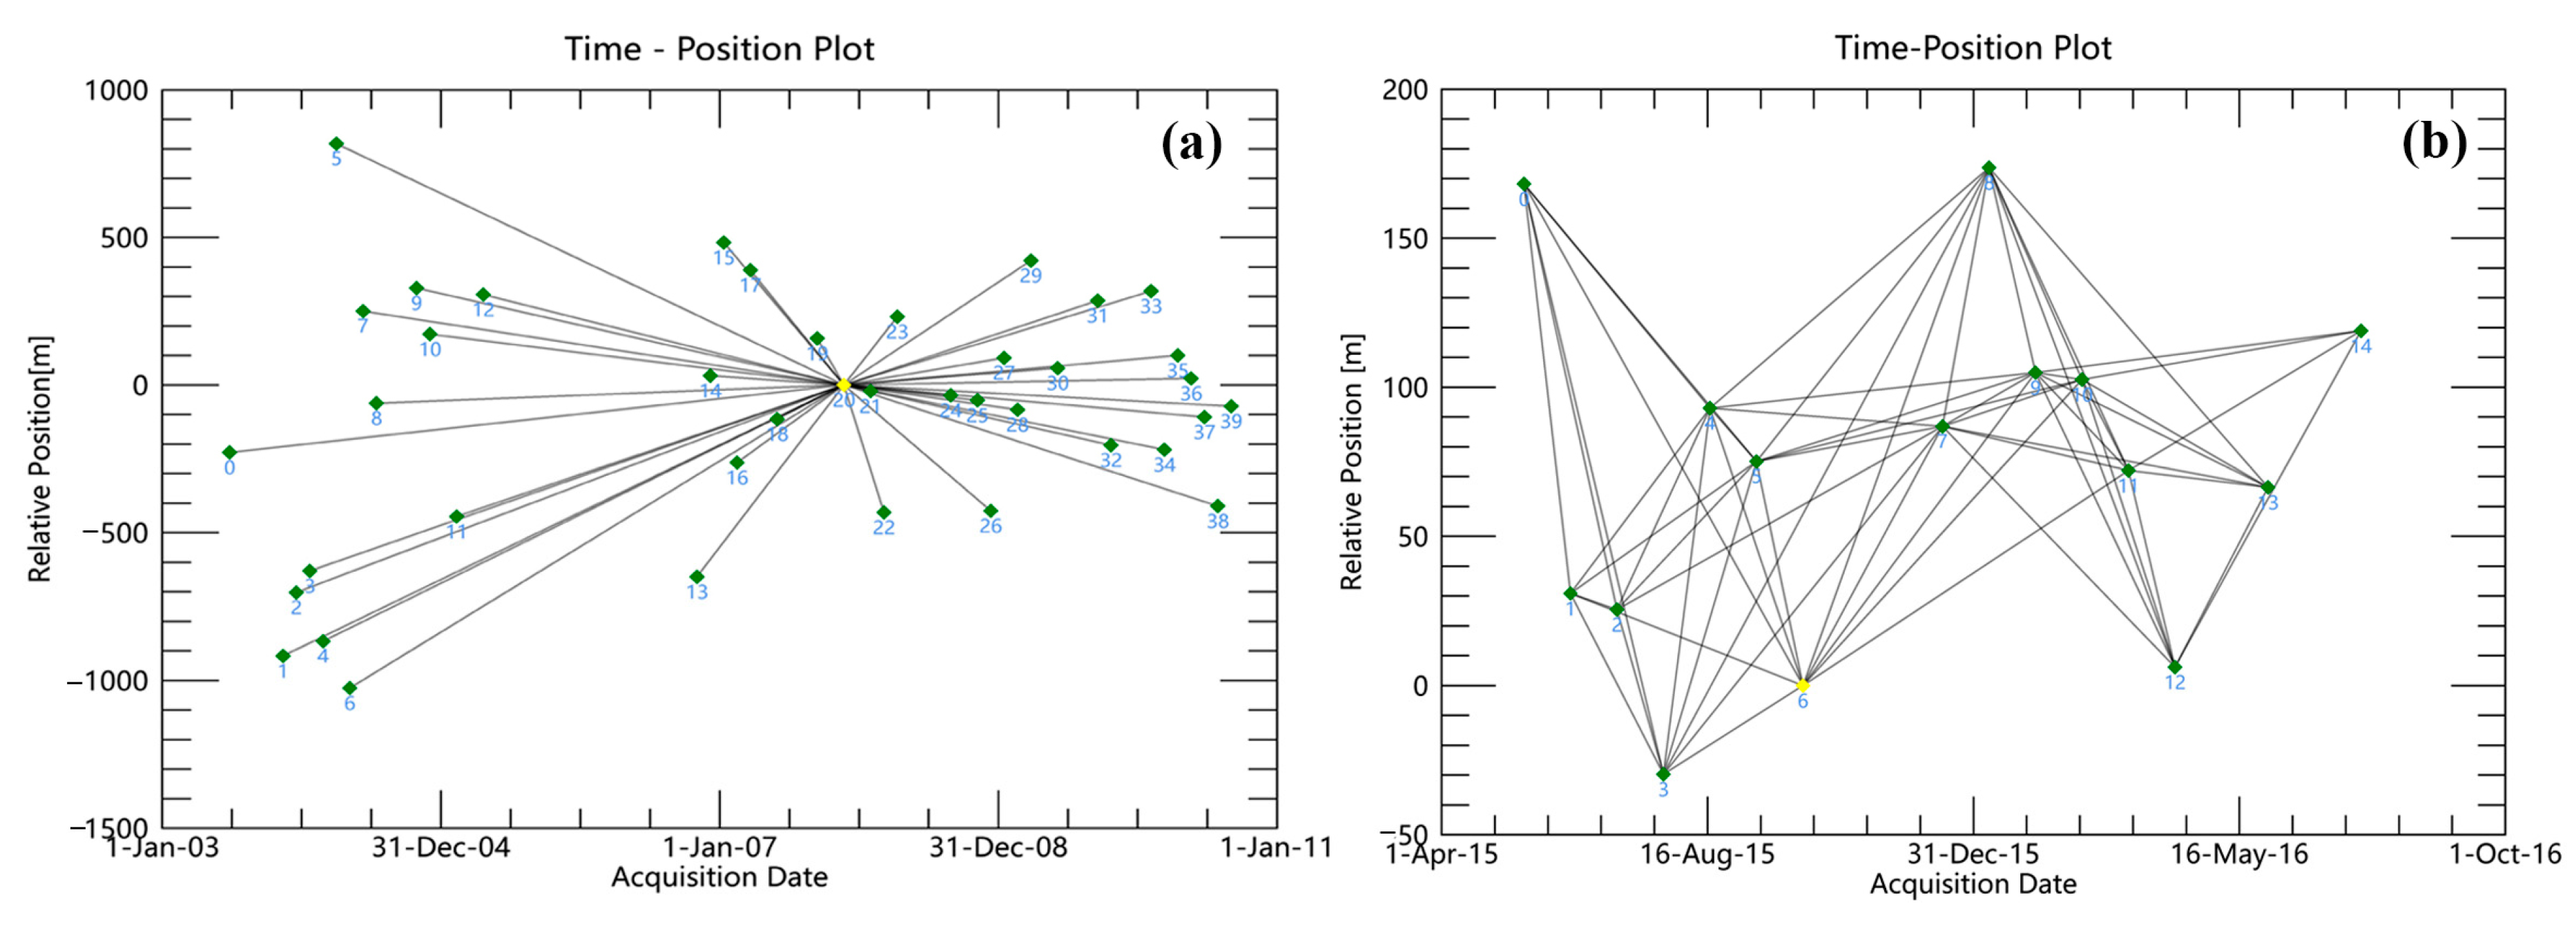
3.1. PSInSAR
3.2. SBAS
4. Results
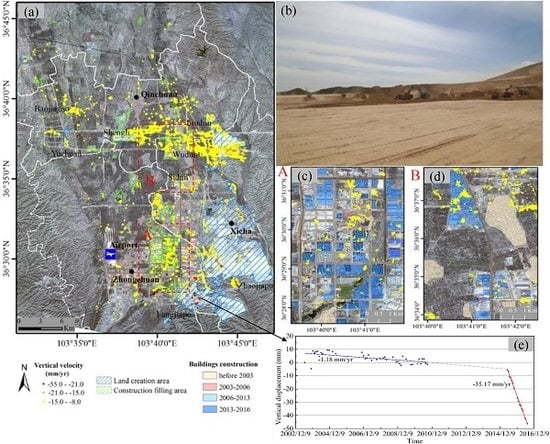
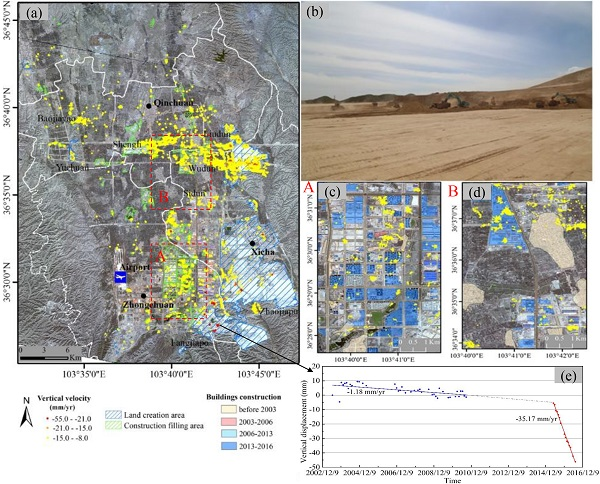
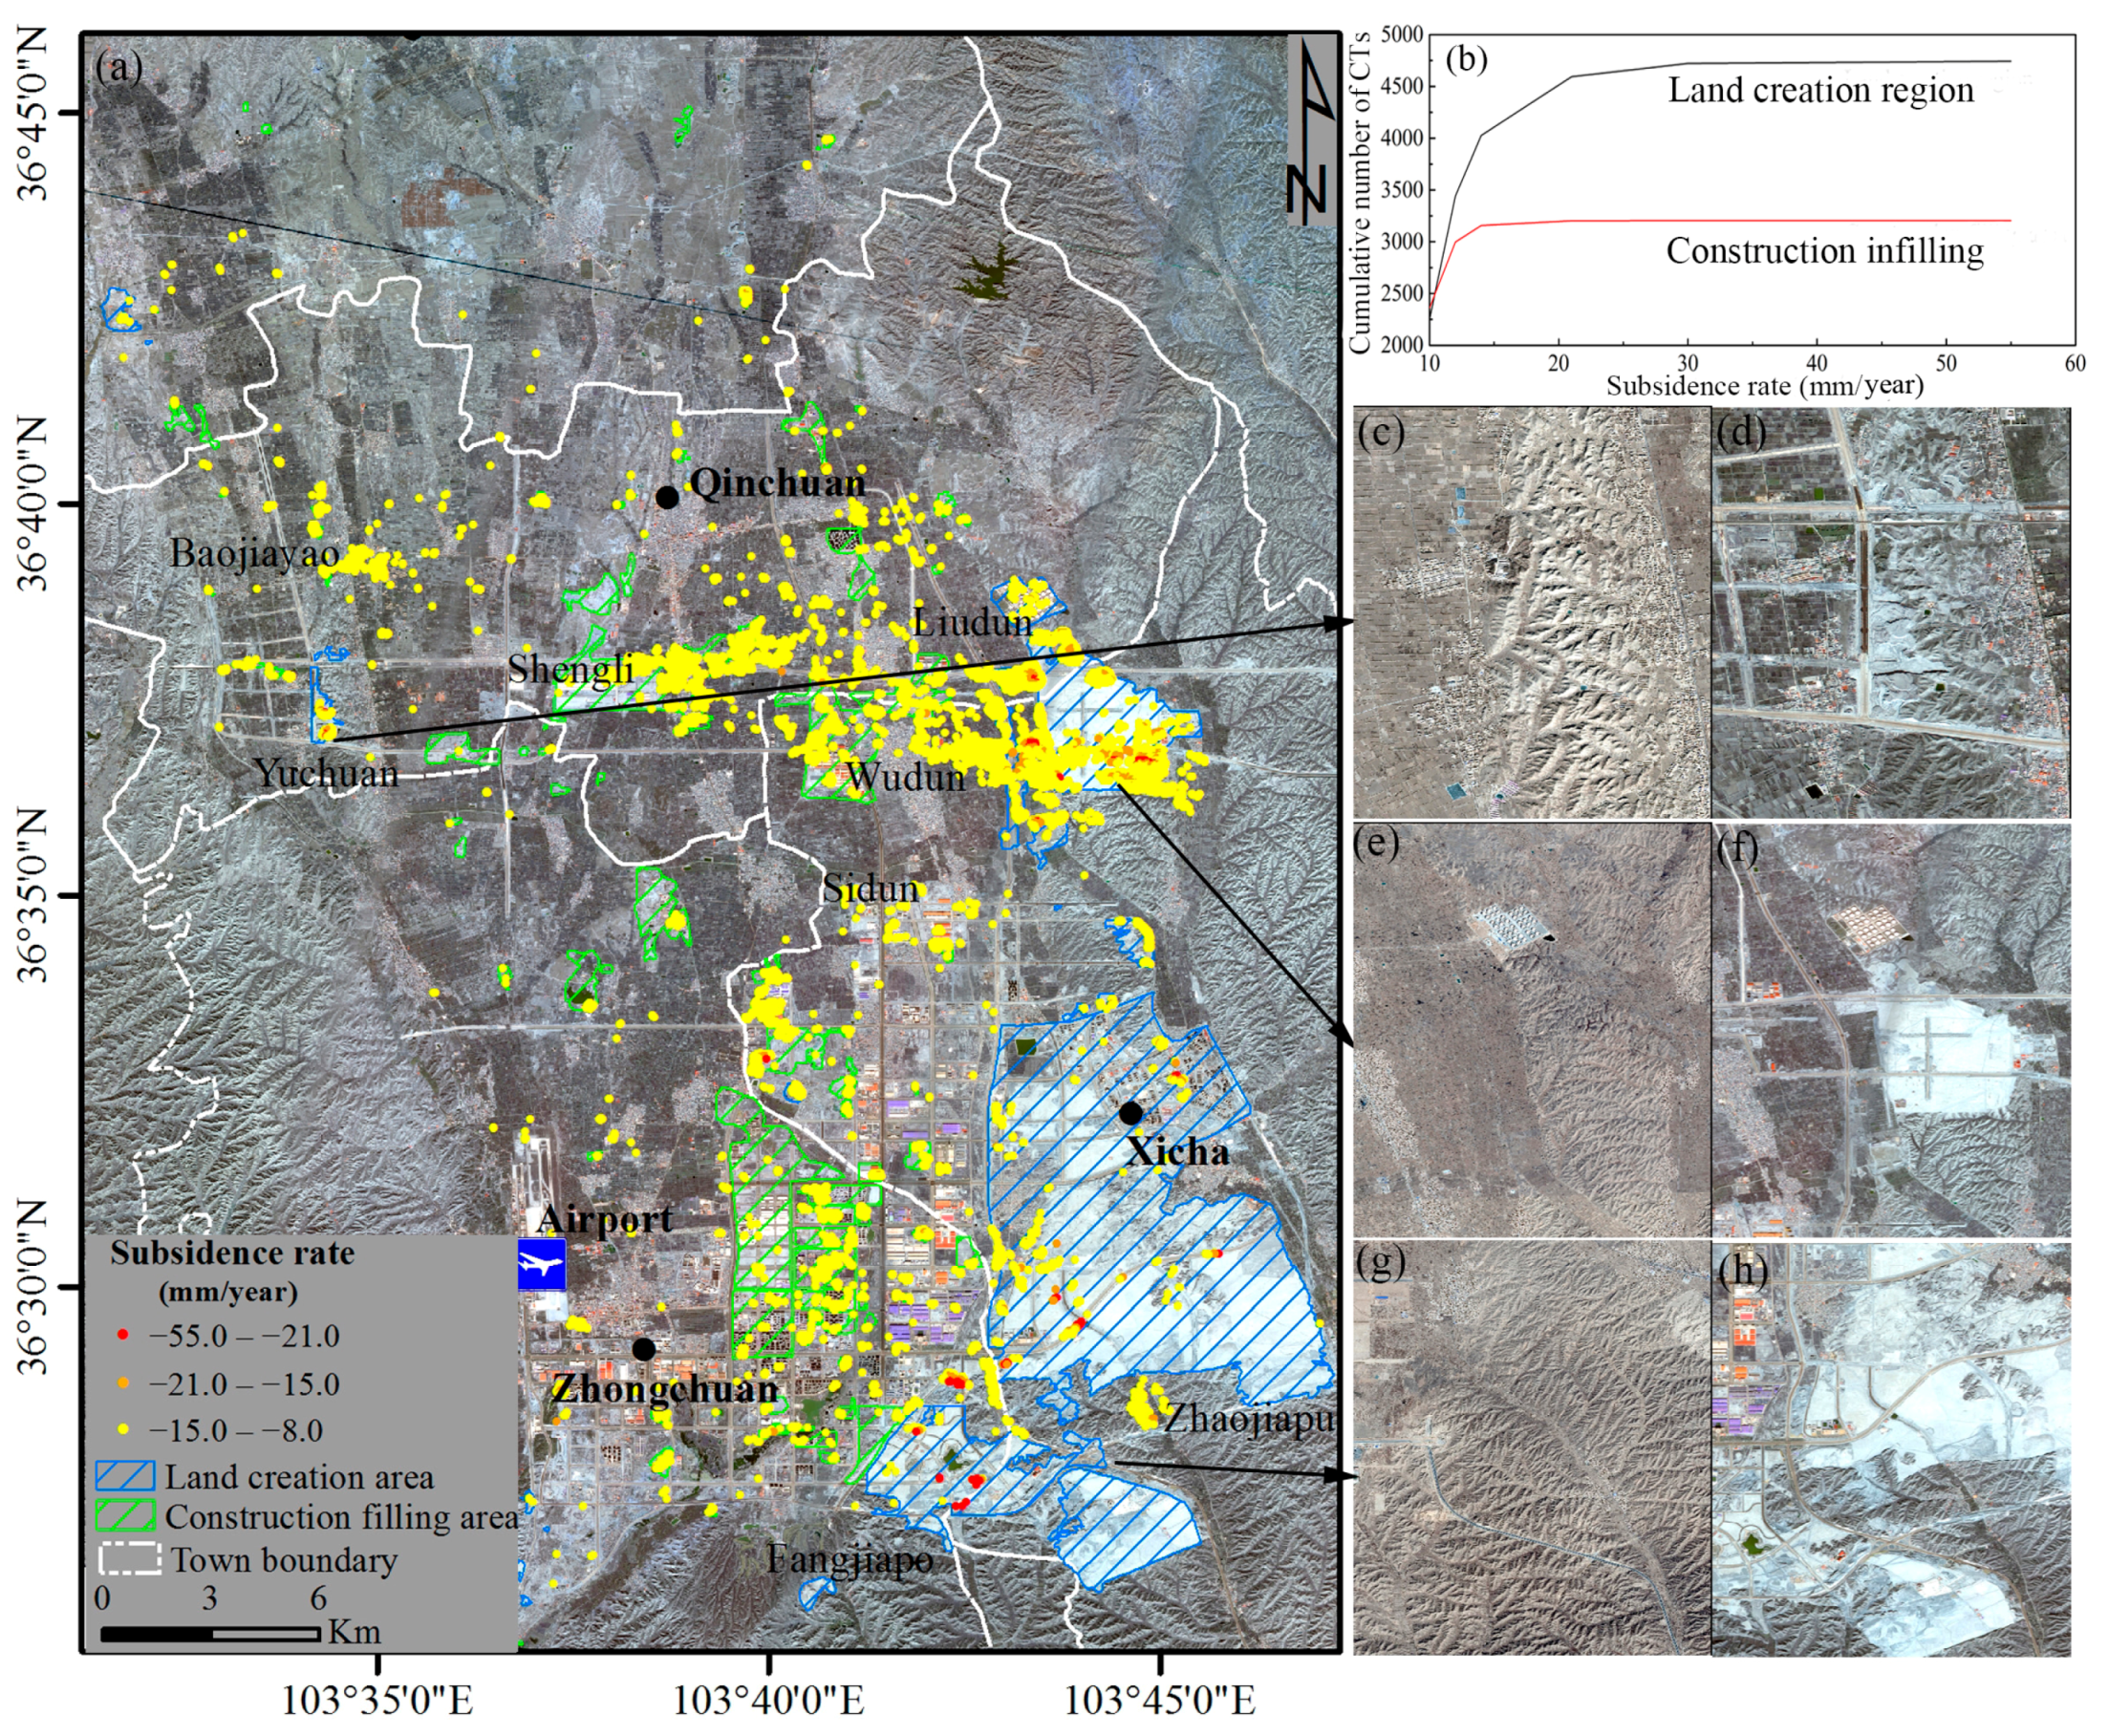
4.1. Spatial Distribution of Land Subsidence
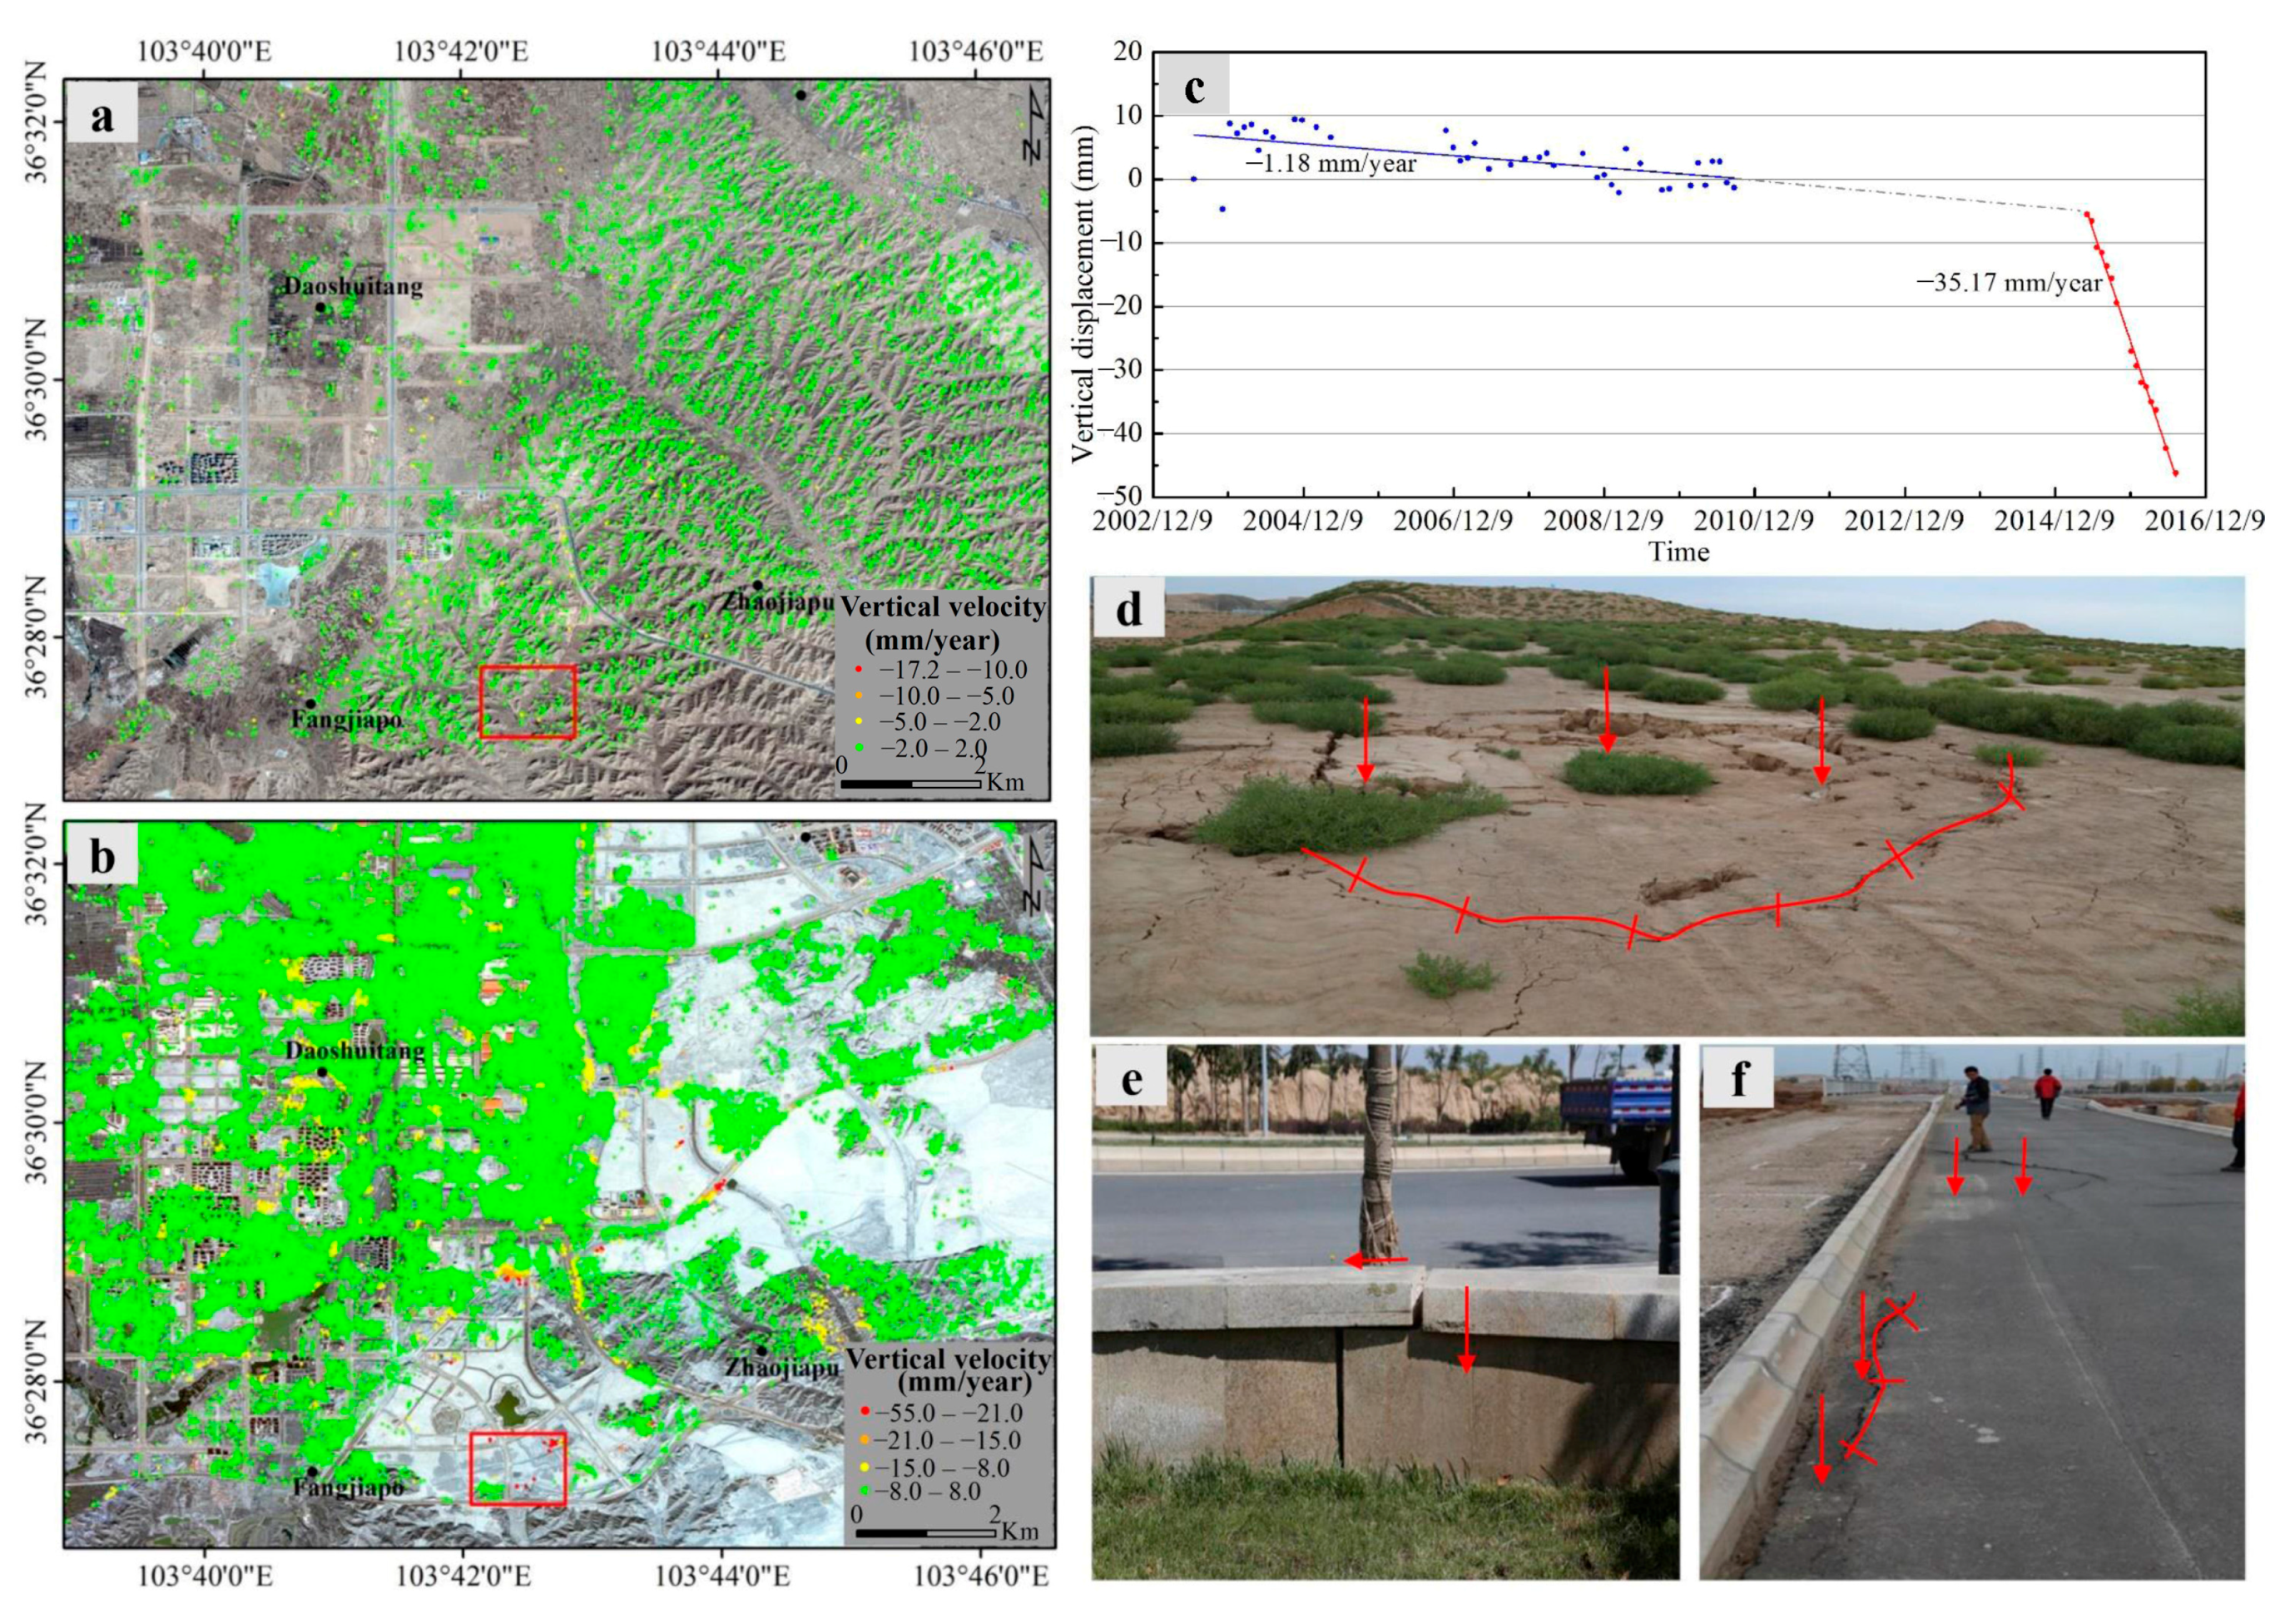
4.1.1. Land Subsidence in Sidun-Fangjiapo District
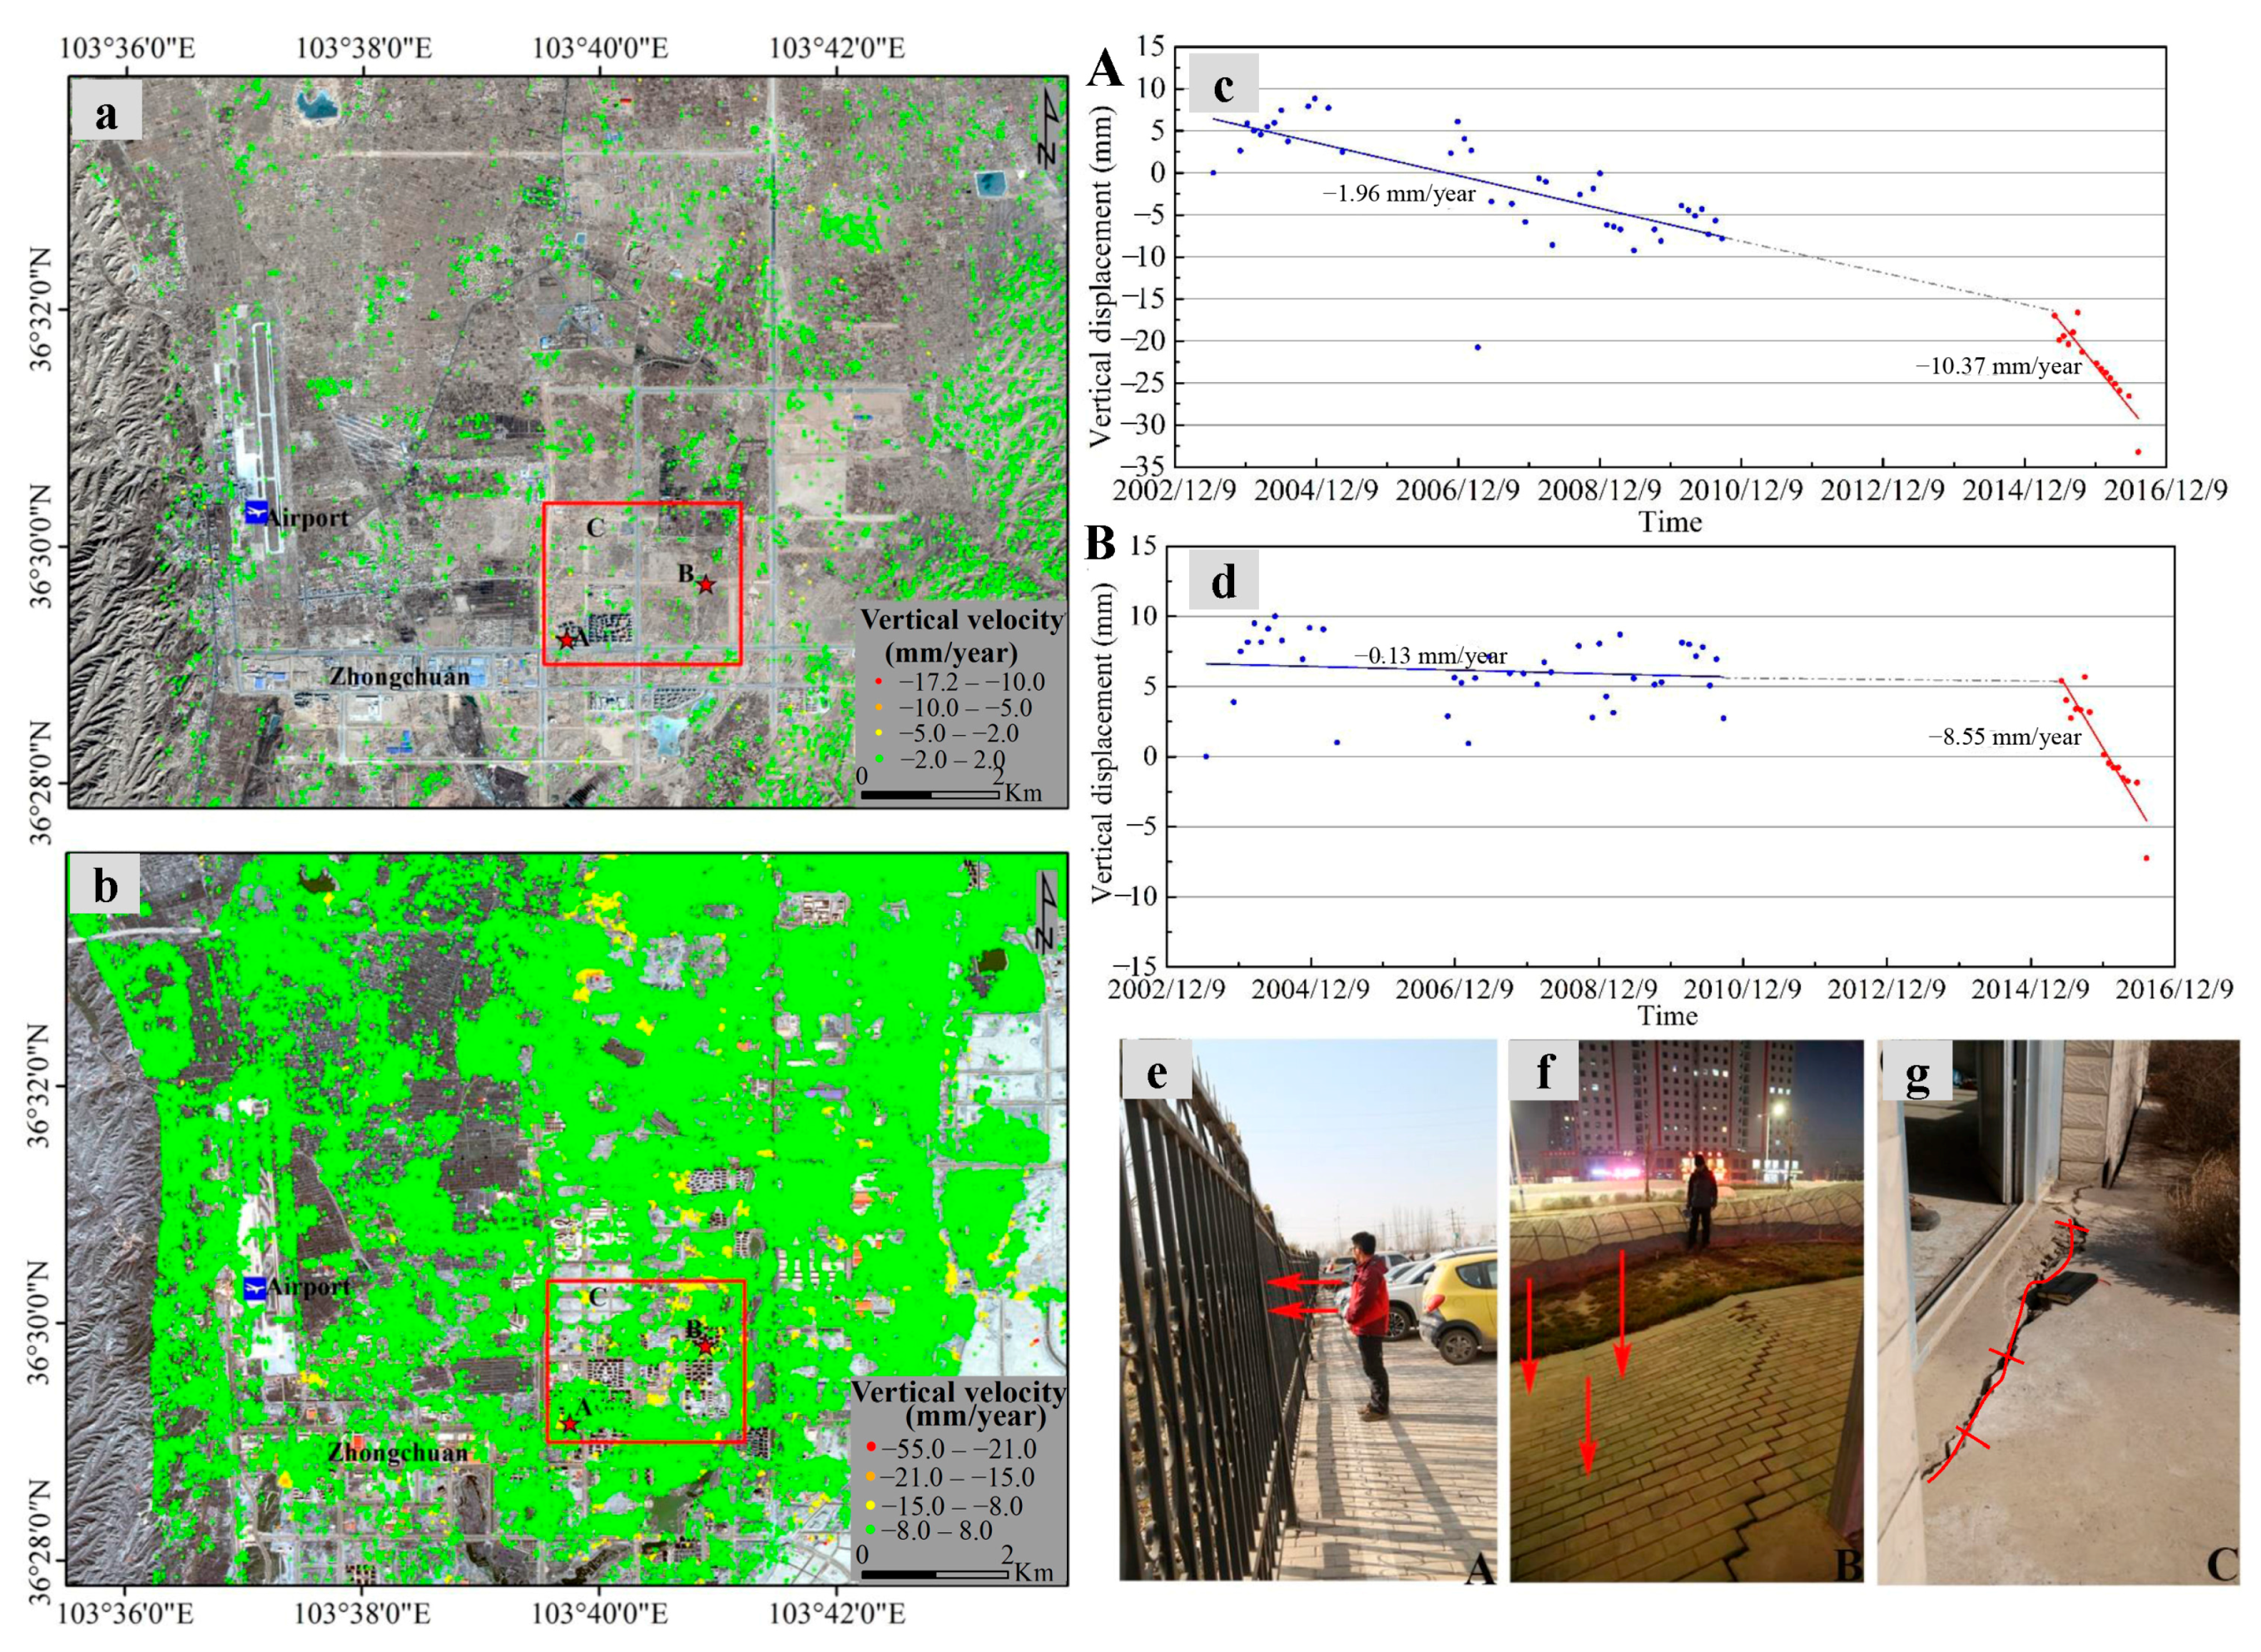
4.1.2. Land Subsidence in Shengli-Liudun District
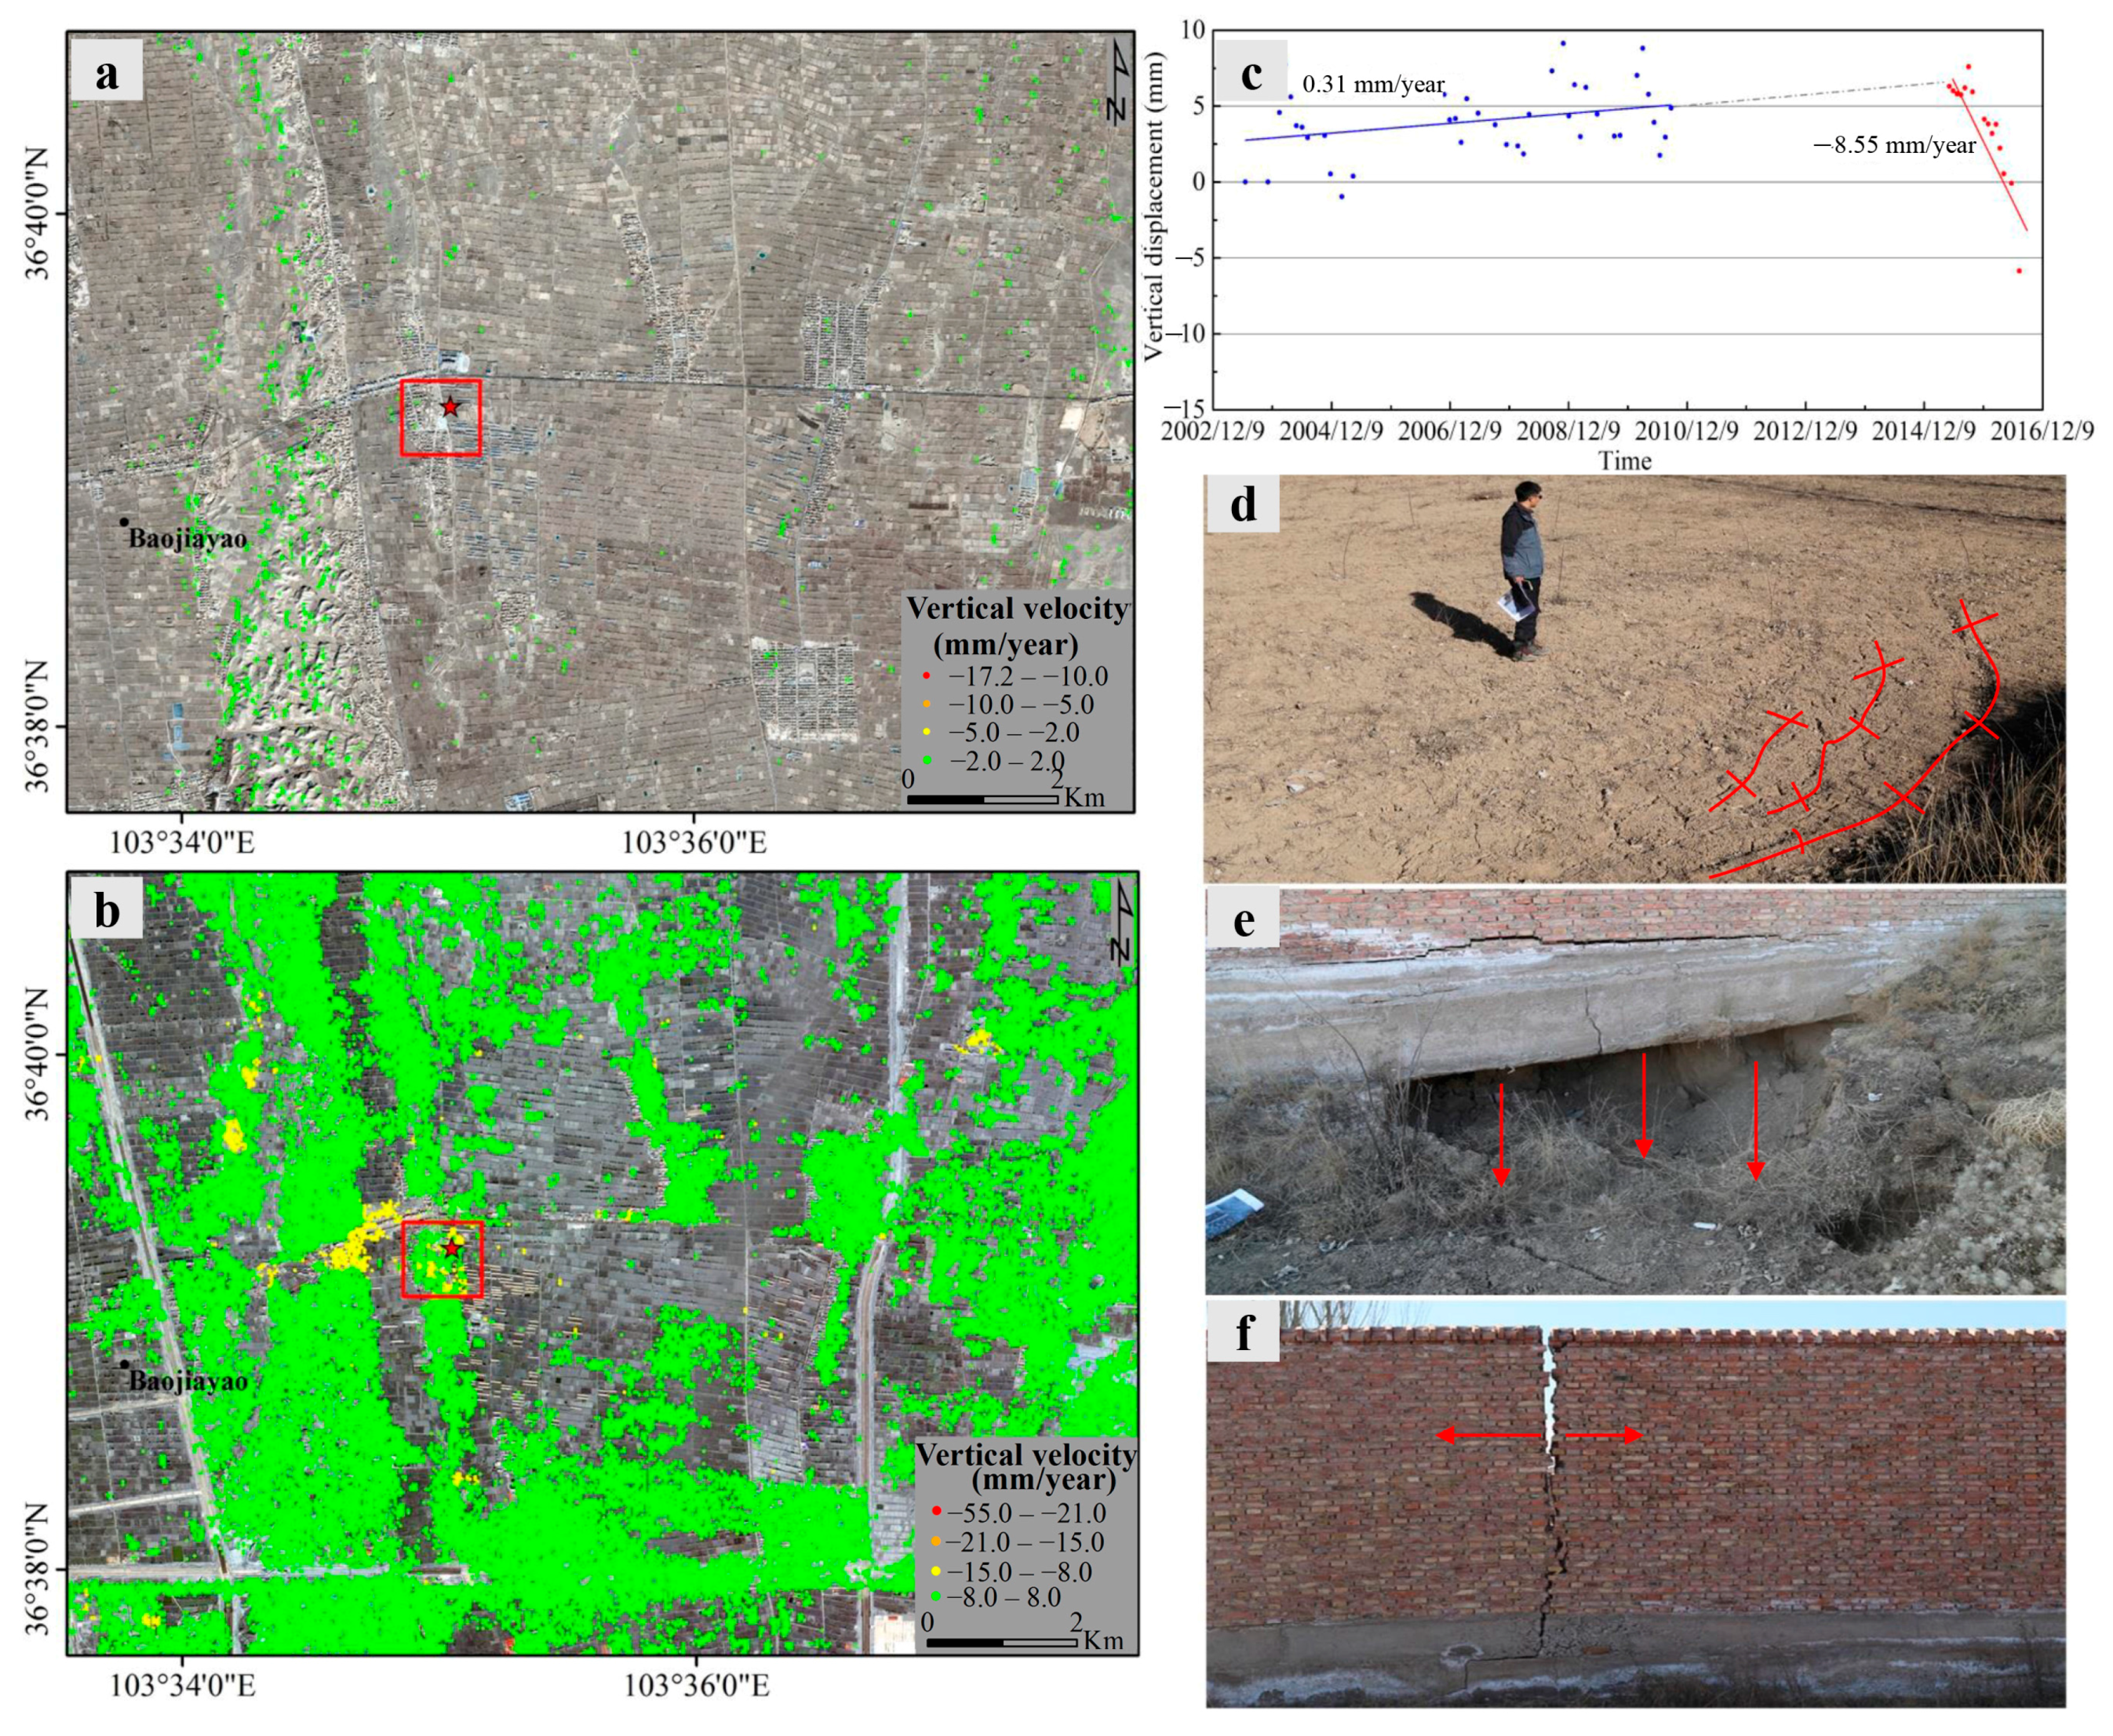
4.1.3. Land Subsidence in Baojiayao-Yuchuan District
4.2. Evolution of Land Subsidence from 2003 to 2016
5. Discussion
5.1. Anthropogenic Drivers of Localized Subsidence
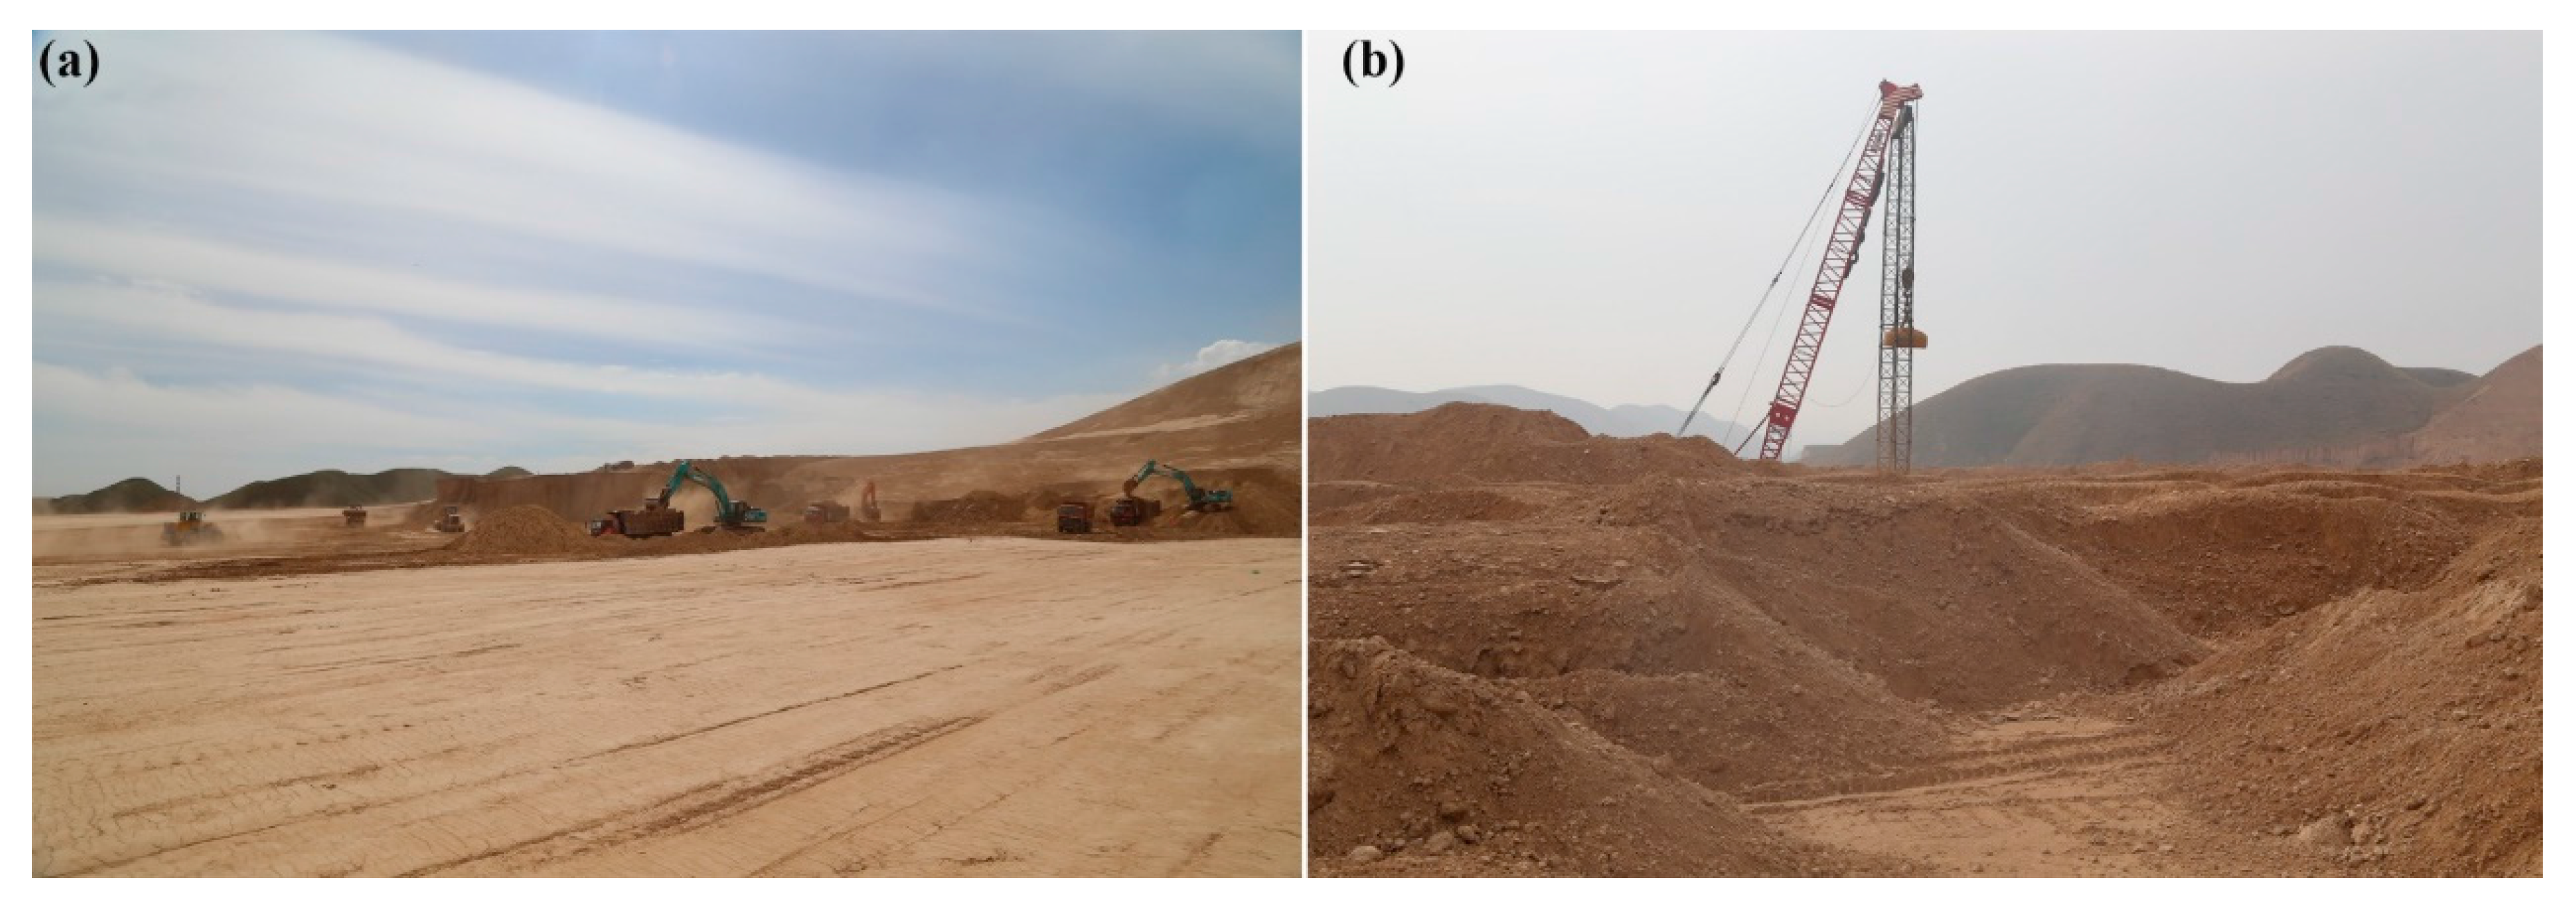
5.1.1. Effect of Large-Scale Land Creation and Construction Infilling
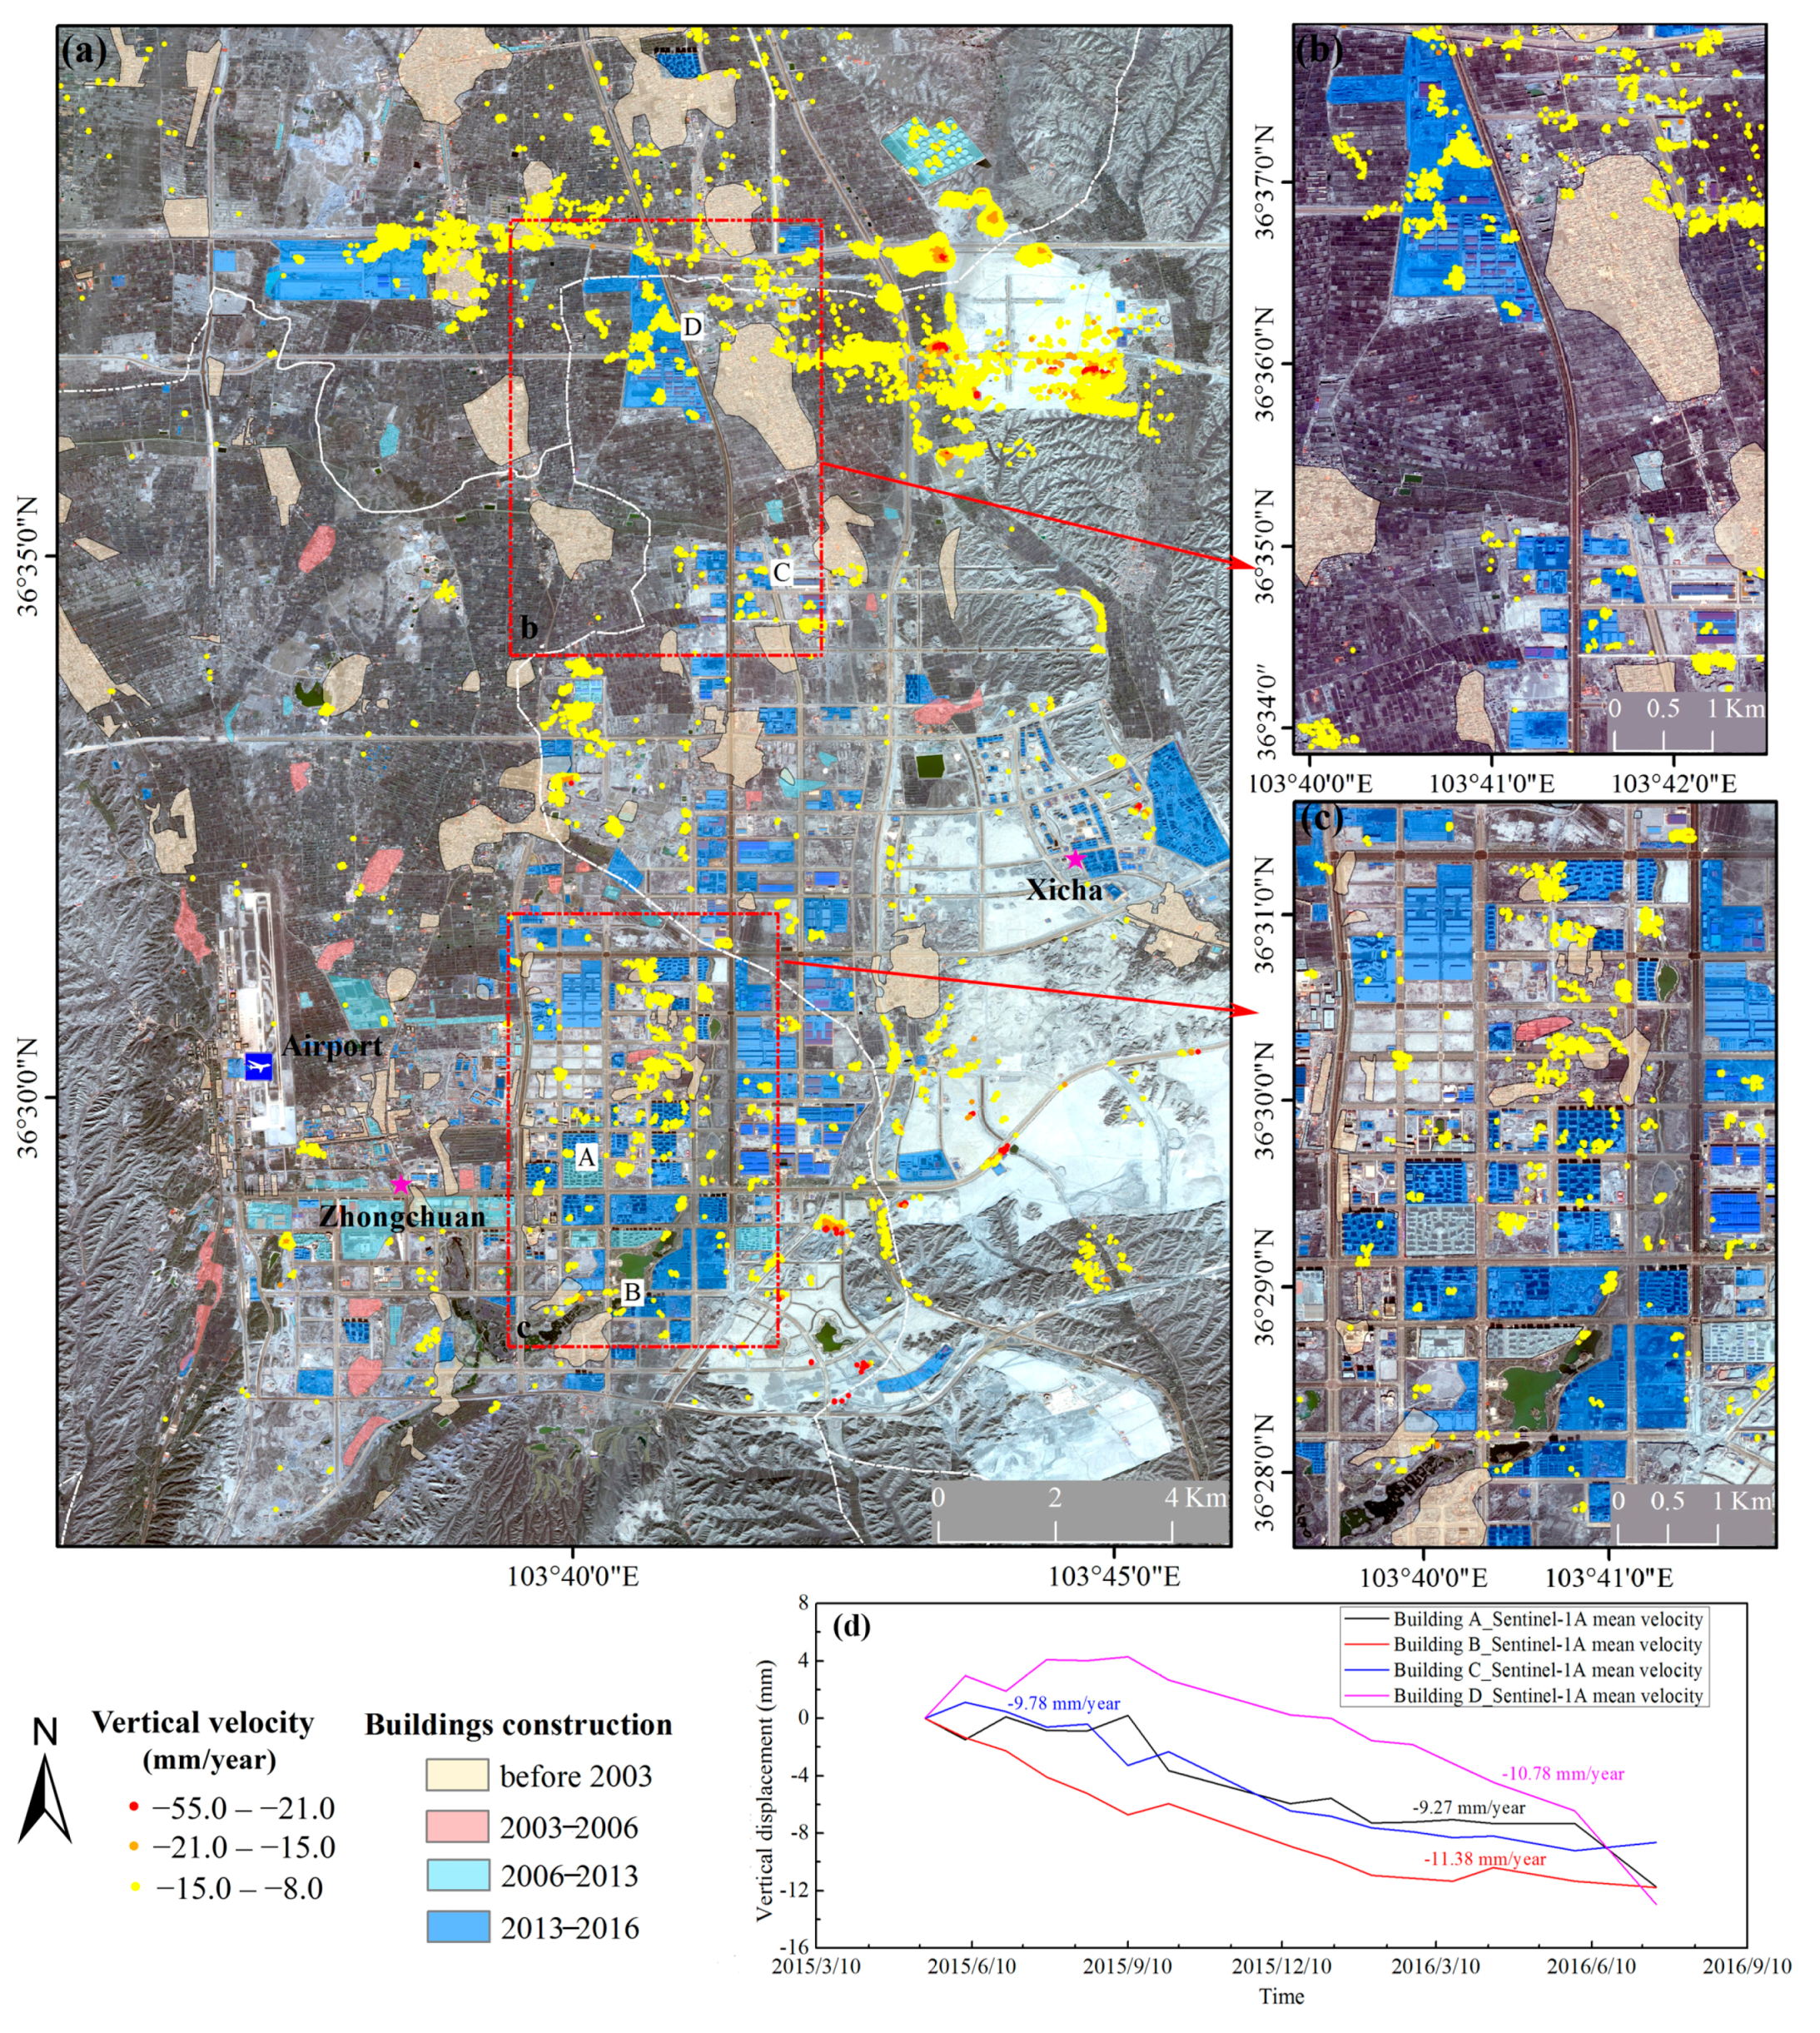
5.1.2. Effects of a Rapid Increase in Building Load
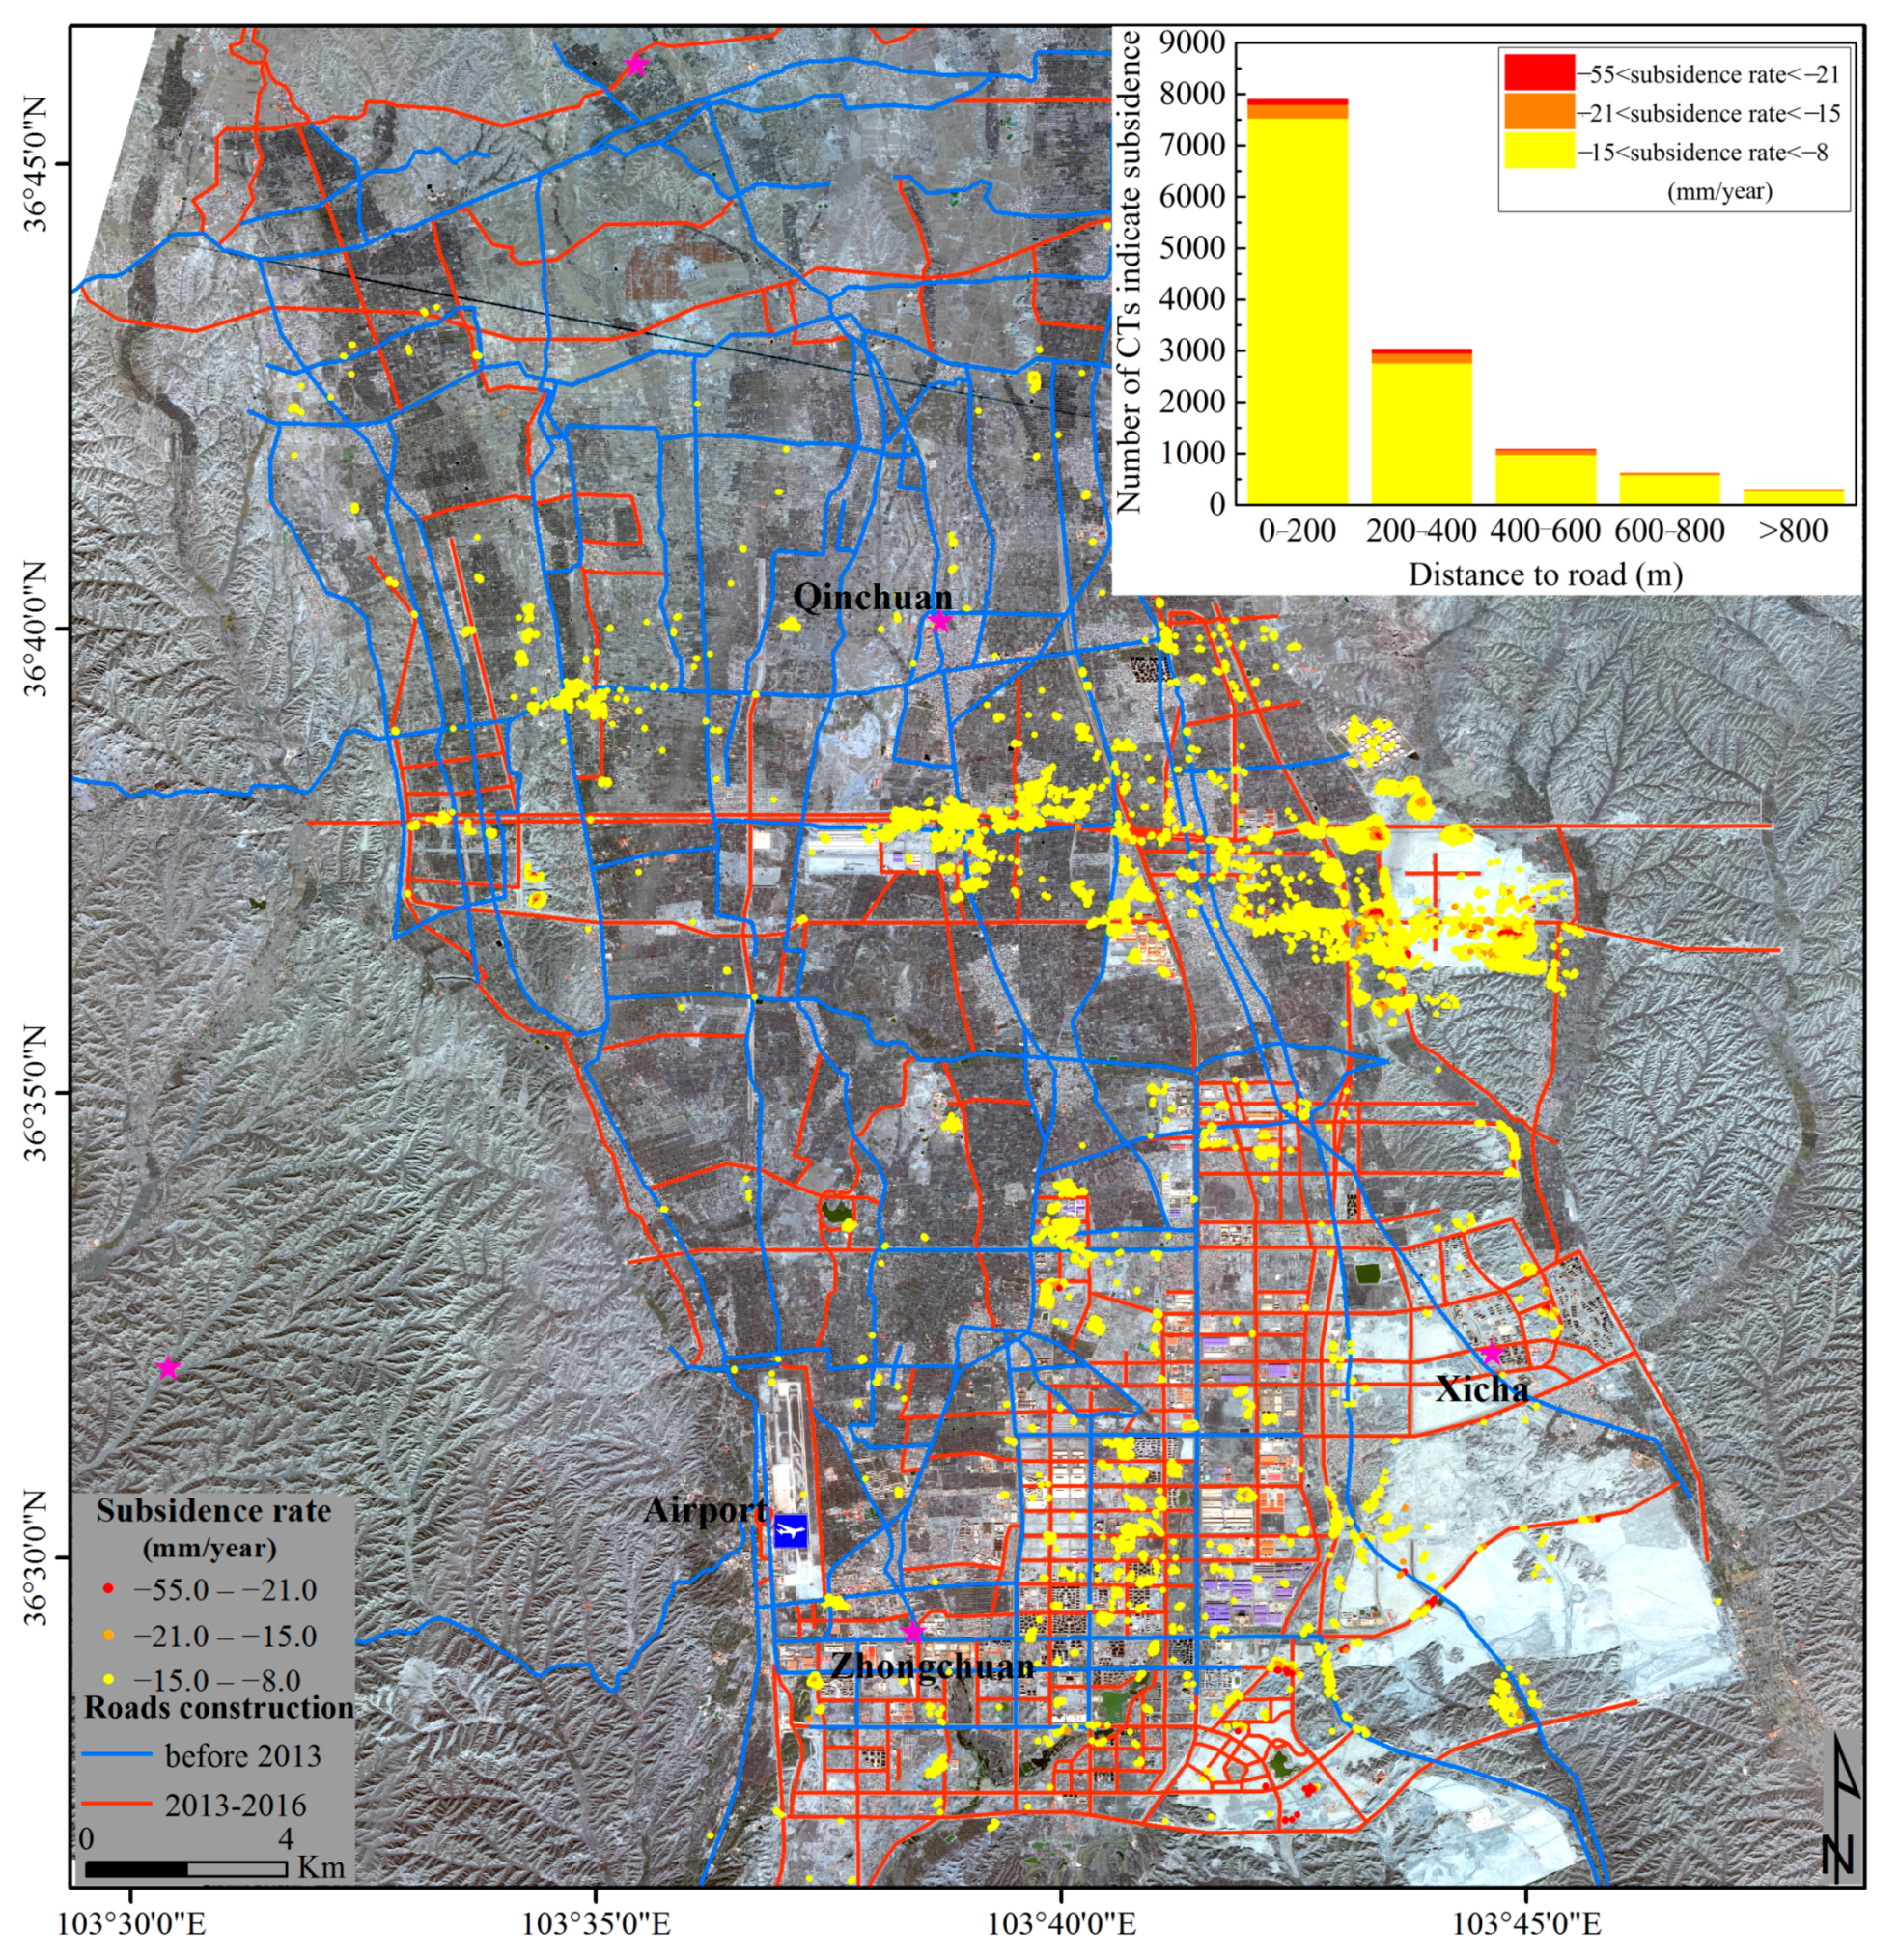
5.1.3. Effects of the Rapid Increase in Road Construction
5.2. Hydrogeological Drivers of Subsidence
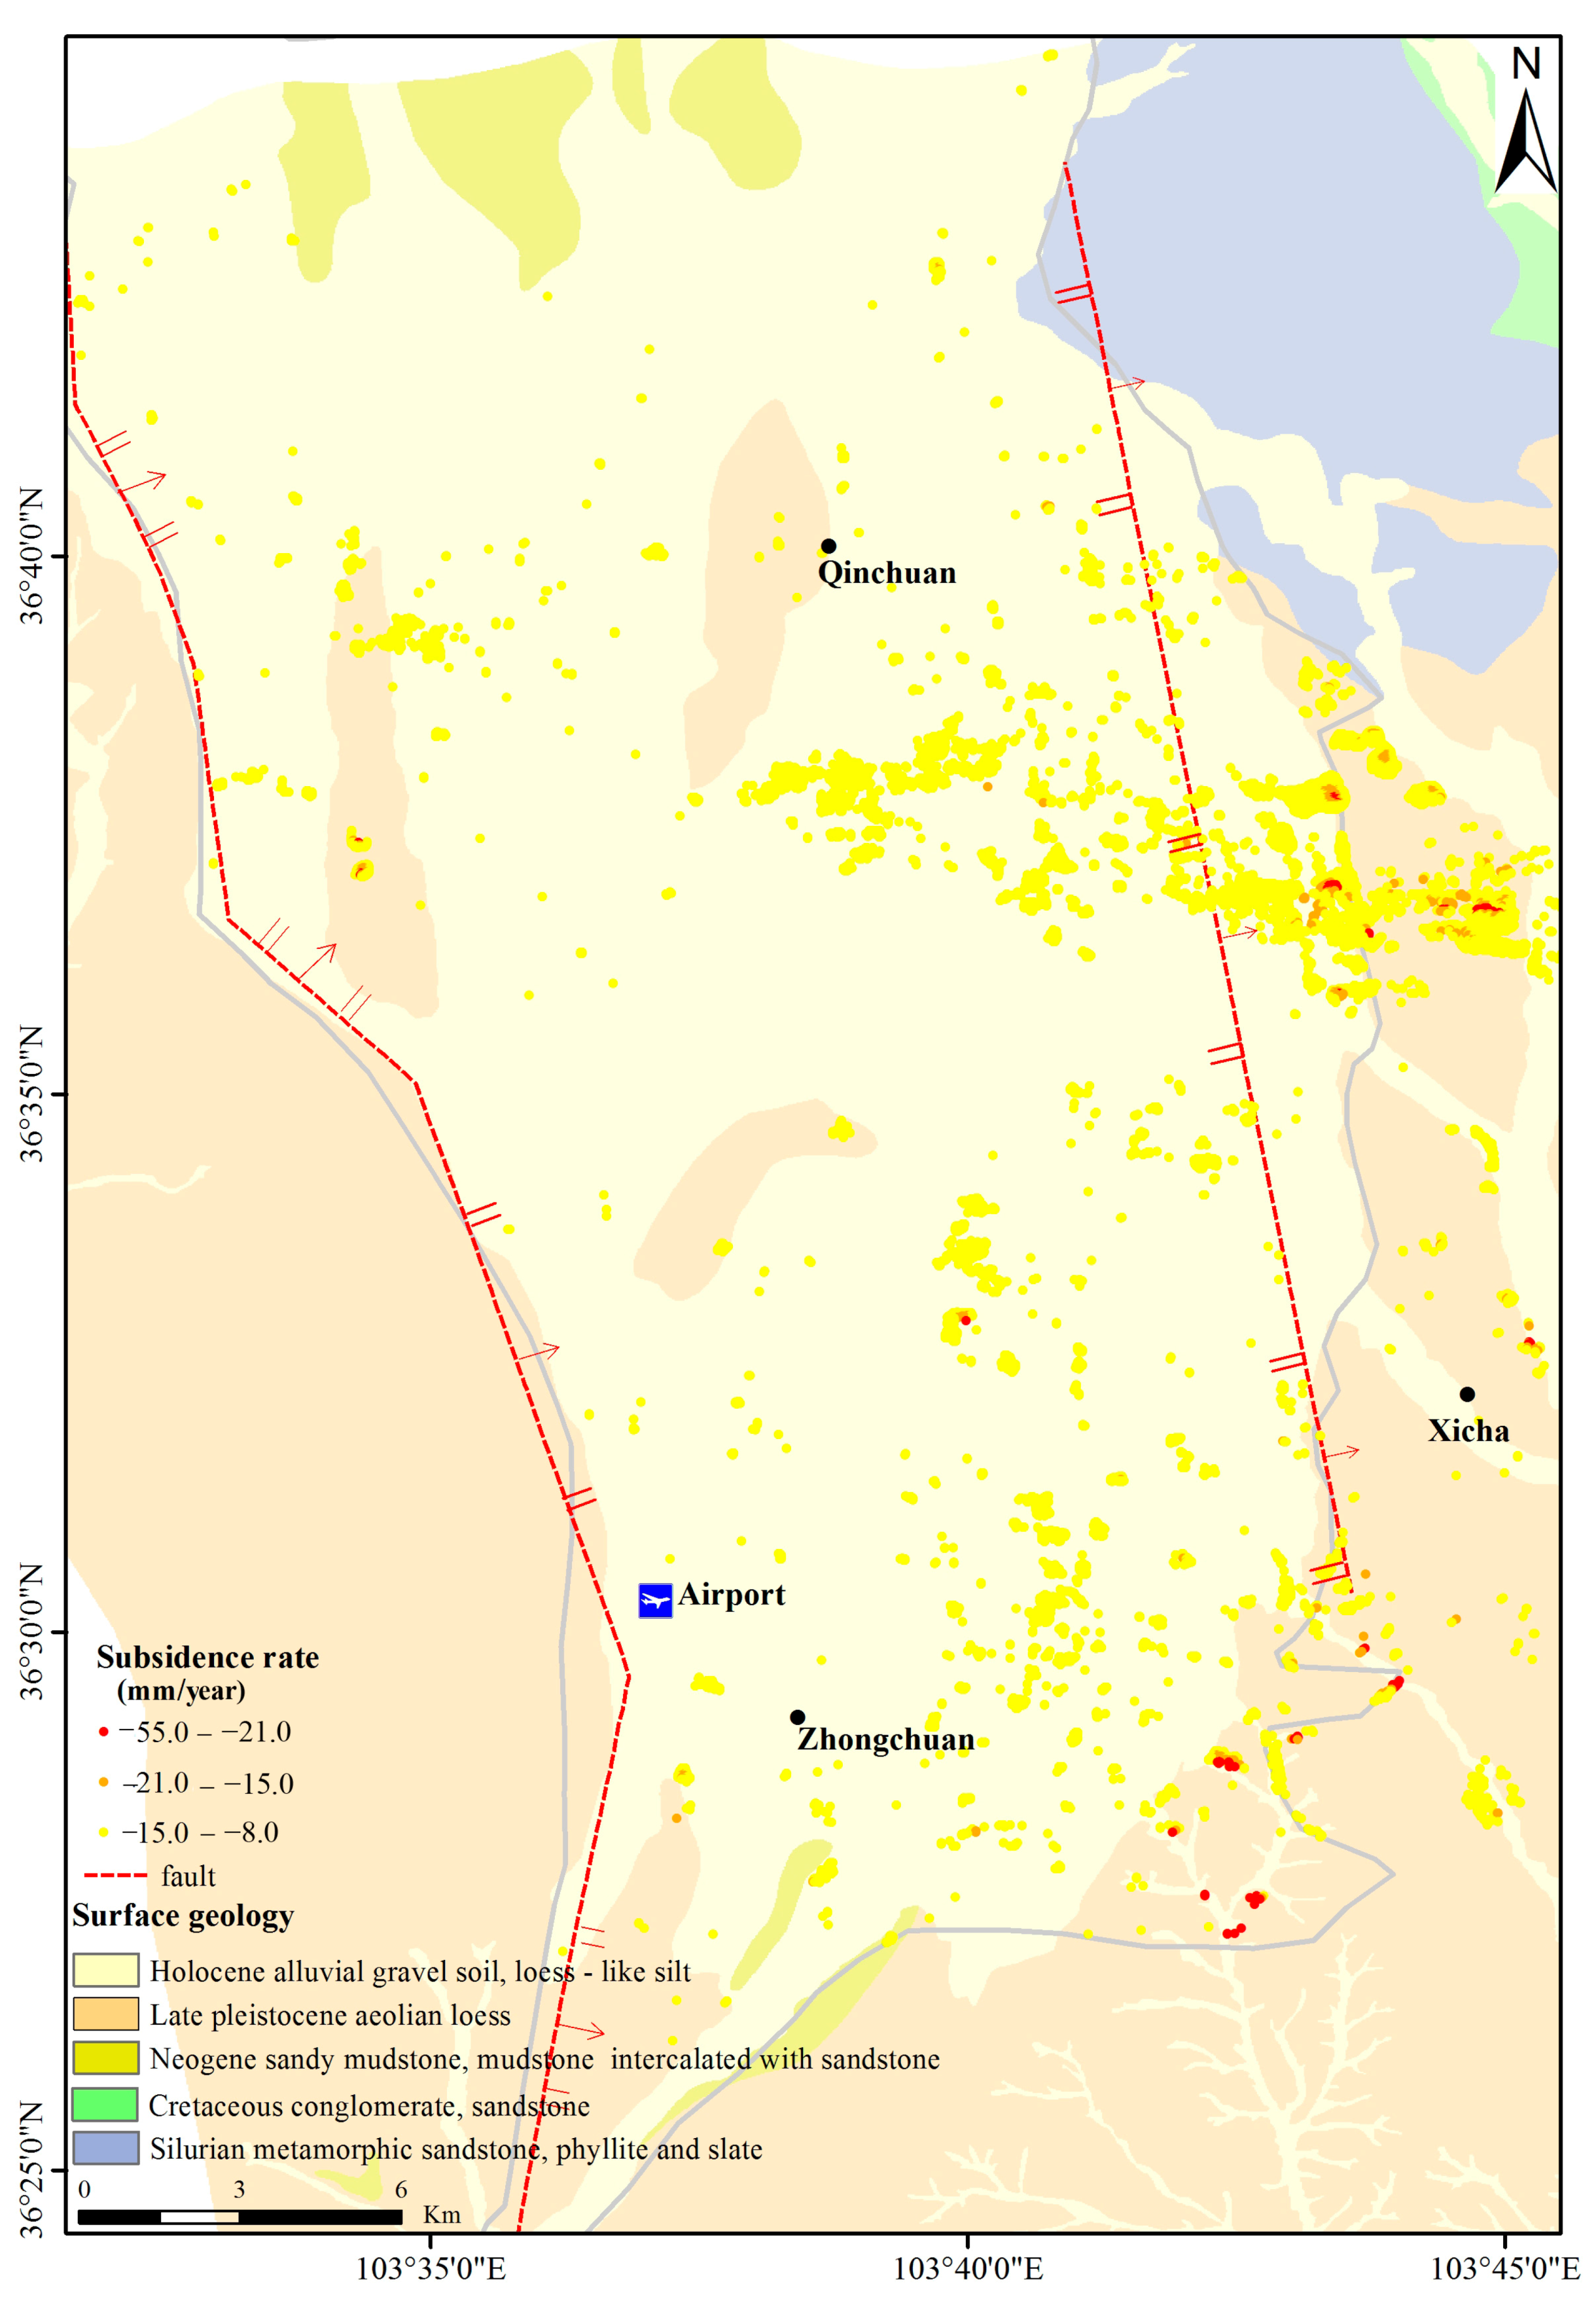
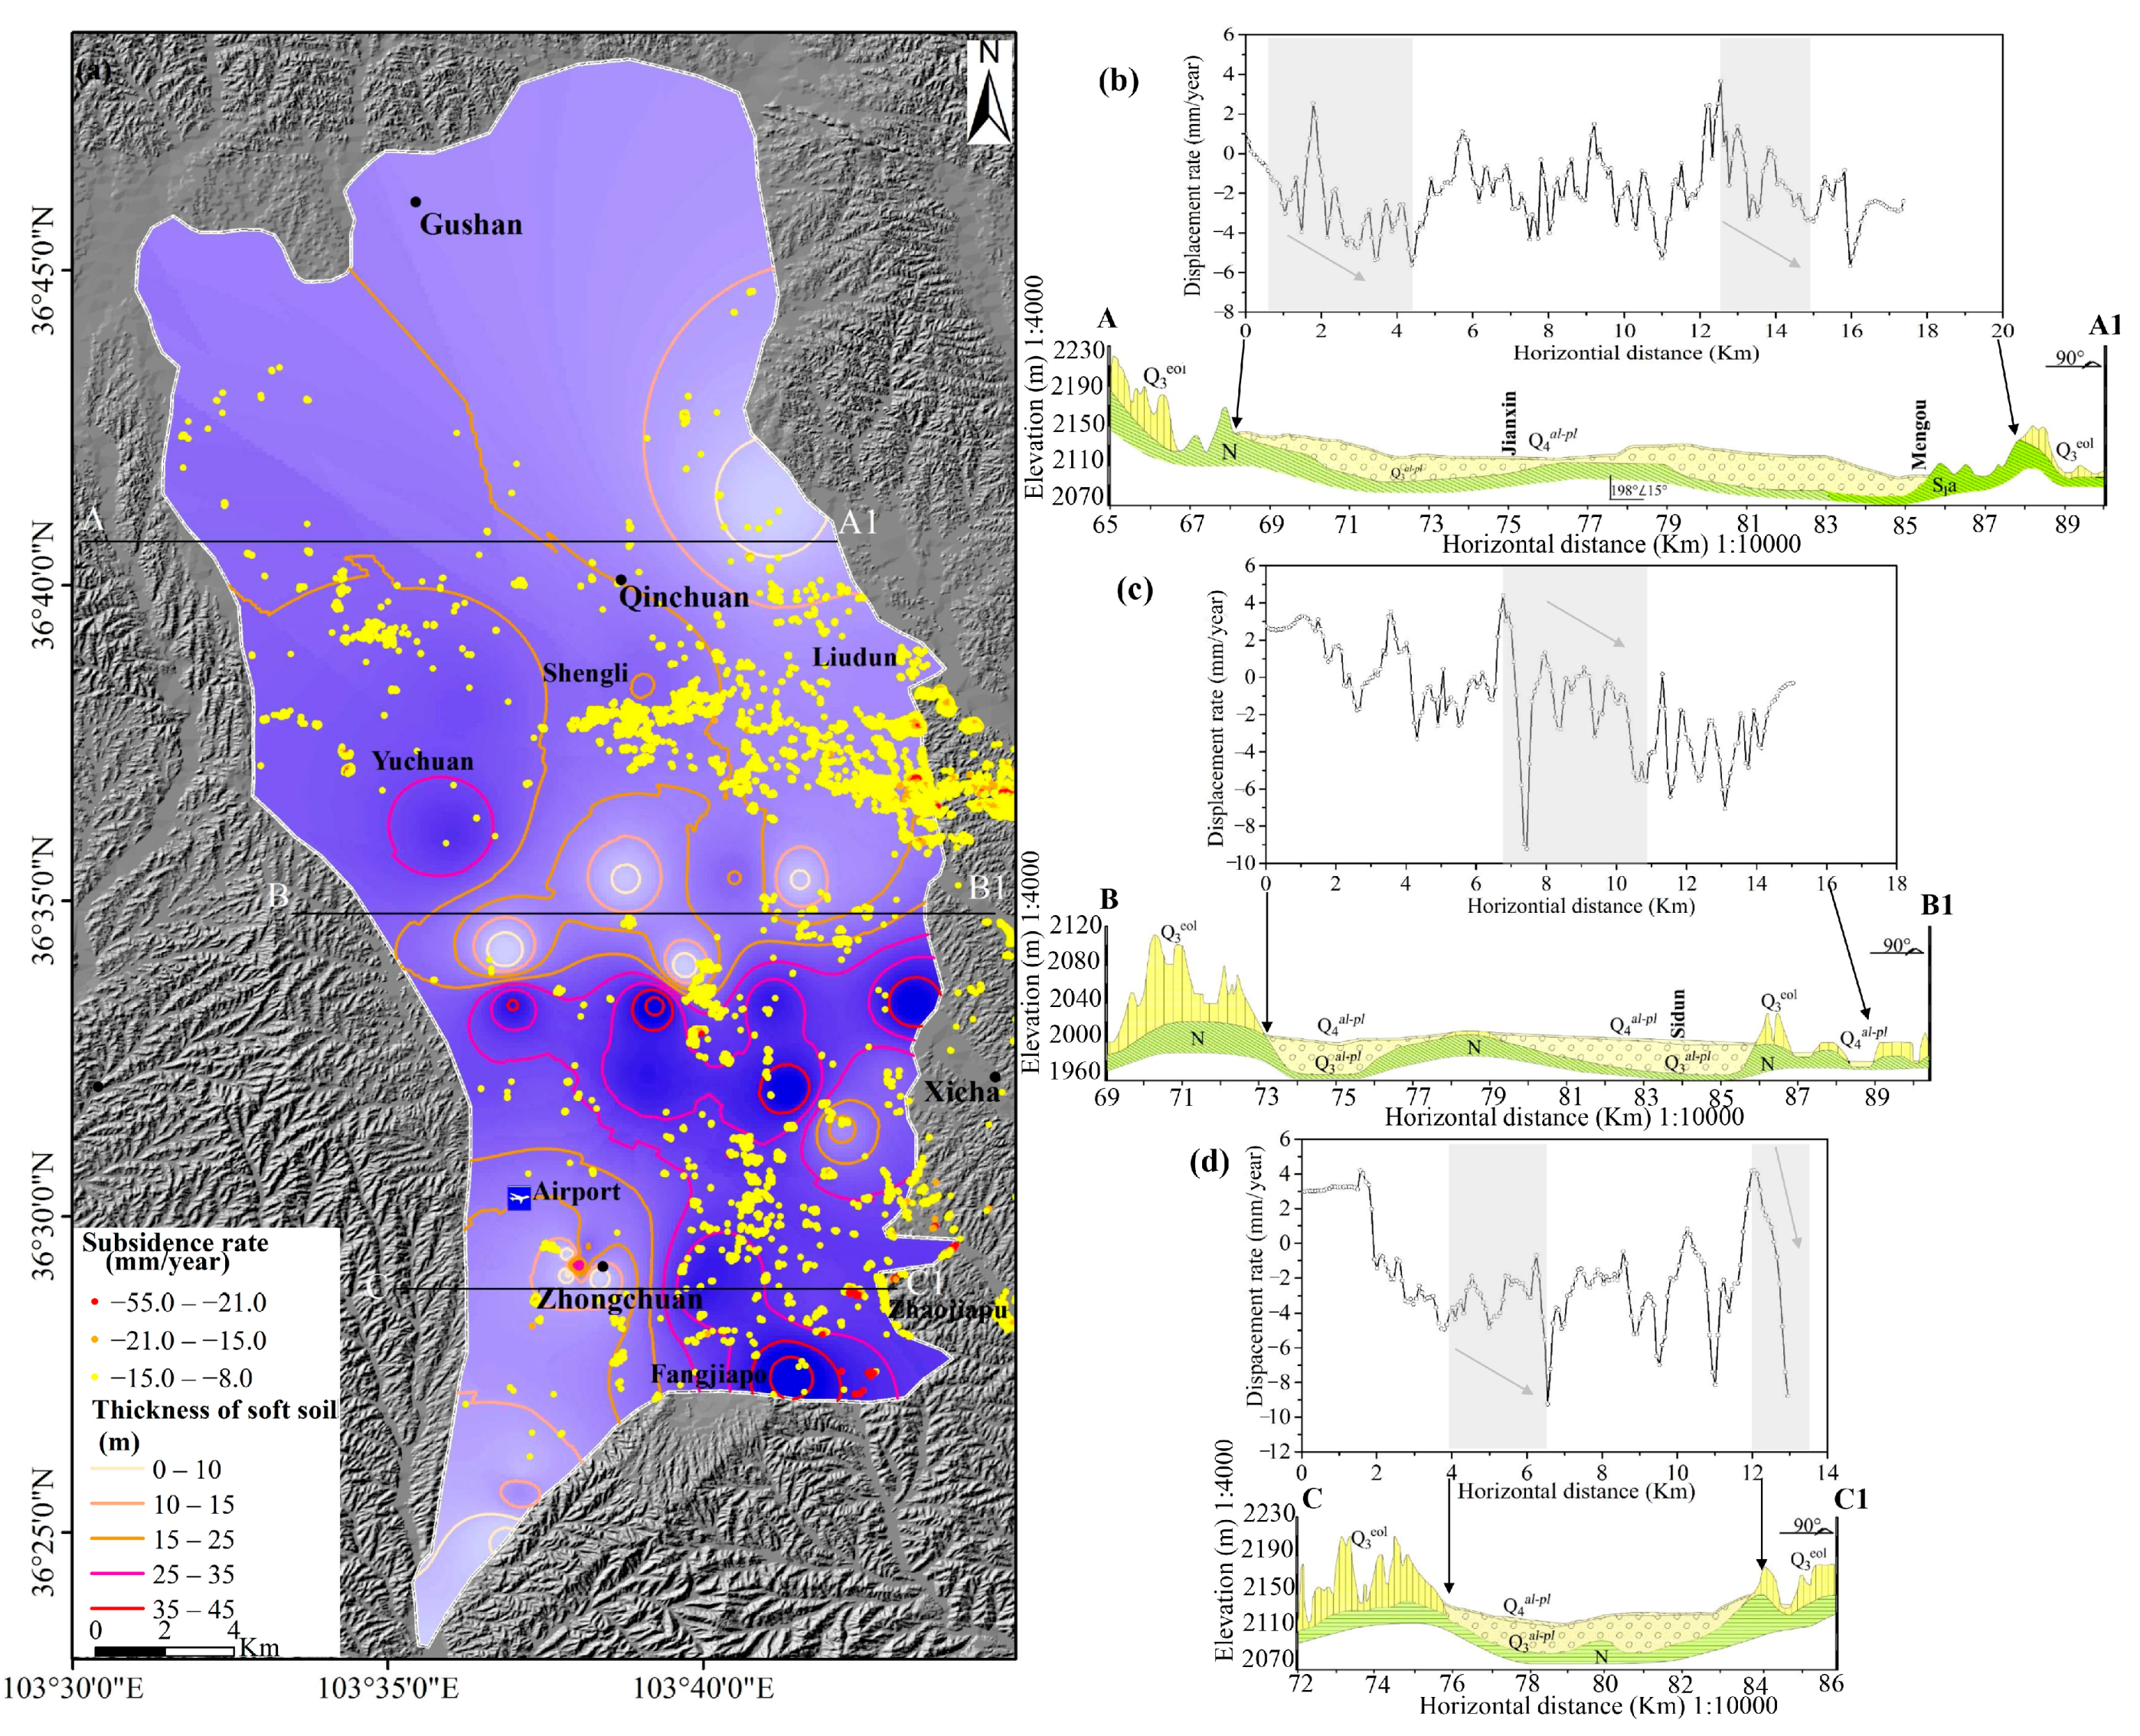
5.2.1. Relationship between Land Subsidence and Geology
5.2.2. Relationship between Land Subsidence and Compressible Deposits
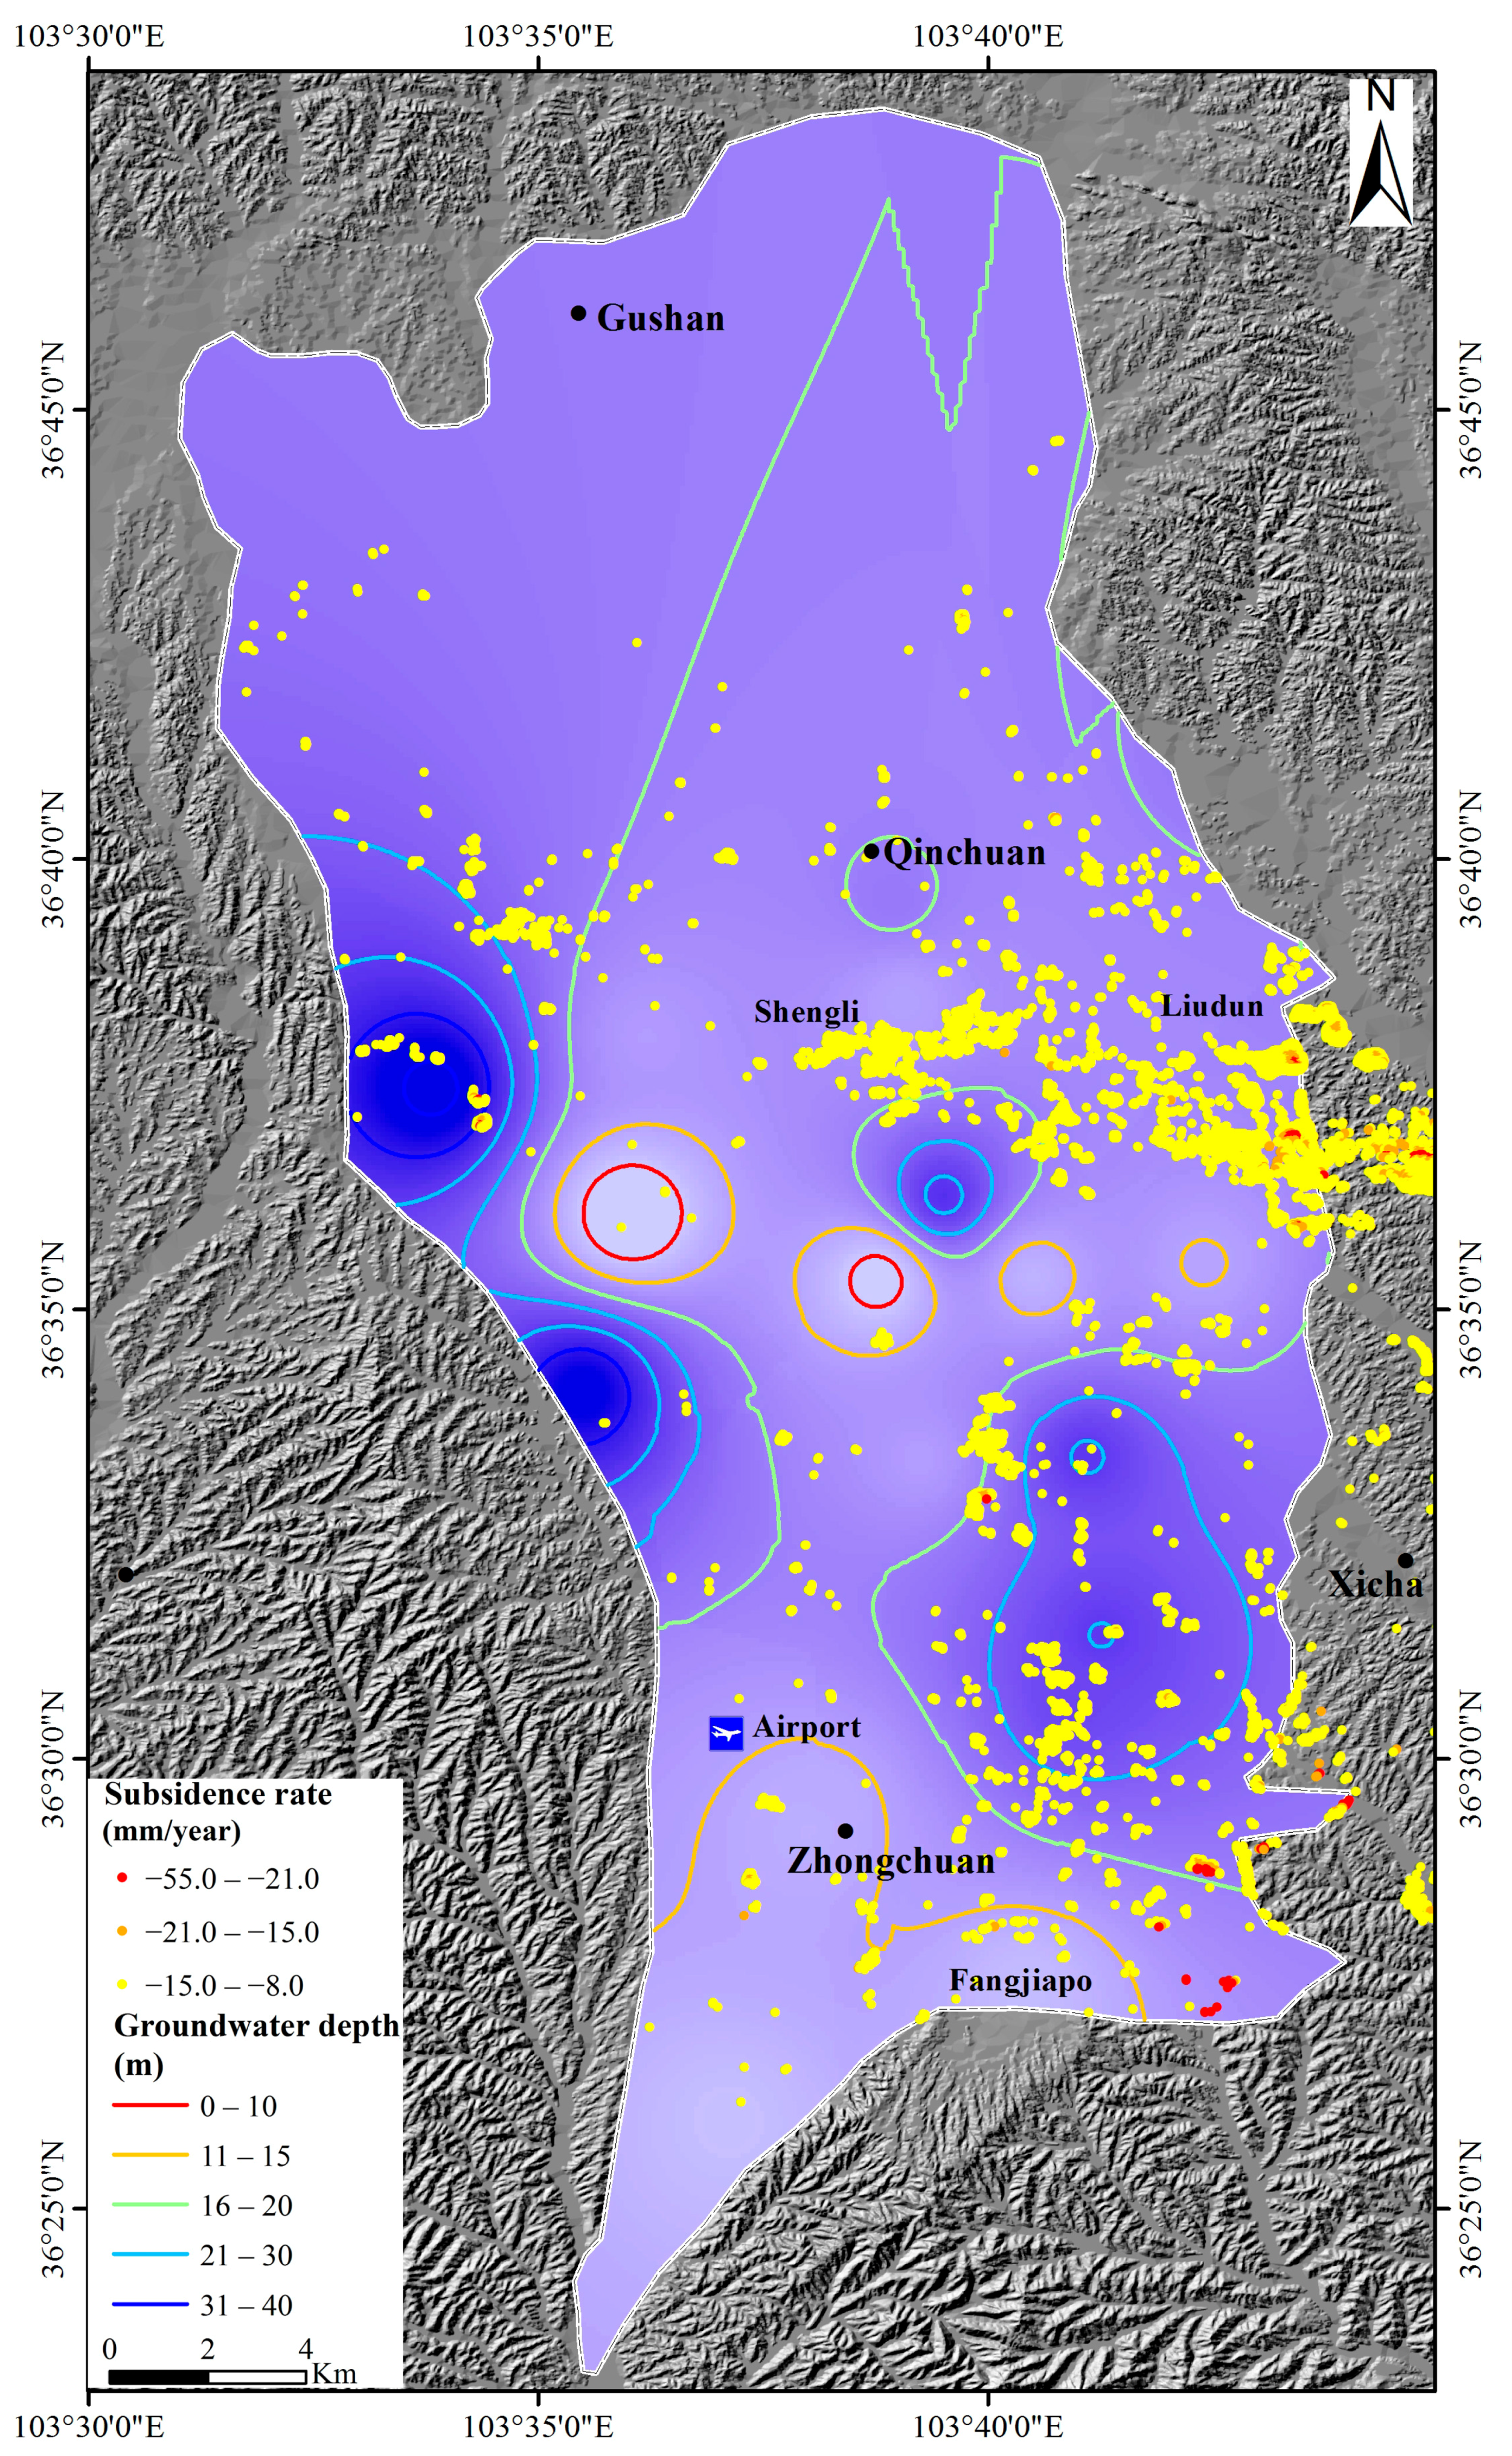
5.2.3. Relationship between Land Subsidence and Groundwater
5.3. Effects of Soil Collapsibility and Compressibility
6. Conclusions
Acknowledgments
Author Contributions
Conflicts of Interest
References
- Bai, X.; Shi, P.; Liu, Y. Realizing China’s Urban dream. Nature 2014, 509, 158–160. [Google Scholar] [CrossRef] [PubMed]
- Chen, F.; Lin, H.; Zhang, Y.; Lu, Z. Ground subsidence geo-hazards induced by rapid urbanization: Implications from InSAR observation and geological analysis. Nat. Hazards Earth Syst. Sci. 2012, 12, 935–942. [Google Scholar] [CrossRef] [Green Version]
- Kenneth, P. Loess. Prog. Phys. Geogr. 1984, 8, 176–217. [Google Scholar]
- Li, P.; Qian, H.; Wu, J. Environment: Accelerate research on land creation. Nature 2014, 510, 29–31. [Google Scholar] [CrossRef] [PubMed]
- Liu, Y.; Li, Y. Environment: China’s land creation project stands firm. Nature 2014, 511, 410. [Google Scholar] [CrossRef] [PubMed]
- Conway, B.D. Land subsidence and earth fissures in south-central and southern Arizona, USA. Hydrol. J. 2016, 24, 649–655. [Google Scholar] [CrossRef]
- Ferretti, A.; Prati, C.; Rocca, F. Permanent scatterers in SAR interferometry. IEEE Trans. Geosci. Remote Sens. 2001, 39, 8–20. [Google Scholar] [CrossRef]
- Solari, L.; Ciampalini, A.; Raspini, F.; Bianchini, S.; Moretti, S. PSInSAR Analysis in the Pisa Urban Area (Italy): A Case Study of Subsidence Related to Stratigraphical Factors and Urbanization. Remote Sens. 2016, 8, 120. [Google Scholar] [CrossRef]
- Cigna, F.; Osmanoğlu, B.; Cabral-Cano, E.; Dixon, T.H.; Ávila-Olivera, J.A.; Garduño-Monroy, V.H.; DeMets, C.; Wdowinski, S. Monitoring land subsidence and its induced geological hazard with Synthetic Aperture Radar Interferometry: A case study in Morelia, Mexico. Remote Sens. Environ. 2012, 117, 146–161. [Google Scholar] [CrossRef]
- Chaussard, E.; Wdowinski, S.; Cabral-Cano, E.; Amelung, F. Land subsidence in central Mexico detected by ALOS InSAR time-series. Remote Sens. Environ. 2014, 140, 94–106. [Google Scholar] [CrossRef]
- Chen, B.; Gong, H.; Li, X.; Lei, K.; Ke, Y.; Duan, G.; Zhou, C. Spatial correlation between land subsidence and urbanization in Beijing, China. Nat. Hazards 2015, 75, 2637–2652. [Google Scholar] [CrossRef]
- Bozzano, F.; Esposito, C.; Franchi, S.; Mazzanti, P.; Perissin, D.; Rocca, A.; Romano, E. Understanding the subsidence process of a quaternary plain by combining geological and hydrogeological modelling with satellite InSAR data: The Acque Albule Plain case study. Remote Sens. Environ. 2015, 168, 219–238. [Google Scholar] [CrossRef]
- Zhang, Y.; Meng, X.; Chen, G.; Qiao, L.; Zeng, R.; Chang, J. Detection of geohazards in the Bailong River Basin using synthetic aperture radar interferometry. Landslides 2015, 1–12. [Google Scholar] [CrossRef]
- Chen, B.; Gong, H.; Li, X.; Lei, K.; Zhu, L.; Gao, M.; Zhou, C. Characterization and causes of land subsidence in Beijing, China. Int. J. Remote Sens. 2017, 38, 808–826. [Google Scholar] [CrossRef]
- Pratesi, F.; Tapete, D.; Del Ventisette, C.; Moretti, S. Mapping interactions between geology, subsurface resource exploitation and urban development in transforming cities using InSAR Persistent Scatterers: Two decades of change in Florence, Italy. Appl. Geogr. 2016, 77, 20–37. [Google Scholar] [CrossRef]
- Mateos, R.M.; Ezquerro, P.; Luque-Espinar, J.A.; Béjar-Pizarro, M.; Notti, D.; Azañón, J.M.; Montserrat, O.; Herrera, G.; Fernández-Chacón, F.; Peinado, T.; et al. Multiband PSInSAR and long-period monitoring of land subsidence in a strategic detrital aquifer (Vega de Granada, SE Spain): An approach to support management decisions. J. Hydrol. 2017, 553, 71–87. [Google Scholar] [CrossRef]
- Zhou, C.; Gong, H.; Chen, B.; Li, J.; Gao, M.; Zhu, F.; Chen, W.; Liang, Y. InSAR Time-Series Analysis of Land Subsidence under Different Land Use Types in the Eastern Beijing Plain, China. Remote Sens. 2017, 9, 380. [Google Scholar] [CrossRef]
- Berardino, P.; Fornaro, G.; Lanari, R.; Sansosti, E. A new algorithm for surface deformation monitoring based on small baseline differential SAR interferograms. IEEE Trans. Geosci. Remote Sens. 2002, 40, 2375–2383. [Google Scholar] [CrossRef]
- Hooper, A. A multi-temporal InSAR method incorporating both persistent scatterer and small baseline approaches. Geophys. Res. Lett. 2008, 35, 96–106. [Google Scholar] [CrossRef]
- Ferretti, A.; Fumagalli, A.; Novali, F.; Prati, C.; Rocca, F.; Rucci, A. A New Algorithm for Processing Interferometric Data-Stacks: SqueeSAR. IEEE Trans. Geosci. Remote Sens. 2011, 49, 3460–3470. [Google Scholar] [CrossRef]
- Yan, Y.; Doin, M.P.; Lopez-Quiroz, P.; Tupin, F.; Fruneau, B.; Pinel, V.; Trouve, E. Mexico City Subsidence Measured by InSAR Time Series: Joint Analysis Using PS and SBAS Approaches. IEEE Trans. Geosci. Remote Sens. 2012, 5, 1312–1326. [Google Scholar] [CrossRef] [Green Version]
- Hooper, A.; Bekaert, D.; Spaans, K.; Arıkan, M. Recent advances in SAR interferometry time series analysis for measuring crustal deformation. Tectonophysics 2012, 514, 1–13. [Google Scholar] [CrossRef]
- Wasowski, J.; Bovenga, F. Investigating landslides and unstable slopes with satellite Multi Temporal Interferometry: Current issues and future perspectives. Eng. Geol. 2014, 174, 103–138. [Google Scholar] [CrossRef]
- Wei, G.; Wang, G.; Li, C.; Wang, D.; Zhu, F.; Xu, T. The numerical simulation of groundwater in the south of Qinwangchuan Basin. J. Lanzhou Univ. 2006, 42, 16–21. (In Chinese) [Google Scholar]
- Shanker, P.; Casu, F.; Zebker, H.A.; Lanari, R. Comparison of Persistent Scatterers and Small Baseline Time-Series InSAR Results: A Case Study of the San Francisco Bay Area. IEEE Trans. Geosci. Remote Sens. 2011, 8, 592–596. [Google Scholar] [CrossRef]
- Zhou, Z. Persistent Scatterers and Small Baseline SAR Interferometry for City Subsidence Mapping: A Case Study in Panjin, China. Geospat. Inf. Sci. Wuhan Univ. 2011, 36, 928–931. (In Chinese) [Google Scholar]
- Dong, J.; Zhang, L.; Tang, M.; Liao, M.; Xu, Q.; Gong, J.; Ao, M. Mapping landslide surface displacements with time series SAR interferometry by combining persistent and distributed scatterers: A case study of Jiaju landslide in Danba, China. Remote Sens. Environ. 2018, 205, 180–198. [Google Scholar] [CrossRef]
- Hooper, A.; Segall, P.; Zebker, H. Persistent scatterer interferometric synthetic aperture radar for crustal deformation analysis, with application to Volcán Alcedo, Galápagos. J. Geophys. Res. 2007, 112, 112. [Google Scholar] [CrossRef]
- Ferretti, A.; Prati, C.; Rocca, F. Nonlinear subsidence rate estimation using permanent scatterers in differential SAR interferometry. IEEE Trans. Geosci. Remote Sens. 2000, 38, 2202–2212. [Google Scholar] [CrossRef]
- Sousa, J.J.; Hooper, A.J.; Hanssen, R.F.; Bastos, L.C.; Ruiz, A.M. Persistent Scatterer InSAR: A comparison of methodologies based on a model of temporal deformation vs. spatial correlation selection criteria. Remote Sens. Environ. 2011, 115, 2652–2663. [Google Scholar] [CrossRef]
- Luo, Q.; Perissin, D.; Zhang, Y.; Jia, Y. L- and X-Band Multi-Temporal InSAR Analysis of Tianjin Subsidence. Remote Sens. 2014, 6, 7933–7951. [Google Scholar] [CrossRef]
- Crosetto, M.; Monserrat, O.; Cuevas-González, M.; Devanthéry, N.; Crippa, B. Persistent Scatterer Interferometry: A review. ISPRS J. Photogramm. Remote Sens. 2016, 115, 78–89. [Google Scholar] [CrossRef]
- Goldstein, R.M.; Werner, C.L. Radar interferogram filtering for geophysical applications. Geophys. Res. Lett. 1998, 25, 4035–4038. [Google Scholar] [CrossRef]
- Costantini, M. A novel phase unwrapping method based on network programming. IEEE Trans. Geosci. Remote Sens. 1998, 36, 813–821. [Google Scholar] [CrossRef]
- Pepe, A.; Manunta, M.; Mazzarella, G.; Lanari, R. A space-time minimum cost flow phase unwrapping algorithm for the generation of persistent scatterers deformation time-series. In Proceedings of the IEEE International Geoscience and Remote Sensing Symposium, Barcelona, Spain, 23–28 July 2007; pp. 1979–1982. [Google Scholar]
- Chen, F.; Lin, H.; Zhou, W.; Hong, T.; Wang, G. Surface deformation detected by ALOS PALSAR small baseline SAR interferometry over permafrost environment of Beiluhe section, Tibet Plateau, China. Remote Sens. Environ. 2013, 138, 10–18. [Google Scholar] [CrossRef]
- Abir, I.A.; Khan, S.D.; Ghulam, A.; Tariq, S.; Shah, M.T. Active tectonics of western Potwar Plateau–Salt Range, northern Pakistan from InSAR observations and seismic imaging. Remote Sens. Environ. 2015, 168, 265–275. [Google Scholar] [CrossRef]
- Grzovic, M.; Ghulam, A. Evaluation of land subsidence from underground coal mining using TimeSAR (SBAS and PSI) in Springfield, Illinois, USA. Nat. Hazards 2015, 79, 1739–1751. [Google Scholar] [CrossRef]
- Ghulam, A.; Grzovic, M.; Maimaitijiang, M.; Sawut, M. InSAR monitoring of land subsidence for sustainable urban planning. In Remote Sensing for Sustainability; Weng, Q., Ed.; CRC Press: Boca Raton, FL, USA, 2016. [Google Scholar]
- Strozzi, T.; Caduff, R.; Wegmüller, U.; Raetzo, H.; Hauser, M. Widespread surface subsidence measured with satellite SAR interferometry in the Swiss alpine range associated with the construction of the Gotthard Base Tunnel. Remote Sens. Environ. 2017, 190, 1–12. [Google Scholar] [CrossRef]
- Terzaghi, K.; Peck, R.B. Soil Mechanics in Engineering Practice; John Wiley & Sons, Inc.: Hoboken, NJ, USA, 1967. [Google Scholar]
- Castellazzi, P.; Garfias, J.; Martel, R.; Brouard, C.; Rivera, A. InSAR to support sustainable urbanization over compacting aquifers: The case of Toluca Valley, Mexico. Int. J. Appl. Earth Obs. Geoinf. 2017, 63, 33–44. [Google Scholar] [CrossRef]
- Xu, Y.S.; Ma, L.; Du, Y.J.; Shen, S.L. Analysis of urbanisation-induced land subsidence in Shanghai. Nat. Hazards 2012, 63, 1255–1267. [Google Scholar] [CrossRef]
- Notti, D.; Mateos, R.M.; Monserrat, O.; Devanthéry, N.; Peinado, T.; Roldán, F.J.; Fernández-Chacón, F.; Galve, J.P.; Lamas, F.; Azañón, J.M. Lithological control of land subsidence induced by groundwater withdrawal in new urban AREAS (Granada Basin, SE Spain). Multiband DInSAR monitoring. Hydrol. Process. 2016, 30, 2317–2330. [Google Scholar] [CrossRef]
- Derbyshire, E.; Meng, X.; Dijkstra, T.A. Landslides in the Thick Loess Terrain of North-West China; John Wiley & Sons, Inc.: Chichester, UK, 2000; pp. 1–256. [Google Scholar]
- Pei, X.; Zhang, F.; Wu, W.; Liang, S. Physicochemical and index properties of loess stabilized with lime and fly ash piles. Appl. Clay Sci. 2015, 114, 77–84. [Google Scholar] [CrossRef]


| Envisat/ASAR | |||
| No. | Acquisition Date | No. | Acquisition Date |
| 1 | 26 June 2003 | 21 | 22 November 2007 |
| 2 | 13 November 2003 | 22 | 31 January 2008 |
| 3 | 18 December 2003 | 23 | 6 March 2008 |
| 4 | 22 January 2004 | 24 | 10 April 2008 |
| 5 | 26 February 2004 | 25 | 28 August 2008 |
| 6 | 1 April 2004 | 26 | 6 November 2008 |
| 7 | 6 May 2004 | 27 | 11 December 2008 |
| 8 | 10 June 2004 | 28 | 15 January 2009 |
| 9 | 15 July 2004 | 29 | 19 February 2009 |
| 10 | 28 October 2004 | 30 | 26 March 2009 |
| 11 | 2 December 2004 | 31 | 4 June 2009 |
| 12 | 10 February 2005 | 32 | 17 September 2009 |
| 13 | 21 April 2005 | 33 | 22 October 2009 |
| 14 | 2 November 2006 | 34 | 4 February 2010 |
| 15 | 7 December 2006 | 35 | 11 March 2010 |
| 16 | 11 January 2007 | 36 | 15 April 2010 |
| 17 | 15 February 2007 | 37 | 20 May 2010 |
| 18 | 22 March 2007 | 38 | 24 June 2010 |
| 19 | 31 May 2007 | 39 | 29 July 2010 |
| 20 | 13 September 2007 | 40 | 2 September 2010 |
| Sentinel-1A | |||
| No. | Acquisition Date | No. | Acquisition Date |
| 1 | 13 May 2015 | 9 | 8 January 2016 |
| 2 | 6 June 2015 | 10 | 1 February 2016 |
| 3 | 30 June 2015 | 11 | 25 February 2016 |
| 4 | 24 July 2015 | 12 | 20 March 2016 |
| 5 | 17 August 2015 | 13 | 13 April 2016 |
| 6 | 10 September 2015 | 14 | 31 May 2016 |
| 7 | 4 October 2015 | 15 | 18 July 2016 |
| 8 | 15 December 2015 | ||
| Property | Original Loess | Filling Loess |
|---|---|---|
| Dry bulk density (g/cm3) | 1.38 ± 0.06 (N = 16) | 1.39 ± 0.09 (N = 48) |
| Void ratio | 0.95 ± 0.12 (N = 16) | 1.16 ± 0.40 (N = 48) |
| Liquid limit (%) | 24.40 ± 0.53 (N = 16) | 24.30 ± 0.90 (N = 48) |
| Plastic limit (%) | 17.10 ± 0.82 (N = 16) | 16.30 ± 0.70 (N = 48) |
| Collapsibility | 0.09 ± 0.04 (N = 16) | 0.12 ± 0.02 (N = 48) |
| Self-weight collapsibility | 0.05 ± 0.03 (N = 16) | 0.05 ± 0.04 (N = 48) |
| Compressibility | 0.22 ± 0.09 (N = 16) | 0.45 ± 0.25 (N = 48) |
© 2018 by the authors. Licensee MDPI, Basel, Switzerland. This article is an open access article distributed under the terms and conditions of the Creative Commons Attribution (CC BY) license (http://creativecommons.org/licenses/by/4.0/).
Share and Cite
Chen, G.; Zhang, Y.; Zeng, R.; Yang, Z.; Chen, X.; Zhao, F.; Meng, X. Detection of Land Subsidence Associated with Land Creation and Rapid Urbanization in the Chinese Loess Plateau Using Time Series InSAR: A Case Study of Lanzhou New District. Remote Sens. 2018, 10, 270. https://0-doi-org.brum.beds.ac.uk/10.3390/rs10020270
Chen G, Zhang Y, Zeng R, Yang Z, Chen X, Zhao F, Meng X. Detection of Land Subsidence Associated with Land Creation and Rapid Urbanization in the Chinese Loess Plateau Using Time Series InSAR: A Case Study of Lanzhou New District. Remote Sensing. 2018; 10(2):270. https://0-doi-org.brum.beds.ac.uk/10.3390/rs10020270
Chicago/Turabian StyleChen, Guan, Yi Zhang, Runqiang Zeng, Zhongkang Yang, Xi Chen, Fumeng Zhao, and Xingmin Meng. 2018. "Detection of Land Subsidence Associated with Land Creation and Rapid Urbanization in the Chinese Loess Plateau Using Time Series InSAR: A Case Study of Lanzhou New District" Remote Sensing 10, no. 2: 270. https://0-doi-org.brum.beds.ac.uk/10.3390/rs10020270