Article

Urban Land Use Mapping by Combining Remote Sensing Imagery and Mobile Phone Positioning Data

1
State Key Laboratory of Resources and Environmental Information System, Institute of Geographic Sciences and Natural Resources Research, Chinese Academy of Sciences, Beijing 100101 China
2
University of Chinese Academy of Sciences, Beijing 100049, China
3
Institute of Geodesy and Geophysics, Chinese Academy of Sciences, Wuhan 430077, China
4
Department of Geography, The State University of New York, Buffalo, NY 14261, USA
5
School of Earth Sciences and Engineering, Hohai University, Nanjing 210098, China
*
Author to whom correspondence should be addressed.
Submission received: 31 January 2018 / Revised: 28 February 2018 / Accepted: 6 March 2018 / Published: 12 March 2018
(This article belongs to the Special Issue Multisensor Data Fusion in Remote Sensing)

Abstract

:
Land use is of great importance for urban planning, environmental monitoring, and transportation management. Several methods have been proposed to obtain land use maps of urban areas, and these can be classified into two categories: remote sensing methods and social sensing methods. However, remote sensing and social sensing approaches have specific disadvantages regarding the description of social and physical features, respectively. Therefore, an appropriate fusion strategy is vital for large-area land use mapping. To address this issue, we propose an efficient land use mapping method that combines remote sensing imagery (RSI) and mobile phone positioning data (MPPD) for large areas. We implemented this method in two steps. First, a support vector machine was adopted to classify the RSI and MPPD. Then, the two classification results were fused using a decision fusion strategy to generate the land use map. The proposed method was applied to a case study of the central area of Beijing. The experimental results show that the proposed method improved classification accuracy compared with that achieved using MPPD alone, validating the efficacy of this new approach for identifying land use. Based on the land use map and MPPD data, activity density in key zones during daytime and nighttime was analyzed to illustrate the volume and variation of people working and living across different regions.

Graphical Abstract

1. Introduction

Urban areas account for 0.5% of the planet’s surface but accommodate more than half the global population [1]. Over recent decades, most cities have experienced dramatic increases in population and rapid expansion of their urban areas [2]. Such unprecedented development of modern cities has led to the emergence of some important urban problems, e.g., urban heat islands [3], transportation congestion [4], and urban villages [5]. Effective monitoring of urban areas is urgently needed for their sustainable development. Specifically, identifying detailed land use patterns is important for decision-makers, because it is fundamental to understanding the relationship between physical and socioeconomic structures within urban areas [6,7].
Remote sensing is an approach used widely for urban mapping, because it can reveal the physical structure of the surface. Remotely sensed images have been acquired by many different sensors and applied to urban land cover mapping. For example, images obtained by the Landsat Operational Land Imager and Thematic Mapper have been used for land cover classification of fast-developing cities in China [8,9]. However, medium-spatial-resolution remote sensing imagery (RSI) is primarily useful for mapping land cover, and not well suited for distinguishing land uses. This is because the reflectances of several land use classes are very similar, which means they can often be categorized as a single class in a land cover map. For example, the land cover class of impervious surface could comprise the land use classes of business, residential, and factory.
High-spatial-resolution RSI has shown promise as a data source for obtaining urban land use maps, because it can provide both spectral and textural properties of urban areas [10,11,12]. Various spectral-spatial classification methods have been proposed to extract urban land use maps. One popular method is to add into the original remote sensing spectral bands textural information derived from the original RSI, e.g., a grayscale co-occurrence matrix [13,14], morphological features [15], and a pixel shape index [16]. For example, Li et al. used a Bayesian network to categorize building objects into different land use types based on their morphological, geometric, and contextual attributes [17]. Another method involves object-based classification, in which a land cover map is first interpreted from high-spatial-resolution RSI. Then, spatial metrics, image texture, and nearest-neighbor relationships of land cover objects are adopted as parameters to identify urban functional zones [18,19]. Using the object-based classification method, Voltersen et al. classified every block in Berlin (Germany) into specific land use types [12]. Moreover, scene classification, which often includes scene segmentation, scene feature extraction, and semantic classification, is another promising method for urban land use mapping [20,21]. Zhao et al. used the scene classification method to construct a bag-of-visual-words representation according to multiscale spatial features characterized by a convolutional neural network, which they applied to classification of the University of California Merced Land Use Dataset [22].
Although these spectral-spatial approaches applied to high-spatial-resolution RSI have the potential to distinguish different urban land use types, some limitations remain. The main reason is that an urban land use category is commonly composed of various land cover types, and urban land use classes are heterogeneous in their spectral and textural characteristics. It is difficult to distinguish them accurately using classification algorithms based on these physical characteristics alone [23]. However, land use types have distinct social functions. Therefore, integrating auxiliary social information and expert knowledge could be effective in improving the performance of urban land use identification [23,24]. In particular, the emergence of geospatial big data has brought new possibilities regarding the identification of land use because of its natural ability to capture the socioeconomic characteristics of an area.
Of the various sources of auxiliary social information that are available for the extraction of urban land use information, mobile phone data, points of interest (POIs), and human trajectories have been used for functional urban area mapping [25,26,27,28]. Specifically, Pei at el. used mobile phone data collected from base transceiver stations in Singapore and fuzzy c-means to obtain a land use map of Singapore [25]. Yuan et al. proposed a parcel-based method for land use identification, where POIs and taxi trajectories are integrated to attribute parcel types using Dirichlet multinomial regression [26]. Fan et al. proposed a method to discern the life patterns of pixels using a nonnegative tensor factorization approach to decompose geolocation data from 1.5 million volunteer trajectories in Tokyo [27].
Given that urban land use should be recognized using physical or social attributes, identifying the land use of a city based on either RSI or geospatial big data alone has unavoidable limitations. Several land use classes are difficult to distinguish using remote sensing or social sensing data in isolation. For example, the remotely sensed spectral and spatial features of business and commercial land uses are similar, while their respective social characteristics are distinctive. Furthermore, human mobility associated with bare-land and farmland is similar, while their land covers are different. Thus, both remote sensing and social sensing data have drawbacks regarding several land use classes. From another perspective, however, RSI has a natural advantage concerning several physical land use classes, e.g., green land, bare land, and water, while socially sensed data have advantages regarding social land use classes, e.g., business, residential, and commercial areas. Therefore, fusing remotely sensed and socially sensed data could be advantageous when applied to urban land use mapping by exploiting the complementary features of the two methods.
Few methods have been proposed for mapping urban land use by fusing remotely sensed and socially sensed data. Hu proposed a land use mapping method that derived social and physical features from POI and Landsat Operational Land Imager data, and adopted similarity measures and thresholds to obtain the land use type of every land parcel in Beijing [29]. Liu et al. combined spectral, textural, and spatial features calculated from high-resolution RSI and social features derived from mobile phone positioning data (MPPD) to identify land use types of different scenes. Compared with other socially sensed data, such as POI and mobile phone data, MPPD are most suitable for land use mapping, because this type of data has the advantage of expressing human mobility [30]. Although high-spatial-resolution RSI has shown potential for use in land use mapping when combined with social features, medium-spatial-resolution RSI is easier to acquire with little cost and appropriate for large-area mapping. However, the spatial and textural features derived from medium-spatial-resolution RSI are inadequate to reflect the specific features of buildings, roads, and farmland. Therefore, an additional fusion strategy is needed to combine medium-spatial-resolution RSI and MPPD to obtain large-area land use maps.
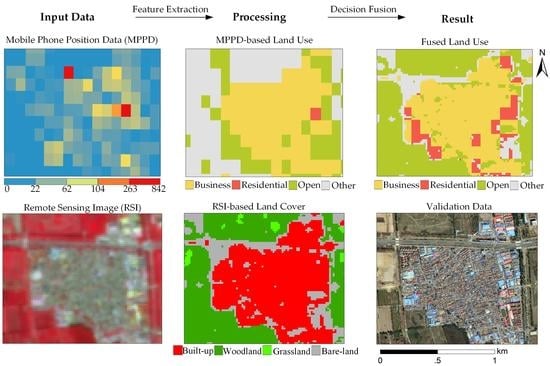
This paper proposes an urban land use mapping method that combines medium-spatial-resolution RSI and mobile phone positioning data (MPPD) to extract urban land use information. The proposed method first classifies the remote sensing data and the MPPD separately. The urban land use map is then derived by fusing the two classification results using a decision fusion method, and activity density is analyzed for some representative classes in different regions. The remainder of this paper is organized as follows. 
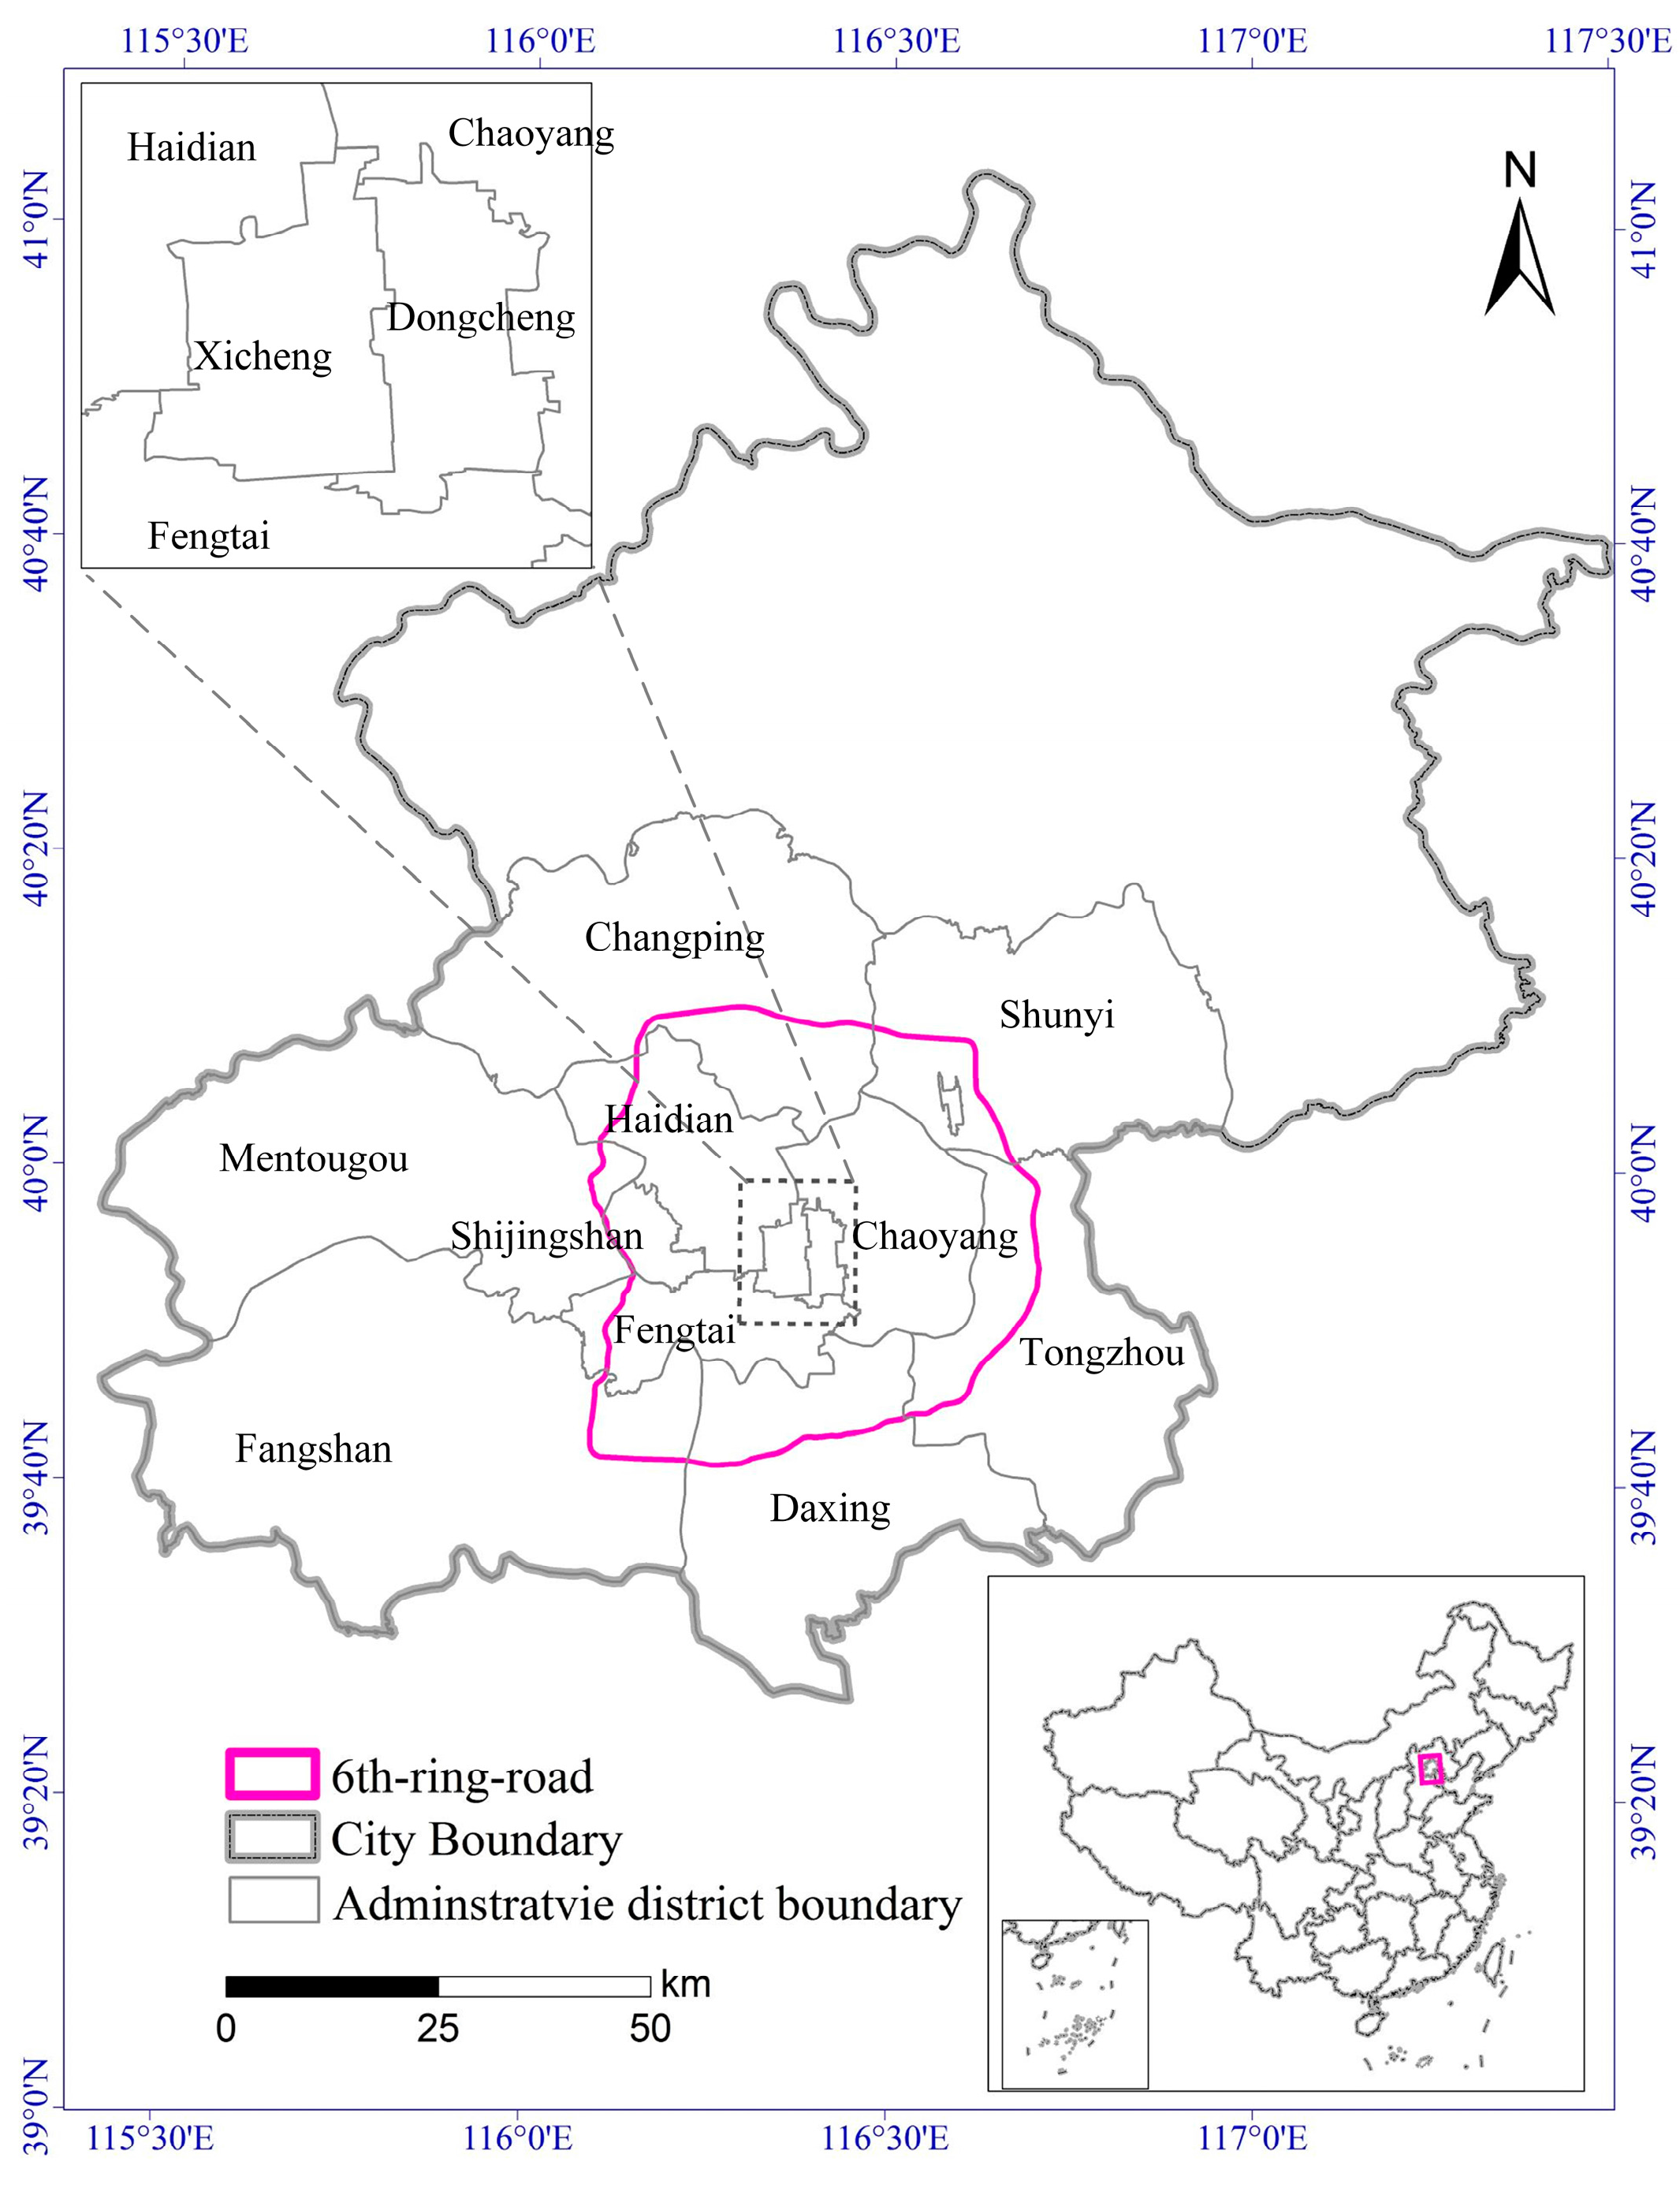
Section 2 elaborates on the details of the study area and the data used. Section 3 describes the method. The results obtained by applying the method to the study area are presented in Section 4. An analysis of the significance and future of the work are discussed in Section 5. Finally, our conclusions are stated in Section 6.

2. Study Area and Data

2.1. Study Area

Beijing, the capital city of China, is located in the northern region of the North China Plain, and its 16 administrative districts cover an area of approximately 16,800 km2. Beijing, which is the center for the national government, is known for many nongovernmental organizations, universities, high-tech companies, and scenic spots, and its population in 2016 was over 22 million [31]. Because of the recent massive influx of people, Beijing has experienced rapid urbanization and structural transformation [32].
The study area comprised the metropolitan area of Beijing within the 6th Ring Road, an area of approximately 2400 km2. The study area encompassed all of Dongcheng, Xicheng, Chaoyang, and Shijingshan administrative districts, most parts of Fengtai and Haidian districts, and small parts of Daixing, Tongzhou, Shunyi, Changping, Mentougou, and Fangshan districts (Figure 1). The study area, which constitutes the most developed zone of Beijing, has a population of 16.7 million, approximately 76% of the population of the entire city [31,33].

2.2. Remote Sensing Data

A single Gaofen 1 (GF1) wide-field view (WFV) scene was used as the RSI data source. GF1, launched in April 2013, has two sensors: a panchromatic/multispectral (PMS) camera and the WFV camera [34]. With high spatial resolution, wide coverage, and a short return interval between acquisitions of successive images of the same area, WFV imagery is considered a promising data source for land cover mapping and dynamic change detection. The detailed parameters of WFV imagery are shown in Table 1. WFV images are freely available for download from China’s Center for Resources Satellite Data and Applications (CRESDA) website (http://www.cresda.com/EN/). The criteria adopted for image selection are for both full and cloud-free coverage of the study area. Images acquired during July to October 2015 were considered, and a WFV image acquired on 15 August was finally selected and downloaded (Figure 2a).

2.3. MPPD Data

MPPD data were provided by Tencent, the largest social communications provider in China. Tencent operates popular social media applications including QQ and WeChat, which is the most widely used instant messaging service in China. When a location-based service (e.g., “People Nearby,” “Sharing Your Position,” or “Position Message”) is activated, the precise location of the mobile phone user is recorded. According to a 2015 report by the Tencent Big Data Center, approximately 450 million mobile phone positions are generated daily in Beijing, and the distribution of the MPPD is found to be correlated strongly with the LandScan database, which is a high-spatiotemporal-resolution global population dataset released by Oak Ridge National Laboratory [35]. Hourly 100 m MPPD have been released by Tencent’s Big Data Platform “Easygo” for research purposes. We obtained MPPD over a two-week period (15–18 June 2015) in the Beijing metropolitan area. Figure 2b shows the MPPD at 12:00 local time on 6 June 2015.

3. Methods

The objective of the proposed method is to obtain urban land use maps by fusing remote sensing and social sensing data. The workflow of the proposed method is shown in Figure 3. First, WVF data and MPPD were preprocessed independently. Second, land cover and primitive land use maps were obtained from the WFV data and MPPD by classification. Finally, using the land cover and land use maps produced from the WFV data and MPPD, the final land use labels of all pixels were identified using a decision fusion strategy, which considers both the physical and socioeconomic characteristics of the land surface.

3.1. Preprocessing

3.1.1. Preprocessing of WFV Data

Orthorectification, radiometric calibration, and cropping were applied in preprocessing the WFV data. Orthorectification was performed using the ENVI® (V 5.3, Harris Corporation, Melbourne, FL, USA) RPC Orthorectification Using Reference Image module. A DigitalGlobal image from Google Earth™ (acquired on 7 September 2105) was adopted as the reference image, and Global Multi-resolution Terrain Elevation Data 2010 was selected as the DEM model. Spectral response function and radiometric calibration coefficients files of the WFV image were obtained from CRESDA (http://www.cresda.com/EN/), and radiometric calibration was completed using the ENVI Radiometric Calibration tool.

3.1.2. Preprocessing of MPPD

An averaging filter was used to reduce the dimensionality of the MPPD. Pei et al. demonstrated that the modes of human activity from Monday to Thursday tend to be similar [25]. Therefore, the hourly MPPD from Monday to Thursday were averaged by hour, i.e., data from the same hour of each of the four days were averaged. A similar hourly mean filter was applied to the data from Friday to Sunday. Following this procedure, the dimensions of the MPPD were reduced from 14 × 24 to 4 × 24, where the leading numerals are the number of days and 24 is the number of hours per day. Subsequently, three-hour bands from the 4 × 24 dataset were further averaged, resulting in MPPD with dimensions of 4 × 8, which were used for the classification.

3.2. Classification Using Single Data

3.2.1. Support Vector Machine Classifier

A support vector machine (SVM) was used as the principal classifier because it has shown remarkable ability to handle remote multispectral data and has been reported to perform well in obtaining land cover and land use maps [36,37]. The concept of a binary-class SVM is to find a separable hyperplane with which to separate two binary classes. When dealing with linear binary classification, for training set S = { ( x 1 , y 1 ) , , ( x n , y n ) } , y n { 1 , 1 } , the optimal separating hyperplane, which can be defined as f ( x ) = w × x + b , maximizes the distance between two class samples. It can be proven that this distance is equal to 1 ω , and that the optimal hyperplane can be solved as a convex quadratic programming problem:
{ minimize : 1 2 w 2 subject   to : y i × ( w × x i + b ) 1
The above optimization problem can be transformed by a Lagrangian formulation into the following dual problems:
{ maximize : i = 1 N a i 1 2 i = 1 N j = 1 N a i × a j × y i × y j × ( X I × X j ) subject   to : i = 1 N a i × y i = 0   and   a i 0
The discriminant function of the hyperplane can be found by Equation (2) using Lagrange multipliers and training samples.
In general cases, training samples are nonlinearly separable. A conventional way to separate samples is to map the data into a new feature space such that the nonlinear separable problem can be converted into a linear classification solution. A kernel method is an effective mapping method because all computations are performed in the original space, which simplifies the dual problem in Equation (2). The result yields a discriminant function f(x) in the original feature space:
f ( x ) = a i × y i × K ( x i , x ) + b
where K ( x i , x ) = Φ ( x i ) × Φ ( x ) is the kernel function, which is expressed as a type of inner product in the transformed feature space.
To deal with multiclass classification problems with N classes, a pairwise approach can be used. The common solution is to construct N(N − 1)/2 hyperplanes, which are able to separate all pairwise classes [24,26]. The probability of unlabeled sample x belonging to class n (n = 1, 2, …, N) can be calculated by transforming the SVM decision value f(x) using a sigmoid function [26]. Hence, the label of a pixel can be defined as:
l a b e l ( i ) = arg   max c ( f c ( i ) )
where i represents an unlabeled sample and f c ( i ) is the calculated probability that pixel i belongs to class c.

3.2.2. Classification of Remote Sensing Imagery

The remotely sensed data are used to represent the spatial distribution of the natural land surface for two reasons. The first is that these data have an inherent advantage in being able to distinguish several classes that can be discerned from the spectral information, e.g., grassland or woodland. The second is that the data provide a baseline classification result for the land use map. This baseline map can then be reclassified or subdivided to generate a land use map according the patterns of human mobility.
In this study, the land cover was obtained by classifying the WFV data. After processing the WFV data, a land cover map was obtained using the SVM classifier. The classification system designed by the Resources and Environmental Scientific Data Center of the Chinese Academy of Sciences was used as the reference classification system for the WFV data [38]. As the difference between grassland and farmland is slight, and because neither class had much influence on the land use mapping, we selected just five classes for the land-cover categories: woodland, grassland, water, built-up, and bare-land.
The training samples of each land cover class were inspected visually in the WFV image with the aid of Google Earth™ imagery using uniform sampling. Overall, 3099 pixels with 16 m spatial resolution were selected from the WFV image as training samples, and the number in each class is shown in Table 2. The separability of the training samples was checked using the Jeffries–Matusita interclass distance, and the results are shown in Table 3. Except for woodland and grassland, the Jeffries–Matusita distance between other classes was relatively high, which indicated that they had distinct separability. As the remote sensing data were acquired in August, there are several similarities between the spectral values of woodland and grassland, which caused some difficulty in separating the two classes.

3.2.3. Classification of MPPD

MPPD are a reliable indicator of the patterns of human mobility, and they have been shown to be remarkably beneficial in land use mapping [25,30]. However, an inherent weakness of MPPD is the inability to distinguish several land use classes, e.g., grassland and bare-land. Therefore, in this study, the role of MPPD is to provide a primitive land use map of the study area.
The characteristics of MPPD used in this study are similar to the data used in the research by Pei et al. and Fan et al. [25,27], and we adopted a classification system similar to theirs. However, because Beijing is famous for its Royal Garden and other tourist attractions, we additionally incorporated a scenic area classification. Therefore, we adopted a classification system with six land use classes: business, residential, entertainment, open, scenic, and other. Similar to the classification procedure implemented for the WFV data, SVM was adopted to label the land use classes derived from the MPPD.
Several typical points for each class were selected from MPPD to illustrate the human mobility pattern of each class by using the mean value of the points. The spectral curve of each class is shown in Figure 4. It can be seen that each of the six land use classes has a unique pattern:
(1)
Residential: has a peak population density in the evening and a relatively lower value during working hours (Figure 4a).
(2)
Business: the population density peaks during working hours and decreases considerably in the evening (Figure 4b).
(3)
Entertainment: mainly includes the places where people go shopping or friends have parties, e.g., shopping malls, restaurants, and clubs. It has a pattern of human mobility similar to business; the obvious difference between the two is that more people visit entertainment areas during the weekend (Figure 4f).
(4)
Scenic: scenic areas, such as the Summer Palace, have high population density and an irregular pattern of human movement (Figure 4c).
(5)
Open: places where people exercise in open areas, like parks and outdoor locations. In comparison with scenic areas, the population density of open areas is relatively low (Figure 4d).
(6)
Other: primarily indicates areas with limited human activity (Figure 4e).
The pattern of human activity associated with the land use class of entertainment is similar to that of business during weekdays, whereas the patterns of the two classes are different on weekends. The work index, which is the ratio between the average daytime population density on workdays and on weekends, was defined to separate business and entertainment. Thus, during the classification process, five classes were defined initially: working, residential, open, scenic, and other. Then, the class working was subdivided into business and entertainment according to the work index. An area with a work index value greater than 1 is considered an entertainment area. The training sample of the MPPD was selected manually using Google Earth™. However, the spatial resolutions of the Google Earth™ image and the MPPD were considerably different, and the boundary of the training samples obtained from Google Earth™ was slightly different to that of the MPPD. Therefore, the boundary of training samples was rectified using the MPPD image combining bands of 18, 12 and 6, which represented the user’s density at local workday times of 18:00, 12:00, and 6:00. Overall, 2776 pixels were finally selected as the training samples (Table 4).

3.3. Decision Fusion Strategy

After the WFV-based land cover map and the MPPD-based initial land use map were produced, the final land use map was generated using decision fusion. The system of categorization of the final land use map is the same as the MPPD-based land use map (i.e., the six land use classes of business, residential, entertainment, scenic, open, and other). As the spatial resolutions of the MPPD-based land use and WFV-based land cover were different, in order to unify the spatial resolutions of the two datasets, the MPPD-based land use map was first disaggregated using the nearest-neighbor method before the fusion procedure was implemented.
In this study, the decision rules shown in Table 5 were applied to fuse the WFV-based land cover map and the MPPD-based initial land use map. The detailed strategy is as follows.
(1)
Fusion rules for residential. In an urban area, the built-up area is the supporting element for residential. The first decision fusion rule is that a built-up area with a residential labelled in the MPPD-based land use is categorized as residential for the fused land use map. For the core city, the pattern of user density is considered sufficient to distinguish the above land use classes. However, for several built-up areas in the outskirts of the city, villages, and villas, the pattern of user density is inadequate to reflect the real class because of a deficiency of mobile phone users. In such areas, the pattern of user density is similar to open areas. Based on this phenomenon, pixels attributed to built-up areas in the WFV-based land cover map but classified as open areas in the MPPD-based land use map were reclassified as residential in the fused land use map.
(2)
Fusion rules for business. Similar to residential, the business class exists in built-up areas. Therefore, several built-up areas were reclassified as business where the categories of WFV-based land cover and MPPD-based land use were built-up and business, respectively. However, several business areas, e.g., warehouses and factories, were misclassified as other in the MPPD-based land use map because of limited human activity. Based on the above, the second decision fusion rule is that pixels that have the value of a built-up area in the WFV-based land cover map and other in the MPPD-based land use map are reclassified as business.
(3)
Fusion rules for entertainment. Similar to residential and business, built-up areas are fundamental to the class of entertainment. For this reason, the entertainment class was assigned to areas where the WFV-based land cover and MPPD-based land use were built-up and entertainment, respectively.
(4)
Fusion rules for scenic. The scenic areas in Beijing primarily include historic palaces and modern monuments, e.g., the Summer Palace, the Forbidden City, and the National Stadium (Bird’s Nest). The land cover classes of these zones are mainly built-up and bare-land. Thus, built-up areas and bare-land areas with scenic patterns were classified as scenic in the fused land use map.
(5)
Fusion rules for open. Green and water areas with significant human activity, except those classified as other in the MPPD-based land use map, were classified as open in the fused land use map.
(6)
Fusion rules for other. Any remaining unclassified areas were assigned as other in the fused land use map.
Figure 5 displays an illustration of the decision fusion rules, and Table 5 presents the complete decision fusion rules.

3.4. Accuracy Assessment

The WFV-based land cover map, MPPD-based land use map, and fusion land use map were assessed using the metrics of overall accuracy (OA), producer’s accuracy (PA), and user’s accuracy (UA). In this study, validation samples were generated randomly using stratified random sampling and inspected visually using Google Earth™. Overall, 2153, 1022, and 1172 samples were selected as validation points for the WFV-based land cover map, MPPD-based land use map, and fusion land use map, respectively, as shown in Figure 6.

4. Results

4.1. WFV-Based Land Cover Classification Result

The land cover map produced from the GF1 RSI is shown in Figure 7. The map shows that the built-up class occupies most of the study area, while green space (woodland and grassland) is scattered around the periphery of the city, and several bodies of water are distributed sporadically.
The accuracy assessment (Table 6) indicates that the OA of the land cover map is 89.3%, and the PA of all classes is over 89.0%, except for the bare-land class. Results from the WFV-based classification of land cover indicate that it is a challenge to distinguish bare-land and built-up areas because of the low spectral separability of the two classes. Approximately 26.6% of bare-land is misclassified as built-up areas, and the omission error for bare-land was 42.5%. Another reason for this phenomenon is that a mixture of building and bare-land was prevalent in Beijing at the time of the study, where several buildings, roads, and parks were undergoing transformation between soil and impervious land during the period.
Despite the reasonably high accuracy of the WFV-based land cover map, it is difficult to discern detailed information about the built-up areas. Although some conclusions could be made by visually checking the map (Figure 7), business and residential areas located in the core area could not be distinguished in the WFV image.

4.2. MPPD-Based Land Use Classification Result

The MPPD-based land use map is shown in Figure 8. The class-specific spatial distribution shows that business and residential areas cover most of the core part of the study area. Open and other classes dominate the outskirts of the city, while scenic and entertainment areas are interspersed sporadically with business areas. The business class occurs in the center of Beijing and is distributed with a linear or aggregated model. The residential class has a more dispersed spatial distribution, and intermingles with business areas.
The resulting confusion matrix (Table 7) demonstrates that the OA of the MPPD-based land use map is 77.8%, which has some credibility for the entire result. However, except for the omission error of business and the commission errors of entertainment and open, the accuracy of the other classes is mostly over 80.0%. This indicates that MPPD are suitable for land use mapping, to some extent; however, considerable effort is required to improve the performance of the land use map, especially for business, entertainment, and open classes.
The resulting table shows that several business areas are misclassified as residential, open, and other, several open areas are misclassified as residential and business, and several entertainment areas are omitted. This shows that MPPD have several disadvantages regarding the classification of business and open areas.

4.3. Fused Land Use Map Result

The fused land use map is shown in Figure 9. It is evident that business, residential, and open areas occupy most of the city. Compared with the MPPD-based land use map, open areas are found to extend over a larger area in the fused map and occur mainly around the periphery of the city. In addition, business and residential areas have more discrete spatial distributions than in the MPPD-based land use map, and more business and residential areas occur in the outskirts of the city.
Table 8 presents the accuracy assessment for the fused land use map. After fusing the land cover information, the OA of the fused land use map reaches 83.5%, an increase of 5.7% compared with the MPPD-based land use map. Compared with the MPPD-based land use map, almost all class-specific accuracies of the fused land use map increased significantly, especially for business, residential, and open areas.
For the residential class, areas misclassified as open and business are the primary reason for commission errors. However, fusing the land cover information reduced commission errors, attributable to misclassification as open areas, from 7.9% to 3.4%. A similar result is achieved for the business zone, where its misclassification of open and other areas decreases from 25.0% to 10.0%. Following the correction of misclassification of residential and business as open areas, the PA of the open class increases to 93.4%. Assignment as other and scenic classes is reasonably high in the MPPD-based land use map; however, increases for these two classes are not obvious after fusing the land cover information. The PA of the entertainment class in the two land use maps is almost equal, which indicates that the land cover information is inadequate to improve the accuracy of this class.

5. Discussion

5.1. Advantages of the Fused Land Cover Map and Future Work

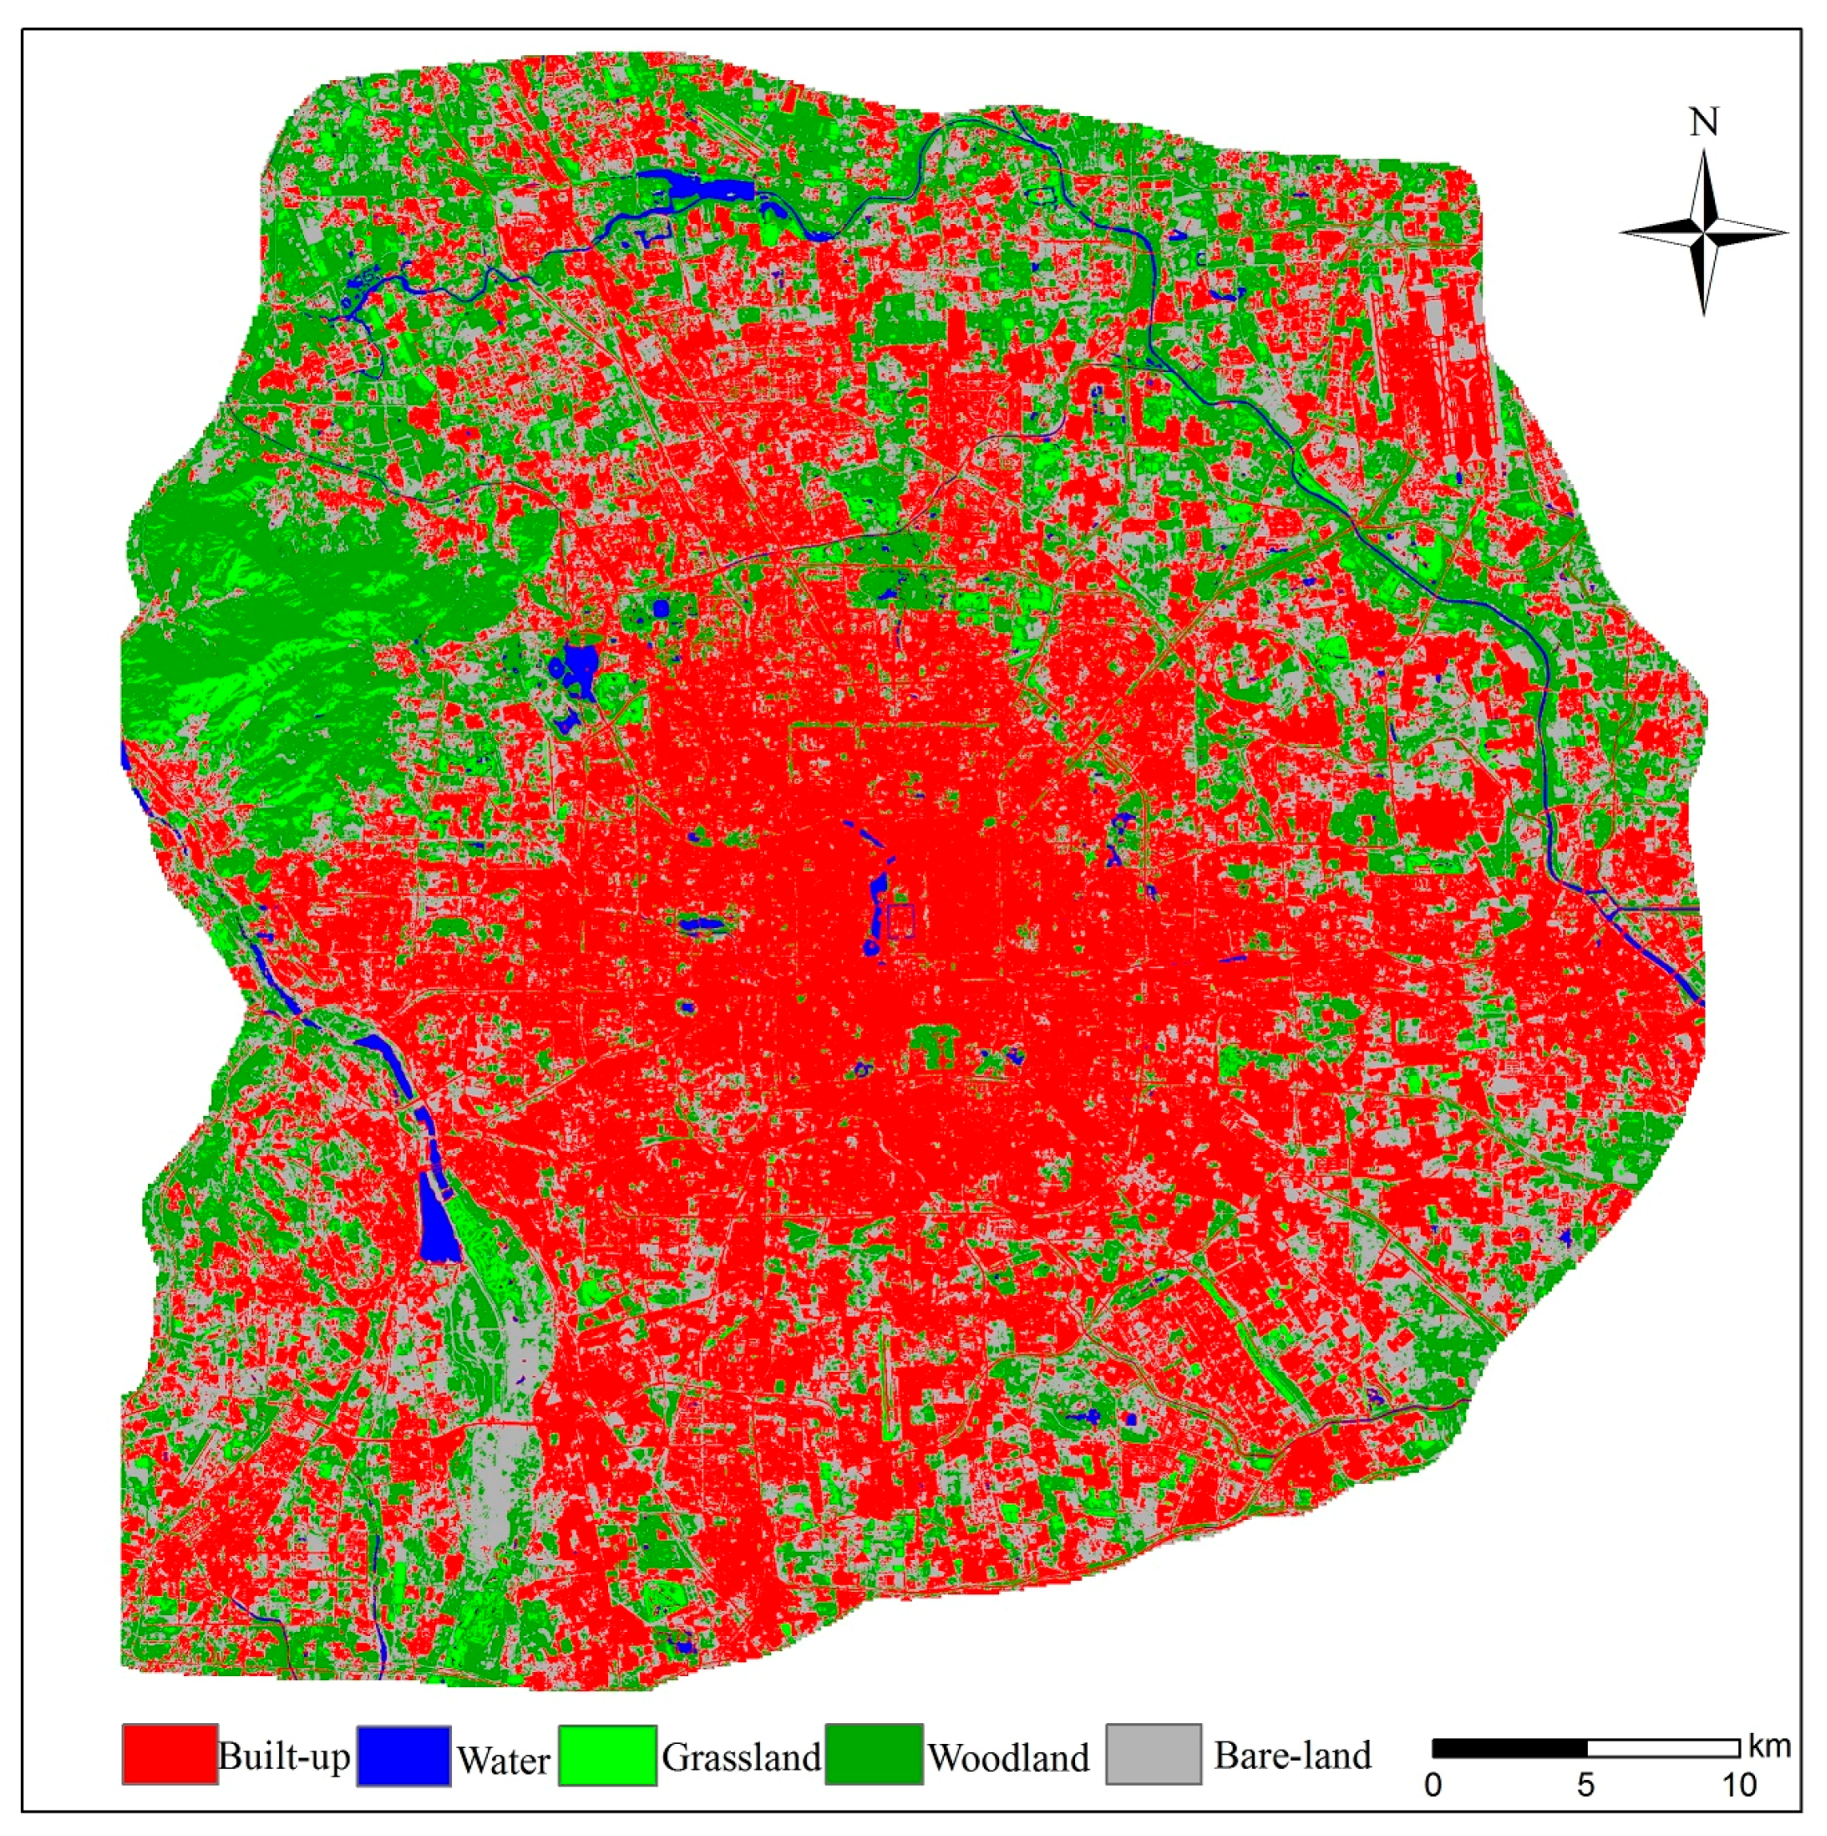
The experimental results indicate that the class-specific accuracy of residential, business, and open areas increases after the MPPD-based land use and WFV-based land cover maps are fused. Comparison between the confusion matrices of the fused and MPPD-based land use maps indicates that four zones, where the true label is residential or business and the misclassified label is open or other, are the main areas contributing to the improved results. Several factors contribute to this improvement. In general, the WFV data by themselves are inadequate for mapping detailed land use, and the MPPD-based mapping is considerably improved by fusing it with the WFV results. As shown in 
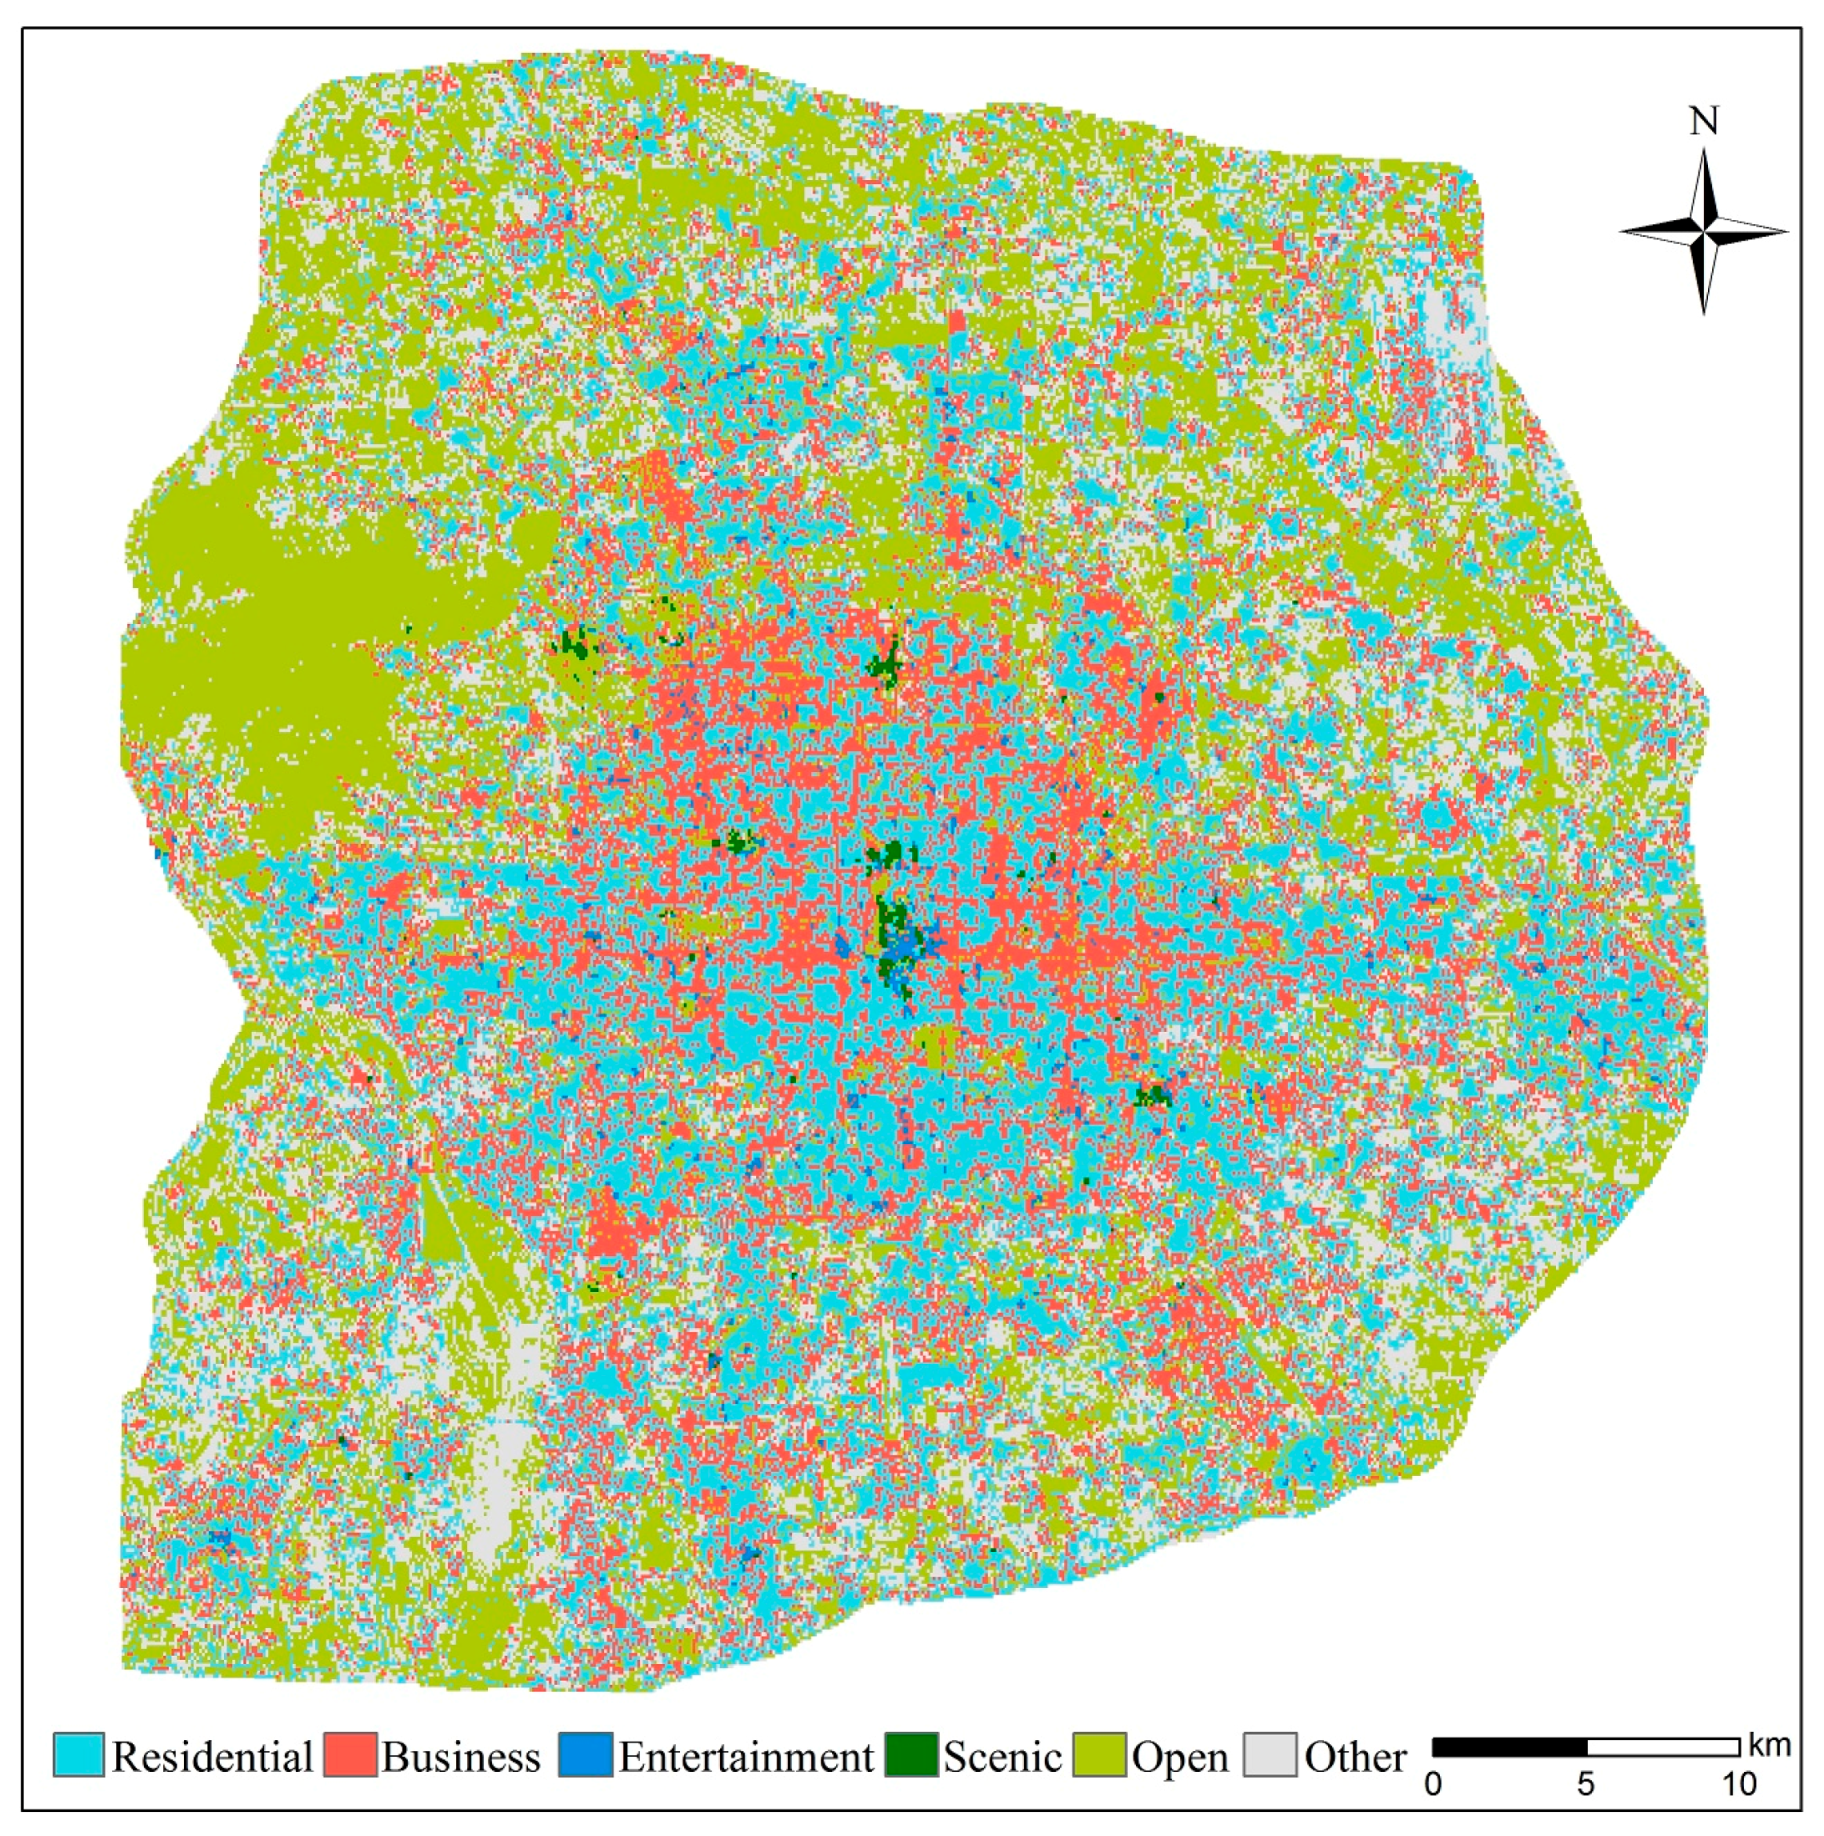
Figure 7, the core area of the study area is occupied primarily by built-up areas, thus it is difficult to discern detailed land use that could adequately reflect the city’s structure. Different from the WFV remote sensing data, MPPD have a natural advantage in revealing unnatural urban functions. However, as shown in Table 5 and Table 6, MPPD are deficient in distinguishing several classes, e.g., open and business. Nevertheless, integrating the WFV data and MPPD decreases the levels of omission and commission errors of the above classes.
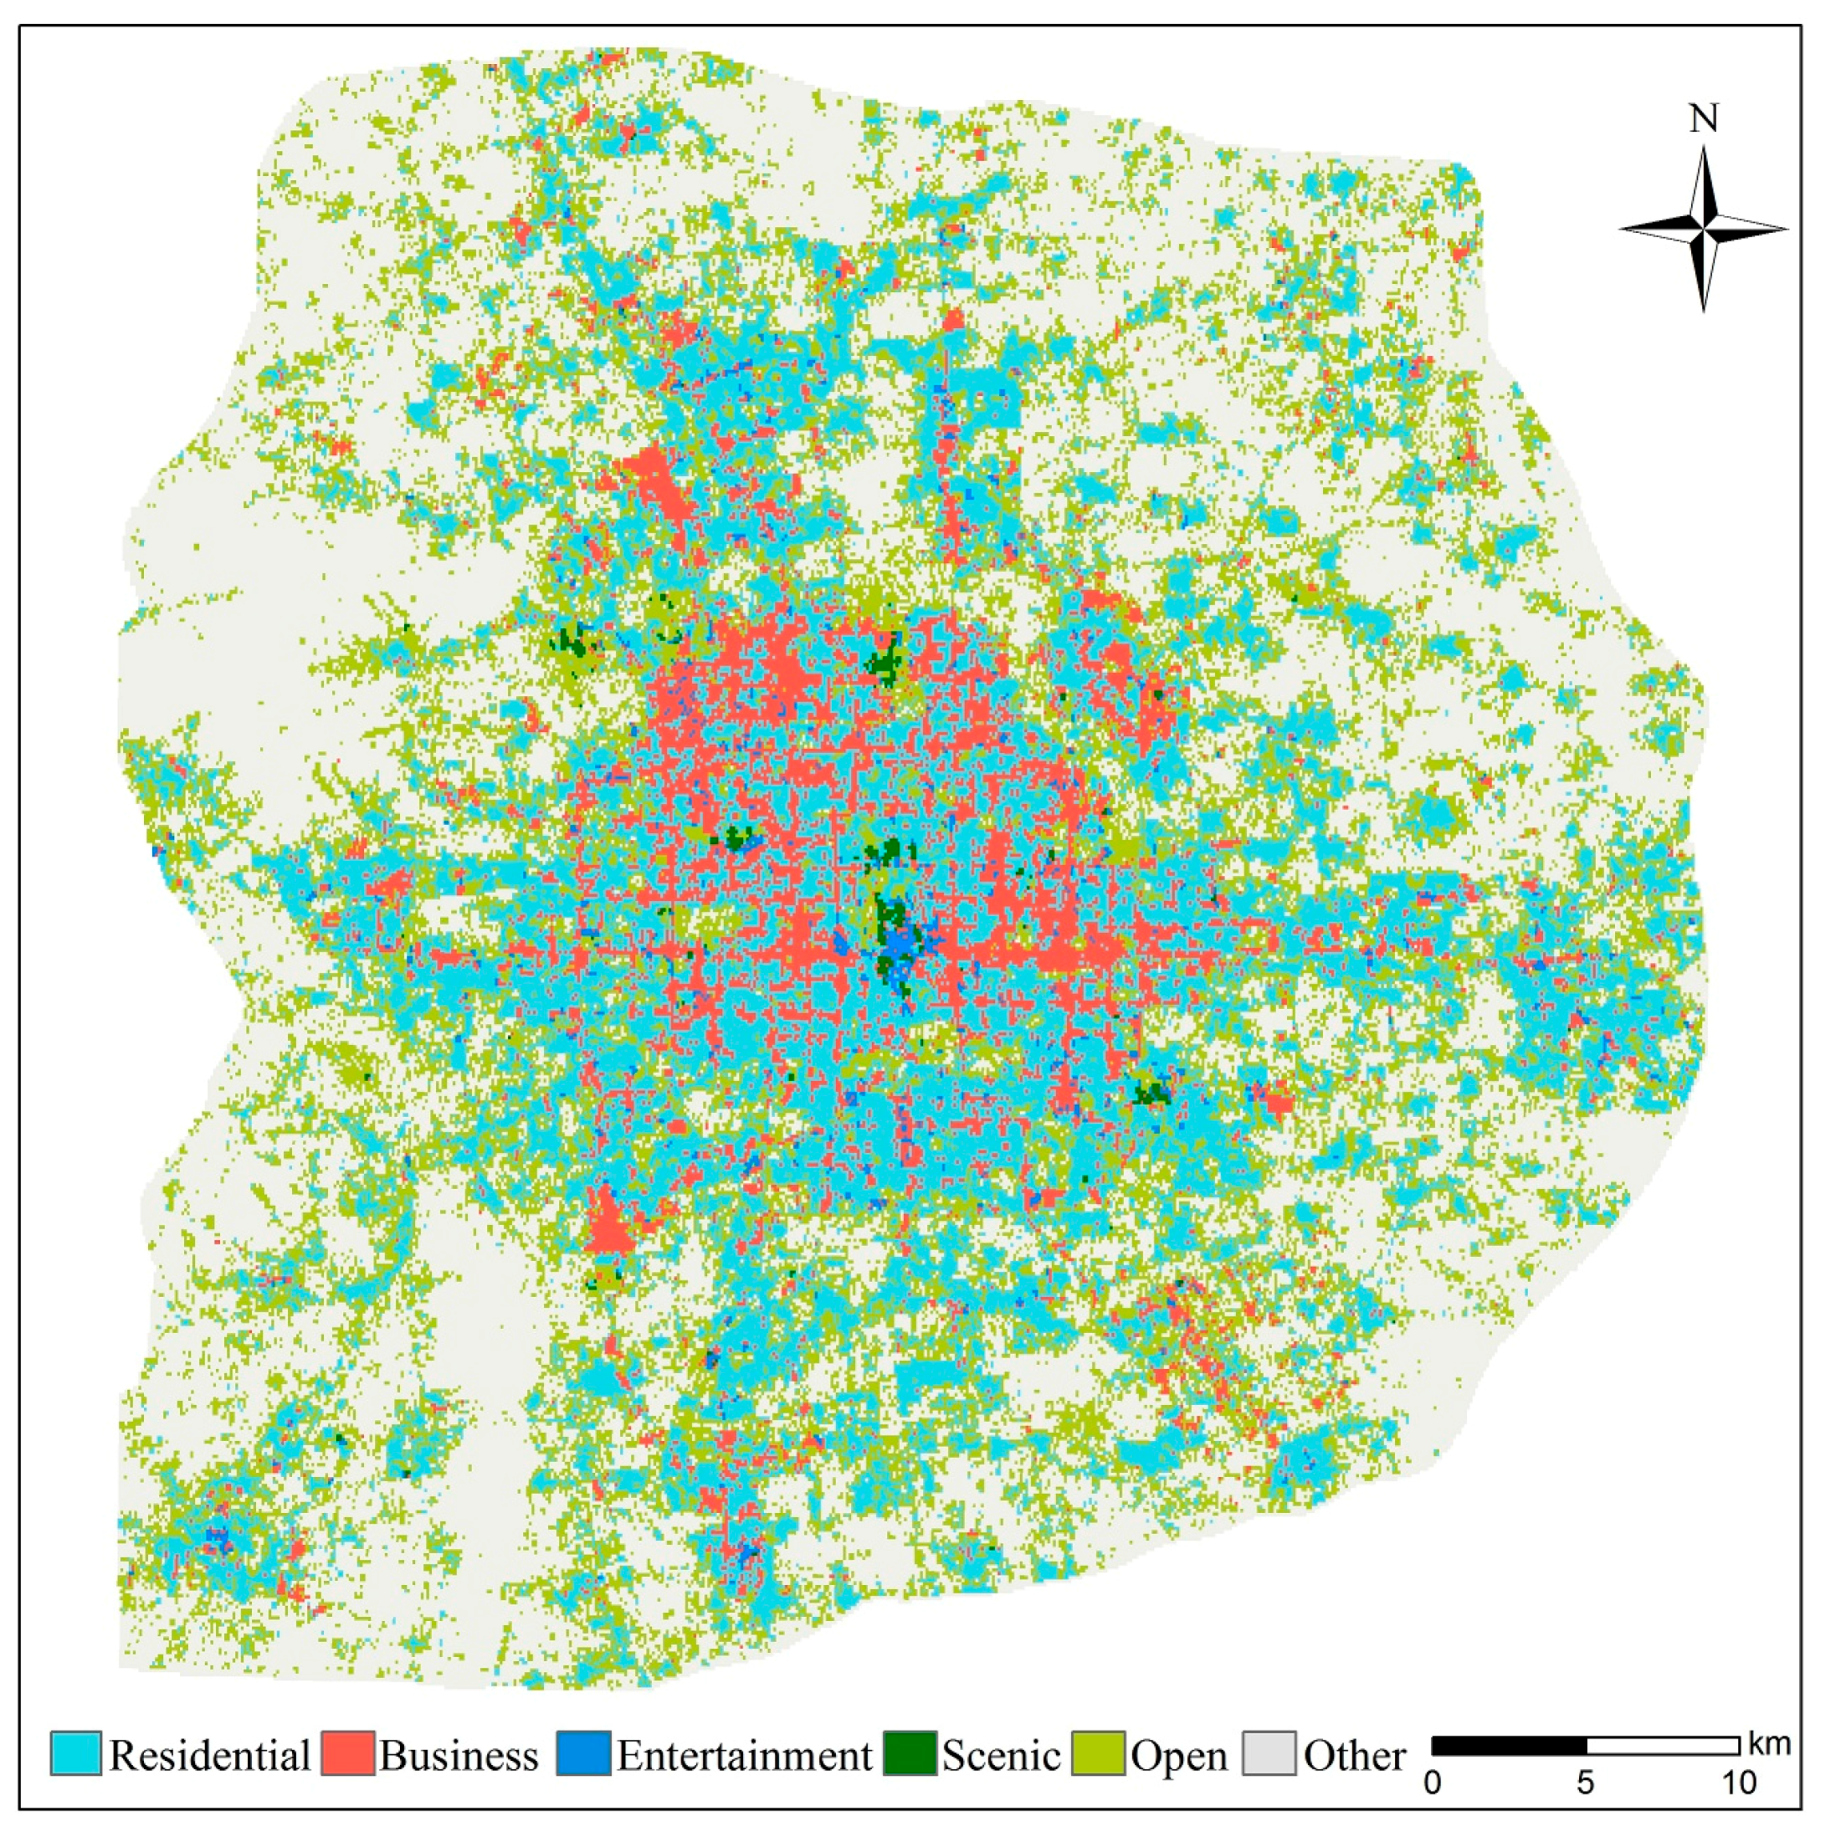
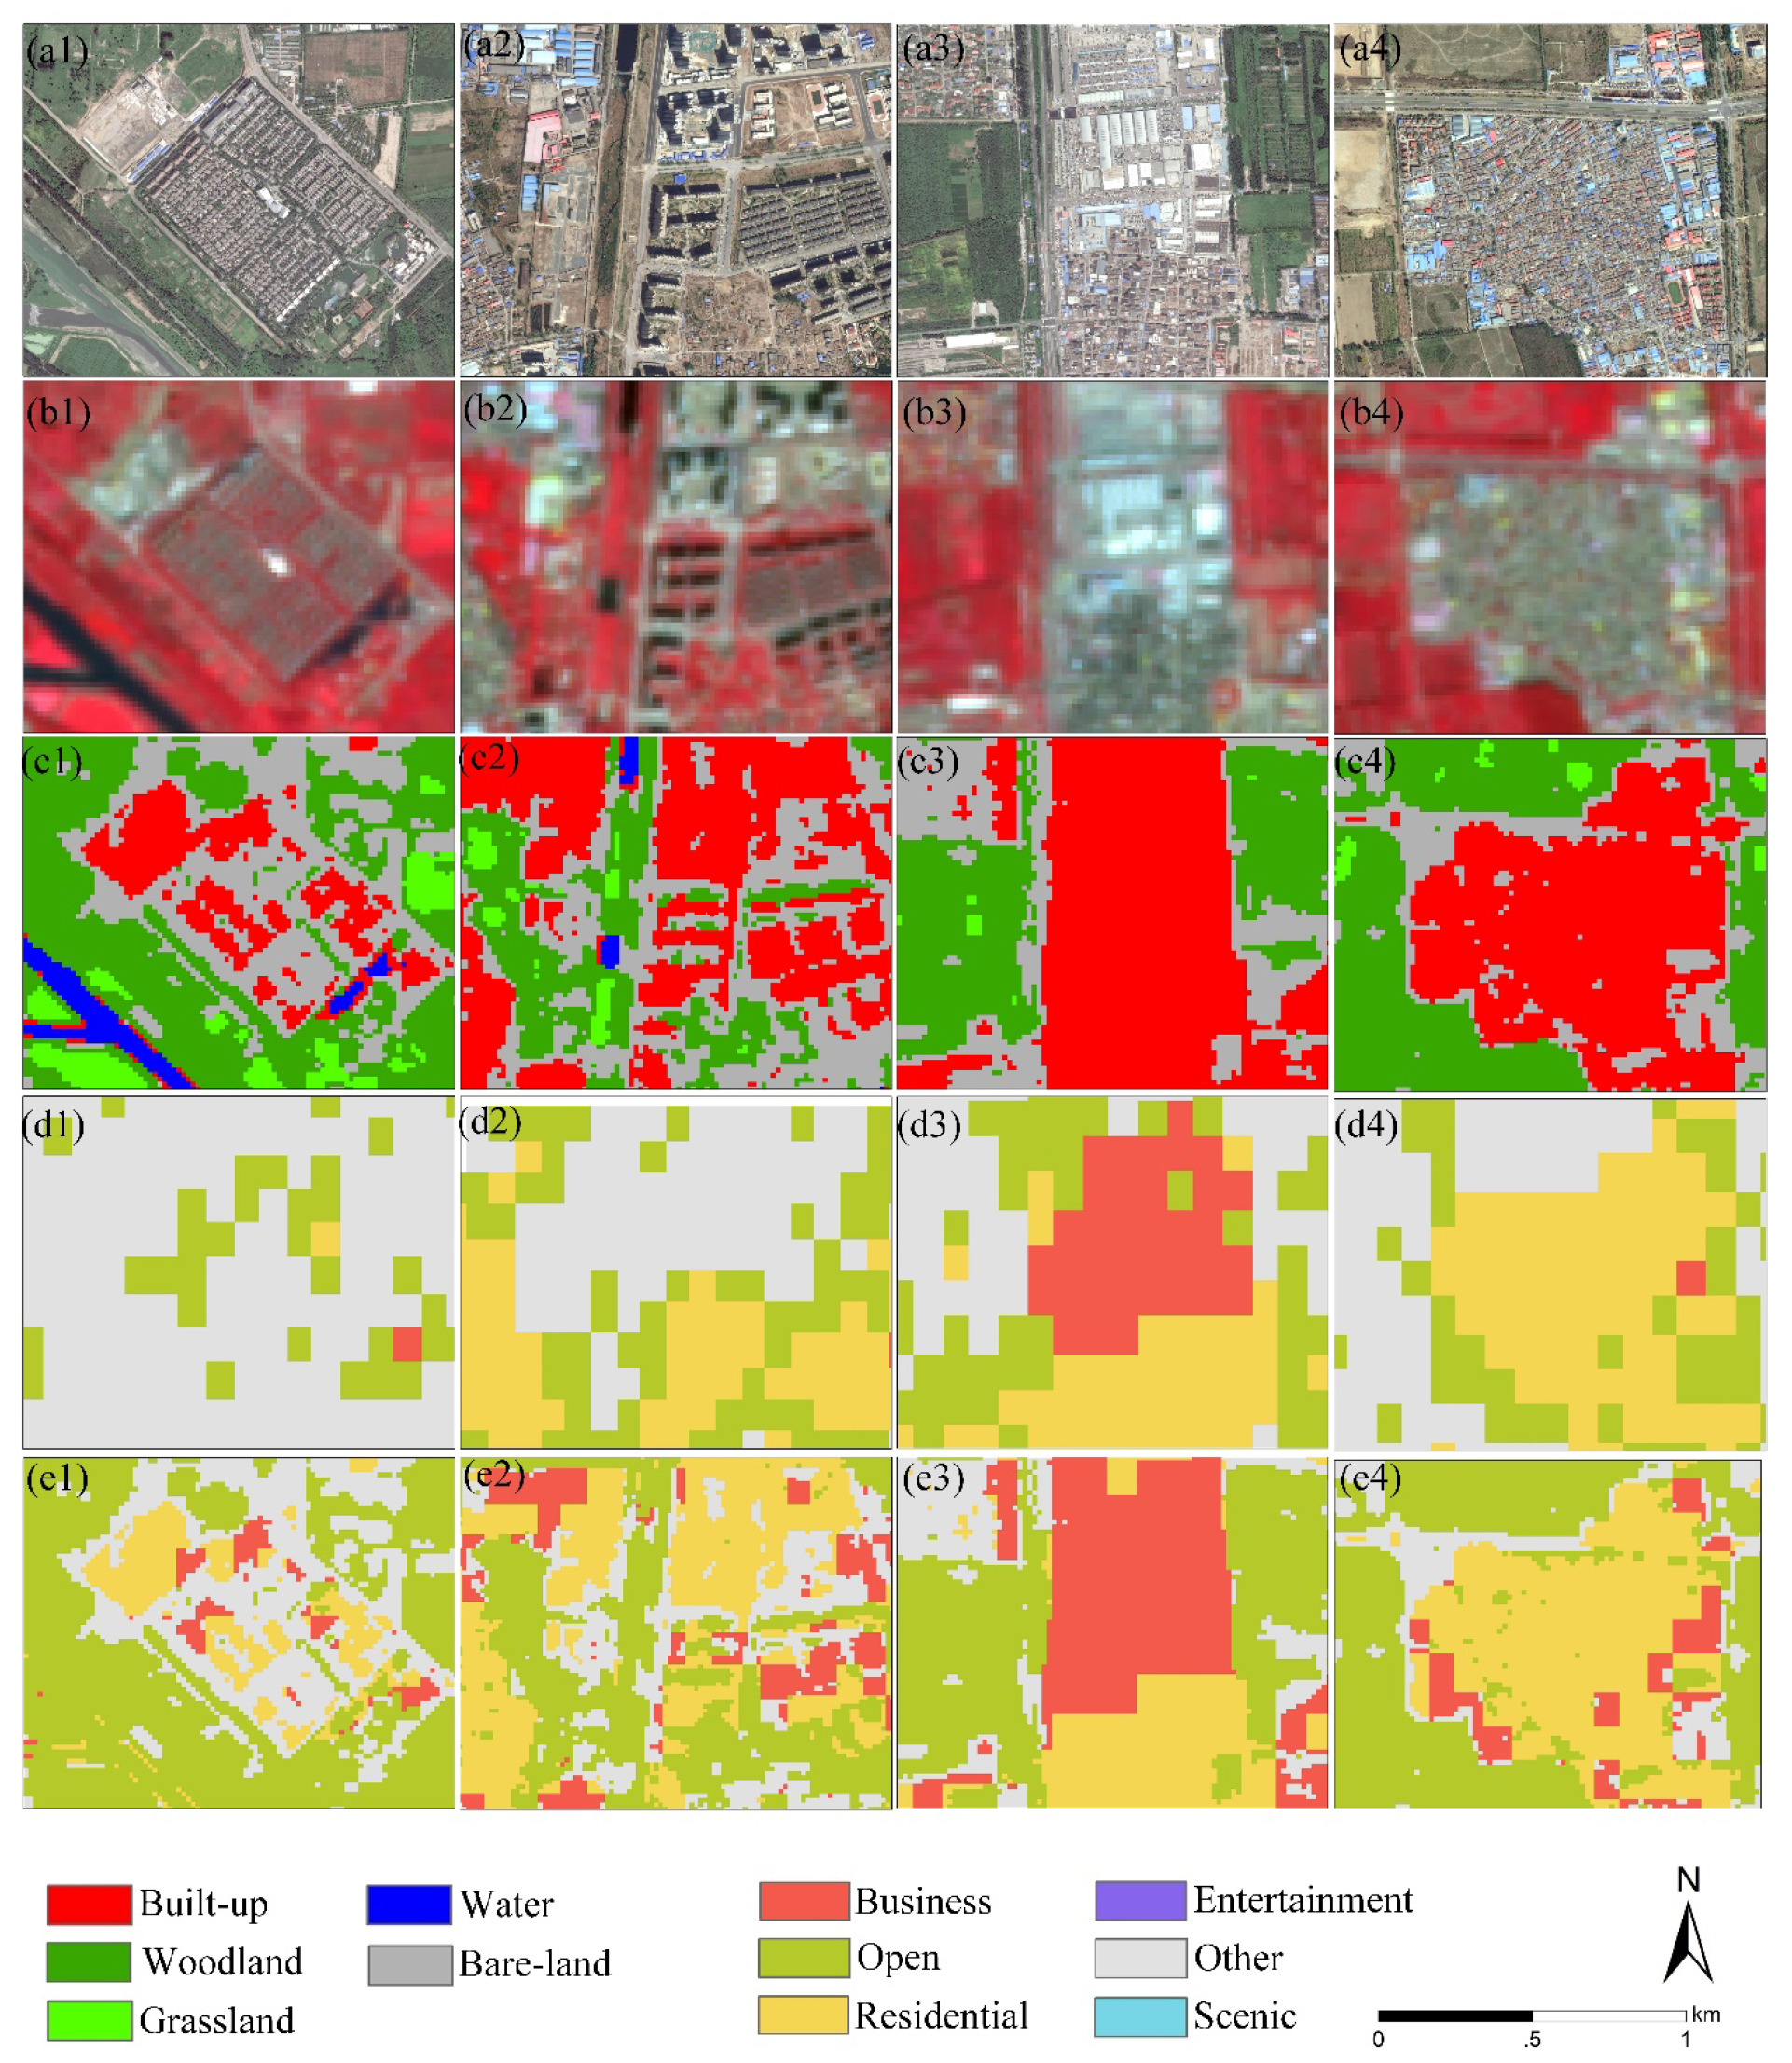
In addition to identifying traditional residential areas, the proposed method could also identify several low-density and suburban developments (shown in Figure 10). As it did for residential areas, the fusion method performs well in identifying both traditional urban working areas and suburban factory areas. Compared with the central urban area, human activity is weaker in suburban areas and low-density developments. The human mobility patterns in these areas could not be represented by the residential class, but they can be characterized by the open class in the MPPD-based land use map. Meanwhile, the built-up class is the land cover label assigned to these areas. With the help of the fusion strategy illustrated in Table 5, the labels of these areas are corrected. Additionally, several areas of suburban factories or warehouses are labeled as other in the MPPD-based land use map, because human activity is even weaker in these areas (shown in Figure 10). After integrating the MPPD-based land use map with the land cover map, the proposed method reclassifies these areas into the correct categories. The class-specific accuracy of open areas is increased significantly because of this reclassification.
Despite the improvement, several mixtures of business and residential areas remain in the fused land use map. The main reasons are that human mobility patterns in these areas blend the characteristics of business and residential, thus they could not be separated by the MPPD or land-cover information. The mixture could be divided into horizontal and vertical mixtures. For the horizontal mixture, in most scenarios, the land surface pattern could not be covered by a square pixel. Especially for MPPD, the spatial resolution is higher than that of the common widths and lengths of buildings. In addition to the horizontal mixture, in several multifunction apartments and working/residential factories, different patterns of activity of mobile phone users may occur in the same location at different elevations. The unique phenomenon of MPPD, that is different from the mixture of remote sensing data, is its vertical mixture for business and residential classes.
The work index is developed to distinguish business and entertainment in the proposed method. With the help of the work index, several shopping centers, such as Xidan Mall and Joy City, are recognized correctly. Nevertheless, for several universities and research institutes, the work index is insufficient to distinguish business from entertainment, because the population density during the weekends is almost the same as on workdays.
The WFV-based land cover map and the MPPD-based land use map are preliminary results used for the fused land use map. Therefore, the classification system of the preliminary results could affect the fused land use map. Based on the fusion strategy shown in Table 5, it is evident that the most important element of the land cover map is the built-up class. This is because it is the fundamental class for most land use types. Reasonably high PA of the built-up class is a prerequisite for the fused land use map. As shown in Figure 7, residential and business areas occupy most parts of the core city, while open areas are mostly around the periphery.
In addition to the classification system, the fusion strategy is another import factor in producing a land use map of the study area. As the physical and social characteristics are distinctive and related features for land use mapping, adopting decision fusion is a suitable choice [39]. Although the overall agreement of the fused land use map is 5.7% higher than that of the MPPD-based map, the decision fusion strategy is primitive and exploratory in relation to the combination of WFV data and MPPD. Developing an automatic and robust decision fusion method for land use mapping will be the focus of future work.
Although the MPPD data are suitable for land use mapping, they might be available only in China and quite limited in other countries in the world. Several alternative sources of social sensing data, including POIs [30], check-in data with location information [40,41], mobile phone data [25], and trajectory data [42], can then be applied to replace the MPPD data. A similar approach that fuses remote sensing and various social sensing data can be used to obtain a land use map. When fusion is performed, a key step is to aggregate the social data into a certain spatial unit, and different aggregation methods might be used for these various social sensing data [25,40,42,43]. For the POIs data, spatial distribution density of POIs by category is the prevalent way to express social features with a certain spatial unit [30]. For the check-in data, the amount of check-in data within a spatial unit should be aggregated according to the category and period [40]. For the mobile phone data, the volume density in spatial units is often aggregated via spatial interpolation according to the location and volume of base transceiver stations [25]. For the trajectory data, not only the volume of inflow and outflow of periods, but also the connections between places are factors that should be taken into consideration to aggregate the data [42]. These extracted social features can then be fused with the physical features derived from remote sensing data to produce the final land use map.

5.2. Spatial Pattern of User Activity

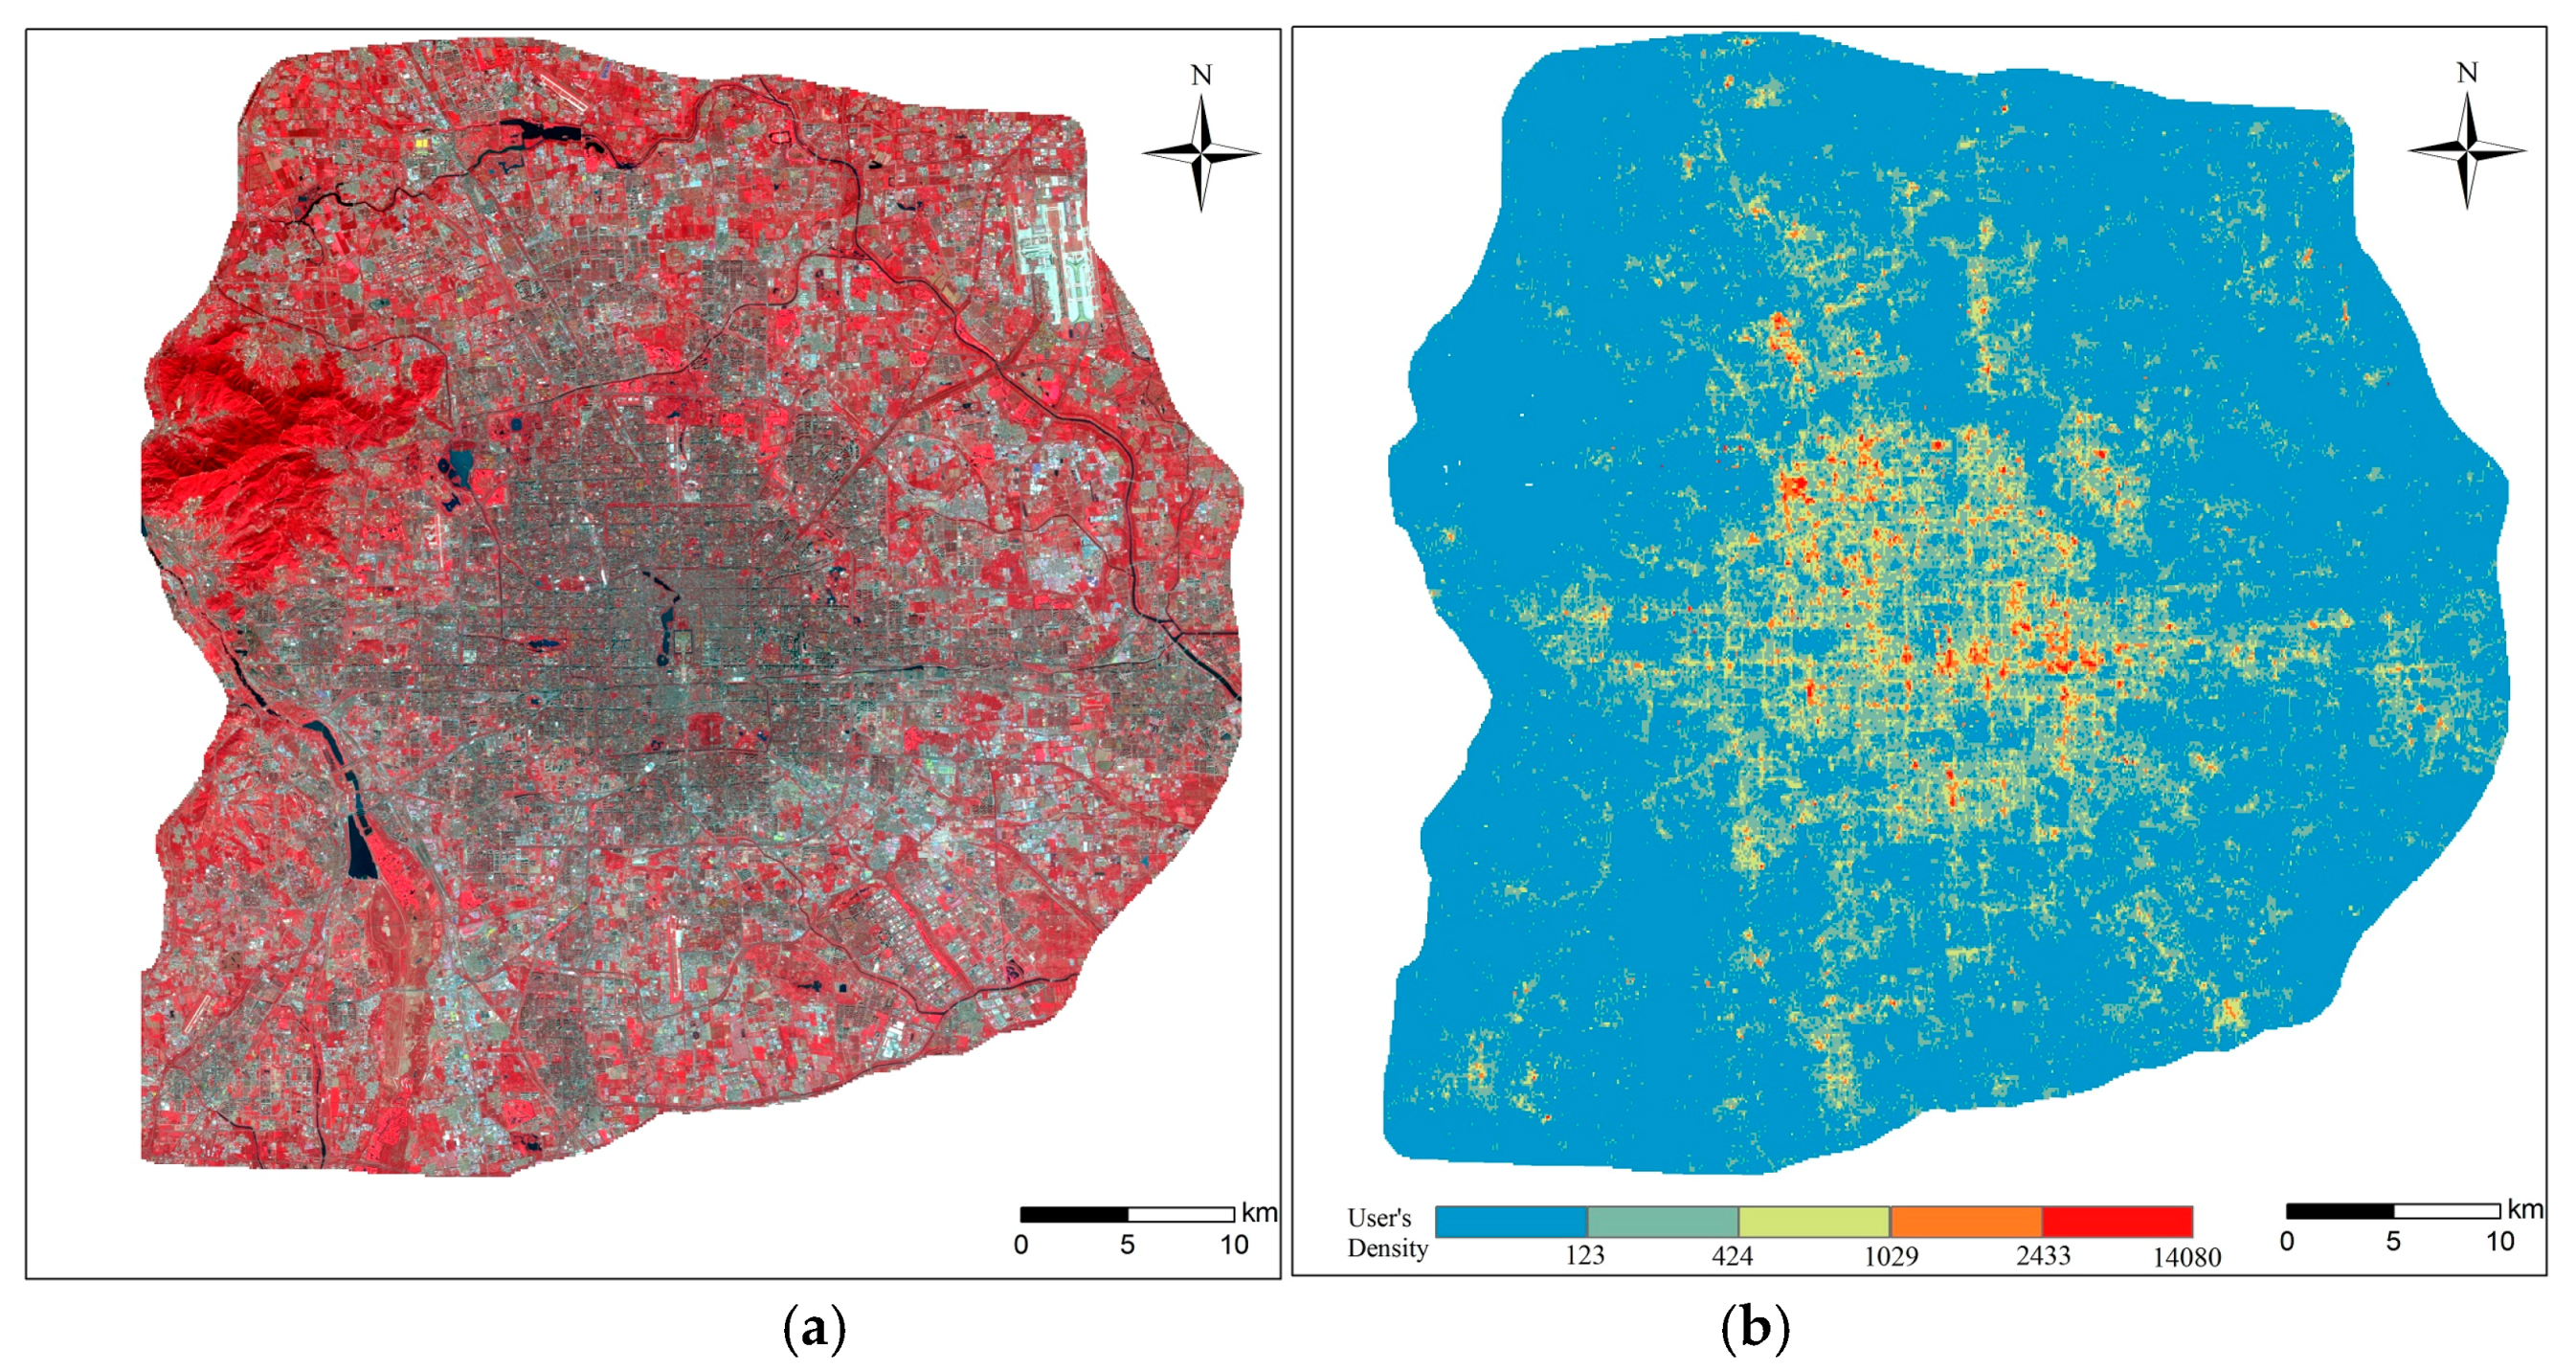
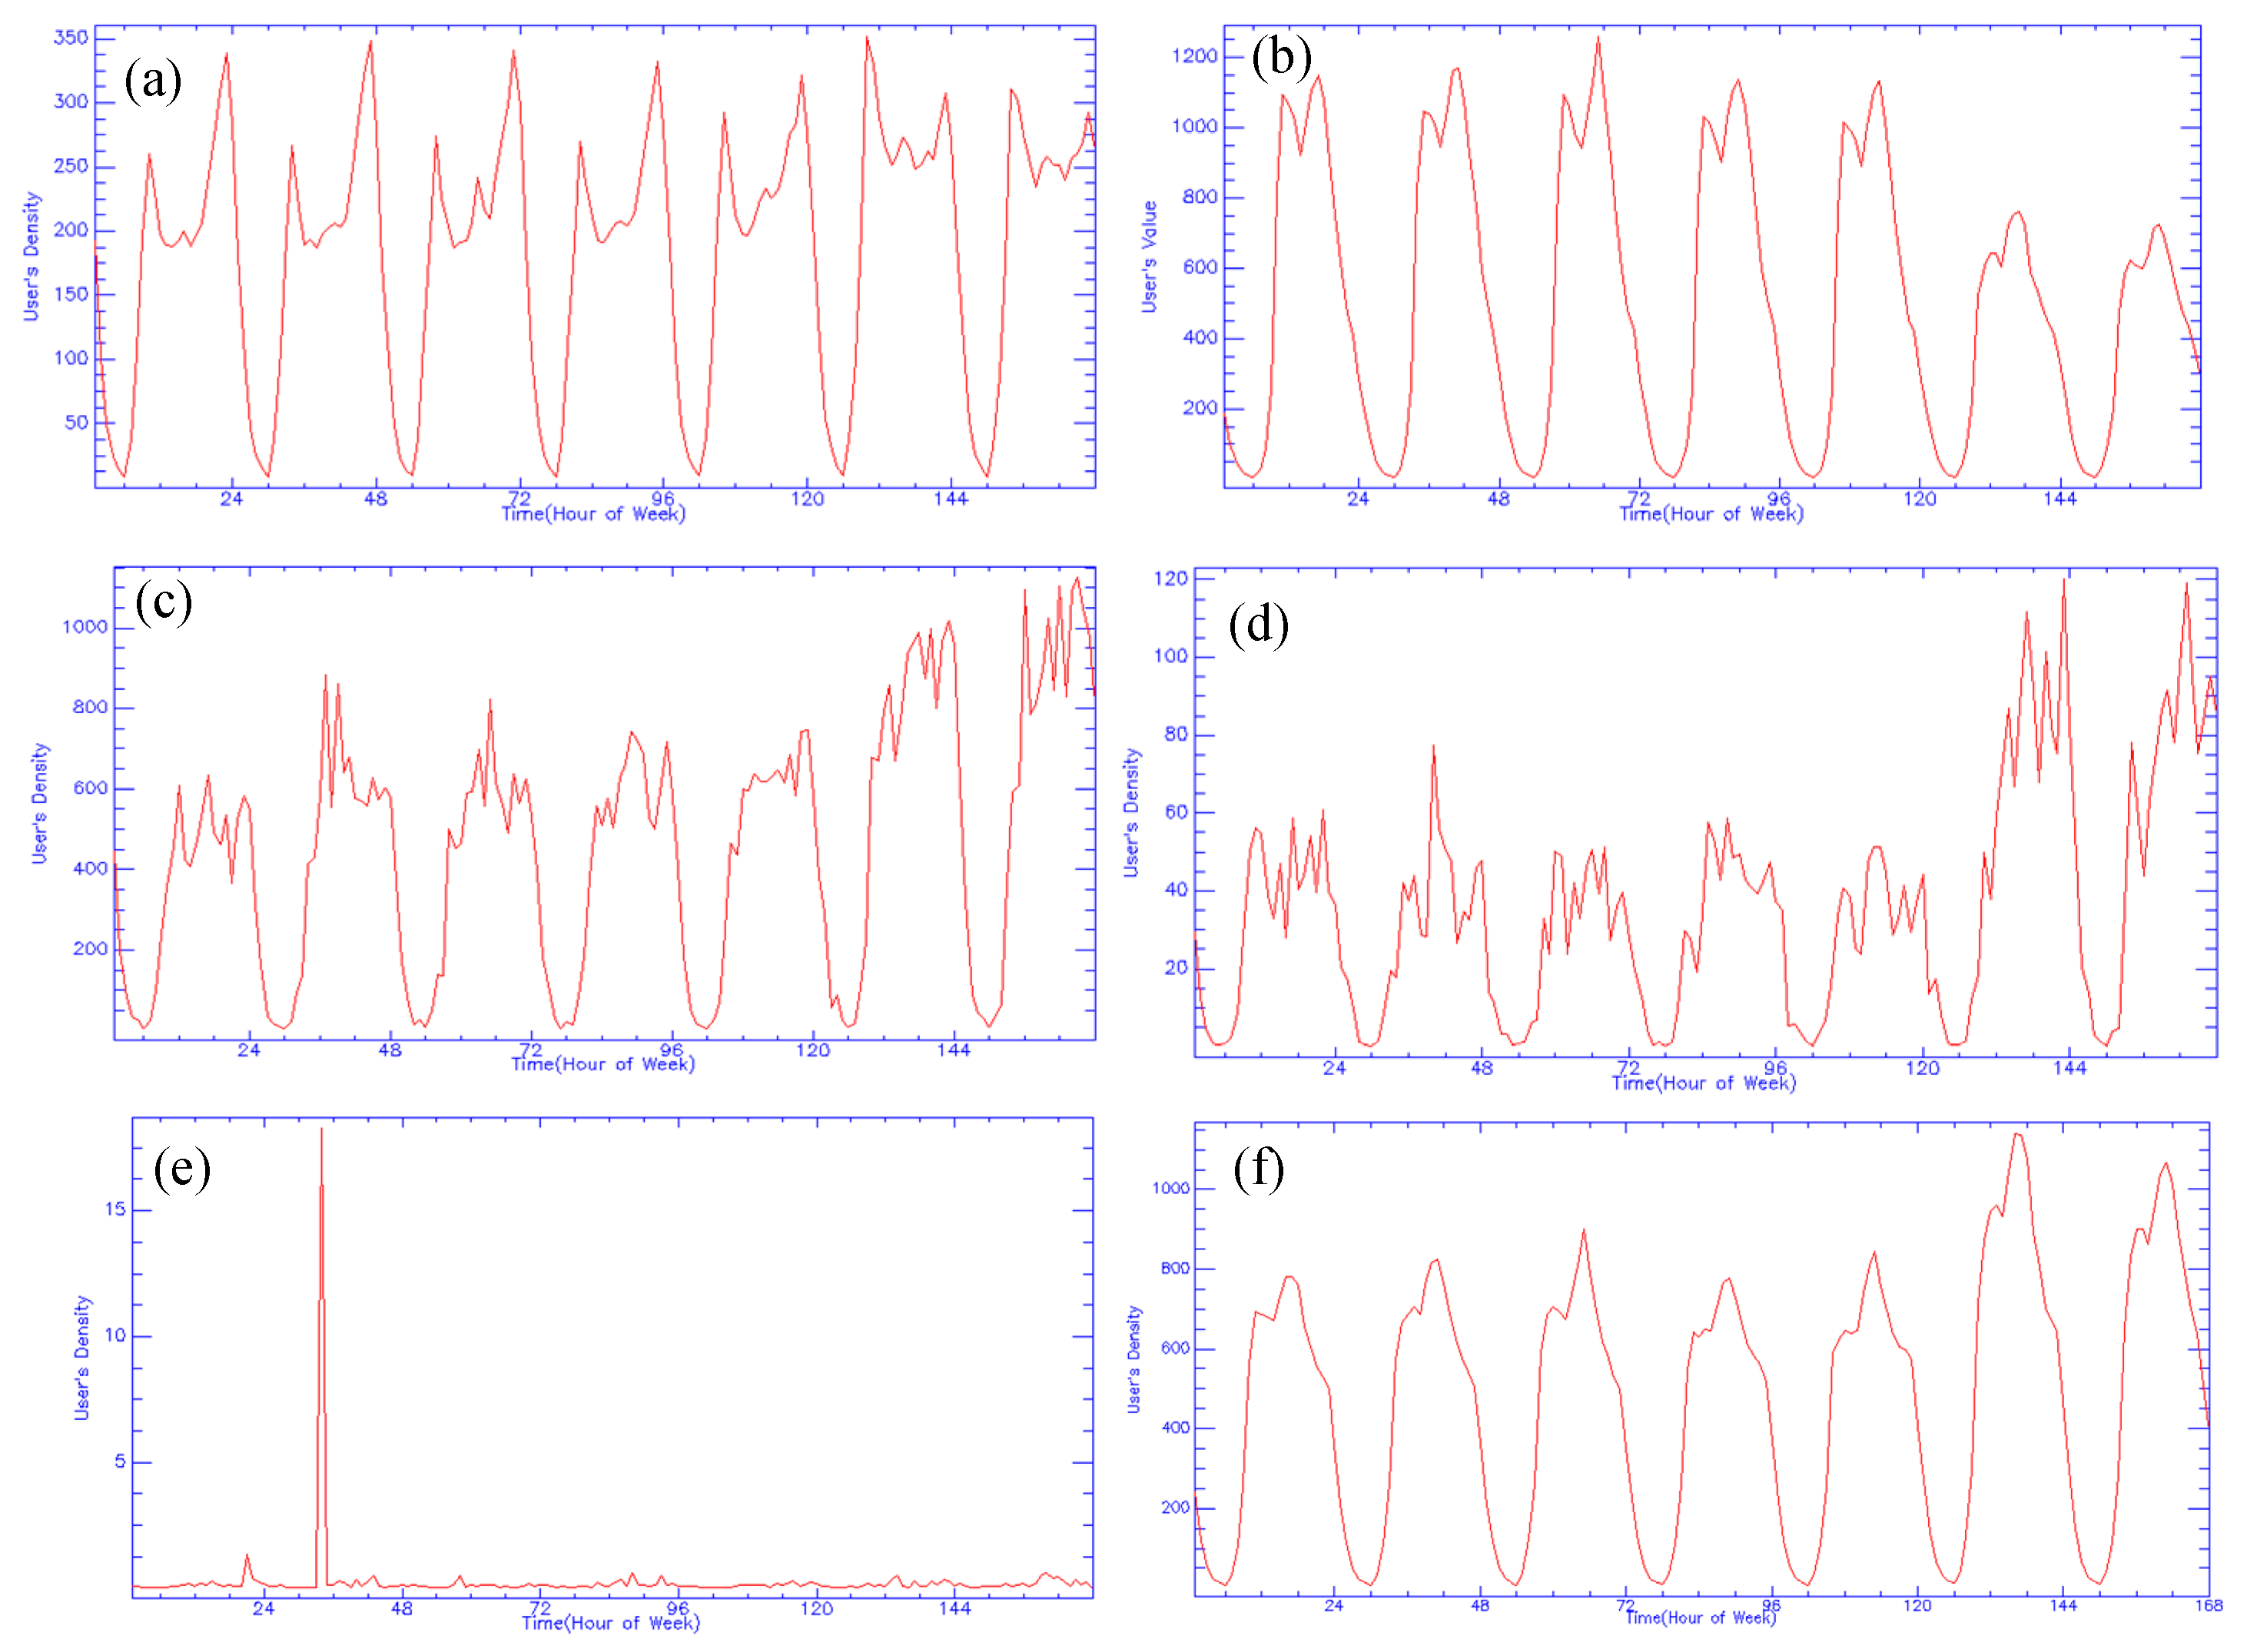
Land use is an important factor in reflecting the urban structure of the patterns of human activity. Analyzing human activity in some key areas during the daytime and nighttime is a useful way to depict where and how dense people work and live. Additionally, it is important in helping to make better urban plans on the basis of population mobility across different zones. In order to reveal the patterns of human activity in the main city, spatial statistics tools were adopted to analyze the user activity (user density) of different zones for the different classes. The five ring roads (2nd, 3rd, 4th, 5th, and 6th) were used to segment the main city into five zones: the inner-2nd-ring, 2nd-3rd-ring, 3rd-4th-ring, 4th-5th-ring, and 5th-6th-ring. As residential and business areas occupy most of the main city and are of critical importance for urban planning, we only analyzed the user activity of these two classes. The user activity of daytime was calculated by averaging the user density between 08:00 and 18:00 local time during workdays. The user activity of rest time was estimated by averaging the user density between 20:00 and 23:00 local time during workdays.
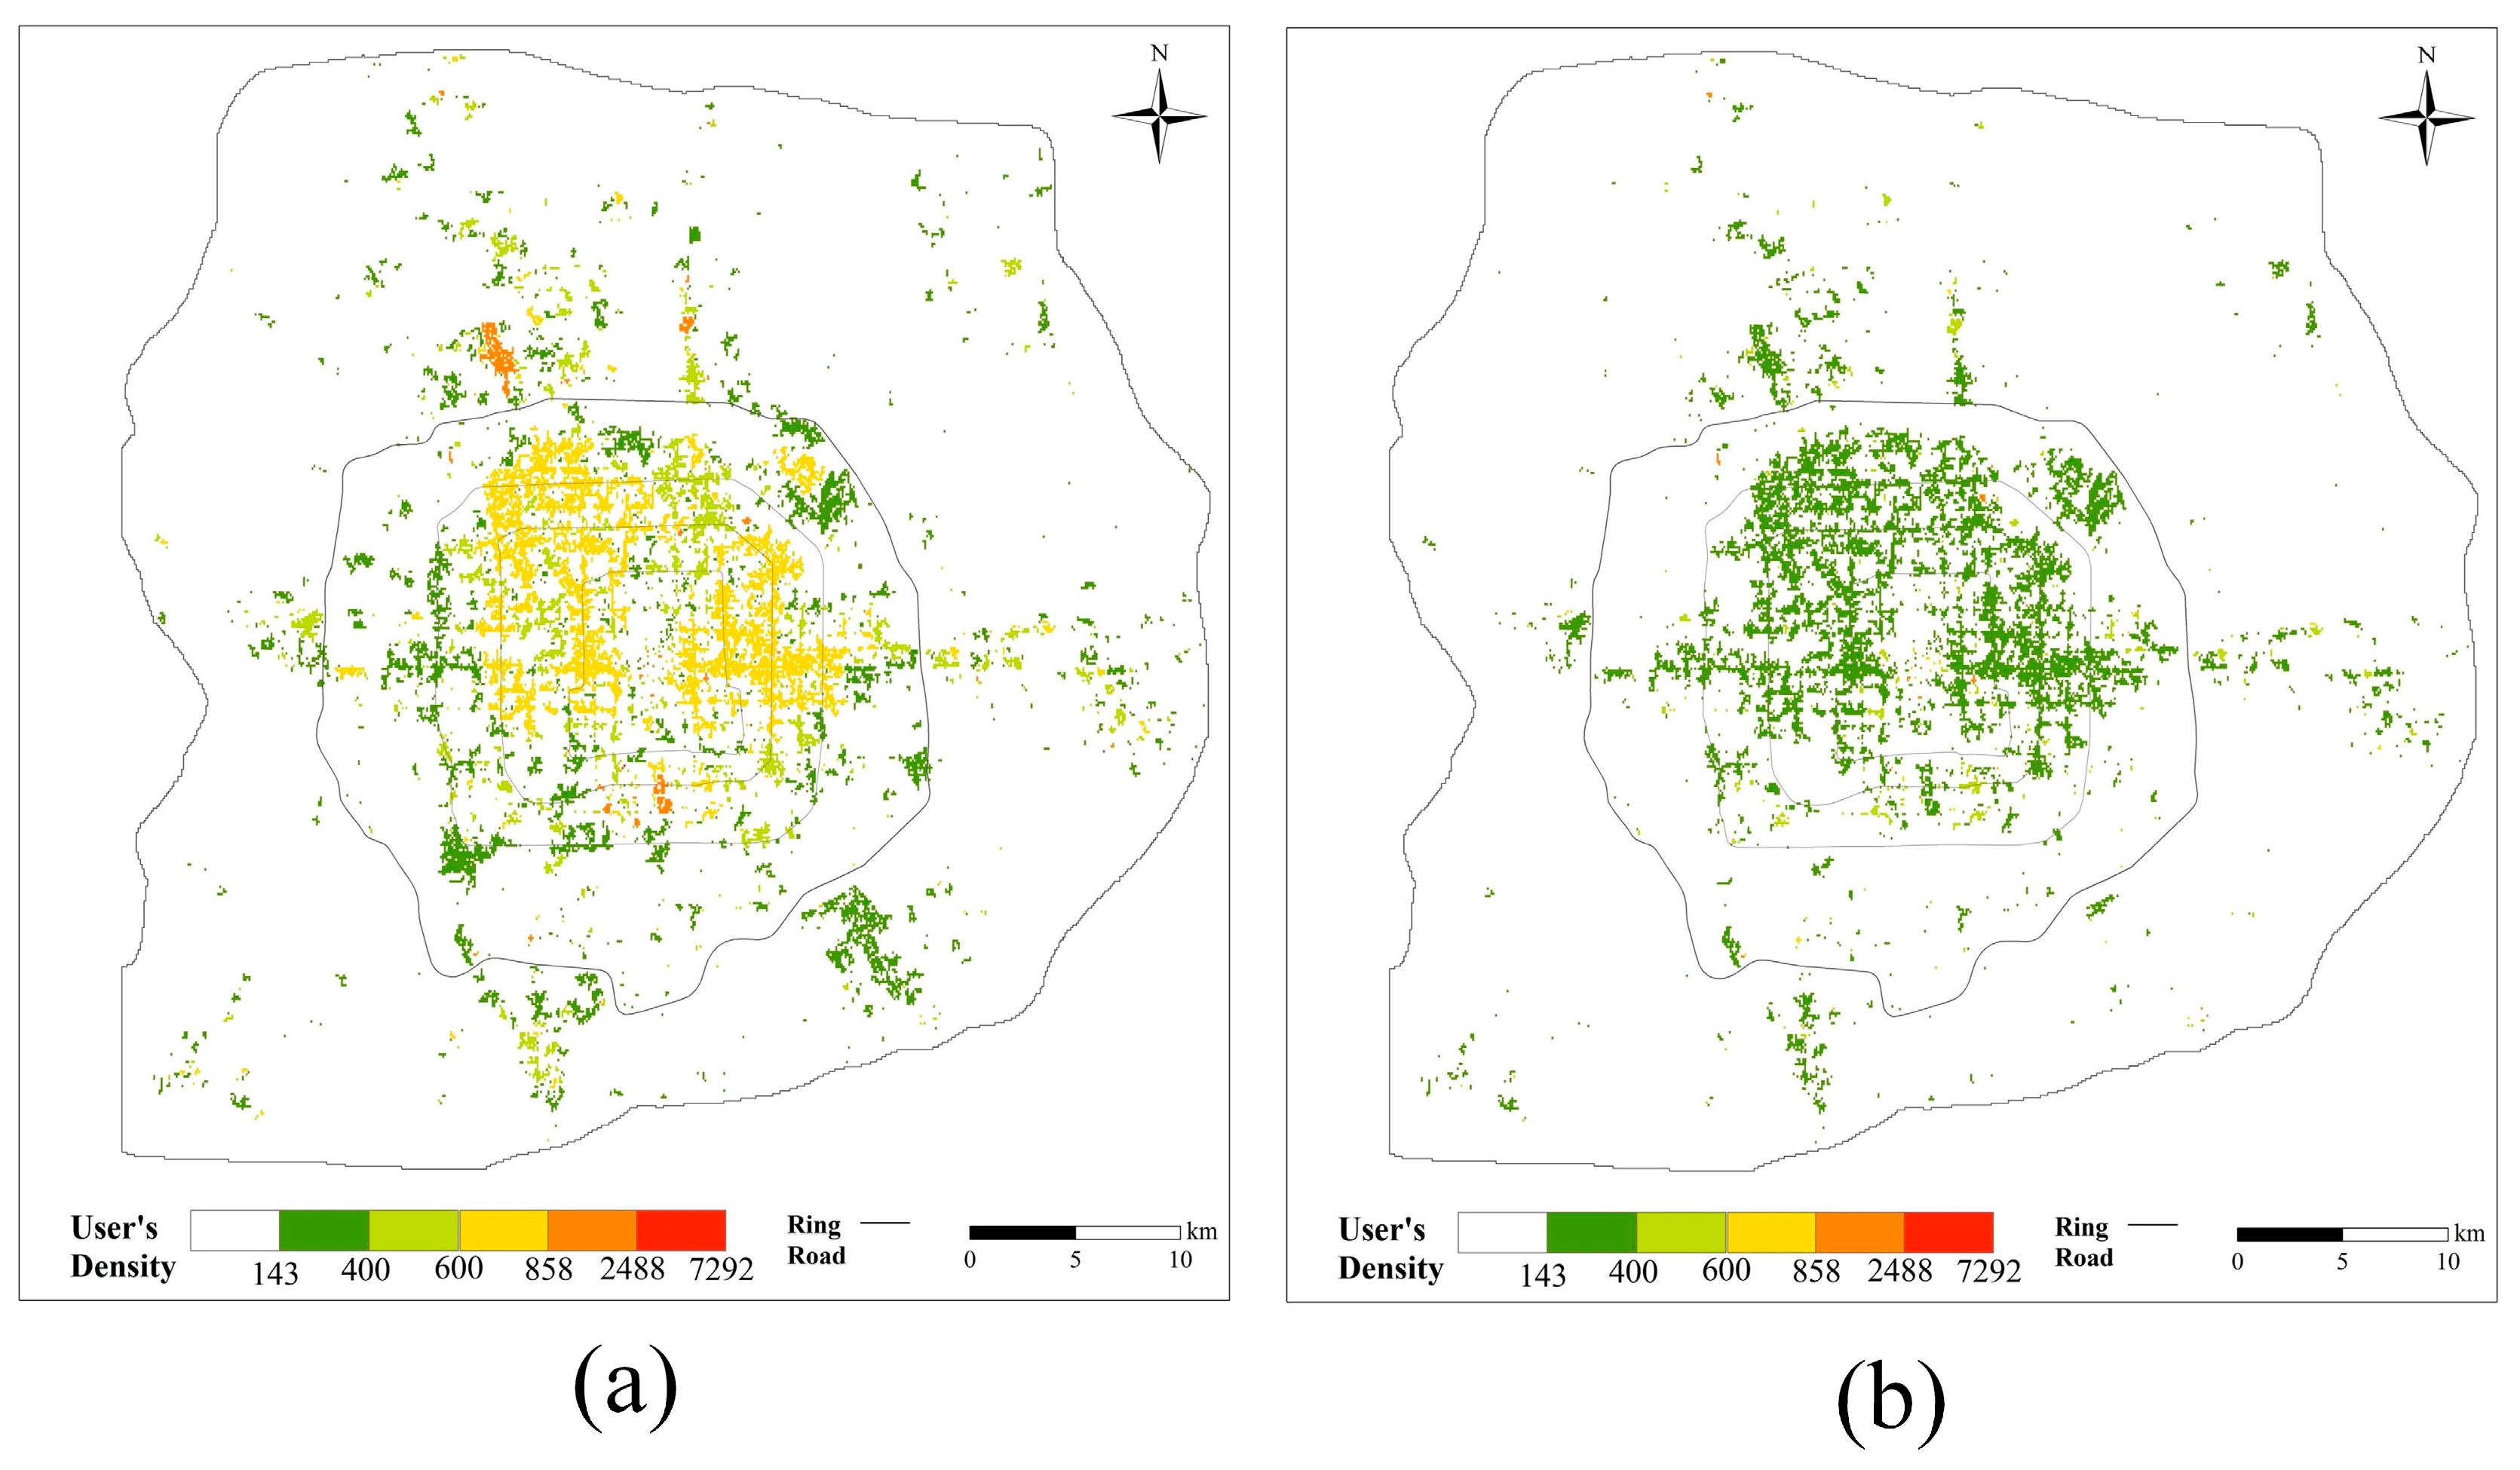
The spatial patterns of user activity for the business class during daytime and nighttime are shown in Figure 11a,b, respectively. It can be seen that during daytime, the main business area is in the 2nd-3rd-ring and the 3rd-4th-ring. However, the most active business area is located in the outer fringe, i.e., the Zhongguancun Software Park, where several notable IT companies (e.g., Baidu and Oracle) are located. During nighttime, the user activity of the entire city is similar, and it remained at a low level.
The flows of users of the five zones were calculated, and are summarized in Table 9. With regard to the total flow, the zones of the 4th-5th-ring, 3rd-4th-ring, and 2nd-3rd-ring had the highest influx of people from nighttime to daytime. With regard to the average flow of users, the 2nd-3rd-ring had the highest inflow, followed by the 3rd-4th-ring and the inner-2nd-ring.
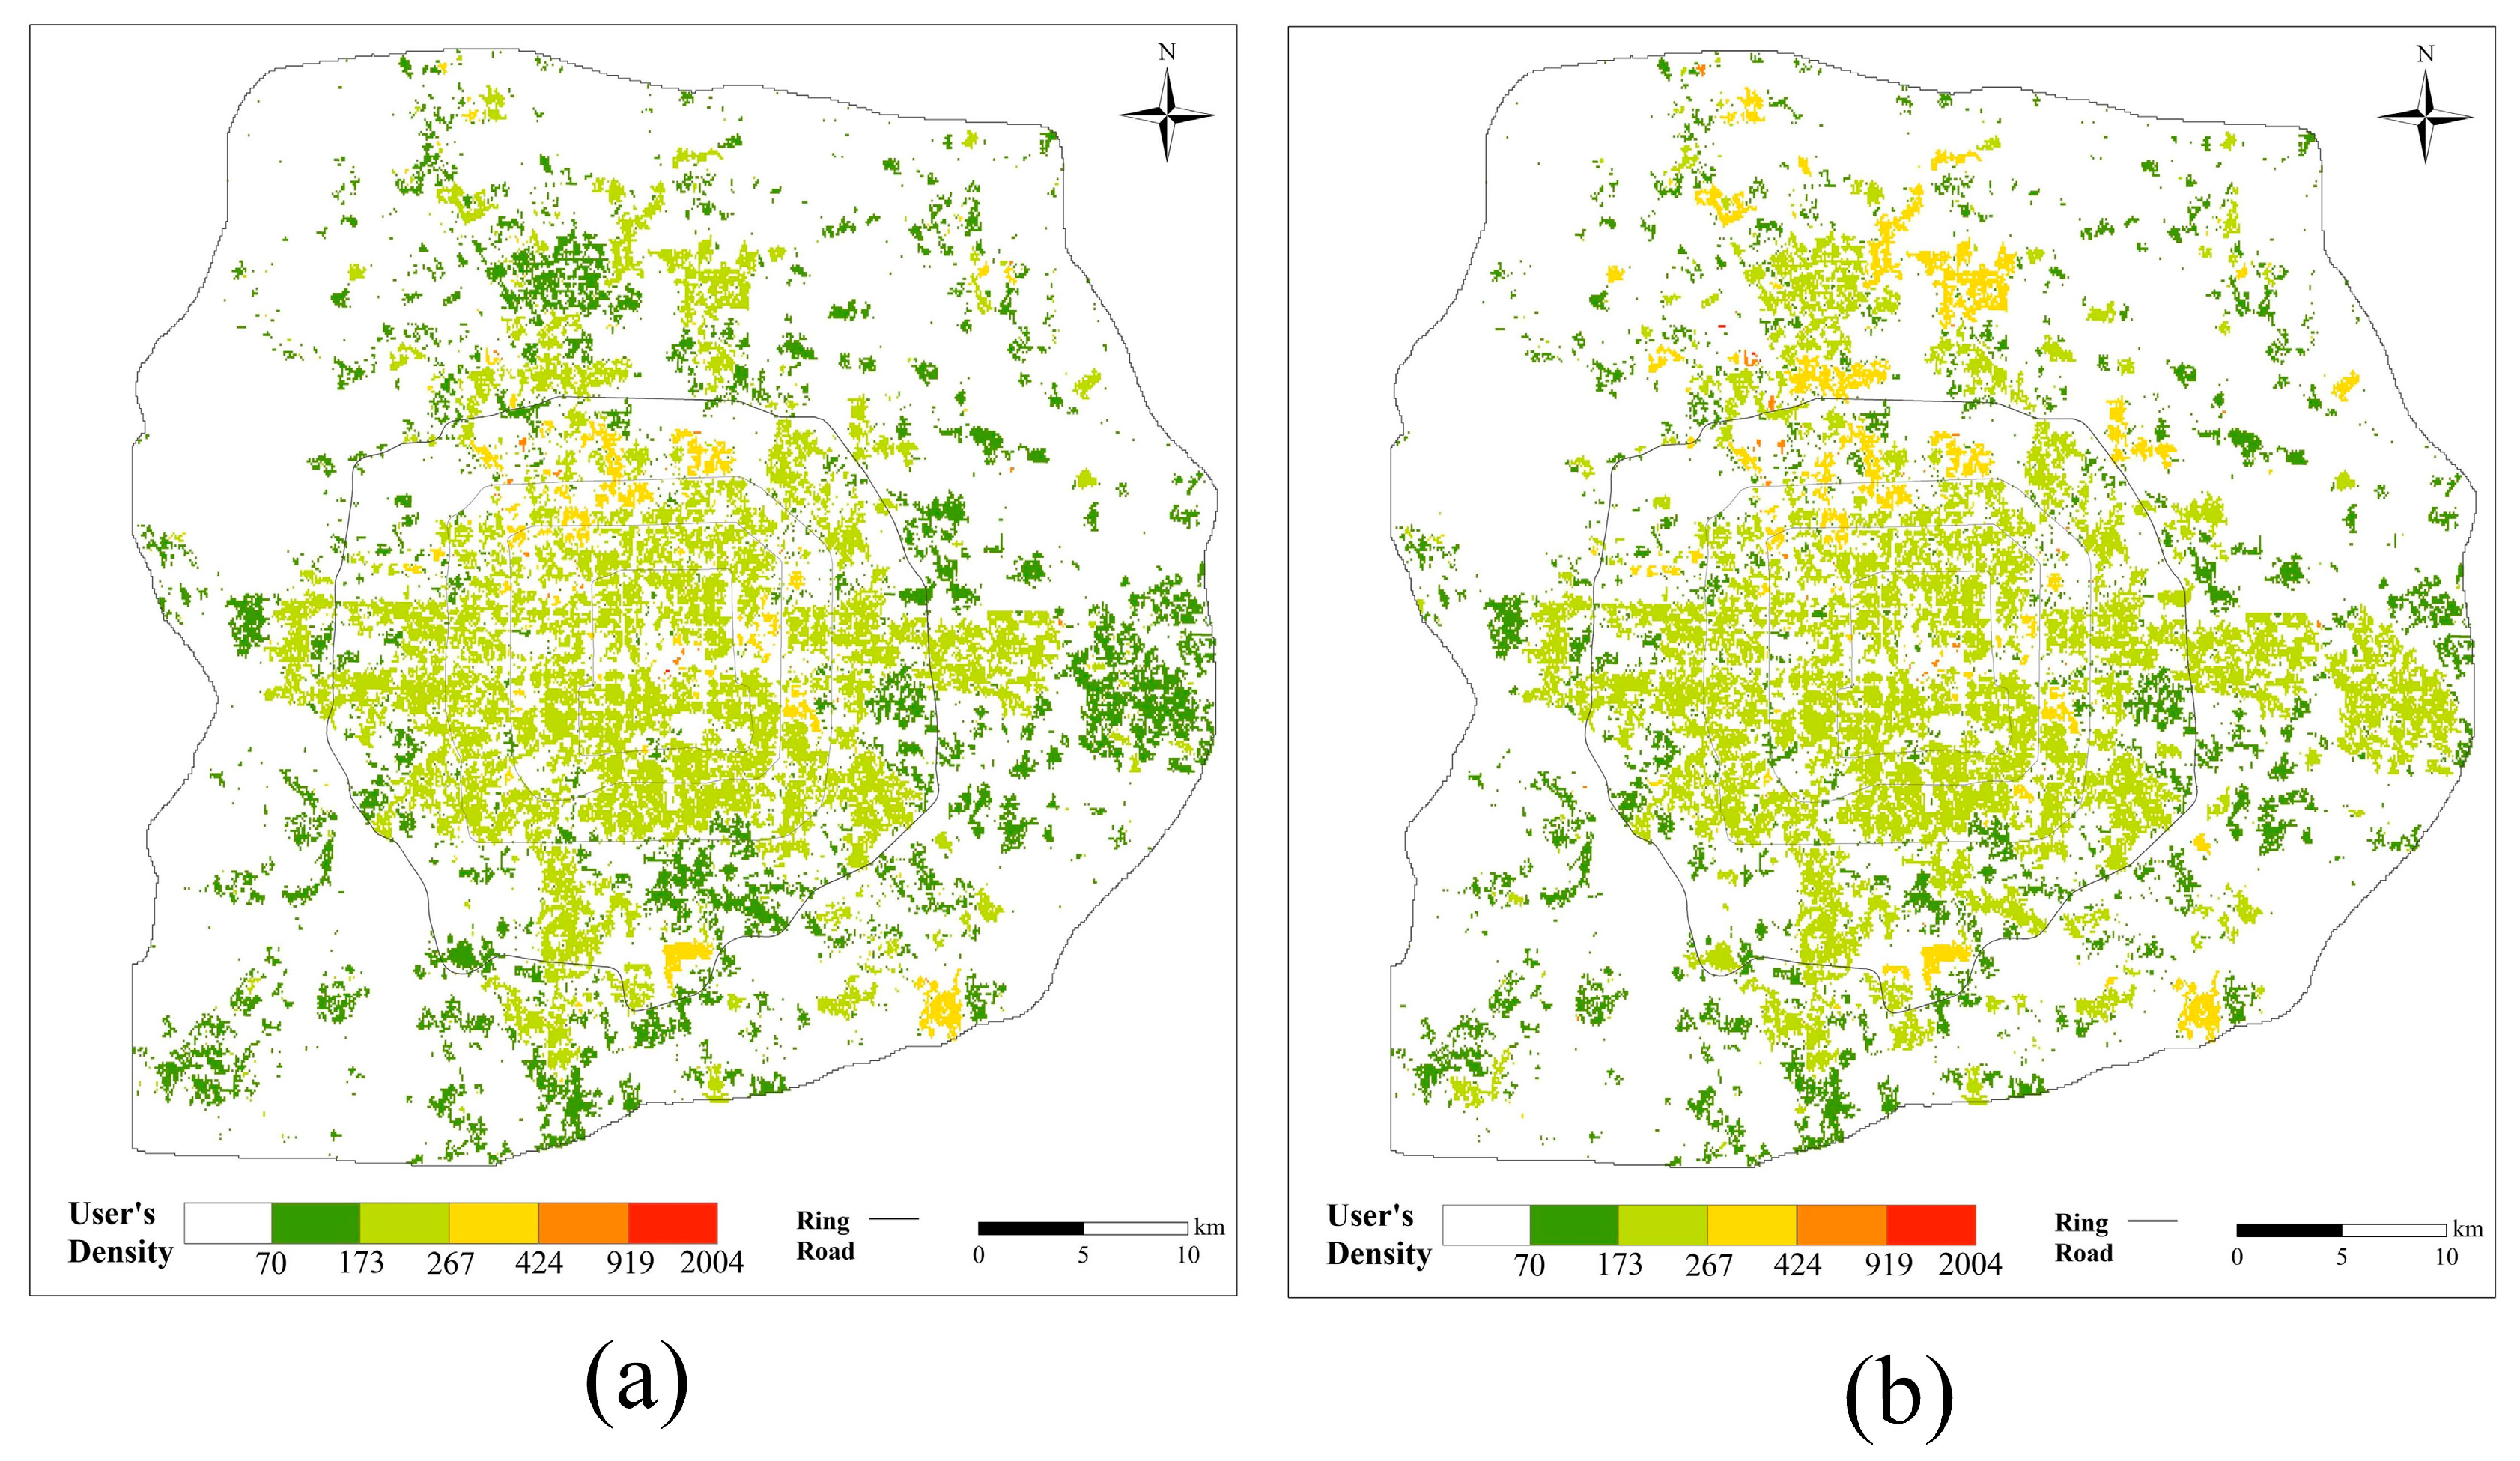
Similar to the business area, the spatial distribution of user activity for the residential class are presented in Figure 12 and Table 10, respectively. User activity during daytime and nighttime shows that user activity in residential areas within the 5th-ring remained stable. However, in the north and west of the city, user density had an obvious increase from daytime to nighttime.
The flows of user density show that the biggest total inflow from daytime to nighttime occurs in the 5th-6th-ring zone, although the average inflow of 5th-6th-ring zone is almost equal to that of the 4th-5th-ring. In addition, the totals and averages of the other three zones are negative, indicating that user activity in these areas decreased.

6. Conclusions

In this study, RSI and MPPD were jointly used to identify land use within the metropolitan area of Beijing. Specifically, an SVM classifier was applied to obtain a land cover map based on GF1 WFV data and a primitive urban land use map derived from hourly MPPD. A six-class land use map was produced by fusing the WFV-based land cover and the MPPD-based land use maps using a decision fusion strategy. Compared with the primitive land use map produced using only MPPD, the fused land use map had an obvious increase in OA, verifying that the proposed approach is a promising method for urban land use identification.
The spatial distributions of user activity of business and residential areas during daytime and nighttime were analyzed using spatial statistics tools. The results show that the main business areas are within the 5th Ring Road, and the most active business area is located in the outer fringe. In terms of the characteristics of flow of user density from nighttime to daytime, the highest total influx occurred in the 4th-5th-ring, 3rd-4th-ring, and 2nd-3rd-ring zones. The 2nd-3rd-ring zone had the biggest inflow, followed by the 3rd-4th-ring and the inner-2nd-ring. Different from the business area, user activity during daytime and nighttime in residential areas within the 5th Ring Road remained stable. In the north and west of the city, user density had an obvious increase from daytime to nighttime. The 5th-6th-ring zone had the biggest inflow from daytime to nighttime.

Acknowledgments

This work was supported by the National Natural Science Foundation for Distinguished Young Scholars of China (Grant No. 41725006), the National Science Foundation of China (Grant No. 41421001), and Key Programs of the National Science Foundation of China (Grant No. 41531174). The authors would like to thank all the data producers.

Author Contributions

Yuanxin Jia, Yong Ge, Jianghao Wang, and Xian Guo conceived of the main idea and designed and performed the experiments. The manuscript was written by Yuanxin Jia and improved by the contributions of all co-authors.

Conflicts of Interest

The authors declare no conflict of interest.

References

  1. Schneider, A.; Friedl, M.A.; McIver, D.K.; Woodcock, C.E. Mapping urban areas by fusing multiple sources of coarse resolution remotely sensed data. Photogramm. Eng. Remote Sens. 2003, 69, 1377–1386. [Google Scholar] [CrossRef]
  2. Liu, X.; Ma, L.; Li, X.; Ai, B.; Li, S.; He, Z. Simulating urban growth by integrating landscape expansion index (LEI) and cellular automata. Int. J. Geogr. Inf. Sci. 2014, 28, 148–163. [Google Scholar] [CrossRef]
  3. Shen, H.; Huang, L.; Zhang, L.; Wu, P.; Zeng, C. Long-term and fine-scale satellite monitoring of the urban heat island effect by the fusion of multi-temporal and multi-sensor remote sensed data: A 26-year case study of the city of Wuhan in China. Remote Sens. Environ. 2016, 172, 109–125. [Google Scholar] [CrossRef]
  4. Çolak, S.; Lima, A.; González, M.C. Understanding congested travel in urban areas. Nat. Commun. 2016, 7, 10793. [Google Scholar]
  5. Huang, X.; Liu, H.; Zhang, L. Spatiotemporal detection and analysis of urban villages in mega city regions of China using high-resolution remotely sensed imagery. IEEE Trans. Geosci. Remote Sens. 2015, 53, 3639–3657. [Google Scholar] [CrossRef]
  6. Pauleit, S.; Duhme, F. Assessing the environmental performance of land cover types for urban planning. Landsc. Urban Plan. 2000, 52, 1–20. [Google Scholar] [CrossRef]
  7. Sexton, J.O.; Song, X.-P.; Huang, C.; Channan, S.; Baker, M.E.; Townshend, J.R. Urban growth of the Washington, D.C.-Baltimore, metropolitan region from 1984 to 2010 by annual, Landsat-based estimates of imperivious cover. Remote Sens. Environ. 2013, 129, 42–53. [Google Scholar] [CrossRef]
  8. Schneider, A. Monitoring land cover change in urban and peri-urban areas using dense time stacks of Landsat satellite data and a data mining approach. Remote Sens. Environ. 2012, 124, 689–704. [Google Scholar] [CrossRef]
  9. Li, E.; Du, P.; Samat, A.; Xia, J.; Che, M. An automatic approach for urban land-cover classification from Landsat-8 OLI data. Int. J. Remote Sens. 2015, 36, 5983–6007. [Google Scholar] [CrossRef]
  10. Gong, P.; Howarth, P.J. The use of structural information for improving land-cover classification accuracies at the rural-urban fringe. Photogramm. Eng. Remote Sens. 1990, 56, 67–73. [Google Scholar]
  11. Herold, M.; Scepan, J.; Clarke, K.C. The use of remote sensing and landscape metrics to describe structures and changes in urban land uses. Environ. Plan. A 2002, 34, 1443–1458. [Google Scholar] [CrossRef]
  12. Voltersen, M.; Berger, C.; Hese, S.; Schmullius, C. Object-based land cover mapping and comprehensive feature calculation for an automated derivation of urban structure types at block level. Remote Sens. Environ. 2014, 154, 192–201. [Google Scholar] [CrossRef]
  13. Agüera, F.; Aguilar, F.J.; Aguilar, M.A. Using texture analysis to improve per-pixel classification of very high resolution images for mapping plastic greenhouses. ISPRS J. Photogramm. Remote Sens. 2008, 63, 635–646. [Google Scholar] [CrossRef]
  14. Zhang, C.; Pan, X.; Li, H.; Gardiner, A.; Sargent, I.; Hare, J.; Atkinson, P.M. A hybrid MLP-CNN classifier for very fine resolution remotely sensed image classification. ISPRS J. Photogramm. Remote Sens. 2017. [Google Scholar] [CrossRef]
  15. Pingel, T.J.; Clarke, K.C.; McBride, W.A. An improved simple morphological filter for the terrain classification of airborne LIDAR data. ISPRS J. Photogramm. Remote Sens. 2013, 2013, 21–30. [Google Scholar] [CrossRef]
  16. Huang, X.; Zhang, L.; Li, P. Classification and extraction of spatial features in urban areas using high-resolution multispectral imagery. IEEE Geosci. Remote Sens. Lett. 2007, 4, 260–264. [Google Scholar] [CrossRef]
  17. Li, M.; Stein, A.; Bijker, W.; Zhan, Q. Urban land use extraction from very high resolution remote sensing images using a Bayesian network. ISPRS J. Photogramm. Remote Sens. 2016, 122, 192–205. [Google Scholar] [CrossRef]
  18. Herold, M.; Liu, X.; Clarke, K.C. Spatial metrics and image texture for mapping urban land use. Photogramm. Eng. Remote Sens. 2003, 69, 991–2001. [Google Scholar] [CrossRef]
  19. Walde, I.; Hese, S.; Berger, C.; Schmullius, C. From land cover-graphs to urban structure types. Int. J. Geogr. Inf. Sci. 2014, 28, 584–609. [Google Scholar] [CrossRef]
  20. Zhang, X.; Du, S.; Wang, Y.-C. Semantic classification of heterogeneous urban scenes using intrascene feature similarity and interscene semantic dependency. IEEE J.-STARS 2015, 8, 2005–2014. [Google Scholar] [CrossRef]
  21. Zhong, Y.; Zhu, Q.; Zhang, L. Scene classification based on the multifeature fusion probabilistic topic model for high spatial resolution remote sensing imagery. IEEE Trans. Geosci. Remote Sens. 2015, 53, 6207–6222. [Google Scholar] [CrossRef]
  22. Zhao, W.; Du, S. Learning multiscale and deep representations for classifying remotely sensed imagery. ISPRS J. Photogramm. Remote Sens. 2016, 113, 155–165. [Google Scholar] [CrossRef]
  23. Wu, S.S.; Qiu, X.; Usery, E.L.; Wang, L. Using geometrical, textural, and contextual information of land parcels for classification of detailed urban land use. Ann. Assoc. Am. Geogr. 2009, 99, 76–98. [Google Scholar] [CrossRef]
  24. Hu, S.; Wang, L. Automated urban land-use classification with remote sensing. Int. J. Remote Sens. 2013, 34, 790–803. [Google Scholar] [CrossRef]
  25. Pei, T.; Sobolevsky, S.; Ratti, C.; Shaw, S.-L.; Li, T.; Zhou, C. A new insight into land use classification based on aggregated mobile phone data. Int. J. Geogr. Inf. Sci. 2014, 28, 1988–2007. [Google Scholar] [CrossRef]
  26. Yuan, J.; Zheng, Y.; Xie, X. Discovering Regions of Different Functions in a City Using Human Mobility and POIs. In Proceedings of the 18th ACM SIGKDD Conference on Knowledge Discovery and Data Mining (KDD’12), Beijing, China, 12–16 August 2012; pp. 186–194. [Google Scholar]
  27. Fan, Z.; Song, X.; Shibasaki, R. Cityspectrum: A non-negative tensor factorization approach. In Proceedings of the 2014 ACM International Joint Conference on Pervasive and Ubiquitous Computing, Seattle, WA, USA, 13–17 September 2014; pp. 213–223. [Google Scholar]
  28. Yao, Y.; Li, X.; Liu, X.; Liu, P.; Liang, Z.; Zhang, J.; Mai, K. Sensing spatial distribution of urban land use by integrating points-of-interest and Google Word2Vec model. Int. J. Geogr. Inf. Sci. 2017, 31, 825–848. [Google Scholar] [CrossRef]
  29. Hu, T.; Yang, J.; Li, X.; Gong, P. Mapping urban land use by using Landsat images and open social data. Remote Sens. 2016, 8, 151. [Google Scholar] [CrossRef]
  30. Liu, X.; He, J.; Yao, Y.; Zhang, J.; Liang, H.; Wang, H.; Hong, Y. Classifying urban land use by integrating remote sensing and social media data. Int. J. Geogr. Inf. Sci. 2017, 31, 1675–1696. [Google Scholar] [CrossRef]
  31. Bureau, B.M.S. Beijing Statistical Yearbook 2016; China Statistics Press: Beijing, China, 2016. [Google Scholar]
  32. He, C.; Okada, N.; Zhang, Q.; Shi, P.; Zhang, J. Modeling urban expansion scenarios by coupling cellular automata model and system dynamic model in Beijing, China. Appl. Geogr. 2006, 26, 323–345. [Google Scholar] [CrossRef]
  33. Huang, D.; Lv, C. Spaital evoltion character of population in Beijing. Sci. Technol. Ind. 2017, 17, 107–115. (In Chinese) [Google Scholar]
  34. Jia, K.; Liang, S.; Gu, X.; Baret, F.; Wei, X.; Wang, X.; Yao, Y.; Yang, L.; Li, Y. Fractional vegetation cover estimation algorithm for Chinese GF-1 wide field view data. Remote Sens. Environ. 2016, 177, 184–191. [Google Scholar] [CrossRef]
  35. Wu, W.; Wang, J.; Li, C.; Wang, M. The Geography of City Liveliness and Land Use Configurations: Evidence from Location-Based Big Data in Beijing; Spatial Economics Research Center Discussion Paper; Spatial Economics Research Centre, LSE: London, UK, 2016. [Google Scholar]
  36. Udelhoven, T.; Linden, S.v.d.; Waske, B.; Stellmes, M.; Hoffmann, L. Hypertemporal classification of large areas using decision fusion. IEEE Geosci. Remote Sens. Lett. 2009, 6, 592–596. [Google Scholar] [CrossRef]
  37. Khatami, R.; Mountrakis, G.; Stehman, S.V. A meta-analysis of remote sensing research on supervised pixel-based land-cover image classification processes: General guidelines for practitioners and future research. Remote Sens. Environ. 2016, 177, 89–100. [Google Scholar] [CrossRef]
  38. Ge, Y.; Jiang, Y.; Chen, Y.; Stein, A.; Jiang, D.; Jia, Y. Designing an experiment to investigate subpixel mapping as an alternative method to obtain land use/land cover maps. Remote Sens. 2016, 8, 360. [Google Scholar] [CrossRef]
  39. Benza, M.; Weeks, J.R.; Stow, D.A.; López-Carr, D.; Clarke, K.C. A pattern-based definition of urban context using remote sensing and GIS. Remote Sens. Environ. 2016, 183, 250–264. [Google Scholar] [CrossRef] [PubMed]
  40. Zhan, X.; Ukkusuri, S.V.; Zhu, F. Inferring urban land use using large-scale social media check-in data. Netw. Spat. Econ. 2014, 14, 647–667. [Google Scholar] [CrossRef]
  41. Yang, L.; Wu, L.; Liu, Y.; Kang, C. Quantifying tourist behavior patterns by travel motifs and geo-tagged photos from Flickr. ISPRS Int. J. Geo-Inf. 2017, 6, 345. [Google Scholar] [CrossRef]
  42. Liu, X.; Kang, C.; Gong, L.; Liu, Y. Incorporating spatial interaction patterns in classifying and understanding urban land use. Int. J. Geogr. Inf. Sci. 2016, 30, 334–350. [Google Scholar] [CrossRef]
  43. Zhu, D.; Wang, N.; Wu, L.; Liu, Y. Street as a big geo-data assembly and analysis unit in urban studies: A case study using Beijing taxi data. Appl. Geogr. 2017, 86, 152–164. [Google Scholar] [CrossRef]
Figure 1. Location of the study area.
Remotesensing 10 00446 g001
Figure 2. Input datasets for the proposed method: (a) WFV data combining bands 4, 3, and 2, with spatial resolution of 16 m; (b) snapshot of mobile phone positioning data (MPPD), representing the density of mobile phone users in a square of 100 m2 at 12:00 local time on June 6, 2015.
Remotesensing 10 00446 g002
Figure 3. Workflow of the proposed method.
Remotesensing 10 00446 g003
Figure 4. Human mobility patterns of the six training classes: (a) residential, (b) business, (c) scenic, (d) open, (e) other, and (f) entertainment.
Remotesensing 10 00446 g004
Figure 5. An example of the decision fusion rules: (a) MPPD-based land use map, (b) WFV-based land cover map, and (c) fused land use map. Lines in (b) correspond to the class boundaries of (a). Regions A–F in (a) correspond to the classes open, residential, business, scenic, entertainment, and other, respectively. Regions 1–5 in (b) represent woodland, built-up areas, water, grassland, and bare-land, respectively. (c) Regions Open, Resid, Busi, Scen, Entert, and Other represent open, residential, business, scenic, entertainment, and other areas, respectively.
Remotesensing 10 00446 g005
Figure 6. Spatial distributions of testing samples: (a) test samples of the WFV-based land cover map, (b) test samples for the MPPD-based land use map, (c) test samples for the fused land use map.
Remotesensing 10 00446 g006
Figure 7. WFV-based land cover classification result.
Remotesensing 10 00446 g007
Figure 8. MPPD-based land use classification result using the SVM classifier.
Remotesensing 10 00446 g008
Figure 9. Fused land use map.
Remotesensing 10 00446 g009
Figure 10. Examples of the improvement after fusing the land cover map of four locations. Location 1 (a1e1) and 2 (a2e2) are the examples of improvement of the residential class; location 3 (a3e3) and 4 (a4e4) examples of improvement of the business class. Figures a1–a4 are images from Google Earth™ in four locations; the spatial resolution of these figures is 2.15 m. Figures b1–b4 are the WFV remote sensing data; the spatial resolution of these figures is 16 m. Figures c1–c4 are the WFV-based land cover maps; the spatial resolution of these figures is 16 m. Pictures d1–d4 are MPPD-based land use maps; the spatial resolution of these figures is 100 m. Pictures e1–e4 are the fused land use maps; the spatial resolution of these figures is 16 m.
Remotesensing 10 00446 g010
Figure 11. Spatial distribution of average user density for the business class during (a) daytime and (b) nighttime.
Remotesensing 10 00446 g011
Figure 12. Spatial distribution of average user density for the residential class during (a) daytime and (b) nighttime.
Remotesensing 10 00446 g012
Table 1. Technical specifications of Gaofen 1 (GF1) wide-field view (WFV).
BandSpectrum (um)ResolutionRepetition Cycle
10.45–0.5216 m4 days
20.52–0.59
30.63–0.69
40.77–0.89
Table 2. Numbers of training samples used for WFV classification.
Built-UpWaterGrasslandWoodlandBare-Land
Train46911022231150155
Table 3. Jeffries–Matusita interclass distance among the training samples of the WFV data.
Built-UpWaterGrasslandWoodland
Water1.95
Grassland1.992.00
Woodland1.992.001.78
Bare-land1.952.002.002.00
Table 4. Number of training samples used for MPPD-based land use map.
ResidentialWorking *OpenScenicOtherSum
9628222231586112776
* The class of Working contains classes of Business and Entertainment.
Table 5. The complete decision fusion rules.
Fused Land UseWFV-Based Land CoverMPPD-Based Land Use
ResidentialBuilt-upResidential
Built-upOpen
BusinessBuilt-upBusiness
Built-upOther
EntertainmentBuilt-upEntertainment
ScenicAll classesScenic
OpenBarelandExcept for Other
Woodland, Grassland, and WaterExcept for Scenic and Other
OtherExcept for Built-upOther
Table 6. WFV-based land cover classification confusion matrix.
Ground TruthReference PointsUser Accuracy
Built-UpWaterGrasslandWoodlandBare-Land
Classified ResultBuilt-up410483133350780.9
Water1358810060297.7
Grassland0213375121163.0
Woodland065743075498.5
Bare-land21165467958.2
Reference points444645148836802153
Producer accuracy92.391.289.988.957.5 OA = 89.2
Table 7. MPPD-based land use classification confusion matrix.
Ground TruthReference PointsUser Accuracy
BusiEntertResidOpenScenicOther
Classified ResultBusi15218303513226856.7
Entert34020304883.3
Resid271197202525278.2
Open212241300016877.4
Scenic09005306285.4
Other0000122322499.5
Reference points1848025318560260184
Producer accuracy82.650.077.870.388.385.7 OA = 77.8
Table 8. Fused land use classification confusion matrix.
Ground TruthReference PointsUser Accuracy
BusiEntertResidOpenScenicOther
Classified ResultBusi1311642131921261.8
Entert24010334981.6
Resid2112461021329383.9
Open412113230635690.7
Scenic09005306285.5
Other00110118619893.9
Reference points1841588031134660217
Producer accuracy82.950.079.193.488.385.7 OA = 83.5
Table 9. User density of five ring-road area of the business class.
Mean (Persons per 100 m2)diffSum (Persons)diff
5th-6th-ringNighttime76−401,640,257−863,696
Daytime116 2,503,953
4th-5th-ringNighttime115−1151,065,629−1,058,209
Daytime230 2,123,838
3rd- 4th-ringNighttime206−2241,010,864−1,101,138
Daytime430 2,112,002
2nd-3rd-ringNighttime270−313951,963−1,104,302
Daytime583 2,056,265
Inner-2nd-ringNighttime248−251493,673−499,557
Daytime500 993,231
Table 10. User density of five ring-road area for the residential class.
Mean (Persons per 100 m2)diffSum (Persons)diff
5th-6th-ringNighttime110144,297,387532,152
Daytime96 3,765,235
4th-5th-ringNighttime167132,297,486177,755
Daytime154 2,119,731
3rd-4th-ringNighttime229−191,494,237−121,589
Daytime248 1,615,826
2nd-3rd-ringNighttime234−51,044,538−23,344
Daytime239 1,067,883
Inner-2nd-ringNighttime225−6666,510−18,858
Daytime231 685,369

