The Use of Sentinel-1 Time-Series Data to Improve Flood Monitoring in Arid Areas


1
German Remote Sensing Data Center (DFD), German Aerospace Center (DLR), Oberpfaffenhofen, D-82234 Wessling, Germany
2
Department of Civil, Geo and Environmental Engineering, Technical University of Munich, D-80333 Munich, Germany
*
Author to whom correspondence should be addressed.
Remote Sens. 2018, 10(4), 583; https://0-doi-org.brum.beds.ac.uk/10.3390/rs10040583
Submission received: 21 March 2018
/
Revised: 29 March 2018
/
Accepted: 30 March 2018
/
Published: 9 April 2018
(This article belongs to the Special Issue Remote Sensing of Hydrological Extremes)
Abstract
:Due to the similarity of the radar backscatter over open water and over sand surfaces a reliable near real-time flood mapping based on satellite radar sensors is usually not possible in arid areas. Within this study, an approach is presented to enhance the results of an automatic Sentinel-1 flood processing chain by removing overestimations of the water extent related to low-backscattering sand surfaces using a Sand Exclusion Layer (SEL) derived from time-series statistics of Sentinel-1 data sets. The methodology was tested and validated on a flood event in May 2016 at Webi Shabelle River, Somalia and Ethiopia, which has been covered by a time-series of 202 Sentinel-1 scenes within the period June 2014 to May 2017. The approach proved capable of significantly improving the classification accuracy of the Sentinel-1 flood service within this study site. The Overall Accuracy increased by ~5% to a value of 98.5% and the User’s Accuracy increased by 25.2% to a value of 96.0%. Experimental results have shown that the classification accuracy is influenced by several parameters such as the lengths of the time-series used for generating the SEL.
1. Introduction
Within the last decade, there has been significant progress in near real-time (NRT) flood mapping based on Synthetic Aperture Radar (SAR) satellite data. In particular, the increased availability of high-spatial and high-temporal resolution Earth observation (EO) data over large areas as well as the development of automatic flood detection approaches (e.g., [1,2,3,4,5,6,7,8,9,10]) has been of great importance to support operational flood mapping activities. Due to the capability of the SAR signal to penetrate clouds, radar sensors have a clear advantage over optical systems in continuous data acquisition at every satellite overpass. Therefore, SAR sensors are especially suited to systematically provide reliable information on flood situations, which usually occur during long lasting precipitation and cloud cover periods. Recent studies focused on implementing fully automatic processing chains for global flood mapping. These studies consider the automatic ingestion and pre-processing of EO data, the adaptation of auxiliary data useful for classification refinement, classification, and the dissemination of flood information to end users. An on-demand TerraSAR-X-based Flood Service (TFS) has been proposed by Martinis et al. [5], which consists of a fully automatic processing chain for near real-time flood detection using TerraSAR-X data. This processing chain has been adapted by Twele et al. [8] to C-band SAR data of the Sentinel-1 (S-1) mission, which is operated by the European Space Agency (ESA) in the frame of the European Union’s Copernicus Programme. This mission consists of two systematically acquiring satellite sensors (S-1A/1B) with a repeat cycle of six days operating in a pre-programmed conflict-free mode, which ensures a consistent long-term data coverage and data archive for systematic flood mapping and monitoring purposes. The application of the processing chains within rapid mapping activities significantly has helped to improve the delivery time of the crisis information to the users, for example, during flood-related activations within the frame of the International Charter ‘Space and Major Disasters’ [11,12].
Flood mapping algorithms are usually based on automatic thresholding algorithms for the initialization of the classification process in SAR amplitude data, for example, using image tiling and minimum error thresholding [13] on selected image tiles [1,5,14], Otsu’s thresholding approach [15] on global gray level histograms [2,16], non-linear fitting under the gamma distribution assumption [3], hierarchical image tiling and bimodality testing [6], and hierarchical tile-ranking thresholding [7].
These methods are capable of extracting the flood extent if there is a significant contrast between water and non-water areas in the SAR data. However, the classification result may be related to overestimations if non-water areas have a similar low backscatter as open water surfaces [17,18,19,20,21]. This is mainly the case in arid regions, where sand surfaces are characterized as water look-alike areas. This makes a reliable SAR-based detection of flooding in these regions nearly impossible. This problem is hardly approached in the literature, and these arid areas are mostly excluded from classification. For example, Wendleder et al. (2013) [17] used the land cover class “Barren or sparsely vegetated” of the Moderate Resolution Imaging Spectroradiometer (MODIS)/Terra Land Cover Types dataset (2001–2004) which is available as a global 1 km raster dataset (MOD12Q1) to exclude desert areas from the computation of a global water indication mask (WAM) using TanDEM-X radar data. Bertram et al. (2016) [18] performed a SAR-based long-term monitoring of water dynamics of Lake Tabalak in the West-African Sahel region by removing water look-alikes related to dry sand surfaces using a mask for the maximum outline of the lake.
The objective of this study was to investigate the potential of Sentinel-1 time-series data to improve the reliability of flood classification in arid regions where sand surfaces generally lead to strong overestimations of the water extent in SAR data. This was accomplished by the use of statistical information of Sentinel-1 backscatter time-series information which helps to identify non-water areas with a permanent low backscatter over time and to exclude these areas from flood detection. For this purpose, a Sand Exclusion Layer (SEL)—a Sentinel-1 based exclusion mask of frequently low-backscattering sand surfaces—was generated and the influence of several parameters on the classification result was investigated. The developed methodology was tested on a region near Beledweyne in Somalia and Ethiopia.
2. Study Area and Data Set
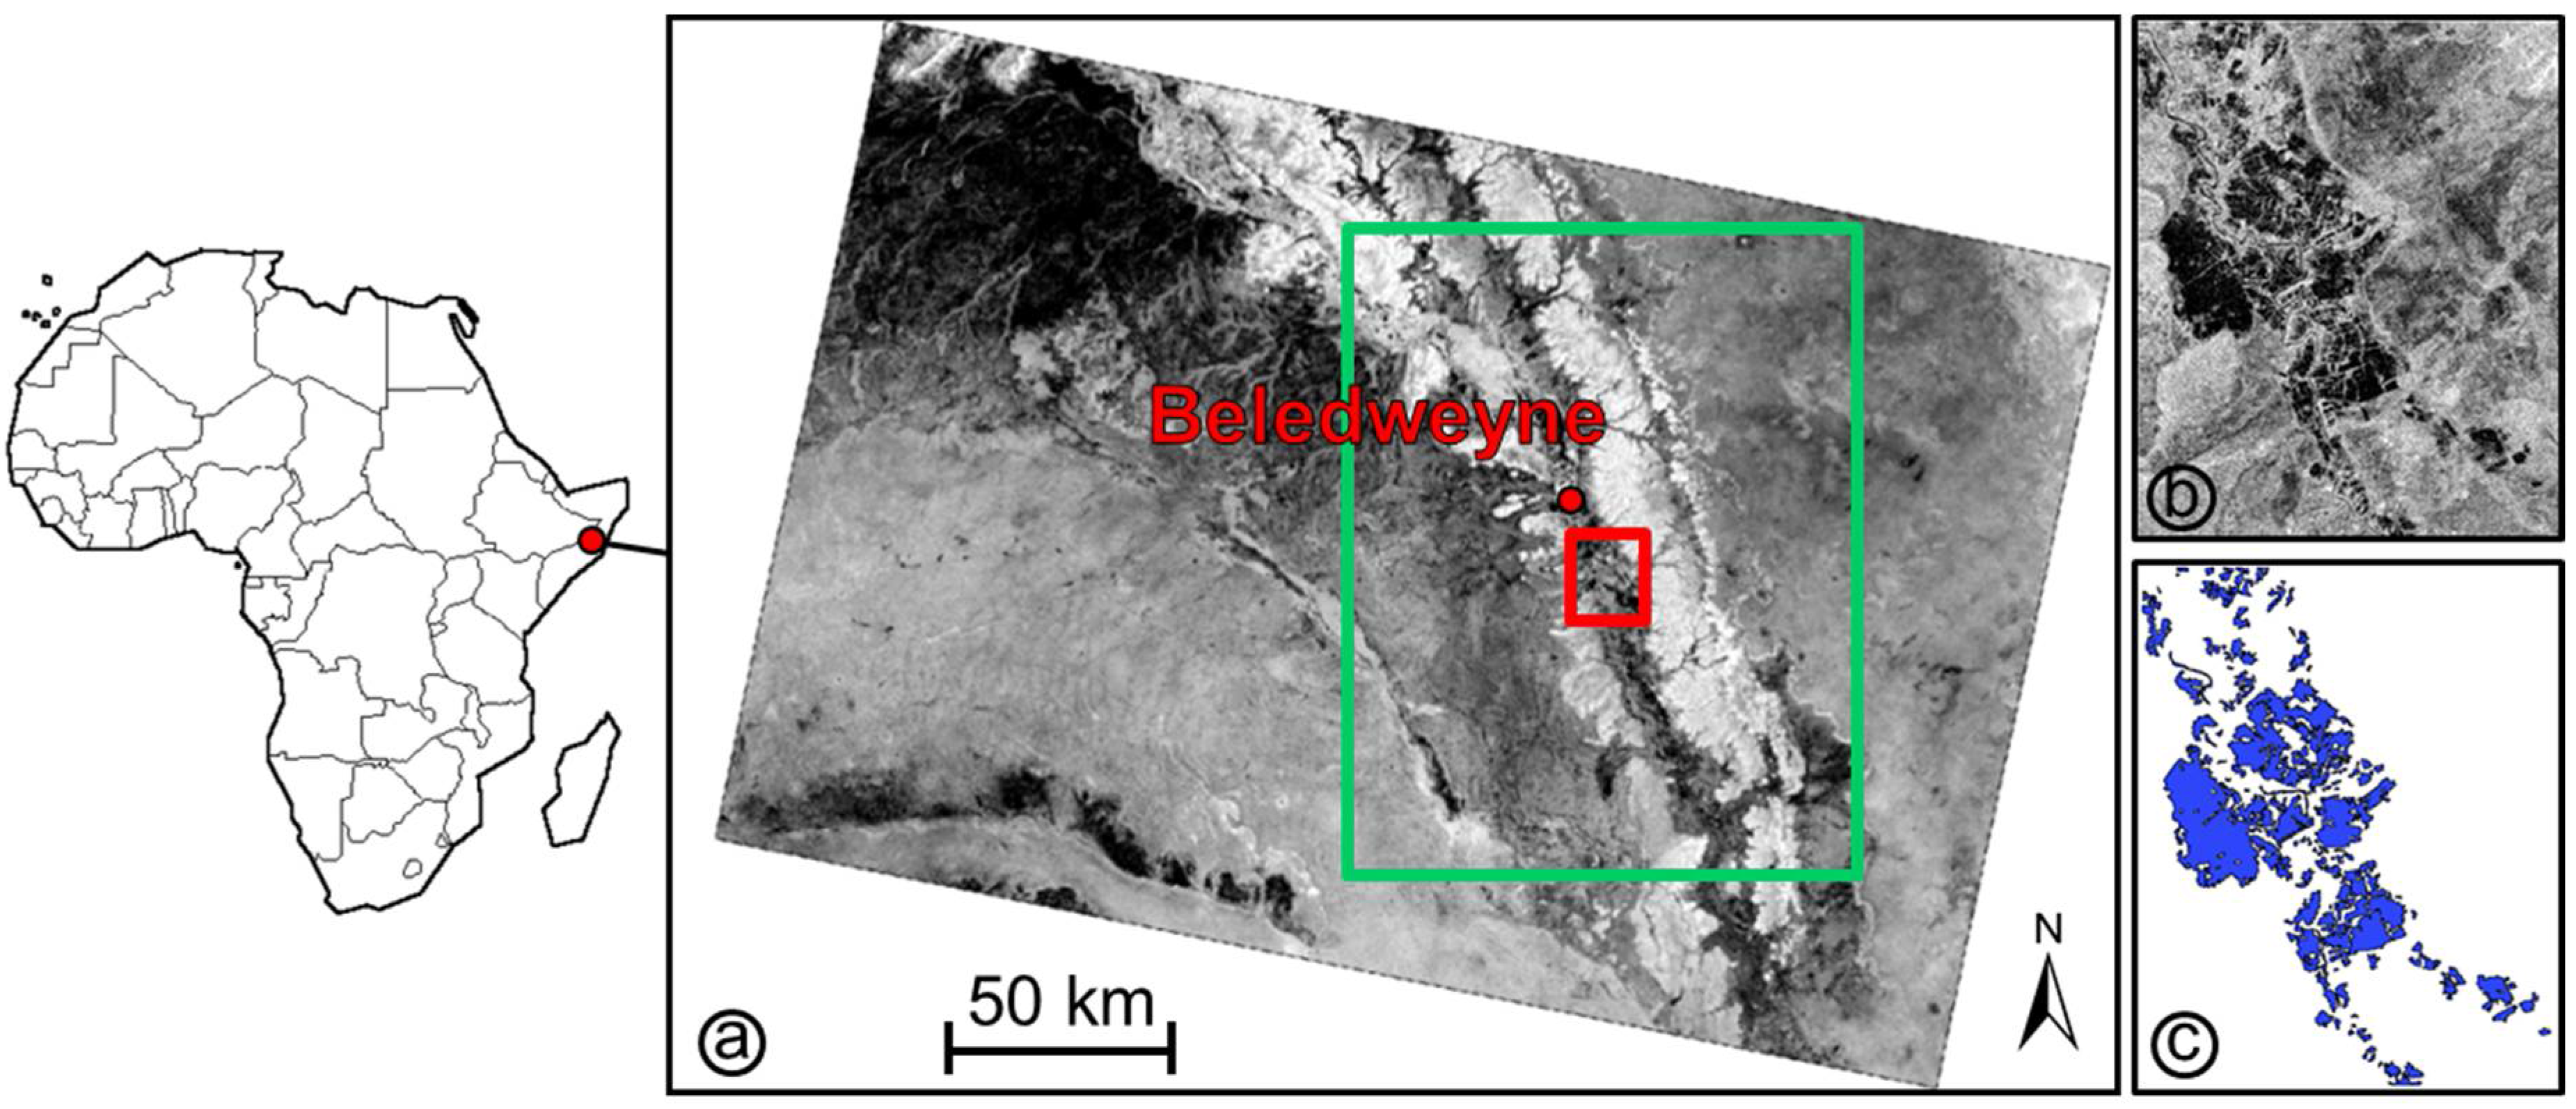
The test area is situated in the arid climate zone of Somalia and Ethiopia and covers the central Hiran region, with Beledweyne as the capital city. The Shabelle River, which emerges on the eastern Ethiopian highlands at an altitude of about 4230 m above sea level and then flows in a southeastern direction into Somalia towards Mogadishu, traverses the study site. Usually, Shabelle River is of enormous economic importance due to agricultural reasons. However, it is frequently threatened by inundations that destroy crops, livestock, and homes, cause deaths, and generally affect thousands of people [22,23]. The focus of this study is the flooding in 2016. This disaster event started on 15 May and continued until the beginning of June. It affected more than 30,000 people, destroying crops and fields, and forcing several thousands of people to flee [24]. The methodology was tested on a Sentinel-1 target scene of 30 May 2016 (Figure 1) which covers flooding along the Shabelle River. Large parts of the area of interest are covered by sand, which has nearly the same backscatter as open flood surfaces.
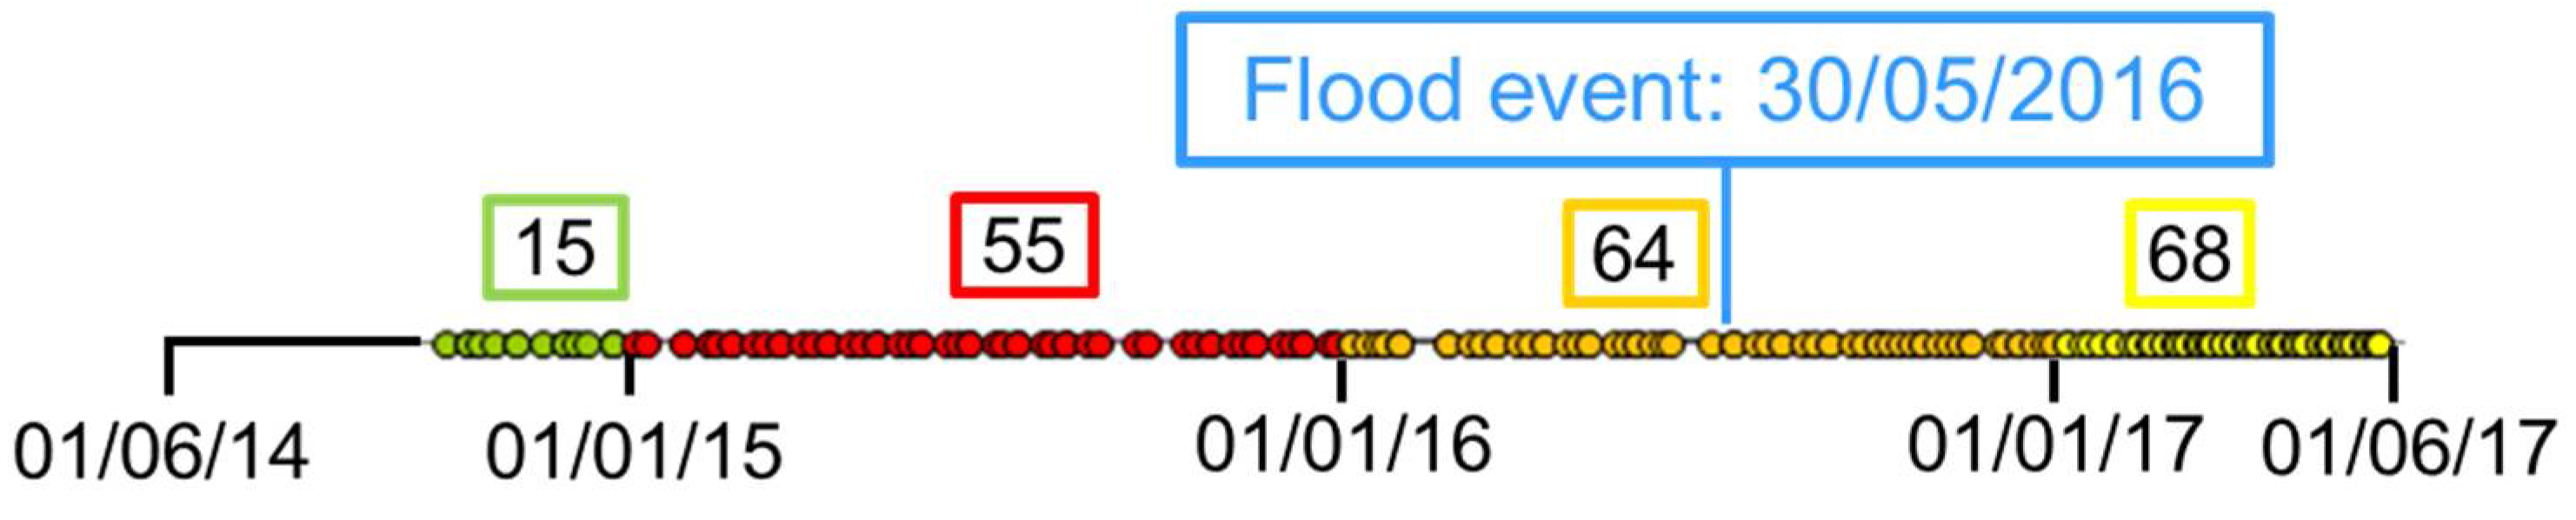
The test area is covered by 202 Interferometric Wide Swath (IW, spatial resolution: 5 × 20 m) Sentinel-1 data sets within the period 1 June 2014–31 May 2017 (Figure 2), which are used for generating the Sand Exclusion Layer (SEL). The test site covers an area of ~31,668 km² (14,305 × 22,410 pixels). Due to the fact that the data either have been acquired in single polarization VV or VV/VH polarization, only VV polarized data are used in this study in order to have a longer and more consistent time-series. This is in line with other studies that state that the VV–polarization is better suited for mapping calm water surfaces than VH due to a better contrast between water and no-water areas (e.g., [8]).
For validation purposes, a Sentinel-2 scene of 25 May 2016 (spectral channels 2, 3, 4, and 8 with a spatial resolution of 10 m) and two Landsat-8 data sets acquired on 28 May 2016 and 4 June 2016, respectively, were used for extracting a reference flood mask (Figure 1c) for a validation area with a size of ~103 km² (1132 × 931 pixels). The Landsat-8 data (spectral channels 1–7) were pan-sharpened to a spatial resolution of 15 m. The Sentinel-2 scene and the Landsat-8 data acquired on 4 June 2016 cover the whole validation area, while the Landsat-8 scene of 28 May 2016 cover only three-quarters of the validation area. The extraction of the reference flood mask was accomplished by visual interpretation and manual digitization of the optical data. By comparing the optical data with the Sentinel-1 scene of 30 May 2016 it could be stated that the flooding was stable between the 25 May 2016 and 30 May 2016. The flooding slightly receded between the Sentinel-1 and Landsat-8 acquisition on 4 June 2016. As the Landsat-8 acquisition of 28 May 2016 had the lowest temporal distance to the SAR crisis data set, this scene was used to derive the major part of the validation mask. Parts of the validation area not covered by this scene were complemented by the information provided by the Sentinel-2 acquisition of 25 May 2016. Some missing information on the flooding covered by single clouds was filled by using the Landsat-8 data of 4 June 2016. This information was visually cross-checked using the SAR crisis data.
3. Methodology
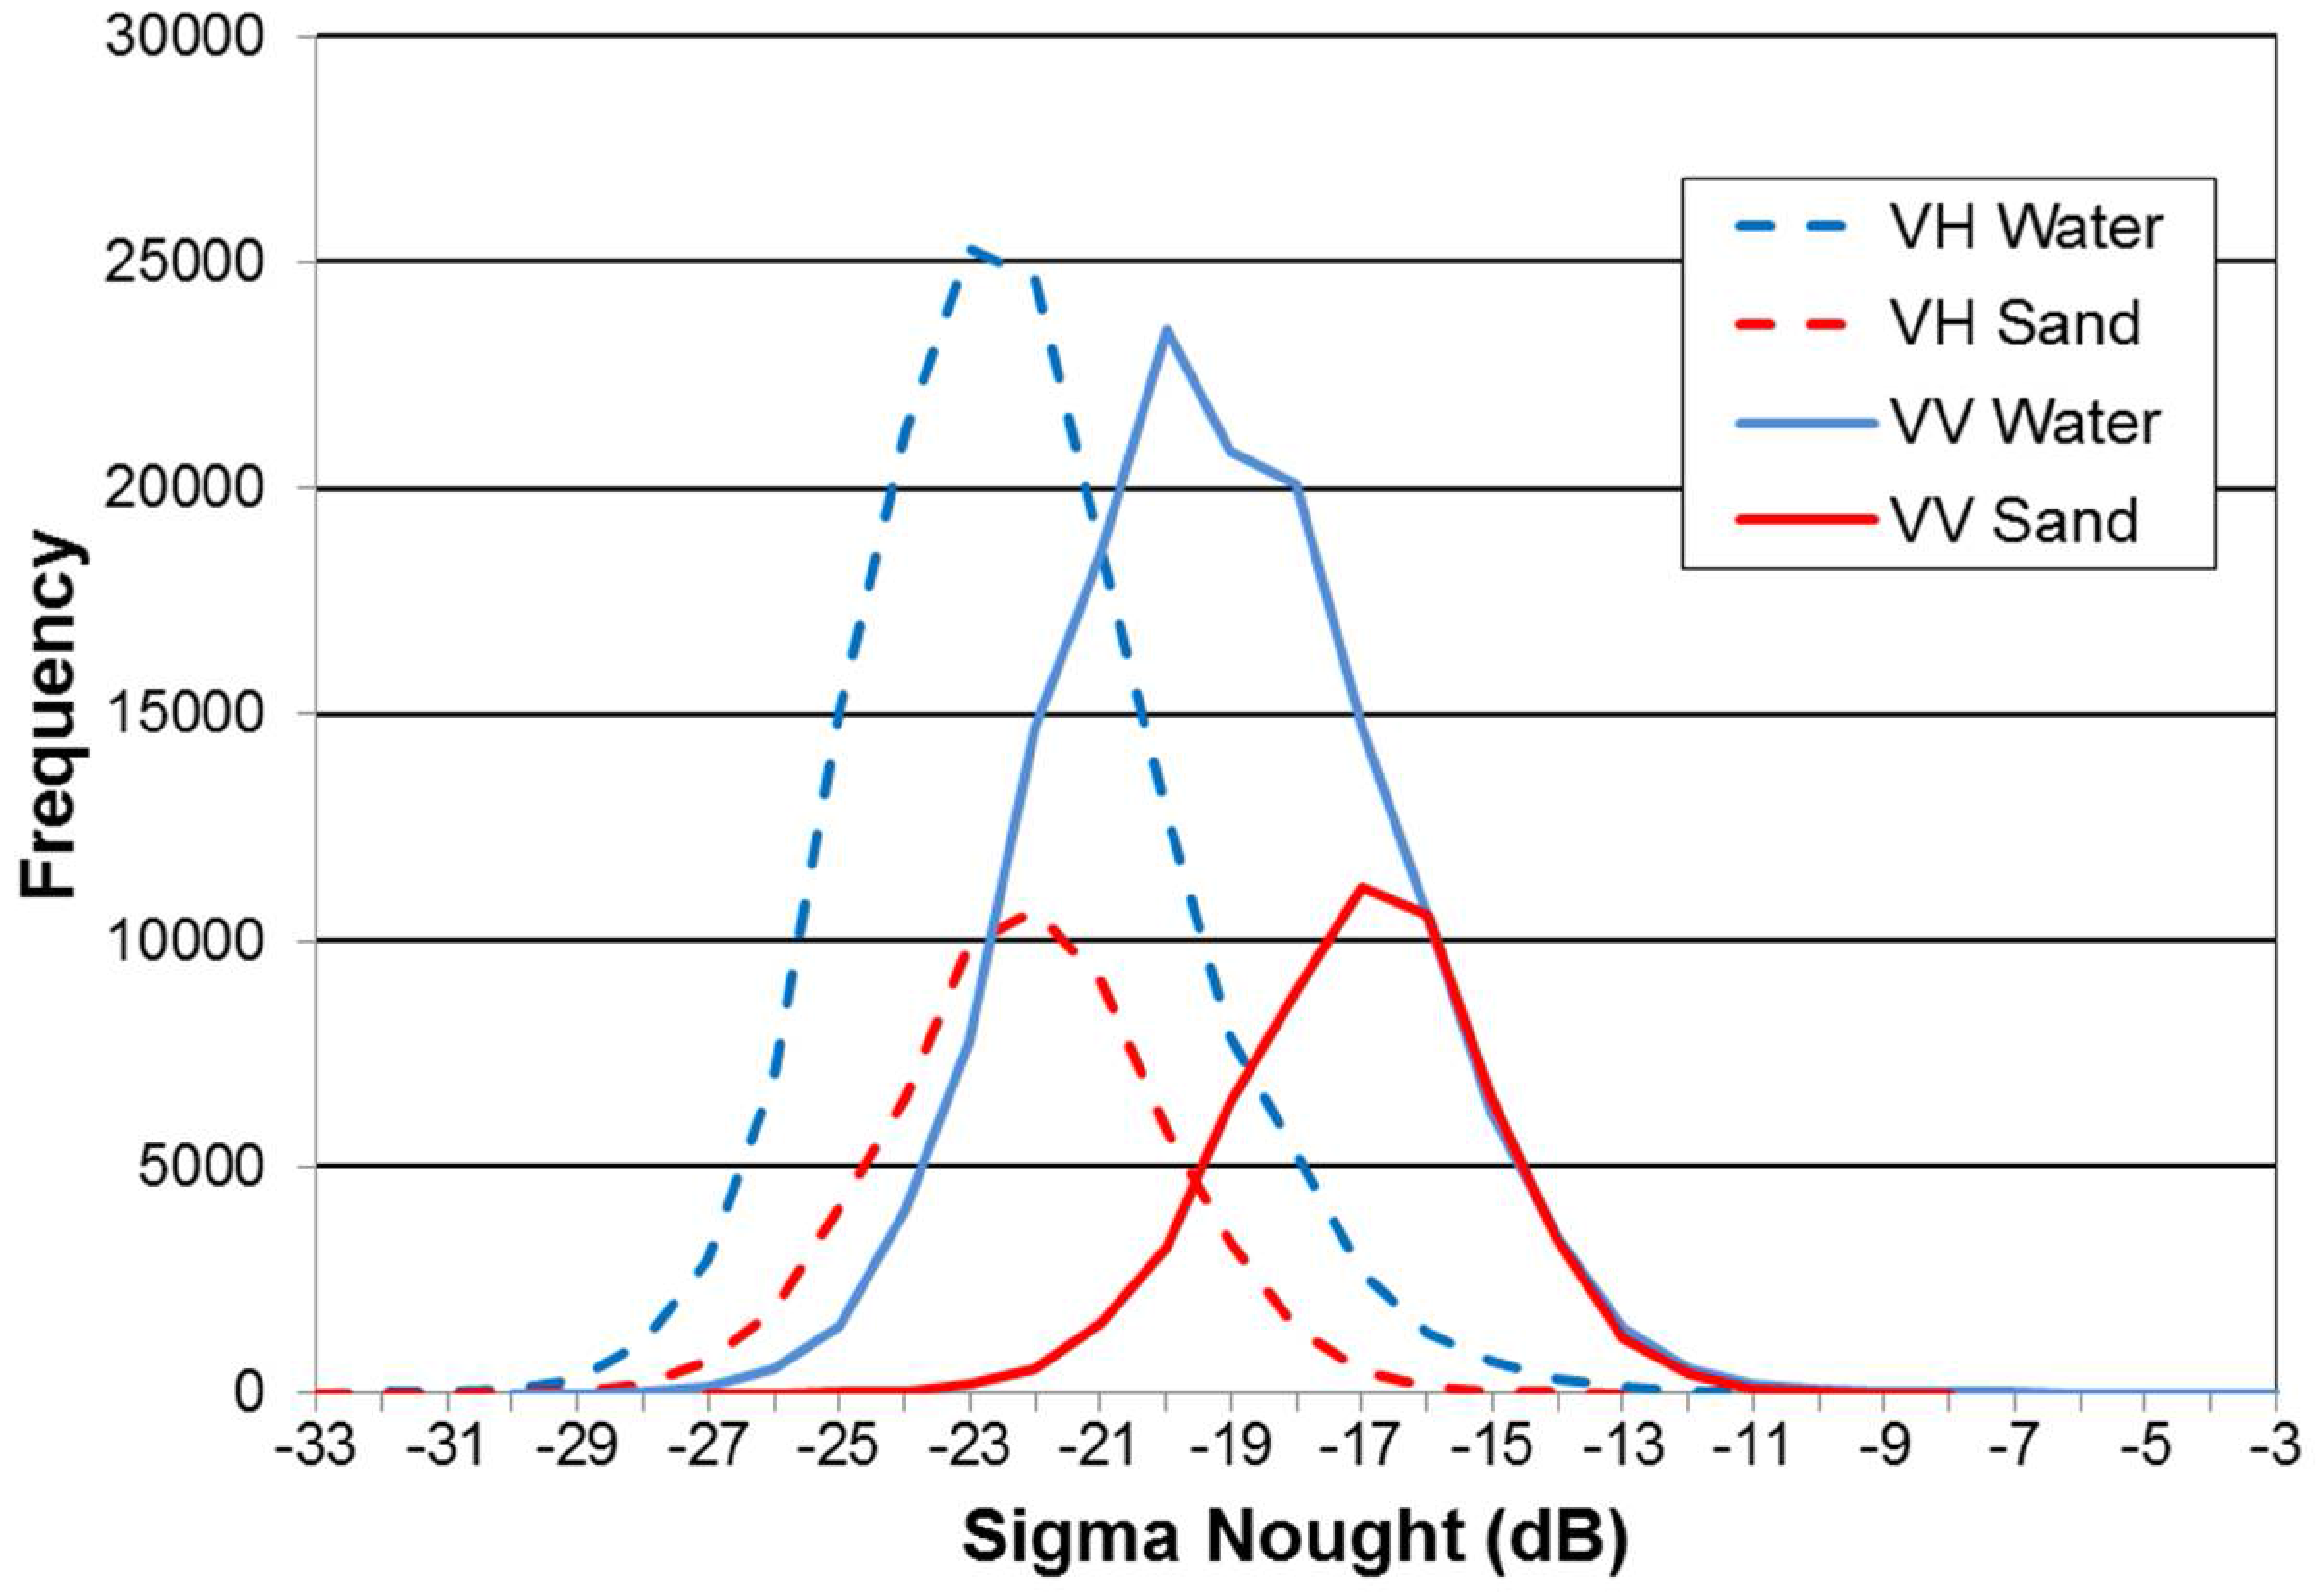
It is well known that open water surfaces lead to low backscattering coefficients due to the specular reflection of the SAR signal on the water surface and the high permittivity of water [25]. The radar backscatter over sand surfaces is affected by several environmental factors, mainly the grain size, its distribution, and the moisture. With decreasing grain size, the backscattering over arid land surfaces generally decreases [26]. Sand or gravel with bigger and unevenly distributed grain size provides a stronger backscattering than small and similar sized sand [26]. Therefore, mainly uniformly distributed dry sand areas with small grain size lead to low backscatter responses and radar-dark sand surfaces, which have similar backscatter values as smooth open water surfaces. Sand surfaces therefore usually lead to an overestimation of SAR-based flood/water classification. This can also be seen in Figure 3, which shows the distributions of water and dark-backscattering sand surfaces in both Sentinel-1 VV and VH polarization within the validation area. In both polarizations, the classes have a large overlap, which leads to misclassifications of the water extent. The distributions show a small displacement between VV and VH polarization. While in VH polarization both water and sand surfaces have nearly the same mean backscatter (µwater-VH = −22.31 dB; µsand-VH = −22.14 dB) and similar standard deviations (σwater-VH = 2.46; µsand-VH = 2.08), the pixel populations seems to be slightly better separable in VV polarized data (µwater-VV = −19.21 dB; µsand-VV = −17.01 dB; σwater-VV = 2.60; µsand-VV = 1.99).
The occurrence of water in the soil leads to stronger backscattering. For that reason, the SAR backscatter increases during rain events or by the occurrence of morning dew in a desert and decreases when the sand dries as a result of rising temperature [27]. Moister sand reduces the penetrability of the SAR signal stronger than dryer sand. This happens especially when the area is observed by radiation with small signal wavelength [28].
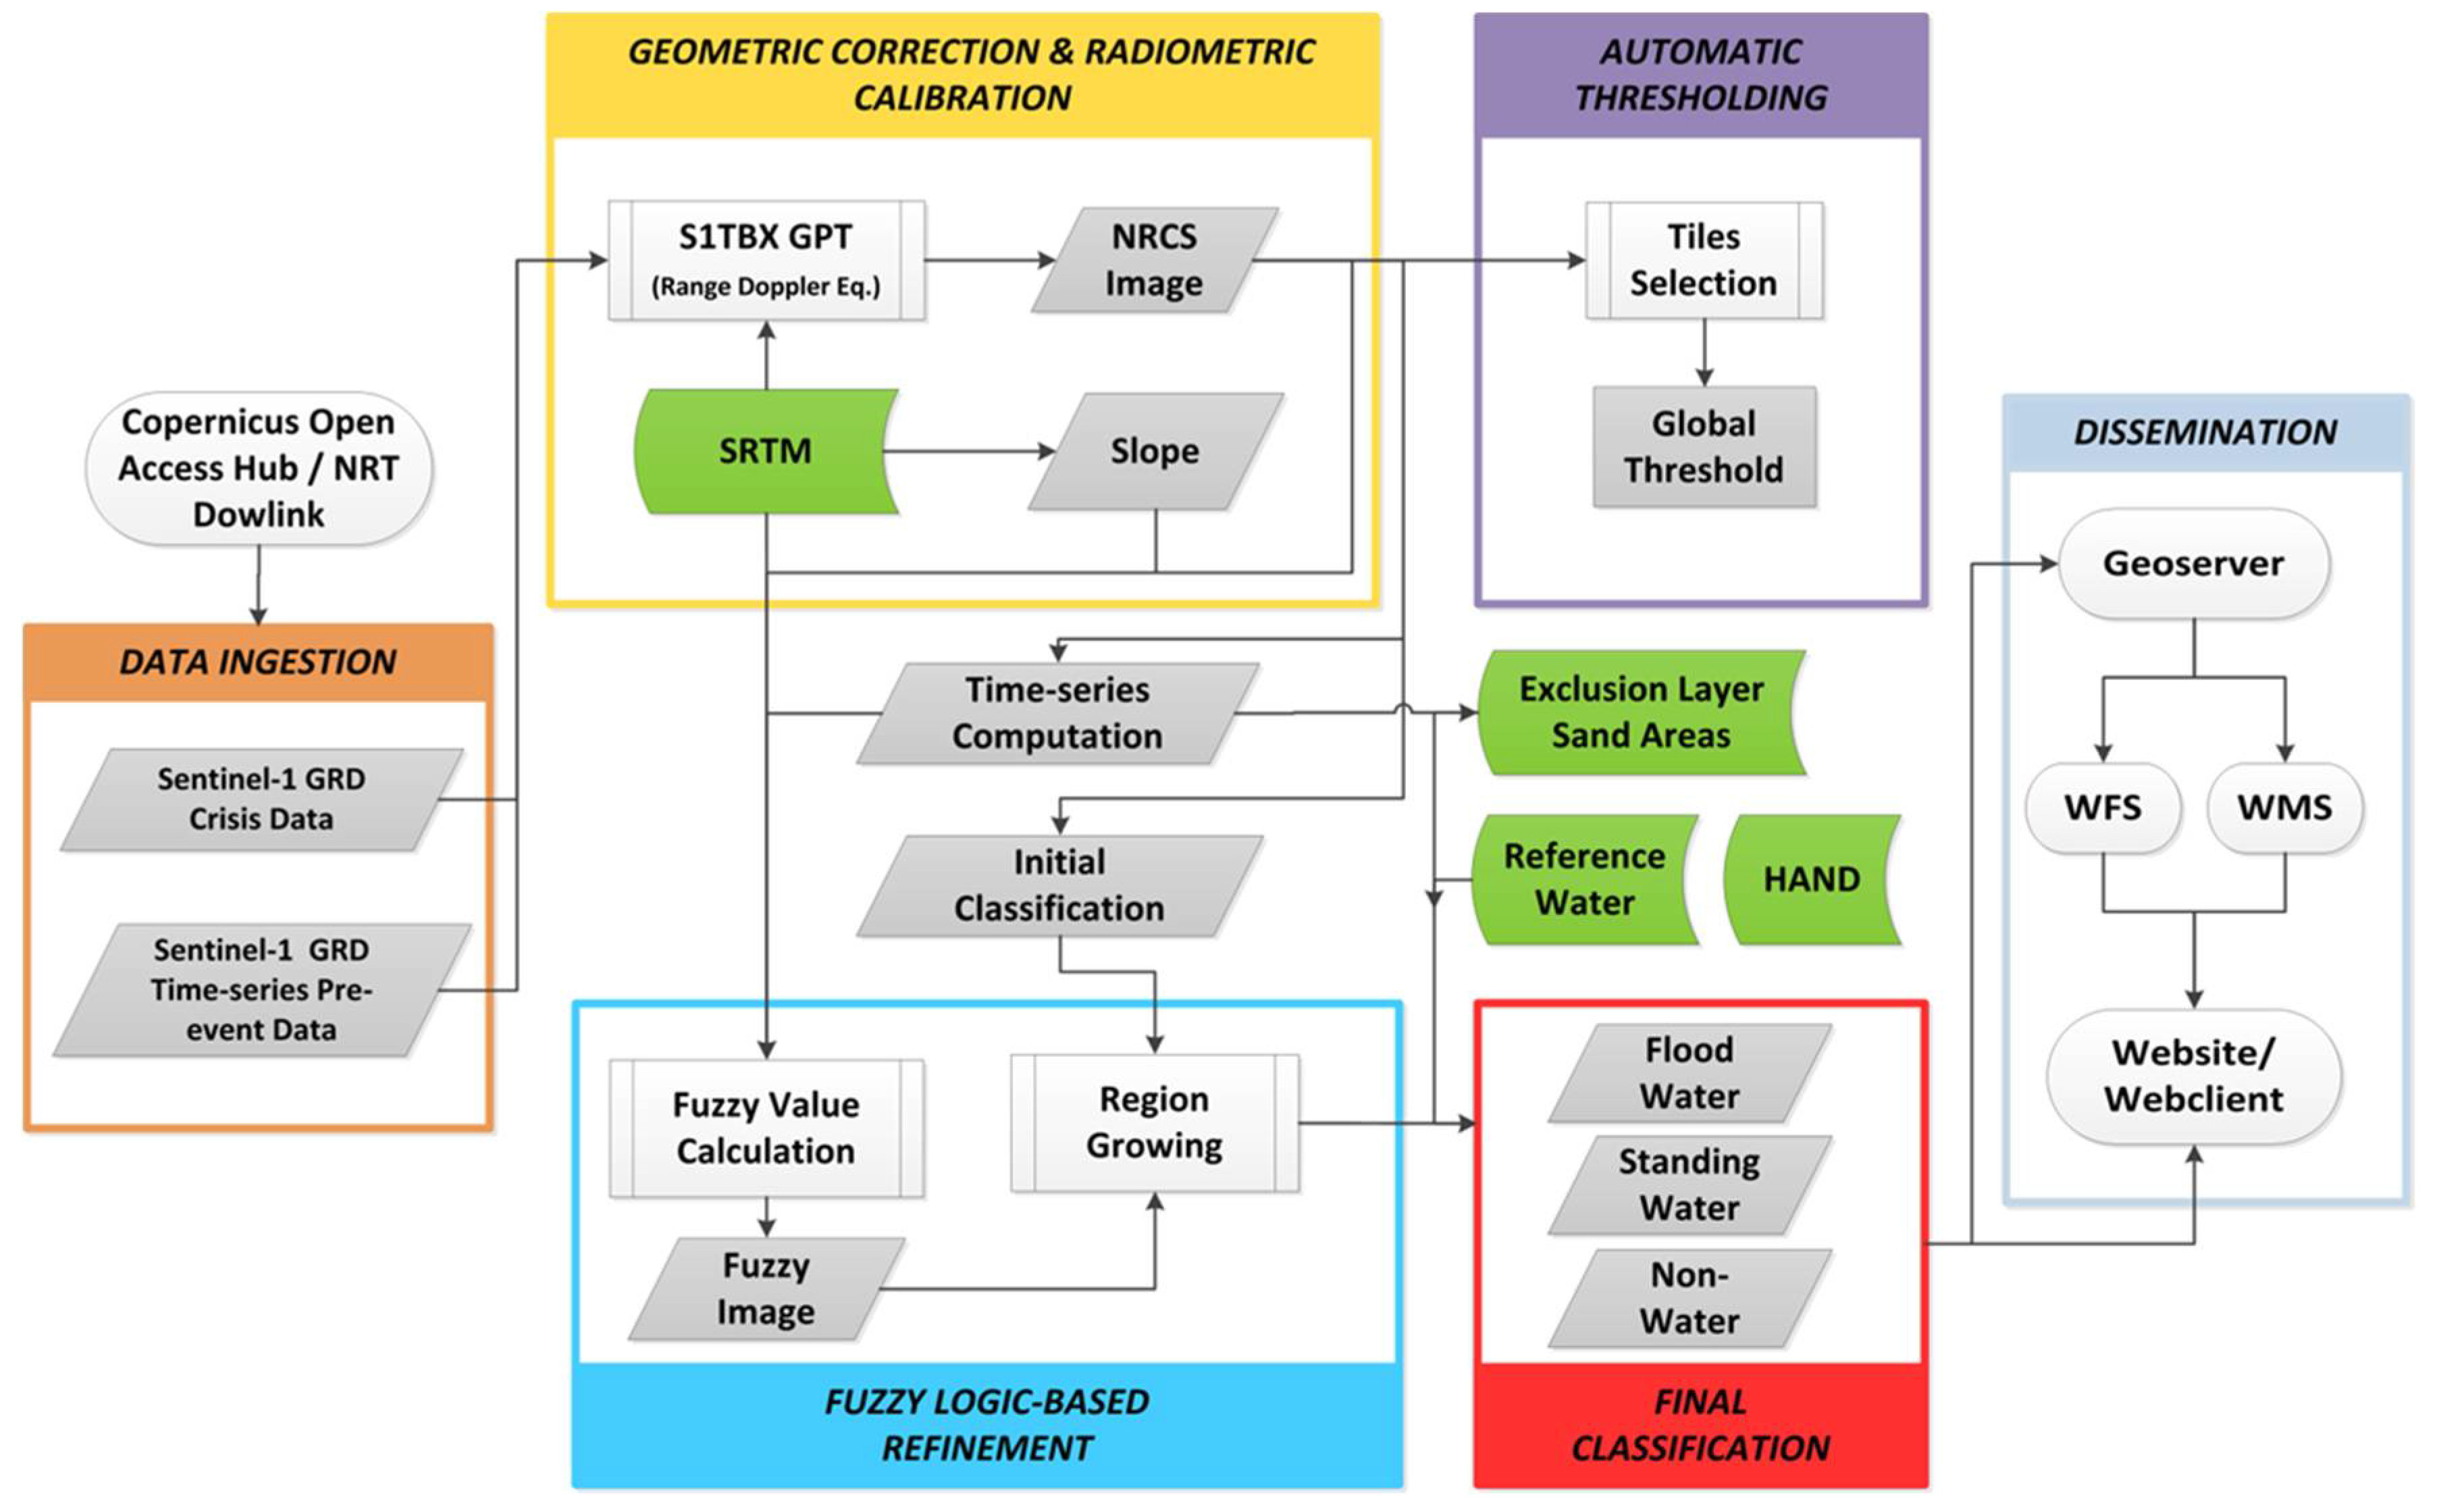
To enable reliable SAR-based flood classification accuracy in arid areas, the workflow as visualized in Figure 4 is proposed. It consists mainly of the automatic processing chain described in Twele et al. [8] for Sentinel-1-based NRT flood mapping and is extended by the computation of the SEL and its usage for a refinement of the classification in arid areas.
The following workflow was developed for the rapid mapping of flood surfaces in arid areas (Figure 4). The original NRT processing chain [8] is comprised of modules for automatic ingestion of the Sentinel-1 crisis data, geometric correction, and radiometric calibration. Further, an initial classification using automatic tile-based thresholding, a fuzzy logic-based classification refinement using different input parameters (backscatter, size, slope, and elevation of initially derived flood objects), and a final classification including auxiliary data (reference water mask and the Height Above Nearest Drainage Index (HAND) Exclusion Mask (HAND-EM)) is performed. Finally, the results are deployed via a Geoserver as a single web mapping service (WMS) layer set, which is visualized within a dedicated web client.
The method of Twele et al. [8] is extended in this study by the integration of the SEL, which is used within a final post-processing step to improve the flood classification result of the Sentinel-1 Flood Service (S-1FS). This is accomplished by subtracting the exclusion layer from the automatically computed flood mask to eliminate areas that frequently have a low backscatter over time and therefore would result in an overestimation of the flood classification.
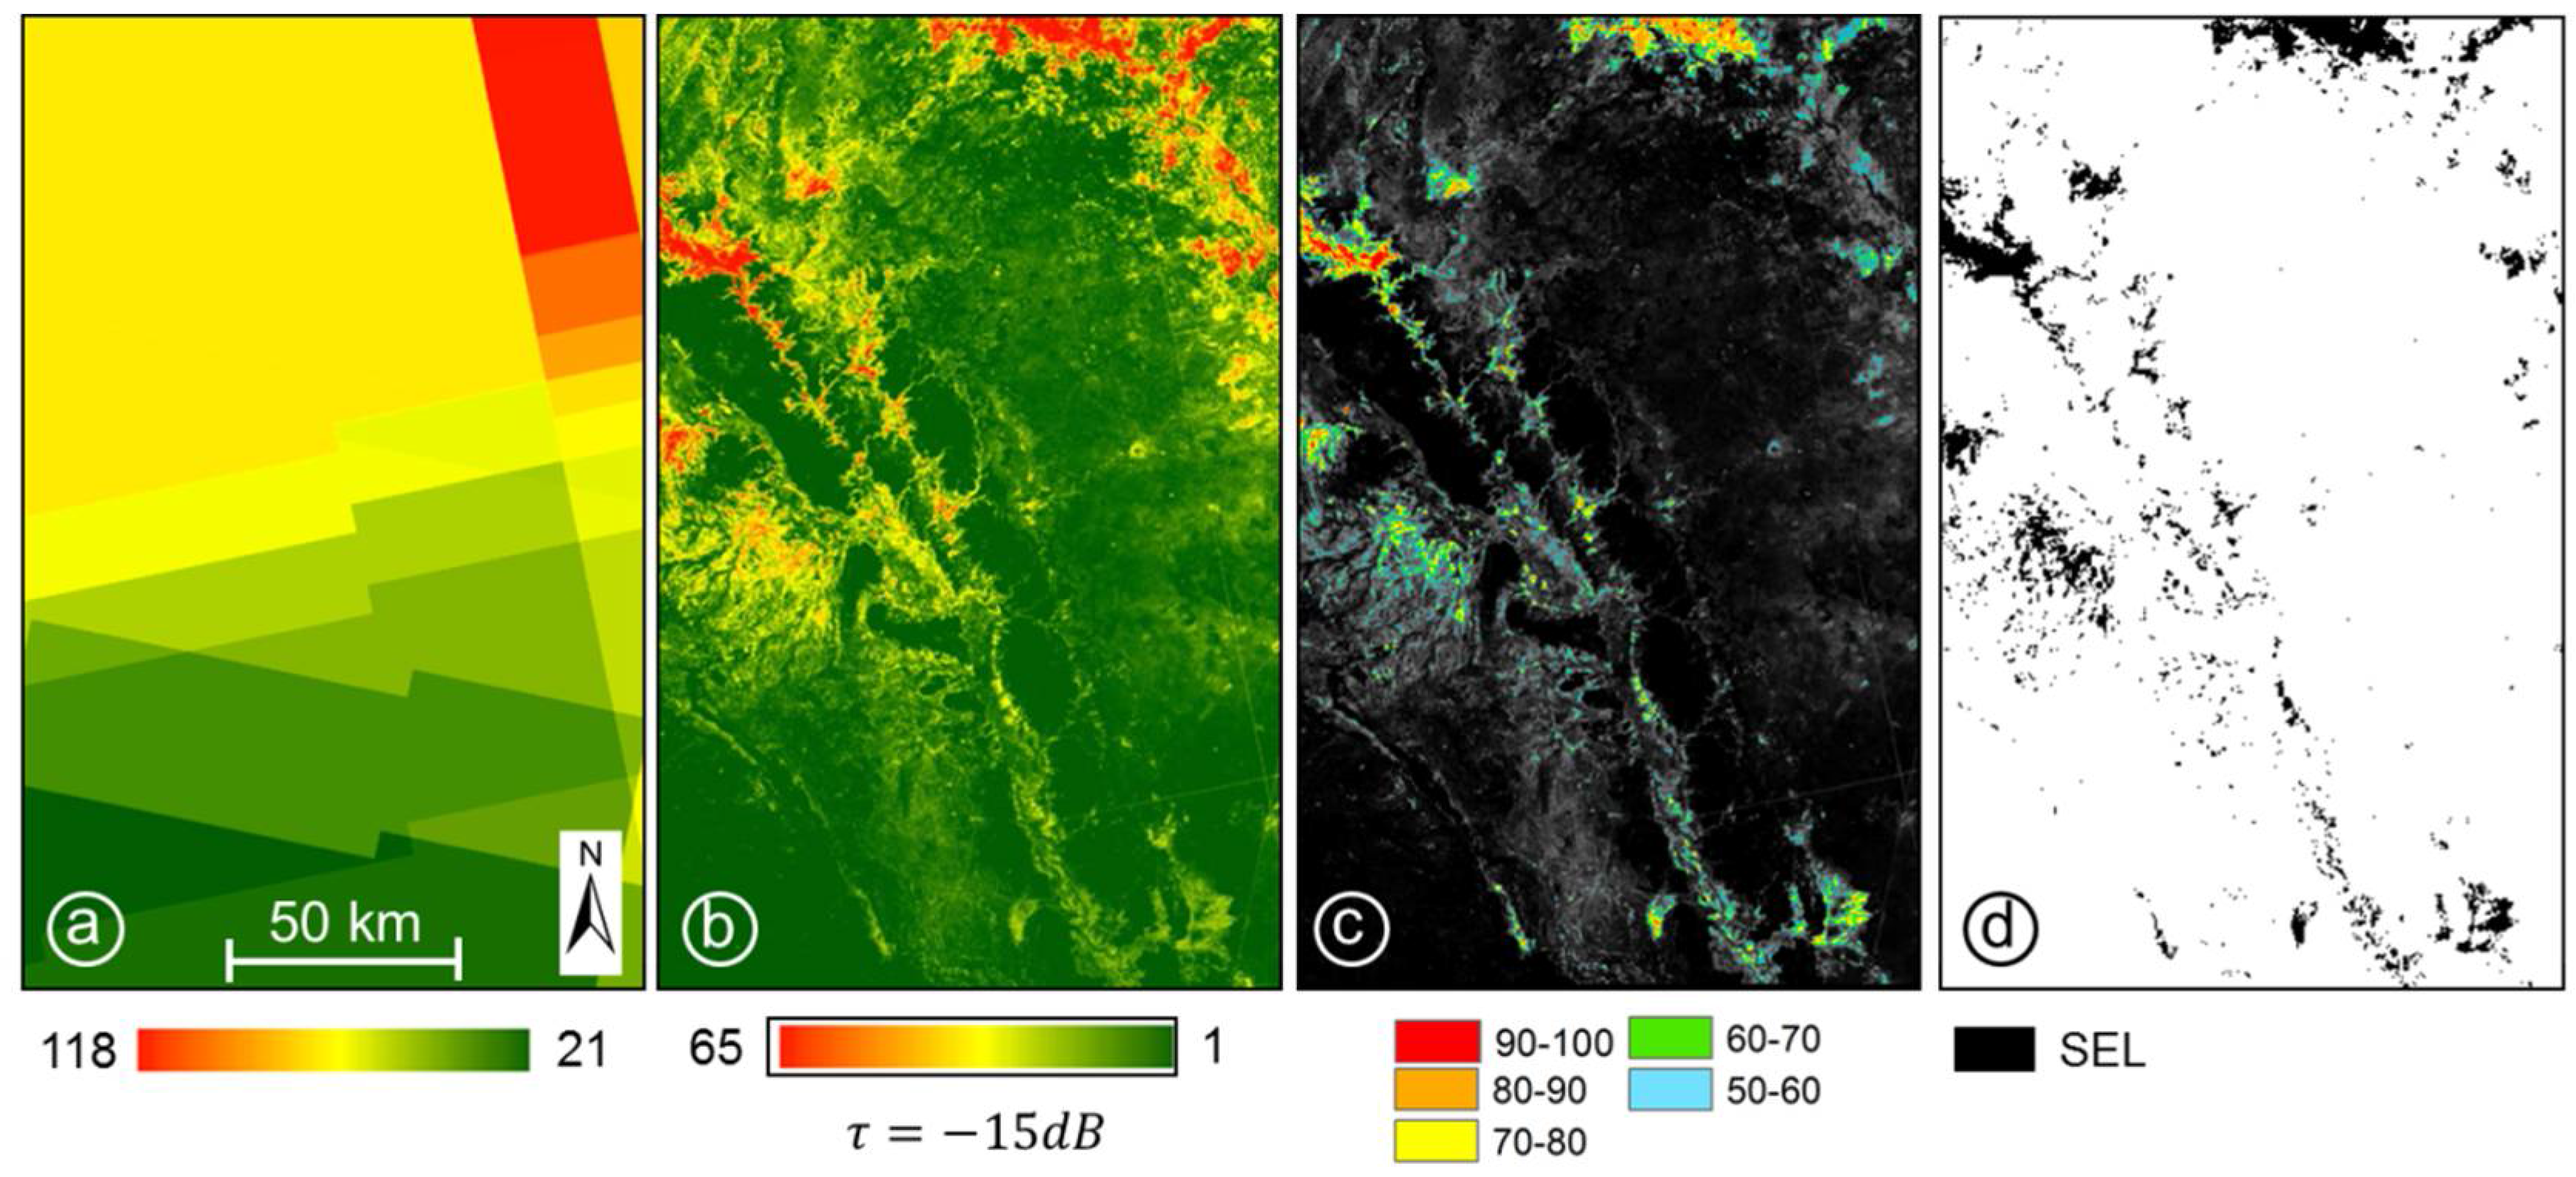
The following automatic approach was developed for generating a Sentinel-1 time-series-based Sand Exclusion Layer (SEL), which can be used for improving the fully automatic S-1FS presented in Twele et al. [8] for the NRT extraction of the open flood extent. The basis of the workflow is the automatic download and pre-processing (radiometric calibration and terrain correction) of Sentinel-1 Ground Range Detected (GRD) data acquired within different orbits from both ascending and descending direction over a defined area of interest for a defined time period. Further, various statistical information is computed based on the pre-processed SAR data as a basis for the generation of the SEL. First, a frequency mask f (Figure 5a) is computed that counts the number (n) of available Sentinel-1 VV-polarized data over the test area in a defined time period (tx–ty) for each image element i of each data set k.
In a second step, a raster layer is generated that exhibits the absolute frequency fa (Figure 5b) of each pixel (i) that has a radar backscatter lower than a predefined threshold (τ) in the time-series.
The parameter τ is empirically defined as −15 dB in this study, as below this value there is a large overlap between the probability density functions of the classes for water and sand areas (Figure 3) and it includes most sand surfaces leading to a misclassification of the water surfaces. Further, best results have been achieved in using this value in computing the SEL.
The relative frequency (fr) (Figure 5c) of each pixel is computed by the ratio between the absolute frequency (fa) and the acquisition frequency mask (f):
All pixels are classified in ten classes ranging from 0–100% with a 10% interval of the relative frequency (fr). The final binary sand exclusion layer (Figure 5d) is generated by combining these classes of fr which offer a certain frequency for a pixel having a radar backscatter value below τ over time within the frequency interval a–b%, where in this context b is set to 100:
The combination of several frequency classes is necessary due to the fact that a relatively rarely occurring high moisture content (e.g., after precipitation) of the sand may lead to a higher backscatter of the usually low backscattering sand surface. Additionally, this also accounts for slight changes of the radar backscatter that might result from the combination of data from different orbits and therefore varying incident angles.
Due to computational reasons, the SEL can be processed offline for a certain time period over all required arid areas to be prepared in case of flood occurrence and, therefore, to be able improve the NRT applicability of the flood processor during disaster management activities.
4. Results
In this section, the effectiveness of the proposed approach for improved flood mapping based on Sentinel-1 time-series data is evaluated for the validation area in Somalia, and the influence of parameters on the flood mapping result is investigated. The following parameters are evaluated for generating the SEL: the frequency range and the time-series length. The evaluation is accomplished by comparing the flood masks computed by the original version of the Sentinel-1 Flood Service [8] and post-processed using the Sentinel-1-based SEL with the flood validation mask. Further, the results based on the SEL are compared to the results of the S-1FS improved by the MODIS land cover product, which could be used alternatively for excluding sand surfaces.
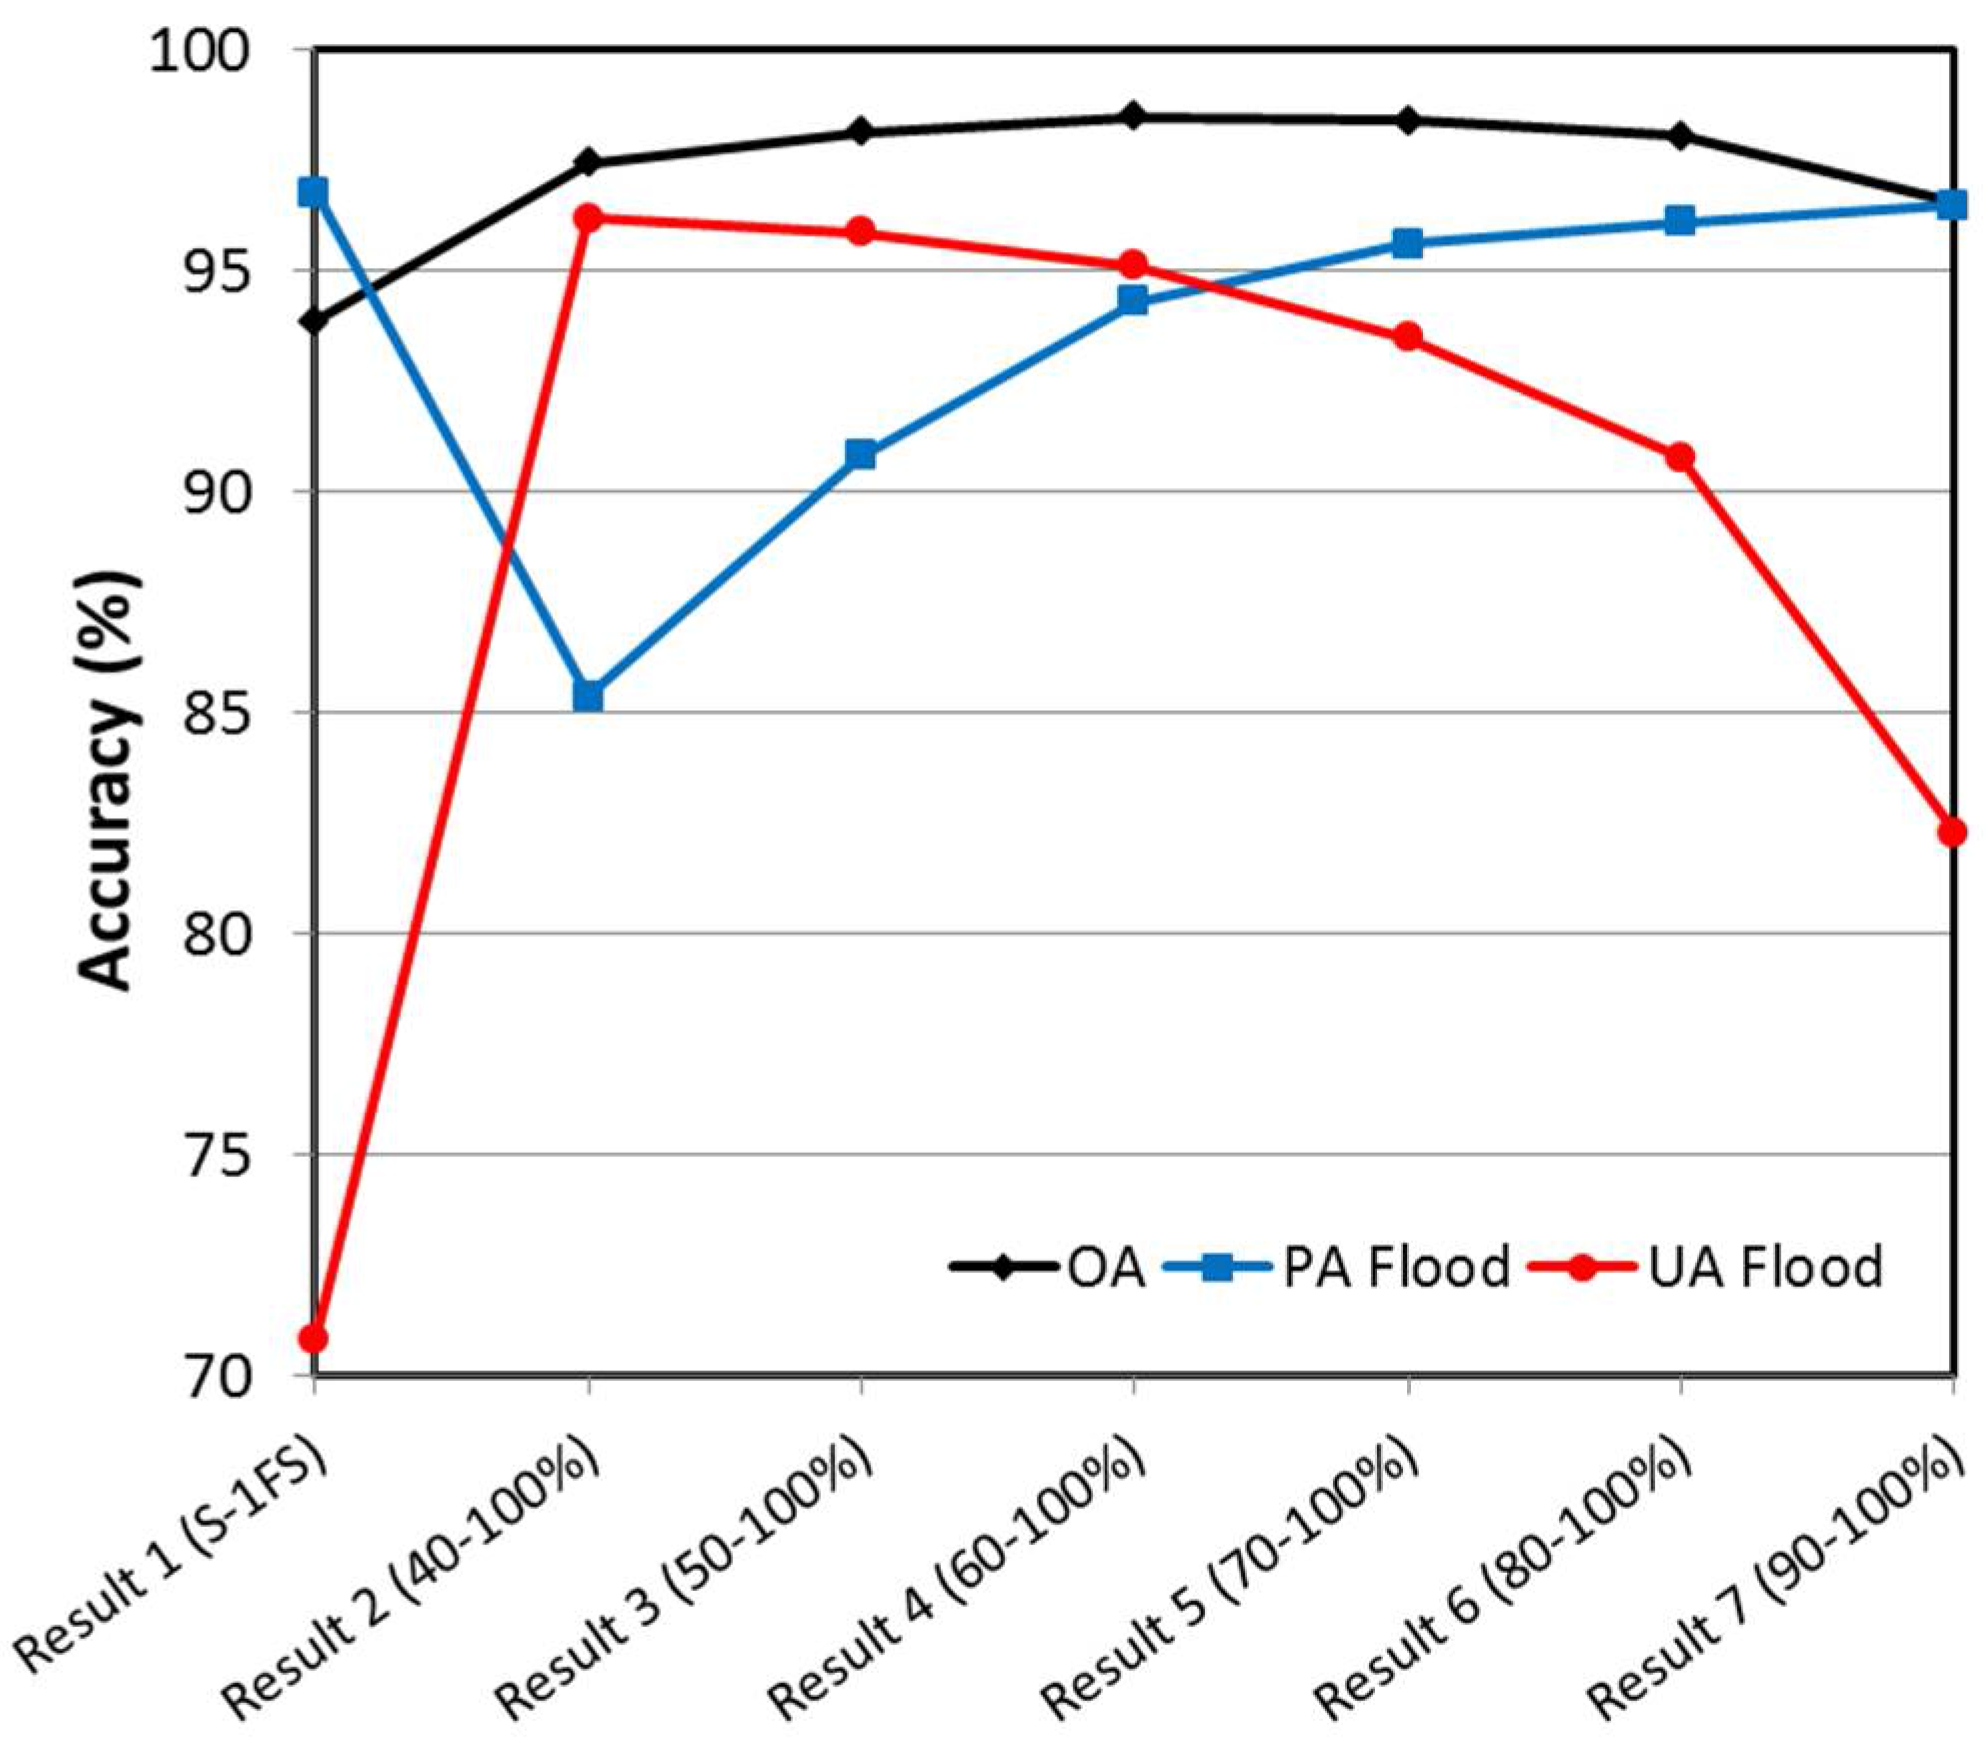
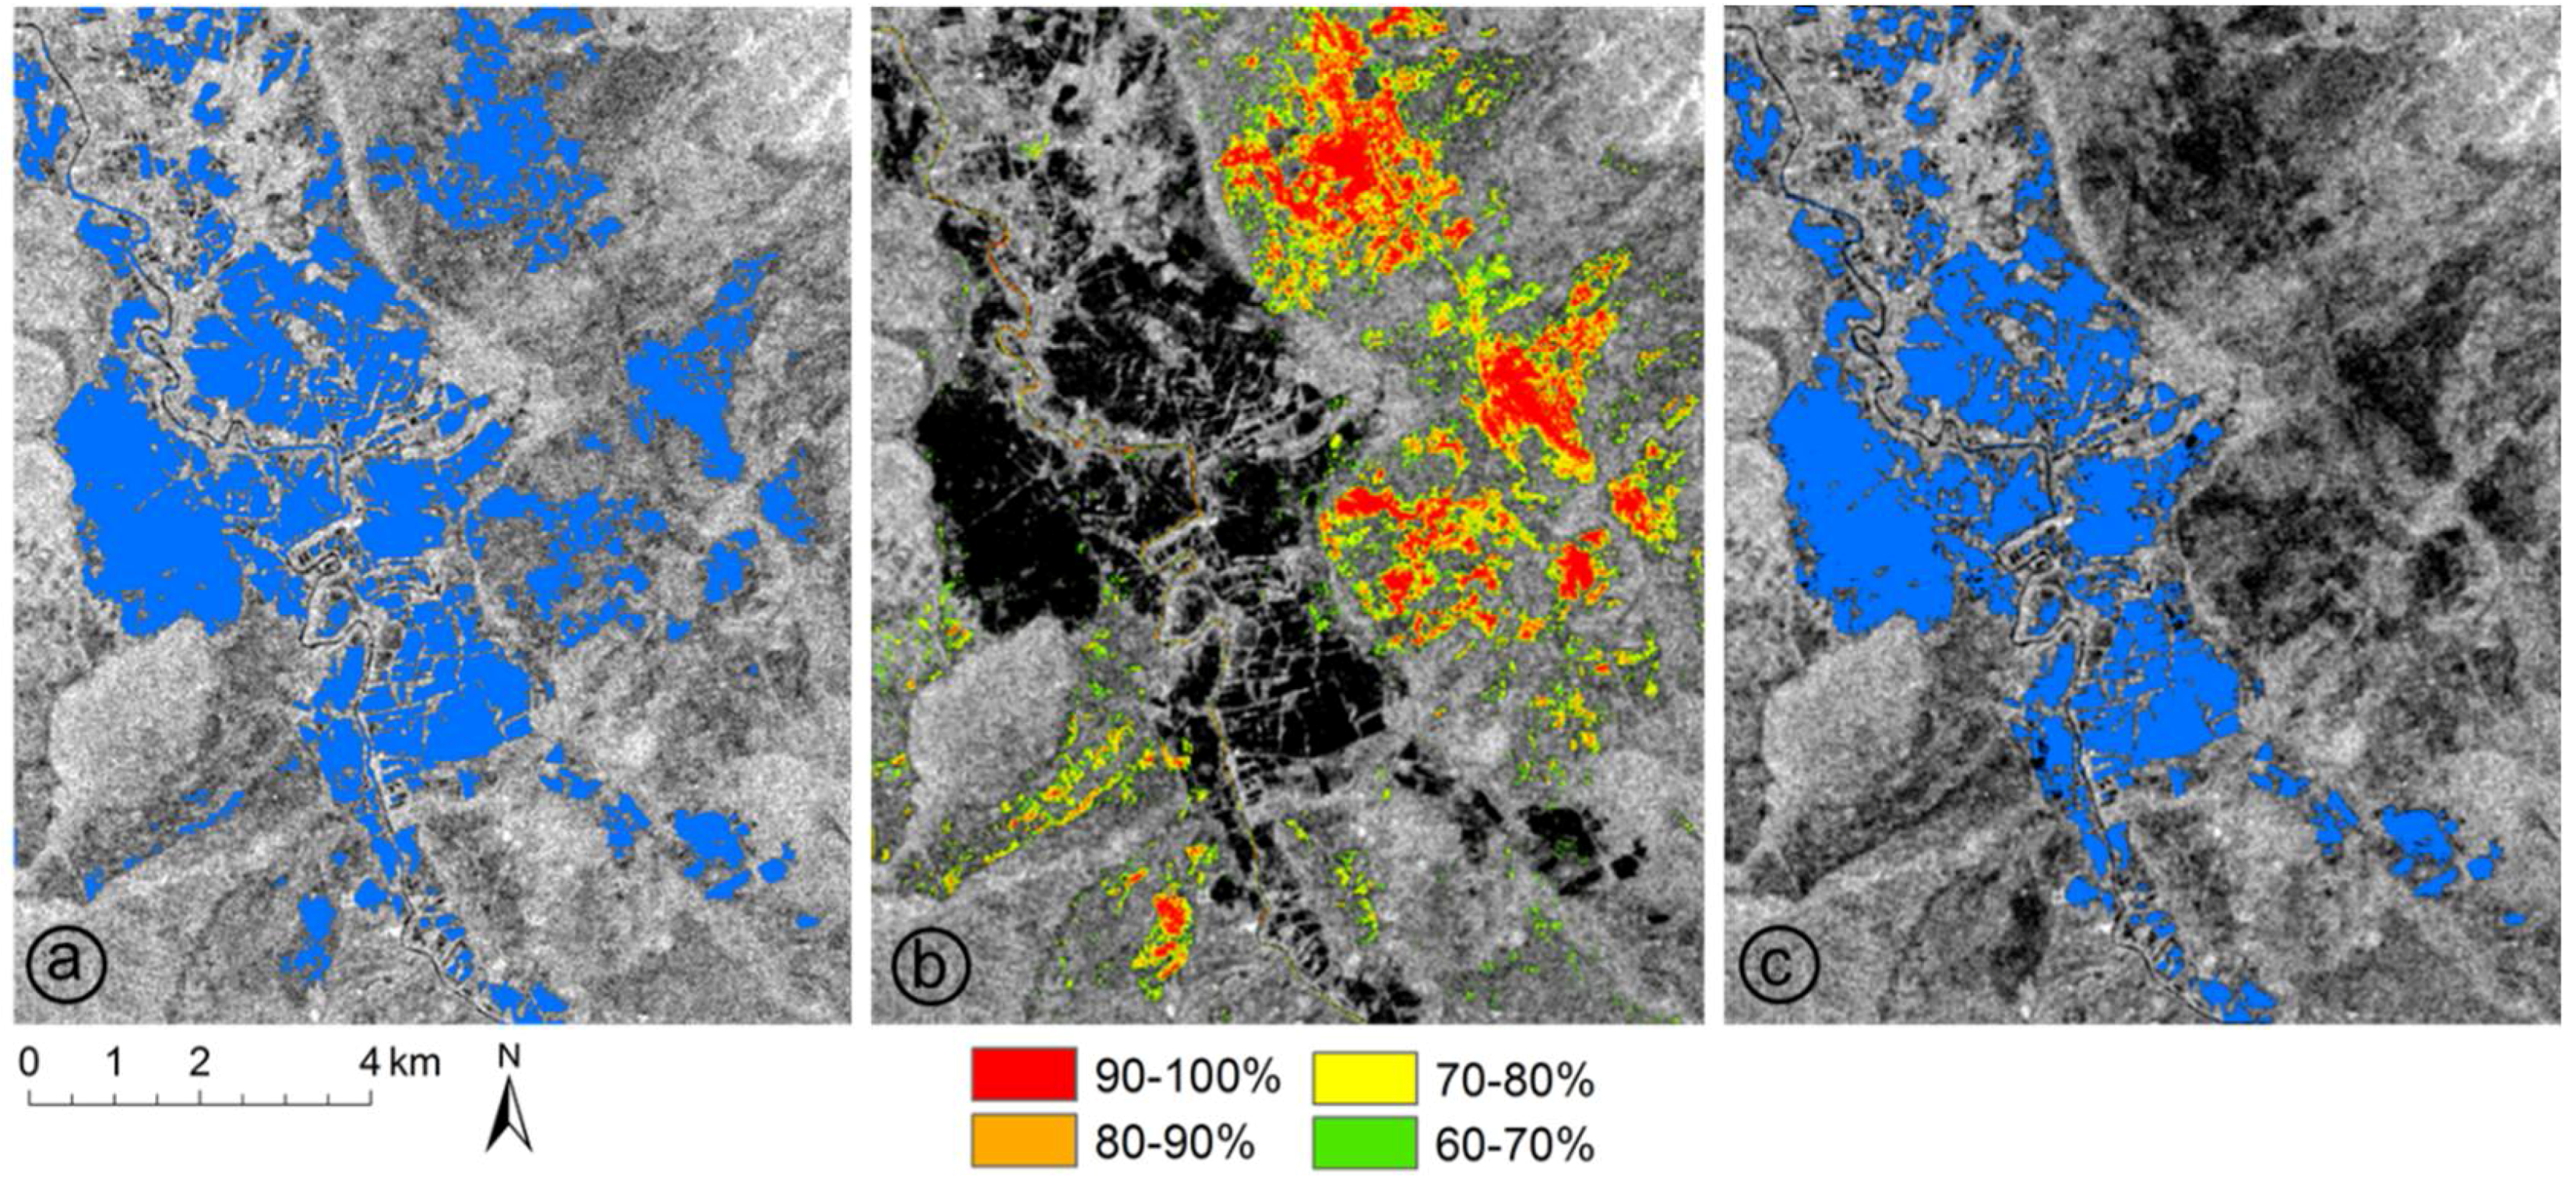
Within the first experiment, six combinations of frequency classes between 40–100% (Figure 6) were tested for the computation of the best Sand Exclusion Layer consisting of data of a three years’ time-series (1 June 2014–31 May 2017). The original flood mask of the Sentinel-1 Flood Service (Figure 7a) shows several false alarms as sand surfaces are wrongly classified as water. Therefore, the User’s Accuracy (UA) offers a value of only 70.8%, the Overall Accuracy (OA) shows a value of 93.4%. As can be seen in Figure 6, the best frequency range for computing the SEL is achieved by combining the frequency classes 60–100% (result 4 in Figure 6). This layer improves the OA of the final flood mask to a value of 98.5% (User’s Accuracy: 95.1%, Producer’s Accuracy: 94.3%). The final classification result based on the SEL60–100% is visualized in Figure 7c.
Within the second experiment, the impact of the lengths of the Sentinel-1 time-series on the classification result was investigated based on SEL60–100%.
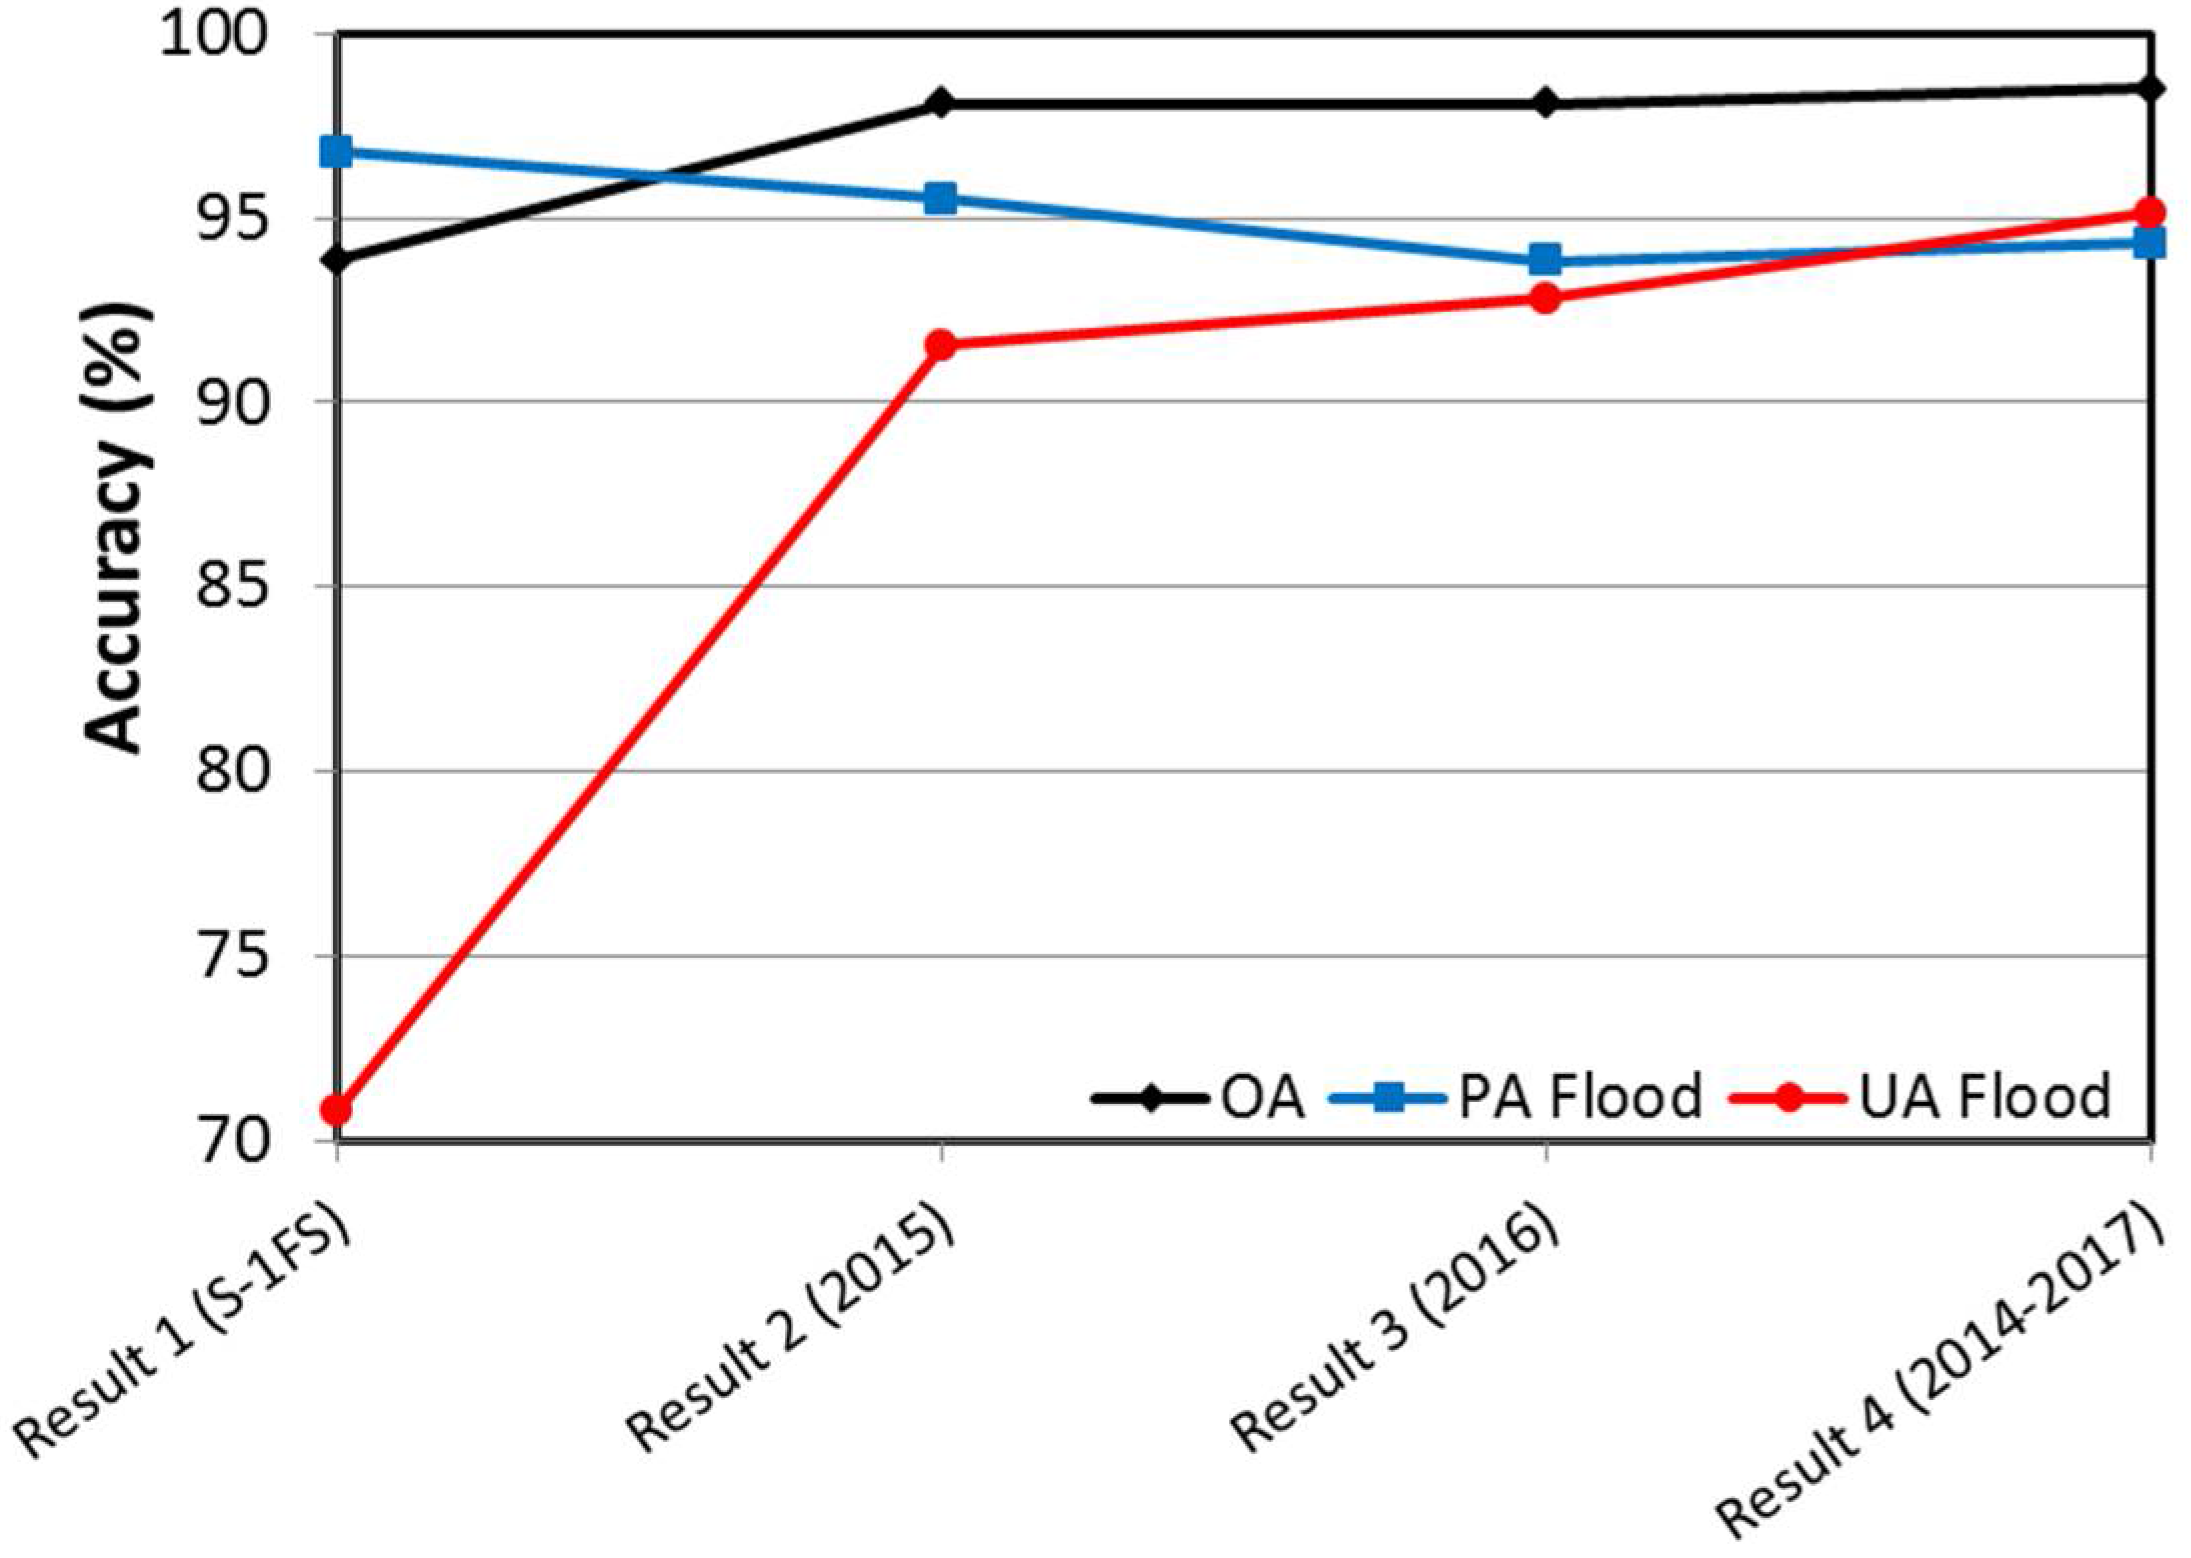
The classification result achieved by using SEL60–100% computed on the basis of 202 Sentinel-1 data of the three years’ time-series 2014–2017 (1 June 2014–31 May 2017, 202 data) is compared to time-series of only one-year covering the year 2015 (1 January 2015–31 December 2015; 55 data) and 2016 (1 January 2016–31 December 2016; 64 data) (Figure 8). Due to the systematic acquisition plan of the Sentinel-1 mission the time-series are regularly covered by data throughout the years. Thus, for each month, at least one acquisition is available (Figure 2). This helps to cover seasonal effects in this area. Further, this facilitates the comparison of the SELs computed from different time-series lengths.
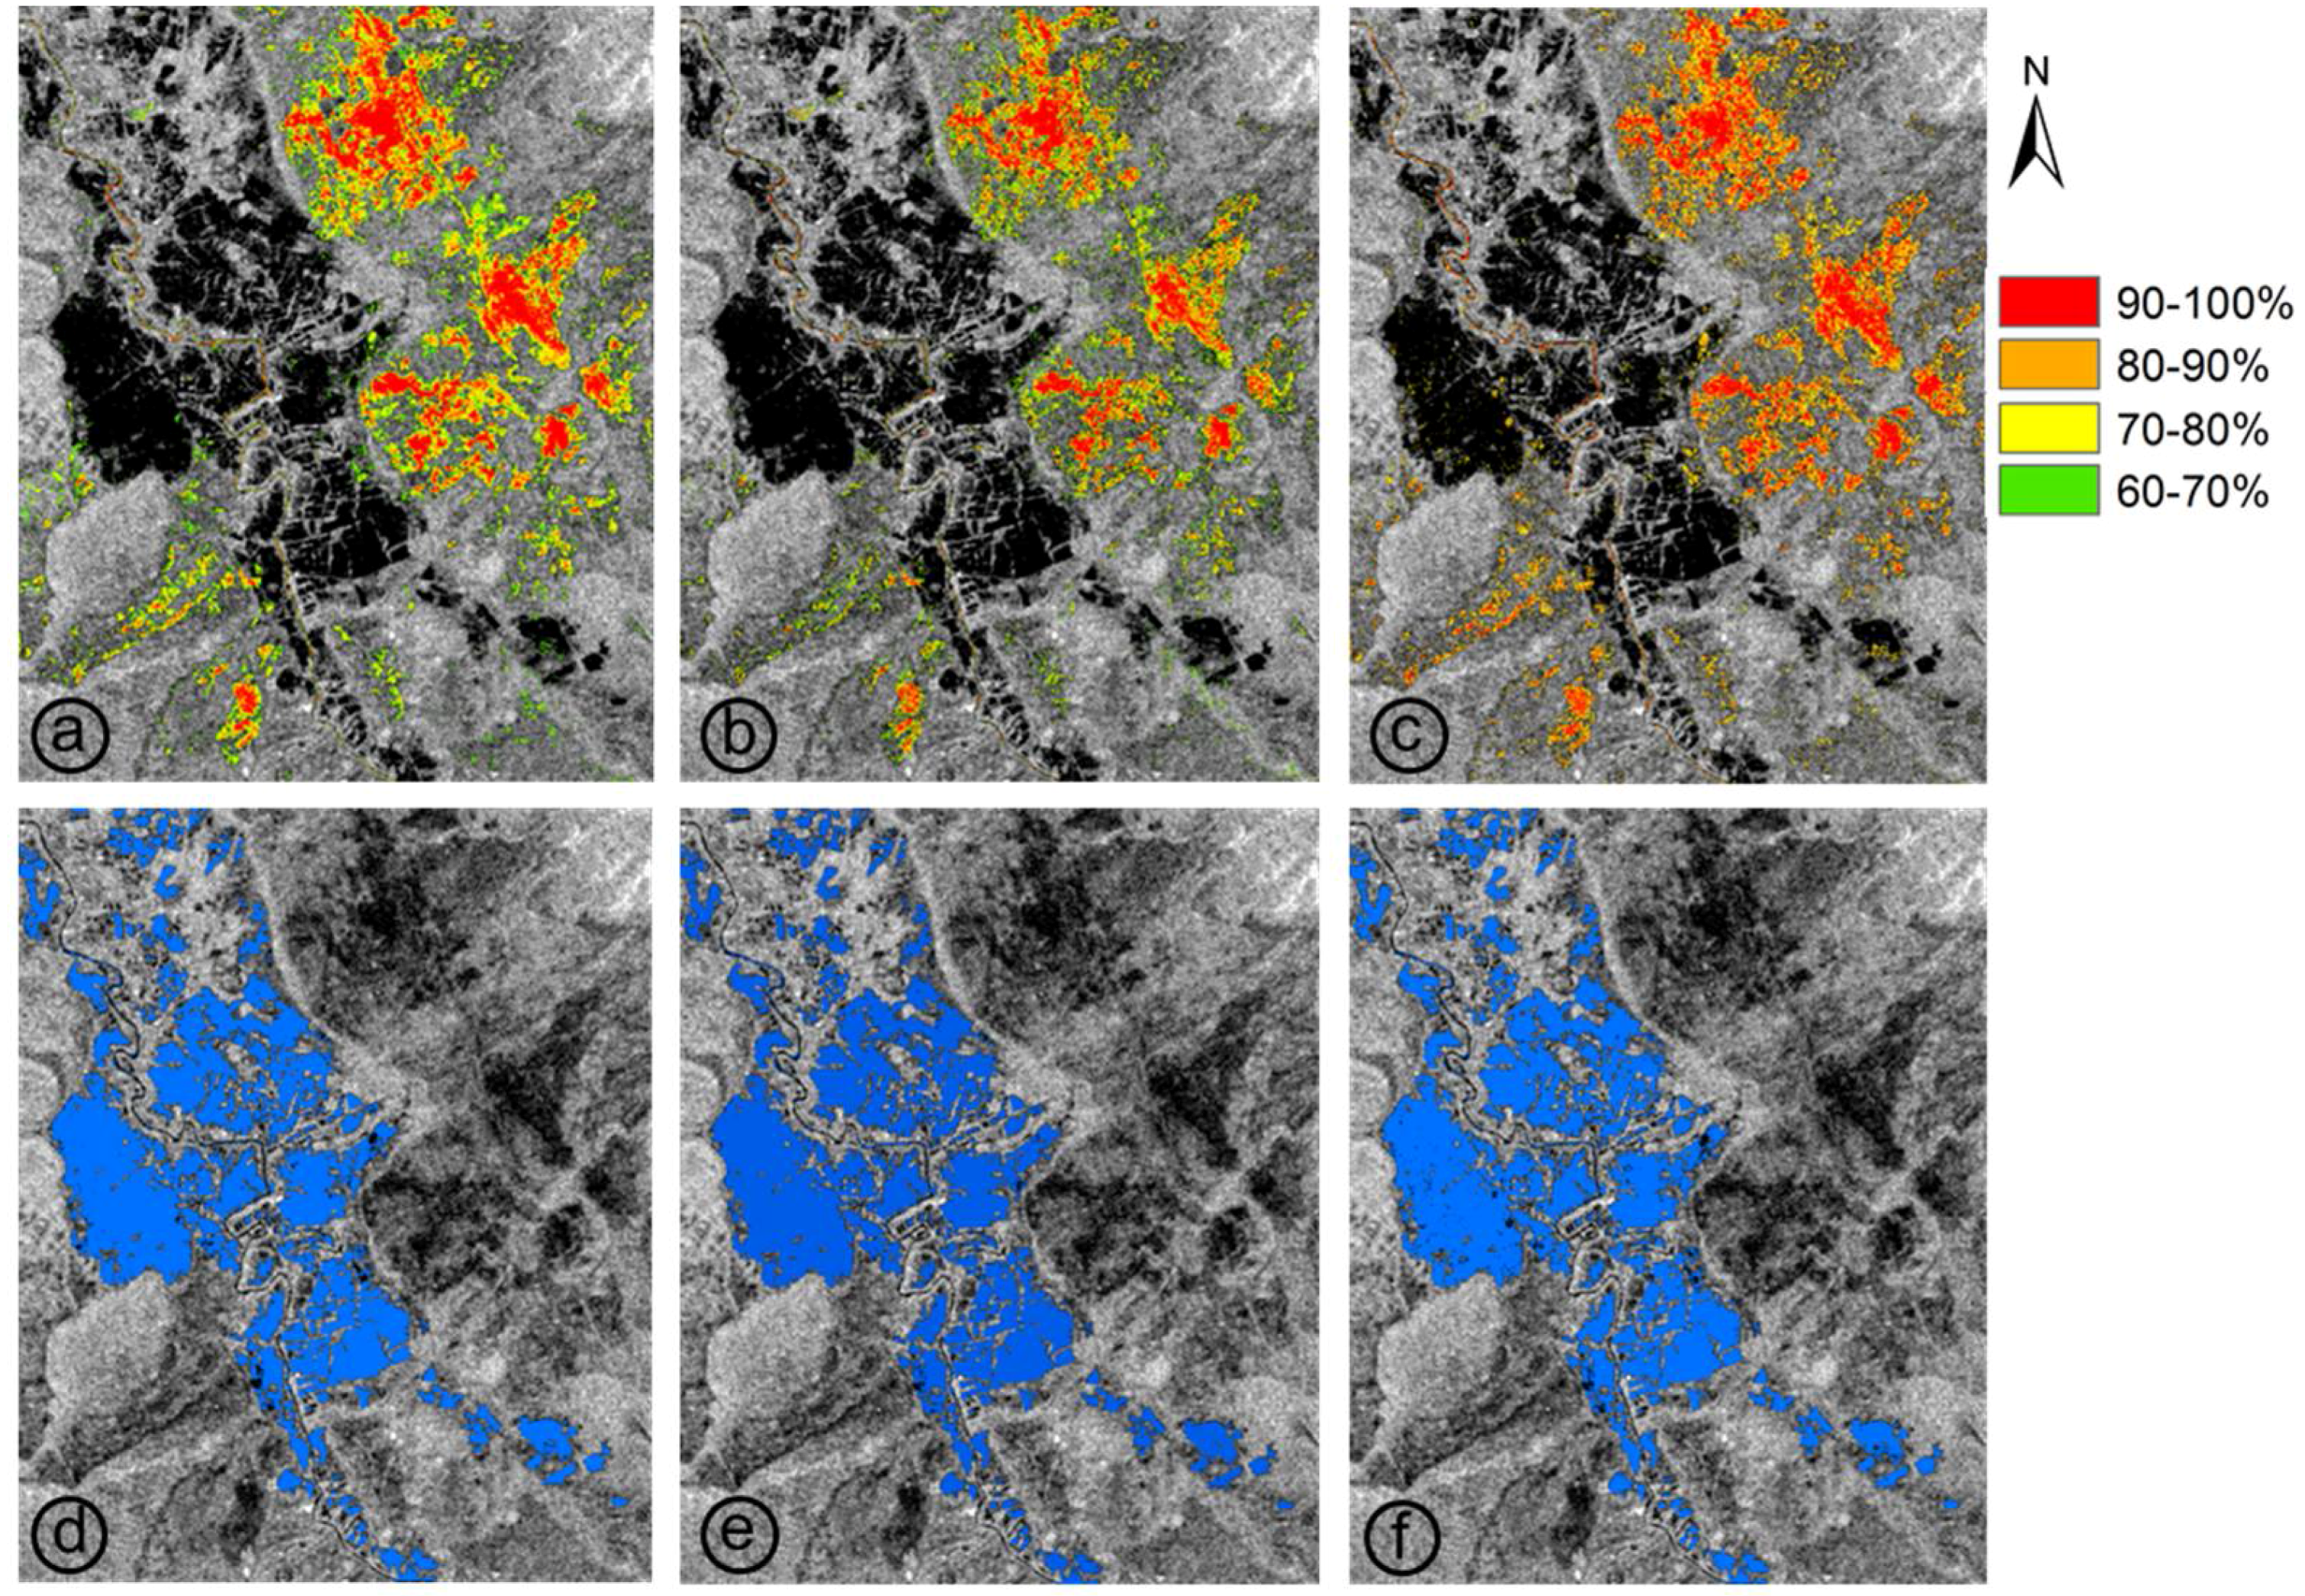
The SEL based on the three years’ time-series (OA 2014–2017: 98.5%) led to better classification results than the SELs based on data from only one year (OA 2015: 98.1% and OA 2016: 98.1%). The relative frequencies related to SEL60–100% and the respective classification results of the proposed method for the three time-series are visualized in Figure 9.
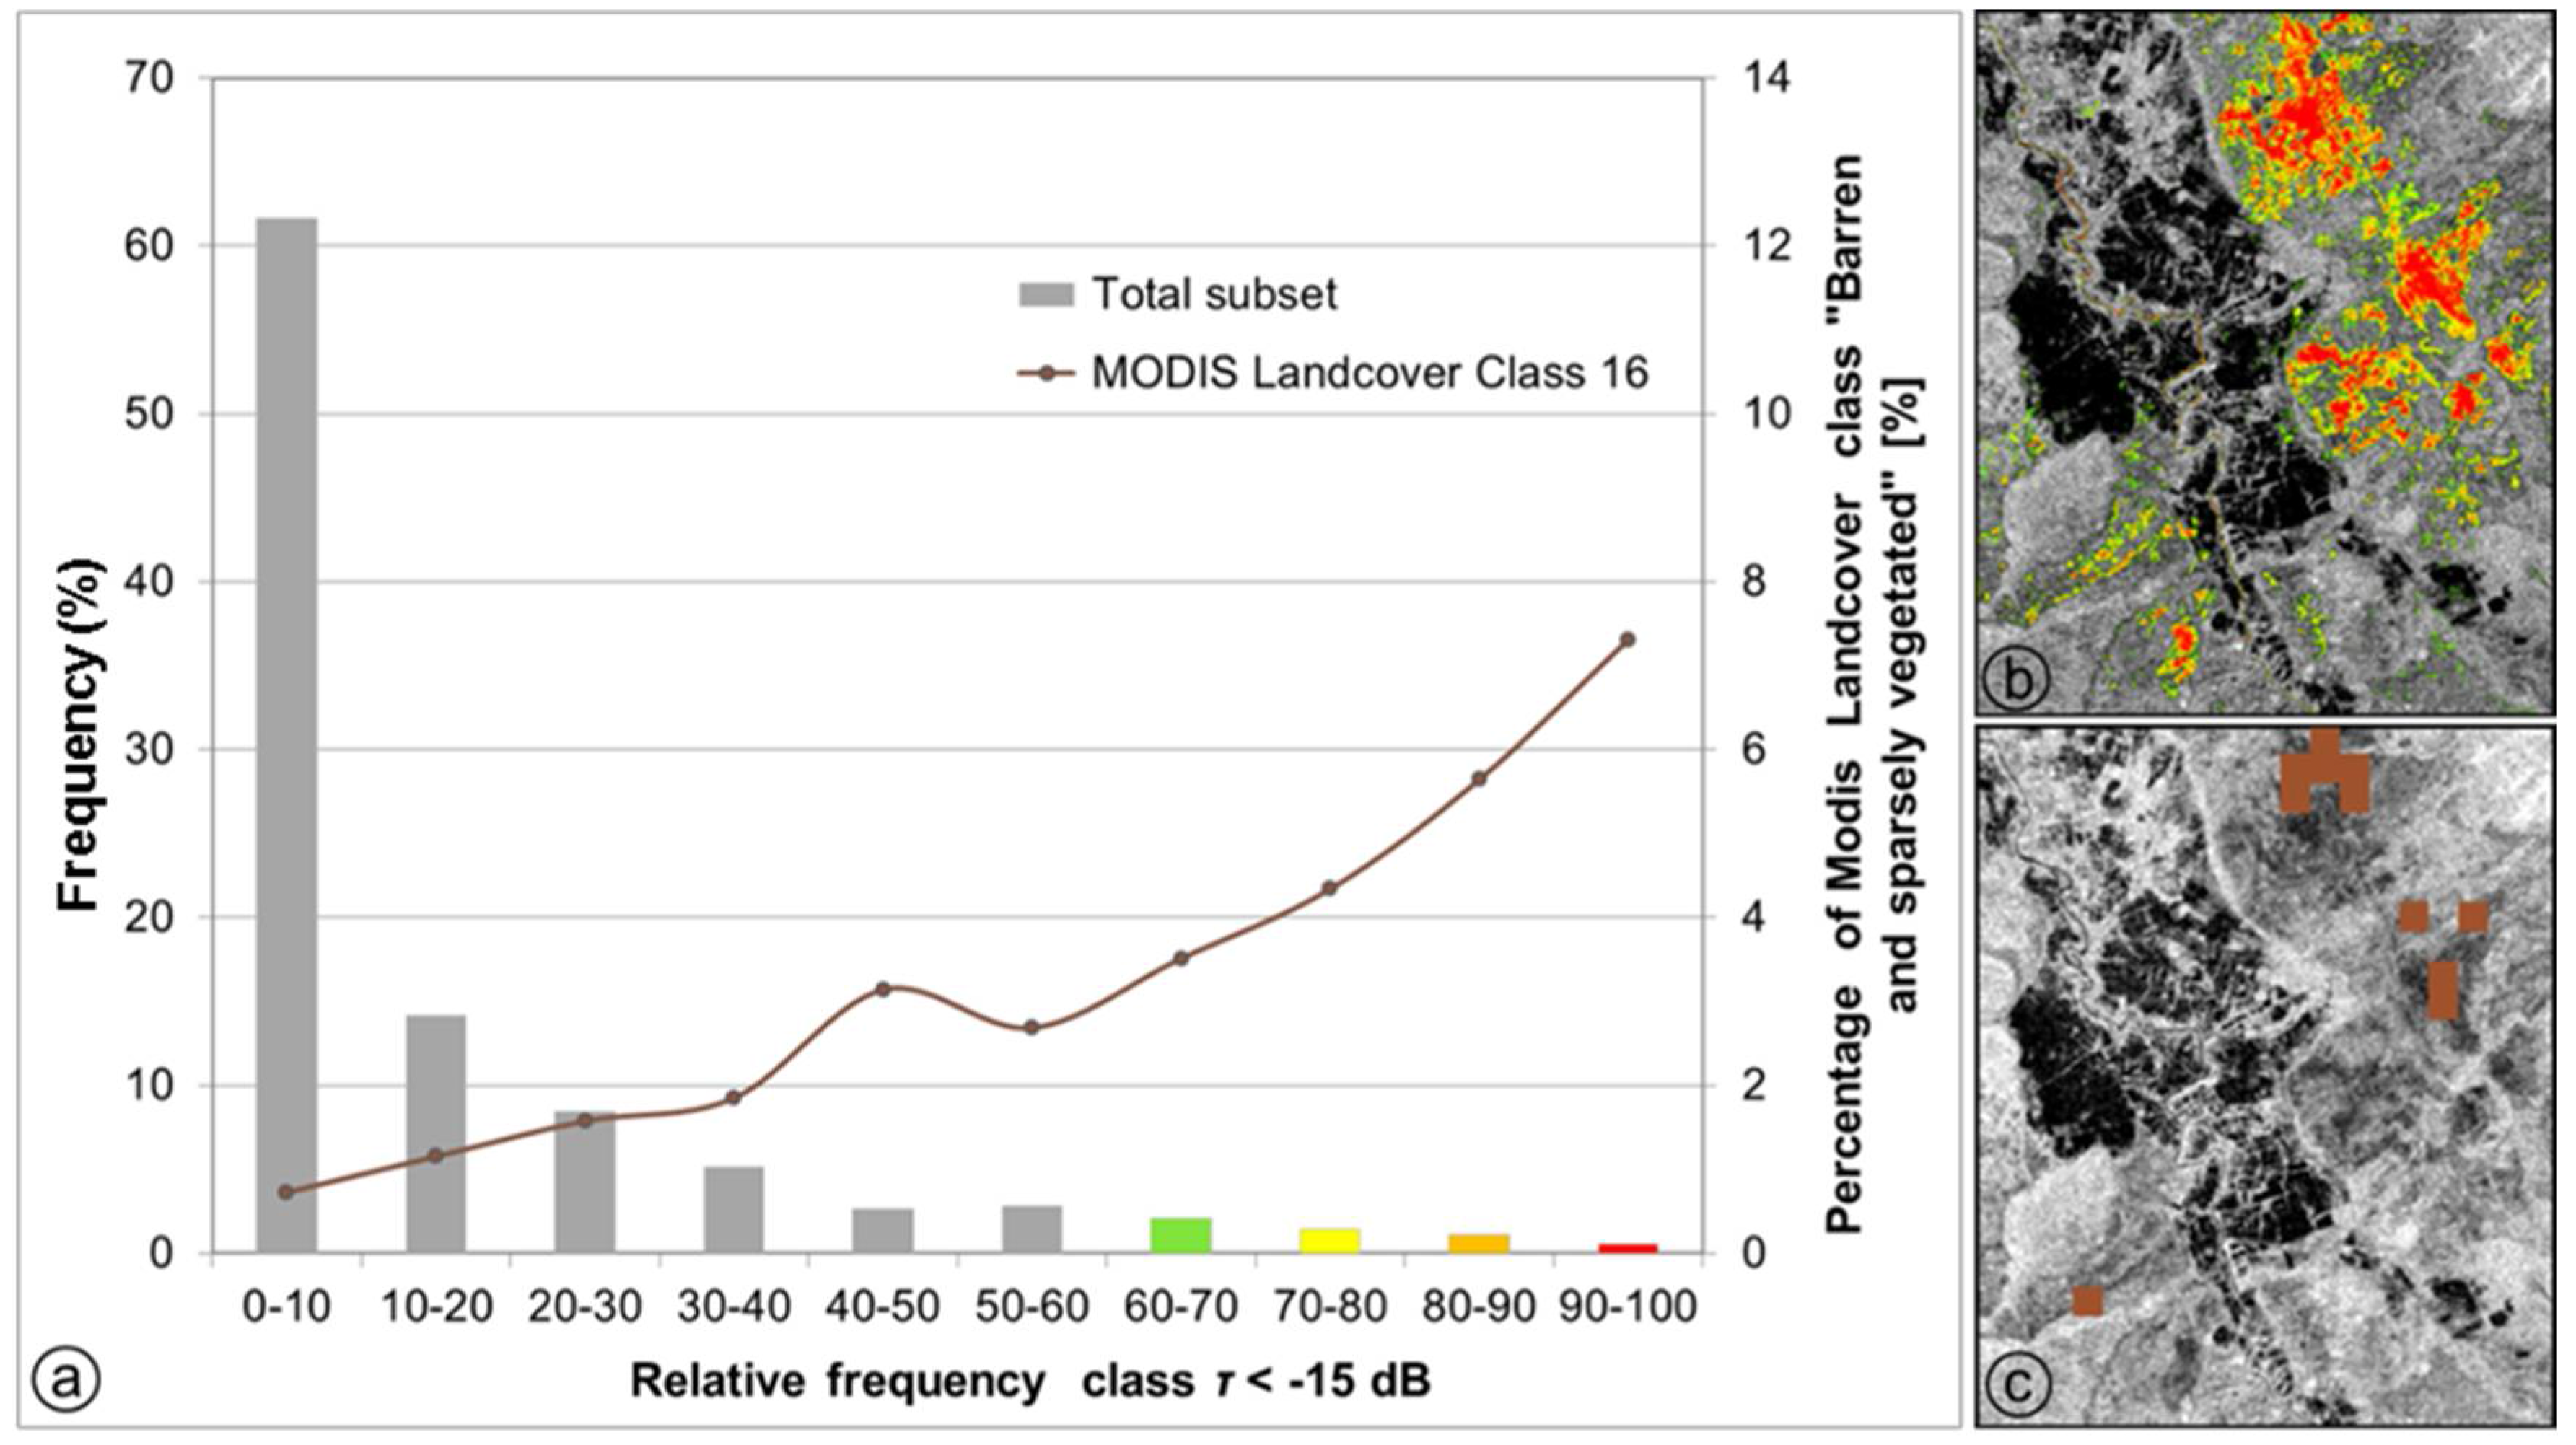
The third experiment focused on the comparison of the performance of the Sentinel-1-based SEL to other sources that could be used to exclude sand surfaces from the SAR-based flood classification. For this experiment, the SEL60–100% based on the three years’ time-series was compared to the class 16 “Barren or sparsely vegetated” of the MODIS/Terra Land Cover Types dataset MCD12Q1 (spatial resolution: 1 km). This product is, for example, used by Wendleder et al. (2013) [17] to exclude desert areas from the computation of a global water indication mask (WAM) using TanDEM-X SAR data.
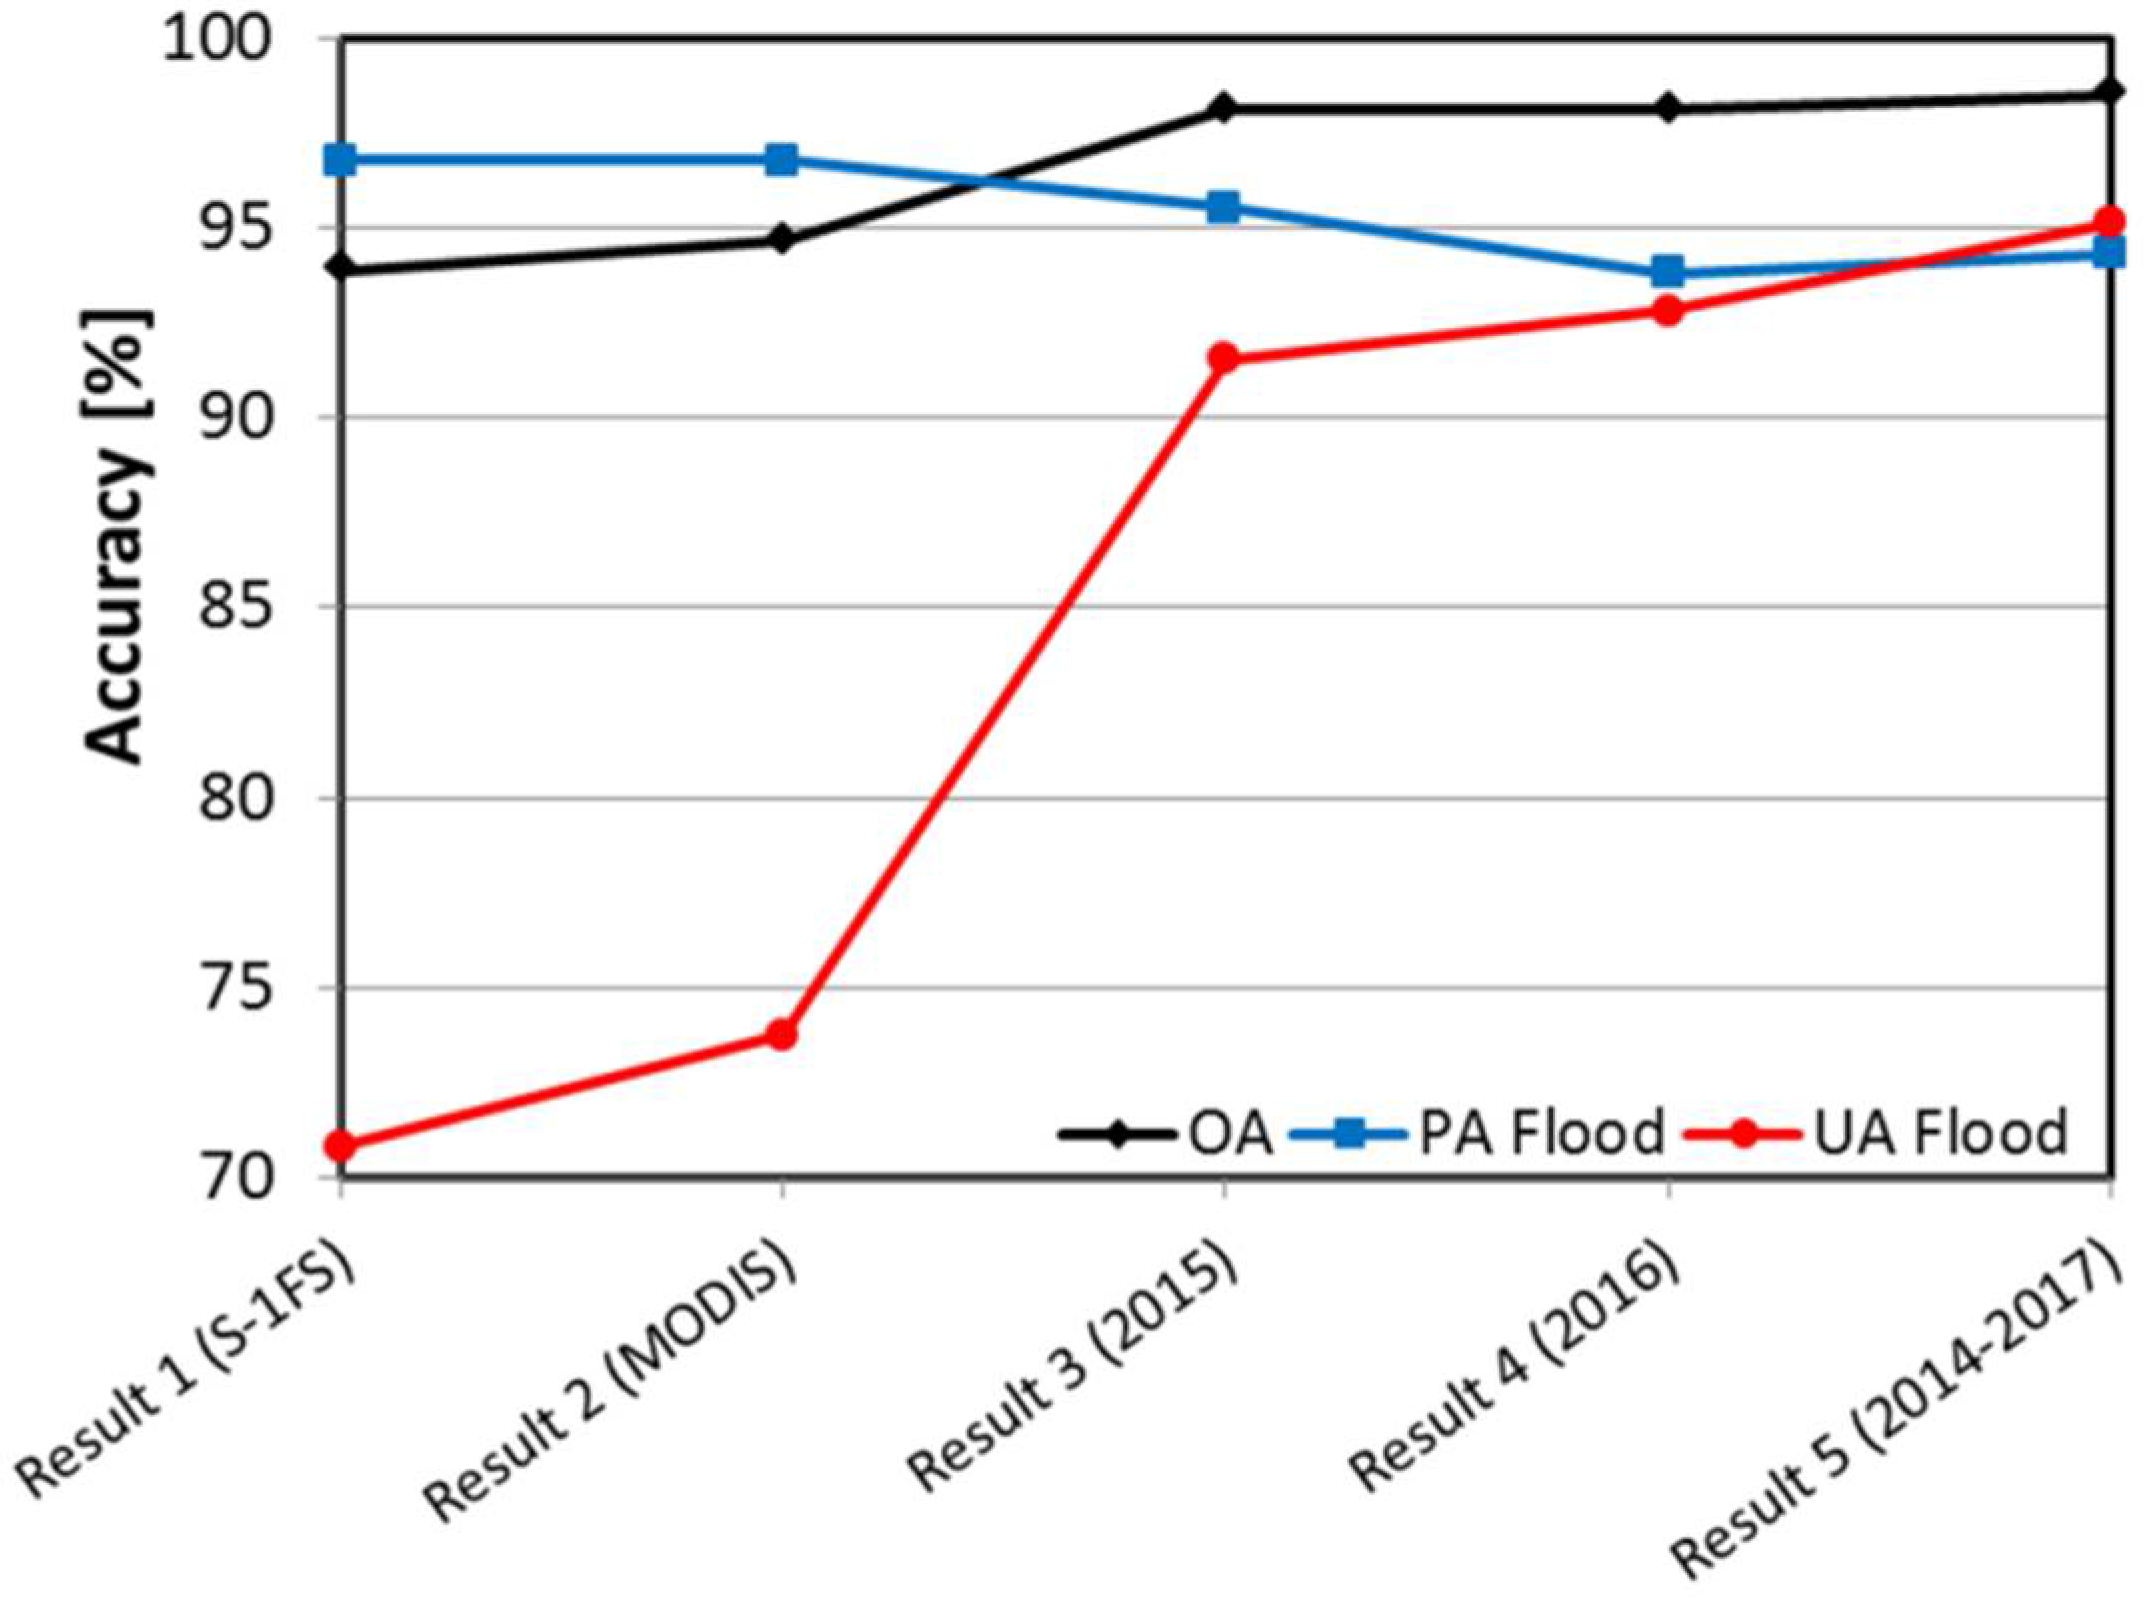
The bar chart in Figure 10a shows the distribution of the backscatter values of each pixel in the validation area within the 10% relative frequency classes. About 8% of the pixels in the subset are covered by the SEL60–100% (Figure 10a,b). The spatial coverage of the MODIS land cover class 16 is visualized in Figure 10c. As can be seen, there exists only a minor spatial overlap between the low-backscattering sand surfaces covered by SEL60–100% and the MODIS product. Even if one can see in Figure 10a an increasing percentage of the MODIS land cover class 16 with increasing relative frequency, there is only a minor overlap between the MODIS class and SEL60–100% (only 20.8% of the pixels classified to the relative frequency class 60–100% are also covered by MODIS class 16). This means that ~80% of the dark backscattering sand surfaces are not covered by the MODIS class 16. Therefore, it is not possible to remove most of the water look-alike areas related to sand surfaces using this product. The MODIS land cover class 16 only slightly increases the UA in comparison to the original flood mask of the Sentinel-1 Flood Service by about 3% (from 71% to 74%), while the Sentinel-1-based SELs lead to an increase of the UA of 22% (time-series of 2015) to 25% (time-series of 2014–2017) (Figure 11).
5. Discussion
According to the results achieved in Section 3, the proposed method strongly improves the reliability of flood classifications in arid regions where sand surfaces generally lead to strong overestimations of the water extent in SAR data. The generated SEL was able to remove most of the water look-alike areas related to frequently low-backscattering sand surfaces. Even if SEL60–100% achieved the best results, the SEL based on other relative frequency classes within the range 40–100% also significantly improves the flood classification result in comparison to the flood mask derived with the original version of the Sentinel-1 Flood Service. The usage of the Sentinel-1-based SEL also outperforms the MODIS/Terra Land Cover Types dataset MCD12Q1 (class 16: “Barren or sparsely vegetated”) which is used by Wendleder et al. [17] for improving SAR-based water classification in desert areas.
As can be seen in Figure 8, the SEL60–100% based on the three years’ time-series (OA 2014–2017: 98.5%) leads to better classification results than the exclusion layers based on data of only one year (OA 2015: 98.1% and OA 2016: 98.1%). It seems that a longer time-series is able to better cover seasonal effects. However, the difference of accuracy between the three years’ time-series and both of the one-year time-series is very low (0.4%). This difference in accuracy has to be weighed against the higher computational demand, particularly if the SEL has to be computed for large regions.
To cope with seasonal effects, it is suggested that SEL should be computed using a time-series of at least one year with minimum data coverage once a month. However, a time-series with higher data coverage increases the probability of reducing the effects, which might alter the usual appearance of the SAR data due to the occurrence of relatively infrequent events in desert areas such as flooding or precipitation.
The limitation of this method is related to the surface on which the flooding occurs. The developed approach is based on the computation of an exclusion layer of regions with continuous low backscatter. Thus, if flooding occurs in an area permanently covered by low-backscattering sand, these areas are removed from the flood mask. Therefore, the proposed approach can only improve the SAR-based flood mapping in arid areas when the flooding occurs on non-permanently low-backscattering areas (like in this study area in Somalia and Ethiopia).
Permanent water bodies also have a low backscatter over time in SAR data and would be removed from the detected water mask. Therefore, these areas have to be identified by using existing permanent water masks, such as the Shuttle Radar Topography Mission (SRTM) Water Body Data (SWBD), the Water Indication Mask (WAM) [17], or the global water occurrence product of the Joint Research Center (JRC) of the European Commission [29], which is based on Landsat time-series data.
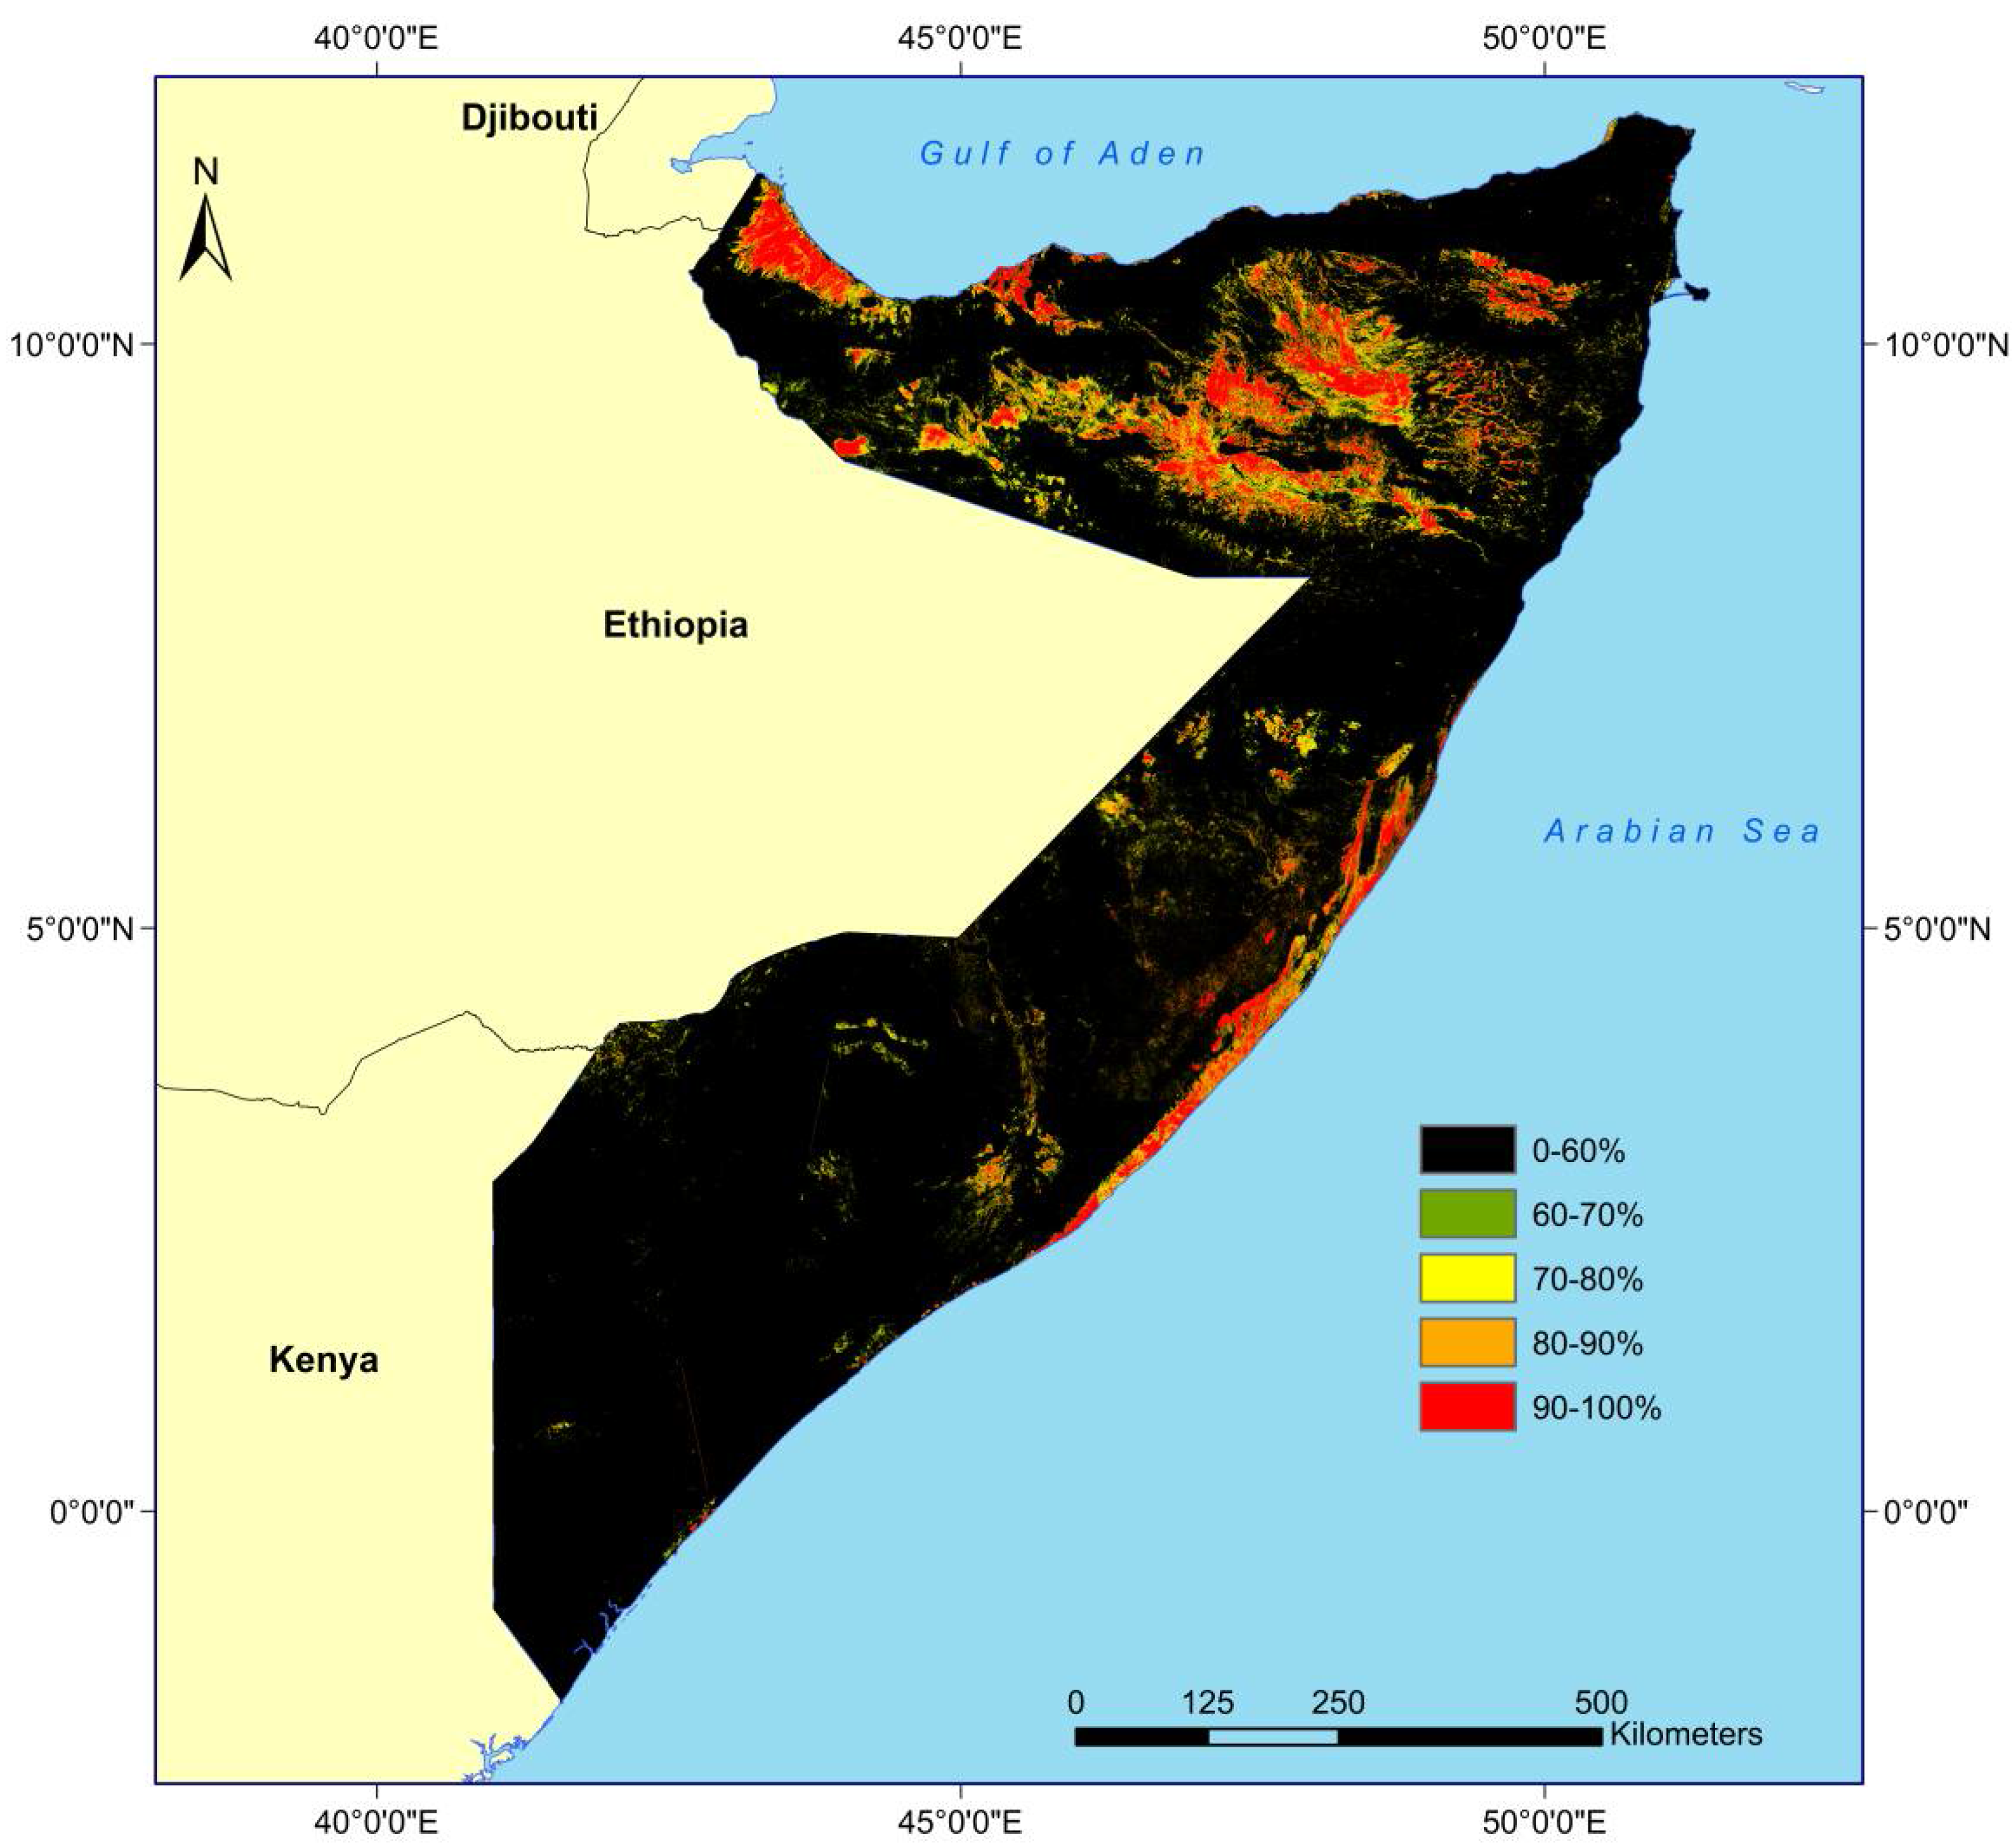
Due to computational reasons, offline processing of the SEL is required, which can be used as static auxiliary data set to be prepared in case of flood occurrence and, therefore, to be able to improve the near real-time flood detection during future rapid mapping activities. For example, the SEL for Somalia as visualized in Figure 12 can be used to improve the results of the automatic flood masks derived by the Sentinel-1 Flood Service within this country. This layer was computed for a Sentinel-1 time-series of three years (1 June 2014–31 May 2017) based on 1553 VV polarized Sentinel-1 data sets.
6. Conclusions
In this study, a methodology to improve the flood classification results of German Aerospace Center (DLR)’s automatic Sentinel-1 Flood Service (S-1FS) in arid areas was presented, where reliable SAR-based water detection is usually not possible due to the similarity of the backscatter of open water and sand surfaces.
This was accomplished by computing a Sand Exclusion Layer (SEL) from Sentinel-1 time-series data which was used to remove frequently low backscattering sand surfaces from the flood classification result of the Sentinel-1 Flood Service.
The method was applied on a test site in Somalia/Ethiopia and the influence of parameters (frequency range and the time-series length) on the classification result was evaluated. The approach proved capable of significantly improving the flood classification accuracy at this study site.
Best results were achieved by combining the relative frequency classes 60–100% for generating the SEL, which indicates that >60% of the pixels of the used Sentinel-1 time-series data have a backscatter lower than −15 dB. By varying the length of the time-series, it was observed that the classification accuracy increased with increasing number of data sets at the cost of higher computational demand.
The SEL based on the three years’ time-series with 202 data sets (OA 06/2014–05/2017: 98.5%) led to better classification results than the SELs based on data of only one year from 2015 (OA: 98.1%, 55 data) and 2016 (OA 2016: 98.1%, 65 data). However, as the difference in accuracy between the three years’ time-series and both of the one-year time-series was very low (0.4%) this slight improvement has to be weighed against the higher computational demand. Due to computational reasons, the SEL can be processed offline for a certain time period over the required arid areas in order to improve the NRT applicability of the automatic flood processing chain during disaster management activities by removing sand-related water look-alike areas.
Further, it was observed that the Sentinel-1-based SEL outperformed the class 16 “Barren or sparsely vegetated” of the MODIS/Terra Land Cover Types dataset MCD12Q1 (spatial resolution: 1 km), which is alternatively used in the literature for excluding desert areas in SAR-based water detection. While the MODIS land cover product only slightly increased (by about 3.2%) the User’s Accuracy in comparison to the original flood mask of the Sentinel-1 Flood Service (from 70.8% to 74.0%), the Sentinel-1-based SELs led to an increase of the User’s Accuracy of up to 25.2% (from 70.8% to 96.0%).
The limitation of this approach is that it can only improve the SAR-based flood mapping in arid areas when the flooding occurs over non-permanently low-backscattering sand surfaces.
Future work will focus on testing the transferability of the methodology to other flood scenarios in arid areas.
Acknowledgments
The authors are grateful to three anonymous reviewers for their helpful comments.
Author Contributions
Sandro Martinis wrote the manuscript, developed the methodology, and performed the majority of the processing. Simon Plank and Kamila Ćwik supported the time-series processing and performed the validation.
Conflicts of Interest
The authors declare no conflicts of interest.
References
- Martinis, S.; Twele, A.; Voigt, S. Towards operational near real-time flood detection using a split-based automatic thresholding procedure on high resolution TerraSAR-X data. Nat. Harzad. Earth Syst. Sci. 2009, 9, 303–314. [Google Scholar] [CrossRef]
- Schumann, G.; Di Baldassarre, G.; Alsdorf, D.; Bates, P.D. Near real-time flood wave approximation on large rivers from space: Application to the River Po, Italy. Water Resour. Res. 2010, 46. [Google Scholar] [CrossRef]
- Matgen, P.; Hostache, R.; Schumann, G.; Pfister, L.; Hoffman, L.; Svanije, H.H.G. Towards an automated SAR based flood monitoring system: Lessons learned from two case studies. Phys. Chem. Earth 2011, 36, 241–252. [Google Scholar] [CrossRef]
- Pulvirenti, L.; Pierdicca, N.; Chini, M.; Guerriero, L. An algorithm for operational flood mapping from Synthetic Aperture Radar (SAR) data using fuzzy logic. Nat. Harzad. Earth Syst. Sci. 2011, 11, 529–540. [Google Scholar] [CrossRef] [Green Version]
- Martinis, S.; Kersten, J.; Twele, A. A fully automated TerraSAR-X based flood service. ISPRS J. Photogramm. Remote Sens. 2015, 104, 203–212. [Google Scholar] [CrossRef]
- Chini, M.; Giustarini, L.; Hostache, R.; Matgen, P. A hierarchical split-based approach for parametric thresholding of SAR images: Flood Inundation as a Test Case. IEEE Trans. Geosci. Remote Sens. 2017, 55, 6975–6988. [Google Scholar] [CrossRef]
- Cao, W.; Martinis, S.; Plank, S. Automatic SAR-based flood detection using hierarchical tile-ranking thresholding and fuzzy logic. In Proceedings of the 2017 IEEE International Geoscience and Remote Sensing Symposium (IGARSS), Fort Worth, TX, USA, 23–28 July 2017; pp. 1–4. [Google Scholar]
- Twele, A.; Cao, W.; Plank, S.; Martinis, S. Sentinel-1 based flood mapping: A fully automated processing chain. Int. J. Remote Sens. 2016, 37, 2990–3004. [Google Scholar] [CrossRef]
- Mason, D.C.; Davenport, I.J.; Neal, J.C.; Schumann, G.J.-P.; Bates, P.D. Near real-time flood detection in urban and rural areas using high-resolution Synthetic Aperture Radar images. IEEE Trans. Geosci. Remote Sens. 2012, 50, 3041–3052. [Google Scholar] [CrossRef]
- Giustarini, L.; Hostache, R.; Matgen, P.; Schumann, G.; Bates, P.D.; Mason, D.C. A change detection approach to flood mapping in urban areas using TerraSAR-X. IEEE Trans. Geosci. Remote Sens. 2013, 51, 2417–2430. [Google Scholar] [CrossRef]
- Martinis, S.; Twele, A.; Plank, S.; Zwenzner, H.; Danzeglocke, J.; Strunz, G.; Lüttenberg, H.; Dech, S. The International ‘Charter Space and Major Disasters’: DLR’s contributions to emergency response world-wide. J. Photogramm. Remote Sens. Geoinf. Sci. 2017, 85, 317–325. [Google Scholar] [CrossRef]
- Mahmood, A. Monitoring disasters with a constellation of satellites-type examples from the International Charter “Space and Major Disasters”. Geocarto Int. 2012, 27, 91–101. [Google Scholar] [CrossRef]
- Kittler, J.; Illingworth, J. Minimum error thresholding. Pattern Recognit. 1986, 19, 41–47. [Google Scholar] [CrossRef]
- Martinis, S.; Twele, A.; Strobl, C.; Kersten, J.; Stein, E. A multi-scale flood monitoring system based on fully automatic MODIS and TerraSAR-X processing chains. Remote Sens. 2013, 5, 5598–5619. [Google Scholar] [CrossRef] [Green Version]
- Otsu, N. A threshold selection method from gray-level histograms. IEEE Trans. Syst. Man Cybern. 1979, 9, 62–66. [Google Scholar] [CrossRef]
- Schlaffer, S.; Matgen, P.; Hollaus, M.; Wagner, W. Flood detection from multi-temporal SAR data using harmonic analysis and change detection. Int. J. Appl. Earth Obs. Geoinf. 2015, 38, 15–24. [Google Scholar] [CrossRef]
- Wendleder, A.; Wessel, B.; Roth, A.; Breunig, M.; Martin, K.; Wagenbrenner, S. TanDEM-X Water Indication Mask: Generation and first evaluation results. IEEE J. Sel. Top. Appl. Earth Obs. Remote Sens. 2013, 6, 171–179. [Google Scholar] [CrossRef] [Green Version]
- Bertram, A.; Wendleder, A.; Schmitt, A.; Huber, M. Long-term Monitoring of water dynamics in the Sahel region using the Multi-SAR-System. In Proceedings of the Congress of the International Society for Photogrammetry and Remote Sensing (ISPRS), Prague, Czech Republic, 12–19 July 2017. [Google Scholar]
- O’Grady, D.; Leblanc, M.; Gillieson, D. Use of ENVISAT ASAR Global Monitoring Mode to complement optical data in the mapping of rapid broad-scale flooding in Pakistan. Hydrol. Earth Syst. Sci. 2011, 15, 3475–3494. [Google Scholar] [CrossRef]
- Westerhoff, R.S.; Kleuskens, M.P.H.; Winsemius, H.C.; Huizinga, H.J.; Brakenridge, G.R.; Bishop, C. Automated global water mapping based on wide-swath orbital synthetic-aperture radar. Hydrol. Earth Syst. Sci. 2013, 17, 651–663. [Google Scholar] [CrossRef]
- Martinis, S. Improving flood mapping in arid areas using Sentinel-1 time series data. In Proceedings of the 2017 IEEE International Geoscience and Remote Sensing Symposium (IGARSS), Fort Worth, TX, USA, 23–28 July 2017; pp. 193–196. [Google Scholar]
- Reliefweb. Available online: https://reliefweb.int/disaster/fl-2015-000153-irq (accessed on 20 September 2017).
- FAO-SWALIM. Available online: http://www.faoswalim.org/water/climate-somalia (accessed on 6 March 2018).
- FloodList. Available online: http://www.floodlist.com (accessed on 3 January 2018).
- Ulaby, F.T.; Moore, R.K.; Fung, A.K. Microwave Remote Sensing: Active and Passive; Volume II—Radar Remote Sensing and Surface Scattering and Emission Theory; Addison-Wesley Publishing Company: Reading, MA, USA, 1982; pp. 458–1064. ISBN 0201107600. [Google Scholar]
- Deroin, J.-P.; Company, A.; Simonin, A. An empirical model for interpreting the relationship between backscattering and arid land surface roughness as seen with the SAR. IEEE Trans. Geosci. Remote Sens. 1997, 35, 86–92. [Google Scholar] [CrossRef]
- Ridley, J.; Strawbridge, F.; Card, R.; Phillips, H. Radar backscatter characteristics of a desert surface. Remote Sens. Environ. 1996, 57, 63–78. [Google Scholar] [CrossRef]
- Williams, K.K.; Greeley, R. Radar Attenuation by Sand: Laboratory measurements of radar transmission. IEEE Trans. Geosci. Remote Sens. 2001, 39, 2521–2526. [Google Scholar] [CrossRef]
- Pekel, J.-F.; Cottam, A.; Gorelick, N.; Belward, A.S. High-resolution mapping of global surface water and its long-term changes. Nature 2016, 540, 418–422. [Google Scholar] [CrossRef] [PubMed]
Figure 1.
(a) Sentinel-1 VV polarized data set covering parts of Somalia and Ethiopia during flooding at Shabelle River on 30 May 2016. The green rectangle visualizes the study area in Somalia (6.090°N, 44.535°E (upper left); 4.090°N, 45.817°E (lower right)); the red rectangle represents the validation area (4.695°N, 45.287°E (upper left); 4.593°N, 45.287°E (lower right)); (b) subset of Sentinel-1 VV polarized data set according to the validation area; (c) reference flood mask derived by visual interpretation and manual digitization of optical data acquired on 25 May 2016, 28 May 2016, and 4 June 2016.

Figure 2.
Sentinel-1 time-series information available for the study area within the period 1 June 2014–31 May 2107.
Figure 2.
Sentinel-1 time-series information available for the study area within the period 1 June 2014–31 May 2107.

Figure 3.
Histograms for water and dark backscattering sand surfaces for VV and VH polarized Sentinel-1 data sets within the validation area in Somalia.
Figure 3.
Histograms for water and dark backscattering sand surfaces for VV and VH polarized Sentinel-1 data sets within the validation area in Somalia.

Figure 4.
Workflow of German Aerospace Center (DLR)’s Sentinel-1 Flood Service extended by the Sand Exclusion Layer. NRT: near real-time; GRD: Ground Range Detected; HAND: Height above Nearest Drainage Index; WMS: web mapping service.
Figure 4.
Workflow of German Aerospace Center (DLR)’s Sentinel-1 Flood Service extended by the Sand Exclusion Layer. NRT: near real-time; GRD: Ground Range Detected; HAND: Height above Nearest Drainage Index; WMS: web mapping service.

Figure 5.
(a) Sentinel-1 acquisition frequency mask f (time period: 1 June 2014–31 May 2017); (b) absolute frequency fa (τ < −15 dB); (c) relative frequency fr (grouped in 10% classes); (d) Sand Exclusion Layer (SEL) based on classes 50–100%.
Figure 5.
(a) Sentinel-1 acquisition frequency mask f (time period: 1 June 2014–31 May 2017); (b) absolute frequency fa (τ < −15 dB); (c) relative frequency fr (grouped in 10% classes); (d) Sand Exclusion Layer (SEL) based on classes 50–100%.

Figure 6.
Overall (OA), User’s (UA), and Producer’s Accuracies (PA) of the classification results of the Sentinel-1 Flood Service (S-1FS) and of the improvements using the Sand Exclusion Layers computed with different frequency intervals.
Figure 6.
Overall (OA), User’s (UA), and Producer’s Accuracies (PA) of the classification results of the Sentinel-1 Flood Service (S-1FS) and of the improvements using the Sand Exclusion Layers computed with different frequency intervals.

Figure 7.
(a) Original flood mask of the Sentinel-1 Flood Service derived over the validation area in Somalia; (b) frequency classes 60–100% used for computing the Sand Exclusion Layer; (c) improved classification result using the SEL.
Figure 7.
(a) Original flood mask of the Sentinel-1 Flood Service derived over the validation area in Somalia; (b) frequency classes 60–100% used for computing the Sand Exclusion Layer; (c) improved classification result using the SEL.

Figure 8.
Overall (OA), User’s (UA), and Producer’s Accuracies (PA) of the flood masks produced by the Sentinel-1 Flood Service and of the improvements using SEL60–100% computed with different time-series lengths.
Figure 8.
Overall (OA), User’s (UA), and Producer’s Accuracies (PA) of the flood masks produced by the Sentinel-1 Flood Service and of the improvements using SEL60–100% computed with different time-series lengths.

Figure 9.
Relative frequency classes 60–100% (τ < −15 dB) for the time-series (a) 2014–2017 (1 June 2014–31 May 2017), (b) 2015 (1 January 2015–31 December 2015), and (c) 2016 (1 January 2016–31 December 2016) and respective flood classification results derived by the Sentinel-1 Flood Service and improved by the SEL60–100% for the time-series (d) 2014–2017, (e) 2015, and (f) 2016.

Figure 10.
(a) Distribution of pixel frequencies of SEL60–100% vs. MODIS Landcover (MCD12Q1) Class 16 (“Barren or sparsely vegetated”); (b) frequency classes 60–100% used for computing SEL60–100%; (c) MODIS Landcover Class 16.
Figure 10.
(a) Distribution of pixel frequencies of SEL60–100% vs. MODIS Landcover (MCD12Q1) Class 16 (“Barren or sparsely vegetated”); (b) frequency classes 60–100% used for computing SEL60–100%; (c) MODIS Landcover Class 16.

Figure 11.
Overall (OA), User’s (UA), and Producer’s Accuracies (PA) of the flood masks produced by the Sentinel-1 Flood Service and of the improvements using the MODIS Landcover Class 16 and the SEL60–100% computed with different time-series lengths.
Figure 11.
Overall (OA), User’s (UA), and Producer’s Accuracies (PA) of the flood masks produced by the Sentinel-1 Flood Service and of the improvements using the MODIS Landcover Class 16 and the SEL60–100% computed with different time-series lengths.

Figure 12.
Relative frequency classes related to SEL60–100% based on a three-year Sentinel-1 time-series computed for Somalia based on 1553 VV polarized Sentinel-1 data sets.
Figure 12.
Relative frequency classes related to SEL60–100% based on a three-year Sentinel-1 time-series computed for Somalia based on 1553 VV polarized Sentinel-1 data sets.

© 2018 by the authors. Licensee MDPI, Basel, Switzerland. This article is an open access article distributed under the terms and conditions of the Creative Commons Attribution (CC BY) license (http://creativecommons.org/licenses/by/4.0/).
Share and Cite
MDPI and ACS Style
Martinis, S.; Plank, S.; Ćwik, K. The Use of Sentinel-1 Time-Series Data to Improve Flood Monitoring in Arid Areas. Remote Sens. 2018, 10, 583. https://0-doi-org.brum.beds.ac.uk/10.3390/rs10040583
AMA Style
Martinis S, Plank S, Ćwik K. The Use of Sentinel-1 Time-Series Data to Improve Flood Monitoring in Arid Areas. Remote Sensing. 2018; 10(4):583. https://0-doi-org.brum.beds.ac.uk/10.3390/rs10040583
Chicago/Turabian StyleMartinis, Sandro, Simon Plank, and Kamila Ćwik. 2018. "The Use of Sentinel-1 Time-Series Data to Improve Flood Monitoring in Arid Areas" Remote Sensing 10, no. 4: 583. https://0-doi-org.brum.beds.ac.uk/10.3390/rs10040583
Note that from the first issue of 2016, this journal uses article numbers instead of page numbers. See further details here.