Article

The Temporal-Spatial Characteristics of Drought in the Loess Plateau Using the Remote-Sensed TRMM Precipitation Data from 1998 to 2014

1
College of water Resources and Architectural Engineering, Northwest A&F University, Yangling 712100, China
2
Institute of Soil and Water Conservation, Northwest A&F University, Yangling 712100, China
3
School of Geographic and Environmental Sciences, Tianjin Normal University, Tianjin 300387, China
4
School of Earth and Space Sciences, Peking University, Beijing 100871, China
*
Authors to whom correspondence should be addressed.
Submission received: 10 April 2018 / Revised: 20 May 2018 / Accepted: 24 May 2018 / Published: 27 May 2018
(This article belongs to the Special Issue Remote Sensing of Drought Monitoring)

Abstract

:
Rainfall gauges are always sparse in the arid and semi-arid areas of Northwest China, which makes it difficult to precisely study the characteristics of drought at a large scale in this region and similar areas. This study used the TRMM (The Tropical Rainfall Measuring Mission) multi-satellite precipitation data to study the spatial-temporal evolution of drought in the Loess Plateau based on the SPI (Standardized Precipitation Index) drought index for the period of 1998–2014. The results indicate that the monthly TRMM precipitation data are well matched with the observed precipitation, indicating that this remotely sensed data set can be reliably used to calculate the SPI drought index. Based on the study findings, the average precipitation in the Loess Plateau is showing a significant increasing trend at the rate of 4.46 mm/year. From the spatial perspective, the average annual precipitation in the Southeast is generally greater than that in the Northwest. However, the annual precipitation in the Southeast area is showing a decreasing trend, whereas, the annual precipitation in the northwest areas is showing an increasing trend. Through the SPI analysis, the 3-month SPI and 12-month SPI were both showing an increasing trend, which indicates that the drought severity in the Loess Plateau was a generally declining trend at a seasonal to annual time scale. From the spatial perspective, the SPI values in the Central and Northwest of the Loess Plateau were significantly increasing, whereas, the SPI values in the southern area of the Loess Plateau were slightly decreasing. From the seasonal characteristics, the high-risk area for drought in the spring was concentrated in the northeast and southwest part, and in the summer and autumn, the high-risk area was transferred to the south part. Through this study, it is concluded that the Loess Plateau was likely getting wetter during the time period since the Grain-for-Green Project (1999–2012) was implemented, which replaced much farmland with forestry. This is a positive signal for vegetation recovery and ecological restoration in the near future.

Graphical Abstract

1. Introduction

The impact of drought climate events is mostly widespread, because drought is a natural and recurring feature of climate and occurs in almost all climatic regimes [1,2]. In order to evaluate the severity and the impact of drought, the previous studies have proposed many indices, of which the PDSI (Palmer Drought Severity Index) and SPI (Standardized Precipitation Index) indexes are most widely used [3,4]. The calculation of PDSI requires too many parameters, including the precipitation, air temperature, air pressure, and the soil moisture, etc. Although the PDSI is a physically-based drought index, the high density of data required in the calculating process limits the widespread use of PDSI, because the majority of the research areas cannot satisfy the data and parameter requirements. Meanwhile, the time scale of PDSI is unchangeable and cannot reflect the evolution of the regional drought event at different time scales (such as 3-month, 6-month, and 12-month scale) [5]. To solve this problem, Mckee et al. proposed the SPI drought index, which could be used to evaluate drought events at various time scales. Moreover, the SPI can be calculated based on the monthly precipitation data, which are relatively easy to obtain [6,7]. Due to the flexibility of the time scale and the simple calculating process, the SPI has been widely used worldwide. Naresh Kumar et al. calculated the SPI based on the observed precipitation data collected from the weather stations in Ananthpur and Khammam (India) and analyzed the characteristics of the drought in the two areas [8]. Zarch compared the SPI and RDI (Reconnaissance drought index) in different climate areas, and concluded that the agreement between the two indexes is good in arid areas [9]. Therefore, in this paper, we applied the SPI to the Loess Plateau which is an arid and semi-arid area.
The previous studies show that the precipitation is the key parameter to quantitatively calculate the drought indices [10,11]. Most researchers evaluated the drought event based on the observed data from the weather stations. Nevertheless, the distribution of the weather stations is often sparse in developing countries, such as China, which thus increases the uncertainty in the research into drought evaluation [12]. In recent years, the problem has been solved effectively due to the rapid development of satellite remote sensing technology, through which the high-resolution climatic data can be easily collected at a large scale [13,14]. Many precipitation products based on satellite platforms with high spatial resolution and high precision are released. These products include TRMM (the Tropical Rainfall Measuring Mission), CMORPH (the Climate Prediction Center Morphing technique), GSMAP (the Global Satellite Mapping of Precipitation) etc., among which, TRMM precipitation data are currentlythe most widely used [15]. Yang et al. evaluated the accuracy of the TRMM3B42V7 precipitation data in its application in Hanjiang River Basin of China using the observed data collected from 29 weather stations, proving that the TRMM data are satisfactory in accuracy in humid area at monthly scale [16]. Mantas et al. compared TRMM3B42V7 and TRMM3B42RT respectively with the observed data in Peruvian Andes (including both the tropical desert and the rainforest) [17]. The result shows that the two kinds of precipitation products have good reliability in the Peruvian Andes, and the TMPA (TRMM Multisatellite Precipitation Analysis) products show a good agreement with the gauge values, especially for more prolonged observation periods (over 8 days). Jiang et al. evaluated the accuracy of the monthly TMPA 3B42V7 satellite precipitation data using rain gauge observations in the Weihe River Basin, Loess Plateau. The results showed that the temporal and spatial characteristics of rainfall can be accurately depicted by the monthly TMPA 3B42V7 precipitation data [18]. Based on the above findings, it shows that the TRMM data has comparatively high accuracy in different climatic regions. In recent years, TRMM data have been widely used in numerous other applications. Li et al. constructed the SWAT (Soil and Water Assessment Tool) model in the Taihu Lake Basin of China, using the TRMM3B42 precipitation data as the input data, and found that TRMM3B42 has a good application prospect for the runoff simulation [19]. Rhee et al. proposed the SDCI (the Scaled Drought Condition Index) based on multi-satellite data sources [20]. Then they tested and verified the accuracy of the SDCI in some dry and humid areas of the United States, and concluded that the TRMM precipitation product can be used as input data to assess the regional drought condition in both dry and wet areas. The TRMM precipitation data were widely used to assess drought. Comparing the SPI values calculated by the TMPA precipitation data with the SPI values calculated by meteorological observation data, Jiang et al. found that the TMPA 3B42V7 precipitation data can be used to reliably monitor the drought conditions in Weihe River Basin [18]. Tan et al. compared the monthly TRMM precipitation data (3B43) with 22 meteorological stations in Singapore from 1998 to 2014 and showed that the TRMM precipitation products performed well in accuracy [21]. Several other studies suggested that it is feasible to use TRMM precipitation data to monitor drought conditions in typical areas of China and Africa [22,23].
The Loess Plateau is located in the arid and semi-arid areas of Northern China and is seriously affected by drought and other extreme climate events such as extreme precipitation events. The low vegetation cover and the serious soil erosion make this place an ecologically fragile area [24]. With the rapid development of the social economy, more water is consumed by different sectors, particularly for domestic and industrial consumption [25]. In this context, less water is available for ecology and agriculture, which poses a great threat to ecological sustainability and food security. The Loess Plateau is one of the main grain production areas in China and the government of China had conducted the Grain-for-Green Project (1999–2012) in this area, both of which need a huge amount of water resources. However, the drought has a great impact on the region’s predominately rain-fed agriculture and vegetation recovery. Therefore, the evolution of drought in the Loess Plateau has attracted more and more attention from researchers. Liu et al. calculated the drought indexes of SPI and SPEI respectively based on the precipitation and the temperature data collected from the 54 weather stations of the Loess Plateau to analyze the temporal and spatial variability of drought, and indicated that the loess plateau was getting drier between 1957 and 2012 [26]. Sun and Ma calculated the PDSI index based on the climatic data from the 53 weather stations in the Loess Plateau, and concluded that it is the increase in temperature and the decrease in precipitation that lead the area to be more arid [27]. Numerous studies were conducted in the Loess Plateau to evaluate the drought evolution based on the observed climatic data, but there was large uncertainty for drought characteristics at a large scale due to the sparse distribution of weather stations [28].
Satellite-derived products supply the high spatial resolution climatic information, which can be used to study the spatial-temporal evolution of the drought over large areas. To validate the reliability of satellite-derived TRMM precipitation data and to explore the hydrological characteristics in the Loess Plateau since the Grain-for-Green Project was implemented, this study evaluated regional drought conditions using the TRMM precipitation data between 1998 and 2014. The main objectives of this paper can be summarized as follows: (1) to validate the TRMM precipitation data (1998–2014) and evaluate its applicability in the Loess Plateau based on the observed weather data from 50 stations in the study area; (2) to analyze the temporal and spatial variability of the precipitation from 1998 to 2014 and test the changing trend based on M-K test method and (3) to analyze the temporal and spatial variation process of the drought condition using SPI index before and after the implementation of the Grain-for-Green Project. Based on the above findings, we will also study the occurrence rate of dry and wet events and analyze the vegetation recovery potential in the Loess Plateau, which may be an important reference for ecological restoration and vegetation recovery in the future.

2. Research area and Materials
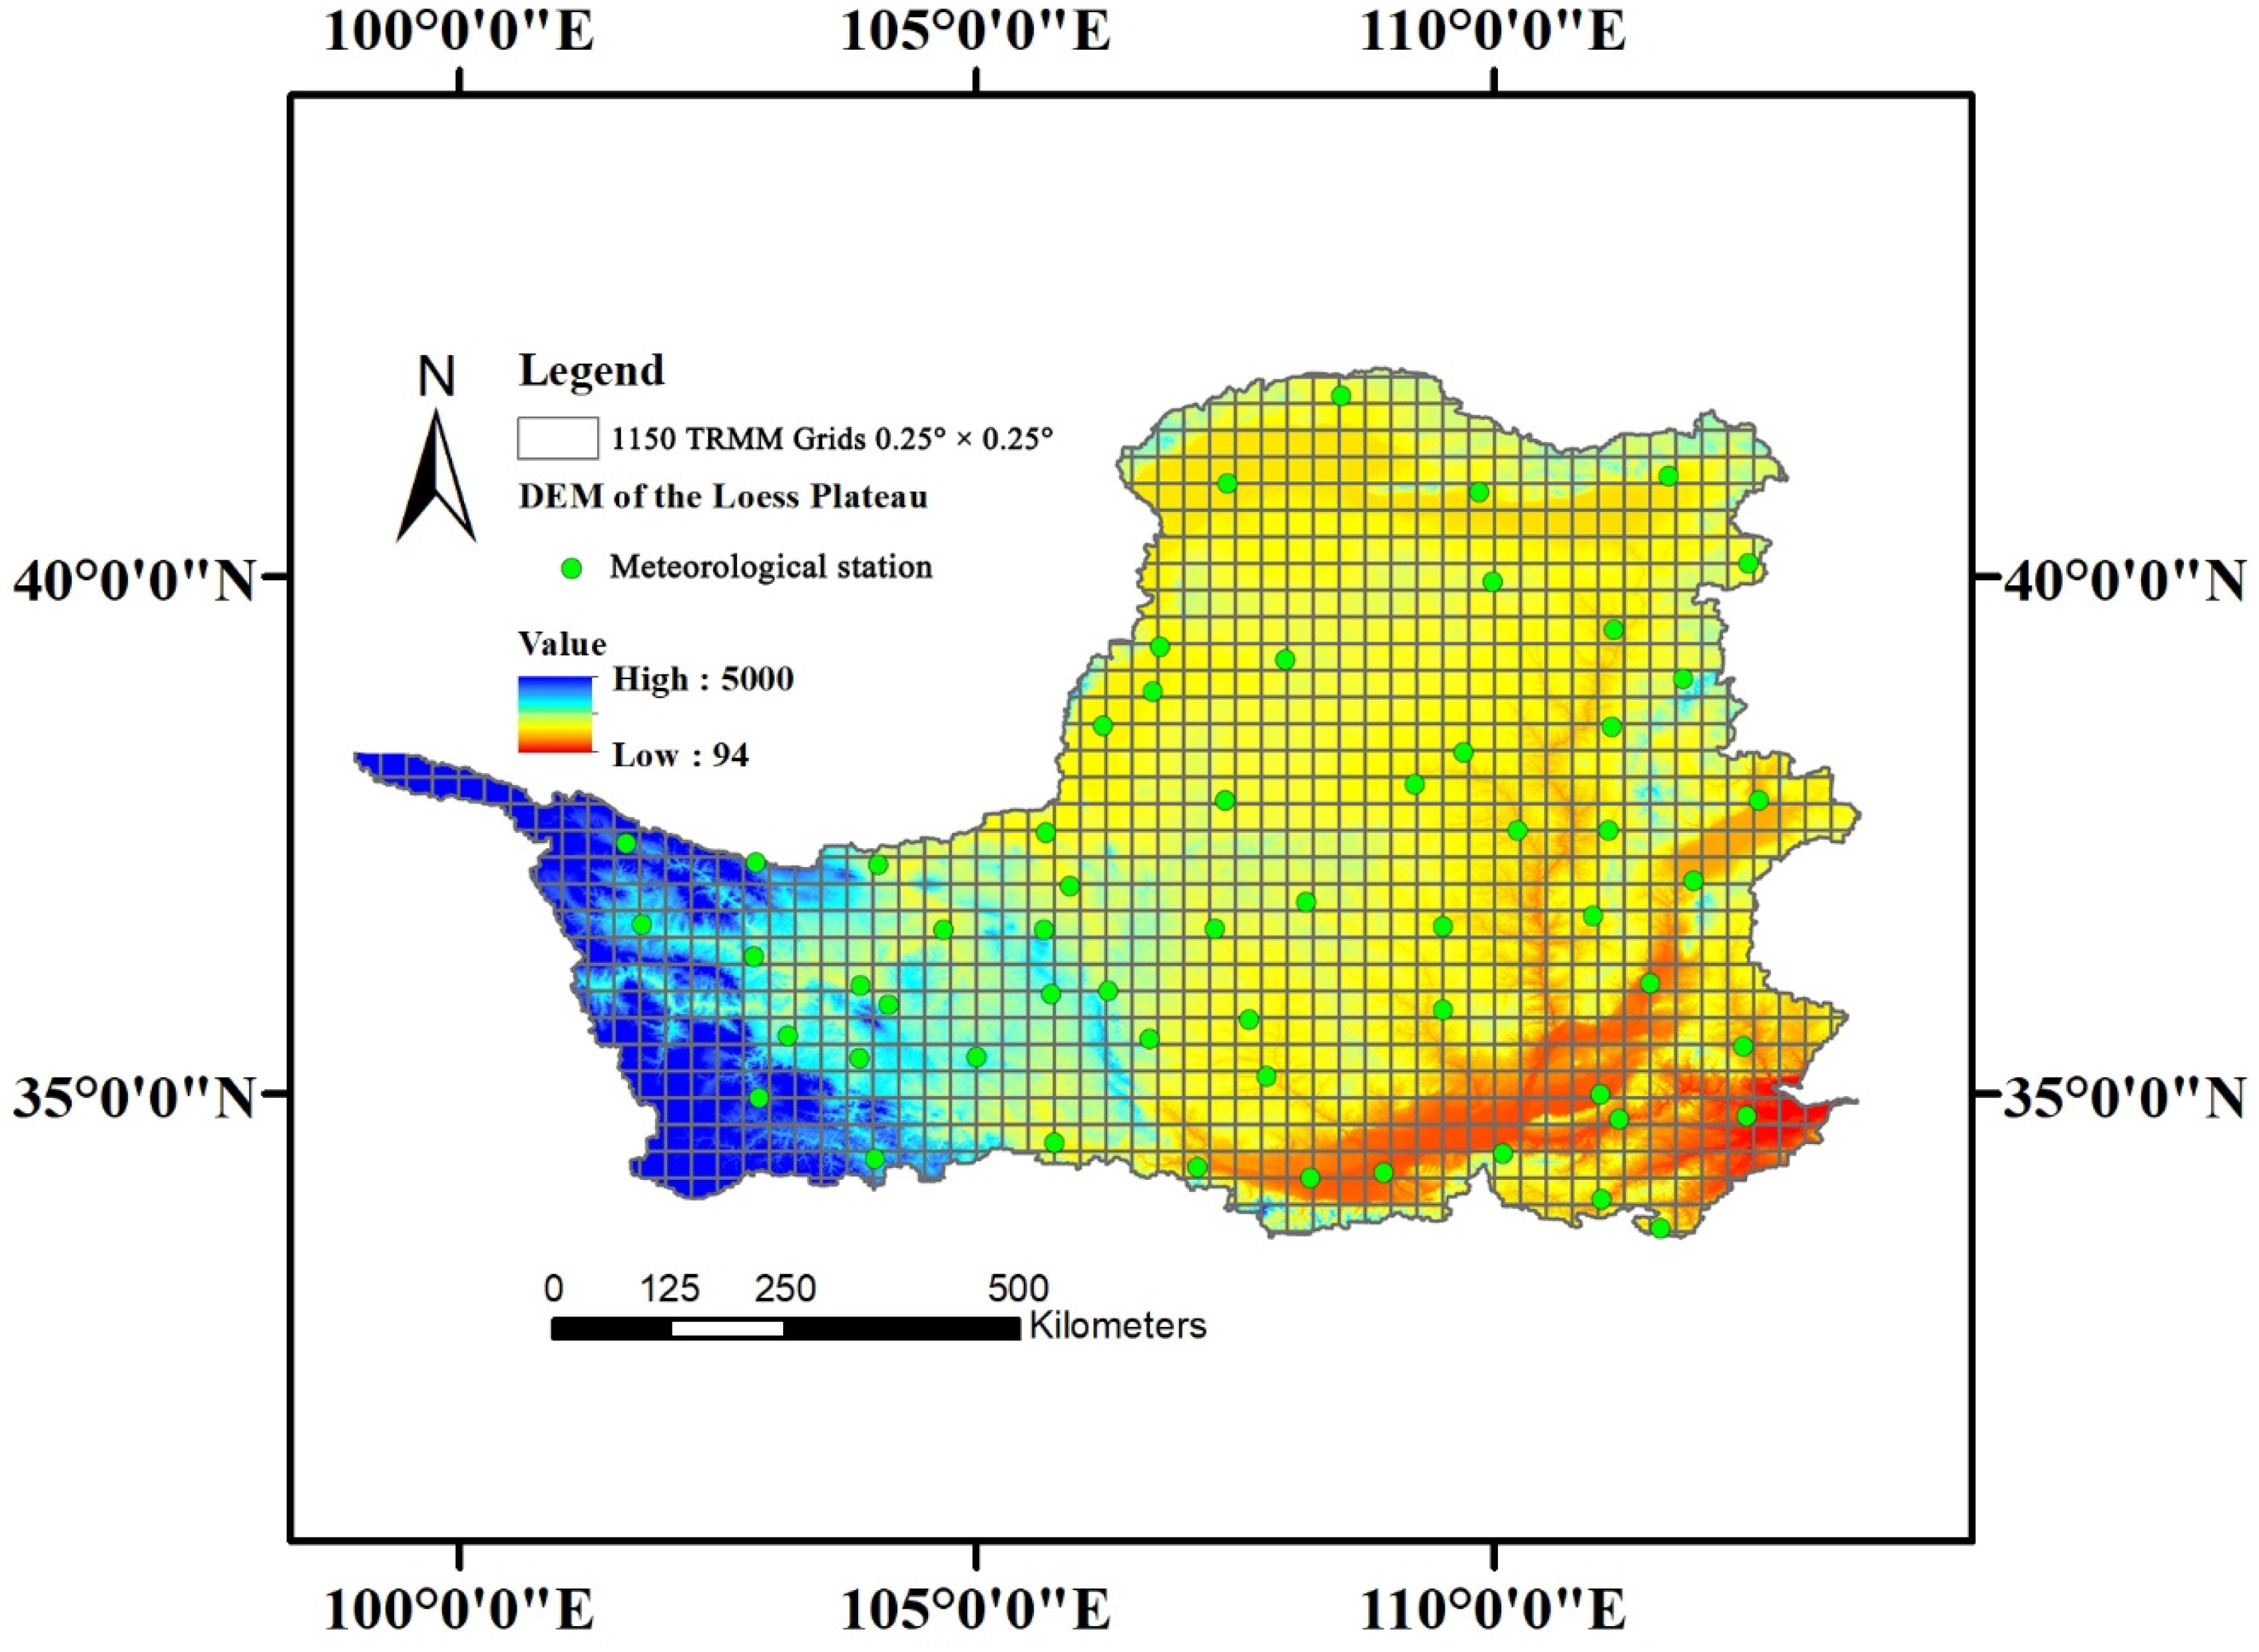
2.1. Study Area

The Loess Plateau is the biggest loess sedimentary area in the world, located in the Upper and Middle Yellow River of China. The Loess Plateau covers an area of 628,000 km2, with the latitude of 33°43′–41°16′ N and the longitude of 100°54′–114°33′ E, and is surrounded by Taihang Mountain to the east, Riyue-Helan Mountain to the west, Qinling Mountain to the south, and Yinshan Mountain to the north [24]. The Loess Plateau belongs to semi-humid and semi-arid climates, with the average temperature ranging from 4.3 °C to 14.3 °C. The annual precipitation ranges from 200 mm in the northwest to 750 mm in the southeast, 65% of which is distributed in the period of June to September. The annual potential evapotranspiration is estimated to be much higher than the precipitation, ranging from 865 mm to 1274 mm [29]. According to the statistics in 2005, low-coverage grass, farmland, and forestry are the primary land use types, which account for 43%, 33%, and 14% of Loess Plateau [30].

2.2. Data Source

This study used three types of data: (1) the TRMM satellite-derived precipitation data. In this study, the data are extracted from the TRMM product of TRMM3B43 dataset. The TRMM3B43 dataset is a synthesized dataset combining the TRMM3B42 precipitation data with the global grid-point precipitation data from NOAA (National Oceanic and Atmospheric Administration) and the global precipitation assimilation data from CPCC (Global Precipitation Climatology Centre). The spatial extent of the TRMM3B43 dataset covers the area with the latitude of 50° S to 50° N and the longitude of 180° W to 180° E, which includes almost the entirety of China. The dataset is based on the 0.25° × 0.25° spatial resolution, and the temporal resolution is 3-h, which can be downloaded freely at https://trmm.gsfc.nasa.gov/. (2) The observed precipitation data. In this study, we collected the daily observed precipitation data from 1998 to 2014 totally from 50 meteorological stations across the Loess Plateau. These data were downloaded from the China Meteorological Sharing Network (http://data.cma.cn/). The observed precipitation data are mainly used to validate the reliability of the TRMM satellite-derived precipitation data. (3) The vegetation coverage data (Normalized Difference Vegetation Index, NDVI). In this study, we used NDVI data to qualitatively evaluate the drought risk in the Loess Plateau. The NDVI data are generated by MVC Method (Maximum Value Composites) using the SPOT Vegetation data [31]. The SPOT Vegetation Sensor was launched in 1998, which can observe the global vegetation coverage with a 1 km × 1 km spatial resolution. The NDVI data have been made into the Remote Sensing Products by Chinese Academy of Sciences, which can be obtained from the Data Center for Resources and Environmental Sciences in the Chinese Academy of Sciences (http://www.resdc.cn).

3. Methods

3.1. Calculation of the Standardized Precipitation Index

The SPI (Standardized Precipitation Index), which is based on precipitation only, was proposed by McKee et al. [7]. The SPI is based on the conversion of precipitation data to probabilities using long-term monthly precipitation records computed at different time scales. After standardization, it can be used to monitor conditions at different locations and at different times of year [32]. One unique feature is that the SPI can be used to monitor conditions on a variety of time scales. This temporal flexibility allows the SPI to be useful in both short-term agricultural and long-term hydrological applications.
The SPI is computed by fitting an appropriate probability density function to the frequency distribution of precipitation summed over the time scale of interest (e.g., 3, 6 and 12 months). SPI computation involves fitting a gamma probability density function to a given time series of precipitation, whose probability density function is defined as
g ( x ) = 1 β α Γ ( α ) x α 1 e x / β
where α > 0 is a shape parameter, β > 0 is a scale parameter, and x > 0 is the precipitation. Γ ( α ) is the gamma function, which is defined as
Γ ( α ) = 0 y α 1 e y d y
Fitting the distribution to the data requires α and β to be estimated. Using the approximation of Thom [33], these parameters can be estimated as follows:
α = 1 + 1 + 4 A / 3 4 A
β = x ¯ α
A = ln ( x ¯ ) i = 1 n l n ( x i ) n
where n is the number of observations. Integrating the probability density function with respect to x gets the following expression G( x ) for the cumulative probability:
G ( x ) = 1 Γ ( α ) 0 x / β t α 1 e t d t
It is possible to have several zero values in a precipitation sample set. However, the gamma distribution is undefined for x = 0. In order to consider zero value probability, the cumulative probability function for gamma distribution is modified as
H ( x ) = q + ( 1 q ) G ( x )
where q is the probability of zero precipitation.
After the distribution of the cumulative probability H ( x ) transformed into the standard normal distribution, then the SPI value can be calculated as follows:
When 0 < H ( x ) 0.5 ,
k = l n ( 1 H ( x ) 2 )   and   SPI = ( k c 0 + c 1 k + c 2 k 2 1 + d 1 k + d 2 k 2 + d 3 k 3 )
When 0.5 < H ( x ) < 1.0 ,
k = l n 1 [ 1 H ( x ) ] 2   and   SPI = k c 0 + c 1 k + c 2 k 2 1 + d 1 k + d 2 k 2 + d 3 k 3
where, c 0 = 2.515517 , c 1 = 0.802853 , c 2 = 0.010328 , d 1 = 1.432788 , d 2 = 0.189269 and d 3 = 0.001308 .
After the SPI is calculated, the drought severity can be classified based on the SPI values. The drought classification adopted in this study is defined in Table 1. SPIs with different timescales imply different physical meaning. SPIs with shorter timescales (3-month SPI) reflect short and medium-term moisture conditions, which is important for agricultural production, whereas SPIs with longer timescales (12-month SPI) are probably related to streamflow, reservoir levels, and even groundwater levels. We used the SP3 (3-month SPI) and SPI12 (12-month SPI) in this study for drought evaluation, which can reflect seasonal and inter-annual drought events respectively.

3.2. Mann-Kendall Trend Test with Trend-Free Pre-Whitening

The nonparametric M-K (Mann-Kendall) test has been widely used in the world to assess the significance of monotonic trends in climatological, meteorological and hydrological data time series [35,36,37]. In this study, the M-K test was used to test the changing trends of the precipitation and the SPI drought index. The standardized test statistic (Z) is calculated as follows:
Z = { S 1 V a r ( S ) ,   i f   S > 0 0 ,   i f   S = 0 S + 1 V a r ( S ) ,   i f   S < 0
and,
S = k = 1 n 1 j = k + 1 n s i g n ( x j x k )
where,
S i g n ( x j x k ) = { 1 ,   i f   ( x j x k ) > 0 0 ,   i f   ( x j x k ) = 0 1 ,   i f   ( x j x k ) < 0
x k and x j are the sequential values; n is the length of the data series.
The variance of S is given by the following equation [38]:
Var ( S ) = n ( n 1 ) ( 2 n + 5 ) 18
where n is the length of the data series.
Based on the M-K test, positive values of Z indicate the increasing trends, while negative Z values show decreasing trends. The testing trend is performed at a specific α significance level, and when | Z | Z 1 α / 2 , the trend is significant at the α confidence level. Generally speaking, the trend is significant at the 5% confidence level if | Z | 1.96 and the trend is significant at the 10% confidence level if |Z| ≥ 1.28.
Trend-free pre-whitening (TFPW) is an approach that improves the performance of the M-K test in the presence of serial correlation [39]. The TFPW procedure has been proposed as a means to detect a significant trend in a time series with significant serial correlation. It includes the following steps [40]:
r 1 = t = 1 n 1 ( x t x ¯ t ) · ( x t + 1 x ¯ t + 1 ) t = 1 n 1 ( x t x ¯ t ) 2 · t = 1 n 1 ( x t + 1 x ¯ t + 1 ) 2
β = M e d i a n ( x j x i j i )     i < j
Y t = x t β · t
Y t = Y t r 1 · Y t 1 + β · t
where x i and x j are the values in the year i and the year j of the time series, respectively, n is the length of the time series, and x ¯ t is the average value in the total t number of years of the time series. If 1 1.645 n 2 n 1 r 1 1 + 1.645 n 2 n 1 , then the time series data are considered to be serial-independent at the 10% significance level and it is not necessary to conduct TFPW. The original M-K test is applied to the series of Y t to assess the significance of the trend. Otherwise, the data series are assumed to be serial-correlated and TFPW is required. The original M-K test is applied to the series of Y t to assess the significance of the trend.

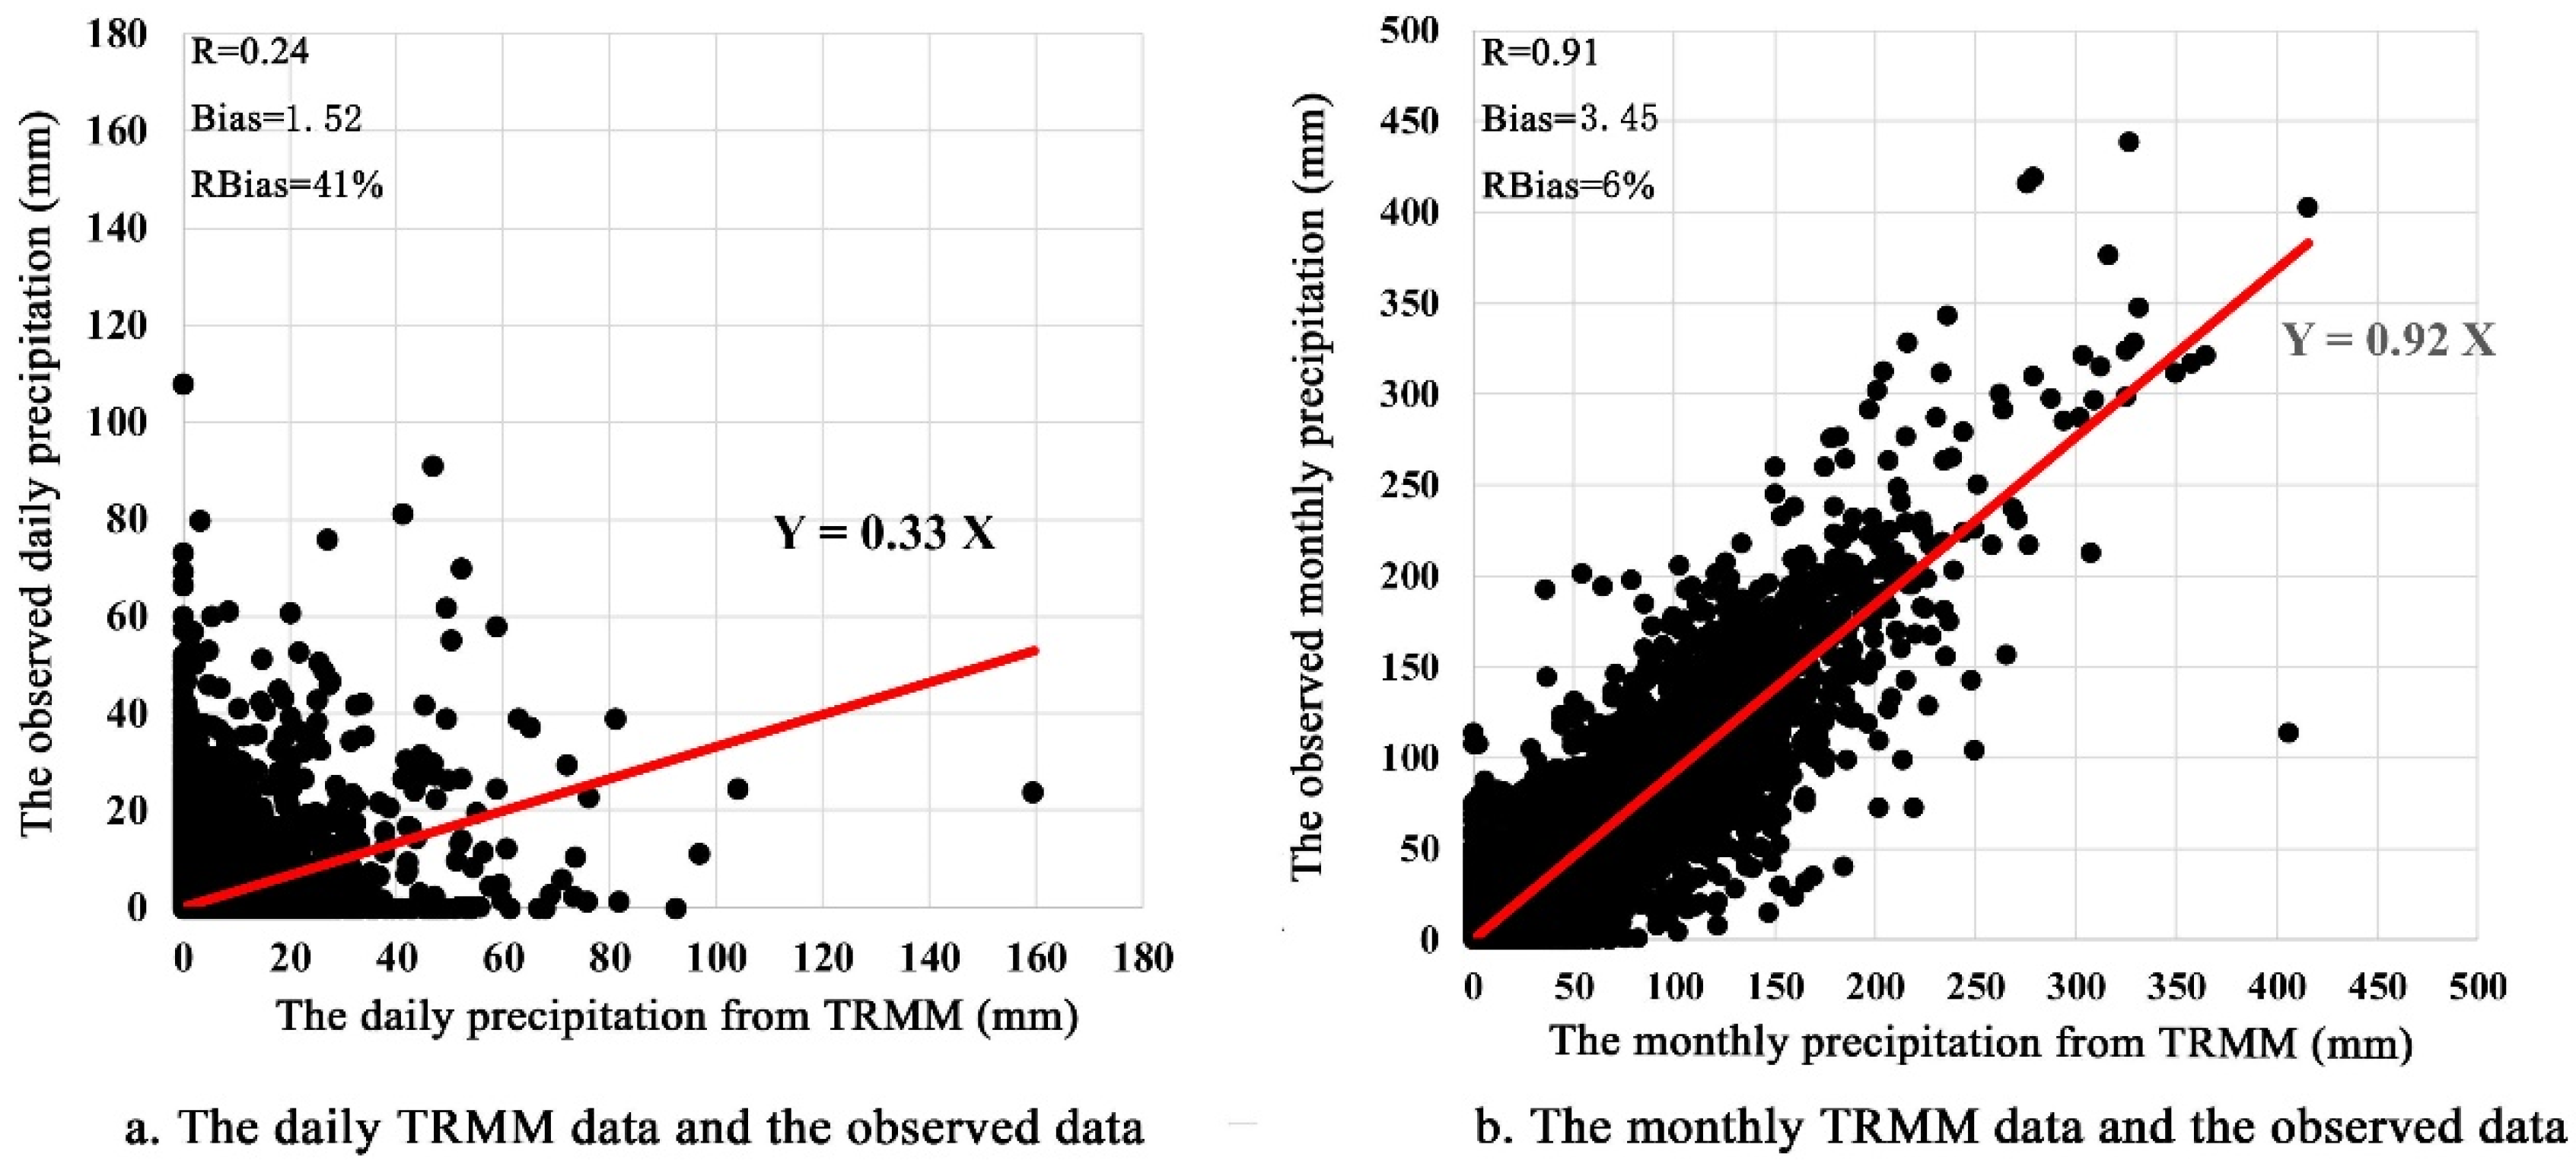
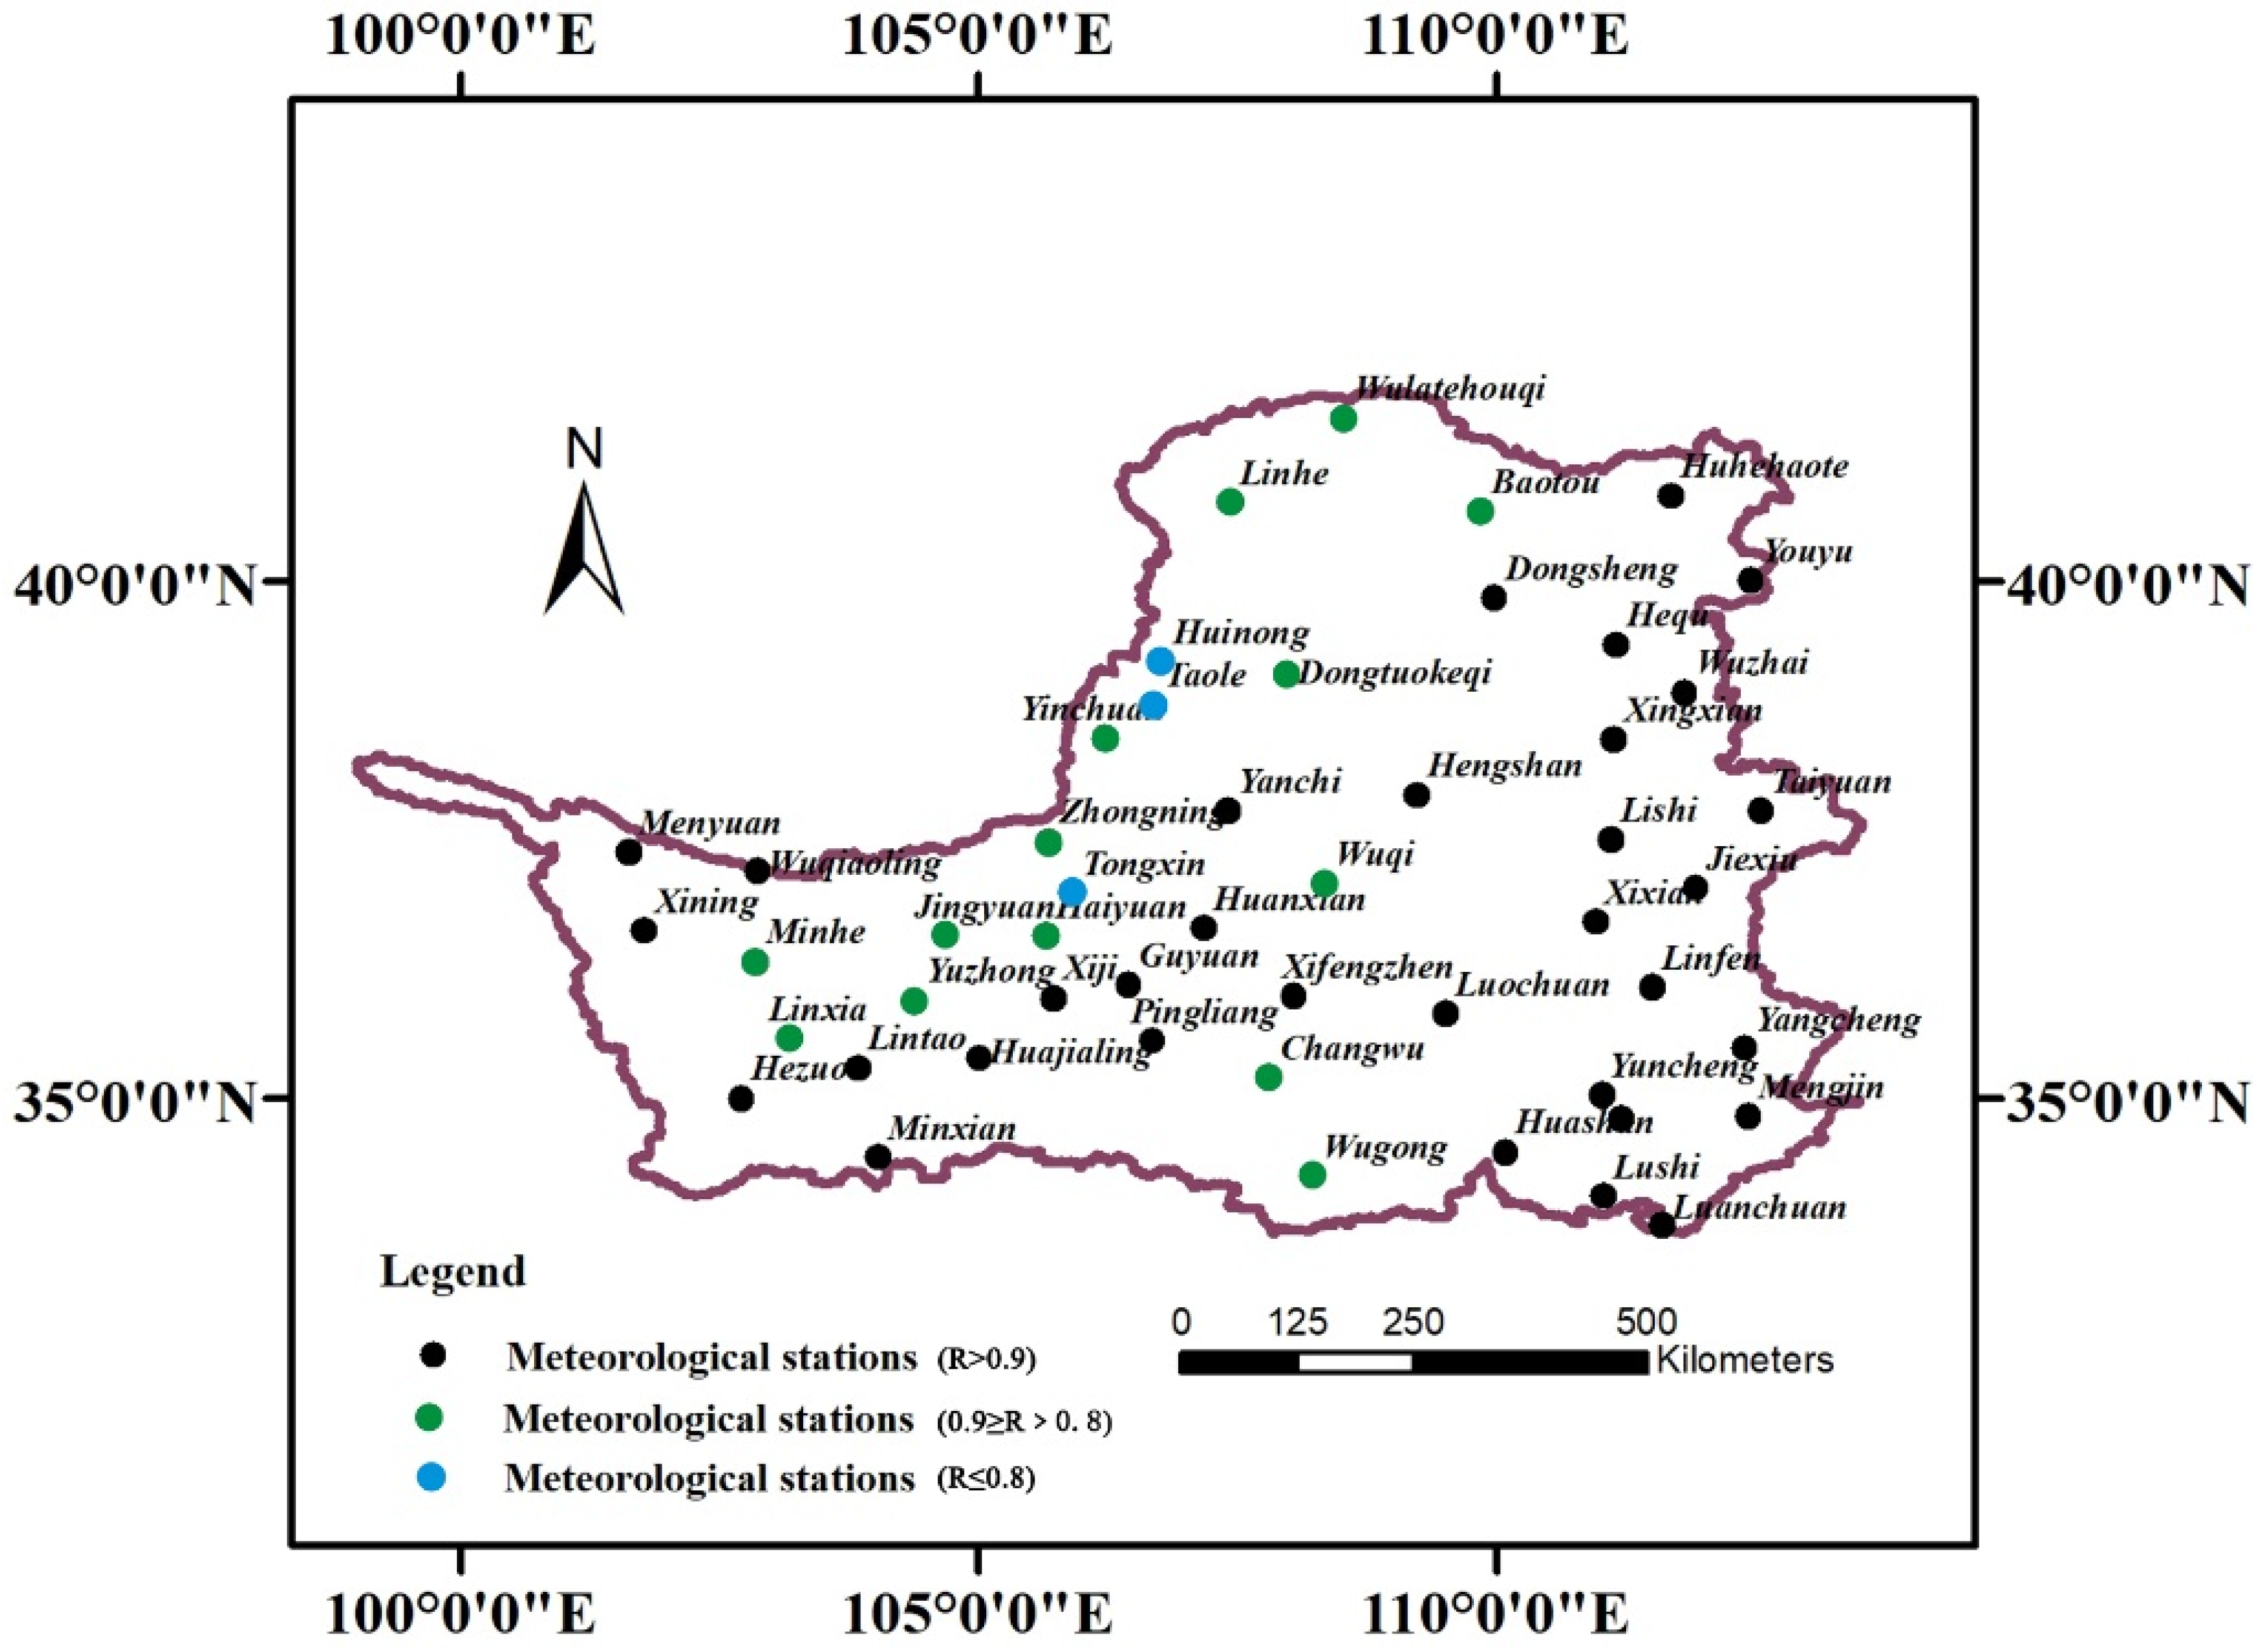
3.3. Evaluate the Reliability of the TRMM Precipitation Data

In this study, the Loess Plateau was divided into 1150 grids based on the 0.25° spatial resolution (Figure 1). The observed monthly and daily precipitation data during the period of 1998–2014, collected from the 50 meteorological stations in the Loess Plateau were used to evaluate the accuracy of the TRMM 3B43 precipitation data. Before evaluation, the 1150 calculation grids in the Loess Plateau were firstly encoded with consecutive numbers. If the meteorological station is located at a grid, the TRMM 3B43 precipitation data of this grid are compared with the data of the meteorological station. To show the locations of the 50 meteorological stations, we superimposed the grid structure on the map of the Loess Plateau (Figure 1).
To evaluate the accuracy of TRMM data in the Loess Plateau and calculate the bias between the observed precipitation data and the TRMM satellite-derived precipitation data, we calculated the Pearson Correlation Coefficients (R) and the Bias and the Relative Bias (RBias) indicators.
R = i = 1 n ( O i O ¯ ) ( P i P ¯ ) i = 1 n ( O i O ¯ ) 2 i = 1 n ( P i P ¯ ) 2
Bias = i = 1 n ( p i O i ) n
RBias = i = 1 n ( p i O i ) n · O i ¯
where, O i and P i are the observed precipitation data and the TRMM satellite-derived precipitation data in ith month of the study period, mm; O ¯ and P ¯ are the average values of observed monthly precipitation data and TRMM satellite-derived monthly precipitation in the whole study period, mm; n is the total number of months in the study period.

3.4. The Vegetation Recovery Potential Assessment in the Loess Plateau

To demonstrate the vegetation recovery potential in the Loess Plateau, we first considered the factor of water availability in Loess Plateau. In this study, we introduced the indicator of the frequency of the dry event (FDE) that occurred during the study period of 1998–2014 to analyze the evolution characteristics of water balance regime in Loess Plateau. A higher value of the FDE will indicate lower water availability in the study region and also imply lower potential for vegetation recovery. To calculate the FDE, the indicator of SPI can be used to precisely define the dry and wet events. According to the Table 1, if the value of SPI12 is less than 0.0, it can be defined a dry event or quasi dry event occurs in the current year of the study area. Consequently, in this study, we calculate the indicator of FDE based on the SPI12 values in the 1150 grids in the entire Loess Plateau.
Besides the factor of water availability, the factor of the current vegetation condition on the overlying surface were considered to demonstrate the vegetation recovery potential. In this study, the vegetation coverage (VGC) was calculated using the Normalized Difference Vegetation Index (NDVI) data of each grid. We used the dimidiate pixel model to calculate the VGC. The dimidiate pixel model is a method that can calculate the VGC based on NDVI by classifying each pixel as either pure vegetation ( N D V I v e g ) or bare soil ( N D V I s o i l ) [41]. The vegetation coverage (VGC) is calculated using the following Equation [42]:
VGC = ( N D V I N D V I s o i l ) / ( N D V I v e g N D V I s o i l )
where, VGC is the vegetation coverage in a pixel; N D V I is the current Normalized Difference Vegetation Index for a pixel;   N D V I s o i l is the NDVI of bare soil for a pixel and N D V I v e g is the N D V I value of pure vegetation for a pixel. Generally speaking, if the study area is large, N D V I s o i l can be regarded as the minimum value of N D V I of all pixels, and N D V I v e g can be regarded as the maximum value of   N D V I of all pixels in the whole study area.
According to the discussion mentioned above, we jointly consider the two factors (FDE and VGC) to assess the vegetation recovery potential in the Loess Plateau. The FDE represents the factor of water available for vegetation growth. The higher the FDE is, the lower the vegetation recovery potential is. The VGC represents the factor of overlying surface condition. The higher the VGC is, the more limited the vegetation recovery potential is. Consequently, we qualitatively evaluated the vegetation recovery potential by overlapping the spatial distribution map of FDE with VGC map and scoring the potential grade through classifying the FDE and VGC. The classification standard is shown in Table 2.

4. Results

4.1. The Reliability Analysis of TRMM Satellite Precipitation Data

Figure 2 shows the comparison results of the observed and the TRMM 3B43 precipitation data of daily and monthly precipitation from 1998 to 2014.
Figure 2a shows the comparison of the daily precipitation from the two data sources. The Pearson correlation coefficient is 0.24, which is less than 0.5. The Bias is 1.52 and the relative Bias is 41%. This indicates that the accuracy of daily TRMM precipitation is poor which may be due to the complex topography and overlying surface conditions of the Loess Plateau. Figure 2b shows the comparison of the monthly TRMM precipitation. As shown in Figure 2b, the linear fitting equation between the monthly TRMM data and the observed data is Y = 0.92 X . The Pearson correlation coefficient for monthly precipitation is 0.91 and the Bias is 3.45 and the relative Bias is 6%. To describe the spatial variability of TRMM monthly precipitation product accuracy, the results of the comparative analysis of precipitation data for each meteorological station and TRMM precipitation products are listed in Table 3, and the location of each meteorological station is given in Figure 3. Table 3 shows the comparison results between the observed and TRMM values of monthly precipitation from 1998 to 2014 for 50 meteorological stations. The R values of more than 35 meteorological stations are above 0.9 and the RBias values of more than 32 meteorological stations are less than 0.1. Therefore, the monthly TRMM precipitation data are satisfactory in accuracy. Overall, the monthly TRMM precipitation is more accurate than the daily precipitation. In this study, the calculation of the SPI drought index only needs monthly precipitation data. Consequently, the monthly TRMM precipitation data can meet the input data requirement of this study.

4.2. The Temporal and Spatial Variability of Precipitation

The SPI is calculated based on the precipitation data. Thus, the analysis of the temporal and spatial variability of the precipitation in the Loess Plateau could be helpful to better understand the change of the drought condition.

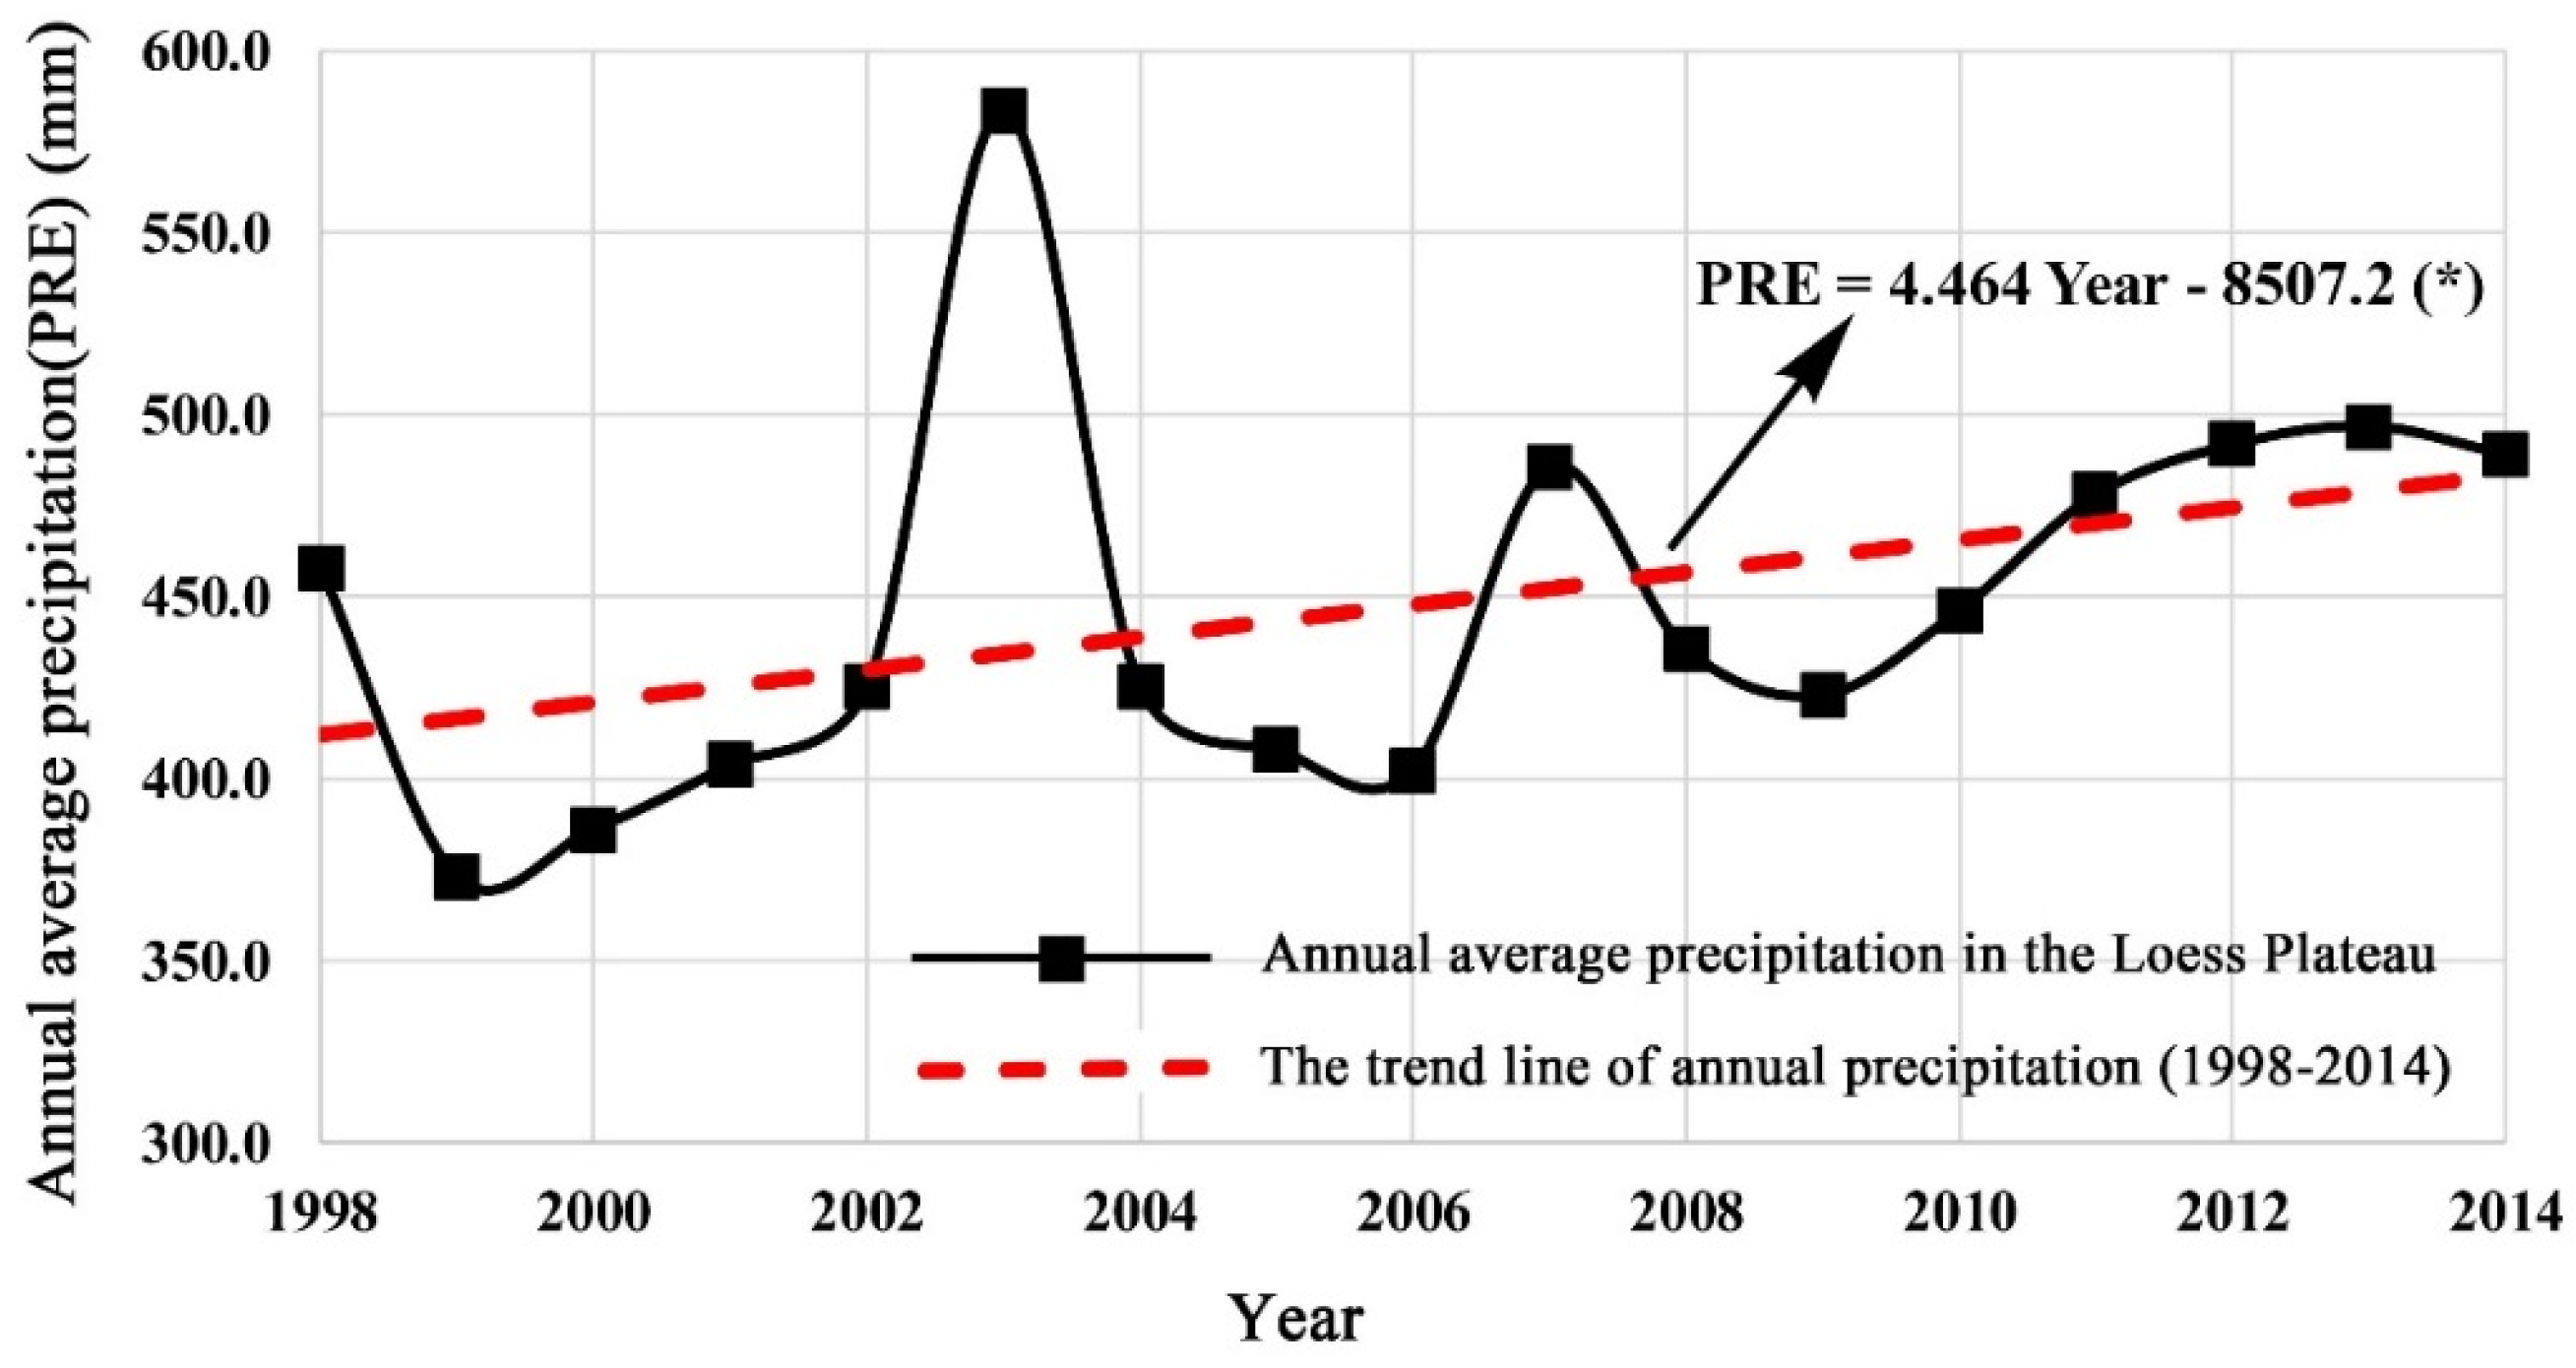
4.2.1. Temporal Change of Precipitation in the Loess Plateau from 1998 to 2014

To analyze the inter-annual variation of the precipitation in the Loess Plateau, the PRE (annual average precipitation) for the 1150 grids (Figure1) across the whole Loess Plateau is plotted and the significance of the changing trend of the PRE is tested based on M-K analysis.
As shown as Figure 4, the precipitations of 2003 and 2007 are relatively high, which are, respectively, 583.5 mm and 485.6 mm. In comparison, they are relatively lower in 1996 and 2006, which are 373.0 mm and 402.2 mm, respectively. In general, PRE increased from 1998 to 2014 by 4.5 mm per year. The M-K trend test is used to test the significance of the trend of PRE, and the result indicates that the increasing trend is significant with 90% confidence level.

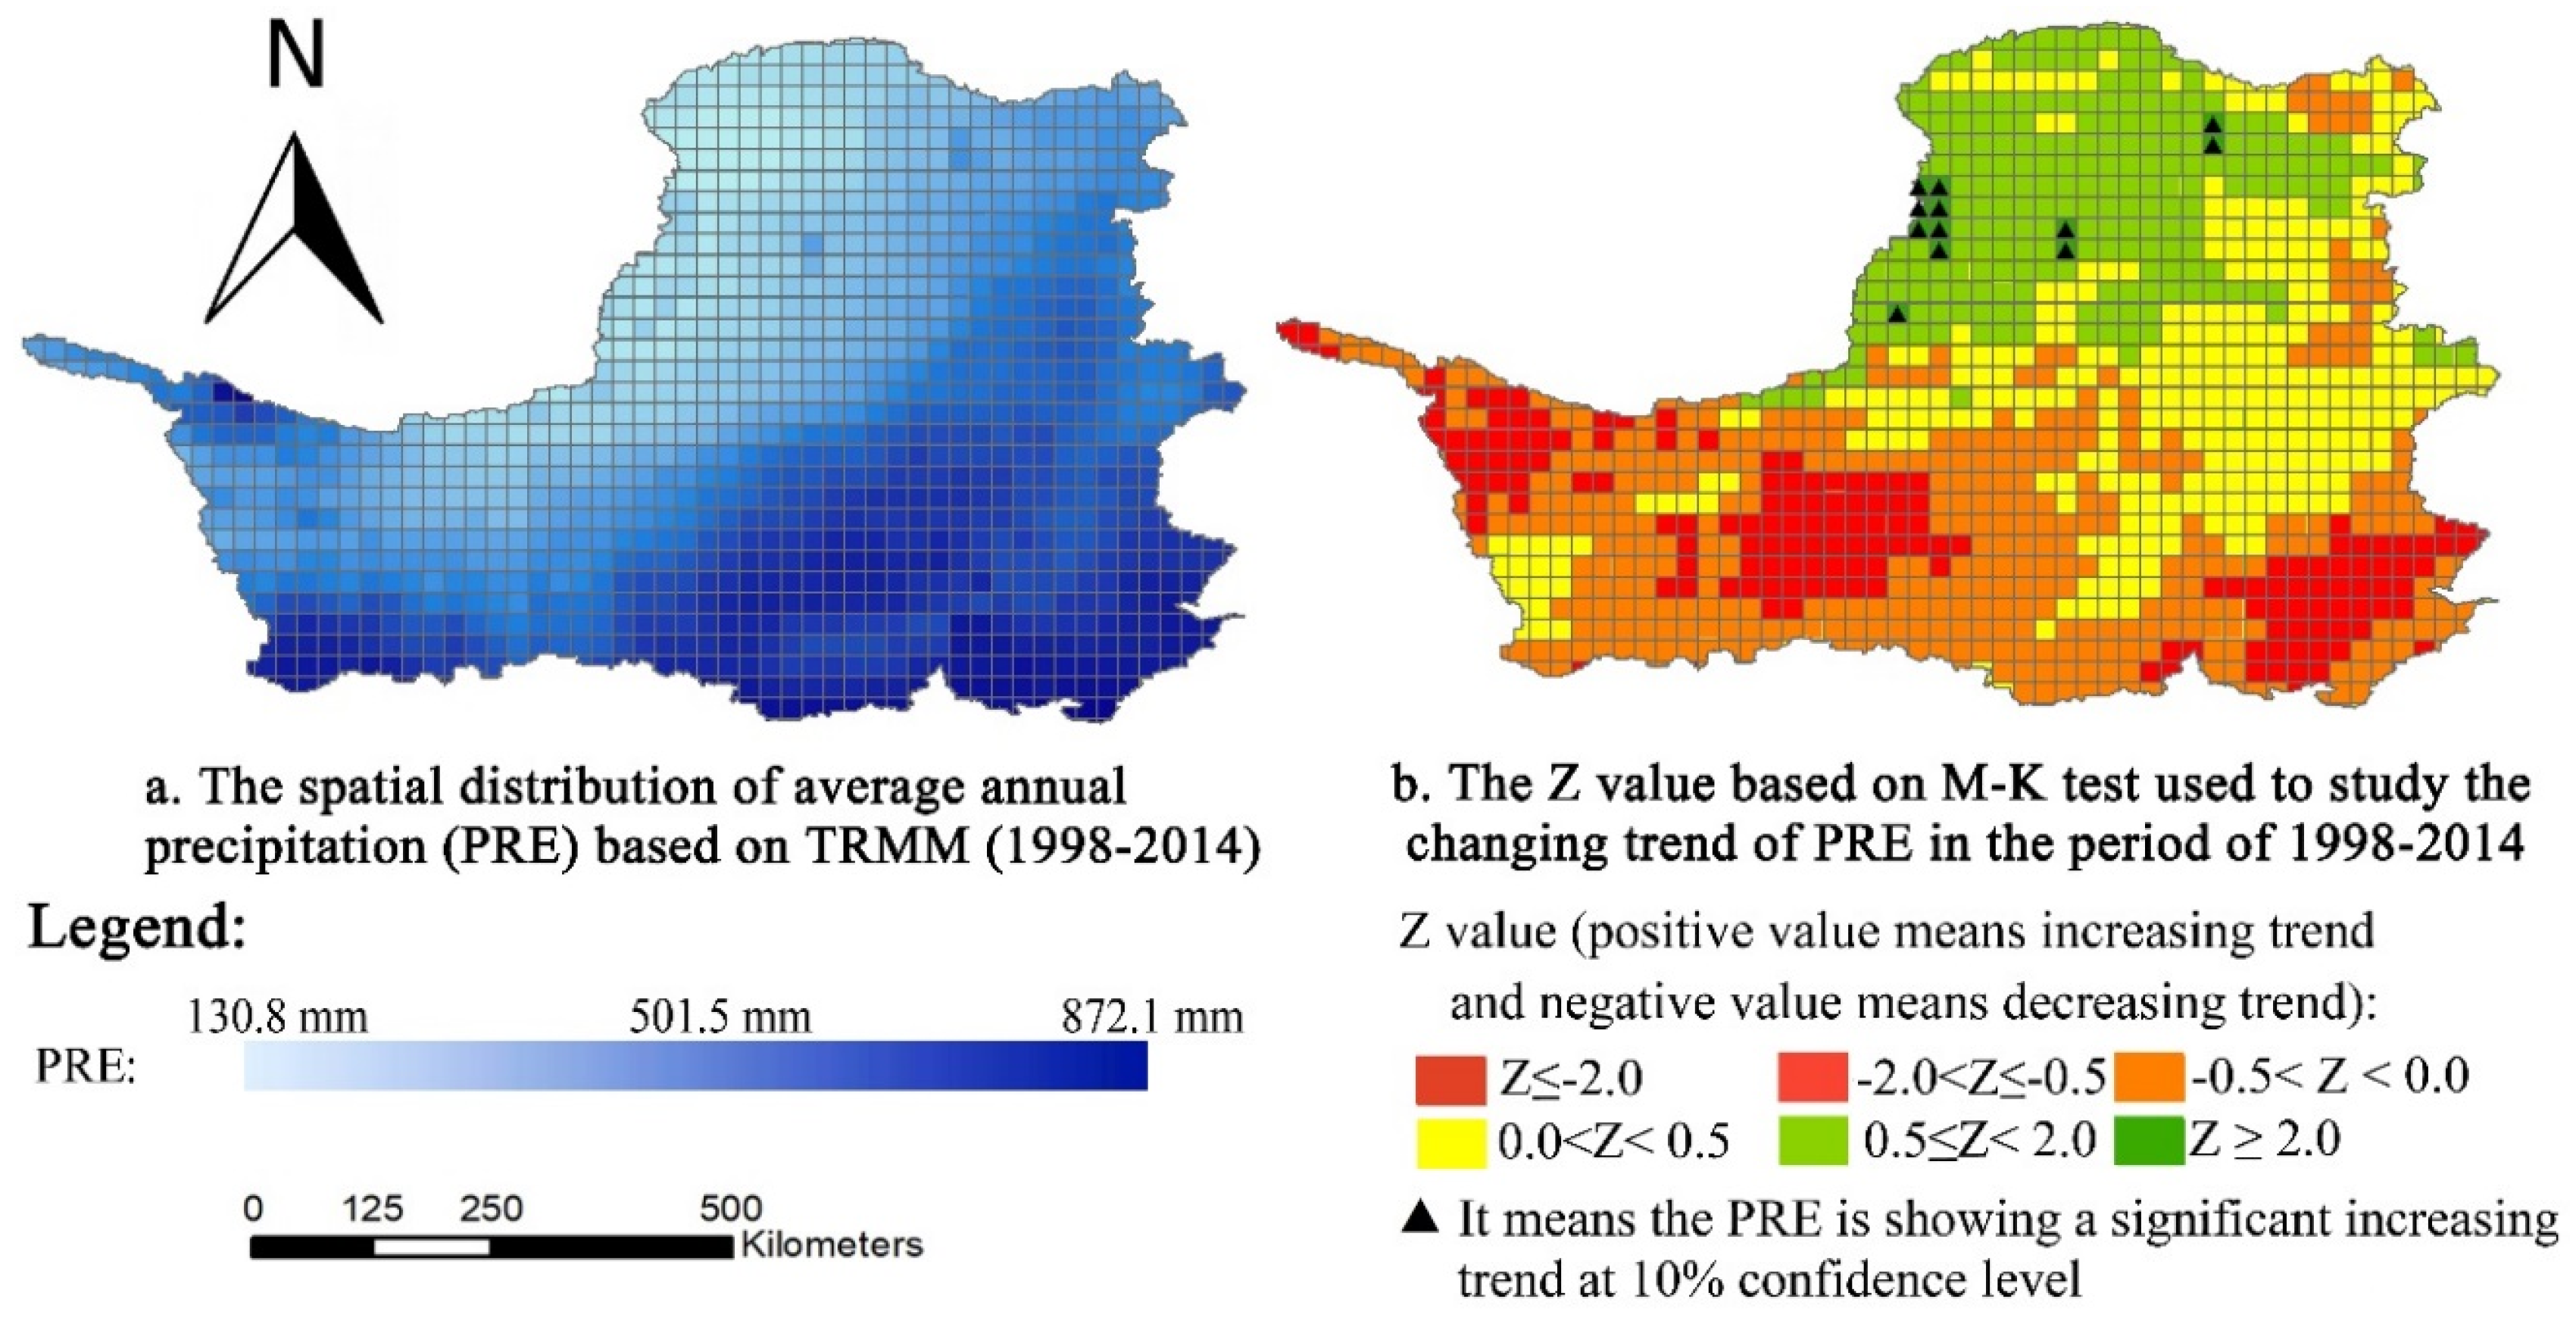
4.2.2. Spatial Distribution and Variability of Precipitation in the Loess Plateau

To analyze the spatial distribution and the variability of the precipitation in the Loess Plateau, the average precipitation during 1998–2014 of each grid was calculated and the M-K trend test was applied to analyze the changing trend in each grid, as shown in Figure 5.
As shown in Figure 5a, the precipitation in the southeast part of the Loess Plateau is relatively high, with a maximum of 872.1 mm. In comparison, the precipitation in the northwest part is relatively low, with a minimum of 130.8 mm. The average annual precipitation in the Southeast is generally larger than that in the Northwest of the Loess Plateau. As shown in Figure 5b, based on the Z values using M-K test, the annual precipitation in the southern part of the Loess Plateau is showing a slight decreasing change in the study period, while it is showing a significant increasing change trend in the central and northern part of the Loess Plateau. The result indicates that it is likely getting wetter especially in the central and northern Loess Plateau since the Grain-for-Green Project was implemented.

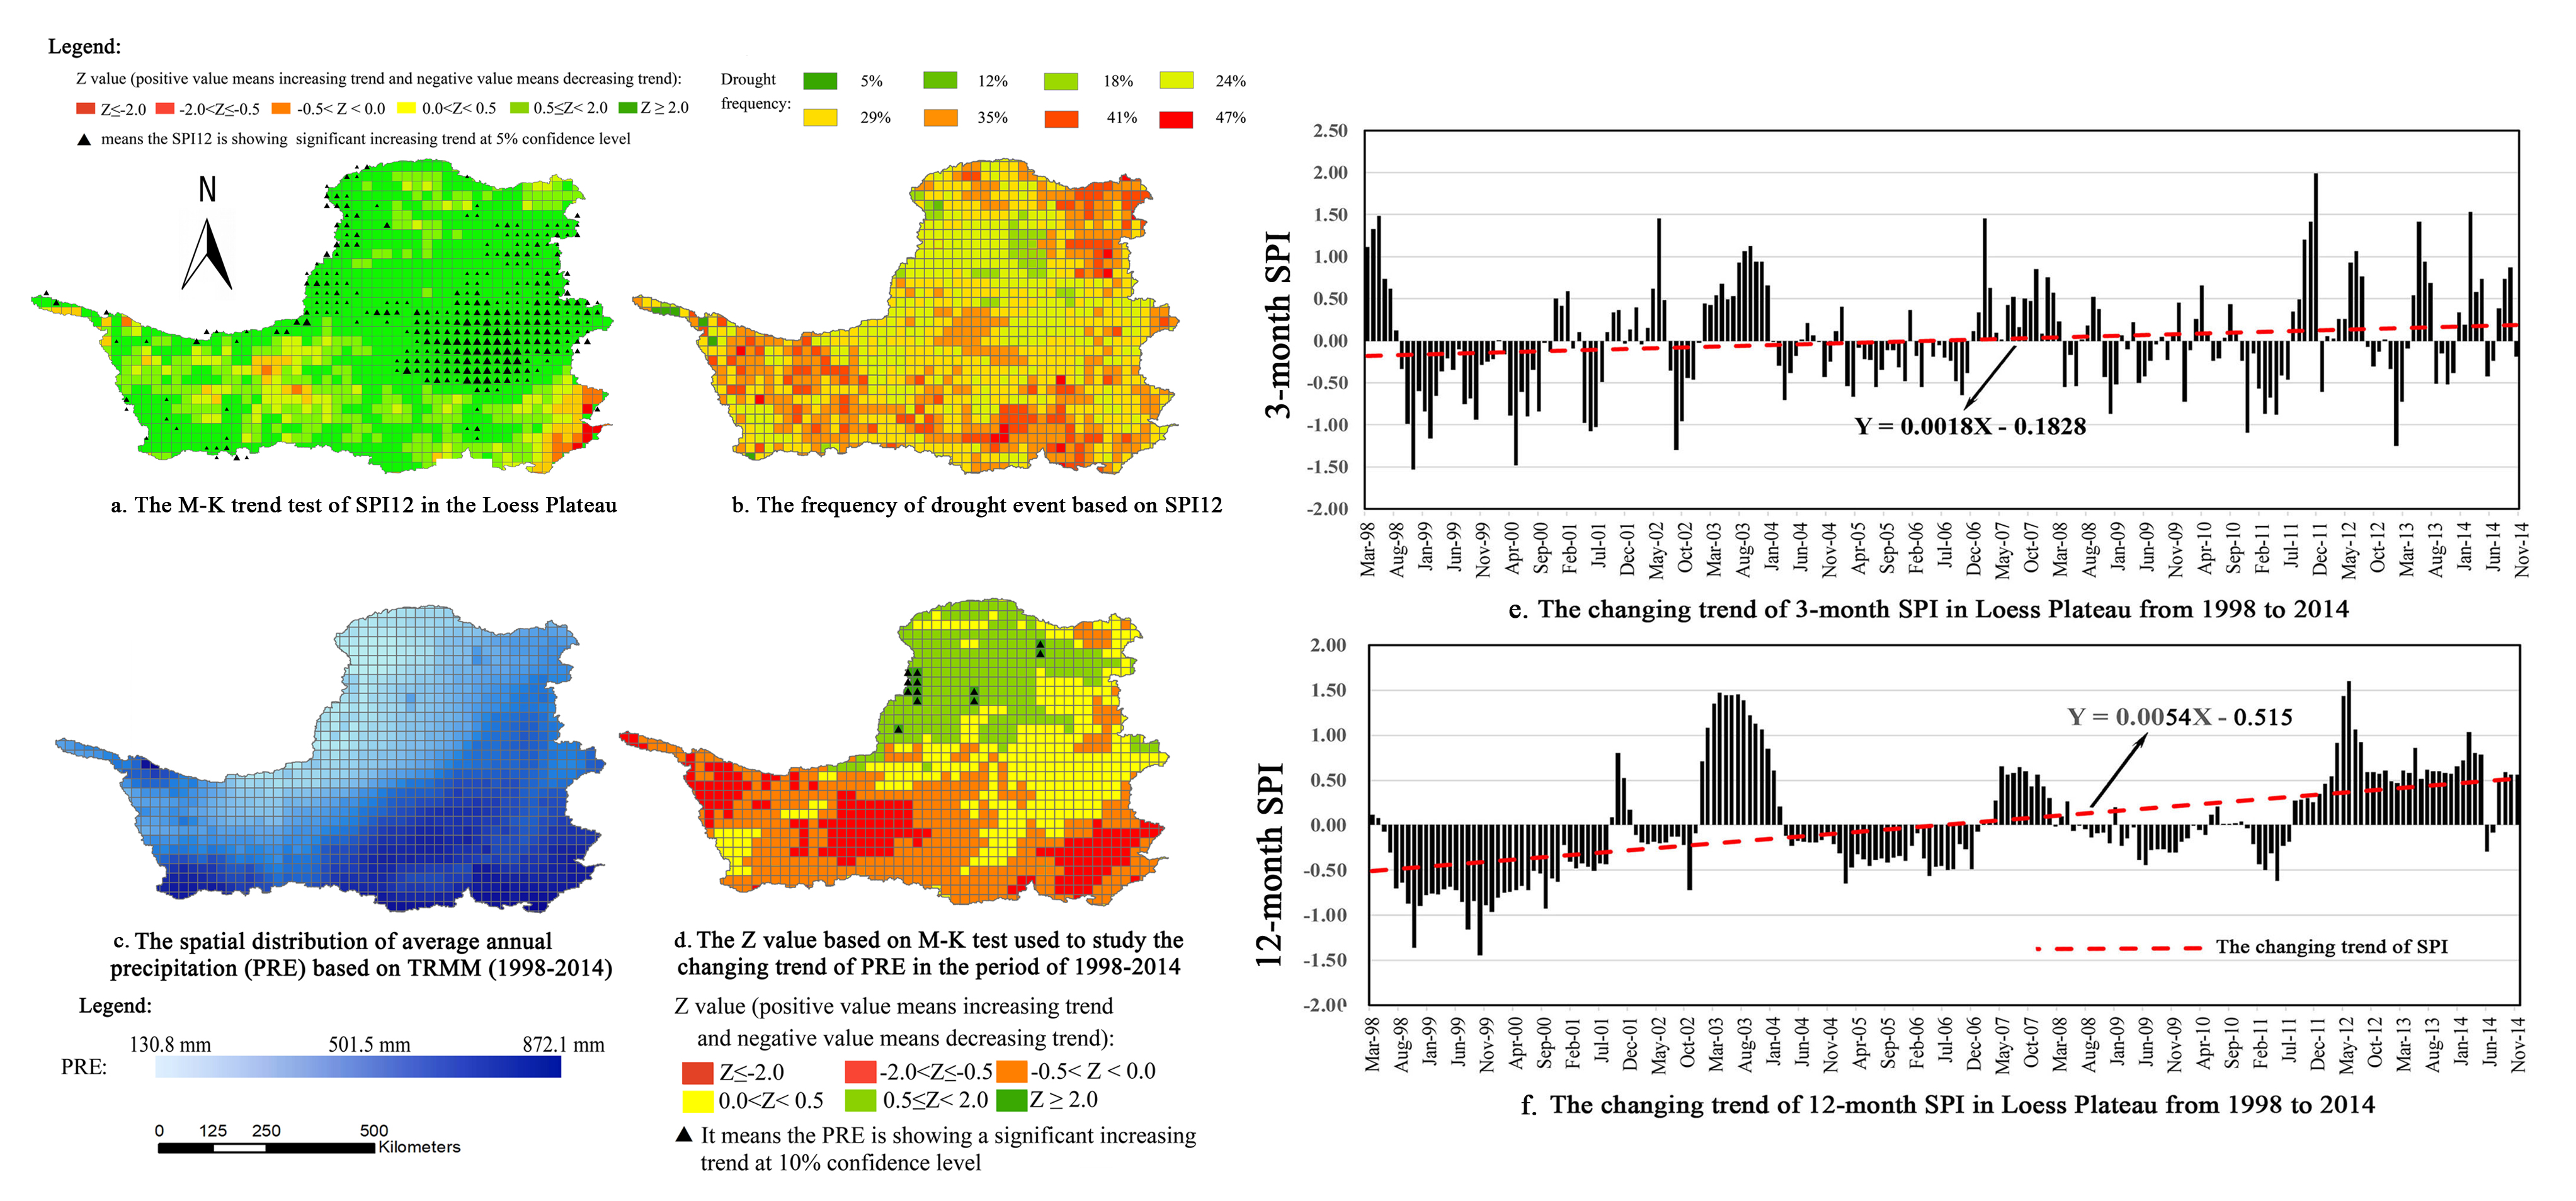
4.3. The Temporal and Spatial Variability of the Drought in the Loess Plateau

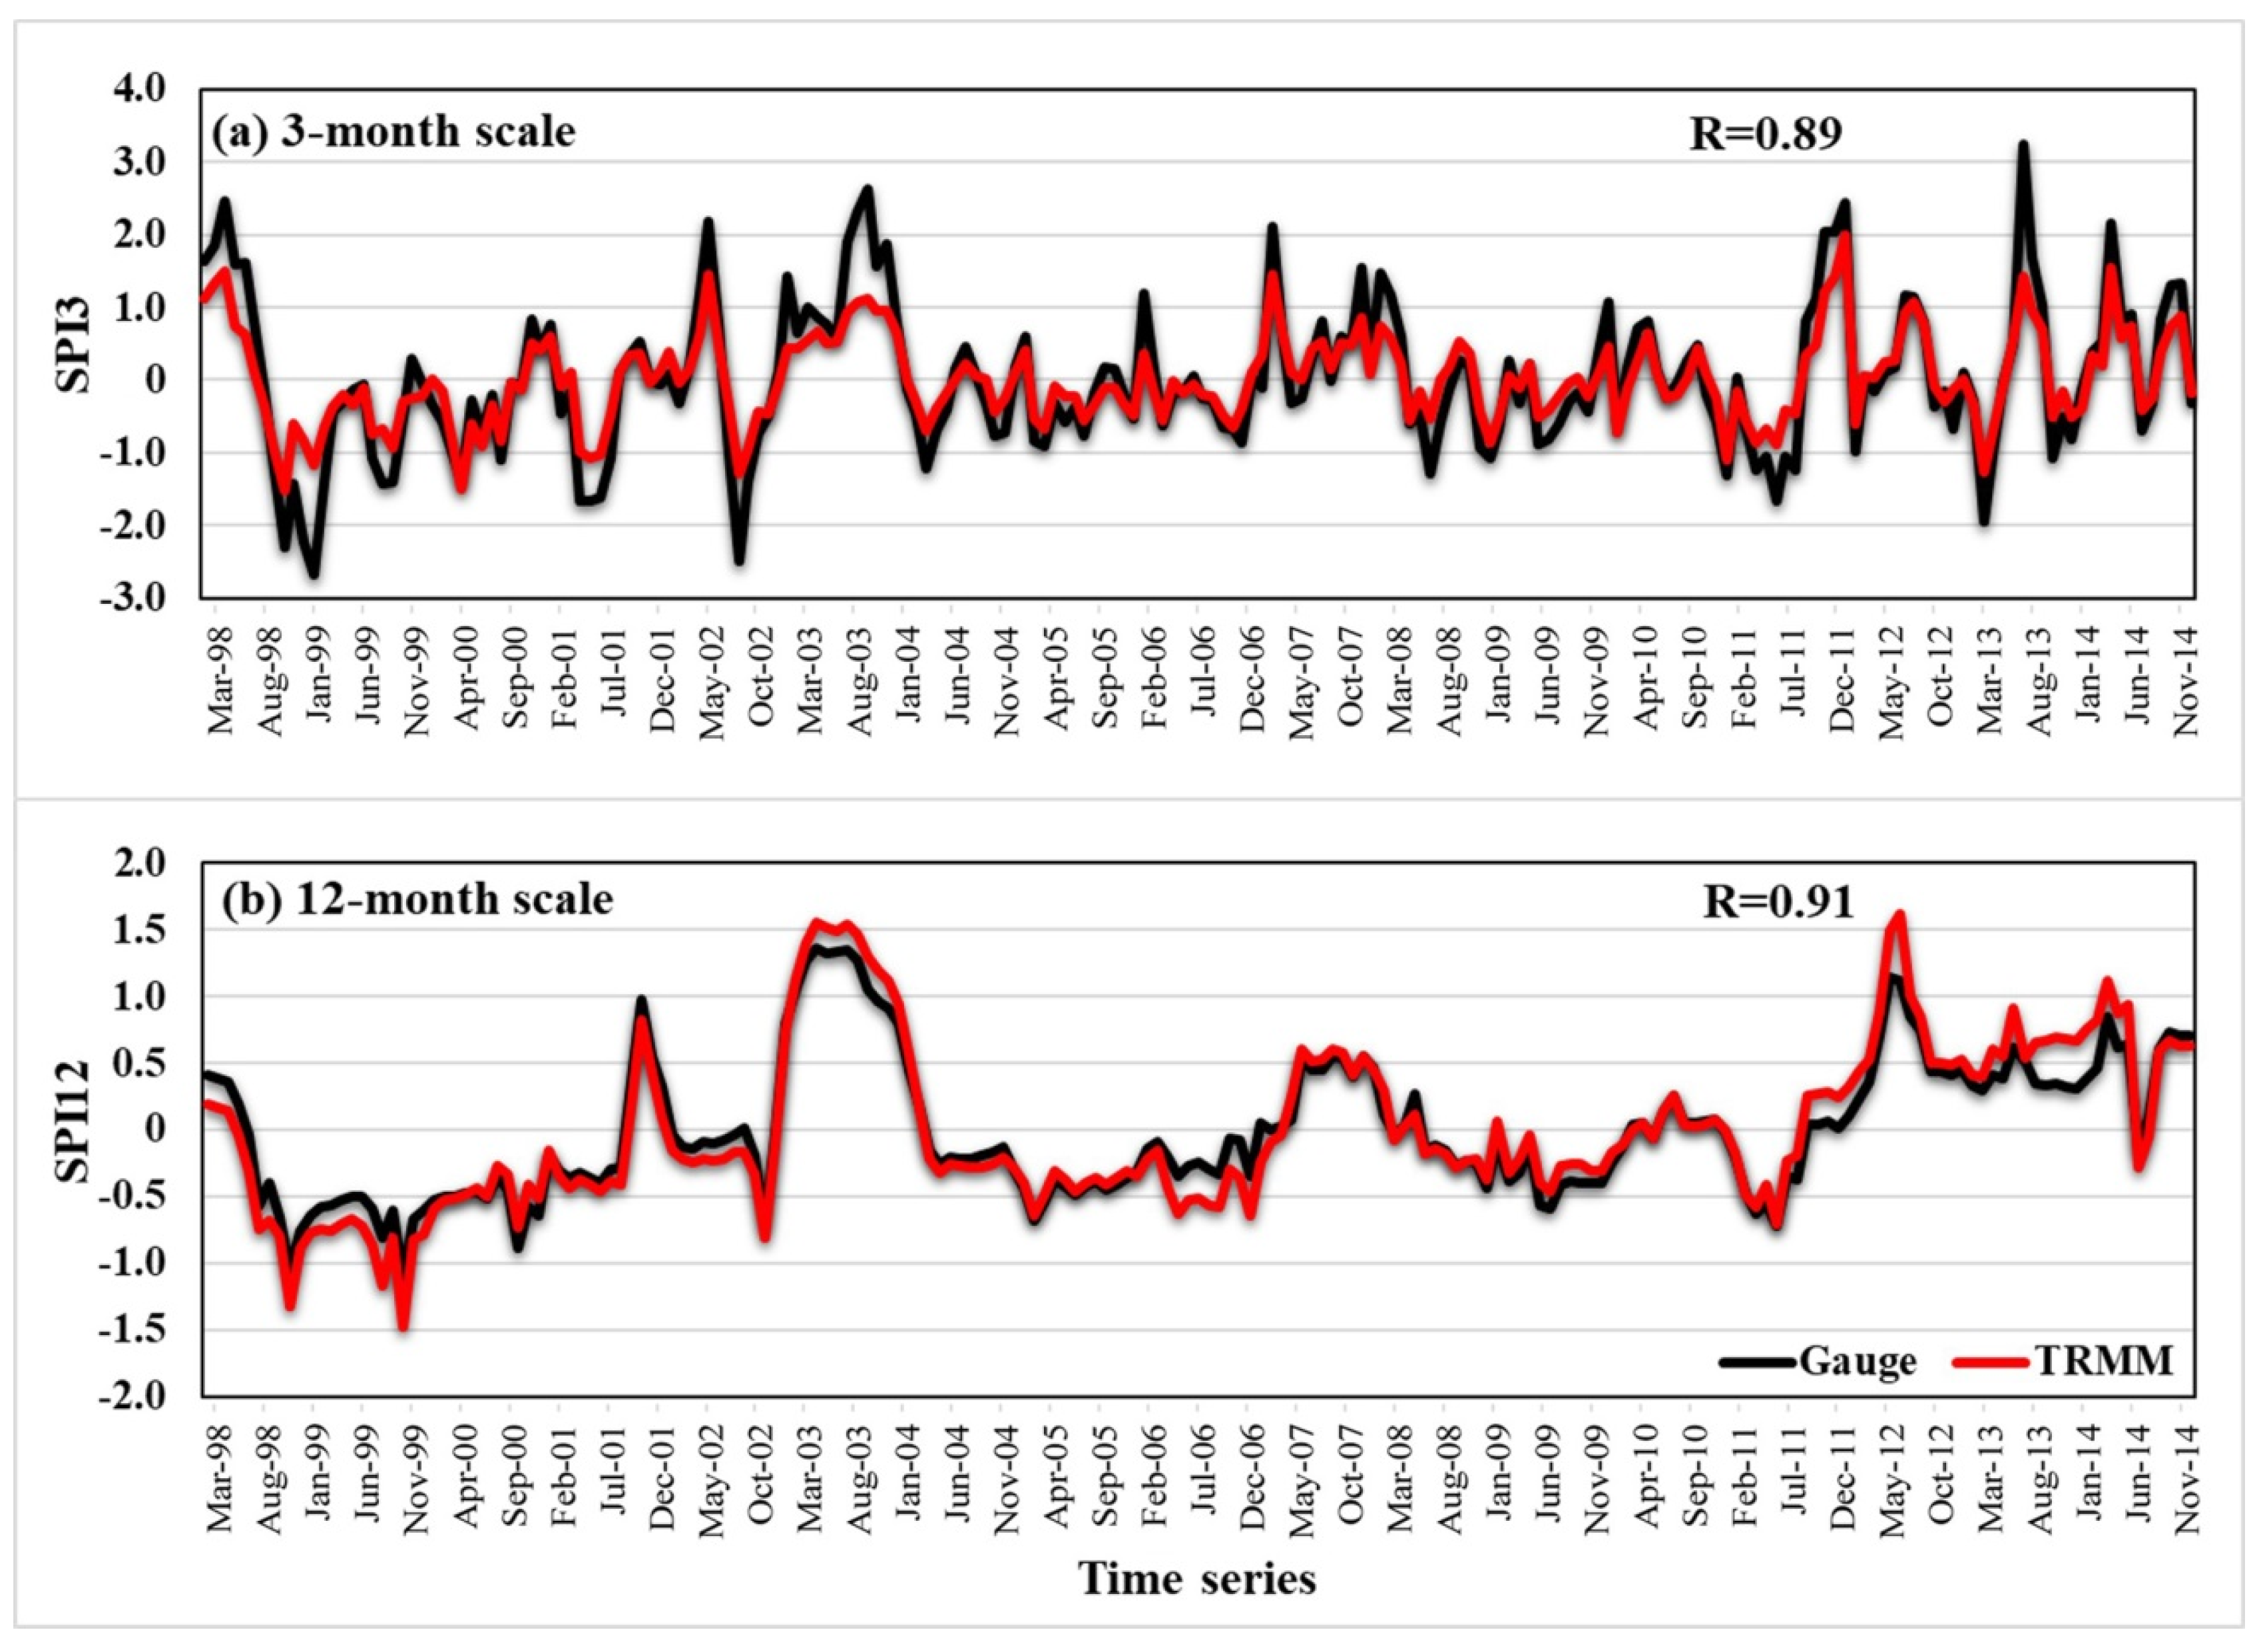
4.3.1. The Reliability Analysis of TRMM-Based SPI

Firstly, we calculated the average precipitation values of the 50 meteorological stations. Then the values were used to calculate the gauge-based SPI. The TRMM-based SPI was calculated by the average precipitation values of TRMM grids related to the meteorological stations. Figure 6 shows that the variability of SPI based on TRMM estimates and rain gauge observations at different time scales at basin scale (i.e., basin average). The Pearson Correlation Coefficients (R) between TRMM -based SPI and rain gauge-based SPI at 3- and 12-month scales are 0.89 and 0.91 respectively. It shows that the TRMM-based SPI matches the rain gauge-based SPI very well at both time scales (3- and 12-month scales) indicating that data can be used to monitor the drought in the Loess Plateau.

4.3.2. The Temporal Variability of Drought

Figure 7a,b show the temporal variation of the average values of 3-month SPI (SPI3) and 12-month SPI (SPI12) in the Loess Plateau from 1998 to 2014. As illustrated in Table 1, when the SPI value is greater than zero, it indicates a wet event and negative values represent a drought event.
Figure 7a shows that the value of SPI3 changes frequently between drought and wet status, because it is vulnerable to being affected by the short-term climatic conditions. For some specific years, droughts occurred over the whole year, such as 1999 to 2000, 2005 to 2006 and 2011. Figure 7b shows the changing trend of SPI12 from 1998 to 2014, which indicates longer-time drought effects on streamflow conditions, reservoir levels, and even groundwater levels in the Loess Plateau. Overall, the changing trends of drought event and the wet event shown in Figure 5a,b are consistent, and the SPI value is showing an increasing trend, which means the Loess Plateau is getting humid in recent years.

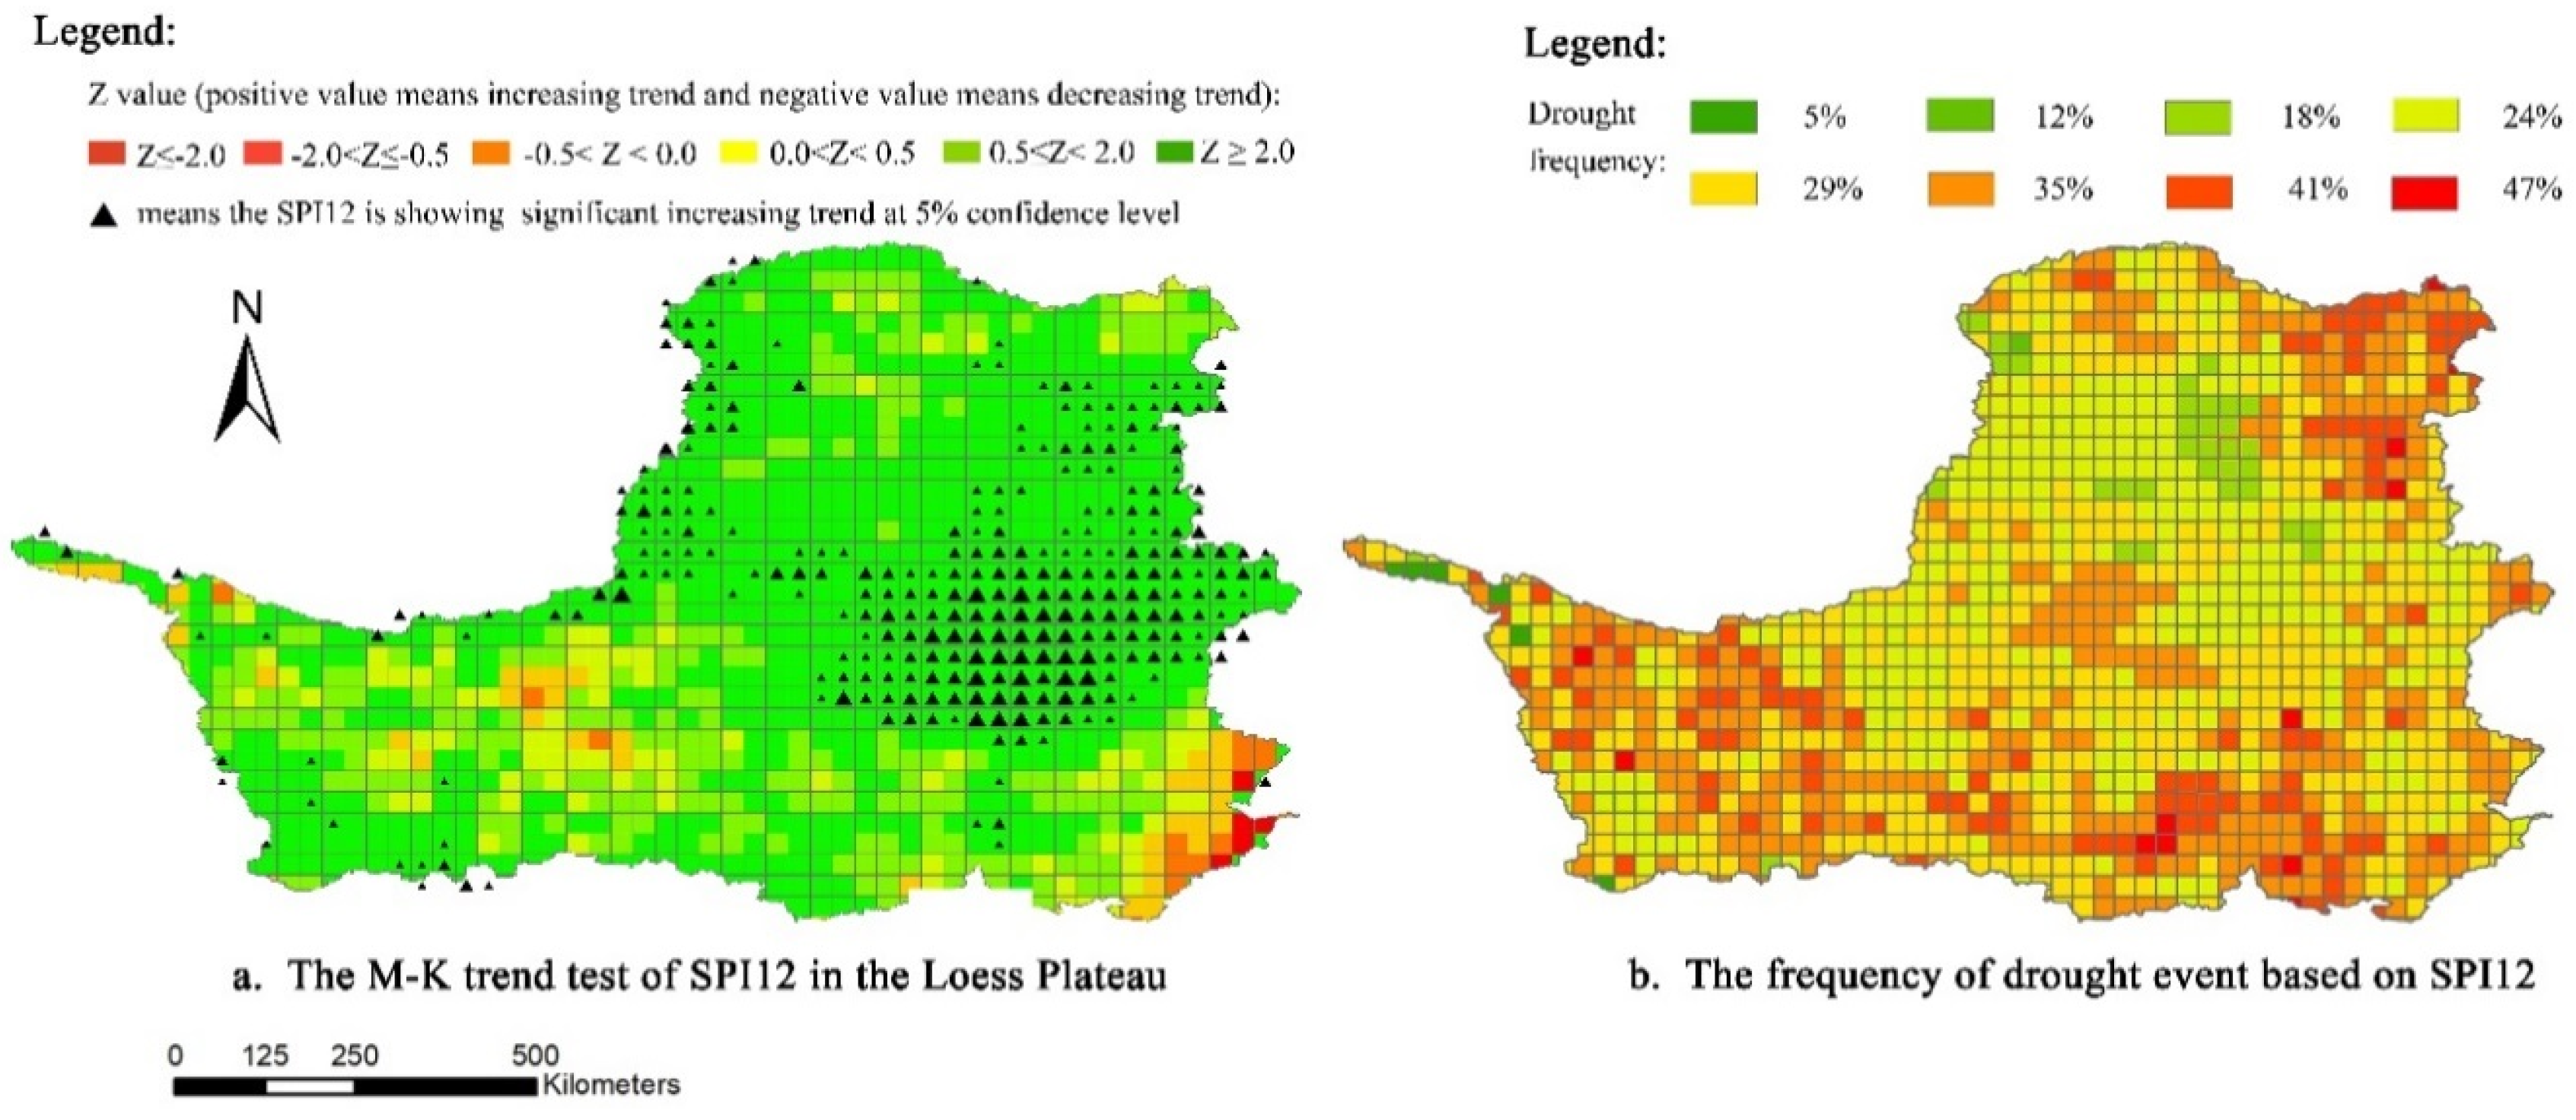
4.3.3. The Spatial Variability of Drought Based on SPI12

Based on the M-K test method, we calculated the Z values in each grid to analyze the changing trend of SPI12, which are shown in Figure 8a. Meanwhile, the frequency of drought event is calculated in each grid in the Loess Plateau. In this study, if the SPI12 in a specific grid is lower than 0, it is defined that the drought event occurred in this grid. The result is shown in Figure 8b.
As shown in Figure 8a, the SPI12 in most parts of the Loess Plateau is showing an increasing positive trend, which indicates that the Loess Plateau is likely becoming humid from 1998 to 2014. Meanwhile, in the southeast and the southwest regions, the SPI12 is showing a slight decreasing trend, but the trend is not significant based on the M-K test. Figure 8b indicates that the frequency of the drought event in most area of Loess Plateau is higher than 20% during 1998 to 2014. In comparison, the northeast and the southern part of the Loess Plateau are vulnerable to suffering from more frequent droughts. Over all, most parts of the Loess Plateau are getting wetter except for some parts in the southeast and southwest. Meanwhile, the high-frequency drought areas are distributed in the northeast and southern part of the Loess Plateau.

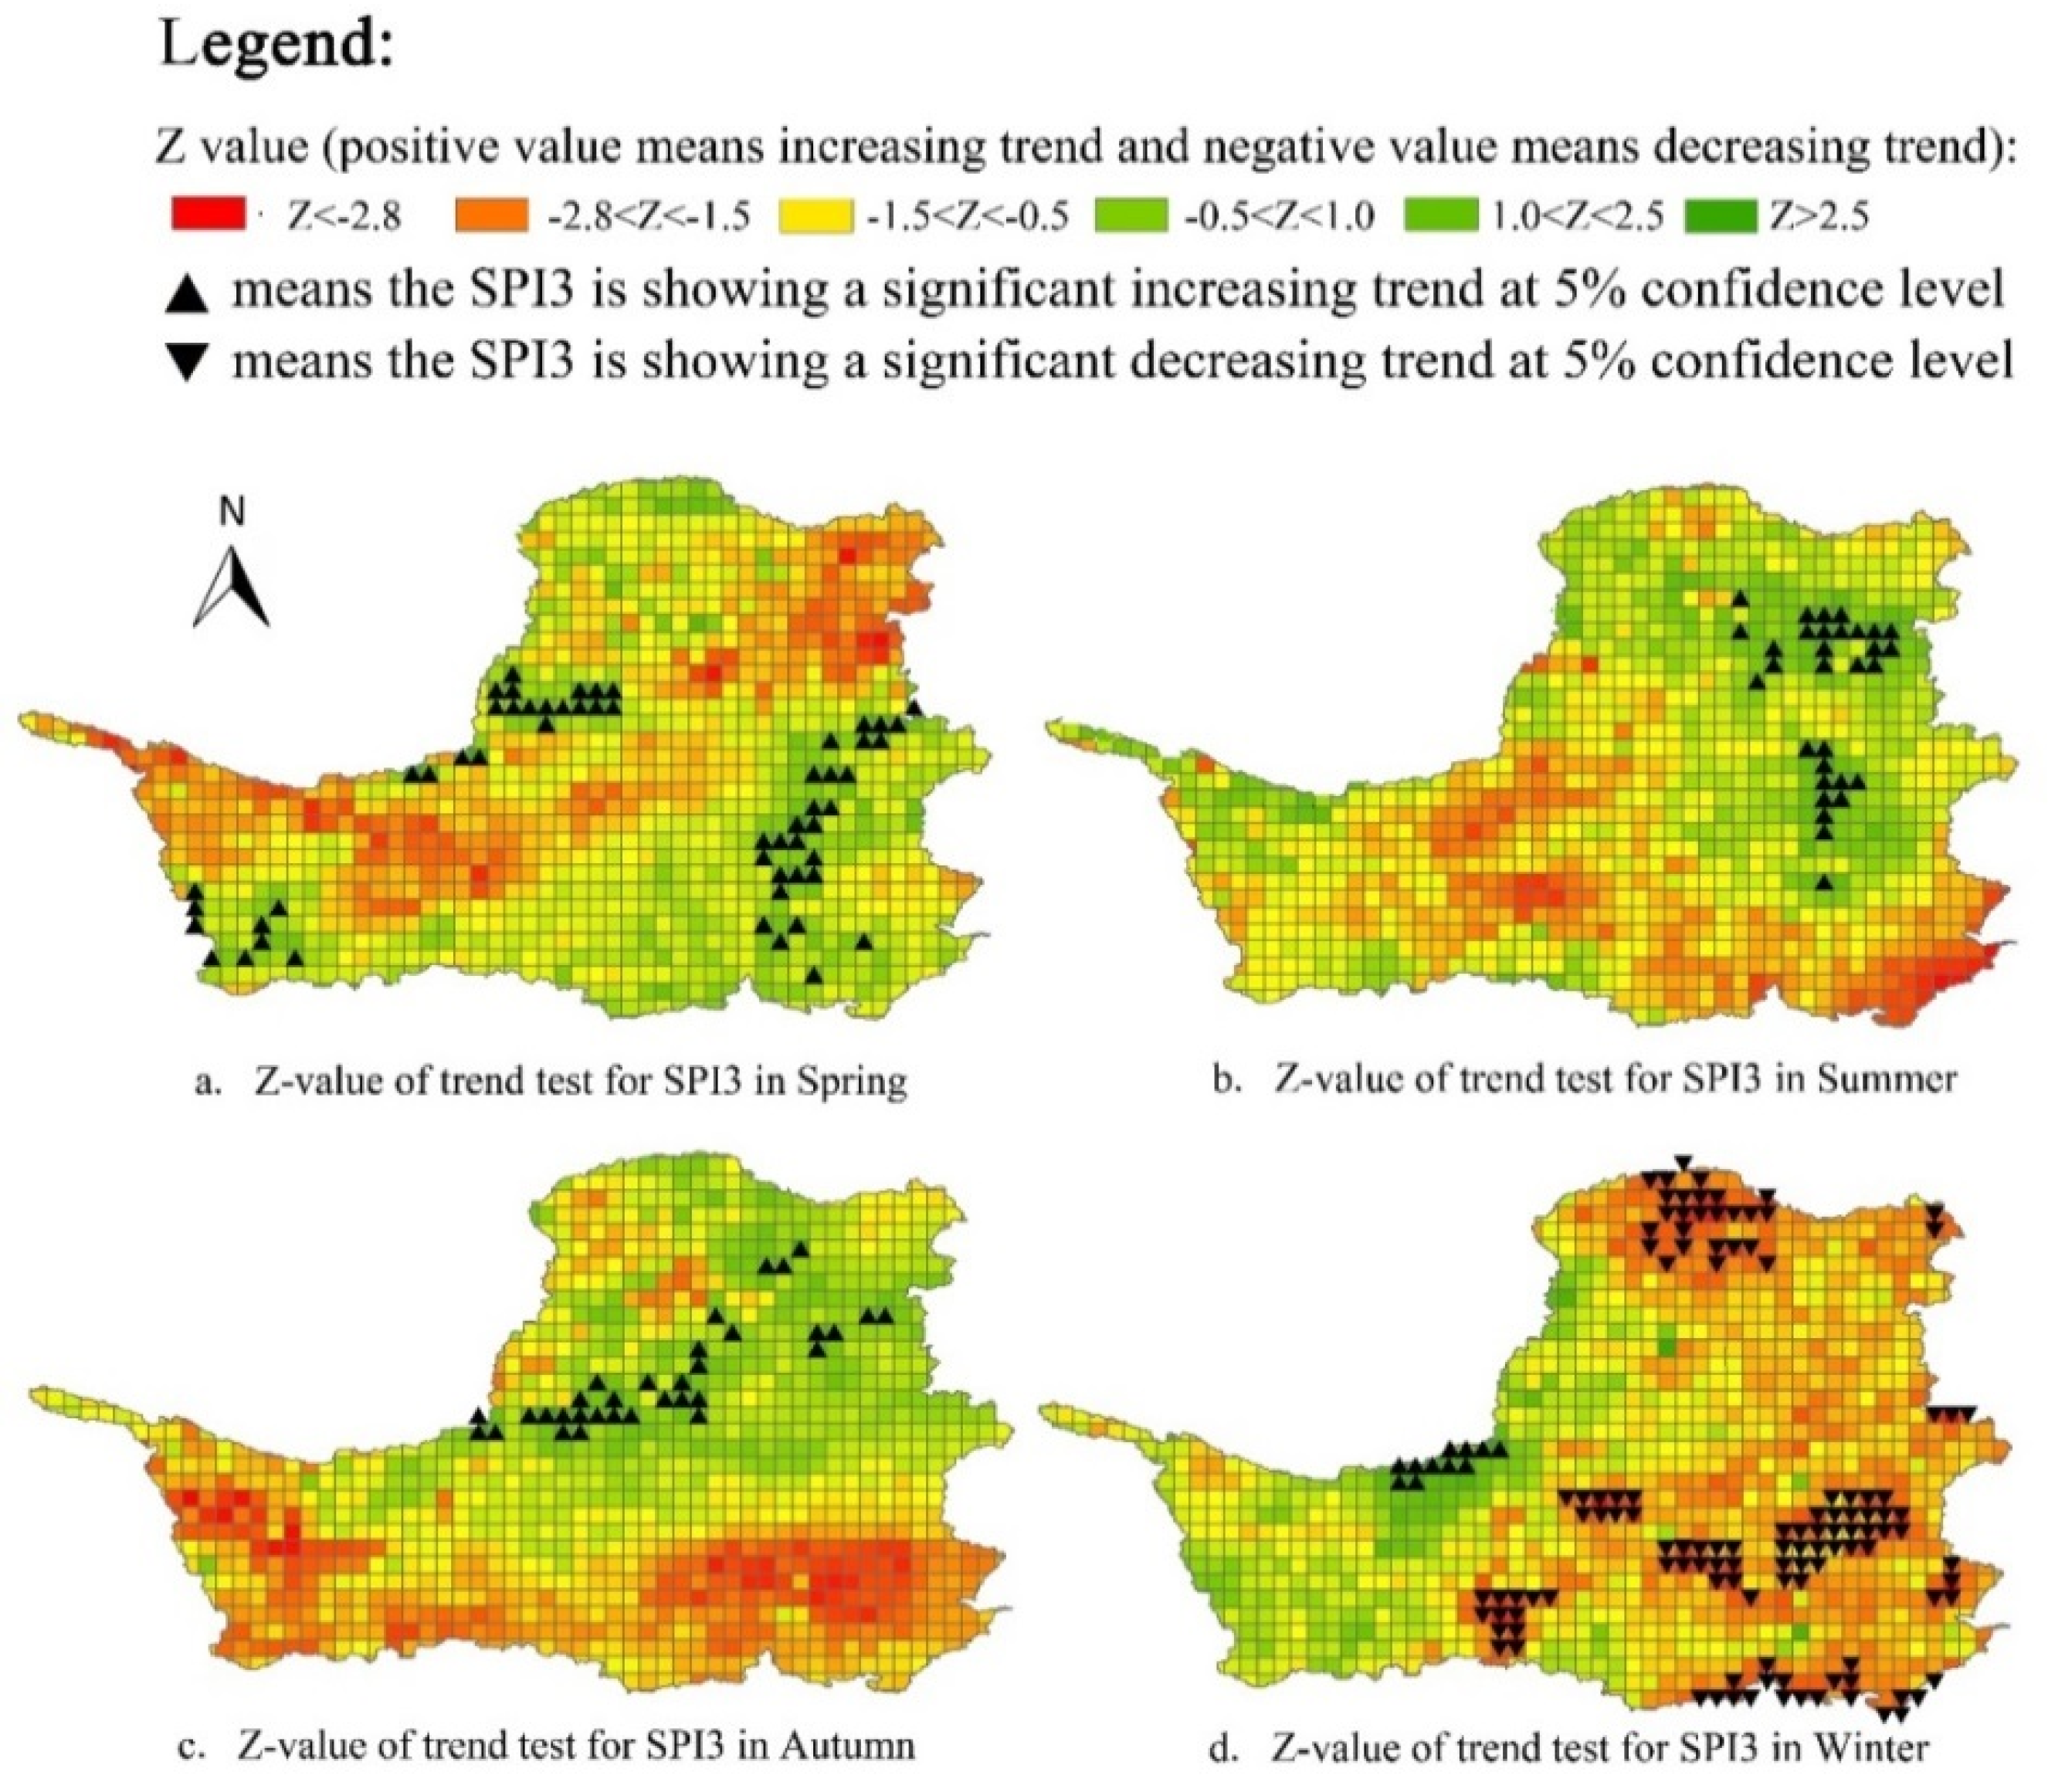
4.3.4. The Spatial Distribution of Drought in the Four Seasons

To study the characteristics of seasonal drought, the SPI3 was chosen as the key index. This paper tested the SPI3 value by the M-K trend test and drew the trend map of drought in different seasons in Figure 9.
Comparing Figure 9a–d, the spatial variability of drought in the four seasons can be concluded as follows. In spring (3–5th month), the SPI3 in the northwest and the southeast part of the Loess Plateau is increasing, while in other areas it is decreasing, which means that the northwest and southeast part of the Loess Plateau is getting wetter. In summer (6–8th month), the SPI3 in the eastern and northern Loess Plateau is increasing, while in other parts is decreasing, which means that the eastern and northern Loess Plateau is getting wetter. In autumn (9–11th month), the SPI3 in the northern Loess Plateau is increasing, while in the southern part it is decreasing. However, the changing trend is not significant. In winter (12–2th month), the SPI3 in the majority of the Loess Plateau is decreasing and the changing trend is significant in some areas, which means that the drought risk in winter of the Loess Plateau is much higher than other seasons. In summary, the Loess Plateau is getting wetter generally in spring, summer, and autumn, except for a few localized areas getting arid non-significantly, which is a positive signal for the vegetation recovery in the growing seasons.

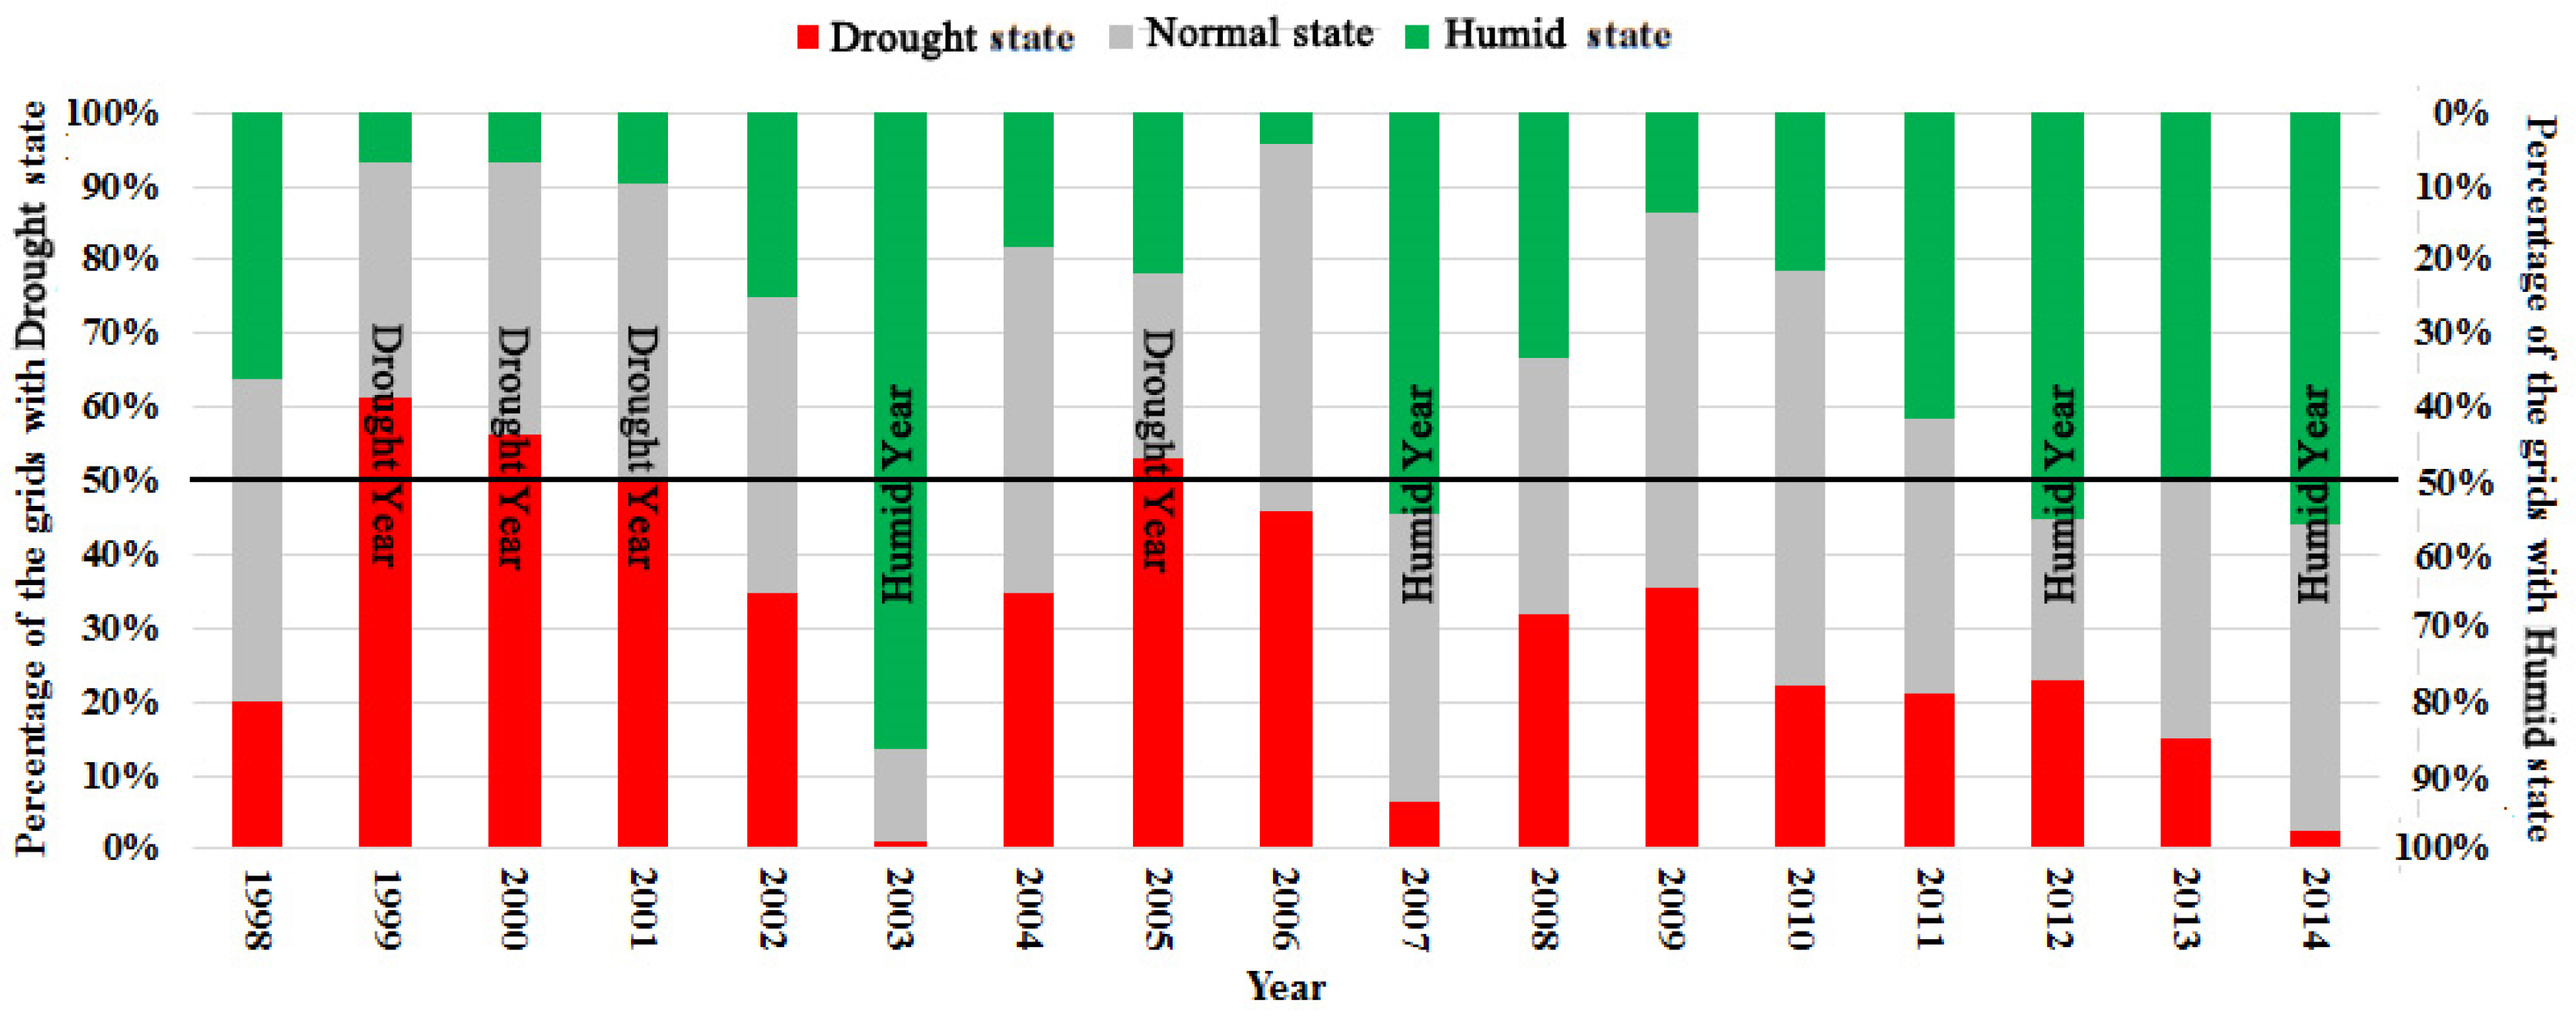
4.3.5. The Temporal Variability of Drought Events and Humid Events

To analyze the temporal characteristics of drought and humid events under climate change, we proposed new definitions of drought and humid year based on the SPI drought index categories. In this study, the whole Loess Plateau has been partitioned into 1150 grids, and each grid has a SPI12 value to represent the degree of drought in every year during the period of 1998–2014. If the SPI12 is greater than 0.5, the grid is defined as a humid state. If the SPI12 is lower than −0.5, the grid is defined as a drought state and if the SPI12 is between −0.5 and 0.5, the grid is defined as a normal state. For the whole Loess Plateau, if the total number of the grids in a humid state in a specific year accounts for >50% of the total number of grids, this year is defined as a humid year. If the total number of the grids in a drought state in a specific year accounts for >50% of the total number of grids, this year is defined as a drought year.
As shown as Figure 10, there are four drought years and four humid years during 1998–2014. The drought years are 1999, 2000, 2001 and 2005, while the humid years are 2003, 2007, 2012 and 2014. The drought years all occurred in the first half of 1998–2014 and most of the humid years occurred in the last half of 1998–2014 except the year of 2003. From the Figure 10, we find that occurrence rate of drought year is decreasing and the occurrence rate of humid year is increasing. Therefore, the Loess Plateau is most likely changing to be humid during 1998–2014.

5. Discussion

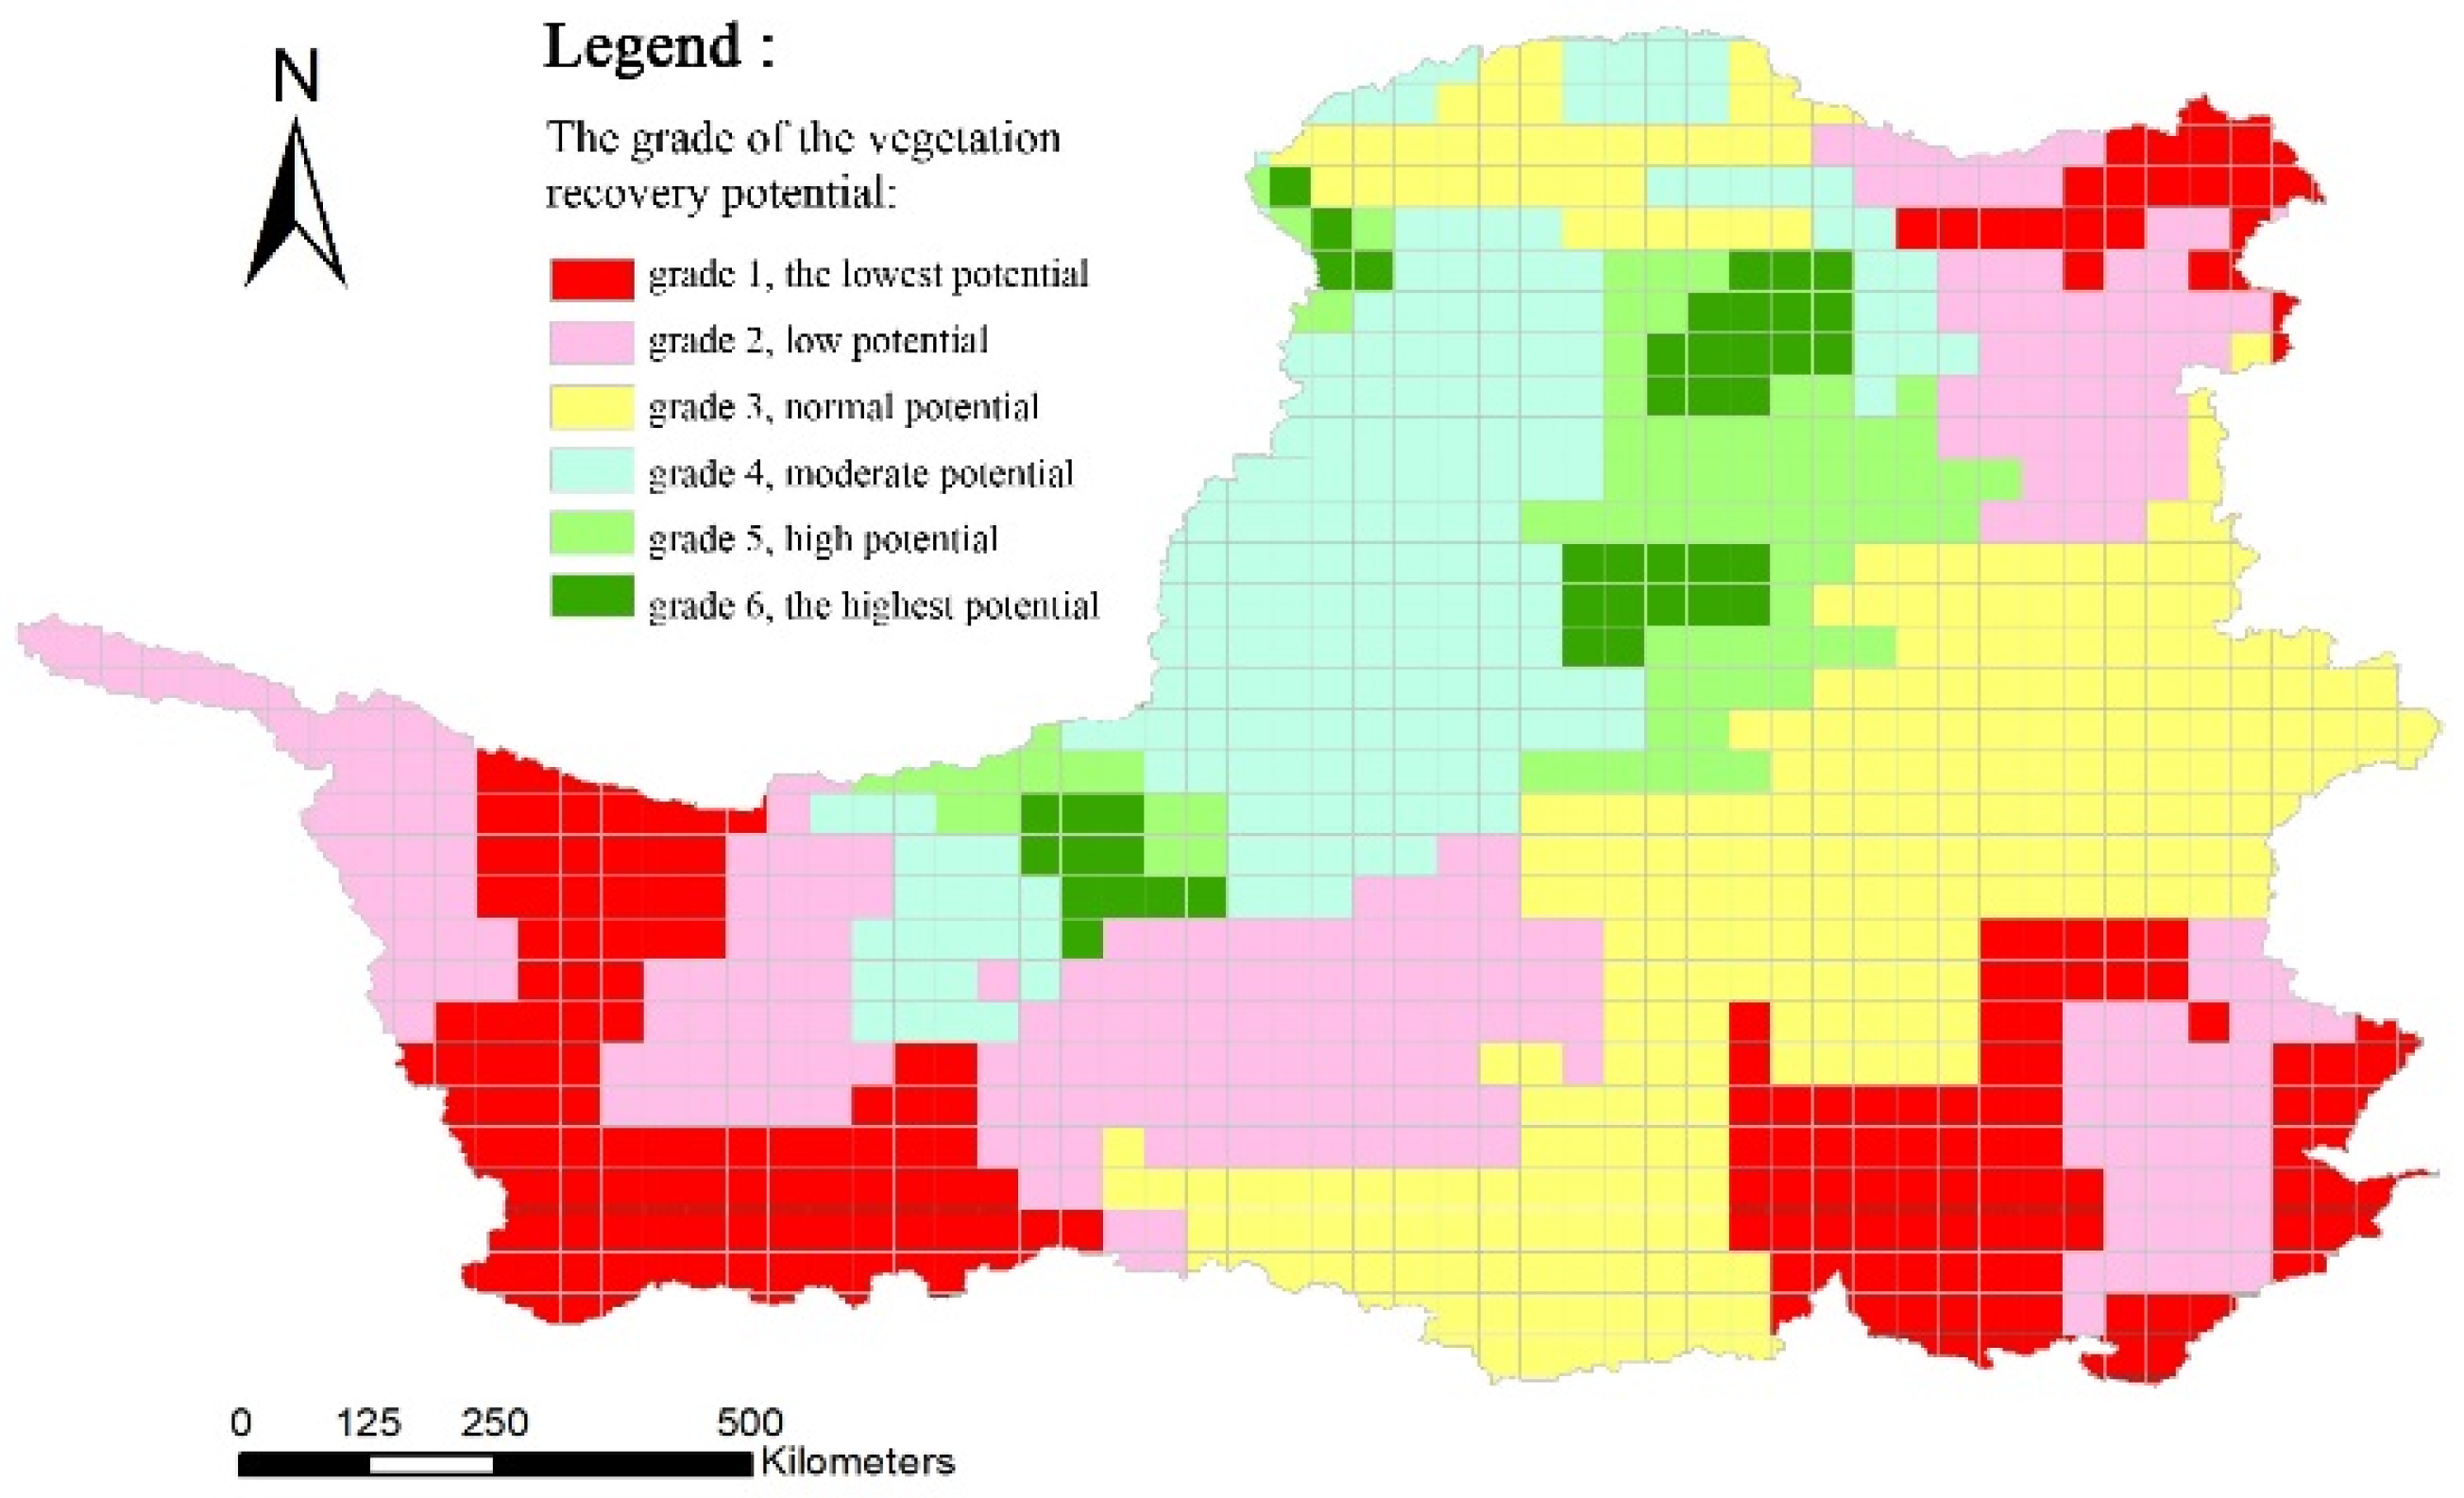
5.1. The Potential of Vegetation Recovery in the Loess Plateau

Heat and water are two crucial factors for vegetation recovery and anti-desertification in the Loess Plateau [43]. The Loess Plateau has abundant solar energy resources in China, which is the second richest area in solar energy following the Tibet Plateau. Therefore, the water resource is comparatively the determinant factor for vegetation recovery and ecological restoration in the Loess Plateau. Since 1999, the Chinese government approved the Grain-for-Green Project. After more than 15 years, the average vegetation coverage on the Loess Plateau has been greatly increased, which is as large as 59.6% by 2013, almost double the vegetation coverage before the Grain-for-Green Project [44]. However, with the increase in the vegetation coverage, the water requirements of plants and crops are also increasing correspondingly. Therefore, assessing the potential of vegetation construction and recovery is very important for the sustainable development of the ecosystem in the Loess Plateau, and also a scientific focus to guide the further implementation of Grain for Green Project under the background of global climate change.
According to the vegetation recovery potential assessment method described above in Part 3.4, the grade of the vegetation recovery potential was qualitatively determined in the 1150 grids of the whole Loess Plateau, and the spatial distribution of the potential grade for the vegetation recovery was drawn by the GIS tool, as shown in Figure 11.
As shown in Figure 11, the high-potential area (the grids with the Level 6 and Level 5) is mainly located in the central and small part of the west, accounting for 24.6% of the total area of Loess Plateau. The east and the middle-southern part of the Loess Plateau are showing moderate potential for vegetation recovery, accounting for 37.6% of the total area of Loess Plateau. However, the vegetation recovery potential in the southeast, southwest, and northeast corner of the Loess Plateau is very low (the grids with the Level 2 and Level 1), accounting for 37.8% of the total area of the Loess Plateau. As mentioned before, since the Grain-for-Green Project was implemented in 1999, the average vegetation coverage has been substantially improved from 31.6% (1999) to 59.6% (2013). However, the growth of the vegetation coverage in the Loess Plateau is extremely uneven from the north to south. The remote-sensed result indicates that the NDVI in the southern and eastern part of the Loess Plateau was greater than 0.6 in 2014. However, the NDVI in the northern and western part was less than 0.35. Luckily, based on the TRMM precipitation data in this study, the central and northwest part of Loess Plateau showed a significant humidification trend during these years, which could provide sufficient water resources for vegetation growth and ecological restoration. It is predicted that, in the next few years, the vegetation coverage in the Loess Plateau will be more balanced spatially if the government could continuously strengthen the implementation of the Grain-for-Green Project reasonably and effectively.

5.2. The Comparison between Our Findings and Those of the Previous Studies

To evaluate the reliability of the TRMM-based SPI, we made a comparison between the findings of this study and the previous studies. Through the comparative analysis of the TRMM-based SPI and the gauge-based SPI, we find that the TRMM-based SPI matches the rain gauge-based SPI very well at all time scales (3- and 12-month scales). The previous related studies have the similar conclusions with ours. Jiang et al. found that the TRMM (3B42V7) precipitation data can be efficiently used to monitor the drought conditions at different time scales in Weihe River Basin of Loess Plateau [18]. Yan et al. evaluated the reliability of the Tropical Rainfall Measuring Mission (TRMM3B43V7) products using the observed monthly precipitation data obtained from 118 meteorological stations in Southwest China from 1998 to 2013 and found that the TRMM-based SPI was consistent with gauge-based SPI [45]. Tao et al. evaluated the reliability of the Multi-Satellite Precipitation Analysis (TMPA) product using observed monthly precipitation data from 65 meteorological stations in Jiangsu Province, China in the period of 1998–2014 and they found that the TRMM3B43-based SPI showed very good agreement in frequency and intensity with the SPI from observations [46].
According to the results of this study, the Loess Plateau was likely showing an obvious wetting trend in the period of 1998–2014. This finding is consistent with previous studies with respect to climatic variables. For example, Yan studied the changing trend of temperature and precipitation based on the observed meteorological data from 1961 to 2014 in the entire Loess Plateau [47]. The results indicated that precipitation showed a general downward trend in the entire period from 1961 to 2014. However, the results also showed that the precipitation was increasing specifically after 1990. Gao et al. concluded that the precipitation from 1990 to 2014 was increasing significantly based on observed precipitation values [48]. Li et al. studied the effect of changes in extreme precipitation events in the Loess Plateau and concluded that more frequent and intense precipitation would occur during the 21st century and the total annual precipitation would be slightly rising [49]. However, there is one study with inconsistent findings. Liu et al. made a comprehensive analysis of the evolution characteristics of drought using the aridity–wetness index of precipitation and potential evaporation based on daily precipitation and other meteorological data from 1961 to 2013 [50]. The result showed that there was an obvious drying trend in the Loess Plateau, which is inconsistent with our study. The reason may be that the study period of Liu et al. is much longer than our study, and they ignored the increasing trend of precipitation during the sub-period of 1998–2014. Based on the above analyses, the inconsistent research conclusions in previous studies are mainly due to the high uncertainties of climatic variables and different data sources.

6. Conclusions

This study used the TRMM multi-satellite precipitation data to study the spatial-temporal evolution of drought in the Loess Plateau based on the SPI drought index in the period of 1998–2014. The main conclusions from this study can be summarized as follows:
(1) The accuracy of the monthly TRMM precipitation data is satisfactory to quantitatively calculate the regional drought index in the Loess Plateau. The daily TRMM precipitation data are poor in accuracy, while the monthly TRMM precipitation data are better in accuracy. By comparison, the Pearson Correlation Coefficient (R) is 0.91m and the Bias is 1.92 and the relative Bias is 5%. Therefore, the monthly TRMM satellite-derived precipitation data are well matched with the observed values. The Pearson Correlation Coefficients (R) between TRMM-based SPI and rain gauge-based SPI at 3- and 12-month scales are 0.89 and 0.91 respectively. It shows that the TRMM-based SPI matches the rain gauge-based SPI very well at all time scales (3- and 12-month scales). Thus, the TRMM data can be used to monitor the drought in the Loess Plateau.
(2) The temporal and spatial variation of precipitation and the SPI drought index is studied in this paper. The precipitation in the majority of the Loess Plateau is generally showing a significant increasing trend, and the growth rate of precipitation in the northern Loess Plateau is higher than that in the southern Loess Plateau. The SPI3 and SPI12 are both showing an increasing trend in the whole Loess Plateau during the period of 1998–2014, which indicates that the Loess Plateau is likely becoming wetter since the implementation of Grain-for-Green Project. From the spatial perspective, the SPI in the northern Loess Plateau is increasing significantly. However, the southern Loess Plateau is showing a slight drying trend.
(3) Vegetation recovery and sustainable ecological development is a key issue for the Loess Plateau. Based on the drought evolution, our study further analyzed the potential of vegetation recovery on Loess Plateau. The high-potential area (the green grids) is mainly located in the central and small part of the west, accounting for 24.6% of the total area of the Loess Plateau. However, the potential in the southeast, southwest, and a small part of the northeast is very low. Generally speaking, the central-northern part of Loess Plateau is becoming humid significantly, which is the best zone for vegetation recovery. In contrast, the southern part of Loess Plateau is showing quite a high drought risk. The above findings could be an important reference for the government and managers to take measures in advance for sustainable ecological management in the Loess Plateau.

Author Contributions

P.W. and X.G. conceived and designed the roadmap of this study; Q.Z. and Q.C. performed the experiments and analyzed the data; M.J., M.M. and Y.H. contributed to the discussion and edited the manuscript; Q.Z. and X.G. wrote the paper; All authors discussed and reviewed the manuscript.

Funding

This research was funded by National Key Research and Development Program of China (2016YFC0401301, 2016YFC0400204), and the Major Consulting Project of Chinese Academy of Engineering (Grant No. 2016-ZD-08-02) and the Open Research Fund of the State Key Laboratory of Simulation and Regulation of Water Cycle in River Basin at the China Institute of Water Resources and Hydropower Research (IWHR-SKL-201601).

Acknowledgments

The researchers thank the assistance of Professor Yong Zhao from China Institute of Water Resources and Hydropower Research, and the help provided by Liqin Ge and Xueqin Pang in language editing is also appreciated.

Conflicts of Interest

The authors declare no conflict of interest.

References

  1. Min, S.K.; Zhang, X.; Zwiers, F.W.; Hegerl, G.C. Human contribution to more-intense precipitation extremes. Nature 2011, 470, 378–381. [Google Scholar] [CrossRef] [PubMed]
  2. Perkins, D.; Uhl, E.; Biber, P.; Toit, B.; Carraro, V.; Rotzer, T.; Pretzsch, H. Impact of Climate Trends and Drought Events on the Growth of Oaks (Quercus robur L. and Quercus petraea (Matt.) Liebl.) within and beyond Their Natural Range. Forests 2018, 9, 108. [Google Scholar] [CrossRef]
  3. Bayarjargal, Y.; Karnieli, A.; Bayasgalan, M.; Khudulmur, S.; Gandush, C.; Tucker, C.J. A Comparative study of NOAA-AVHRR derived drought indices using change vector analysis. Remote Sens. Environ. 2006, 105, 9–22. [Google Scholar] [CrossRef]
  4. Bhuiyan, C.; Singh, R.P.; Kogan, F.N. Monitoring drought dynamics in the Aravalli region (India) using different indices based on ground and remote sensing data. Int. J. Appl. Earth Obs. Geoinf. 2006, 8, 289–302. [Google Scholar] [CrossRef]
  5. Guttman, N.B. Comparing the palmer drought index and the standardized precipitation index. J. Am. Water Resour. Assoc. 1998, 34, 113–121. [Google Scholar] [CrossRef]
  6. McKee, T.B.; Doesken, N.J.; Kleist, J. The relationship of drought frequency and duration to time scales. In Proceedings of the 8th Conference on Applied Climatology, Anaheim, CA, USA, 17–22 January 1993; American Meteorological Society: Boston, MA, USA, 1993; pp. 179–184. [Google Scholar]
  7. Naresh Kumar, M.; Murthy, C.S.; Sesha Sai, M.V.R.; Roy, P.S. On the use of Standardized Precipitation Index (SPI) for drought intensity assessment. Meteorol. Appl. 2009, 16, 381–389. [Google Scholar] [CrossRef]
  8. Svoboda, M.; Hayes, M. Standardized Precipitation Index User Guide; WMO-No. 1090; Wood World Meteorological Organization: Geneva, Switzerland, 2012. [Google Scholar]
  9. Zarch, M.A.A.; Sivakumar, B.; Sharma, A. Droughts in a warming climate: A global assessment of Standardized precipitation index (SPI) and Reconnaissance drought index (RDI). J. Hydrol. 2015, 526, 183–195. [Google Scholar] [CrossRef]
  10. Mansour, A. Calibration of TRMM rainfall climatology over Saudi Arabia during 1998–2009. Atmos. Res. 2010, 99, 400–414. [Google Scholar] [CrossRef]
  11. Mcroberts, B.D.; Nielsengammon, J.W. The use of a high-resolution standardized precipitation index for drought monitoring and assessment. J. Appl. Meteorol. Clim. 2011, 51, 68–83. [Google Scholar] [CrossRef]
  12. Stampoulis, D.; Anagnostou, E.N. Evaluation of global satellite rainfall products over continental Europe. J. Hydrometeorol. 2012, 13, 588–603. [Google Scholar] [CrossRef]
  13. Ghajarnia, N.; Liaghat, A.; Daneshkar Arasteh, P. Comparison and evaluation of high resolution precipitation estimation products in Urmia Basin-Iran. Atmos. Res. 2015, 158–159, 50–65. [Google Scholar] [CrossRef]
  14. Khan, S.I.K.; Hong, H.; Gourley, J.J.; Khattak, M.U.K.; Yong, B.; Vergara, H.J. Evaluation of three high-resolution satellite precipitation estimates: Potential for monsoon monitoring over Pakistan. Adv. Space Res. 2014, 54, 670–684. [Google Scholar] [CrossRef]
  15. Zhao, T.B. Evaluation of TRMM 3B42 product using a new gauge-based analysis of daily precipitation over China. Int. J. Climatol. 2014, 34, 2749–2762. [Google Scholar] [CrossRef]
  16. Yang, N.; Zhang, K.; Hong, Y.; Zhao, Q.H.; Qin, H.Q.; Xu, Y.S.; Xue, X.W.; Chen, S. Evaluation of the TRMM multisatellite precipitation analysis and its applicability in supporting reservoir operation and water resources management in Hanjiang basin, China. J. Hydrol. 2017, 549, 313–325. [Google Scholar] [CrossRef]
  17. Mantas, V.M.; Liu, Z.; Caro, C.; Pereira, A.J.S.C. Validation of TRMM multi-satellite precipitation analysis (TMPA) products in the Peruvian Andes. Atmos. Res. 2015, 163, 132–145. [Google Scholar] [CrossRef]
  18. Jiang, S.H.; Ren, L.L.; Zhou, M.; Yong, B.; Zhang, Y.; Ma, M. Drought monitoring and reliability evaluation of the latest TMPA precipitation data in the Weihe River Basin, Northwest China. J. Arid Land 2017, 9, 256–269. [Google Scholar] [CrossRef]
  19. Li, D.; Christakos, G.; Ding, X.X.; Wu, J.P. Adequacy of TRMM satellite rainfall data in driving the SWAT modeling of Tiaoxi catchment (Taihu lake basin, China). J. Hydrol. 2017. [Google Scholar] [CrossRef]
  20. Rhee, J.; Im, J.; Carbone, G.J. Monitoring agricultural drought for arid and humid regions using multi-sensor remote sensing data. Remote Sens. Environ. 2010, 114, 2875–2887. [Google Scholar] [CrossRef]
  21. Tan, M.L.; Chua, V.P.; Tan, K.C.; Brindha, K. Evaluation of TMPA 3B43 and NCEP-CFSR precipitation products in drought monitoring over Singapore. Int. J. Remote Sens. 2018, 39, 2089–2104. [Google Scholar] [CrossRef]
  22. Zeng, H.W.; Li, L.J.; Li, J.U. The evaluation of TRMM Multisatellite Precipitation Analysis (TMPA) in drought monitoring in the Lancang River Basin. J. Geogr. Sci. 2012, 22, 273–282. [Google Scholar] [CrossRef]
  23. Naumann, G.; Barbosa, P.; Carrao, H.; Singleton, A.; Vogt, J. Monitoring Drought Conditions and Their Uncertainties in Africa Using TRMM Data. J. Appl. Meteorol. Climatol. 2012, 51, 1867–1874. [Google Scholar] [CrossRef]
  24. Gao, X.R.; Zhao, Q.; Zhao, X.N.; Wu, P.T.; Pan, W.X.; Gao, X.D.; Sun, M. Temporal and spatial evolution of the standardized precipitation evapotranspiration index (SPEI) in the Loess Plateau under climate change from 2001 to 2050. Sci. Total Environ. 2017, 595, 191–200. [Google Scholar] [CrossRef] [PubMed]
  25. Yang, Y.; Bian, Y. Building a Harmonious Relationship between Water Resource and the Environment on the Loess Plateau: How to Restore Its Vegetation. In Proceedings of the 2011 International Symposium on Water Resource and Environmental Protection, Xi’an, China, 20–22 May 2011. [Google Scholar] [CrossRef]
  26. Liu, Z.P.; Wang, Y.Q.; Shao, M.G.; Jia, X.X.; Li, X.L. Spatiotemporal analysis of multiscalar drought characteristics across the Loess Plateau of China. J. Hydrol. 2016, 534, 281–299. [Google Scholar] [CrossRef]
  27. Sun, C.F.; Ma, Y.Y. Effects of non-linear temperature and precipitation trends on loess plateau droughts. Quat. Int. 2015, 372, 175–179. [Google Scholar] [CrossRef]
  28. Su, F.G.; Hong, Y.; Lettenmaier, D.P. Evaluation of TRMM multisatellite precipitation analysis (TMPA) and its utility in hydrologic prediction in the La Plata Basin. J. Hydrometeorol. 2008, 9, 622–640. [Google Scholar] [CrossRef]
  29. Li, Z.; Zheng, F.L.; Liu, W.Z. Spatially downscaling GCMs outputs to project changes in extreme precipitation and temperature events on the Loess Plateau of China during the 21st Century. Glob. Planet. Chang. 2012, 82, 65–73. [Google Scholar] [CrossRef]
  30. Wang, F.; Gao, J.E.; Shao, H.; Zhang, T.; Zhang, Y.X.; Xu, X.Q.; Zhao, C.H.; Wang, H.J. Response of ecosystem service values to land use change based on GIS and ecological compensation in Loess Plateau. Sci. Soil Water Conserv. 2013, 11, 25–31. [Google Scholar] [CrossRef]
  31. Holben, B.N. Characteristics of maximum-value composite images for temporal AVHRR data. Int. J. Remote Sens. 1986, 7, 1435–1445. [Google Scholar] [CrossRef]
  32. Yuan, W.P.; Zhou, G.S. Comparison between Standardized Precipitation Index and Z_index in China. Acta Phytoecol. Sin. 2004, 28, 523–529. (In Chinese) [Google Scholar]
  33. Thom, H. A note on the gamma distribution. Mon. Weather Rev. 1958, 86, 117–122. [Google Scholar] [CrossRef]
  34. Lloyd-Hughes, B.; Saunders, M. A drought climatology for Europe. Int. J. Climatol. 2002, 22, 1571–1592. [Google Scholar] [CrossRef]
  35. Mann, H.B. Nonparametric tests against trend. Econometrica 1945, 3, 245–259. [Google Scholar] [CrossRef]
  36. Kendall, M.G. Rand Correlation Methods; Charles Griffin: London, UK, 1975. [Google Scholar]
  37. Gocic, M.; Trajkovic, S. Analysis of precipitation and drought data in Serbia over the period 1980–2010. J. Hydrol. 2013, 494, 32–42. [Google Scholar] [CrossRef]
  38. Li, J.; Chen, F.; Cook, E.R. Drought reconstruction for north central China from tree rings: The value of the palmer drought severity index. Int. J. Climatol. 2007, 27, 903–909. [Google Scholar] [CrossRef]
  39. Blain, G. The influence of nonlinear trends on the power of the trend–free prewhitening approach. Acta Sci. Agron. 2015, 37, 21–28. [Google Scholar] [CrossRef]
  40. Wang, Y.F.; Chen, Y.; Chen, X.W. Runoff trend detection in the Minjiang River Basin with TFPW-MK method. Sci. Soil Water Conserv. 2013, 11, 96–102. (In Chinese) [Google Scholar]
  41. Liu, X.; Zhou, W.; Bai, Z. Vegetation coverage change and stability in large open-pit coal mine dumps in China during 1990–2015. Ecol. Eng. 2016, 95, 447–451. [Google Scholar] [CrossRef]
  42. Li, D.; Fan, J.; Wang, J. Change characteristics and their causes of fractional vegetation coverage (FVC) in Shaanxi Province. Chin. J. Appl. Ecol. 2010, 21, 2896–2903. (In Chinese) [Google Scholar]
  43. Kimura, R.; Liu, Y.; Takayama, N. Heat and water balances of the bare soil surface and the potential distribution of vegetation in the Loess Plateau, China. J. Arid Environ. 2005, 63, 439–457. [Google Scholar] [CrossRef]
  44. Chen, Y.; Wang, K.; Lin, Y. Balancing green and grain trade. Nat. Geosci. 2015, 8, 739–741. [Google Scholar] [CrossRef]
  45. Yan, G.X.; Liu, Y.; Chen, X. Evaluating satellite-based precipitation products in monitoring drought events in southwest China. Int. J. Remote Sens. 2018, 39, 3186–3214. [Google Scholar] [CrossRef]
  46. Tao, H.; Fischer, T.; Zeng, Y.; Fraedrich, K. Evaluation of TRMM 3B43 Precipitation Data for Drought Monitoring in Jiangsu Province, China. Water 2016, 8, 221. [Google Scholar] [CrossRef]
  47. Yan, L.B. Characteristics of temperature and precipitation on the Loess Plateau from 1961 to 2014. J. Earth Environ. 2015, 6, 276–282. (In Chinese) [Google Scholar]
  48. Gao, X.R.; Sun, M.; Zhao, Q.; Wu, P.T.; Zhao, X.N.; Pan, W.X.; Wang, Y.B. Actual ET modelling based on the Budyko framework and the sustainability of vegetation water use in the loess plateau. Sci. Total Environ. 2016, 579, 1550–1559. [Google Scholar] [CrossRef] [PubMed]
  49. Li, Z.; Zheng, F.; Liu, W. Spatiotemporal characteristics of reference evapotranspiration during 1961–2009 and its projected changes during 2011–2099 on the Loess Plateau of China. Agric. For. Meteorol. 2012, 154–155, 147–155. [Google Scholar] [CrossRef]
  50. Liu, Y.F.; Yuan, Z.H.; Li, W.Z.; Kong, W.; Zhang, L.; Wu, L. Extreme and persistent analysis of drought-flood variation in the Loess Plateau during 1961–2013. Geogr. Res. 2017, 36, 345–360. (In Chinese) [Google Scholar]
Figure 1. The location of the Loess Plateau and the distribution of the meteorological stations.
Remotesensing 10 00838 g001
Figure 2. Comparison between daily and monthly TRMM data and observed values.
Remotesensing 10 00838 g002
Figure 3. The distribution of the meteorological stations.
Remotesensing 10 00838 g003
Figure 4. The changing trend of annual average precipitation in the period of 1998–2014. “*” means that the changing trend has passed the statistical significance test with 90% confidence level.
Remotesensing 10 00838 g004
Figure 5. The spatial distribution of annual precipitation (a) and the changing trend in each grid of Loess Plateau (b).
Remotesensing 10 00838 g005
Figure 6. Comparison of Standardized Precipitation Index (SPI) time series calculated both from rain gauge observations and from Tropical Rainfall Measuring Mission (TRMM) estimation at 3-month scale (a) and 12-month scale (b).
Remotesensing 10 00838 g006
Figure 7. The temporal variation of SPI3 (a) and SPI12 (b) in the Loess Plateau from 1998 to 2014.
Remotesensing 10 00838 g007
Figure 8. The spatial distribution of Z value and the frequency of drought event. When Z > 0, the SPI12 is on an increasing trend. When Z < 0, the SPI12 is on a decreasing trend. The black triangle means that the trend is significant at 95% confidence level.
Remotesensing 10 00838 g008
Figure 9. The changing trend of drought in the four seasons of the Loess Plateau.
Remotesensing 10 00838 g009
Figure 10. The temporal distribution of drought and humid events from 1998 to 2014. The green, red and gray columns respectively represent the percentage of drought-state grids, humid-state grids, and normal-state grids out of 1150 total grids.
Remotesensing 10 00838 g010
Figure 11. The grade of the vegetation recovery potential in the Loess Plateau.
Remotesensing 10 00838 g011
Table 1. Drought severity classification based on SPI value and corresponding event probability [34].
SPI ValueCategoryProbability (%)
SPI 2.00 Extremely wet2.3
1.50 SPI 1.99 Severely wet4.4
1.00 SPI 1.49 Moderately wet9.2
0 SPI 0.99 Mildly wet34.1
0.99 SPI 0 Mild drought34.1
1.49 SPI 1.00 Moderate drought9.2
1.99 SPI 1.5 Severe drought4.4
SPI 2.00 Extreme drought2.3
Table 2. The classification standard for the vegetation recovery potential assessment based on the FDE and vegetation coverage (VGC) values.
CategorySufficient Water Condition (FDE < 20%)Normal Water Condition (20% ≤ FDE < 30%)Water Scarce Condition (FDE ≥ 30%)
High vegetation coverage (VGC ≥ 50%)Medium potential with Level 4Normal potential with Level 3Lowest potential with Level 1
Low vegetation coverage (VGC < 50%)Highest potential with Level 6High potential with Level 5Low potential with Level 2
Table 3. The comparison results of the observed and TRMM values of monthly precipitation from 1998 to 2014 in the 50 meteorological stations.
NameRBiasRBiasNameRBiasRBias
Menyuan0.9014.6740.108Hengshan0.9083.2820.107
Wushaoling0.954−0.434−0.012Lishi0.9732.4200.060
Xining0.951−2.237−0.063Taiyuan0.9694.4490.126
Minhe0.8883.7950.136Haiyuan0.894−1.575−0.052
Jingyuan0.8753.1000.171Tongxin0.76524.9400.120
Yuzhong0.8861.6390.053Guyuan0.9230.9350.026
Linxia0.890−5.629−0.133Huanxian0.9264.0830.114
Linzhao0.912−5.269−0.126Xixian0.9264.3430.104
Huajialing0.934−2.083−0.053Jiexiu0.9533.8780.103
Wulatehouqi0.870−0.152−0.009Linfen0.9334.4970.114
Baotou0.8720.6560.027Xiji0.9053.0830.095
Huhehaote0.9501.0870.033Pingliang0.9601.5480.037
Youyu0.9252.6930.077Xifengzhen0.9514.8760.107
Linhe0.8821.0950.095Changwu0.8604.2460.086
Huinong0.7892.6560.194Luochuan0.911−1.299−0.025
Wutuokeqi0.838−2.377−0.112Yuncheng0.9404.5300.106
Dongsheng0.933−1.673−0.053Yangcheng0.9574.9030.101
Hequ0.9477.6280.237Hezuo0.955−2.873−0.063
Yinchuan0.859−0.561−0.036Minxian0.9391.6850.036
Taole0.7173.7920.254Wugong0.878−1.759−0.035
Wuzai0.9361.9690.049Huashan0.921−4.360−0.070
Xingxian0.9152.9400.073Sanmenxia0.9335.6550.128
Zhongning0.8310.8350.051Lushi0.9725.0000.094
Yanchi0.927−2.537−0.104Mengjin0.9523.0920.061
Wuqi0.8893.8680.099Luanchuan0.933−3.725−0.053

