Article

Remote Sensing Image Compression Based on Direction Lifting-Based Block Transform with Content-Driven Quadtree Coding Adaptively

1
College of Communication and Electronic Engineering, Qiqihar University, Qiqihar 161000, China
2
College of Information and Communication Engineering, Harbin Engineering University, Harbin 150001, China
3
College of Electronic and Communication Engineering, Harbin Institute of Technology, Harbin 150001, China
*
Author to whom correspondence should be addressed.
Submission received: 24 May 2018 / Revised: 17 June 2018 / Accepted: 20 June 2018 / Published: 22 June 2018
(This article belongs to the Section Remote Sensing Image Processing)

Abstract

:
Due to the limitations of storage and transmission in remote sensing scenarios, lossy compression techniques have been commonly considered for remote sensing images. Inspired by the latest development in image coding techniques, we present in this paper a new compression framework, which combines the directional adaptive lifting partitioned block transform (DAL-PBT) with content-driven quadtree codec with optimized truncation (CQOT). First, the DAL-PBT model is designed; it calculates the optimal prediction directions of each image block and performs the weighted directional adaptive interpolation during the process of directional lifting. Secondly, the CQOT method is proposed, which provides different scanning orders among and within blocks based on image content, and encodes those blocks with a quadtree codec with optimized truncation. The two phases are closely related: the former is devoted to image representation for preserving more directional information of remote sensing images, and the latter leverages adaptive scanning on the transformed image blocks to further improve coding efficiency. The proposed method supports various progressive transmission modes. Experimental results show that the proposed method outperforms not only the mainstream compression methods, such as JPEG2000 and CCSDS, but also, in terms of some evaluation indexes, some state-of-the-art compression methods presented recently.

Graphical Abstract

1. Introduction

Along with the rapid development of remote sensing technology, it is becoming easier to acquire high spatial resolution remote sensing images from various satellites and sensors, which is undoubtedly beneficial to the application of remote sensing images [1,2]. On the other hand, massive data has brought a great burden to the storage and transmission of remote sensing images. Therefore, compression technology is indispensable in remote sensing image processing. In general, traditional compression methods can be used for the compression of remote sensing images, such as Embedded Zerotree Wavelet (EZW) [3], Set Partitioning in Hierarchical Tree (SPIHT) [4], Set Partitioned Embedded Block Coder (SPECK) [5], and Joint Photographic Experts Group 2000 (JPEG2000) [6], or some improved versions of them [7,8,9,10]. However, the remote sensing image has its own unique characteristics, which usually include complicated spatial information, clear details, and well-defined geographical objects, and even some small targets [11]. This means that some traditional methods that rarely consider high-frequency information and mainly focus on retaining more low-frequency information are not very applicable. In order to efficiently compress the remote sensing image, its characteristics must be taken into account in the compression process.
In this decade, some compression methods specifically designed for remote sensing images have been proposed. The Consultative Committee for Space Data Systems (CCSDS) published an Image Data Compression (-CCSDS 122.0-B-1) standard [12], which specifically targets space-borne equipment and focuses more on the complexity of the algorithm and less on its flexibility. In [13], it makes some improvement on the CCSDS 122.0-B-1 standards, which supports several ways of interactive decoding. In [14], the CCSDS published the CCSDS 122.0-B-2, which adds some modifications to support the recommended standard for spectral pre-processing transform for multispectral and hyperspectral image compression. In [15] the authors extend the JPEG2000 for the compression of remote sensing images. These compression methods are based on Discrete Wavelet Transform (DWT). In recent years, DWT-based and embedded bit-plane coding techniques have been very popular [16]. However, due to DWT’s property, the energy of images will be spread across subbands if the edges and textures are not horizontal or vertical [16]. For remote sensing images, after DWT, the energy of the high frequency subbands is usually very large for its characteristics related to complicated terrain information. Therefore, a more effective image representation method is desirable for the compression of remote sensing images. In the last few years, several specialized transform methods that aim to improve the treatment of geometric image structures have been proposed, such as curvelets [17], coutourlets [18], directionlets [19], and shearlets [20]. Instead of choosing an a priori basis or frame to represent an image, some adaptive wavelet basis, such as [21,22], have been proposed. In order to employ the direction transform methods for image compression, the authors of [23,24] integrate the direction prediction methods into the wavelet lifting framework, and preserve more directions of images. The authors of [25] present a compressive sensing method exploiting the interscale and intrascale dependencies by directional lifting wavelet transform. The authors of [26] provides an adaptive lifting wavelet transform, which adapts the lifting direction to local image blocks and can preserve more edge information of images. The authors of [27] provide an analysis of the characteristics of airborne LIDAR data and some efficient representation methods for remote sensing images. In [28], a compression technique that considers the properties of predictive coding and discrete wavelet coding is designed. The authors of [29] propose a compression method for remote sensing images based on both saliency detection and directional wavelet for remote sensing images. In recent years, there have also been many studies on multicomponent image compression. In September 2017, CCSDS published a recommended standard (CCSDS 122.1-B-1) [30]. This recommended standard is an extension to CCSDS 122.0-B-2 [14], which defines a data compression algorithm that can be applied to three-dimensional images, such as multispectral and hyperspectral images. The authors of [31] propose a rate control method for the onboard predictive compression. In [32], the authors propose a new compression method based on compressed sensing and universal scalar quantization for the low-complexity compression of multispectral images. In [33], the authors propose a sparse representation-based compression method for hyperspectral images, which tends to represent hyperspectral data with a learned dictionary via sparse coding. In [34], the authors propose a compression method for hyperspectral images, which constructs some superpixels to describe hyperspectral data. Most of these image compression methods focus only on the representation of image directional information, and combine it with existing coding methods. However, image representation and coding are two closely related stages of compression. Considering the two stages jointly will be advantageous for improving the compression performance of remote sensing images.
Embedded coding is one of the most popular coding techniques, which can truncate the bitstream at any position and reconstruct the image [35]. Embedded block coding with optimized truncation (EBCOT) is an effective coding method, which is the fundamental part of the JPEG2000 image compression standard. It divides each transformed subband into many independent code-blocks, encodes these code-blocks, and performs optimal truncation based on the specified bit rate, respectively. However, the EBCOT method only considers the correlation within a subband, and there are a lot of truncated points that need to be stored during the process of running the algorithm [9,36].
Besides EBCOT, tree-based coding methods have been widely used. Some of the embedded coding methods are based on zerotree, such as [3,4,5,37,38,39]. The zerotree-based method exploits the property of self-similarity across scales in wavelet transformed images, which construct some zerotrees by spatial similarity of the wavelet coefficients at different scales. As a result, a great deal of non-significant coefficients can be represented by a root of the zero tree. Recently, some binary, tree-based coding methods were proposed for the compression of remote sensing images. The authors of [40] present a binary tree codec adaptively (BTCA) for on-board image compression. As a novel and robust coding way, the BTCA method has proven to be very effective. In [41], a human vision-based adaptive scanning (HAS) for the compression of remote sensing images was proposed, which combines the human visual model with the BTCA, and can provide a good visual quality for remote sensing images. Additionally, the quadtree-based coding methods are also presented for the compression of remote sensing image coding. The authors of [24] propose a compression method that is based on quadtree coding for Synthetic Aperture Radar (SAR) images and obtains a good coding performance.
In 2017, the state-of-the-art compression method based on quadtree set partitioning, known as quadtree coding with adaptive scanning and optimized truncation (QCAO), was proposed [42]. The main concept of this method is that the entire wavelet image is divided into several blocks and encoded individually. In the process of coding, the significant nodes and their neighbors are encoded before other nodes, and then the optimized truncation is followed to improve the coding efficiency. Although the QCAO is an effective coding method, similar to EBCOT, it mainly utilizes the clustering characteristics within a subband, but seldom considers the relations among subbands.
In this paper, a new compression method for remote sensing images is proposed. In order to improve the compression efficiency, the image representation phase and coding phase are jointly considered. In addition, both the characteristics of subbands and the scanning order among subbands and blocks are utilized in the process of coding. The overall framework of the proposed compression method is shown in Figure 1.
The main contribution of the proposed method consists of two parts:
One part is the directional adaptive lifting partitioned block transform (DAL-PBT), which can provide the optimal prediction direction for each image block and preserve more orientation properties of remote sensing images by directional interpolation. It should be noted that the size of the image block here is consistent with that of the following coding phase.
Another part is the content-driven quadtree codec with optimized truncation (CQOT), which establishes the quadtree for each image block by analyzing the scanning order among blocks and the scanning method of each block based on the image content and the characteristics of subbands, respectively. Then, the coding and optimized truncation is followed for each quadtree in order to provide a good overall coding performance.
The remainder of the paper is organized as follows. In Section 2, the proposed DAL-PBT model is described in detail. In Section 3, we first describe the content-driven adaptive scanning method, before the CQOT method is introduced. Section 4 gives some quality evaluation indicators used in this paper. In Section 5, some numerical experiments are performed and prove the high effectiveness of the proposed compression method. Finally, the conclusions are provided in Section 6.

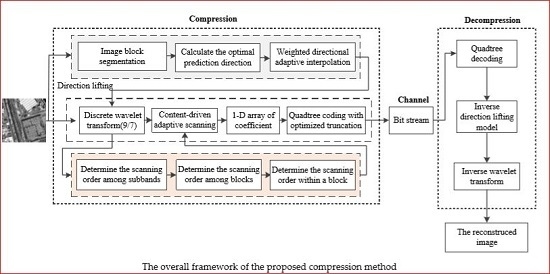
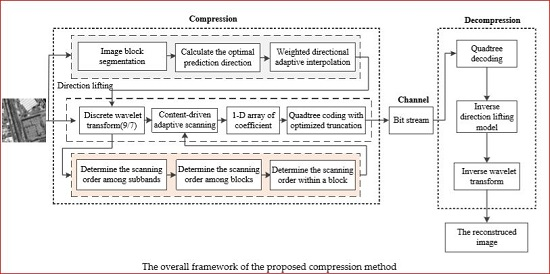
2. The Directional Adaptive Lifting Partitioned Block Transform (DAL-PBT)

The two-dimensional (2-D) DWT is the most important image representation technique of the last decade [43]. Conventionally, the 2-D DWT is carried out as a separable transform by cascading two 1-D transforms in the vertical and horizontal directions, which only use the neighboring elements in the horizontal or vertical direction. However, most remote sensing images contain a lot of directional information, such as edges, contours of terrain, and complex texture of objects, which ensure that the conventional 2-D DWT fails to provide a good representation for them. How to provide an efficient image representation is one of the keys to improving the coding performance of remote sensing images. In this paper, a new DAL-PBT model is proposed. It first divides an image into several blocks and then calculates their optimal lifting directions. Then, a directional interpolation filter is utilized during the lifting process to improve the orientation property of the interpolated remote sensing images. The DAL-PBT model is described in detail as follows.

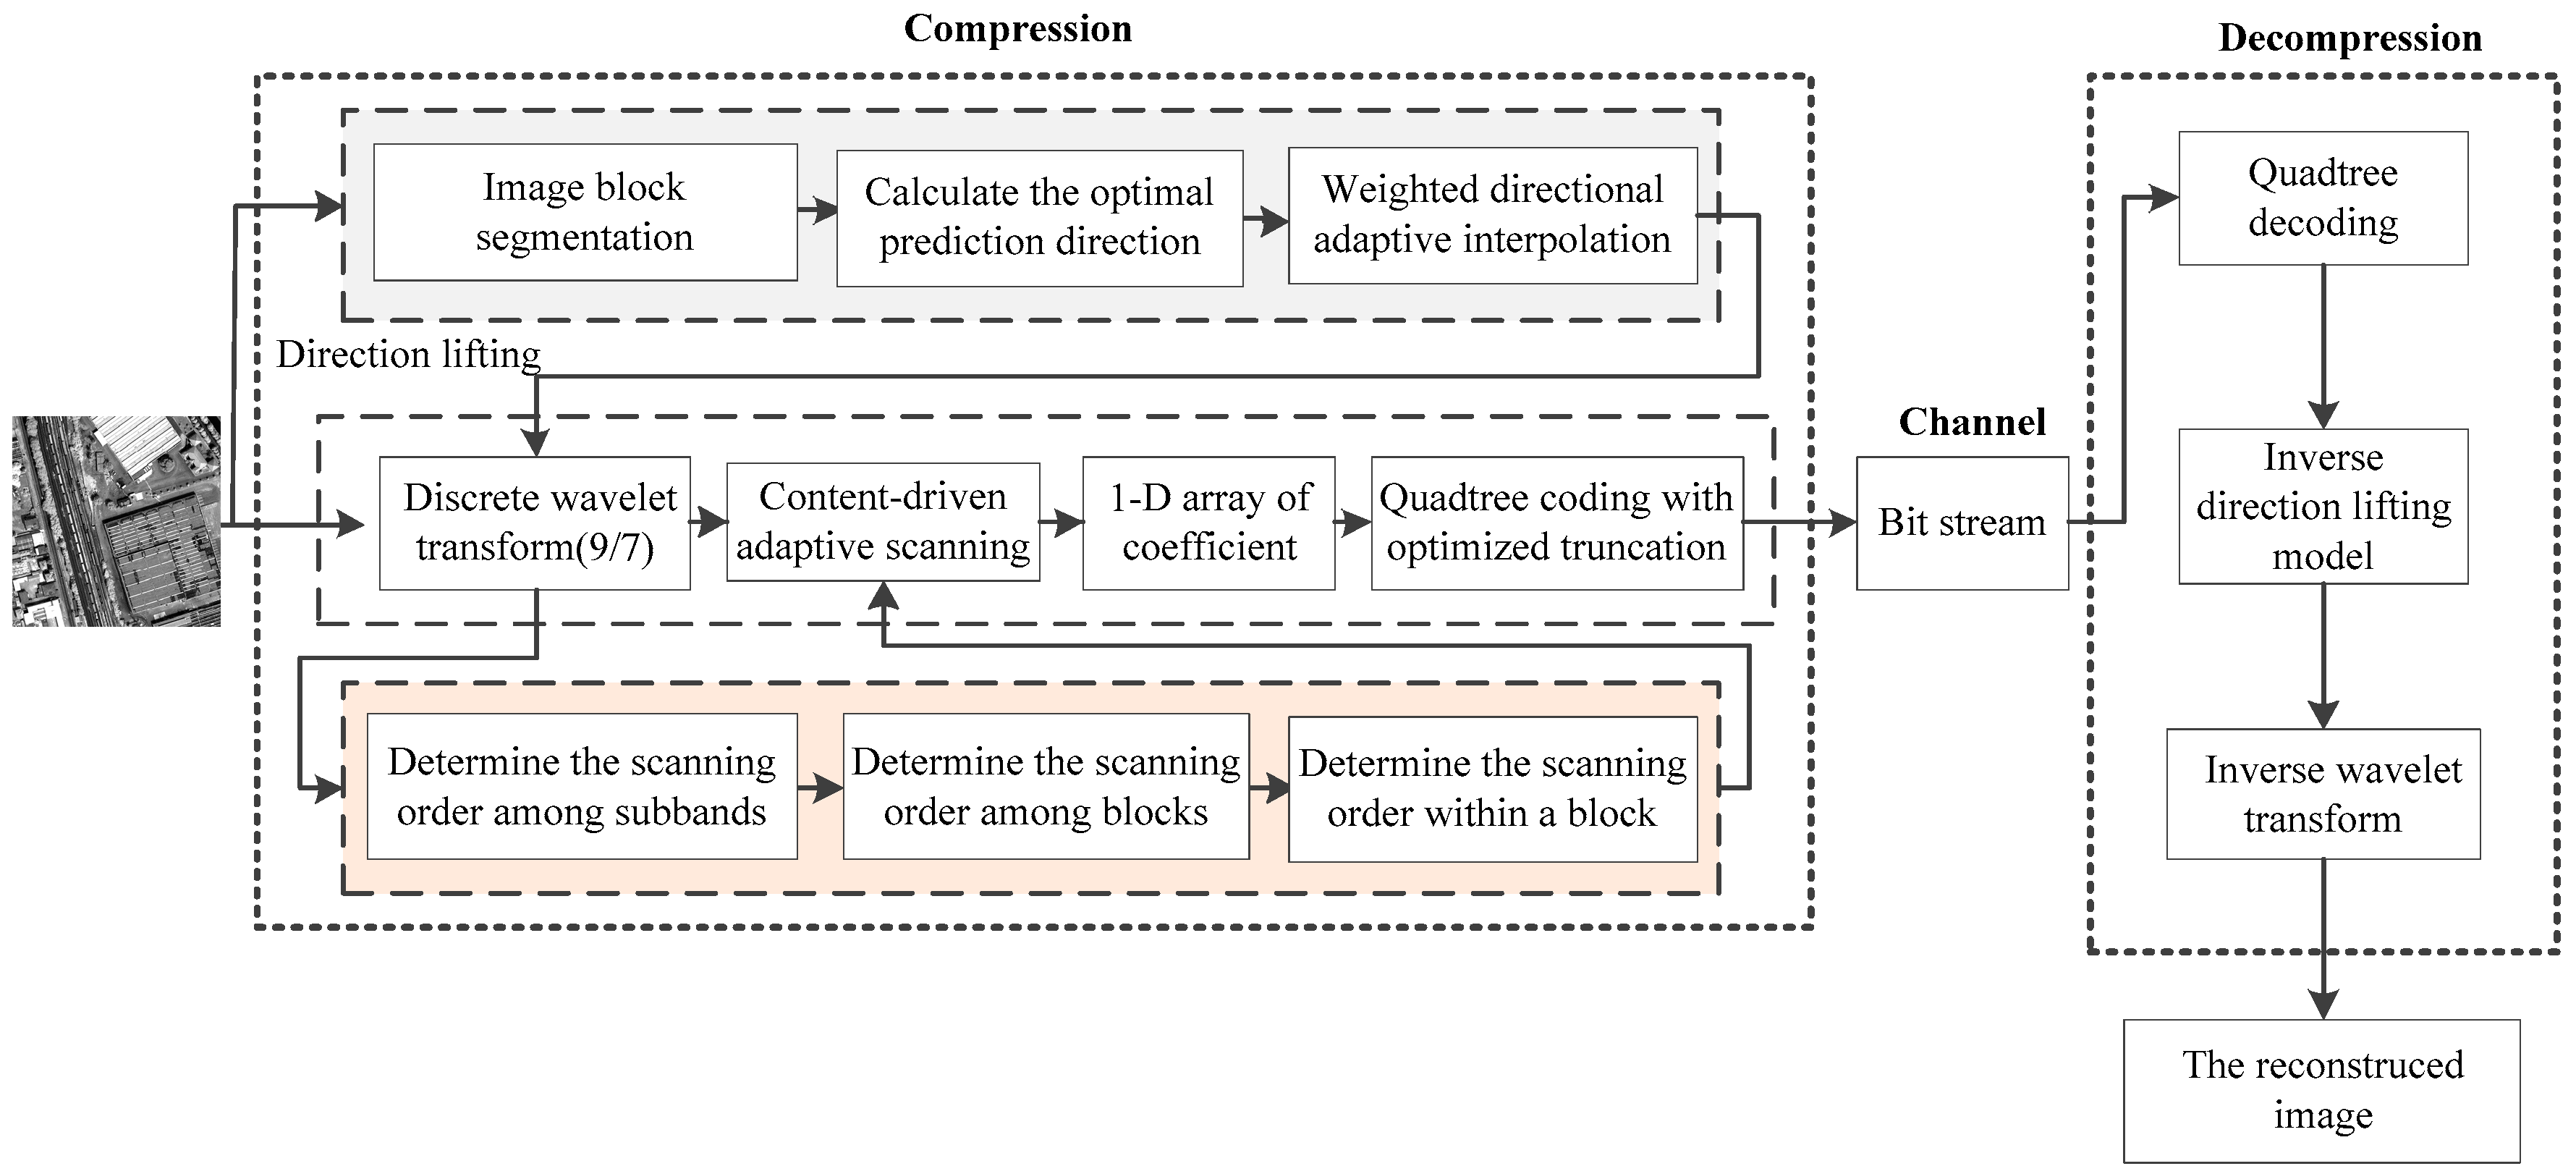
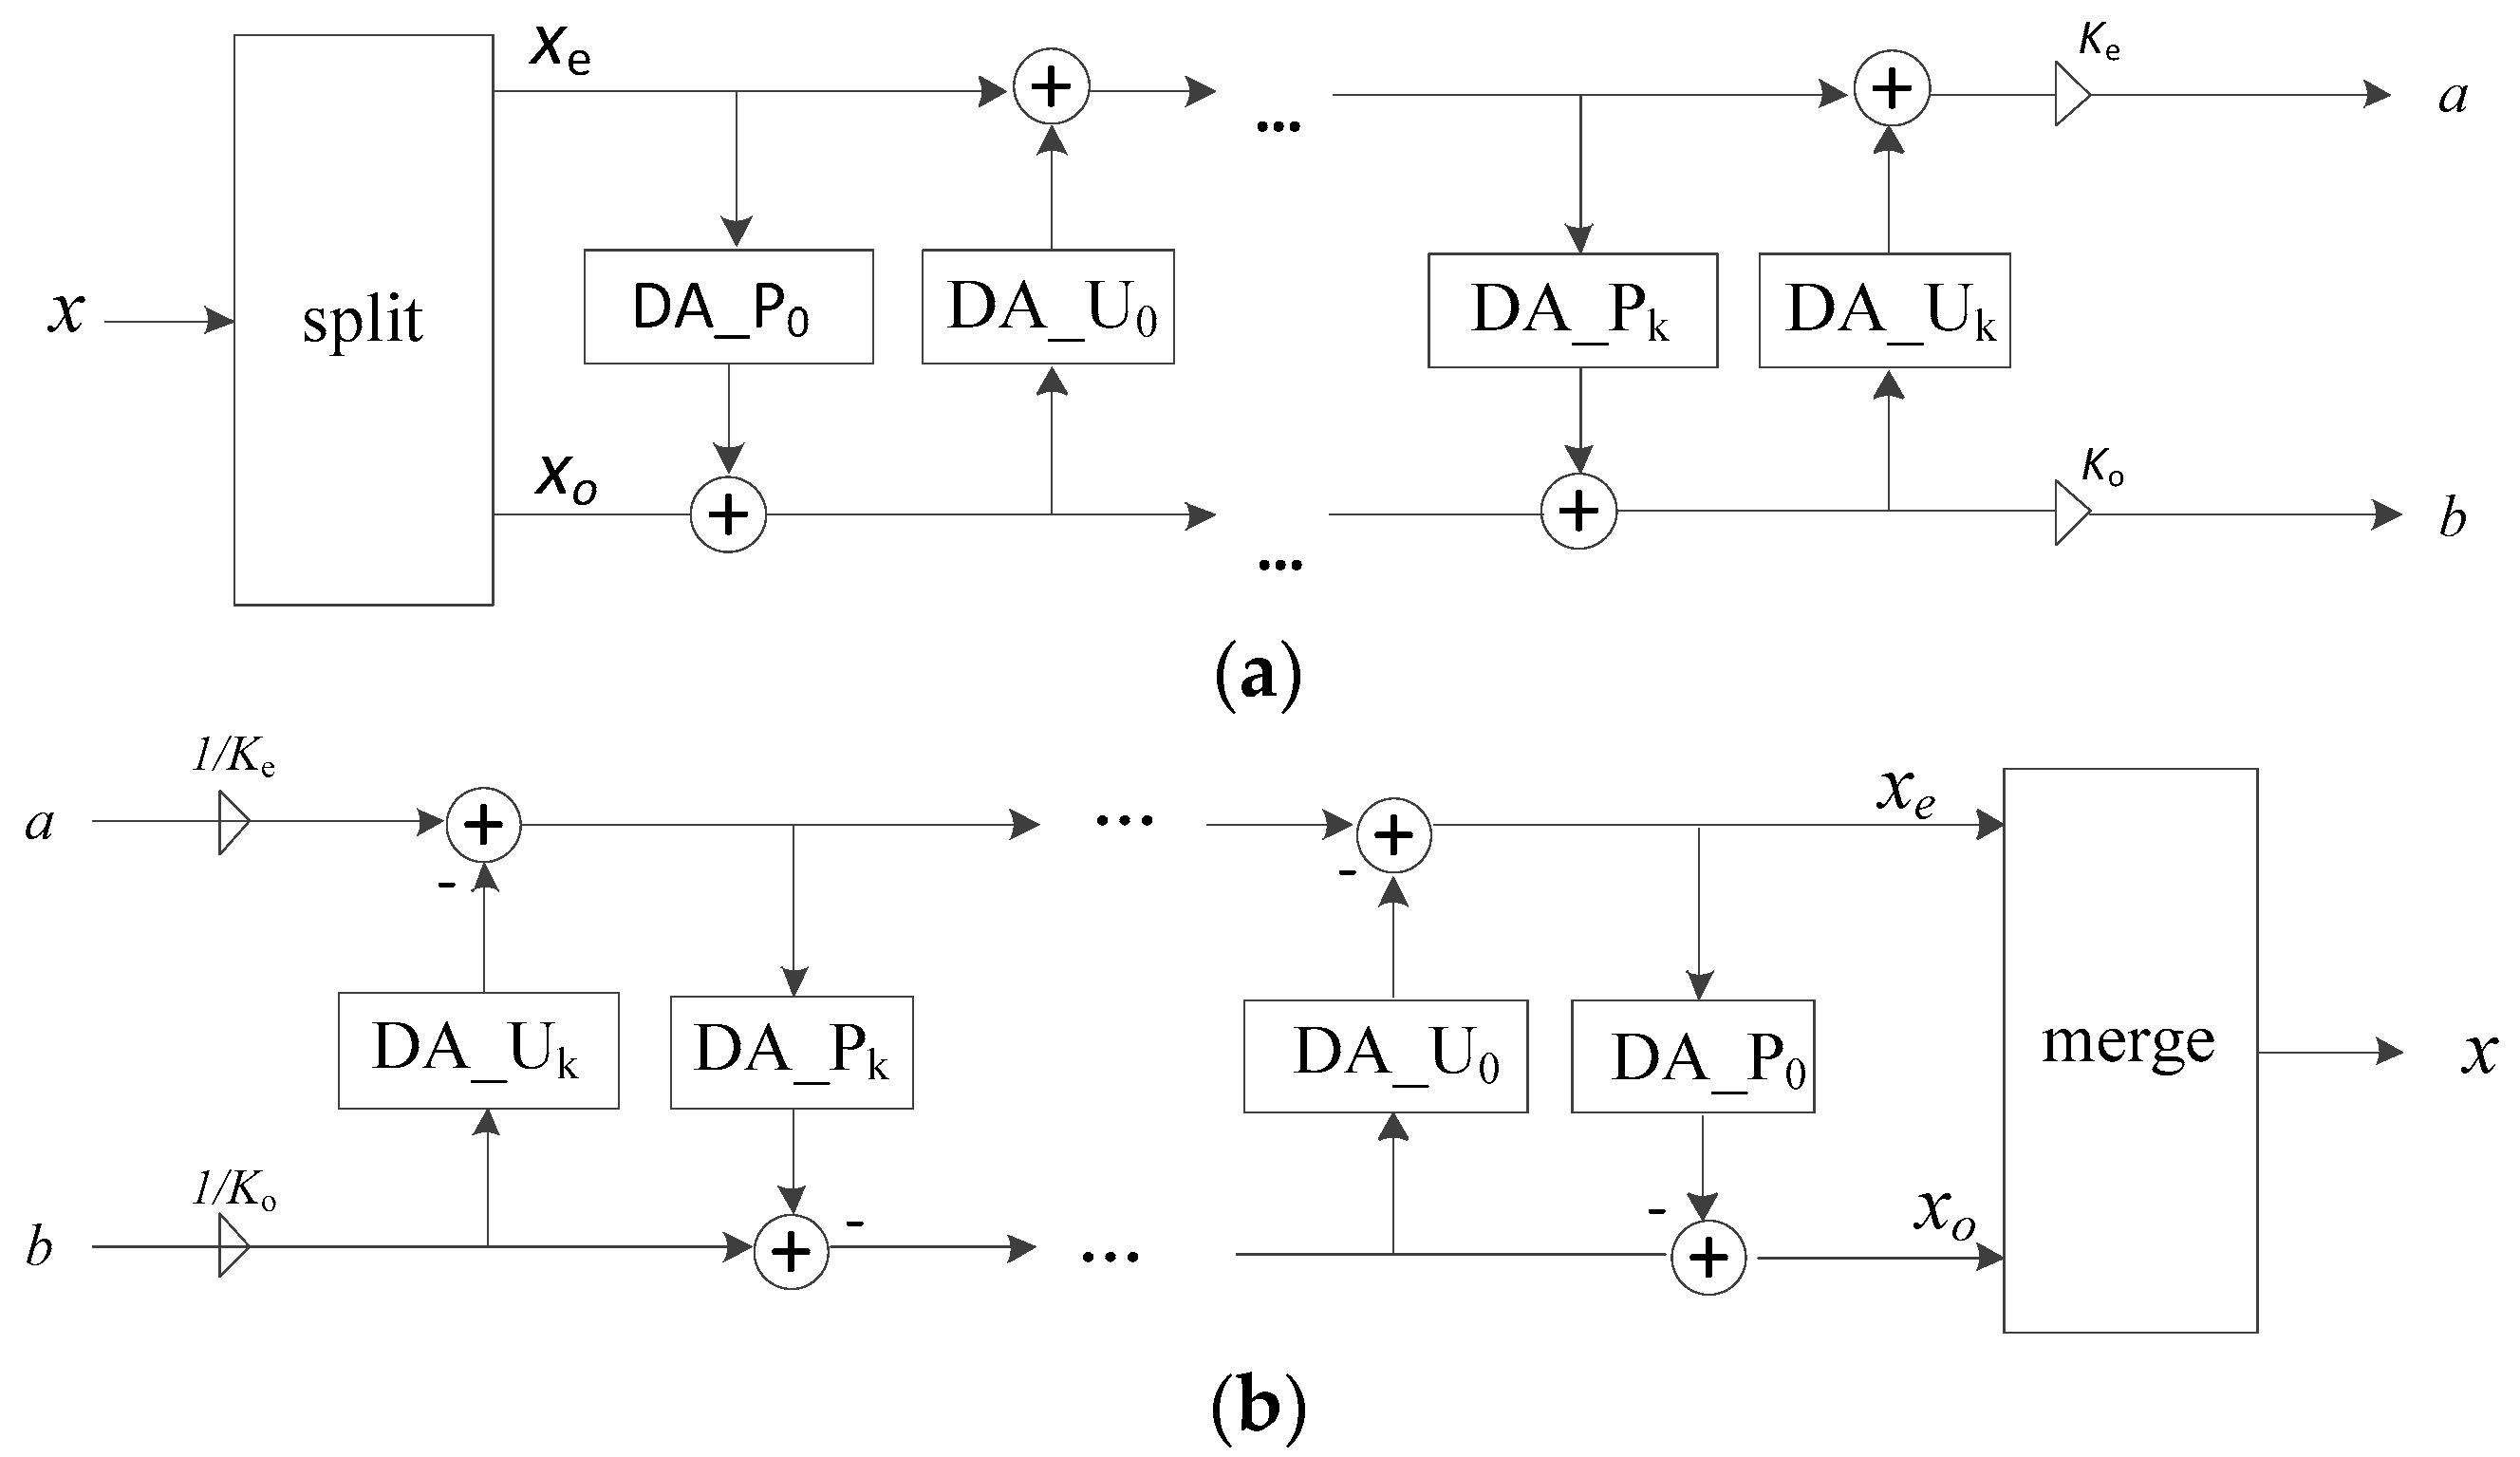
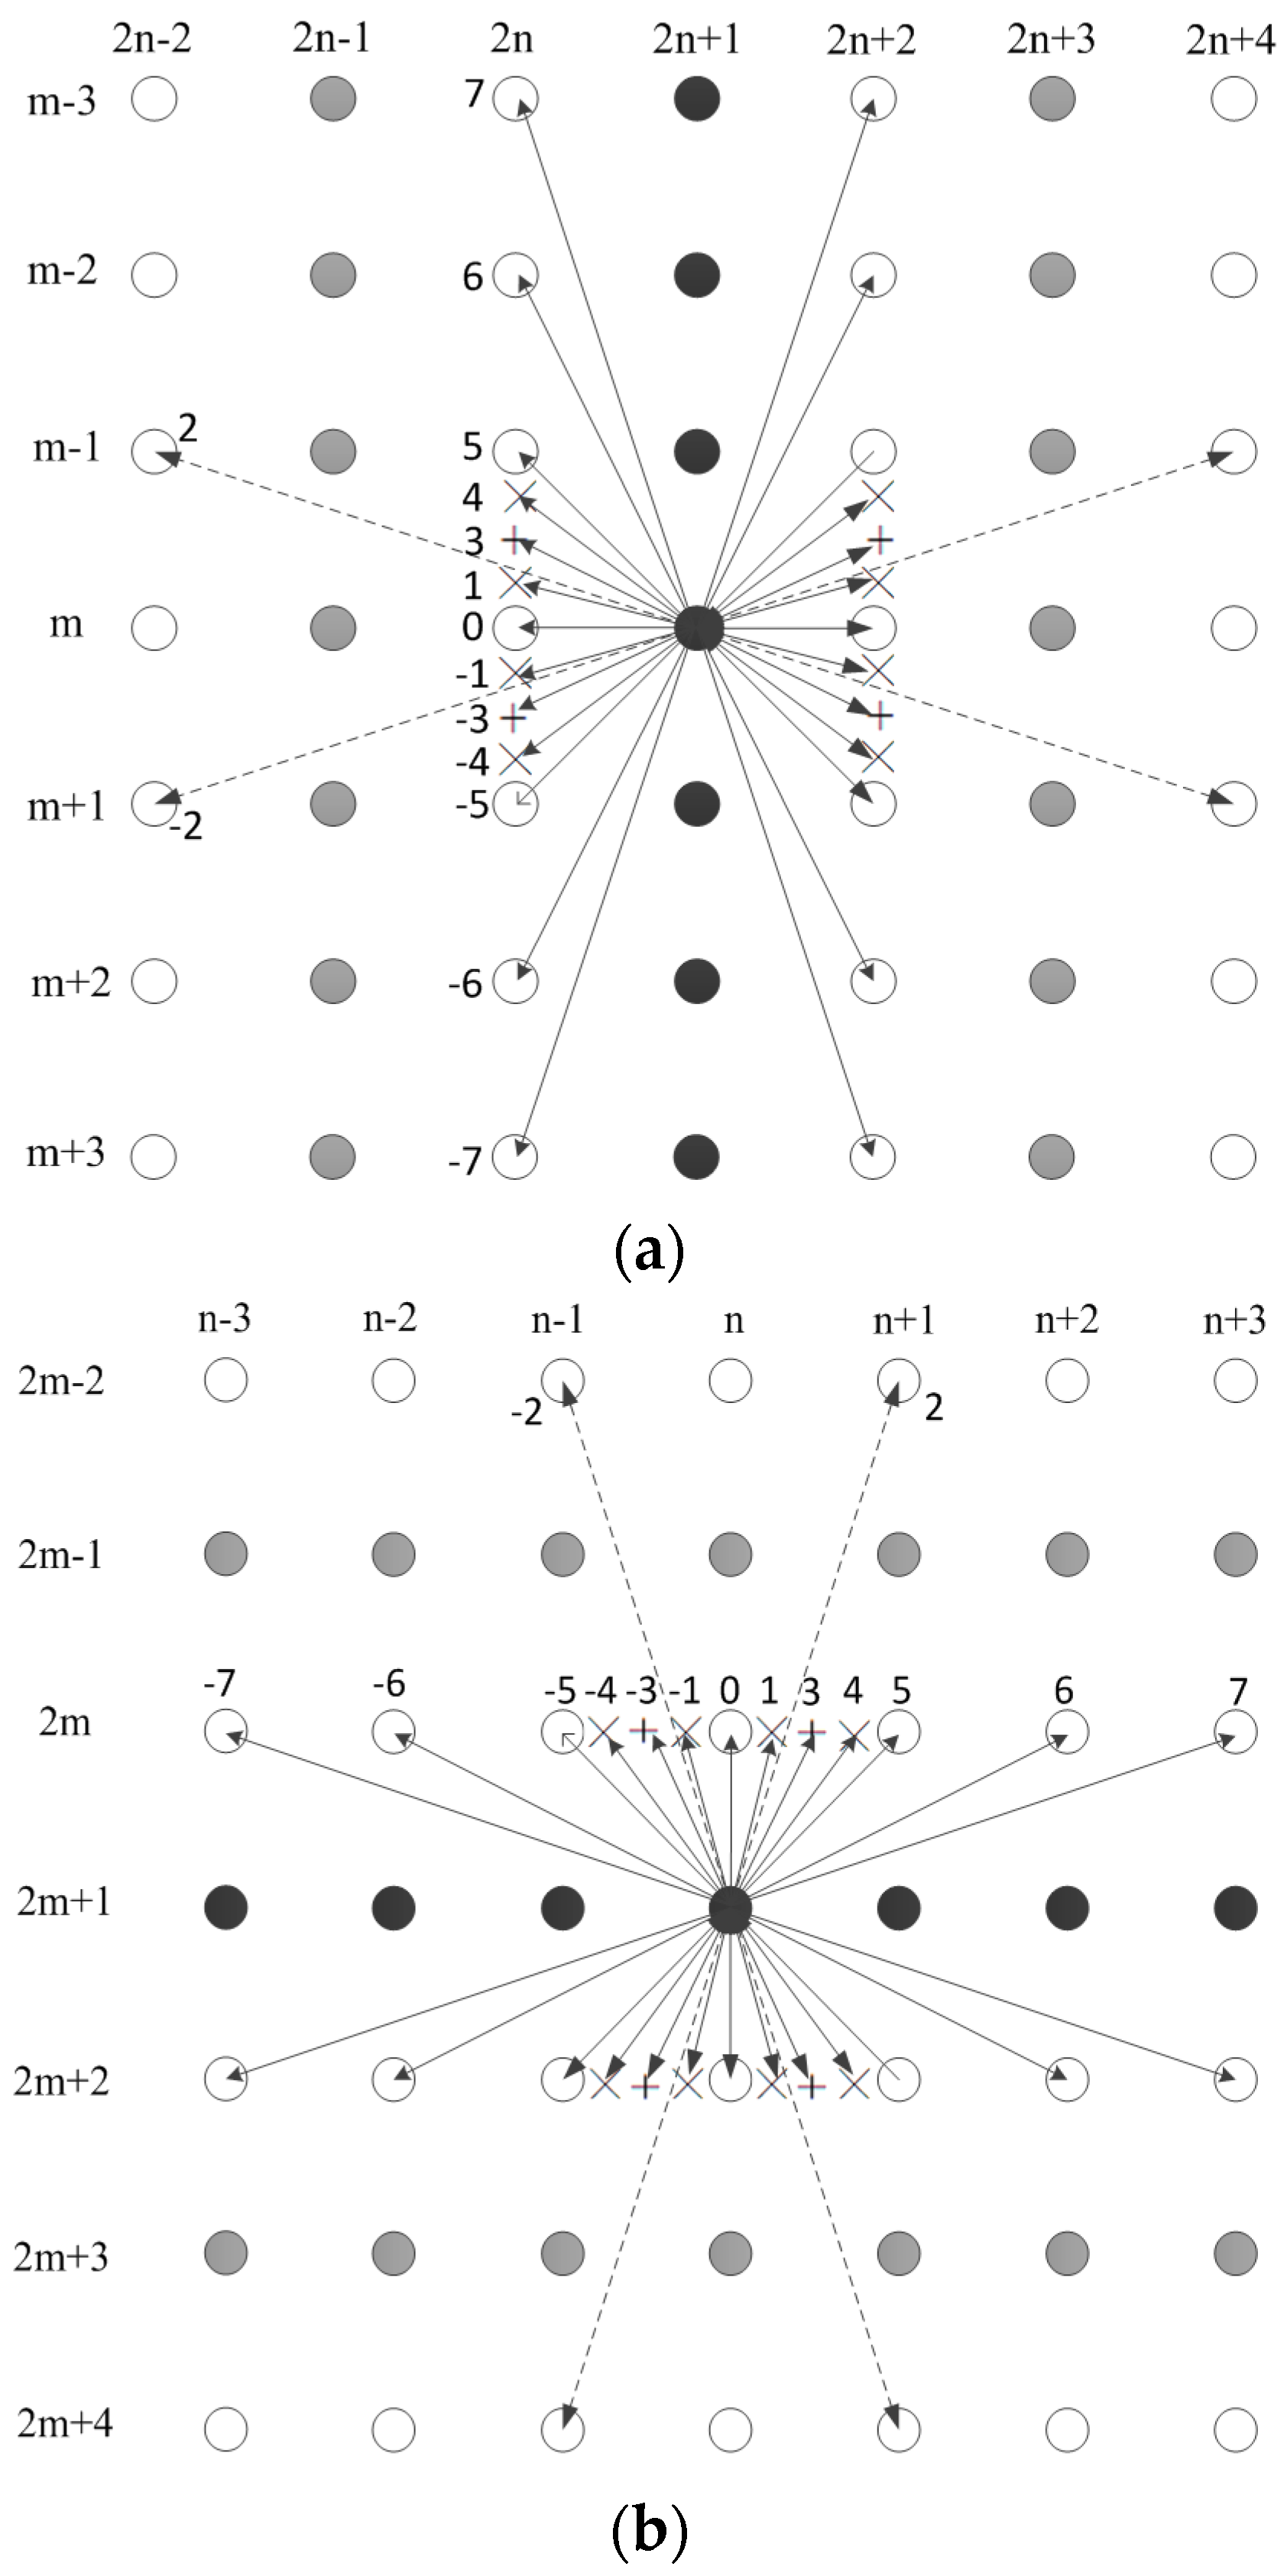
2.1. The Structure of Adaptive Directional Lifting Scheme

Without loss of generality, we present a general formulation of the 2-D DWT implemented with lifting. The authors of [44] point out that the 2-D wavelet transforms can be realized by one pair of the lifting steps, i.e., one prediction step followed by one update step. The typical lifting process consists of four stages: split, prediction, update, and normalize [45]. The 1-D directional lifting wavelet transform and inverse transform are shown in Figure 2a,b.
We consider a 2-D image x ( m , n ) m , n Z . First, all samples of the image are split into two parts: the even sample subset x e and the odd sample subset x o .
{ x e [ m , n ] = x [ 2 m , n ] x o [ m , n ] = x [ 2 m + 1 , n ]
In the predict stage, the odd elements are predicted by the neighboring even elements with a prediction direction obtained via a discriminant criteria. Suppose the direction adaptive prediction operator is D A _ P ; then, the predict process can be represented as
d [ m , n ] = x o [ m , n ] + D A _ P e [ m , n ]
In the update stage, the even elements are updated by the neighboring prediction error with the same direction of the predict stage. Suppose the direction adaptive update operator is D A _ U , the updated process can be described as
c [ m , n ] = x e [ m , n ] + D A _ U d [ m , n ]
Here, the directional prediction operator D A _ P is
D A _ P e [ m , n ] = i p i x e [ m + s i g n ( i 1 ) tan θ v , n + i ]
The directional update operator D A _ U is
D A _ U d [ m , n ] = j u j d [ m + s i g n ( j ) tan θ v , n + j ]
The p i and u j are the coefficients of high pass filter and low pass filter, respectively. θ v represents the direction of prediction and update.
Finally, the outputs of the lifting are weighted by the coefficients K e and K o , which normalize the scaling and wavelet functions, respectively.
For a remote sensing image, if the directional lifting is carried out along the edge or texture direction of the image, then the energy of the high frequency subbands will decrease, which is advantageous for improving the coding performance. In this paper, the integer pixels and the fractional pixels close to the predicted pixel are considered. Obviously, the more reference lifting directions, the better representation of the image block. However, more side information is needed. On the other hand, if there are very few reference lifting directions, the image cannot be well represented. In this paper, 15 reference lifting directions are chosen for one-dimensional horizontal and vertical transformations, which are shown in Figure 3a,b, respectively. Here, the directional filter can be represented along the direction d = ( d x , d y ) T , d 2 . Therefore, the 15 reference directions can be recorded as d 7 = ( 3 , 1 ) T , d 6 = ( 2 , 1 ) T , d 5 = ( 1 , 1 ) T , d 4 = ( 3 / 4 , 1 ) T , d 3 = ( 1 / 2 , 1 ) T , d 2 = ( 1 , 3 ) T , d 1 = ( 1 / 4 , 1 ) T , d 0 = ( 0 , 1 ) T , d 1 = ( 1 / 4 , 1 ) T , d 2 = ( 1 , 3 ) T , d 3 = ( 1 / 2 , 1 ) T , d 4 = ( 3 / 4 , 1 ) T , d 5 = ( 1 , 1 ) T , d 6 = ( 2 , 1 ) T , d 7 = ( 3 , 1 ) T .

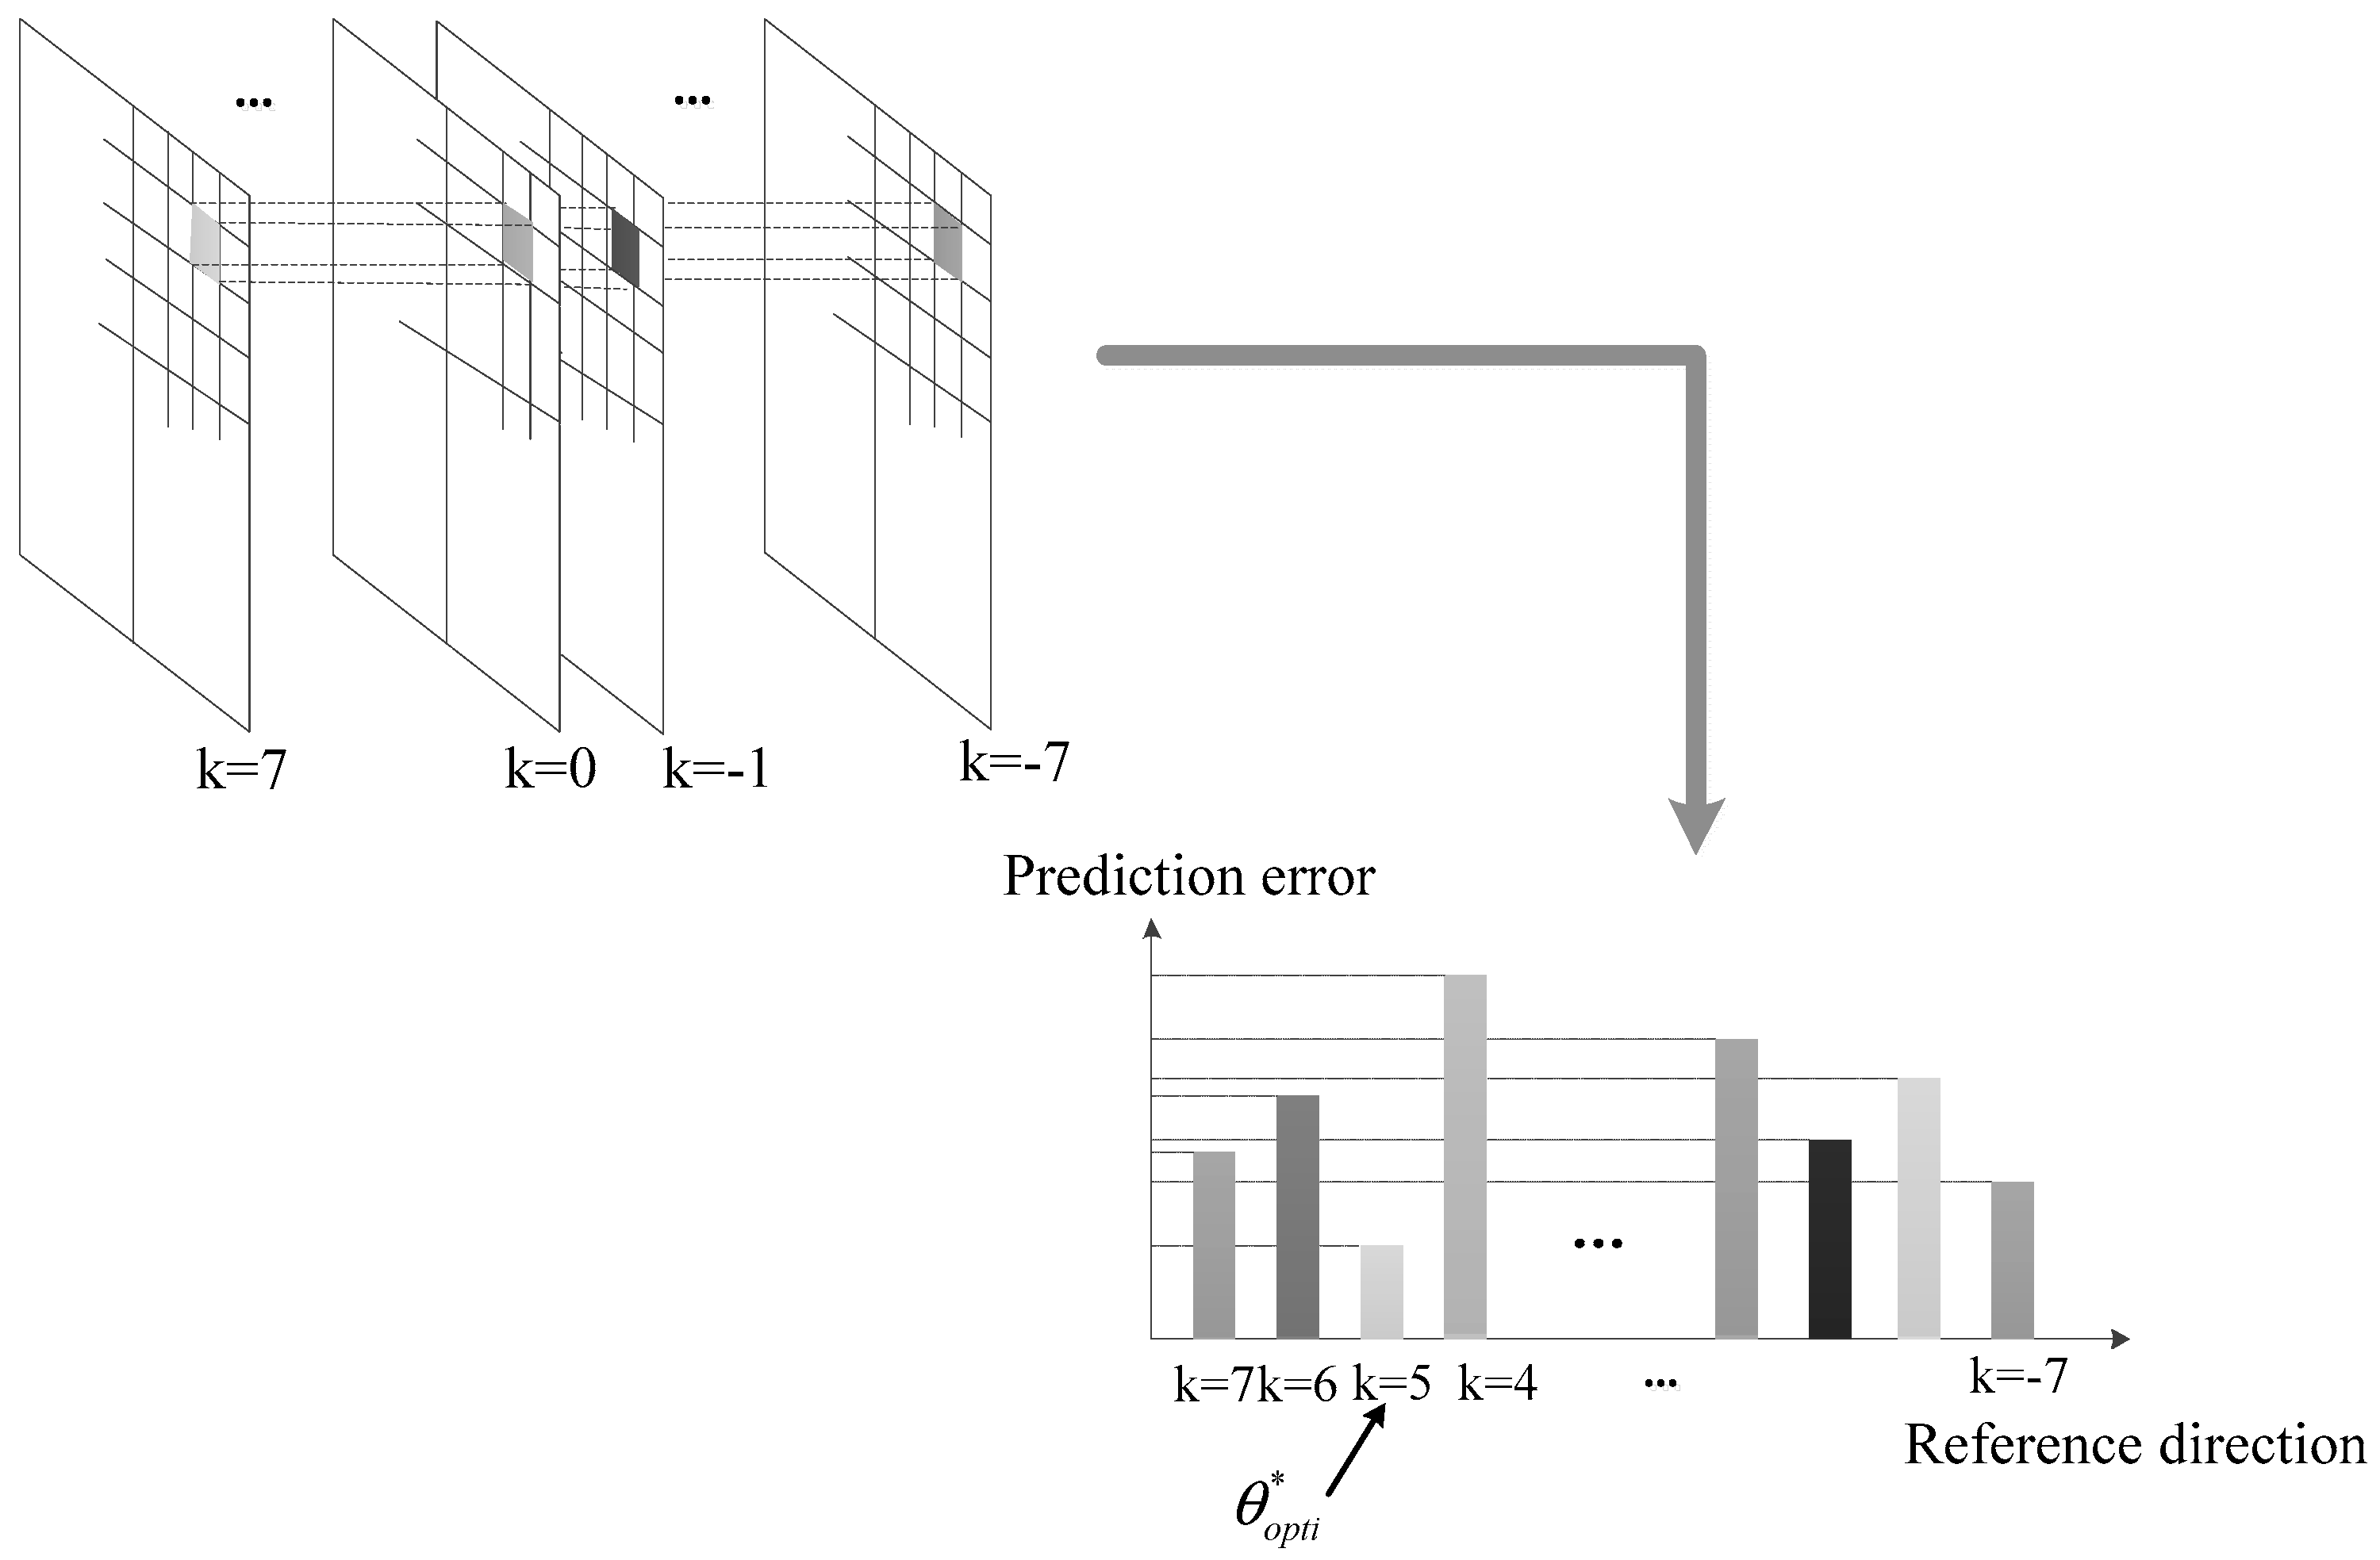
2.2. Image Segmentation and the Calculation of Optimal Prediction Direction

In order to ensure that the direction of the lifting is consistent with the local direction of the image, image segmentation is carried out. In [46], a rate-distortion optimization segmentation method based on quadtree is adopted, which divides a natural image recursively into blocks with different sizes by quad-tree segmentation. However, the efficiency of this segmentation method is closely related to the content of the image. For the remote sensing image, it usually reflects complex landforms rich in details, but rarely large flat areas, so the adaptive segmentation method hardly shows its advantages. The reason for this is that for images with complex content, the adaptive segmentation result most likely shows all of the blocks with the smallest allowed size, which is nearly equivalent to equal size segmentation but with a higher computational cost. In addition, for rate-distortion optimization segmentation method based on quadtree, the “segmentation tree” at each bit rate is different, and all of them should be transmitted to the receiver for correct decoding. The more complex the image is, the more branches of the “segmentation tree” there are, which leads to more side information. Therefore, the rate-distortion optimization segmentation method based on quadtree is not very suitable for remote sensing images.
Based on the above analysis, the block segmentation method with the same size is directly adopted for remote sensing images. In order to provide a better coding performance, the size of the partition block here is the same as that of the following coding phase.
For the directional lifting-based wavelet transform, the prediction error is closely related to the high frequency subbands. For an image block, the optimal prediction direction is the direction with minimal residual information in high frequency subbands.
Suppose the reference direction set is θ r e f , which includes 15 directions, {−7, −6, −5, −4, −3, −2, −1, 0, 1, 2, 3, 4, 5, 6, 7}, and the total number of blocks is N a . For each block B l , l = 0 , 1 , , N a 1 , the optimal prediction direction θ o p t i * can be calculated as follows:
θ o p t i , B l * = arg min i θ r e f m , n B l D { x ( m , n ) D A _ P i ( x ( m , n ) ) }
Here, D ( ) is the function of the image distortion, and x ( m , n ) represents the value at the position ( m , n ) in the block B l . In this paper, let D ( ) = | | . Equation (6) illustrates that the optimal prediction direction of an image block B l is the direction with a minimal prediction error.
The process of calculating the optimal prediction direction of a block is shown in Figure 4. For an original image, the directional wavelet transform is carried out along all the reference directions θ r e f , i ( i = 1 , 2 , , 15 ) , respectively. Following this, for each image block B l of these transformed images, we are looking for the “tile” with a minimum prediction error, and its corresponding prediction direction is the optimal prediction direction θ o p t i * . We repeat this process, until all the optimal prediction directions of all the image blocks are determined. For each block, with the optimal prediction direction θ o p t i * , the predicted process and the updated process of all its elements are carried out via Equations (4) and (5), respectively.
Compared with the adaptive segmentation method, the proposed direction lifting-based wavelet transform does not need to transmit the “segmentation tree” at all bit rates, and it only needs to transmit a small number of prediction directions as side information. Therefore, the side information of the proposed method is low.

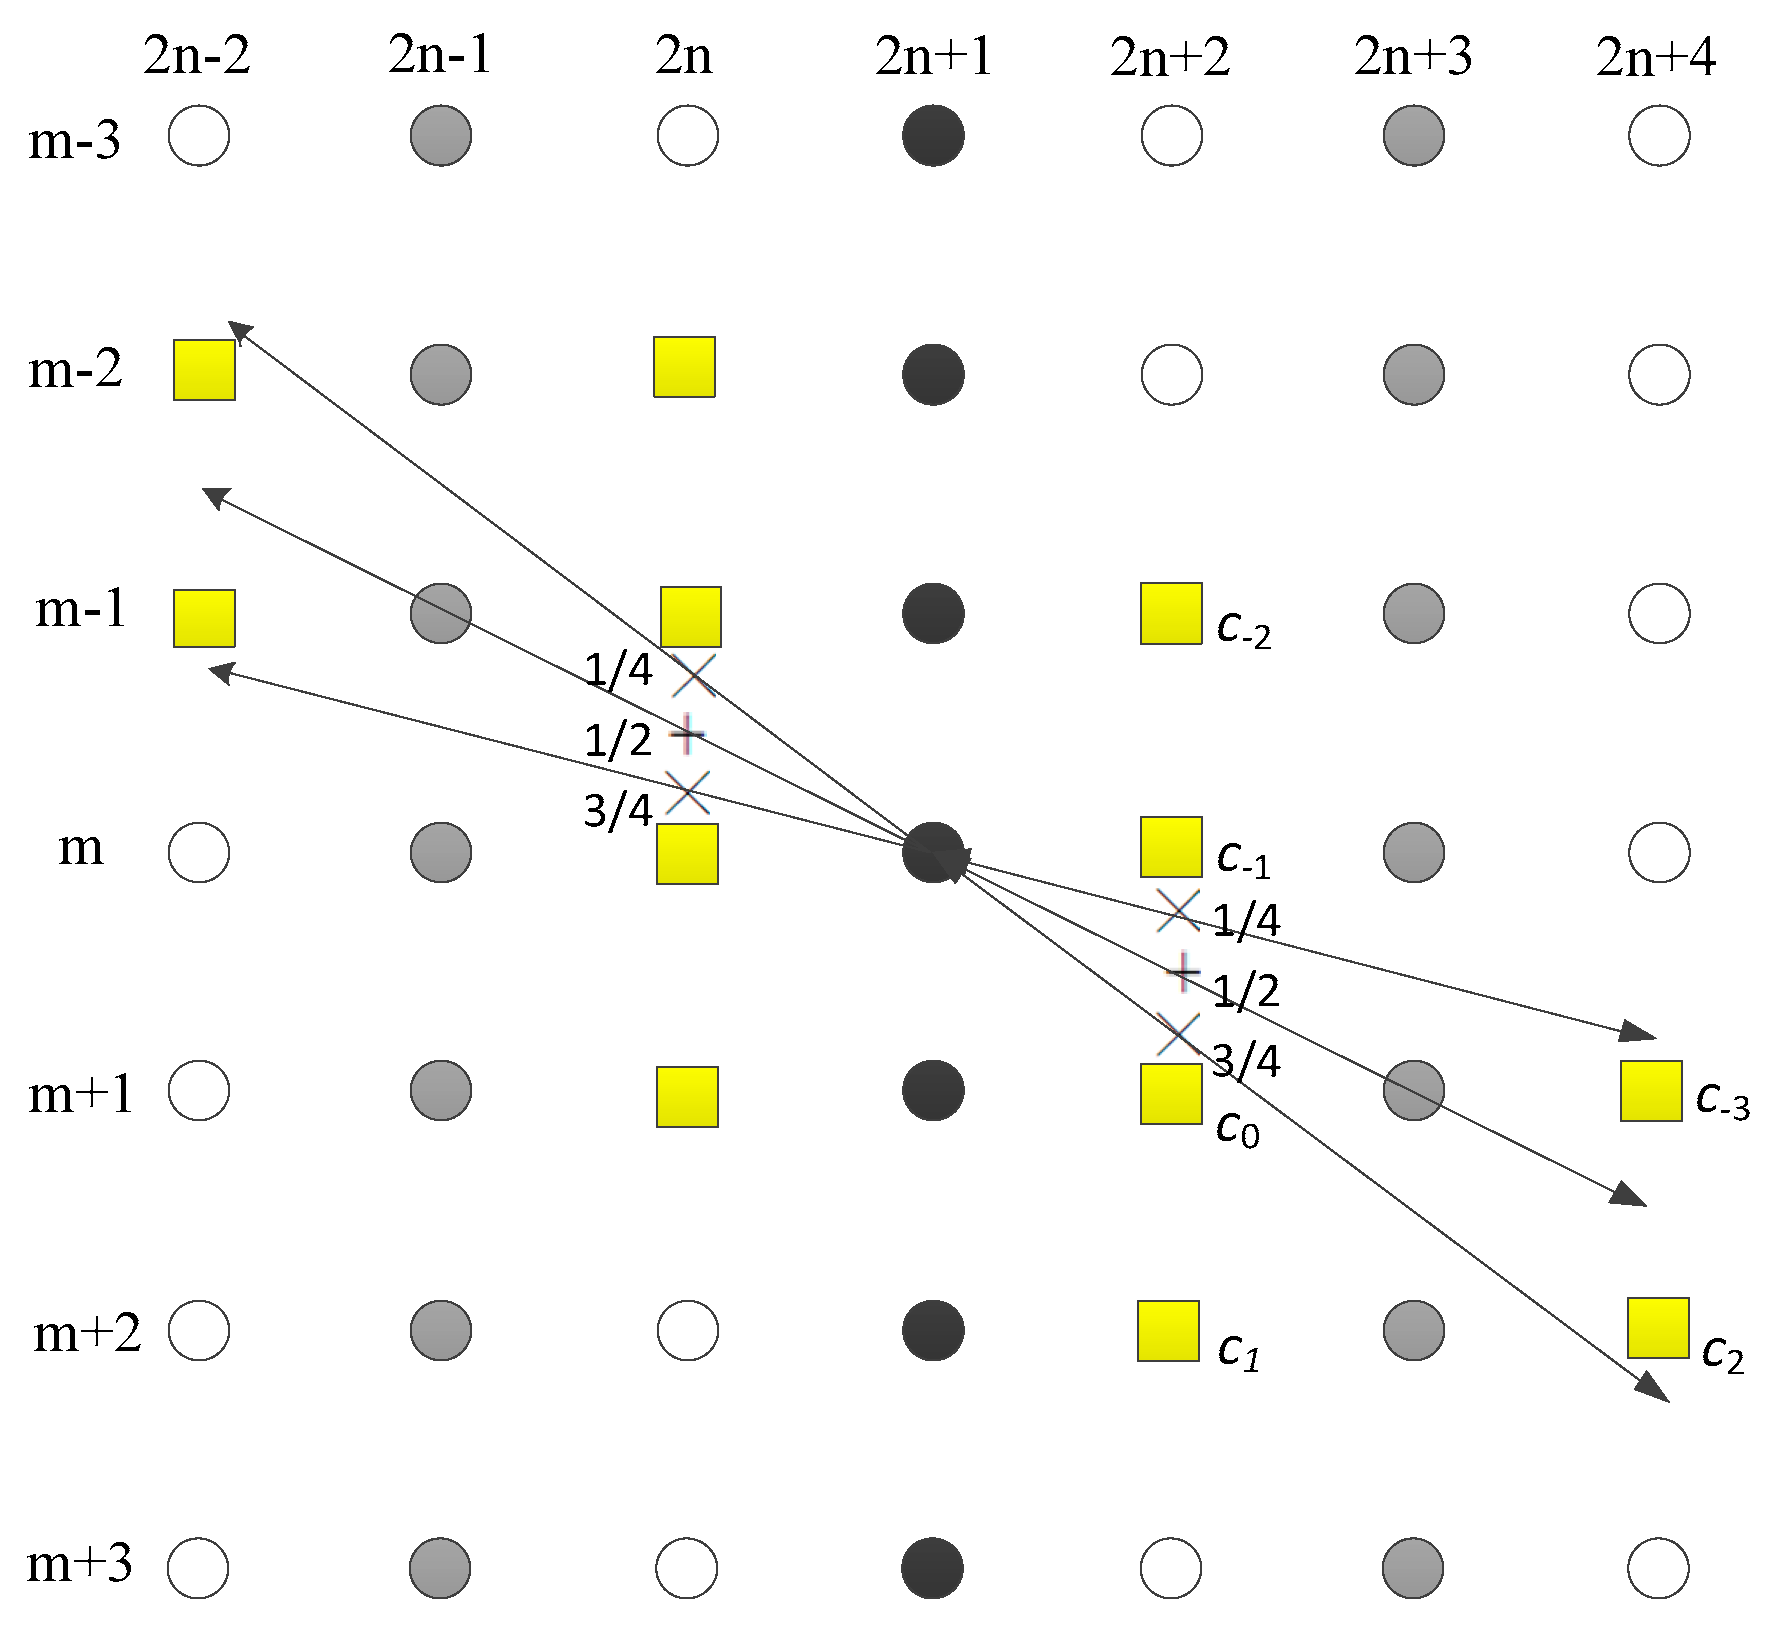
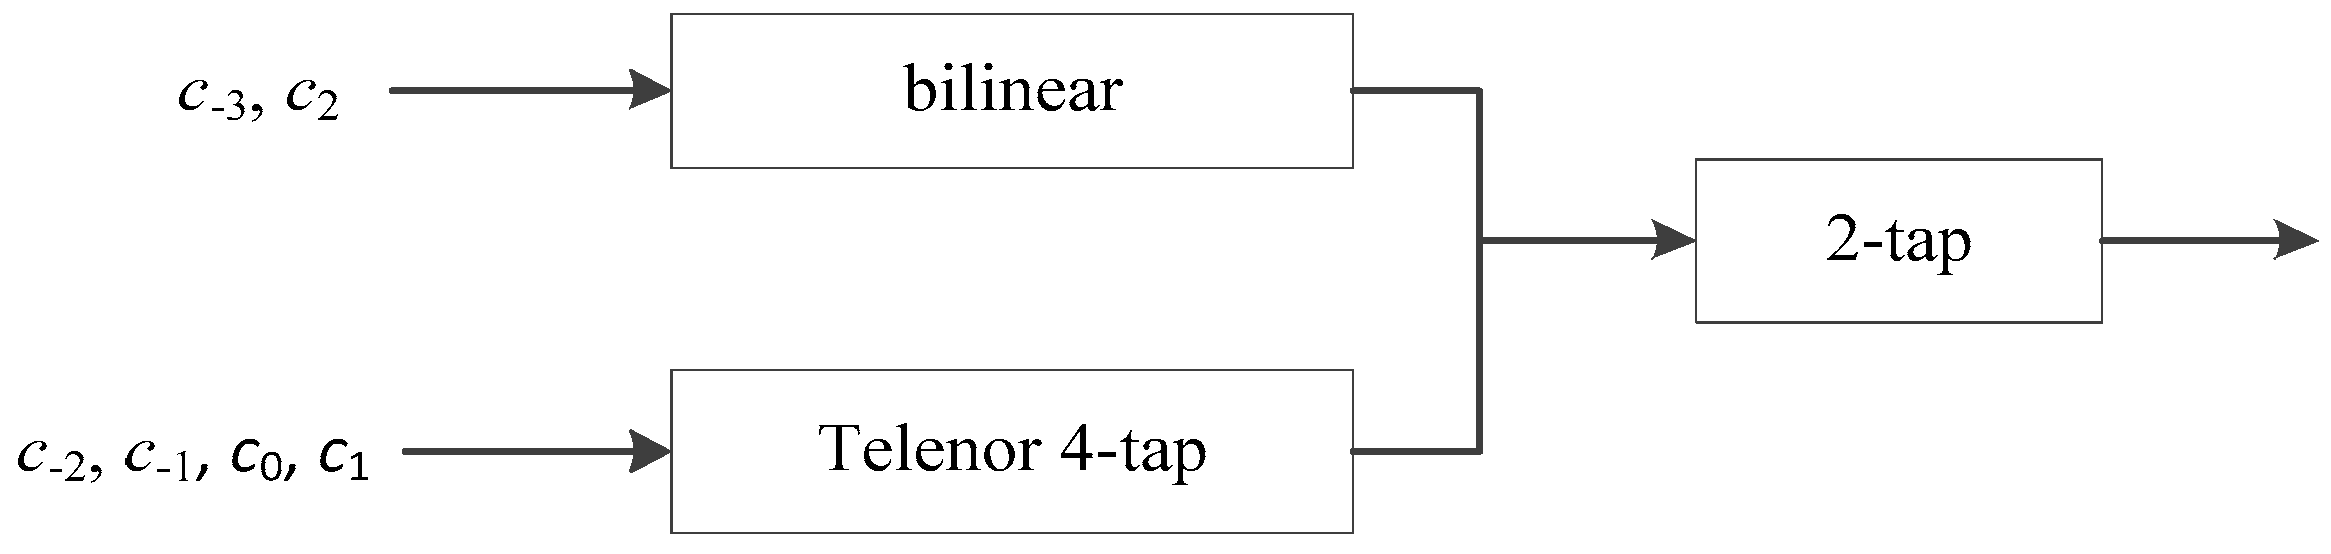
2.3. Directional Adaptive Interpolation

For the directional lifting-based wavelet transform, the lifting direction often needs the values at fractional positions, i.e., the tangent of the lifting direction tan θ is not always an integer. In this situation, it is necessary to interpolate those samples at fractional locations. The Sinc interpolation is a very popular interpolation method. However, it only uses the coefficients in the horizontal or vertical direction, which may blur the direction characteristics of the image. In this paper, a directional interpolation method that interpolates the sub-pixels along the local texture directions by using the adjacent integer pixels is adopted. As an example, for the horizontal transform, the process of direction interpolation is shown in Figure 5.
In Figure 5, for different sub-pixel positions, some different integer pixels are used to interpolate the sub-pixel, and the interpolation direction is adapted to the signal properties for interpolation [47]. For example, in order to interpolate a quarter-position coefficient, not only the integer coefficients { c 2 , c 1 , c 0 , c 1 } are used but also the coefficients { c 3 , c 2 } along the predicted direction. The directional interpolation filter should be constructed by these coefficients { c 3 , c 2 , c 1 , c 0 , c 1 , c 2 } on the integer position and make a prediction to the sub-pixel position. The final coefficients of the directional interpolation filter are determined by three kinds of filters: bilinear filter, Telenor 4-tap filter, and 2-tap filter. The directional interpolation process is shown in Figure 6. The coefficients of these filters are listed in Table 1.
Figure 6 shows that { c 3 , c 2 } are the inputs of the bilinear filter, { c 2 , c 1 , c 0 , c 1 } are the inputs of the Telenor 4-tap filter, and both the outputs of the bilinear filter and the Telenor 4-tap filter are similar to the inputs of the 2-tap filter. As a result, the outputs of the 2-tap filter are the weighted coefficients of the directional interpolation filter.

2.4. Boundary Handing and Semidirection Displacement

The lifting operations of different image blocks are performed with their own optimal prediction directions. However, the boundary effect is a problem. In this paper, for the lifting of block boundaries, the adjacent pixels of other blocks are used, unless the boundary pixels are at the edge of the image. As a result, the error can be restrained to some extent and can avoid the boundary effect.
The processing of the semi-direction is another problem that might need attention. Assuming that a row transform is carried out firstly, the size of the image block is changed, which makes the block direction no longer accurate. To solve this problem, some studies try to reduce the lifting direction of a block by half, before performing another one-dimensional transform with the half angle, such as in [16]. However, the half-angle may not correspond exactly to the optimal prediction direction previously calculated, which may lead to direction deviation. In addition, the deviation will be accumulated with the increment of the wavelet decomposition levels. We adopt the directional interpolation method introduced in Section 2.3 for solving this problem. The rectangular block is interpolated into a square block first, and then, another one-dimensional transform is performed using the previously calculated optimal direction.

3. A Content-Driven Quadtree Coding Method for Remote Sensing Images

Tree-based coding methods have been widely used in recent years. In 2017, a state-of-the-art coding method based on scanning for remote sensing images, known as quadtree coding with adaptive scanning order and optimized truncation (QCAO), was proposed [42]. The main idea of QCAO is that the transformed image is divided into several blocks, which are encoded by quadtree coding method, respectively. Then, the optimized truncation is performed for each codestream of a block in order to improve the coding performance.
Although the QCAO method is somehow related to the content of the image, it only considers the scanning process within a block. However, the contents of different images are often very different, especially for remote sensing images. In order to improve the coding performance, the scanning order among subbands should be different according to the image content. In addition, for a given subband, the scanning order and scanning methods among and within blocks should be determined while taking the characteristics of the subband into account. Therefore, a content-driven quadtree codec with optimized truncation (CQOT) is introduced, which provides an adaptive scanning method based on the image content and the characteristics of subbands, and then encodes more significant coefficients as much as possible at the same bit rate. The proposed CQOT algorithm is described in detail as follows.

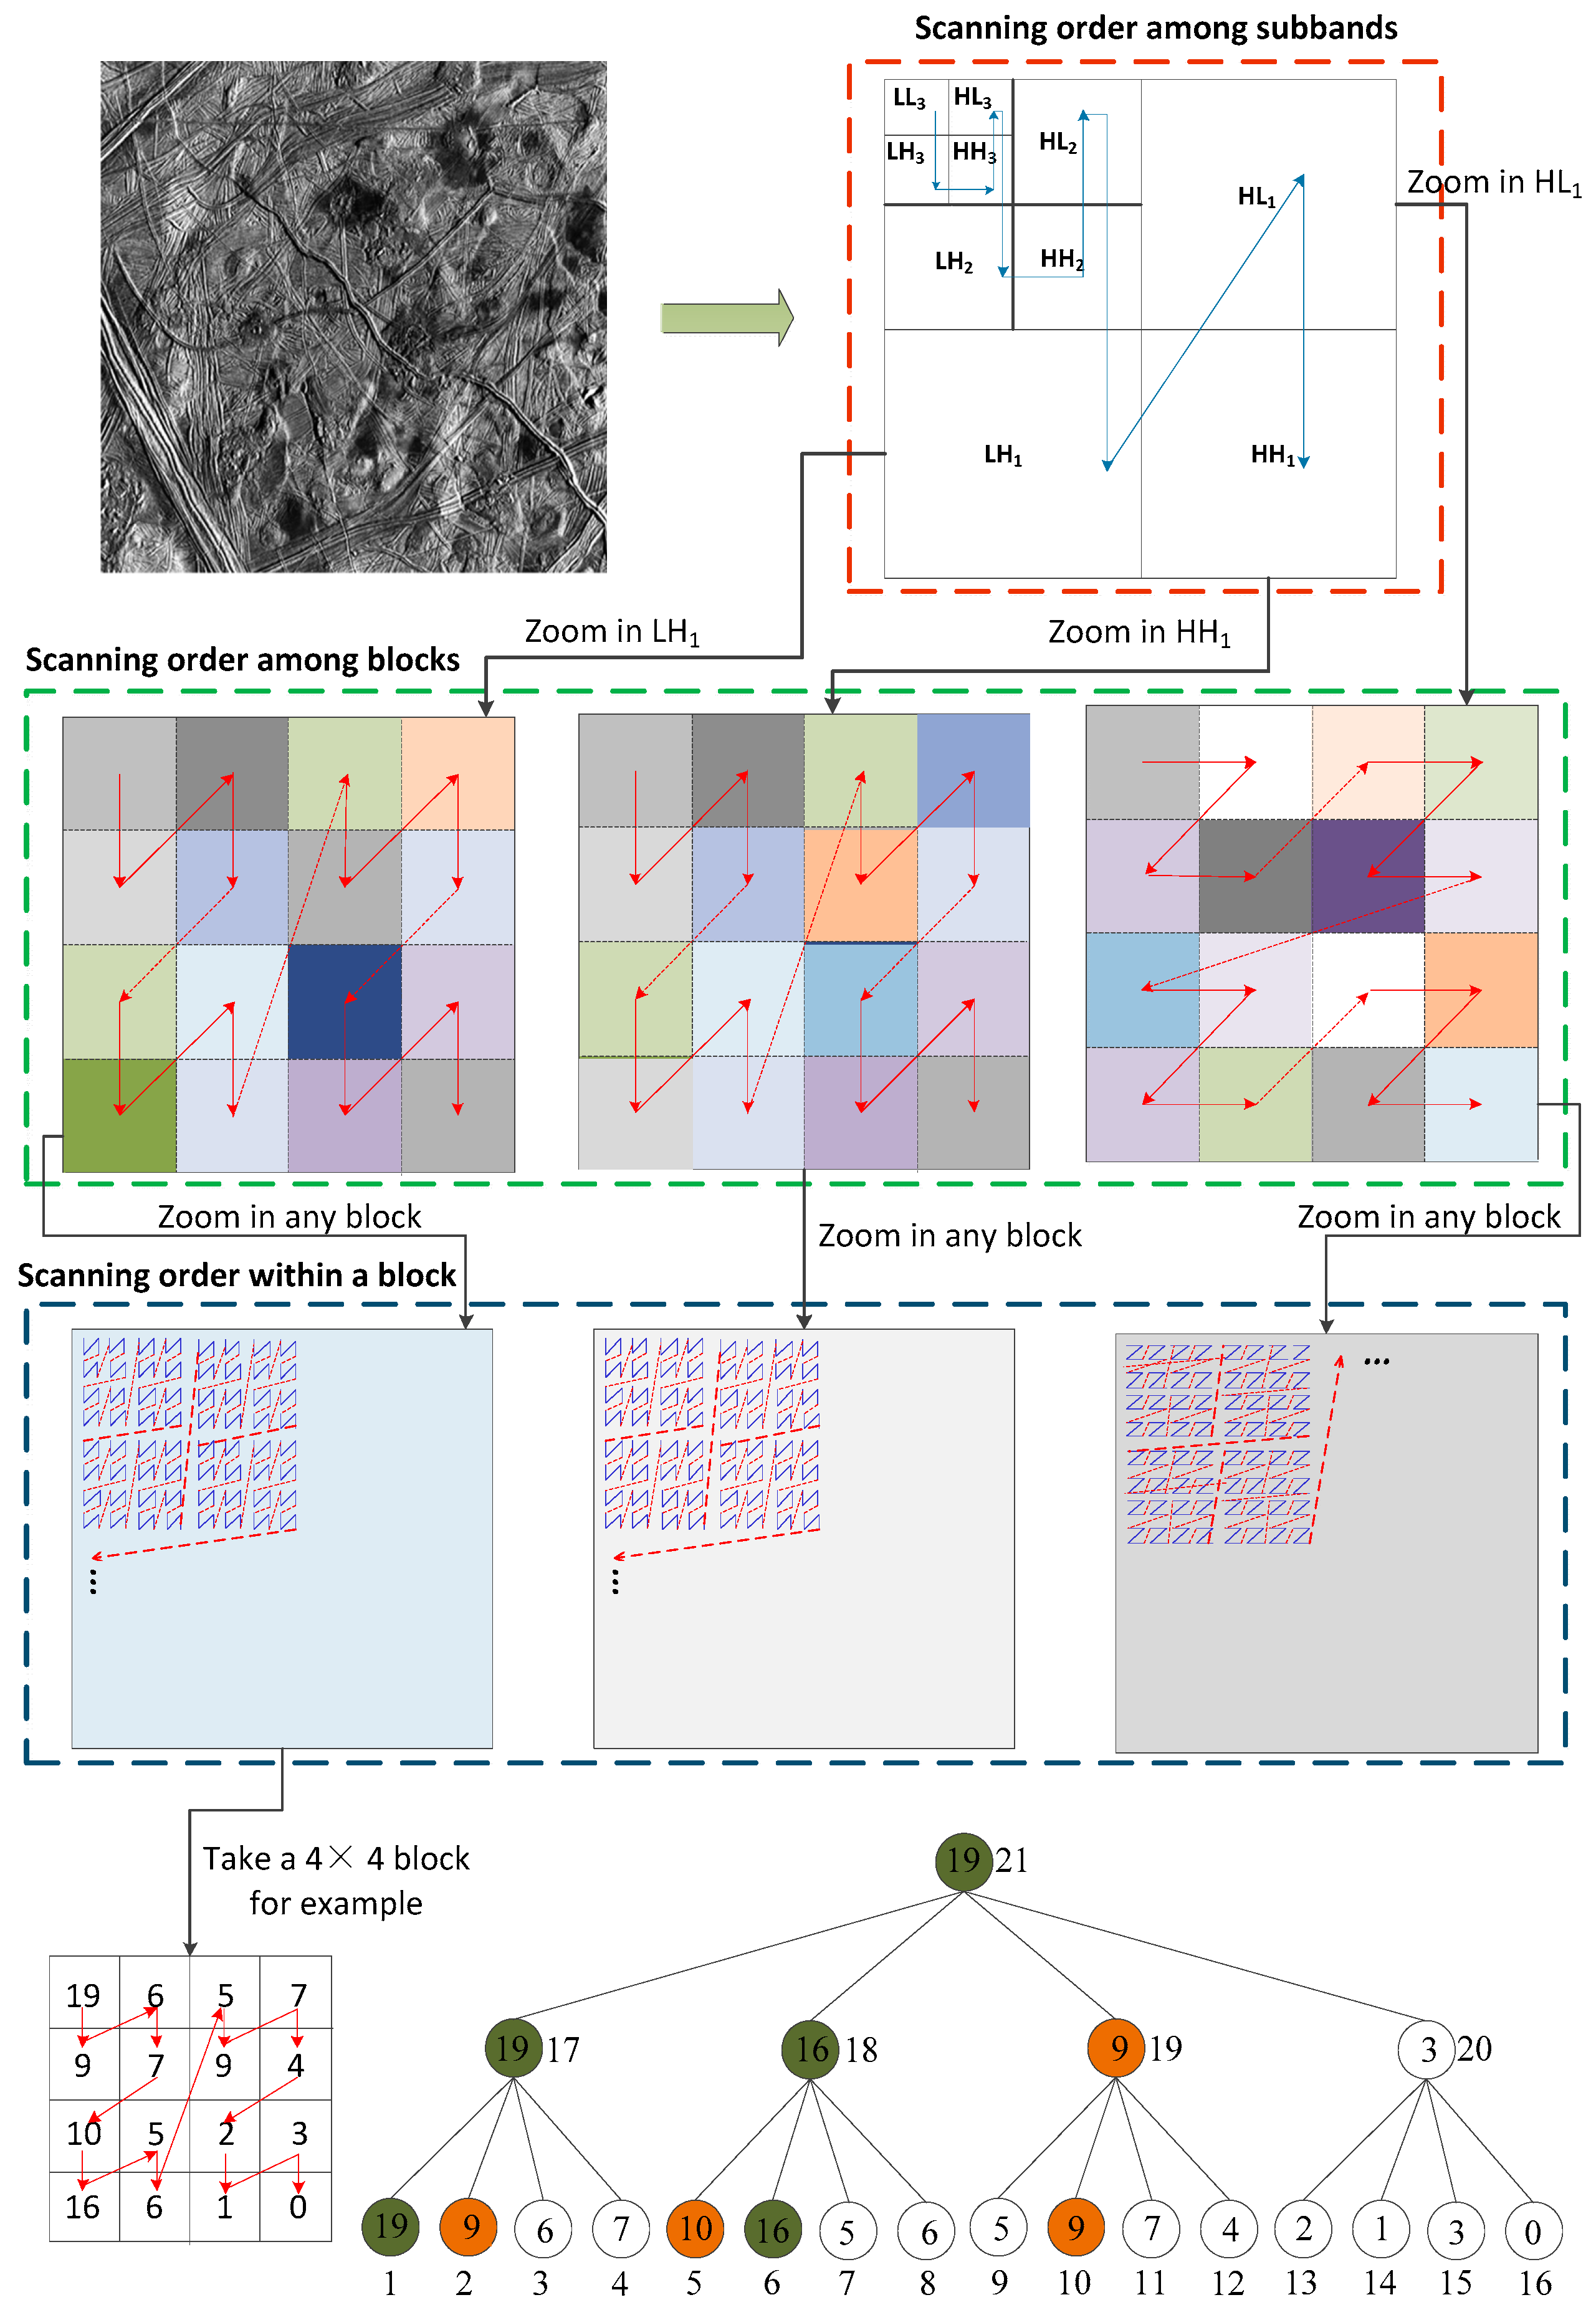
3.1. Content-Driven Subband Scan and Block Scan

For a remote sensing image A with size M × N , after the transform based on the DAL-PBT model, the transformed image can be recorded as B . The scanning process of B can be seen as a bijection f from a closed interval [ 1 , 2 , , M × N ] to the set of ordered pairs { ( i , j ) : 1 i M , 1 j N } , in which the second set represents the locations of the image. After scanning, the 1-D coefficient sequence can be recorded as [ B f ( 1 ) , B f ( 2 ) , , B f ( M N ) ] . Different scanning processes are actually bijective functions f with different definitions. If the function f is defined, then the image compression process becomes a process of compressing a 1-D coefficient sequence B ˜ = [ B f ( 1 ) , B f ( 2 ) , , B f ( M N ) ] .
For the image compression at the same bit rate, different scanning orders can lead to different coding efficiencies, which makes the scanning order very important. Generally, a 2-D transformed image can be converted into a 1-D coefficient sequence using some traditional scanning strategies, such as zigzag scan, morton scan, or raster scan. However, these scanning methods do not take the image content and the characteristics of the wavelet subband into consideration, which will have an impact on the coding performance. Moreover, remote sensing images usually contain some important details, such as terrain contours, complex object textures, or even small targets, which also need to be preserved as much as possible during the encoding process. Therefore, how to design an effective adaptive scanning method is also an important issue for the compression of remote sensing images.
In this paper, an adaptive scanning method is presented. This scanning method can provide different scanning orders among subbands based on the image content, and different scanning orders and scanning methods among and within a block according to the characteristics of subbands. The adaptive scanning process based on the image content and the characteristics of subbands (ASCC) is shown in function ASCC (Algorithm 1).
Algorithm 1. Function S = A S C C ( X , J , b ) .
Input: The transformed image X with the DAL-PBT model, the decomposition level J , and the size of block b .
  • Calculate the energy of each subband, and represent it as E λ , θ .
    l -scale ( m = 1 , 2 , , J ), θ -direction ( d = 1 , 2 , 3 , 4 ). ‘1’ represents the low frequency subband, ‘2’ represents the horizontal direction, ‘3’ represents the diagonal direction, and ‘4’ represents the vertical direction, respectively.
    E l , θ = 1 R C i , j r , c X ( l , θ ) ( i , j ) 2
    r and c are the number of row and column of the current subband X ( l , θ ) , respectively; X ( l , θ ) ( i , j ) represents the value of the current subband at location ( i , j ) .
  • Determine the scanning order among subbands according to the descending order of E l , θ .
  • Determine the scanning order among blocks in a subband based on the characteristics of this subband.
    -
    If these blocks are in the lowest frequency subband or horizontal subband, the “horizontal z-scan” is adopted.
    -
    If these blocks are in the vertical subband, the “vertical z-scan” is performed.
    -
    If these blocks are in the diagonal subband, then the scanning order among blocks depends on the energy of horizontal subband and vertical subband of this level.
    If E l , 2 E l , 4 , the “horizontal z-scan” is adopted.
    If E l , 2 < E l , 4 , the “vertical z-scan” is adopted.
  • Determine the scanning method within a block according to the characteristics of this subband.
    -
    For each block X _ B l o c k ( i )
    -
    If it is in the lowest frequency subband or a horizontal subband, the “horizontal z-scan” is adopted.
    -
    If it is in a vertical subband, the “vertical z-scan” is performed.
    -
    If it is in a diagonal subband, then the scanning method depends on the horizontal subband and vertical subband of this level.
    If E l , 2 E l , 4 , the “horizontal z-scan” is performed to this block.
    If E l , 2 < E l , 4 , the “vertical z-scan” is performed to this subband.
End
Output: The generated 1-D coefficient sequence S by scanning the 2-D transformed image X .
It has been demonstrated that from the ASCC algorithm, the adaptive scanning process is determined by the image content and the characteristics of subbands together. To explain this algorithm clearly, we give an example of the ASCC algorithm. The remote sensing image “Europa3” is chosen as a test image. Suppose the decomposition level is 3, after the wavelet transform with DAL-PBT model, the scanning order among the subbands is determined according to the descending order of energy of these subbands, i.e., LL3, LH3, HH3, HL3, LH2, HH2, HL2, LH1, HL1, HH1. Following this, the scanning order among blocks in each subband is determined based on the characteristics of subbands. Take the subbands LH1, HL1, and HH1, for example: the scanning order among blocks in LH1 is conducted with the “vertical z-scan” method, and that in HL1 follows the “horizontal z-scan” method. Because the energy of LH1 is larger than that of HL1, the scanning order among blocks in HH1 follows the “vertical z-scan” method. Finally, for a given block, its scanning method depends on the characteristics of the subband in which the block is located. The adaptive scanning process of the test image is shown in Figure 7. In Figure 7, take a 4 × 4 block, for example: the scanning result and the corresponding quadtree is provided. The numbers outside the circles represent the establishing order for the quadtree. The numbers in the circles are the coefficient values. Moreover, the green circles and the brown circles refer to the significant coefficients at different scanning thresholds of the quadtree, which will be discussed in detail in Section 3.2.

3.2. Content-Driven Quadtree Codec with Optimized Truncation (CQOT)

The tree-based coding method has been widely used in recent years. Inspired by the most recent development in the quadtree coding technique [42], we propose a CQOT method that combines the quadtree codec with the content-based adaptive scanning method, introduced in the last section. In this framework, for a transformed image with a DAL-PBT model, the ASCC method is adopted first to provide the whole scanning order of the image. Secondly, for each block, a 1-D coefficient sequence is obtained after scanning, and a quadtree is established based on the sequence by comparing the four adjacent coefficients in turn. Then, each quadtree of a block is encoded individually, and the optimized truncation is performed by setting the truncation points during the coding process. The CQOT algorithm is described as Algorithm 2.
Algorithm 2. Function [ c o d e , P ] = C Q O T ( X , J , b , T k ) .
Input: The transformed image X with the DAL-PBT model, and the wavelet decomposition level J ; the size of each block b , T k is the current threshold.
  • For each quadtree Γ of a block, suppose that the total number of coefficients is L 0 , the height of the quadtree is H = l o g ( L 0 ) / log 4 , and the total number of nodes of the quadtree is L = i 0 H 4 i .
  • S = A S C C ( X , J , b ) .
  • Establish the quadtree Γ for each block based on the 1-D coefficient sequence obtained by the scanning order S , respectively.
  • Initialization: c o d e = { } .
  • Encode each quadtree Γ .
d = H ;
e = L ;
b = e 4 d + 1 ;
P = { }
while ( b > 1 )
 {
j = b ;
  while ( j < e )
  {
   if max | Γ ( j : j + 3 ) | 2 T k ,then
   if | Γ ( j ) | < 2 T k , then
    c o d e = c o d e Q C { Γ , j , T k } ;
   end if
   if | Γ ( j + 1 ) | < 2 T k , then
    c o d e = c o d e Q C { Γ , j + 1 , T k } ;
   end if
   if | Γ ( j + 2 ) | < 2 T k , then
    c o d e = c o d e Q C { Γ , j + 2 , T k } ;
   end if
   if | Γ ( j + 3 ) | < 2 T k , then
    c o d e = c o d e Q C { Γ , j + 3 , T k } ;
   end if
   end if
    j = j + 4 ;
  Calculate the series of optimized truncation points { P j k } ;
   P = P { P j k } ;
  }
d = d 1 ;
e = b 1 ;
b = e 4 d + 1 ;
}
Output: The codestream c o d e of the transformed image at the given threshold T k , and the truncation points set p .
}
For a transformed image, the neighbors of the significant coefficients are usually important, because they often reflect some contour or edge information, which is very beneficial for preserving the details of remote sensing images. The CQOT algorithm scans the neighbors of the previous significant coefficients before other regions are scanned. A simple example is shown in Figure 8. In Figure 8, the green nodes are the significant coefficients at the current threshold, and the brown nodes are the previous significant coefficients. During the process of scanning, the neighbors of those brown nodes are encoded in priority, and then the encoding of green nodes follows.
To apply a rate-distortion optimization, the question of how to obtain the valid truncation points is an important issue. Similar to EBCOT, a Post-Compression-Rate-Distortion (PCRD) algorithm is adopted to select the candidate truncation points for each block so that the minimum distortion can be obtained at a given bit rate.
For the j th candidate truncation point of a block, suppose the bit rate is R j and corresponding distortion is D j , then
P j = D j 1 D j R j R j 1
represents the distortion-rate of the block.
If P j + 1 > P j , the j th candidate truncation point is not selected; then, the distortion-rate of the block is updated with
P j + 1 = D j 1 D j + 1 R j + 1 R j 1
Following this, the P j + 1 is compared with P j 1 . If P j + 1 > P j 1 , the ( j 1 ) th truncation point should also not be selected, and we update the distortion-rate of the block with
P j + 1 = D j 2 D j + 1 R j + 1 R j 2
The process is carried out until P j + 1 < P j k , then
P j + 1 = D j k 1 D j + 1 R j + 1 R j k 1
Finally, the strictly decreasing { P j k } is selected as the series of valid truncation points.
The QC algorithm adopted in the CQOT algorithm is described as follows. Algorithm 3 uses a stack to avoid a recursive function.
Algorithm 3. Function c o d e = Q C ( Γ , j , T k ) .
Input: Γ represents a quadtree, and j is the index of a node of the quadtree. T k represents the threshold.
  • c o d e = { }
  • S t a c k S ;    S t a c k I n i t ( S ) ; P u s h ( S , j ) ;
  • while   ( ! E m p t y ( S ) )
 {
  • j = p o p ( S ) ;
  • if | Γ ( j ) | 2 T k and    4 j + 1 < L    then
   P u s h ( S , 4 j + 1 ) ;
   P u s h ( S , 4 j ) ;
   P u s h ( S , 4 j 1 ) ;
   P u s h ( S , 4 j 2 ) ;
  else if j > 1    and j mod 4 = 1    and    | Γ ( j 1 ) | < T k    and    | Γ ( j 2 ) | < T k a n d    | Γ ( j 3 ) | < T k then
   if 4 j + 1 L then
   P u s h ( S , 4 j + 1 ) ;
   P u s h ( S , 4 j ) ;
   P u s h ( S , 4 j 1 ) ;
   P u s h ( S , 4 j 2 ) ;
  else
   c o d e = c o d e s i g n ( Γ ( j ) )
  end if
   else    if    | Γ ( j ) | T k then
   c o d e = c o d e { 1 } ;
   if 4 j + 1 L then
   P u s h ( S , 4 j + 1 ) ;
   P u s h ( S , 4 j ) ;
   P u s h ( S , 4 j 1 ) ;
   P u s h ( S , 4 j 2 ) ;
  else
   c o d e = c o d e s i g n ( Γ ( j ) )
  end if
  else
   c o d e = c o d e { 0 } ;
  end if
  }
Output: The codestream c o d e of the quadtree at the given threshold. T k .

3.3. The Overhead of Bits

For the proposed compression method, the bit overhead, including the optimal prediction directions of those image blocks, the scanning order among the subbands and the scanning method of those diagonal subbands are also encoded and sent to the decoder with the bitstream.
Suppose the size of the image is M × N and the block size is P × Q . Then, the number of blocks is M N / P Q , which means that the number of optimum prediction directions that need to be saved is M N / P Q . Since the number of reference prediction directions is 15, one byte can store two prediction directions (record a direction with 4 bit). That is, M N / 2 P Q bytes are required to store those prediction directions. Moreover, suppose the number of wavelet decomposition levels is J . Then, only 3 J + 1 statuses are needed to represent the scanning order among the subbands. Additionally, J statuses are needed to represent the scanning methods of J diagonal subbands. If the wavelet decomposition is inferior or equal to five levels, the ( 3 J + 1 ) + J status can be stored with no more than 11 bytes (record each status with 4 bit). Usually, the maximum byte overhead of the side information that needs to be sent to the decoder is M N / 2 P Q + 11 .
We take the image in Figure 8 as an example. The size of ‘Europa3’ is 512 × 512. According to [42], the proper size of the image block is 64 × 64. Then, it requires ( 512 × 512 ) / ( 2 × 64 × 64 ) = 32 bytes to store those optimal prediction directions. In addition, we record the scanning order among the subbands according to LLJ, HLi, HHi, and LHi ( i = J , J 1 , , 1 ), and the scanning order of those diagonal subbands according to HHi ( i = J , J 1 , , 1 ). Based on the algorithm ASCC, the scanning order among the subbands is 1, 4, 2, 3, 7, 5, 6, 9, 8, and 10, and the scanning methods of the diagonal subbands are 11, 11, and 11. (The 11 represents the “vertical z-scan” method, and 12 represents the “horizontal z-scan” method). Therefore, they can be stored with 7 bytes. The bit rate of side information is ( 32 + 7 ) × 8 / 512 × 512 = 0.00119 bpp. It is worth mentioning that, if the size of the image is larger or the bit depth of the image is greater than 8 bit, the proportion of overhead bits is smaller. Moreover, if entropy encoding is used for these overhead bits, the overhead cost would be further reduced. Based on the analysis above, the overhead bits of the proposed compression method are extremely small, which makes it have almost no impact on the coding performance.

4. Quality Evaluation Index

In order to evaluate the performance of the proposed compression method comprehensively, in this paper, PSNR (peak signal-to-noise ratio, dB), MS-SSIM (multi-scale structural similarity method), and VIF (visual information fidelity) are chosen as the evaluation indexes, respectively.

4.1. PSNR

Suppose X is the original image, its size is M × N and its possible maximum value is L . Suppose Y is the reconstructed image, then the PSNR can be represented as
P S N R = 10 log 10 L 2 M S E
M S E = i = 1 M j = 1 N ( x i j y i j ) 2 M × N

4.2. MS-SSIM

The MS-SSIM incorporates the variations of viewing conditions and is more flexible than SSIM [43]. Thus, we adopt the MS-SSIM as an evaluation index in this paper.
M S _ S S I M ( x , y ) = [ l M ( x , y ) ] α M j = 1 M [ c j ( x , y ) β j s j ( x , y ) γ j ]
Here, l M ( x , y ) represents the luminance comparison at scale M , and c j ( x , y ) and s j ( x , y ) represent the contrast and structure comparison at scale j , respectively. The exponents α M , β j , and γ j are used to adjust the relative importance of different components.

4.3. VIF

Based on the theory in [48], the model of VIF can be represented as
Y ( i , j ) = β ( i , j ) X ( i , j ) + V ( i , j ) + W ( i , j )
χ ( i , j ) = X ( i , j ) + W ( i , j )
Here, X ( i , j ) is the original image, Y ( i , j ) is the reconstructed image, χ ( i , j ) is the image captured by humans, and W ( i , j ) is the noise image of the human vision system (HVS). X ( i , j ) is decomposed into several subbands ( X 1 ( i , j ) , X 2 ( i , j ) , , X M ( i , j ) ) by wavelet transformation. β ( i , j ) is the value of the window used in the distortion channel estimation. V ( i , j ) is a stationary additive, zero-mean Gaussian noise. If the variance of W ( i , j ) is σ W , c = 0.01 , and
Z ( i , j ) 2 = 1 M k = 1 M X k ( i , j ) 2
Then
V I F = log 2 ( β ( i , j ) 2 Z ( i , j ) 2 + σ w + c σ w + c ) log 2 ( Z ( i , j ) 2 + c c )

5. Experiments and Discussion

In this section, some experiments are carried out to evaluate the performance of the proposed compression method. The proposed compression method is compared with other five scan-based methods, which are the mainstream or the state-of-the-art compression methods, in terms of different evaluation indexes at different bit rates.

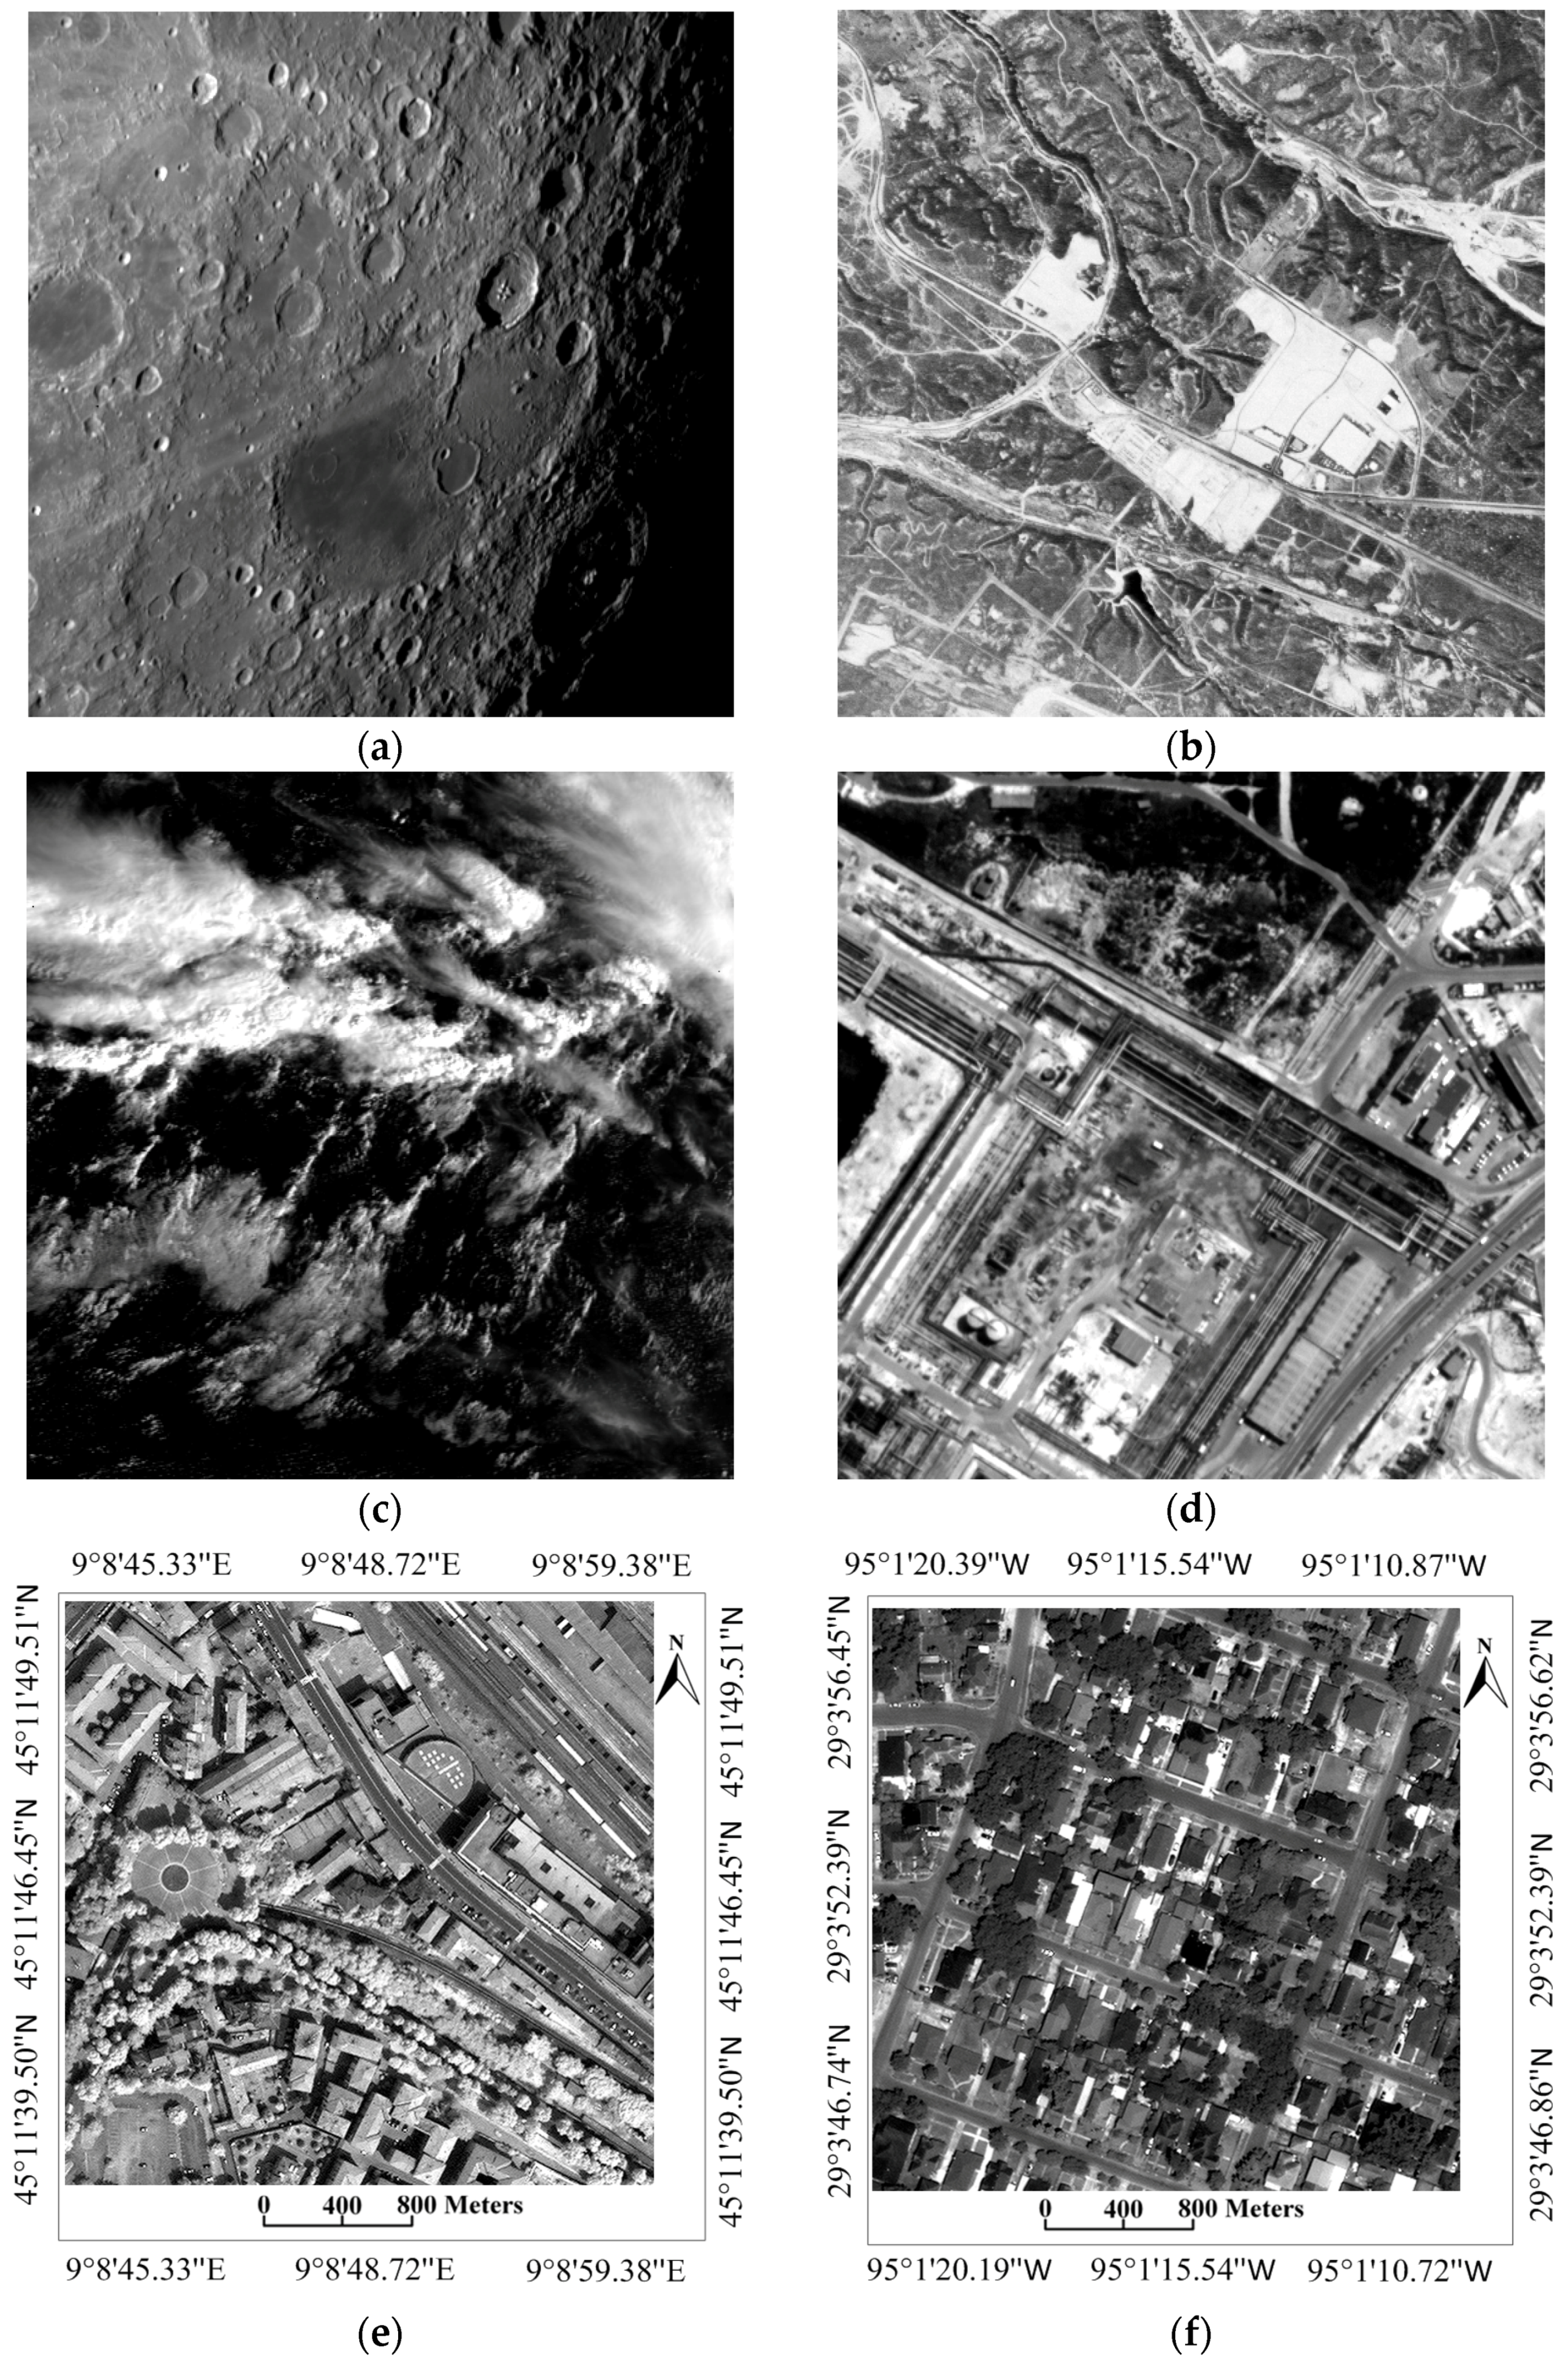
5.1. Space-Borne Images from Different Sensors

To fully verify the performance of the proposed compression method, the test space-borne images come from different sensors. Some test images are from a CCSDS test image set [49], which includes a variety of space imaging instrument data, such as planetary, solar, stellar, earth observations, and radar. In this paper, “lunar”, “ocean_2kb1”, and “pleiades_portdebouc_pan” are chosen. Moreover, the test image “Miramar NAS” is derived from the USCSIPI Image Database [50]. In addition, two other remote sensing images are chosen. “Pavia” is derived from an image acquired by the Quickbird sensor over Pavia, Italy, which has a resolution of 0.6 m. “Houston” is derived from an image acquired by the World View-2 sensor over Houston, USA in 2013, which has a resolution of 0.5 m. We crop the left upper part of these images with a size of 512 × 512 for comparison under the same condition. The test image set is shown in Figure 8. The data source and bit depth of the test image set are listed in Table 2.

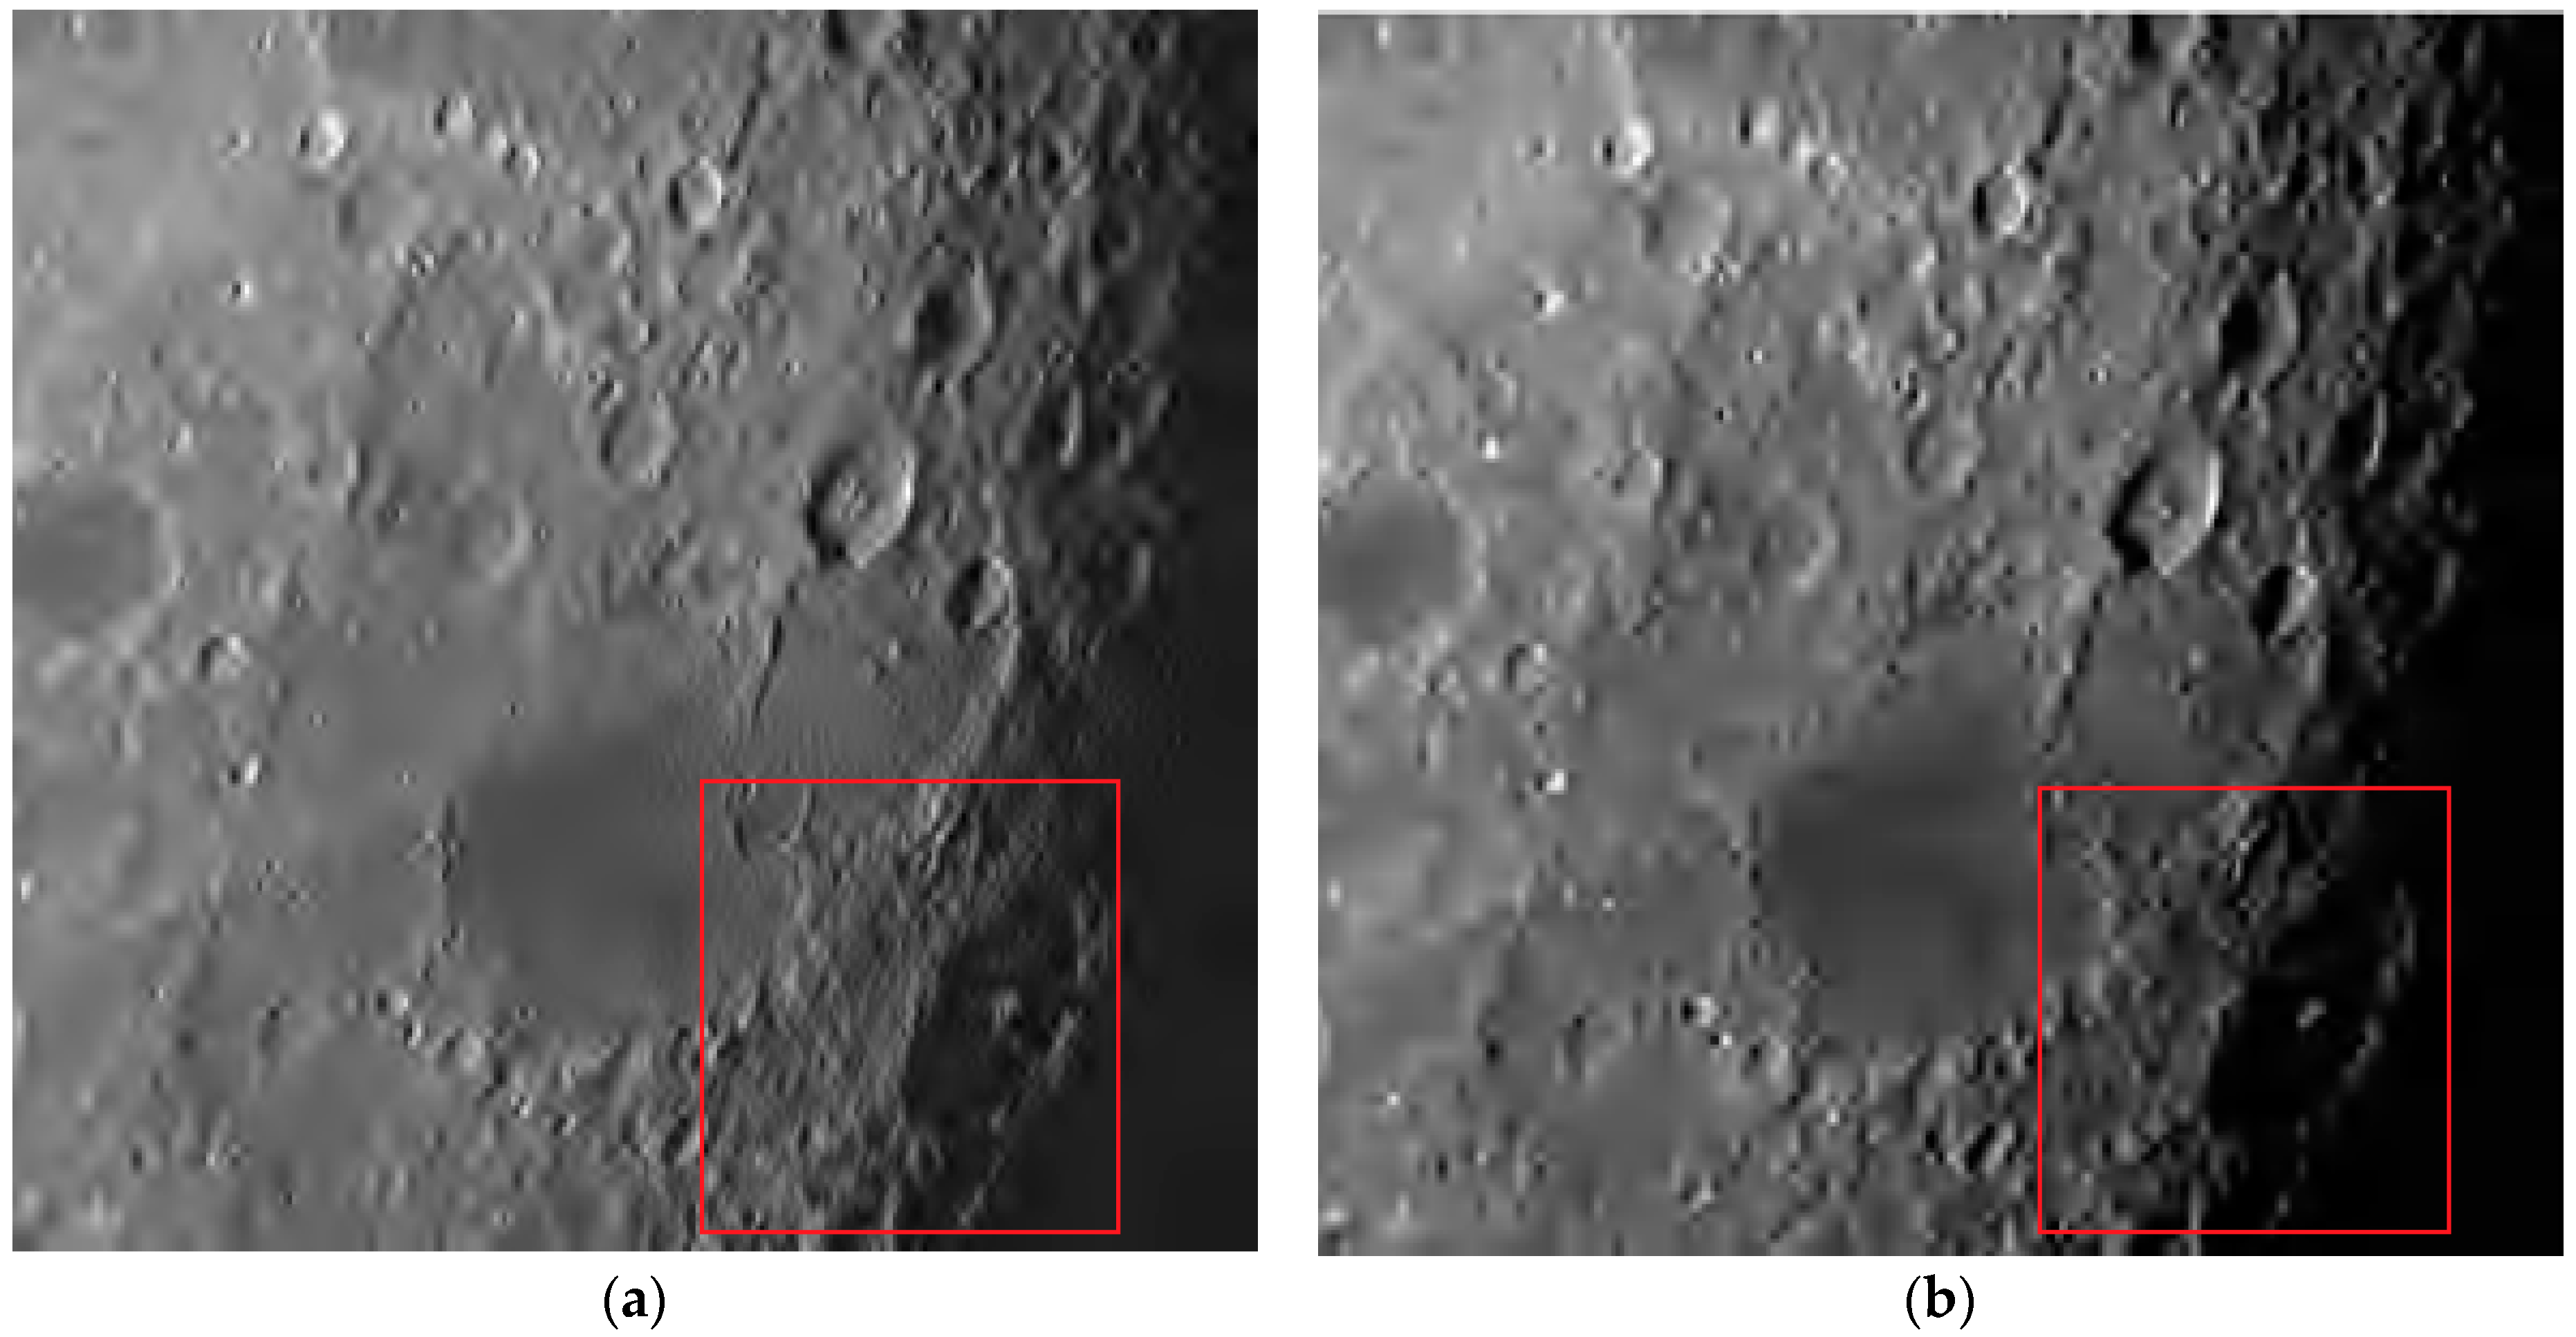
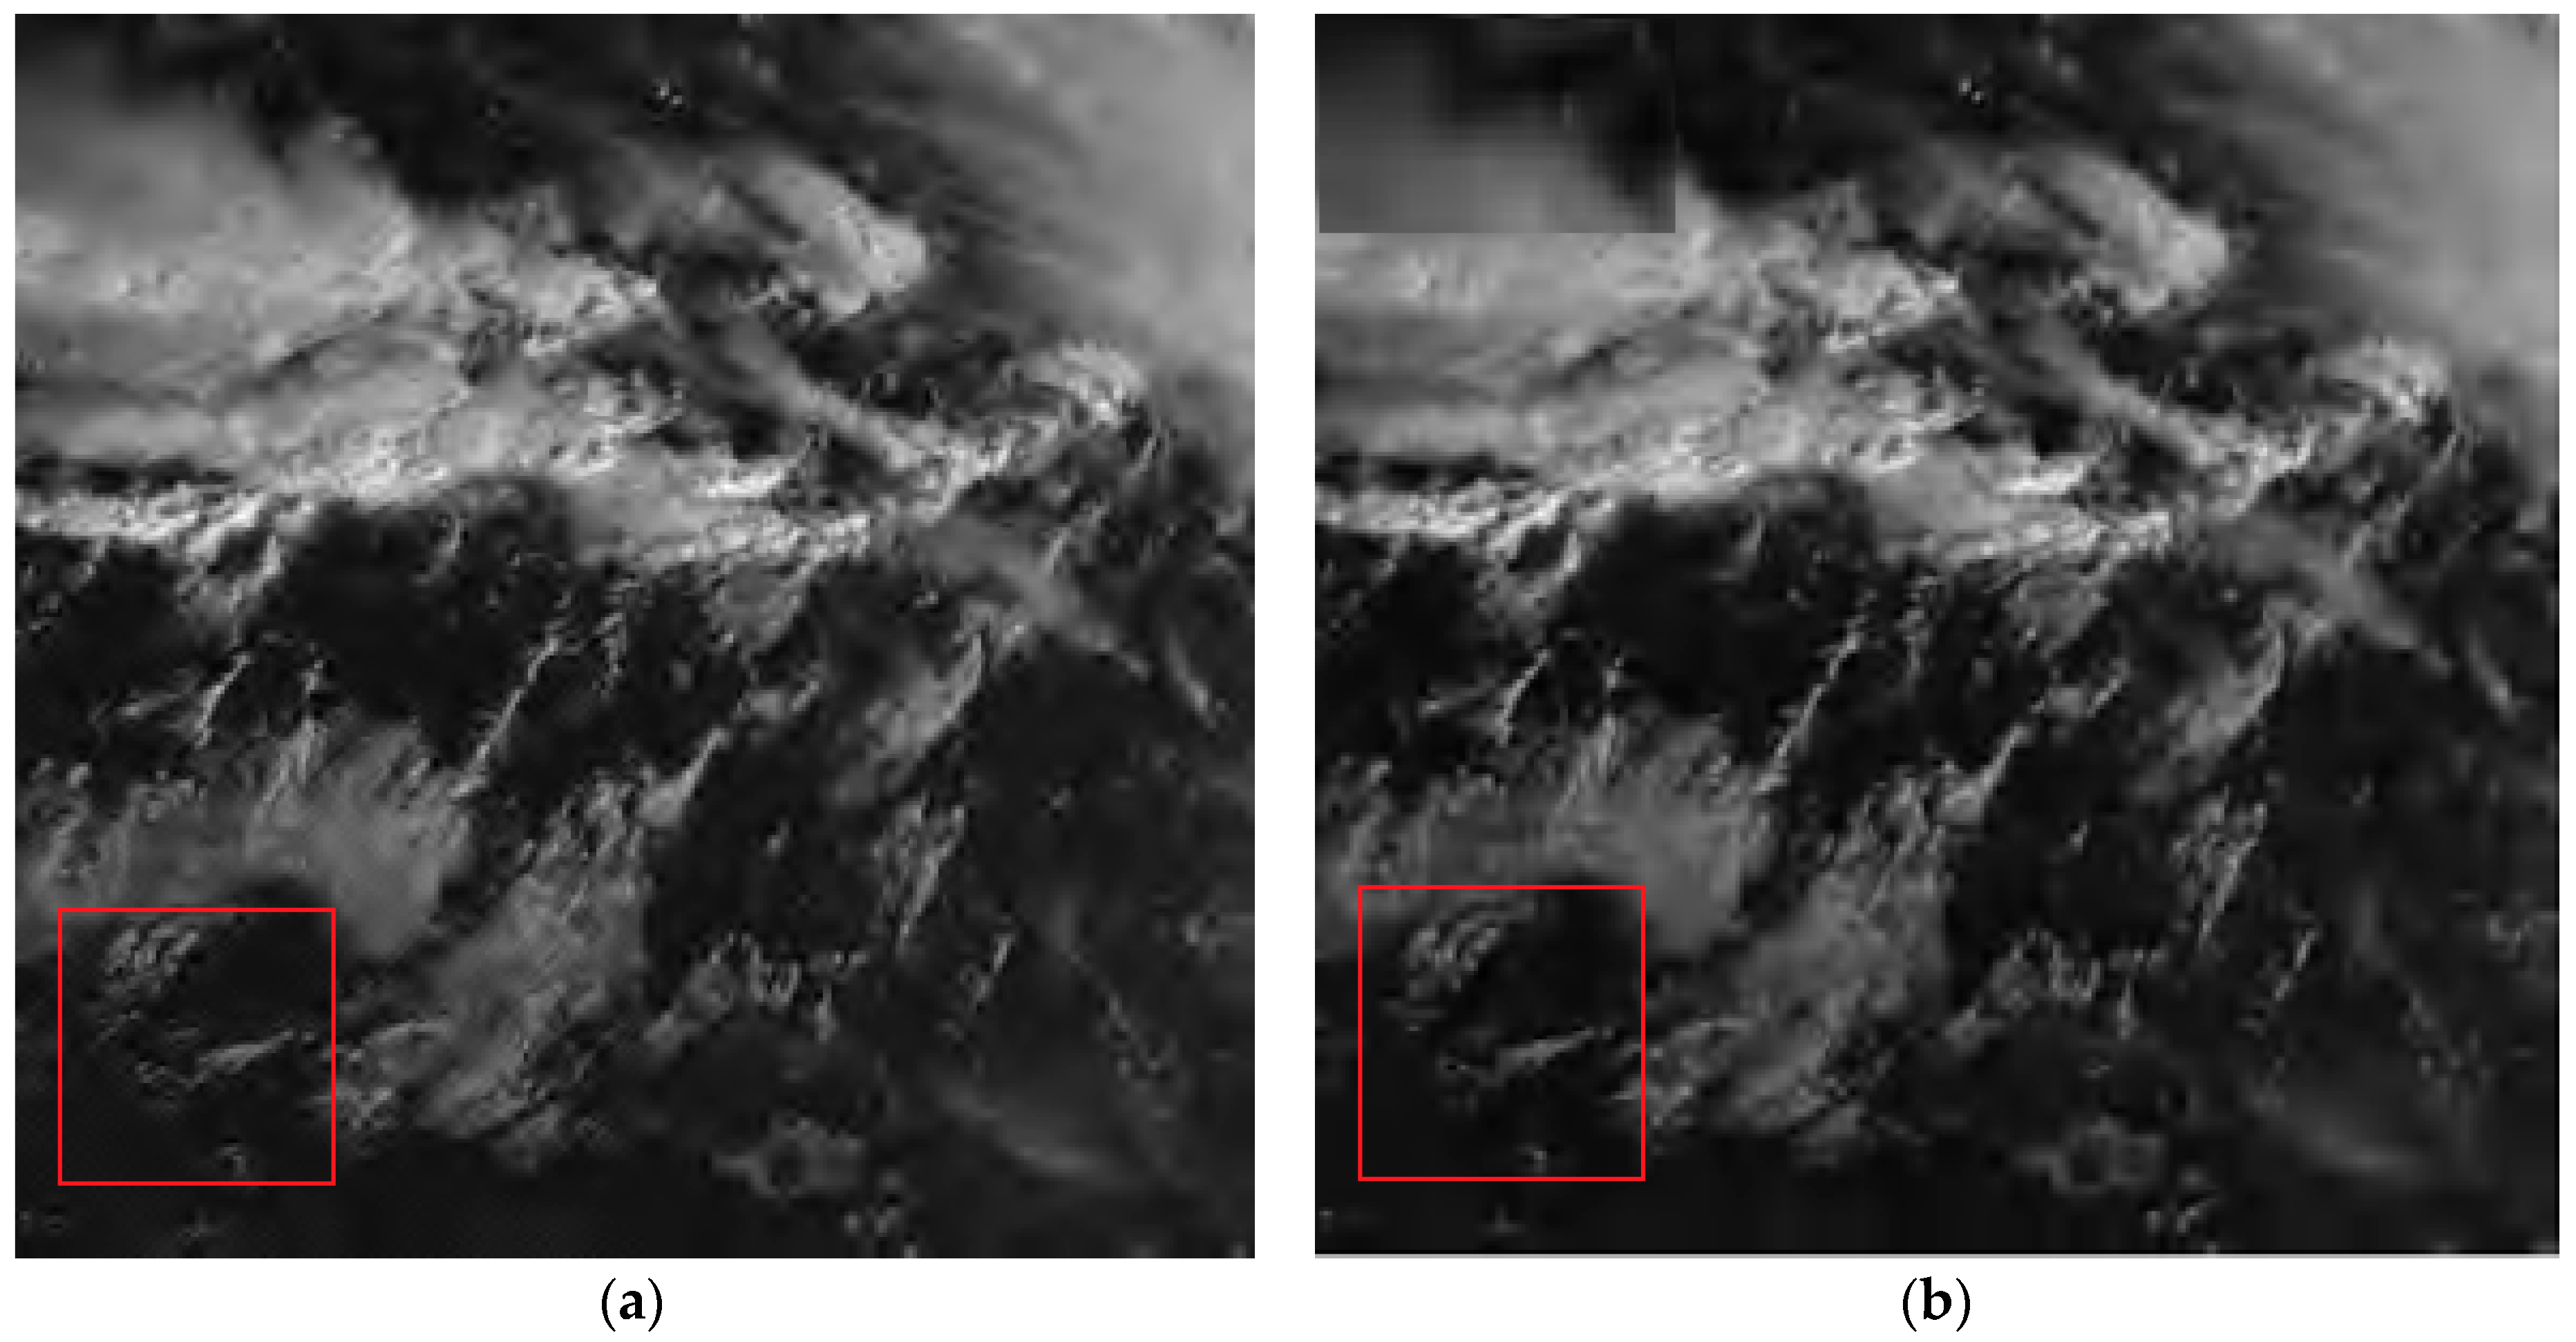
5.2. Performance Comparison of the Proposed Compression Method with Other Scan-Based Methods

In the experiments, the 9/7-tap biorthogonal wavelet filter frame is used for the directional adaptive lifting. The size of the image block is set to 64 × 64. All the test remote sensing images are compressed by the proposed compression methods and the other five scan-based methods, respectively. The methods used for comparison are the mainstream or the state-of-the-art compression methods, including CCSDS 122.0-B-1, JPEG2000, BTCA, HAS, and QCAO. The compared results, in terms of PSNR, MS-SSIM, and VIF, are tabulated in Table 3, Table 4 and Table 5. The results are evaluated at eight bit rates, namely, 0.0313 bpp, 0.0625 bpp, 0.125 bpp, 0.25 bpp, 0.5 bpp, 1 bpp, 2 bpp, and 3 bpp.
PSNR is a quality index that evaluates an algorithm under the sense of a means squared error (MSE). In Table 3, the compared results are listed from the perspective of MSE. It can be seen that the coding performance of CCSDS is the worst. The reason for this is that the CCSDS is designed for onboard compression, which considers the complexity of the algorithm more than the coding performance. As a result, the low complexity of the algorithm is at the cost of the coding performance. The PSNR results of JPEG2000 are good, because some complicated models of JPEG2000, such as the context model and rate-distortion optimization, can help to provide a good coding performance. Compared with JPEG2000, BTCA can encode the neighbors of those significant coefficients in priority, which makes it more advantageous for the compression of remote sensing images, because more details can be preserved. Therefore, the PSNR results of BTCA are better than those of JPEG2000 when bit rate is not very high. The HAS algorithm is an improved version of BTCA that takes human vision into consideration, aiming to improve the visual quality of the reconstructed remote sensing images. It can be seen that from Table 3, the PSNR results of HAS are similar to those of BTCA. The QCAO method is the state-of-the-art compression method, which is an efficient image compression method based on quadtree, and it can provide quality, resolution, and position scalability. The PSNR results of QCAO are higher than those of the previously mentioned methods. The proposed compression method can provide the best coding performance in most cases. The reason is that the designed DAL-PBT model can provide a more efficient representation for remote sensing images, and the CQOT method can provide a reasonable scanning method among and within blocks based on image content, before establishing some quadtrees based on the scanning results. The effective image representation and appreciate scanning mode are all beneficial to the improvement of the coding performance. When the bit rate is very high, sometimes the JPEG2000 can provide a higher PSNR.
Table 4 compares the results in terms of the MS-SSIM. The MS-SSIM can provide a whole approximation to the perceived image quality from the view of structural similarity. From Table 4, we can see that the proposed compression method is still better than the other five compression methods in most cases, especially at low bit rates. The reason is that the DAL-PBT model can provide a good representation of the high frequency information of remote sensing images, and the CQOT method encodes the brothers of significant coefficients in priority during the coding process, which ensures that more important outlines and details of remote sensing images are preserved. Therefore, the structural similarity between the original image and the reconstructed image is improved. As the bit rate increases, some other compression methods, such as the HAS-based method, can sometimes provide a better result. Take the “Houston”, for example; Table 4 shows that the MS-SSIM results of the HAS-based method are 0.9512, 0.9788, 0.9928, and 0.9976 at 0.5 bpp, 1 bpp, 2 bpp, and 3 bpp, respectively. In comparison, the MS-SSIM results of the proposed method are 0.9507, 0.9769, 0.9919, and 0.9973, respectively. The slight performance improvements of the HAS-based method are caused by the visual weighing mask. Nevertheless, for most of the test images, the proposed compression method can still provide the best results at high bit rates.
Table 5 lists the comparison of the compression results in terms of VIF. The VIF is derived from a quantification of two mutual information quantities: the mutual information between the input and the output of the HVS channel for the reference image, and the mutual information between the input of the distortion channel and the output of the HVS channel for the reconstructed image. Therefore, VIF is a quality index that evaluates an algorithm from the perspective of human visual perception. Table 5 shows that the proposed compression method is superior to the other five compression methods in most cases. At a few high bit rates, the HAS method can provide a better visual quality for reconstructed images. The reason is that the HAS method is specially designed for image visualization applications. The retina-based visual weighting mask of the HAS aims to preserve more visually sensitive information of the image.
Table 6 shows the encoding times(s) of these compression methods. The results are the average encoding time for six test images at three bit rates. These programs are evaluated on a PC with Intel Core i7-3770 CPU @ 3.40 GHz and 32 GB memory.
In Table 6, we can see that BTCA is faster than CCSDS with entropy coding. The encoding time of QCAO is slightly shorter than that of BTCA. The reason is that, compared with binary tree, the establishment and scanning of quadtree need fewer comparison times. For HAS, it takes some time to calculate the retina-based visual weighting mask, so its encoding time is longer than that of BTCA. The proposed method is an improved version of QCAO. Compared with QCAO, the proposed method takes a lot of time to calculate the optimum prediction directions of those blocks and directional interpolation. Therefore, the encoding time of the proposed method is longer than that of QCAO, and sometimes even longer than that of JPEG2000. Thus, the proposed method is not applicable to onboard compression, and it can be used for occasions with low real-time requirements and high compression efficiency.
In order to compare the visual quality of reconstructed images obtained by the different compression methods, some experiments are carried out. Here, we provide the visual quality of reconstructed images obtained by the proposed compression method and the mainstream JPEG2000. The comparison results of the image “Lunar” at 0.0625 bpp are shown in Figure 9. It can be seen that the reconstructed image with the proposed method is clearer than that with JPEG2000 in the red box. Figure 10 gets a similar result with the image “Ocean” at 0.125 bpp.
Based on the analysis above, we can conclude that, compared with other scan-based methods, the proposed compression method can provide a better coding performance. One reason is that the designed DAL-PBT model can provide a more efficient representation for remote sensing images. Another reason is that the CQOT method provides a reasonable scanning method among and within subbands/blocks based on image content, which ensures that the important information of the image can be scanned in priority. The effective image representation and the adaptive scanning-based coding method are all beneficial to the improvement of the coding performance.

6. Conclusions

In this paper, we present a new compression framework for remote sensing images. It combines the directional adaptive lifting partitioned block transform with content-driven quadtree codec with optimized truncation. The image representation phase and coding phase are closely related; the former aims to provide a good representation for more directional information of remote sensing images, and the latter focuses on the adaptive scanning mode of the transformed image blocks for further improving the coding efficiency. The experiments are carried out with the images from different sensors (Galileo Image, NOAA Polar Orbiter, QuickBird, WorldView-2, and Simulated PLEIADES) and covering different scenes (lunar, ocean, city, and suburbs). Experimental results show that the proposed method outperforms the mainstream JPEG2000 up to 2.41 dB in PSNR. Compared with the latest QCAO method, up to 0.55 dB improvement in PSNR is reported. Moreover, some improvements in subjective quality are also observed. The proposed method also supports various progressive transmission modes, such as the quality progressive mode, resolution progressive mode, and position progressive mode. Since the block coding is independent, the proposed method can also support the region of interest (ROI)-based progressive transmission mode.
Multicomponent images, such as multispectral and hyperspectral images, are also very popular in remote sensing applications. Therefore, a natural idea is to apply the proposed method to the compression of multicomponent images. The proposed method employs block coding, which can be combined with parallel computing to improve compression efficiency. Actually, we are now doing this work for the compression of hyperspectral images. In addition, for the compression of hyperspectral images, another issue that should be considered is the bit allocation strategy among those transformed components. In our next work, we will research this.

Author Contributions

Conceptualization: C.S.; data curation: L.W. and J.Z.; formal analysis: J.Z. and F.M.; methodology: C.S.; software: C.S. and L.W.; validation: J.Z.; writing—original draft: C.S.; writing—review & editing: F.M. and P.H.

Funding

This research was funded in part by the National Natural Science Foundation of China (41701479, 61675051), in part by China Postdoctoral Science Foundation under Grant 2017M621246, in part by Postdoctoral Science Foundation of Heilongjiang Province of China under Grant LBH-Z17052, in part by the Project plan of Science Foundation of Heilongjiang Province of China under Grant QC2018045, in part by the Fundamental Research Funds in Heilongjiang Provincial Universities of China under Grant 135109250, in part by the plant food processing technology-Heilongjiang Province superiority and characteristic discipline, and in part by the Science and Technology Plan Project of Qiqihar of China under Grant GYGG-201617.

Acknowledgments

We would like to thank the CCSDS and USC University of Southern California for providing the test image set. Additionally, we would like to thank the handling editor and the anonymous reviewers for their careful reading and helpful remarks.

Conflicts of Interest

The authors declare no conflict of interest.

References

  1. Zhang, L.; Lv, X.; Liang, X. Saliency Analysis via Hyperparameter Sparse Representation and Energy Distribution Optimization for Remote Sensing Images. Remote Sens. 2017, 9, 636. [Google Scholar] [CrossRef]
  2. Shi, C.; Zhang, J.; Zhang, Y. Content-based onboard compression for remote sensing images. Neurocomputing 2016, 191, 330–340. [Google Scholar] [CrossRef]
  3. Shapiro, J.M. Embedded image coding using zerotrees of wavelet coefficients. IEEE Trans. Signal Process. 1993, 41, 3445–3462. [Google Scholar] [CrossRef]
  4. Said, A.; Pearlman, W.A. A new, fast, and efficient image codec based on set partitioning in hierarchical trees. IEEE Trans. Circuits Syst. Video Technol. 1996, 6, 243–250. [Google Scholar] [CrossRef]
  5. Pearlman, W.A.; Islam, A.; Nagaraj, N.A. Said, Efficient low complexity image coding with a set-partitioning embedded block coder. IEEE Trans. Circuits Syst. Video Technol. 2004, 14, 1219–1235. [Google Scholar] [CrossRef]
  6. Christopoulos, C.; Skodras, A.; Ebrahimi, T. The JPEG2000 still image coding system: An overview. IEEE Trans. Consumer Electron. 2000, 46, 1103–1127. [Google Scholar] [CrossRef]
  7. Wu, Z.; Bilgin, A.; Marcellin, M.W. Joint source/channel coding for image transmission with JPEG2000 over memoryless channels. IEEE Trans. Image Process 2005, 14, 1020–1032. [Google Scholar] [PubMed]
  8. Suruliandi, A.; Raja, S.P. Empirical evaluation of EZW and other encoding techniques in the wavelet-based image compression domain. Int. J. Wavelets Mult. 2015, 13, 1550012. [Google Scholar] [CrossRef]
  9. Zhang, Y.; Cao, H.; Jiang, H. Mutual information-based context template modeling for bitplane coding in remote sensing image compression. J. Appl. Remote Sens. 2016, 10, 025011. [Google Scholar] [CrossRef]
  10. Hamdi, M.; Rhouma, R.; Belghith, S. A selective compression-encryption of images based on SPIHT coding and Chirikov Standard Map. Signal Process. 2017, 131, 514–526. [Google Scholar] [CrossRef]
  11. Zhang, L.; Li, A.; Zhang, Z.; Yang, K. Global and local saliency analysis for the extraction of residential areas in high-spatial-resolution remote sensing image. IEEE Trans. Geosci. Remote Sens. 2016, 54, 3750–3763. [Google Scholar] [CrossRef]
  12. CCSDS122.0-B-1. Image Data Compression. November 2005. Available online: http://public.ccsds.org/publications/archive/122x0b1c3.pdf (accessed on 20 May 2018).
  13. García-Vílchez, F.; Serra-Sagristà, J. Extending the CCSDS recommendation for image data compression for remote sensing scenarios. IEEE Trans. Geosci. Remote Sens. 2009, 47, 3431–3445. [Google Scholar]
  14. CCSDS122.0-B-2. Image Data Compression. November 2017. Available online: https://public.ccsds.org/Pubs/122x0b2.pdf (accessed on 20 May 2018).
  15. Kulkarni, P.; Bilgin, A.; Marcellin, M.W.; Dagher, J.C.; Kasner, J.H.; Flohr, T.J.; Rountree, J.C. Compression of earth science data with JPEG2000. In Hyperspectral Data Compression; Springer: Boston, MA, USA, 2006; pp. 347–378. ISBN 978-0-387-28579-5. [Google Scholar]
  16. Li, B.; Yang, R.; Jiang, H.X. Remote-sensing image compression using two-dimensional oriented wavelet transform. IEEE Trans. Geosci. Remote Sens. 2011, 49, 236–250. [Google Scholar] [CrossRef]
  17. Candes, E.J.; Donoho, D.L. New tight frames of curvelets and optimal representations of objects with piecewise C2 singularities. Commun. Pure. Appl. Math. 2004, 57, 219–266. [Google Scholar] [CrossRef]
  18. Do, M.N.; Vetterli, M. The contourlet transform: An efficient directional multiresolution image representation. IEEE Trans. Image Process. 2005, 14, 2091–2106. [Google Scholar] [CrossRef] [PubMed]
  19. Velisavljevic, V.; Beferull-Lozano, B.; Vetterli, M.; Dragotti, P.L. Directionlets: Anisotropic multidirectional representation with separable filtering. IEEE Trans. Image Process. 2006, 15, 1916–1933. [Google Scholar] [CrossRef] [PubMed]
  20. Guo, K.; Labate, D. Optimally sparse multidimensional representation using shearlets. SIAM J. Math. Anal. 2007, 39, 298–318. [Google Scholar] [CrossRef]
  21. Wang, C.; Lin, H.; Jiang, H. CANS: Towards Congestion-Adaptive and Small Stretch Emergency Navigation with Wireless Sensor Networks. IEEE Trans. Mob. Comput. 2016, 15, 1077–1089. [Google Scholar] [CrossRef]
  22. Shi, C.; Zhang, J.; Chen, H.; Zhang, Y. A Novel Hybrid Method for Remote Sensing Image Approximation Using the Tetrolet Transform. IEEE J. Sel. Top. Appl. Earth Observ. 2014, 7, 4949–4959. [Google Scholar] [CrossRef]
  23. Hou, X.; Jiang, G.; Ji, R.; Shi, C. Directional lifting wavelet and universal trellis coded quantization based image coding algorithm and objective quality evaluation. In Proceedings of the IEEE International Conference on Image Processing, Hong Kong, China, 26–29 September 2010; pp. 501–504. [Google Scholar]
  24. Hou, X.; Yang, J.; Jiang, G.; Qian, X.M. Complex SAR image compression based on directional lifting wavelet transform with high clustering capability. IEEE Trans. Geosci. Remote Sens. 2012, 51, 527–538. [Google Scholar] [CrossRef]
  25. Hou, X.; Zhang, L.; Gong, C. SAR image Bayesian compressive sensing exploiting the interscale and intrascale dependencies in directional lifting wavelet transform domain. Neurocomputing 2014, 133, 358–368. [Google Scholar] [CrossRef]
  26. Zhang, L.; Qiu, B. Edge-preserving image compression using adaptive lifting wavelet transform. Int. J. Electron. 2015, 102, 1190–1203. [Google Scholar] [CrossRef]
  27. Yan, W.; Shaker, A. El-Ashmawy N. Urban land cover classification using airborne LiDAR data: A review. Remote Sens. Environ. 2015, 158, 295–310. [Google Scholar] [CrossRef]
  28. Hussain, A.J.; Al-Jumeily, D.; Radi, N. Hybrid Neural Network Predictive-Wavelet Image Compression System. Neurocomputing 2015, 151, 975–984. [Google Scholar] [CrossRef] [Green Version]
  29. Zhang, L.; Chen, J.; Qiu, B. Region-of-Interest Coding Based on Saliency Detection and Directional Wavelet for Remote Sensing Images. IEEE Geosci. Remote Sens. Lett. 2017, 14, 23–27. [Google Scholar] [CrossRef]
  30. CCSDS122.1-B-1. Spectral Preprocessing Transform For Multispectral and Hyperspectral Image Compression. November 2017. Available online: https://public.ccsds.org/Pubs/122x1b1.pdf (accessed on 20 May 2018).
  31. Valsesia, D.; Magli, E. A Novel Rate Control Algorithm for Onboard Predictive Coding of Multispectral and Hyperspectral Images. IEEE Trans. Geosci. Remote Sens. 2014, 52, 6341–6355. [Google Scholar] [CrossRef] [Green Version]
  32. Valsesia, D.; Boufounos, P.T. Universal encoding of multispectral images. In Proceedings of the IEEE International Conference on Acoustics, Speech and Signal Processing, Shanghai, China, 20–25 March 2016; pp. 4453–4457. [Google Scholar]
  33. Wang, H.; Celik, T. Sparse Representation-Based Hyperspectral Data Processing: Lossy Compression. IEEE J. Sel. Topics Appl. Earth Observ. 2017, 99, 1–10. [Google Scholar] [CrossRef]
  34. Fu, W.; Li, S.; Fang, L.; Benediktsson, J. Adaptive Spectral–Spatial Compression of Hyperspectral Image with Sparse Representation. IEEE Trans. Geosci. Remote Sens. 2017, 55, 671–682. [Google Scholar] [CrossRef]
  35. Van, L.P.; De Praeter, J.; Van Wallendael, G.; Van Leuven, S.; De Cock, J.; Van de Walle, R. Efficient Bit Rate Transcoding for High Efficiency Video Coding. IEEE Trans. Multimed. 2016, 18, 364–378. [Google Scholar]
  36. Huang, K.K.; Liu, H.; Ren, C.X.; Yu, Y.F.; Lai, Z.R. Remote sensing image compression based on binary tree and optimized truncation. Digit. Signal Process. 2017, 64, 96–106. [Google Scholar] [CrossRef]
  37. Barret, M.; Gutzwiller, J.L.; Hariti, M. Low-Complexity Hyperspectral Image Coding Using Exogenous Orthogonal Optimal Spectral Transform (OrthOST) and Degree-2 Zerotrees. IEEE Trans. Geosci. Remote Sens. 2011, 49, 1557–1566. [Google Scholar] [CrossRef]
  38. Karami, A. Lossy compression of hyperspectral images using shearlet transform and 3D SPECK. In Proceedings of the Image and Signal Processing for Remote Sensing XXI, Toulouse, France, 15 October 2015; Volume 9643. [Google Scholar]
  39. Song, X.; Huang, Q.; Chang, S.; He, J.; Wang, H. Three-dimensional separate descendant-based SPIHT algorithm for fast compression of high-resolution medical image sequences. IET Image Process. 2016, 11, 80–87. [Google Scholar] [CrossRef]
  40. Huang, K.; Dai, D. A New On-Board Image Codec Based on Binary Tree with Adaptive Scanning Order in Scan-Based Mode. IEEE Trans. Geosci. Remote Sens. 2012, 50, 3737–3750. [Google Scholar] [CrossRef]
  41. Shi, C.; Zhang, J.; Zhang, Y. A Novel Vision-Based Adaptive Scanning for the Compression of Remote Sensing Images. IEEE Trans. Geosci. Remote Sens. 2016, 54, 1336–1348. [Google Scholar] [CrossRef]
  42. Liu, H.; Huang, K.; Ren, C.; Yu, Y.; Lai, Z. Quadtree Coding with Adaptive Scanning Order for Space-borne Image Compression. Signal Process. Image Commun. 2017, 55, 1–9. [Google Scholar] [CrossRef]
  43. Antonini, M.; Barlaud, M.; Mathieu, P.; Daubechies, I. Image coding using wavelet transform. IEEE Trans. Image Process. 1992, 1, 205–220. [Google Scholar] [CrossRef] [PubMed]
  44. Chang, C.L.; Girod, B. Direction-adaptive discrete wavelet transform for image compression. IEEE Trans. Image Process. 2007, 16, 1289–1302. [Google Scholar] [CrossRef] [PubMed]
  45. Sweldens, W. The lifting scheme: A construction of second generation wavelets. SIAM J. Math. Anal. 1998, 29, 511–546. [Google Scholar] [CrossRef]
  46. Ding, W.; Wu, F.; Wu, X.; Li, S.; Li, H. Adaptive directional lifting-based wavelet transform for image coding. IEEE Trans. Image Process. 2007, 16, 416–427. [Google Scholar] [CrossRef] [PubMed]
  47. Liu, Y.; Ngan, K.N. Weighted adaptive lifting-based wavelet transform for image coding. IEEE Trans. Image Process. 2008, 17, 500–511. [Google Scholar] [CrossRef] [PubMed]
  48. Sheikh, H.R.; Bovik, A.C. Image information and visual quality. IEEE Trans. Image Process. 2006, 15, 430–444. [Google Scholar] [CrossRef] [PubMed] [Green Version]
  49. CCSDS Reference Test Image Set. April 2007. Available online: http://cwe.ccsds.org/sls/docs/sls-dc/ (accessed on 15 March 2018).
  50. USC-SIPI Database. Available online: http://sipi.usc.edu/database (accessed on 15 March 2018).
Figure 1. The overall framework of the proposed compression method.
Remotesensing 10 00999 g001
Figure 2. Generic 1-D directional lifting wavelet transform. (a) Forward decomposition. (b) Reverse synthesis.
Remotesensing 10 00999 g002
Figure 3. Set of reference directions of directional lifting-based wavelet transform. (a) Horizontal transform and (b) vertical transform.
Remotesensing 10 00999 g003
Figure 4. The process of calculating the optimal prediction direction of a block.
Remotesensing 10 00999 g004
Figure 5. The process of directional interpolation.
Remotesensing 10 00999 g005
Figure 6. The process of directional interpolation.
Remotesensing 10 00999 g006
Figure 7. The adaptive scanning process of the test image.
Remotesensing 10 00999 g007
Figure 8. The test remote sensing image set. (a) Lunar; (b) Miramar NAS; (c) ocean_2kb1; (d) pleiades_portdebouc_pan; (e) Pavia; and (f) Houston.
Remotesensing 10 00999 g008
Figure 9. The comparison results of two compression algorithms with the image “Lunar” at 0.0625 bpp. (a) Reconstructed image with the proposed method and (b) reconstructed image with JPEG2000.
Remotesensing 10 00999 g009
Figure 10. The comparison results of two compression algorithms with the image “Ocean” at 0.125 bpp. (a) Reconstructed image with the proposed method and (b) reconstructed image with JPEG2000.
Remotesensing 10 00999 g010
Table 1. The applied filters of the directional interpolation process.
FilterPositionThe Weights of the Filter
Bilinear filter1/43/4; 1/4
1/21/2; 1/2
3/41/4; 3/4
Telenor 4-tap filter1/4−1/16; 13/16; 5/16; −1/16
1/2−1/8; 5/8; 5/8; −1/8
3/4−1/16; 5/16; 13/16; −1/16
2-tap filterN/A−1/4; 5/4
Table 2. List of the test image set.
ImageBit Depth (bpp)Source—Copyright
lunar8Galileo Image—NASA
Miramar NAS8USC-SIPI
ocean_2kb110NOAA Polar Orbiter (AVHRR)—NOAA
Pavia11QuickBird (0.6 m)
Houston11WorldView-2 Sensor(0.5 m)
pleiades_portdebouc_pan12Simulated PLEIADES—CNES
Table 3. PSNRs (dB) of the proposed compression method and other scan-based compression methods.
ImageAlgorithmBit Rate (bpp)
0.03130.06250.1250.250.5123
lunarCCSDS9.8618.9224.4527.6430.6835.0735.0741.10
JPEG200022.7324.1126.0428.2531.3535.6141.5346.21
BTCA23.2824.6426.4928.7431.7136.1342.4748.45
HAS23.3224.7026.5128.7731.7636.0842.4148.40
QCAO23.3224.9326.5028.8731.7936.1542.4648.51
Proposed23.4025.2626.6329.4231.8336.2942.6048.62
Miramar NASCCSDS12.3016.8321.6224.2126.7129.8134.7439.41
JPEG200019.6720.8122.5424.5026.8029.9735.1440.03
BTCA20.1721.2822.8724.7827.1230.3335.3140.53
HAS20.1521.3522.8524.7927.1930.2935.1540.24
QCAO20.3721.5722.9025.0527.3230.3335.3040.56
Proposed20.6121.7623.0025.2727.4430.5435.3740.66
ocean_2kb1CCSDS14.3317.6329.6933.7236.9040.8647.0152.41
JPEG200028.0829.9132.1734.5137.5441.8448.4053.80
BTCA28.8130.5532.7235.0037.9742.1948.5954.53
HAS28.7930.5932.6034.9837.9942.1348.5154.49
QCAO28.8530.5332.7834.9637.9042.2648.6454.57
Proposed28.9730.8432.9535.1538.1142.3548.6954.59
PaviaCCSDS19.3025.1434.2637.1039.3942.1346.7951.77
JPEG200032.5134.0535.7537.6439.7942.6547.7452.97
BTCA32.9634.2135.9437.7839.9342.7147.4952.61
HAS32.9034.3335.9537.7339.9442.7147.3452.38
QCAO33.4134.6536.2937.8539.8642.6247.4052.58
Proposed33.6534.8036.4438.0940.0242.8347.5752.70
HoustonCCSDS15.9521.7331.6935.4538.3541.7546.6351.37
JPEG200029.9431.7333.5235.9238.6542.1747.2852.28
BTCA30.3431.9933.8936.0738.6942.2347.0852.04
HAS30.3331.9233.8736.0438.6942.2446.9951.90
QCAO31.0232.5134.0336.1738.7542.3346.8951.90
Proposed31.2032.6534.1536.2438.7942.3946.8251.79
pleiades_portdeboucCCSDS13.2017.9329.2434.2138.2042.8748.9954.05
JPEG200027.6129.7731.8734.8938.2842.6448.9954.12
BTCA28.4730.4032.8835.5739.2343.5249.3154.42
HAS28.4430.4132.7135.5539.1843.4849.2454.32
QCAO28.6130.4533.3535.7339.2243.5249.3554.48
Proposed28.7330.5933.4935.9239.3943.6549.6754.76
Table 4. MS-SSIMs (dB) of the proposed compression method and other scan-based compression methods.
ImageAlgorithmBit Rate (bpp)
0.03130.06250.1250.250.5123
lunarCCSDS0.16300.65380.82150.92200.96720.98950.98950.9971
JPEG20000.67020.78490.87160.93100.96490.98820.99680.9988
BTCA0.72110.80350.87790.94130.97200.99060.99790.9989
HAS0.72960.80820.88710.94740.97510.99190.99800.9991
QCAO0.72390.82410.88430.94450.97210.99080.99790.9994
Proposed0.73740.84560.89020.95000.97890.99460.99850.9996
Miramar NASCCSDS0.28770.56830.80080.91480.96270.98480.99500.9980
JPEG20000.62420.73950.85060.92220.96380.98500.99450.9980
BTCA0.66790.77260.86800.92500.96340.98570.99560.9982
HAS0.67610.77930.86010.92920.96790.98670.99590.9986
QCAO0.69450.79080.87210.93350.96820.98550.99560.9985
Proposed0.69630.79170.87560.93790.96810.98710.99560.9986
ocean_2kb1CCSDS0.16400.42330.83510.93190.96450.98490.99620.9986
JPEG20000.70140.80150.87890.92650.96240.98330.99590.9986
BTCA0.73960.81210.88200.93550.96600.98630.99670.9987
HAS0.72670.82560.88690.93220.96470.98570.99660.9990
QCAO0.74250.82370.89170.93470.96590.98630.99640.9988
Proposed0.74770.83370.89360.93610.96760.98780.99680.9991
PaviaCCSDS0.12220.42590.77030.89120.94320.97310.99050.9969
JPEG20000.54100.70080.80890.88990.94480.97420.99110.9970
BTCA0.58360.70460.82400.89390.94190.97310.99070.9970
HAS0.60800.72500.81850.89620.94840.97590.99130.9971
QCAO0.64270.75060.84400.90290.94560.97340.99030.9970
Proposed0.68650.76250.85180.90570.94880.97420.99060.9971
HoustonCCSDS0.09930.42870.76170.89650.95060.97850.99250.9974
JPEG20000.56080.70130.81730.89350.94890.97790.99220.9972
BTCA0.59370.71060.80540.89010.94970.97770.99240.9974
HAS0.57910.70210.82550.89570.95120.97880.99280.9976
QCAO0.65290.76080.82640.89530.95030.97740.99200.9973
Proposed0.66260.76810.82710.89600.95070.97690.99190.9973
pleiades_portdeboucCCSDS0.10840.25780.74760.92040.97260.99110.99720.9989
JPEG20000.57680.74730.85720.93220.97250.99060.99700.9988
BTCA0.64690.77450.87550.94050.97650.99110.99730.9989
HAS0.63500.78890.88200.94130.97510.99180.99740.9990
QCAO0.66570.78910.89370.94190.97650.99120.99740.9990
Proposed0.67370.79900.89460.94330.97750.99170.99770.9991
Table 5. VIFs (dB) of the proposed compression method and other scan-based compression methods.
ImageAlgorithmBit Rate (bpp)
0.03130.06250.1250.250.5123
lunarCCSDS0.02210.05520.11360.25530.42880.66220.66220.8668
JPEG20000.04460.08920.16860.28300.43360.67770.88410.9552
BTCA0.05850.10260.17970.30740.47330.71490.91060.9749
HAS0.05500.10860.18560.30830.47940.72350.92970.9817
QCAO0.05710.12530.18360.31420.47030.71810.91010.9746
Proposed0.05990.15210.19280.34050.47920.72170.90860.9738
Miramar NASCCSDS0.02060.04640.09770.21740.36100.53730.74940.8699
JPEG20000.03550.06710.13260.23310.36960.55510.74260.8828
BTCA0.04520.08440.14680.24090.36690.55870.78080.9138
HAS0.04810.08340.14270.24740.39500.56390.80980.9265
QCAO0.05080.08930.14870.25110.39580.55730.78290.9146
Proposed0.05270.09000.15270.25630.39760.55830.77810.9125
ocean_2kb1CCSDS0.02050.03870.08870.21170.34730.53510.76930.8931
JPEG20000.04030.07450.13390.21990.33870.52590.79600.9180
BTCA0.05060.08530.14650.23840.36540.56330.80110.9297
HAS0.04970.09040.14720.23480.36780.57140.82930.9468
QCAO0.05140.08600.14690.23870.36410.56230.79980.9281
Proposed0.05250.10130.14880.24300.36940.55760.79920.9294
PaviaCCSDS0.01640.03550.07160.16220.26290.39570.58760.7606
JPEG20000.02580.05140.09380.16670.27060.41060.61410.7771
BTCA0.03110.05590.10290.17080.26750.39850.59870.7849
HAS0.03400.05760.10100.17260.28480.43630.64450.8081
QCAO0.04890.07410.12590.17600.27690.41450.59490.7823
Proposed0.05960.08050.12670.17770.27600.41360.59210.7829
HoustonCCSDS0.01520.03070.06330.15950.27070.41960.61610.7768
JPEG20000.02720.05410.09490.16200.27630.43220.62180.7607
BTCA0.03260.05610.09600.16430.27490.42630.63050.7984
HAS0.03000.05680.10280.16930.28470.44980.66380.8262
QCAO0.06520.07740.10270.16850.27730.42080.62590.7946
Proposed0.06970.07910.10390.16960.27260.41760.61860.7906
pleiades_portdeboucCCSDS0.01030.01800.04620.12150.21760.35990.56820.7232
JPEG20000.02200.04480.07640.13300.22420.36070.54670.7204
BTCA0.03010.05240.08990.14680.23840.36320.54960.7268
HAS0.02970.05520.09090.14750.24050.38390.58240.7529
QCAO0.03170.05340.10740.14790.23750.36520.59360.7105
Proposed0.03610.05670.10920.15190.24370.37760.60720.7299
Table 6. The encoding times(s) of different compression methods.
Algorithm1 bpp0.5 bpp0.25 bpp
CCSDS1.780.930.41
JPEG20002.121.190.53
BTCA0.300.270.25
HAS0.370.330.31
QCAO0.280.250.23
Proposed1.291.160.98

