Efficient SfM for Oblique UAV Images: From Match Pair Selection to Geometrical Verification


1
School of Computer Science, China University of Geosciences, Wuhan 430074, China
2
State Key Laboratory of Information Engineering in Surveying, Mapping and Remote Sensing, Wuhan University, Wuhan 430072, China
3
Collaborative Innovation Center of Geospatial Technology, Wuhan University, Wuhan 430072, China
*
Author to whom correspondence should be addressed.
Remote Sens. 2018, 10(8), 1246; https://0-doi-org.brum.beds.ac.uk/10.3390/rs10081246
Submission received: 16 July 2018
/
Revised: 3 August 2018
/
Accepted: 6 August 2018
/
Published: 8 August 2018
(This article belongs to the Special Issue Structure from Motion (SfM) Photogrammetry for Geomatics and Geoscience Applications)
Abstract
:Accurate orientation is required for the applications of UAV (Unmanned Aerial Vehicle) images. In this study, an integrated Structure from Motion (SfM) solution is proposed, which aims to address three issues to ensure the efficient and reliable orientation of oblique UAV images, including match pair selection for large-volume images with large overlap degree, reliable feature matching of images captured from varying directions, and efficient geometrical verification of initial matches. By using four datasets captured with different oblique imaging systems, the proposed SfM solution is comprehensively compared and analyzed. The results demonstrate that linear computational costs can be achieved in feature extraction and matching; although high decrease ratios occur in image pairs, reliable orientation results are still obtained from both the relative and absolute bundle adjustment (BA) tests when compared with other software packages. For the orientation of oblique UAV images, the proposed method can be an efficient and reliable solution.
1. Introduction
Recent years have seen an explosion of activity in the use of UAVs for varying applications, including building model reconstruction [1], transmission line inspection [2], and urban change detection [3] because of their low economic costs and flexible data acquisition. Integrated with oblique photogrammetric systems, such as one-camera or pent-view instruments, the combined imaging systems could improve both of their strengths, namely the flexibility of UAV platforms and the ability of oblique systems [4].
Unfortunately, some new challenges are imposed on the post-processing of oblique UAV images. Major issues are listed as follows: (1) image orientation is required prior to further applications, due to the fact that precise direct geo-referencing devices, namely the GNSS (Global Navigation Satellite System)/IMU (Inertial Measurement Unit), are usually not used on the market-available UAV platforms; (2) because of the large data volume and high overlap degree, the combinational complexity of UAV images becomes more complex than conventional aerial images; (3) feature matching between oblique images is difficult due to different appearances caused by perspective deformations; in addition, the loss of location accuracy and the reduction of tie-point number would be caused by the down-sampling strategy; and (4) the low performance of the commonly used geometrical verification methods, such as the RANSAC (Random Sample Consensus) [5], due to the high outlier ratios of initial candidate matches.
In the field of computer vision, the Structure-from-Motion (SfM) has the ability to recover camera poses and 3D points from unordered images [6] without their prior knowledge, whose strengths have been verified and reported in comparison tests [7] and in applications [8,9]. Consequently, SfM can be a promising solution to address the first above-listed issue for the orientation of oblique UAV images. However, the efficiency problem is not neglectable because the primal SfM is originally designed to recover small-scale scenes or scenarios recorded by small-size photos with low spatial resolution. In the overall workflow, the SfM consists of three major steps, namely feature extraction, feature matching and reconstruction, and most of the time costs are consumed by feature matching. Thus, related research has been done for the acceleration of image matching [10], which is related to the last three issues.
The second issue corresponds to match pair selection, which reduces unessential image pairs. Without any prior knowledge about camera poses, image retrieval based on vocabulary trees is a golden standard method to select images with high similarity scores [11]. On the contrary, flight control data of UAV platforms can be used to calculate the rough POS (Positioning and Orientation System) with the assistance of camera mounting angles [12]. Consequently, some researchers try to simplify the processing of match pair selection by using the overlap criterion, where two images are marked as a validate pair if their footprints intersect with each other [13,14,15]. Although the criterion can dramatically decrease the number of unessential image pairs, a vast number of redundant image pairs still exist in the results from the direct adjacent principle. To achieve the further reduction, the analysis of topological connection network (TCN) has gained attention, where initial pairs are used to construct an edge-weighted network, and reduction is implemented by removing unessential edges from the network [16]. To cope with some issues caused by oblique images, Jiang et al. [17] proposed using both overlap area and intersection angle to calculate edge weights and designed a match graph extraction algorithm considering the local stability of the TCN, which is verified as a promising solution for match pair selection of oblique UAV images.
The third issue is to achieve reliable and accurate feature matching for UAV images. In the fields of computer vision and digital photogrammetry, there are many algorithms proposed to achieve the correspondence problem, including the earliest corner detector [18], the scale invariant detector [19], and some other variants [20,21] and revised versions [22,23,24]. Thus, it seems that dozens of algorithms and libraries can be utilized to address the correspondence problem of oblique UAV images. However, as documented in [12], extra considerations should be taken for sufficient and precise tie-point extraction and matching with impressive efficiency. In their work, two commonly used strategies, including the geometrical rectification and the divide-and-conquer, are considered for tie-point extraction of oblique UAV images. They conducted varying tests to compare their individual performance on feature extraction and matching and designed four combinations of these two strategies for image orientation in terms of efficiency, completeness, and accuracy. The test results revealed that the solution integrated with the divide-and-conquer strategy outperforms other solutions for feature extraction and matching of oblique UAV images.
The fourth issue aims to divide initial matches into true matches and false matches based on an estimated geometrical transformation model. In the literature, the RANSAC algorithm [5] is one of the most popular tools to estimate model parameters from outlier contaminated matches because it can tolerate a large fraction of outliers. However, the computational costs of the RANSAC increase exponentially with the percentage of outliers [25]. In contrast to the RANSAC, the other methods implicitly find a geometrical transformation, which is usually achieved by using the Hough transformation (HT) [26]. The core idea of HT is to transform model estimation in the feature space to bin voting in the parameter space [27,28]. However, verification approaches based on the HT are not as accurate as the RANSAC-based methods, due to the coarse voting space quantization and the weak geometrical constraints. For photogrammetric images, the rough geo-referencing characteristics have been exploited for outlier removal, which is based on the assumption that two images have been coarsely aligned, and the geometrical transformation of initial matches can be simplified as two-dimensional transformation [29,30]. Similarly, the same idea can also be introduced to achieve efficient geometrical verification for oblique UAV images, as reported in Jiang et al. [31], where a hierarchical motion consistency constraint (HMCC) algorithm was designed to filter obvious outliers prior to the use of the RANSAC. Experimental results demonstrated their promising performance for geometrical verification of oblique UAV images.
This paper proposes an integrated SfM solution based on previous studies [12,17,31]. First, the operation for match pair selection is conducted to remove unessential image pairs. Second, for reliable feature matching, the tiling strategy is used to increase the number of matches and improve their distribution. Finally, the HMCC is used to remove outliers. To verify the performance of the proposed solution, comparison tests are conducted with other software packages.
This paper is organized as follows. Methods used in this study are firstly described, which are followed by the workflow of the SfM solution. Experiments are then conducted to verify the proposed solution. Finally, the discussions and conclusions are presented.
2. Methodology
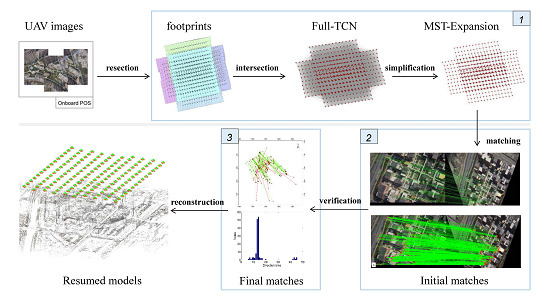
For the three issues in the SfM reconstruction of oblique UAV images, namely match pair selection, feature extraction and matching, and geometrical verification, this paper summarizes the corresponding solutions based on our previous research [12,17,31] and then proposes the overall workflow to achieve an efficient SfM solution, as presented in Figure 1. The processing pipeline consists of three parts: (1) match pair selection based on the analysis of topology connection network; (2) tiling strategy for feature extraction and matching; and (3) efficient geometrical verification for initial matches with high outlier ratios. The inputs of the overall workflow include UAV images, flight control data, camera installation angles, and the mean altitude of test sites. These data can be easily accessed from a classical data acquisition campaign. Thus, the proposed solution is not dependent on any hard-to-access materials and can be widely used for UAV photogrammetric data processing. The outputs of the pipeline include the camera poses of UAV images and point clouds of scenes. The description of each step in the overall workflow is listed as follows.
2.1. Match Pair Selection Based on MST-Expansion
The purpose of match pair selection is to search essential image pairs with overlap regions. By using flight control data and camera installation angles, the rough POS of images can be calculated with respect to a selected photogrammetric system [12]. Then, with the assistance of the mean altitude of test sites or some auxiliary data sources, such as SRTM (Shuttle Radar Topography Mission) [32], initial match pairs can be selected based on the overlap criterion, where their image footprints are intersected.
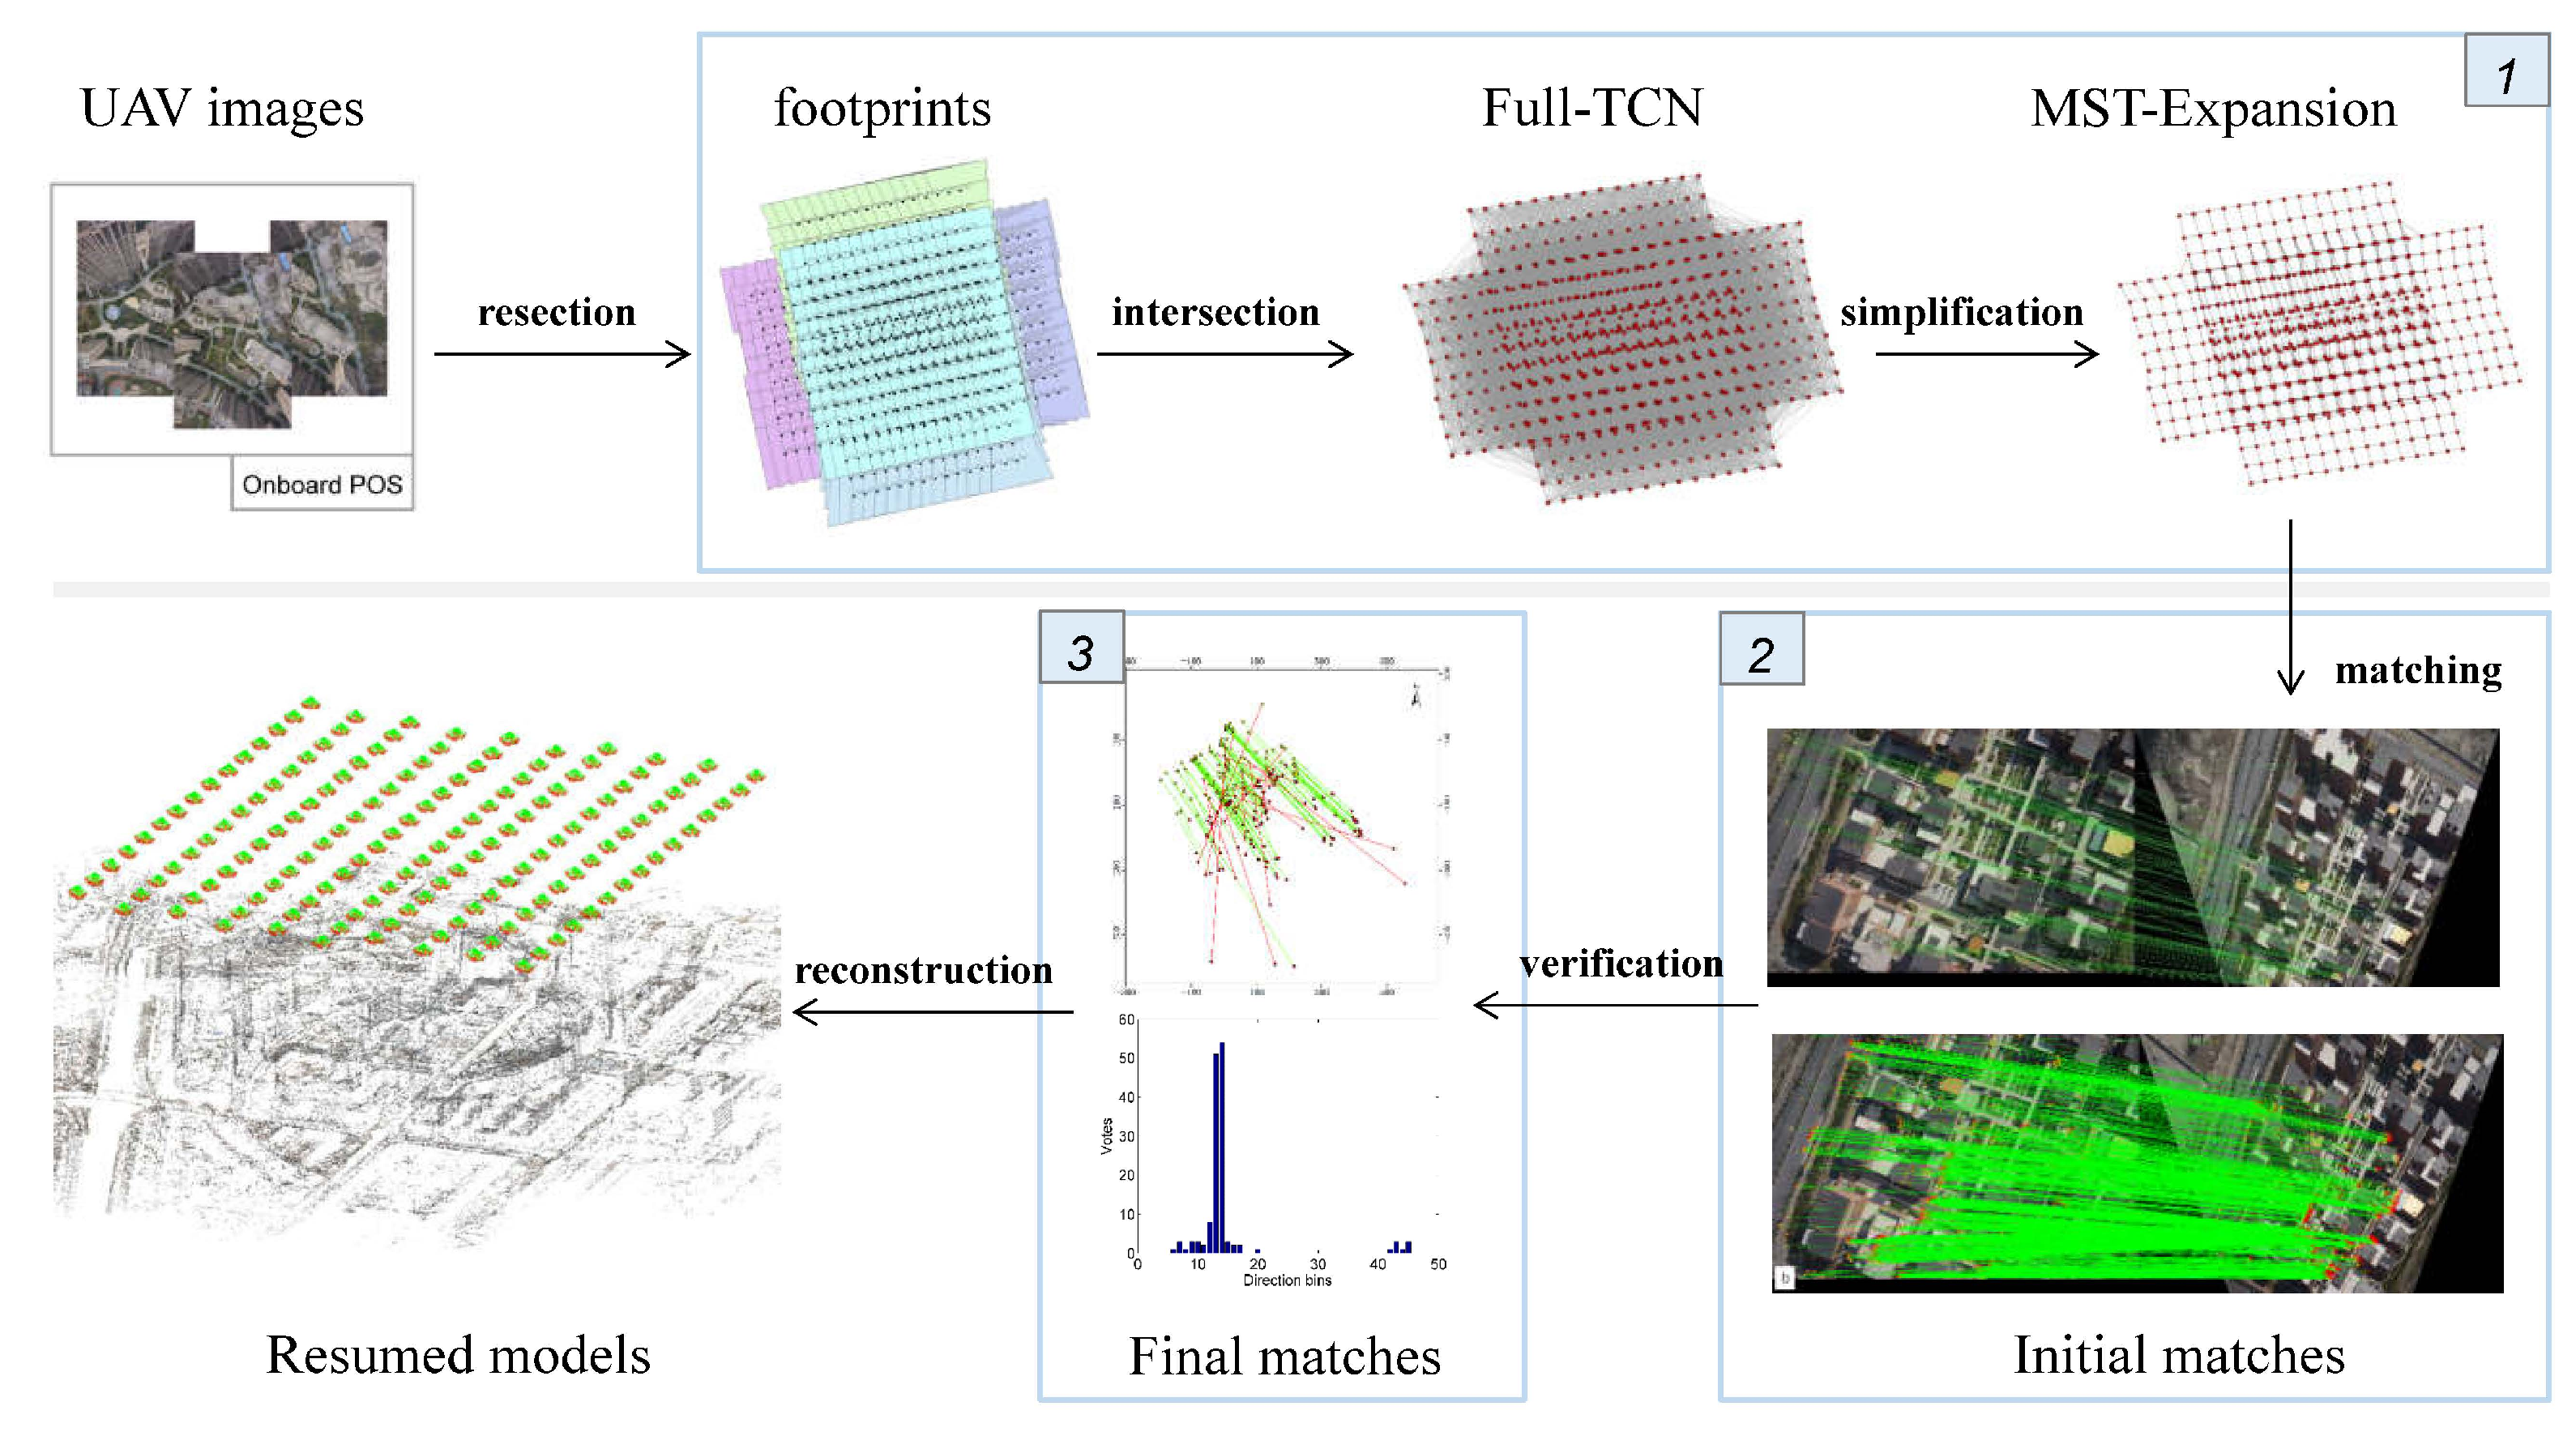
Because of the existence of redundant match pairs, the MST-Expansion (Maximum Spanning Tree Expansion) algorithm [17] is designed for the simplification of initial match pairs. First, an image connection network represented by an undirected weighted graph is formed using initial candidate matches, where edge weights indicate the importance of image pairs, and they are calculated by using the overlap area and the intersection angle of image pairs, as shown in Figure 2a; second, to achieve the simplest form, an MST [33] is extracted from the image connection network by using the Kruskal algorithm [34], which strings all vertices together without any cycles and with the maximum sum of edge weights; finally, local structural analysis is used to enhance the MST by introducing critical connections.
The core idea of local structural analysis is based on the eigenvector decomposition, as shown in Figure 2b, where the red dot indicates the target vertex, and the green dots indicate connected vertices in the MST. By using ground coordinates of both the red and green dots, a covariance matrix can be calculated to reveal the distribution of existing image connections. Based on SVD (Singular Value Decomposition) decomposition, the direction is determined by the eigenvector of the matrix corresponding to the smallest eigenvalue. Then, candidates, as depicted by blue dots, can be searched from the initial image connection network, and edge expansion is conducted until the numbers of connections in two regions represented by blue-dash lines reach a desired count, which means a stable connection for the target vertex. According to the above-mentioned operation, a simplified and stable image connection network can be constructed, and the image pairs corresponding to the finally retained edges are fed into subsequent feature matching. The configuration of the MST-Expansion algorithm used in this study is listed in Table 1.
2.2. Tiling Strategy for Feature Extraction and Matching
The tiling strategy has two main advantages when compared with other strategies, such as geometrical rectification using image POS data [35]. The first one is that the tiling strategy can restrict the searching space for feature matching and further increase the success of the ratio-test [19], which is commonly used to reject false matches. Thus, both the number and distribution of matches can be improved. The other one is that it can avoid image down-sampling in order to adapt to limited computer memory for feature extraction of photogrammetric images of a large size. Consequently, it can also extend the usage fields of some memory sensitive algorithms, such as the SIFT (Scale Invariant Feature Transform) [19].
Considering that the rough POS calculated from flight control data is not accurate enough to predict correspondences between two images, a homography transformation is used to model the geometrical relationship of one image pair. Thus, three steps achieve the tiling strategy. First, seed points are extracted from two down-sampled images, and a homography matrix is robustly estimated from these points using the RANSAC; second, the overlap region of the image pair is determined in order to avoid unnecessary matching computation, and the overlap region expressed in the first image plane is gridded into regular blocks of a small size; then, for each block in the first image plane, four locations are calculated by transforming four corners of the current block to the second image plane using the homography matrix; finally, a corresponding block can be determined in the second image plane and used to restrict feature matching. The configuration of the tiling strategy used in this study is listed in Table 2.
2.3. Geometrical Verification Using HMCC-RANSAC
The key idea of the HMCC-RANSAC is to transform the complex geometrical relationship of initial matches in the image space to a simple 2-dimensional translation in the object space by projecting matches onto a specified elevation plane. For two matched image points, the corresponding projected points form the primitive, namely motion, for further analysis. The motion is characterized by two features, i.e., motion direction and length. The procedure of geometrical verification based on the HMCC-RANSAC can be divided into two steps, where obvious outliers are removed by using the HMCC, and the RANSAC with the rigorous geometrical constraint is utilized to refine final matches.
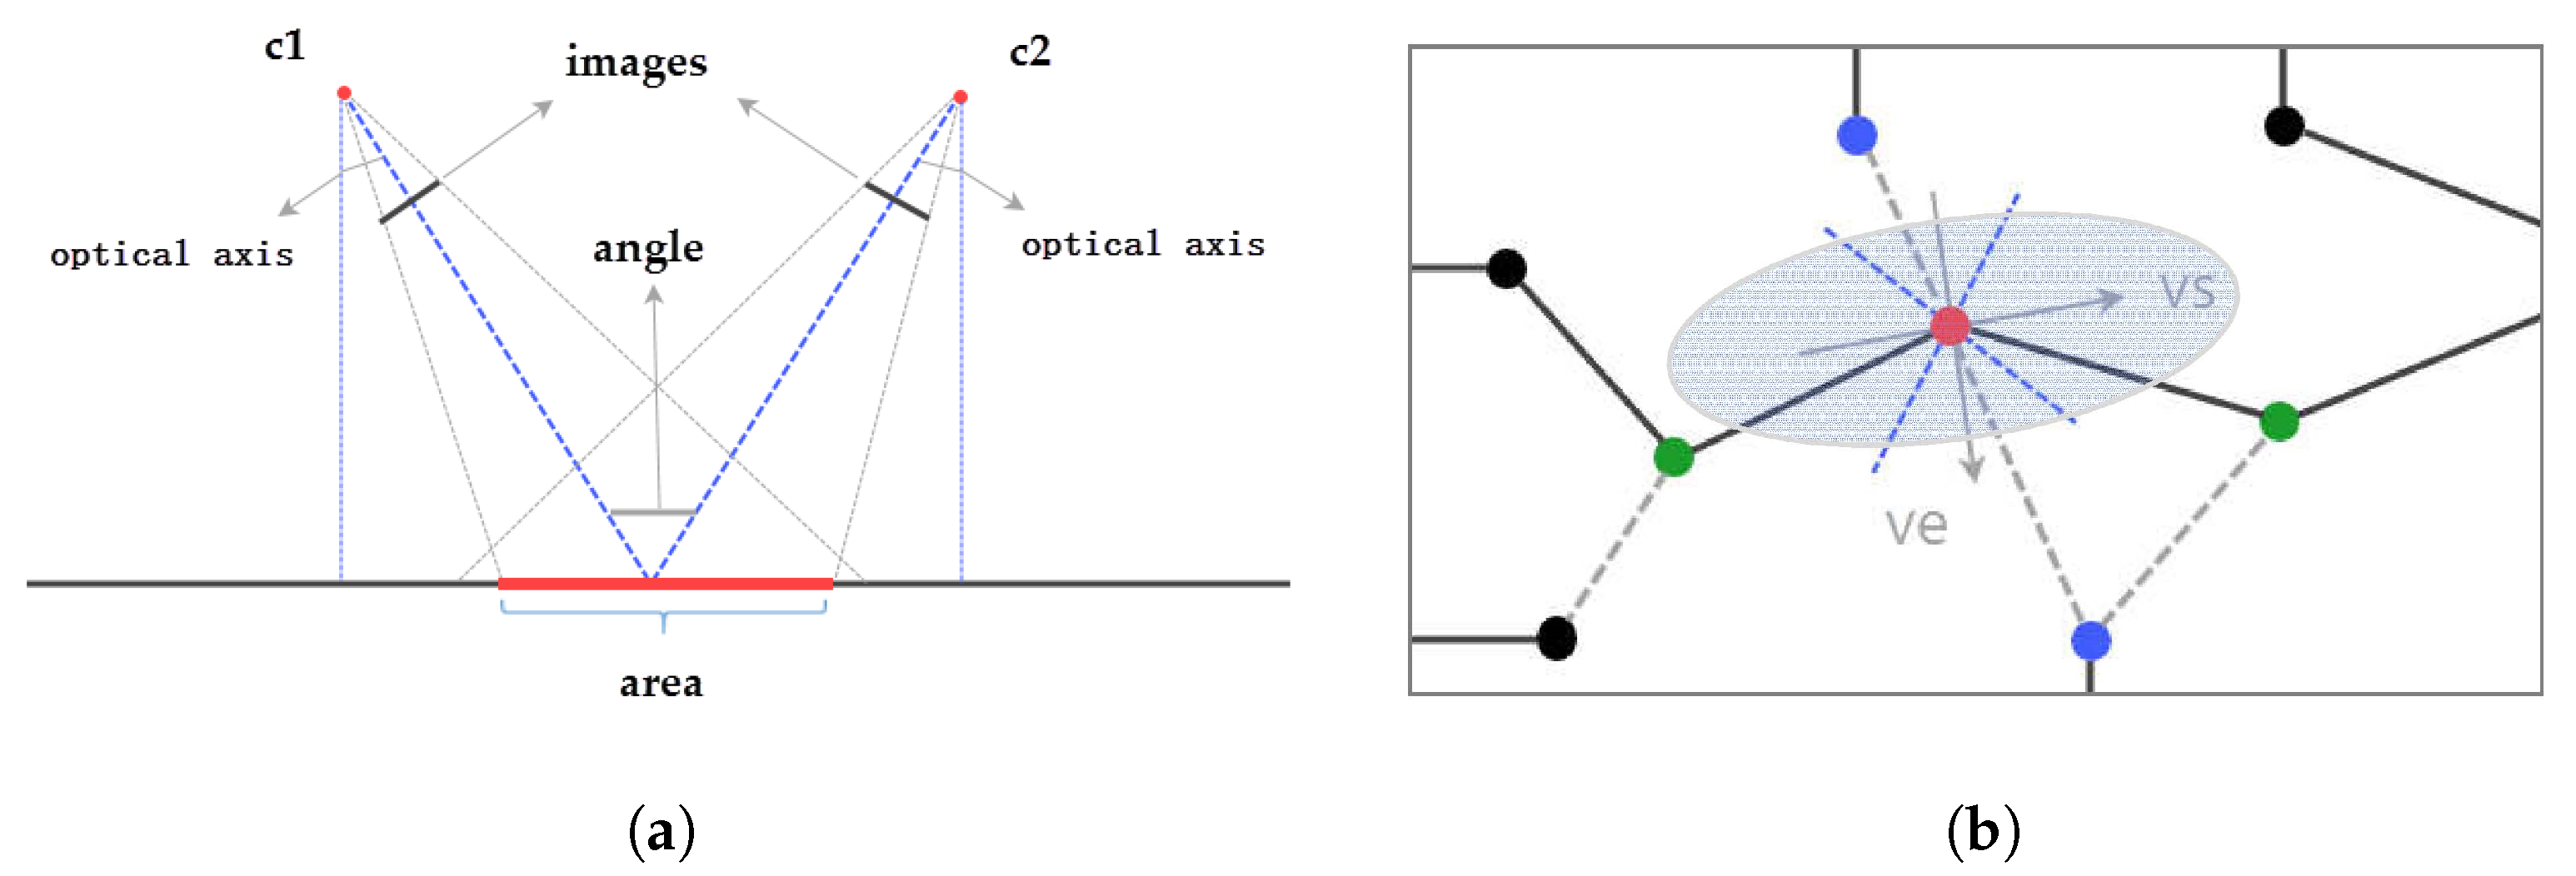
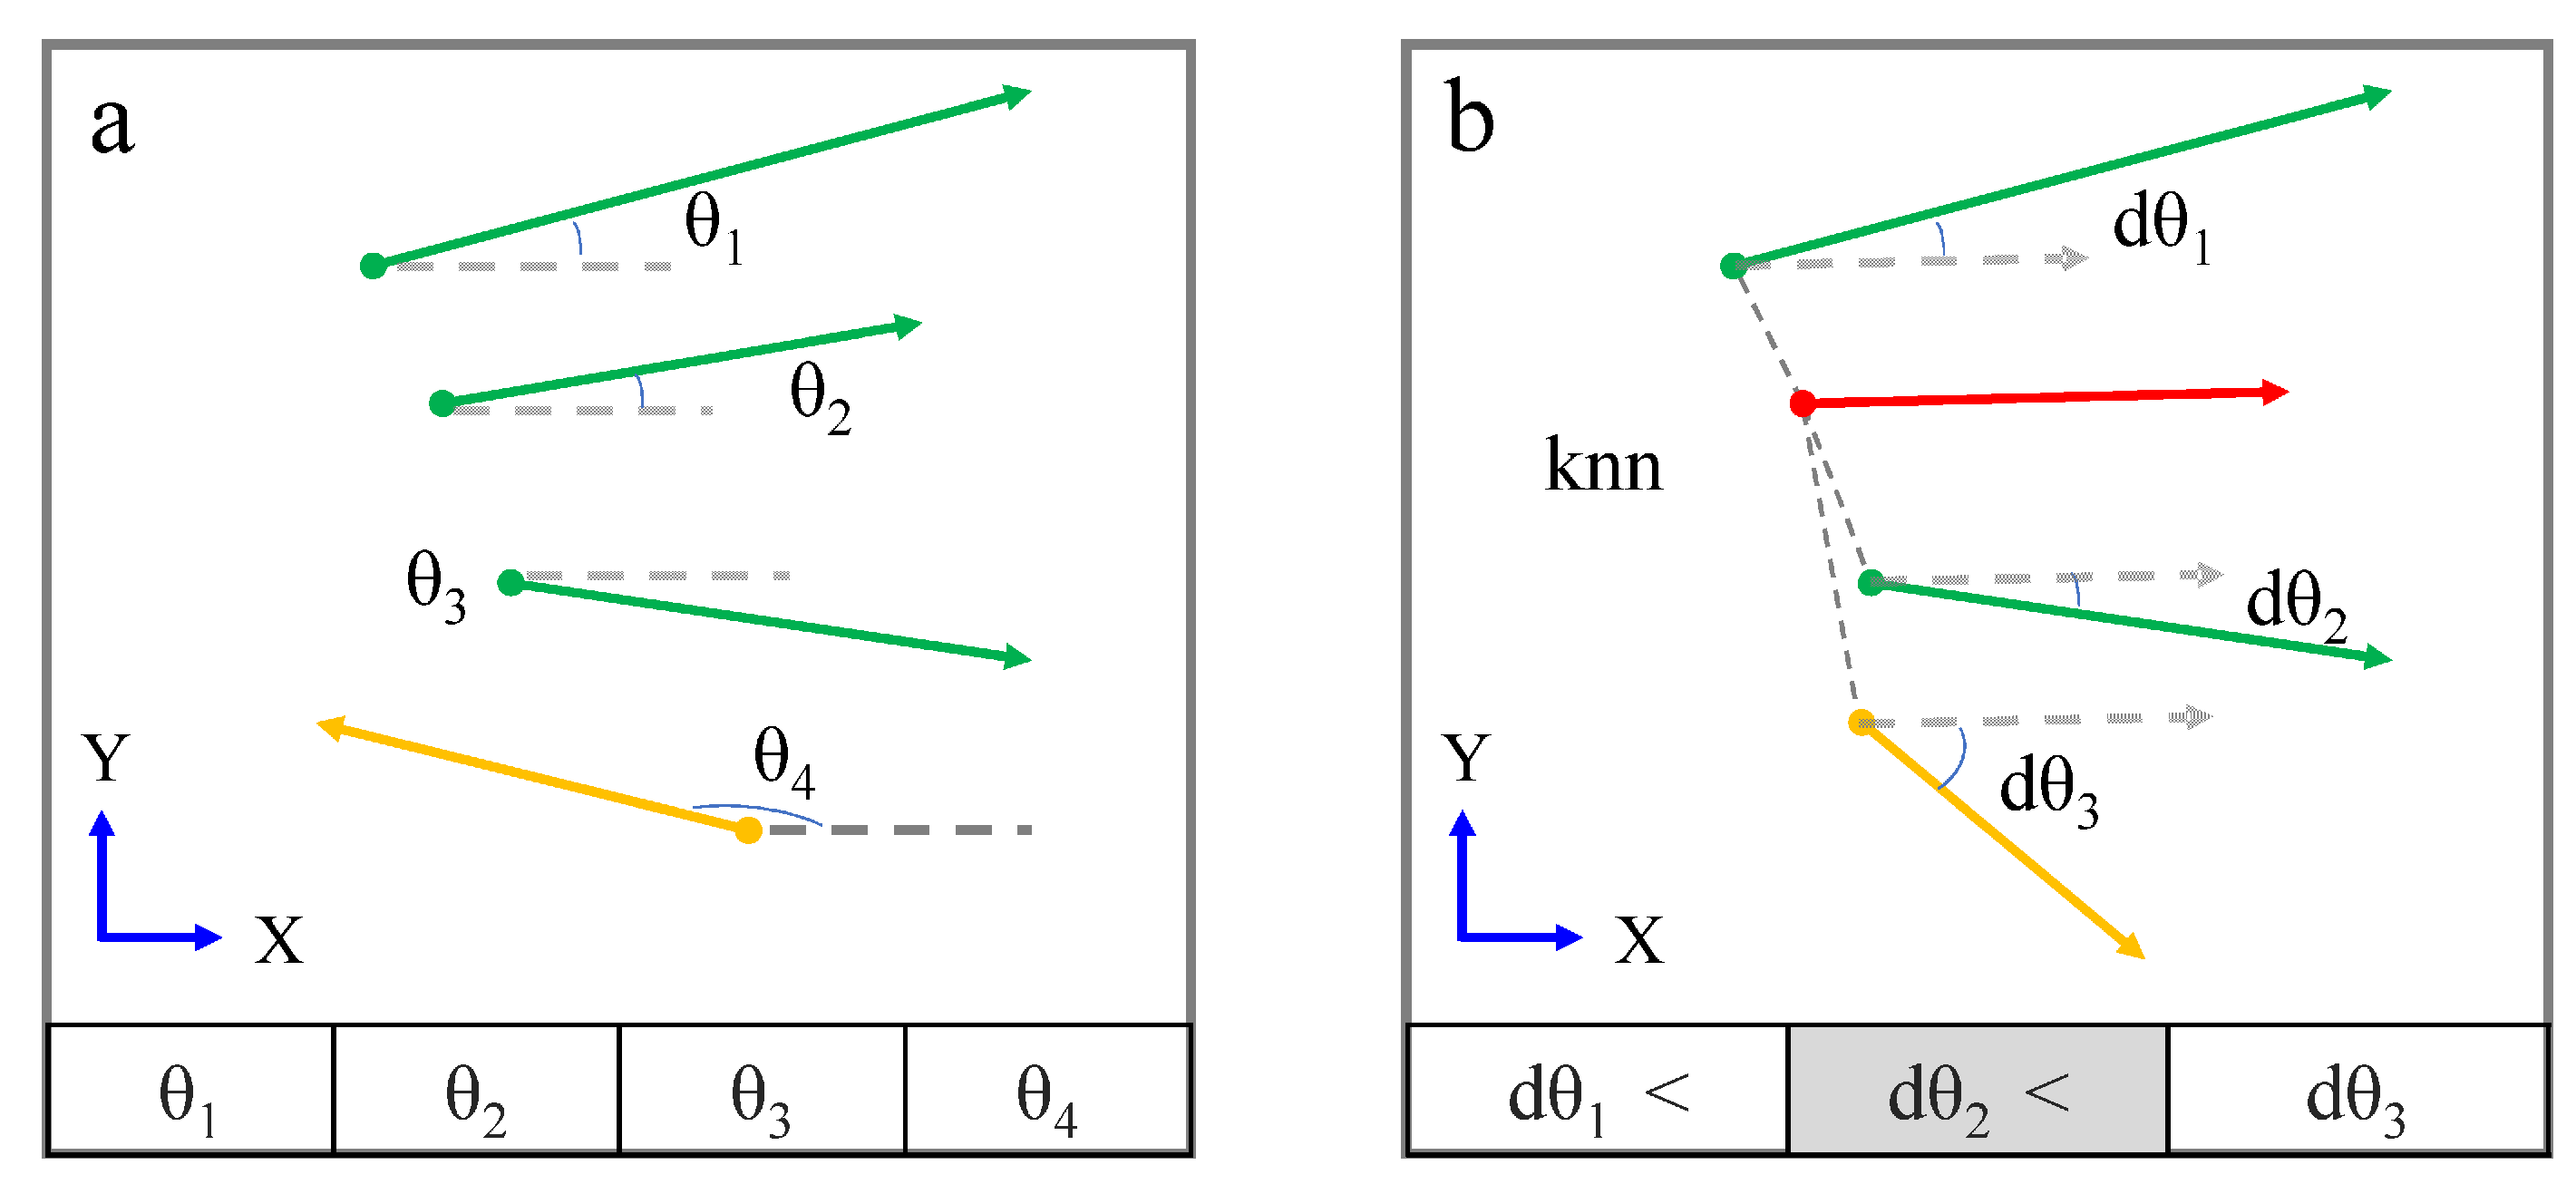
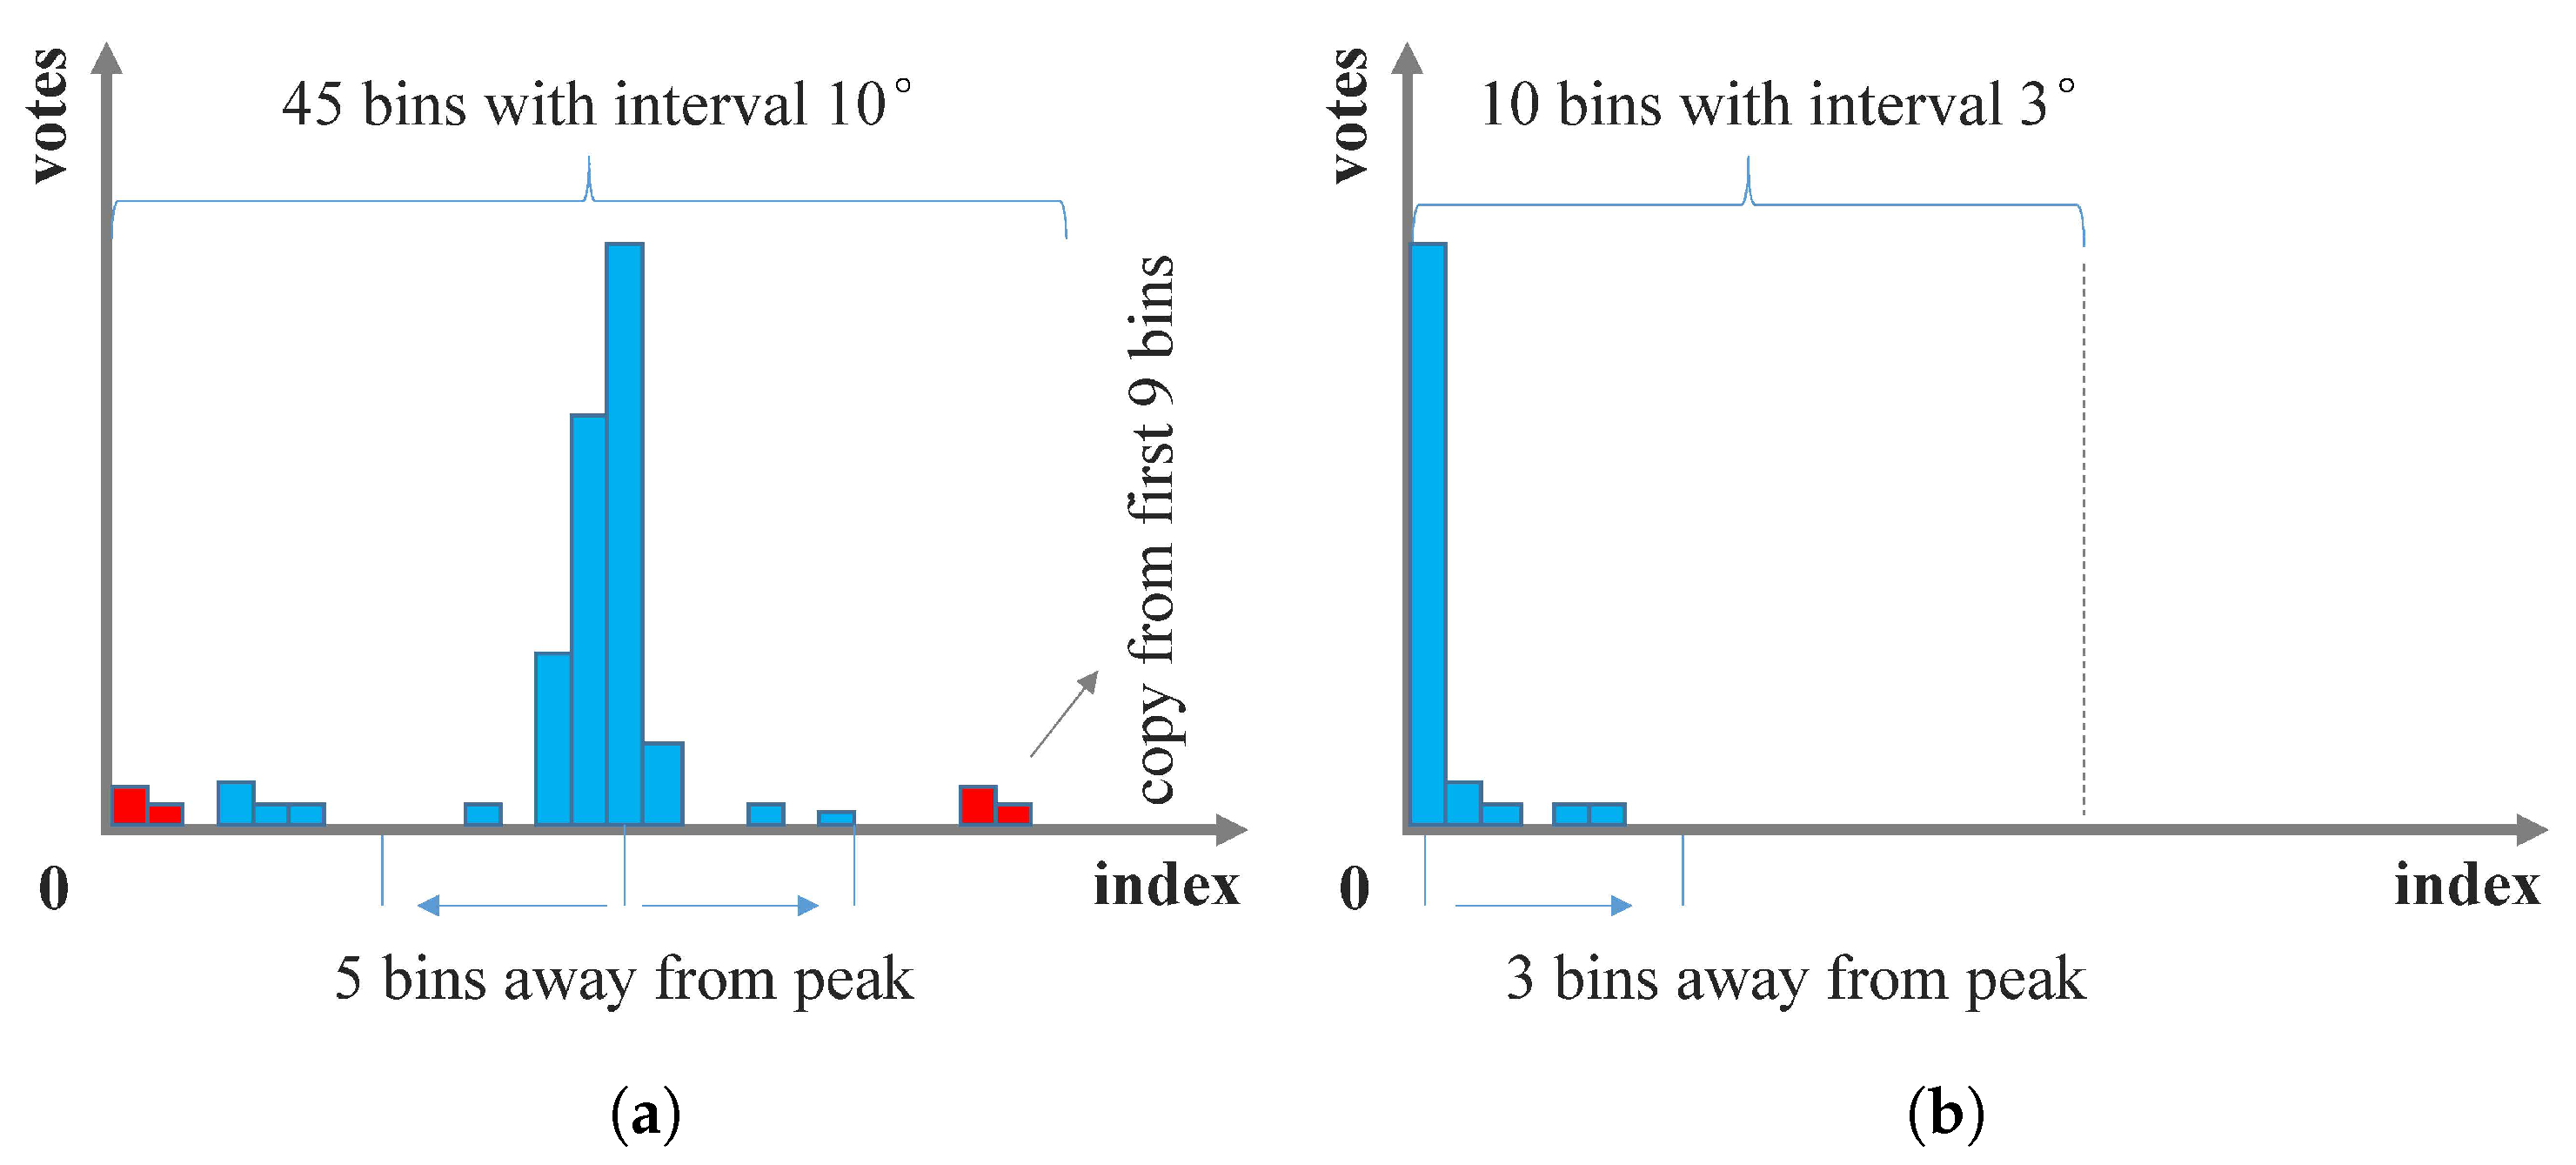
The HMCC algorithm is implemented through a hierarchical strategy. First, motions with abnormal directions are detected and corresponding matches are labeled as outliers based on the observation that directions of motions for true matches vary in a limited range; however, directions of motions for false matches would be random, as presented in Figure 3a; second, motions with abnormal direction change are found and corresponding matches are labeled as outliers based on the observation that direction change of motions for true matches varies in a limited range; however, direction change of motions for false matches would be random, as shown in Figure 3b; finally, the length of motions is used to detect false matches. Due to its robustness to outliers, the Hough voting scheme is used in the first and second steps of the HMCC. The processing of the voting scheme is illustrated in Figure 4, where Figure 4a,b is the voting based on motion direction and motion direction change, respectively. The configuration of the HMCC-RANSAC used in this study is listed in Table 3.
2.4. Integrated Solution for Efficient SfM
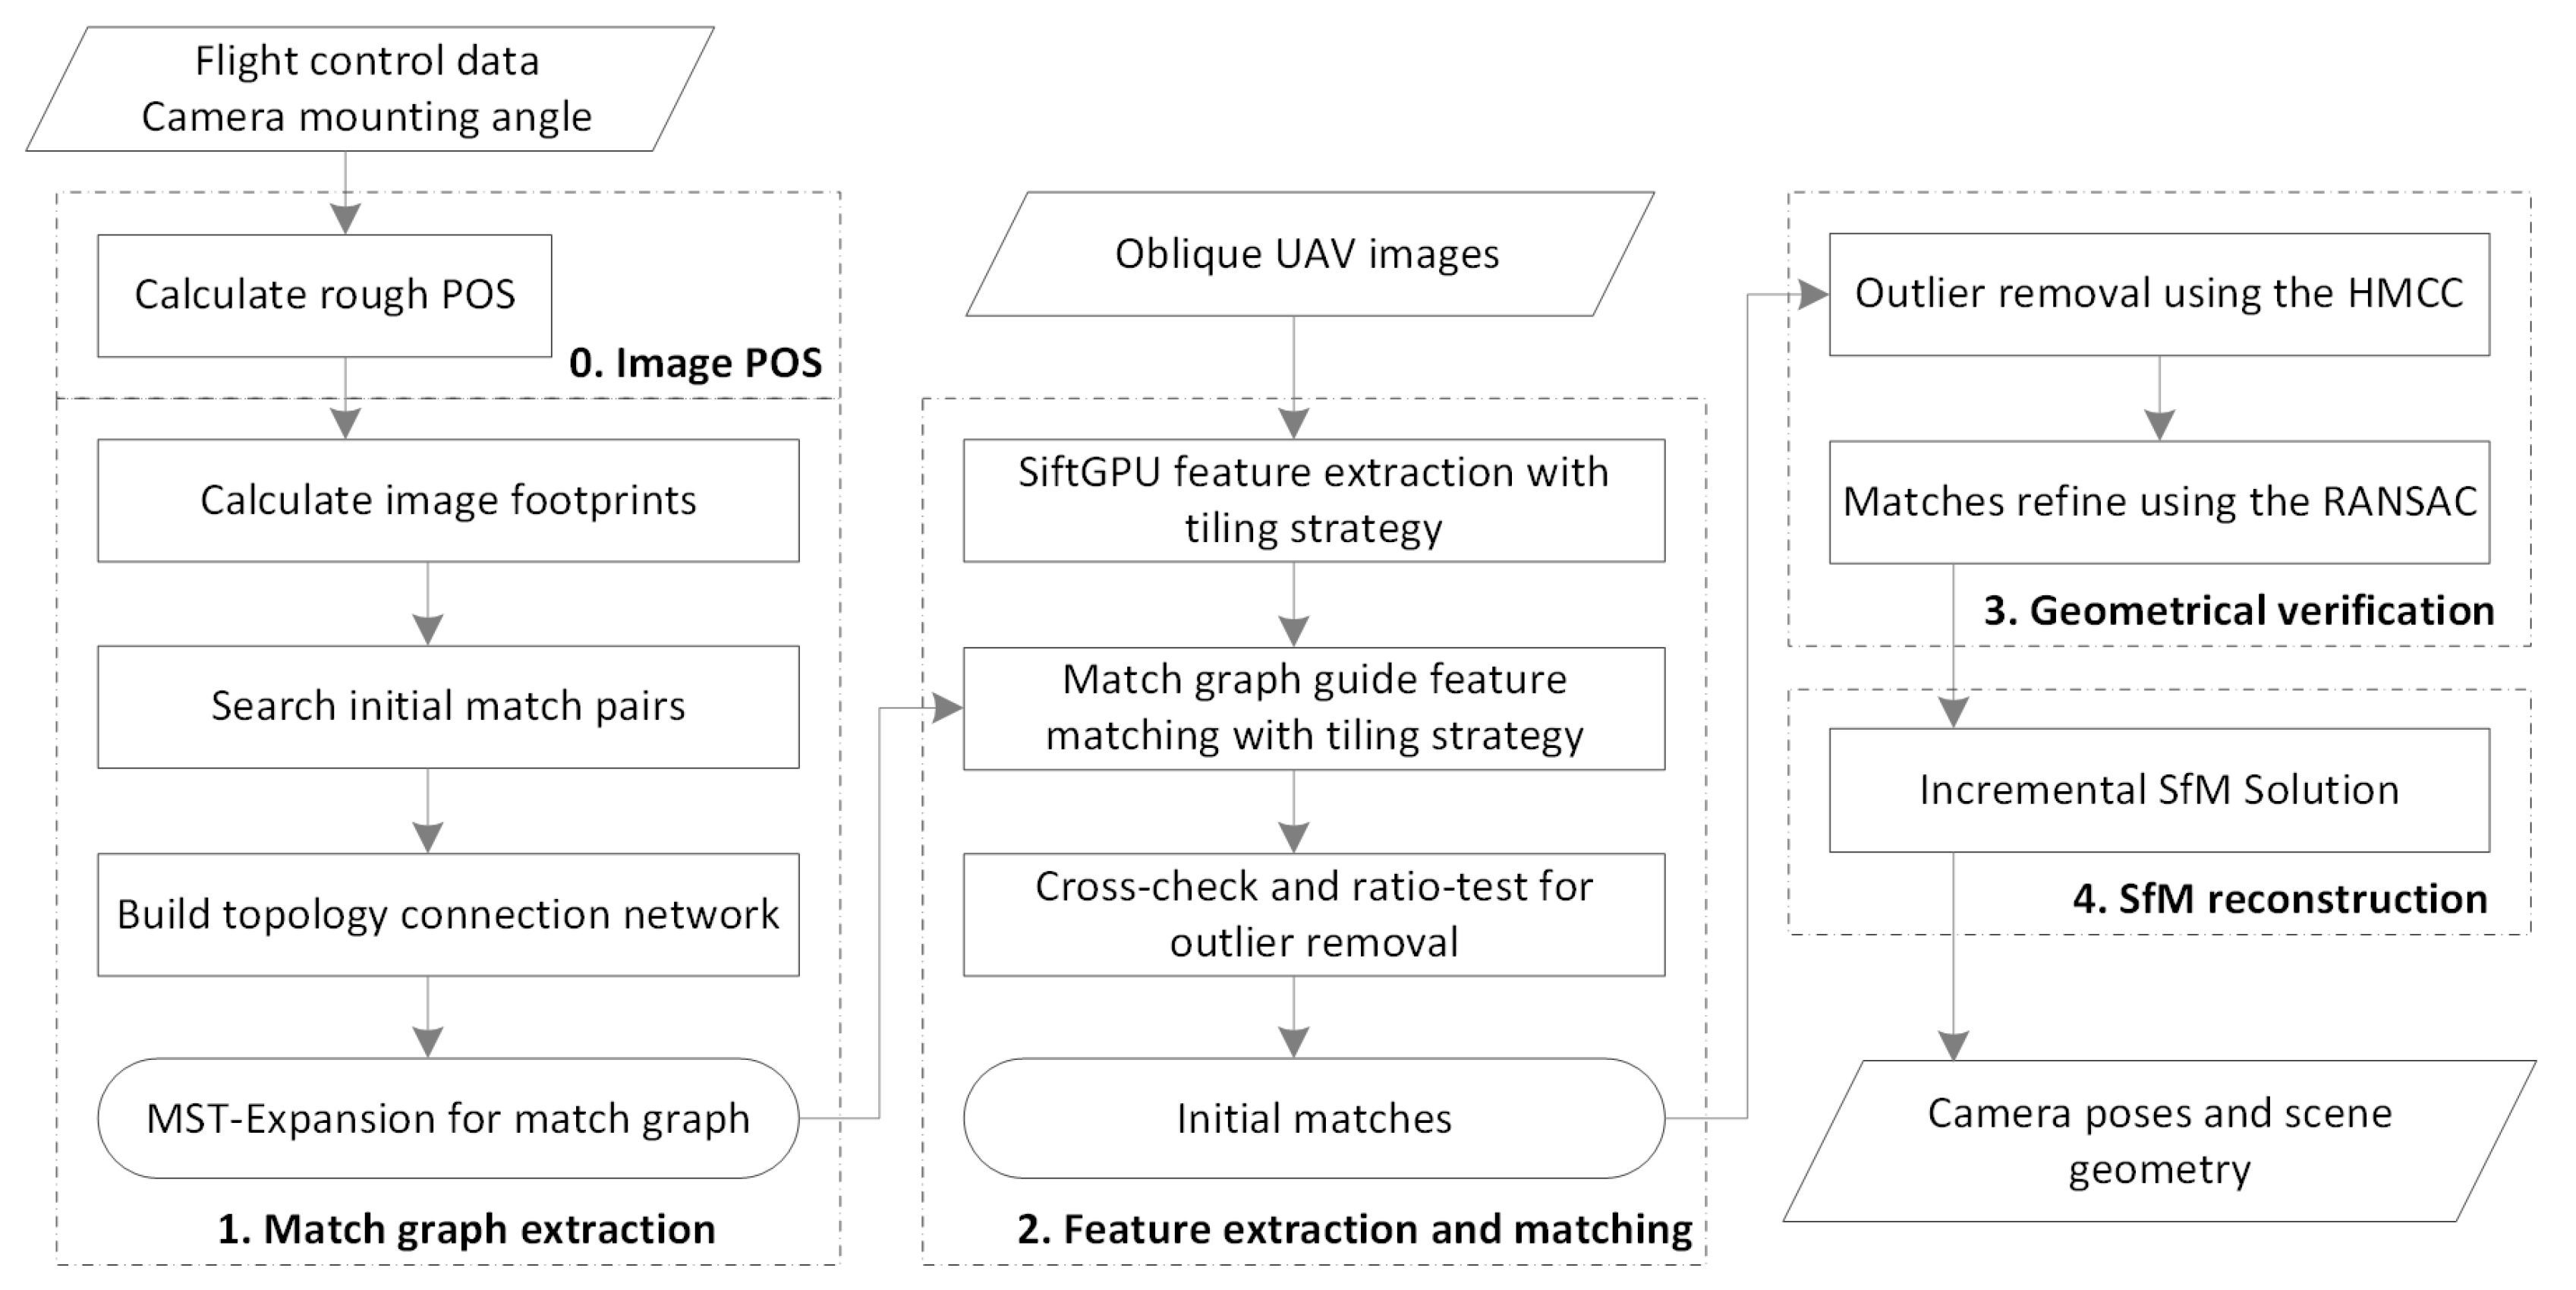
By using the strategies described in Section 2, this study constructs an integrated SfM solution for the efficient orientation of oblique UAV images, with consideration of match pair selection, feature extraction and matching, and geometrical verification. The solution is shown in Figure 5, which contains four major steps described as follows:
- (1)
- Match graph extraction. Image footprints are firstly calculated; then, initial match pairs are searched based on the overlap criterion, and image topology connection network is formed by using initial match pairs; finally, the image connection network is simplified through the MST-Expansion algorithm.
- (2)
- Feature extraction and matching. Features are extracted from each image by using the SiftGPU [22] open-source library. To avoid memory overflow caused by images with large size, the tiling strategy is utilized in feature extraction; to avoid time consumption caused by exhaustive matching, image pairs deduced from the previous step are used to guide feature matching.
- (3)
- Geometrical verification. First, obvious false matches are detected and removed by using the HMCC algorithm; second, the RANSAC-based rigorous geometrical verification is utilized to refine the final matches; finally, matched points corresponding to the same object locations are linked to generate tie-points, namely tracks.
- (4)
- SfM reconstruction. The problem of recovering camera poses and scene geometry is formulated as a joint minimization problem, where the sum of errors between projections of tracks and the corresponding image points is minimized, as presented by Equation (1):where and denote a 3D point and a camera, respectively; is the predicted projection of point on camera ; is the observed image point; denotes the L2-norm; is an indicator function with if point is visible in camera ; otherwise, . The problem is solved using the open-source nonlinear optimization library Ceres Solver [36]. Because good initial values of unknown parameters are essential to ensure the globally optimal solution, an incremental SfM pipeline, similar to Snavely et al. [37], is used in this study. Therefore, based on the above four major steps, this study proposes the integrated SfM solution to achieve efficient orientation for oblique UAV images.
3. Experimental Results
In the experiments, four datasets are used to evaluate the proposed SfM solution. Image match pairs are firstly selected using the MST-Expansion algorithm; then, feature extraction and matching are conducted, which is guided by the selected image pairs; subsequently, the HMCC-RANSAC algorithm is adopted for geometrical verification of initial candidate matches, whose performance would be compared with two current state-of-the-art, namely LO-RANSAC [38], and GC-RANSAC [28]; finally, refined feature matches are tracked and used in an incremental SfM. In order to assess the performance of the proposed SfM solution, comparison tests are conducted with two software packages, including the open-source toolkit MicMac [39] and the commercial package Agisoft PhotoScan [40] (version 1.4.1, manufactured by Agisoft LLC, Russia), in terms of efficiency, completeness, and accuracy. All experiments are conducted on a Windows PC with a 3.4 GHz Intel Core i7-4770 CPU (manufactured by Micro-Star corporation at Shenzhen, China) and a 2 GB GeForce GTX 770M graphic card (manufactured by Nvidia, Santa Clara, CA, USA).
3.1. Datasets
The detailed information for data acquisition of the four test sites is presented in Table 4. The four datasets are collected from different regions: the majority region of the first dataset is covered by low-height vegetation and crossed by some railroad tracks; the second dataset is a farmland, which features repetitive texture patterns; the third site is located in a shopping plaza and surrounded by high residual buildings; and the last site is a suburban area with some low buildings surrounded by bare-earth lands.
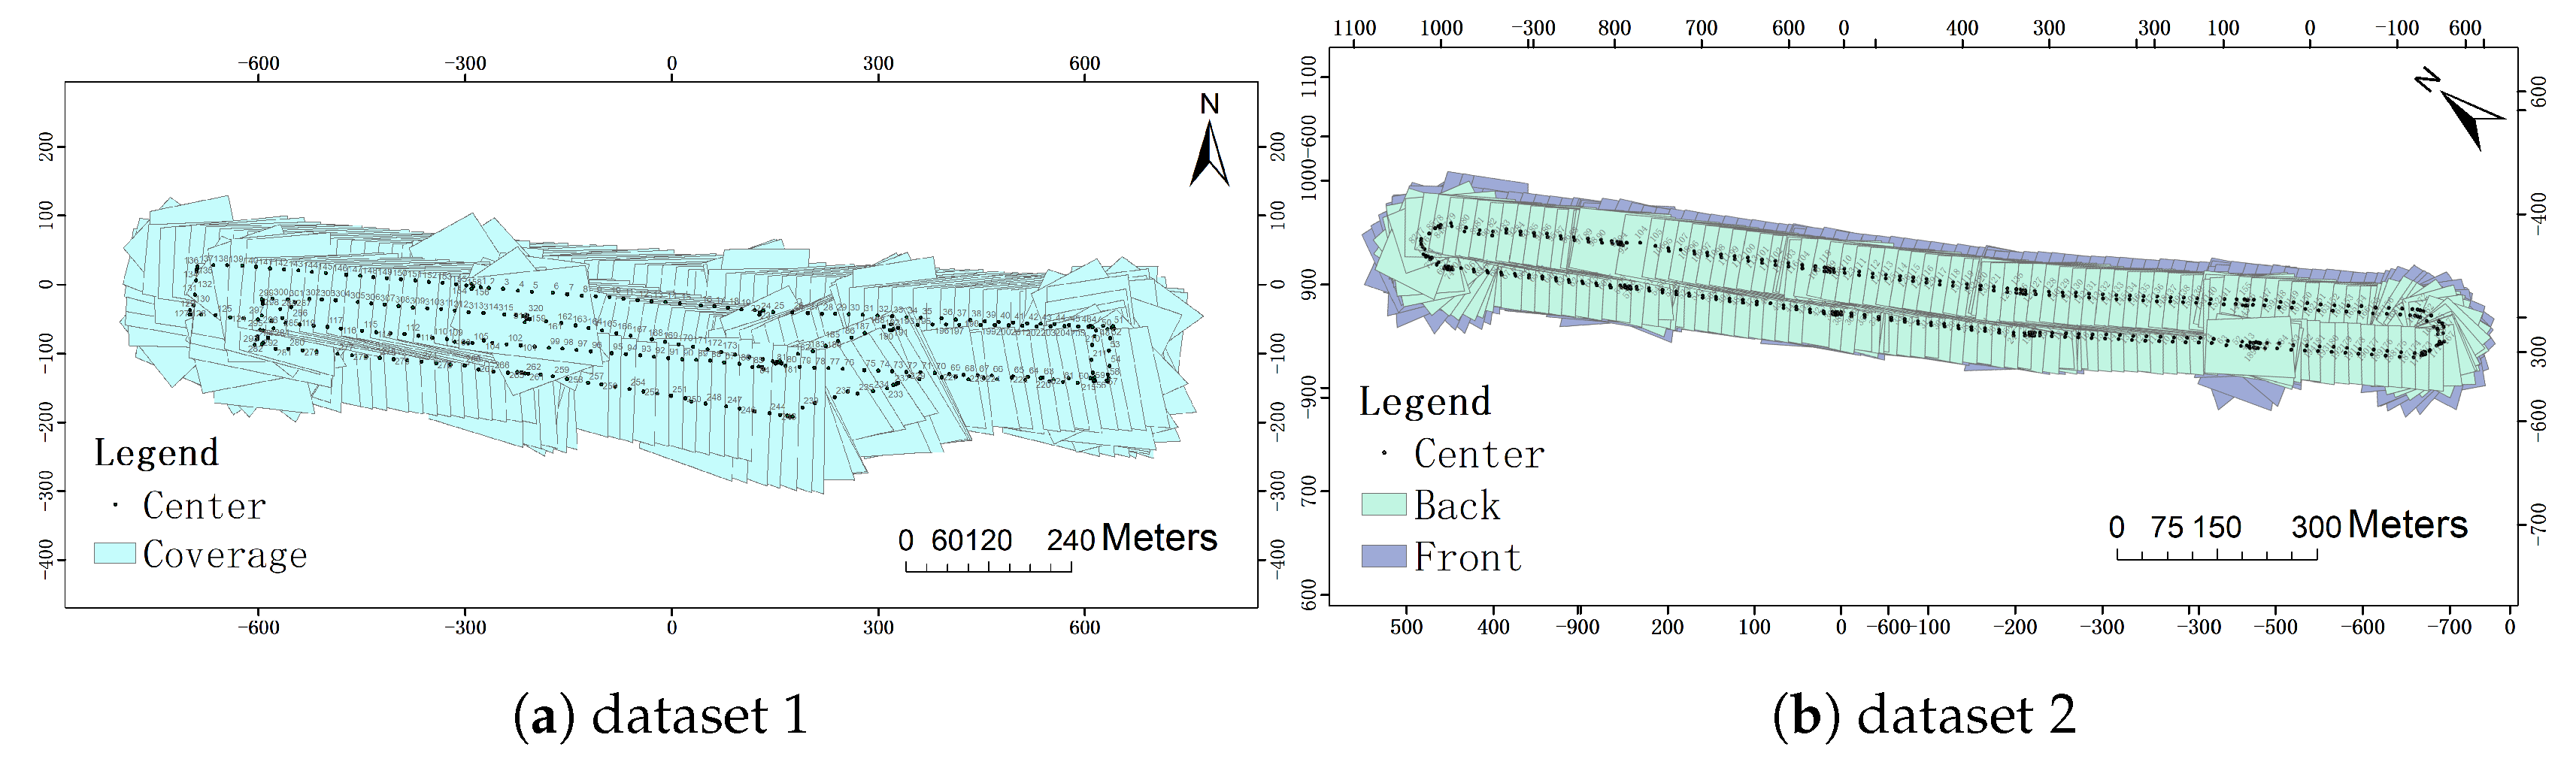
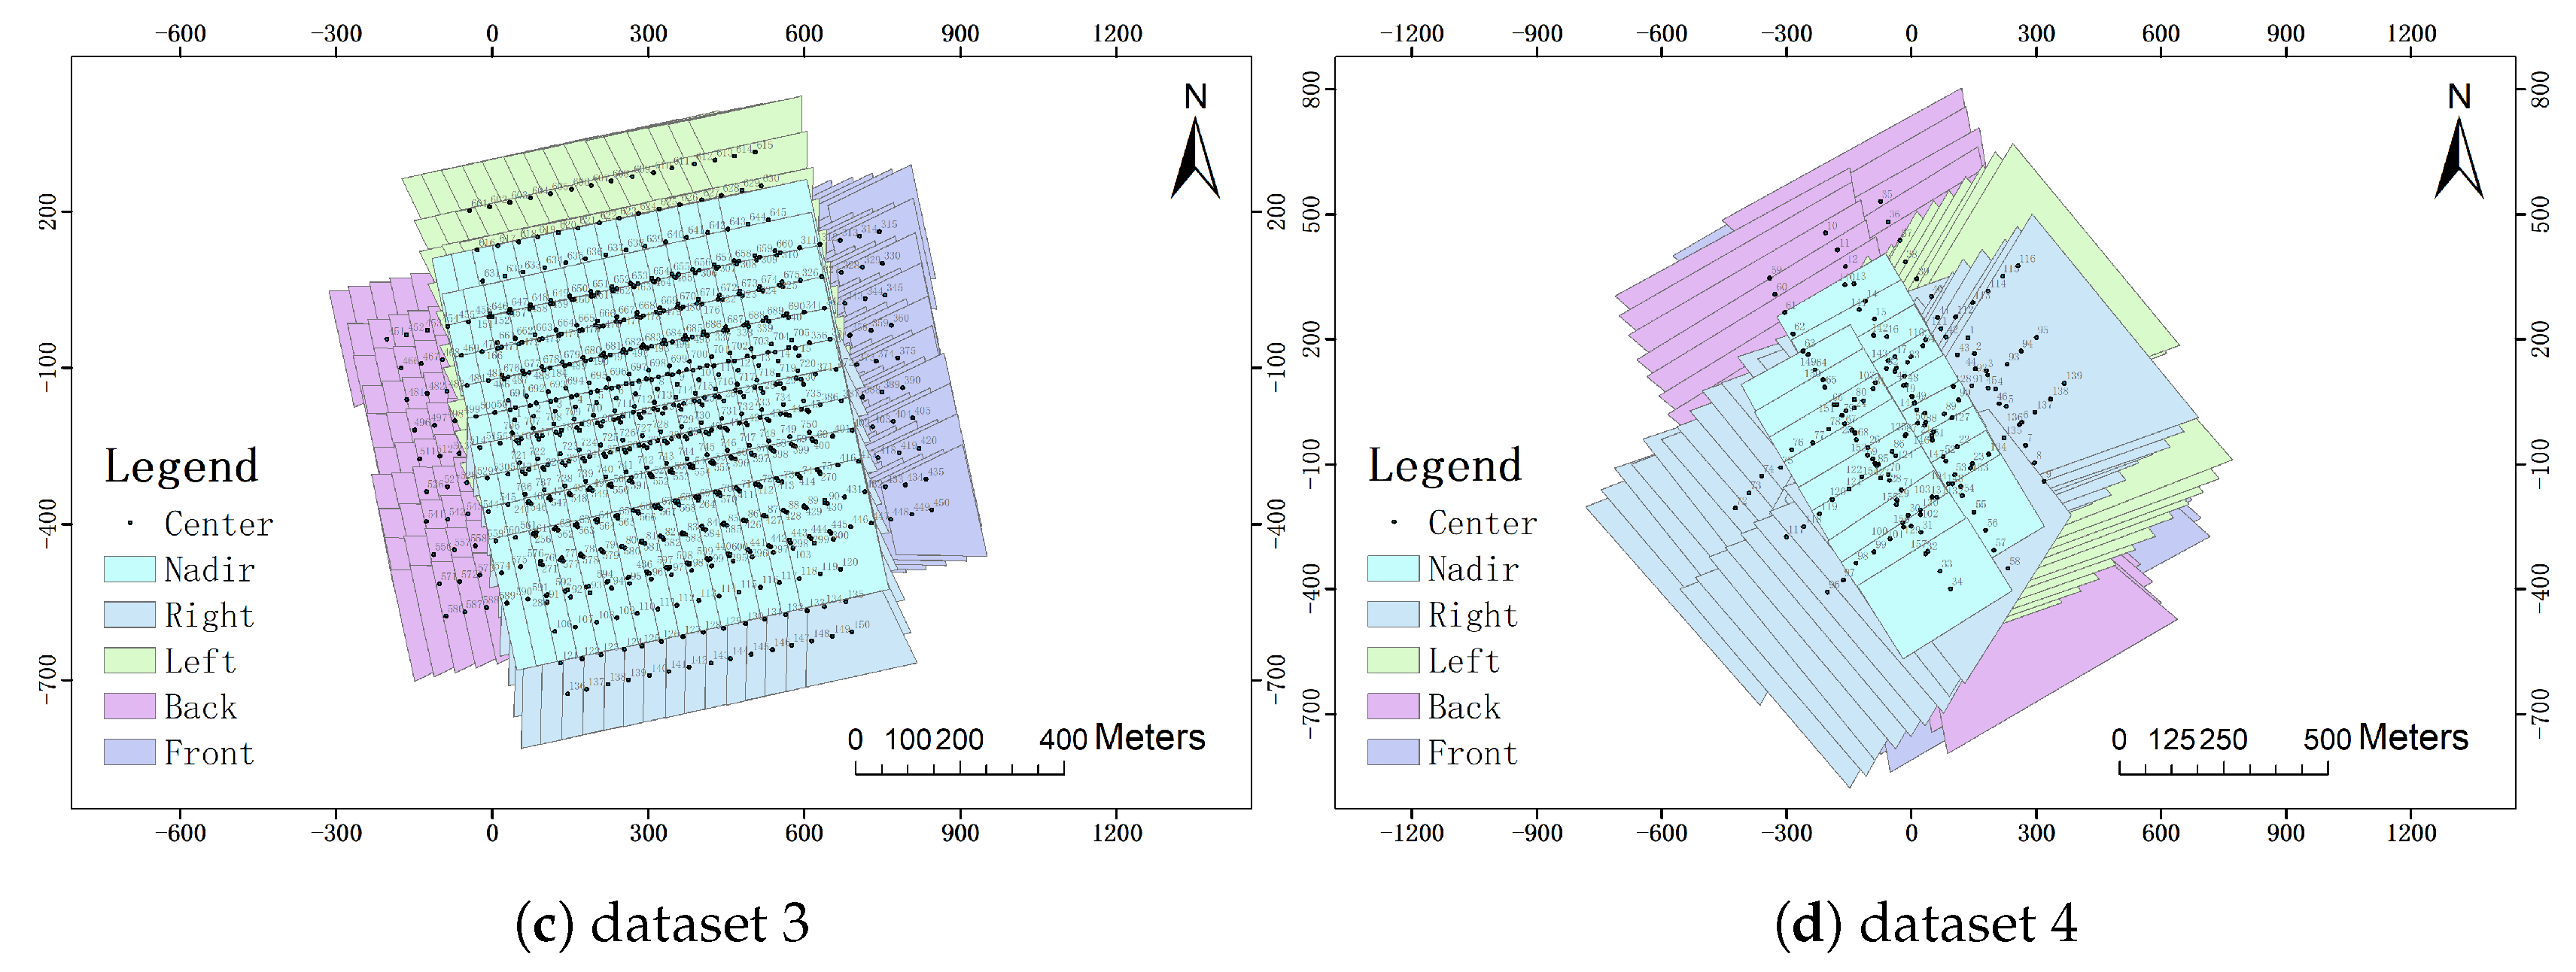
For outdoor data acquisition, a multi-rotor UAV is adopted in this study, and four oblique photogrammetric systems are designed and used for the four test sites. For dataset 1, the pitch and roll angles of the camera are respectively configured as 25 and −15, and 320 images with GSD (Ground Sampling Distance) 5.05 cm are collected under the flight height of 165 m; for dataset 2, two Sony RX1R cameras, 25 and −15 installation angles for the front one and 0 and −25 for the back one, are used for data acquisition under the flight of 120 m; for test site 3, a classical pent-view imaging system is adopted with the 45 tiling angle for oblique cameras, and the total number of images is 750 under the flight height of 175 m; for the last test site, only one Sony ILCE-7R camera is adopted, and two individual campaigns are used to simulate the data acquisition of a pent-view system. Using flight control data and camera mount angles, rough POS of images can be calculated, and image footprints are determined, as illustrated in Figure 6.
3.2. Performance Evaluation of Individual Steps
The performance of the overall workflow would be evaluated from aspects of match pair selection, feature extraction and matching, and geometrical verification. For all experiments, the parameters of each algorithm or strategy used in this study are listed in Section 2. Based on the established processing pipeline presented in Figure 5, these three steps are sequentially conducted and evaluated by using the four datasets.
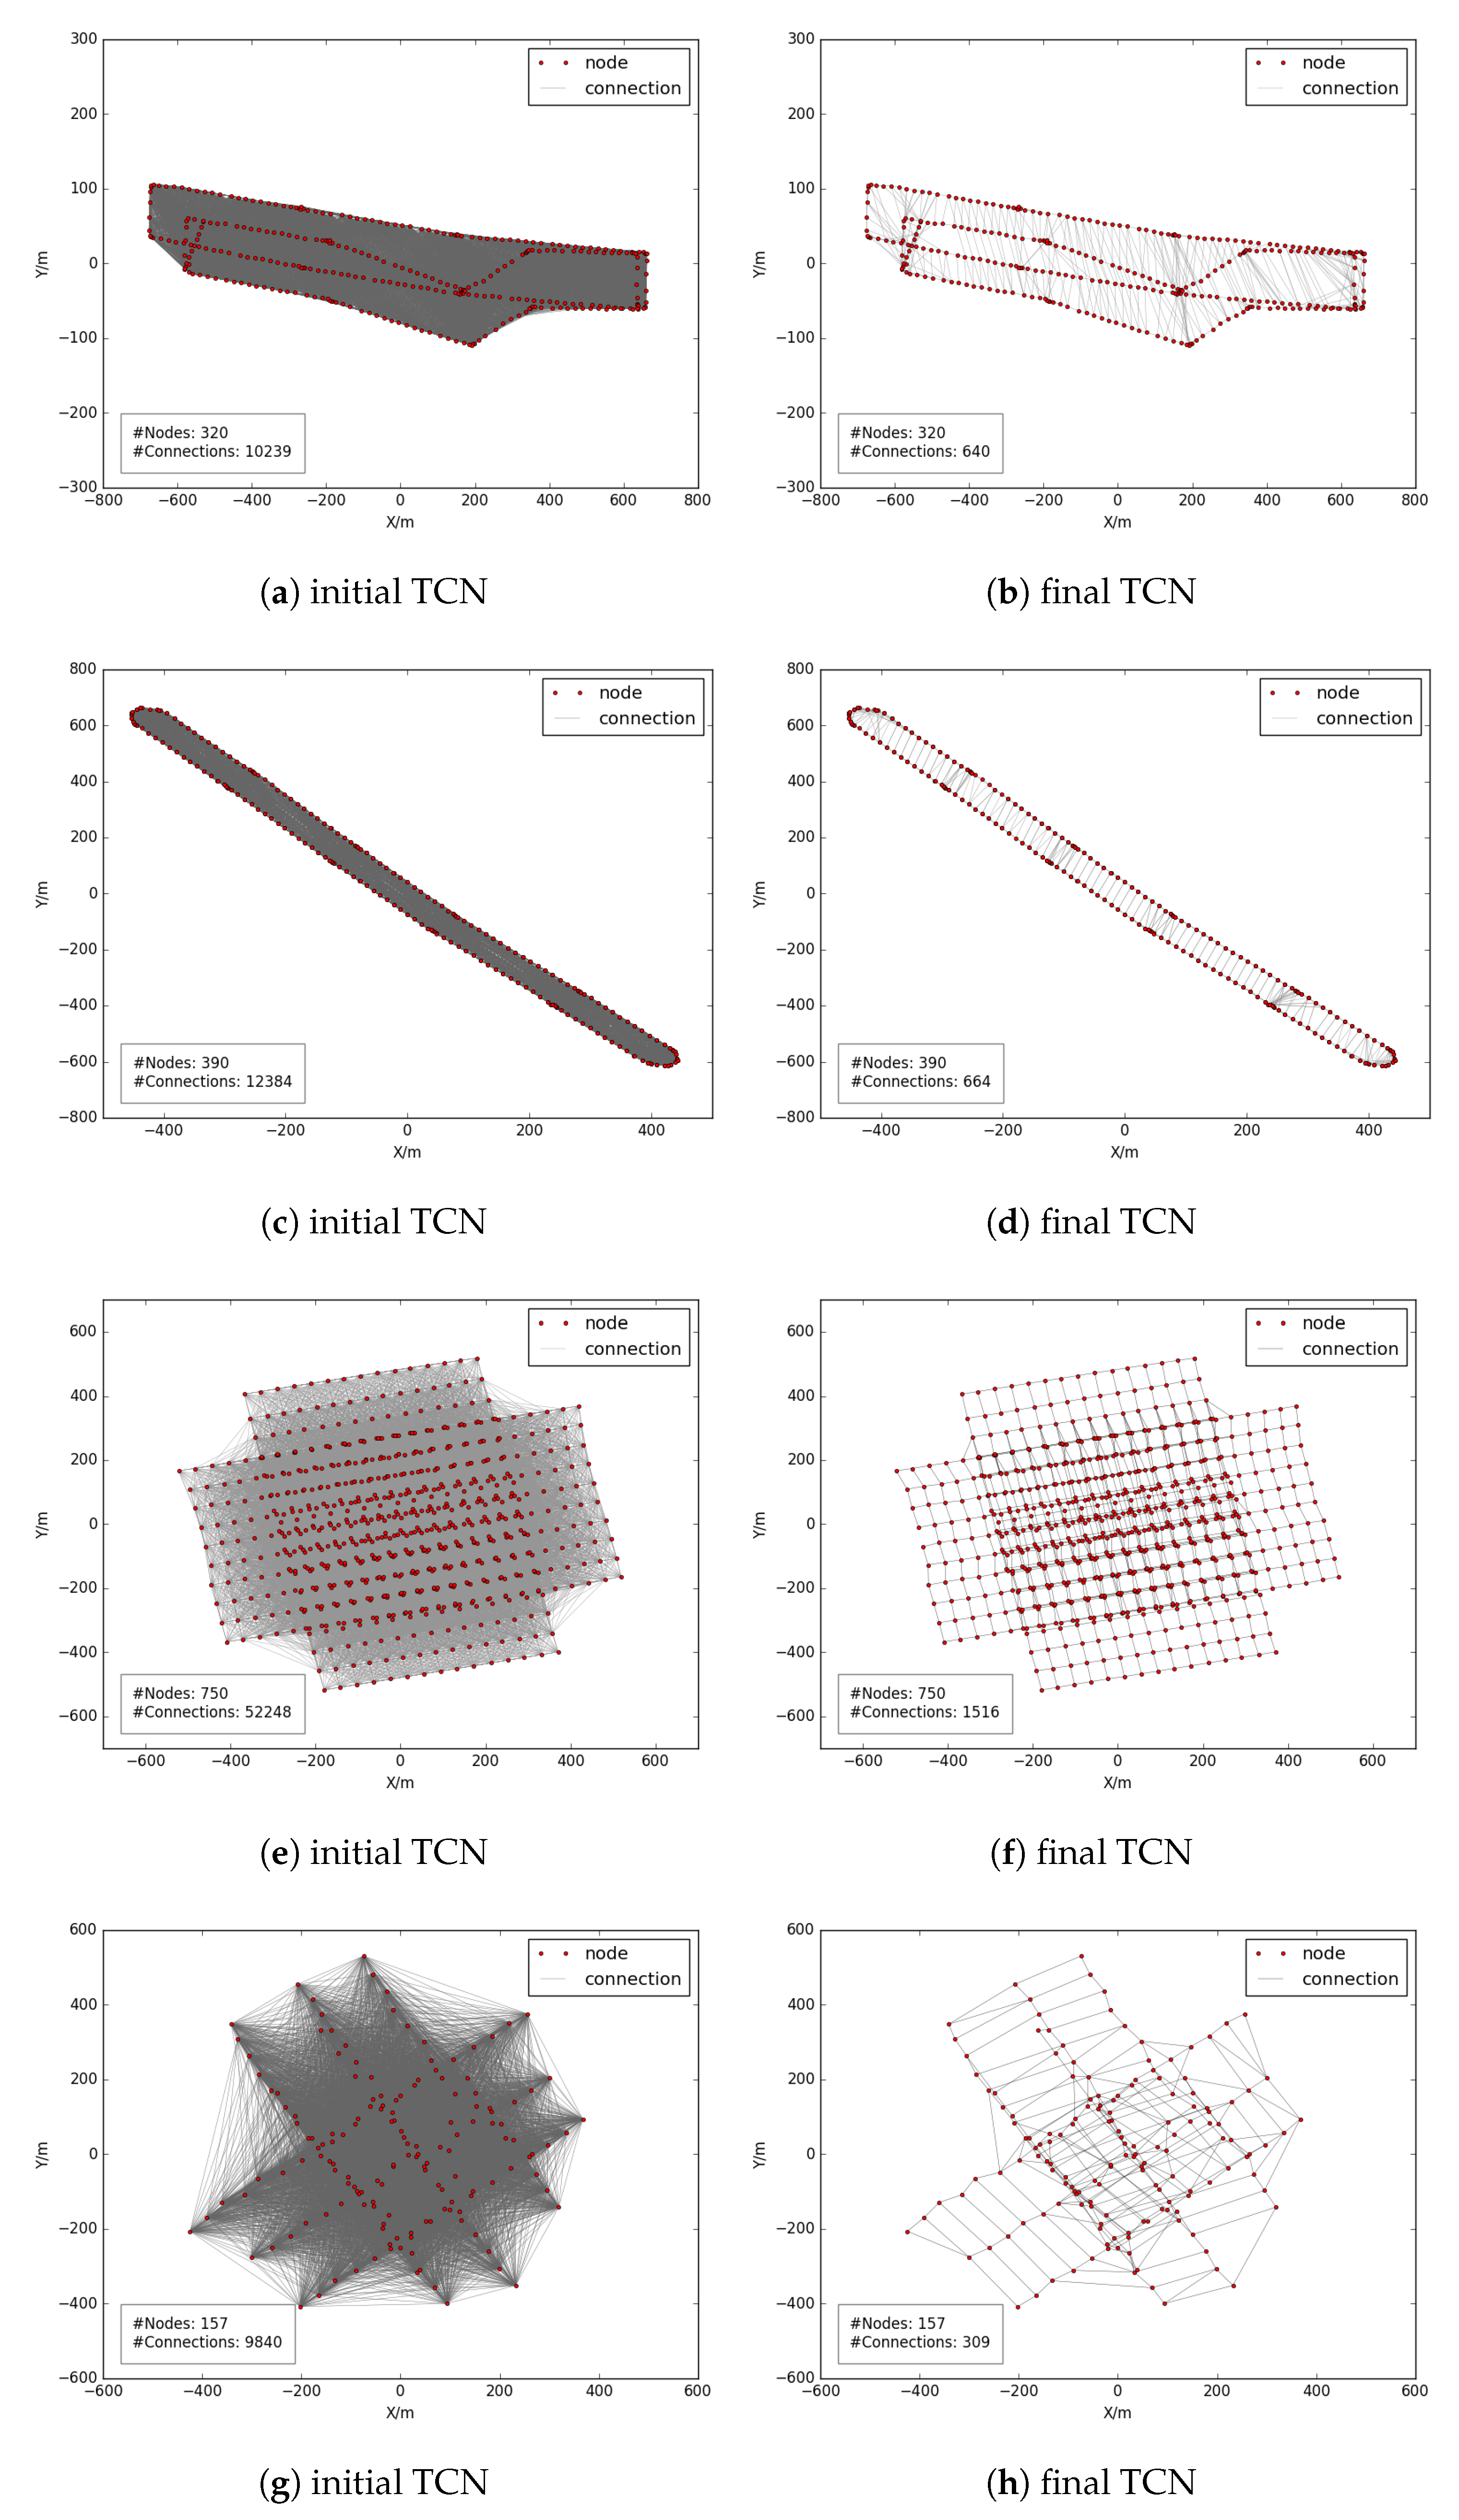
After initial candidate matches are selected based on intersection tests, image topology connection network is constructed with edge weights calculated by using overlap area and intersection angle as shown in Figure 7, where Figure 7a,c,e,g is the initial TCN of dataset 1, 2, 3 and 4, respectively. We can observe that the number of connected edges for each vertex is too excessive, which can be deduced from dense gray lines between red dots. In other words, vast redundant match pairs exist even with the simplification by using the overlap criterion. Therefore, the MST-Expansion algorithm is designed for the further simplification of the TCN, which results in the final match graph as illustrated in Figure 7b,c,f,h for the four datasets, respectively. Under the parameter configuration listed in Table 1, there are 640, 664, 1516 and 309 match pairs survived from the MST-Expansion algorithm. Compared with the numbers of initial pairs with 10,239, 12,384, 52,248 and 9840, the simplification ratio of the number of match pairs is 16, 19, 35 and 32 for the four datasets, respectively. Thus, the first step of the proposed workflow can dramatically decrease the number of image pairs in feature matching.
The image pairs can be used to guide feature matching. First, feature extraction is performed for each image by using the SiftGPU [22] library. In order to relieve the effects of image down-sampling, the tiling strategy is utilized in feature extraction, which can increase both the number and the accuracy of extracted SIFT features. Second, feature matching is conducted for two sets of features based on the smallest Euclidean distance criterion. Similarly, the tiling strategy is also used to improve the number and distribution of matched features.
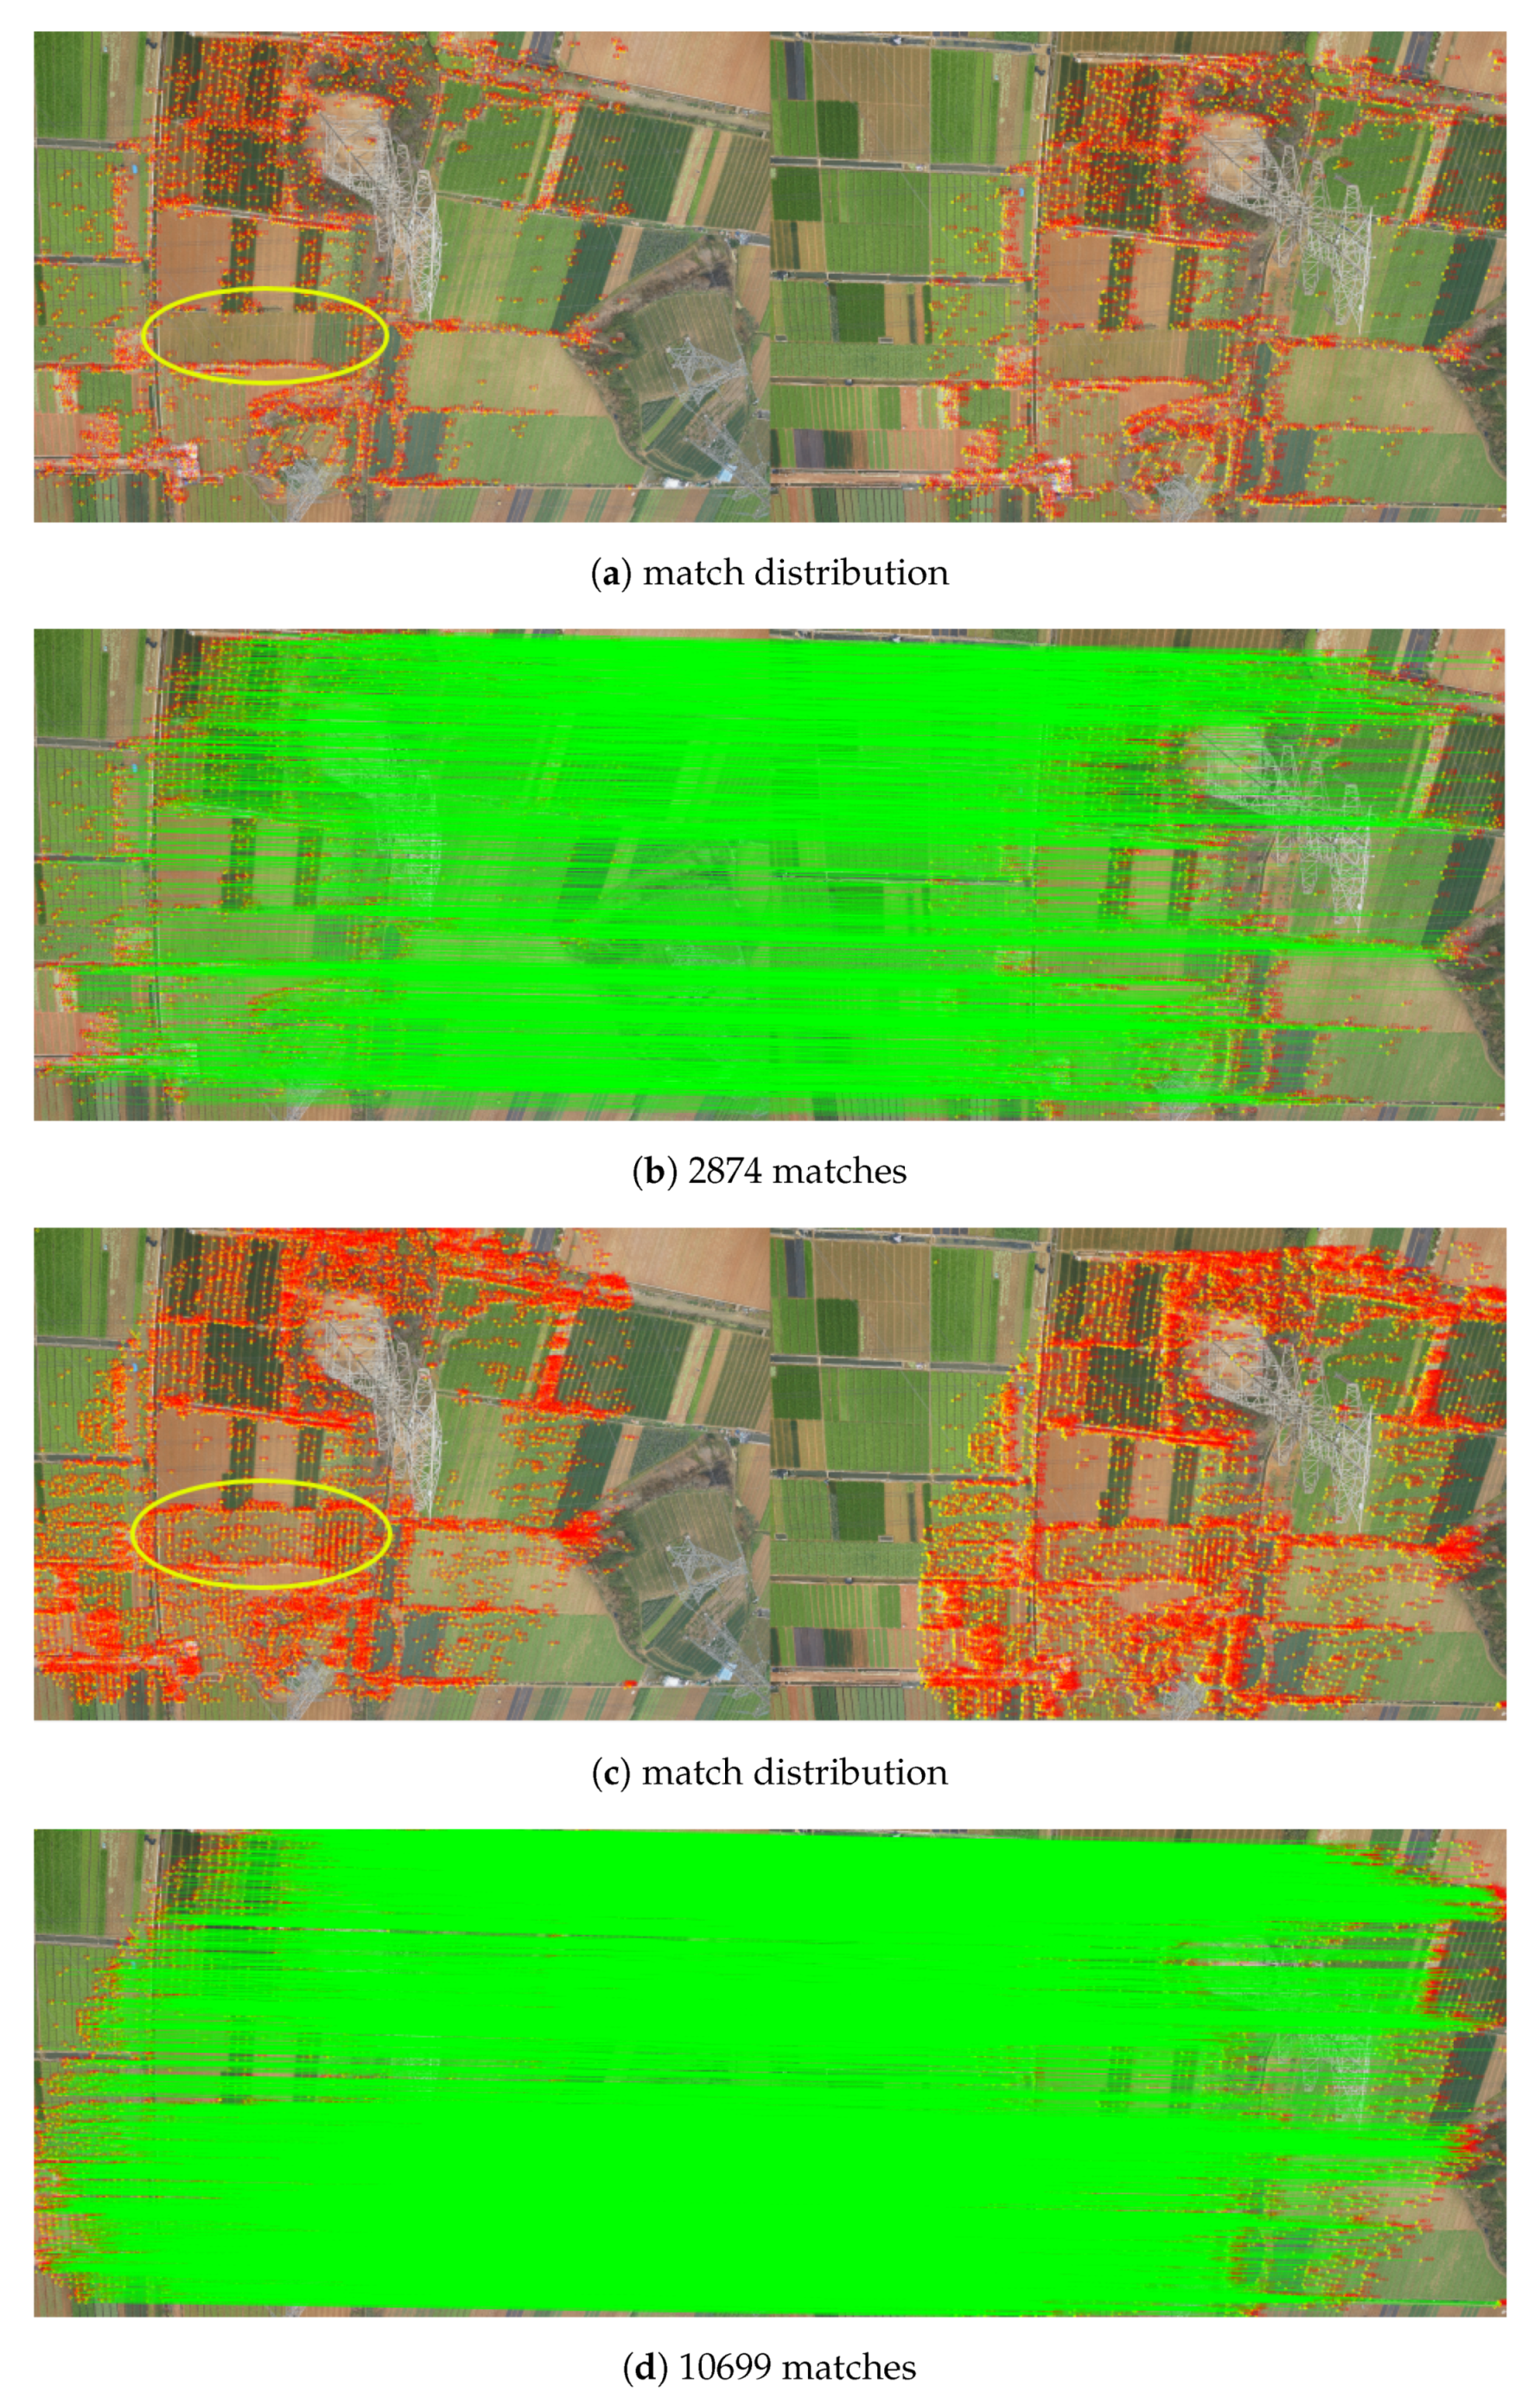
Figure 8 shows the match result of one image pair from dataset 2, where Figure 8a,c are the distribution of matches, and Figure 8b,d are matches linked by green lines. Because of the almost same viewing direction, the number of matched features is 2874 without using the tiling strategy, as shown in Figure 8a,b. By using the tiling strategy, there are 10,699 matches extracted from the same image pairs, as shown in Figure 8c,d, and both the number and distribution of matches are improved, especially for some regions with repetitive patterns as shown in the yellow ellipses.
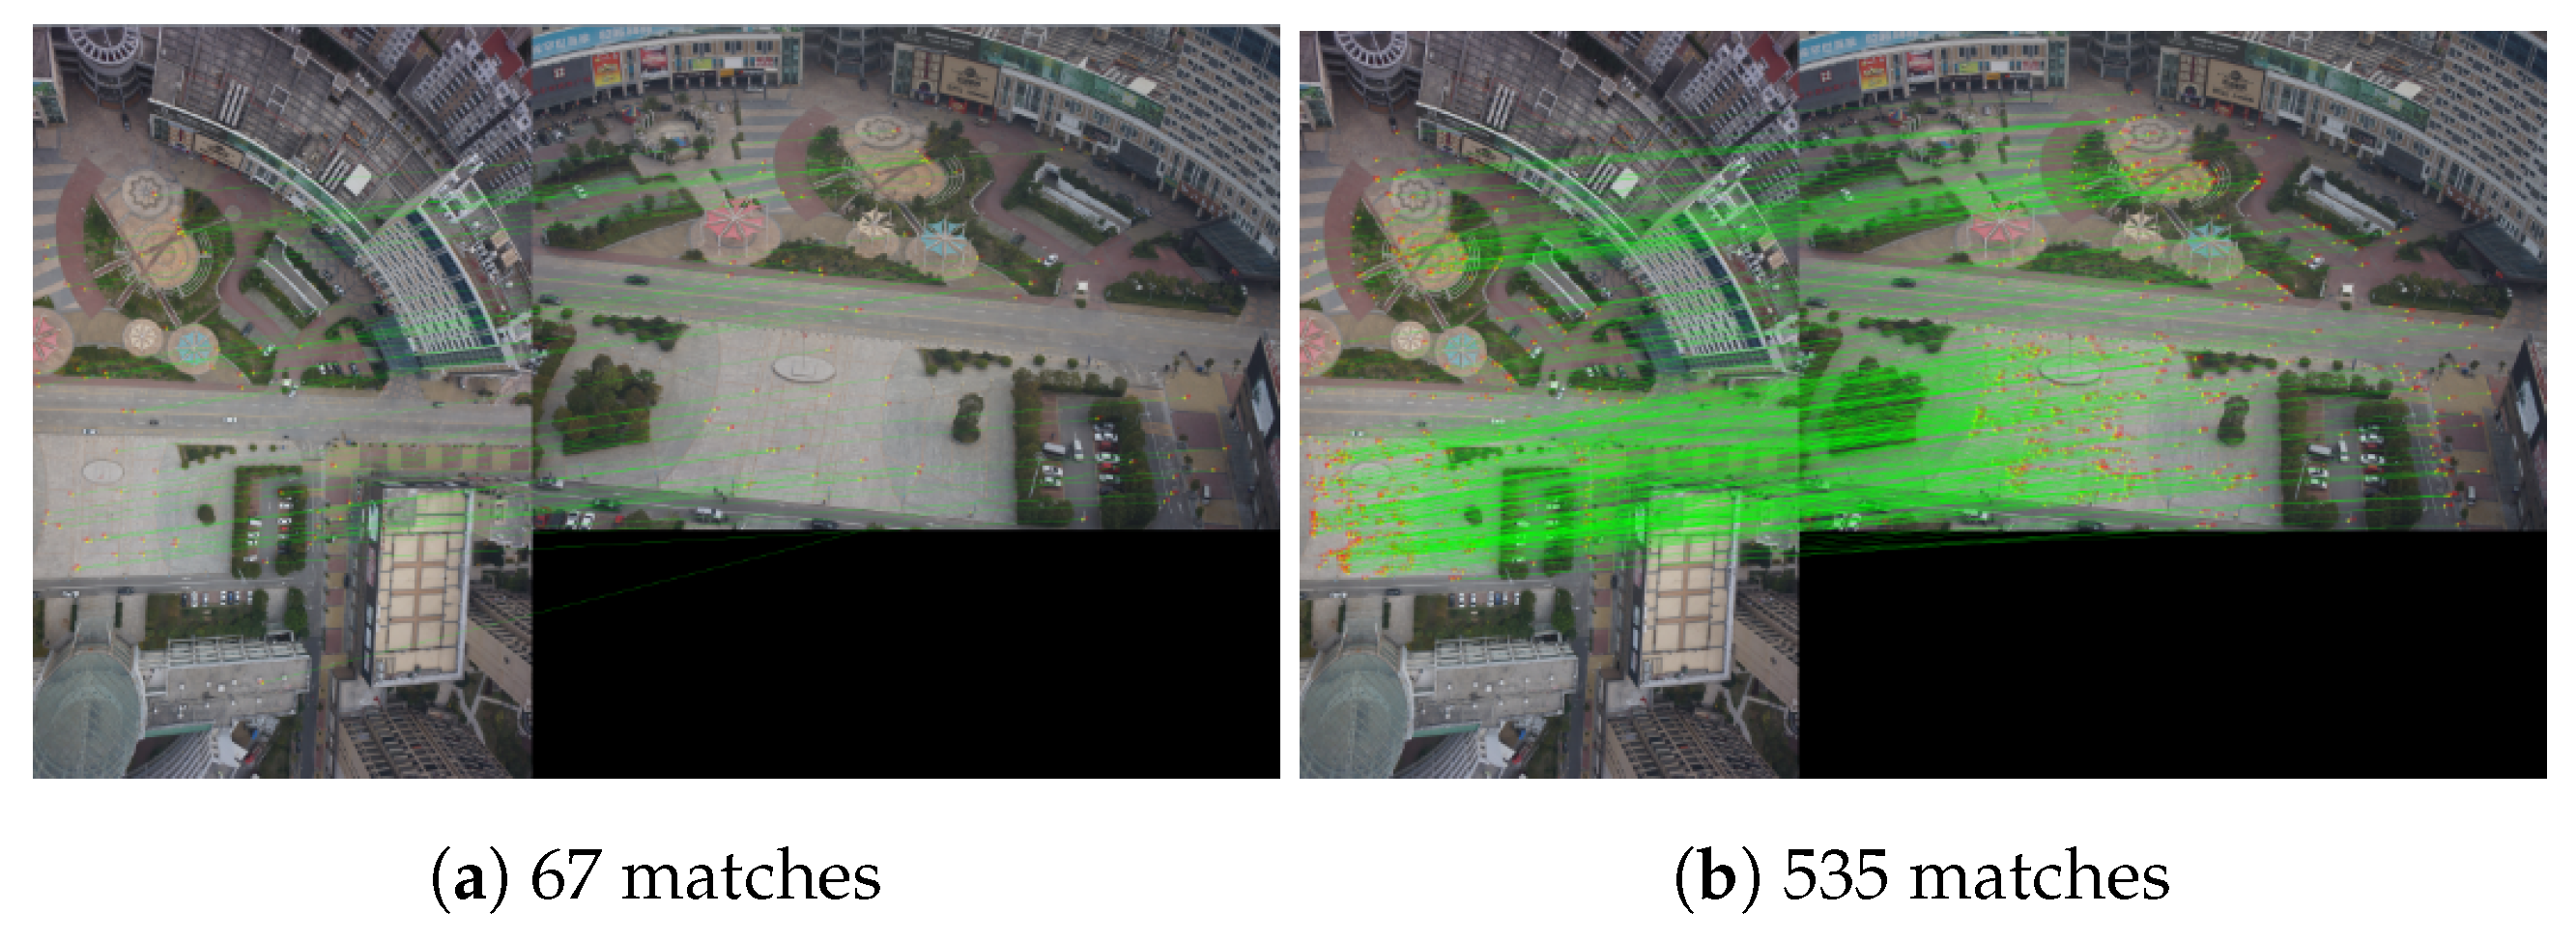
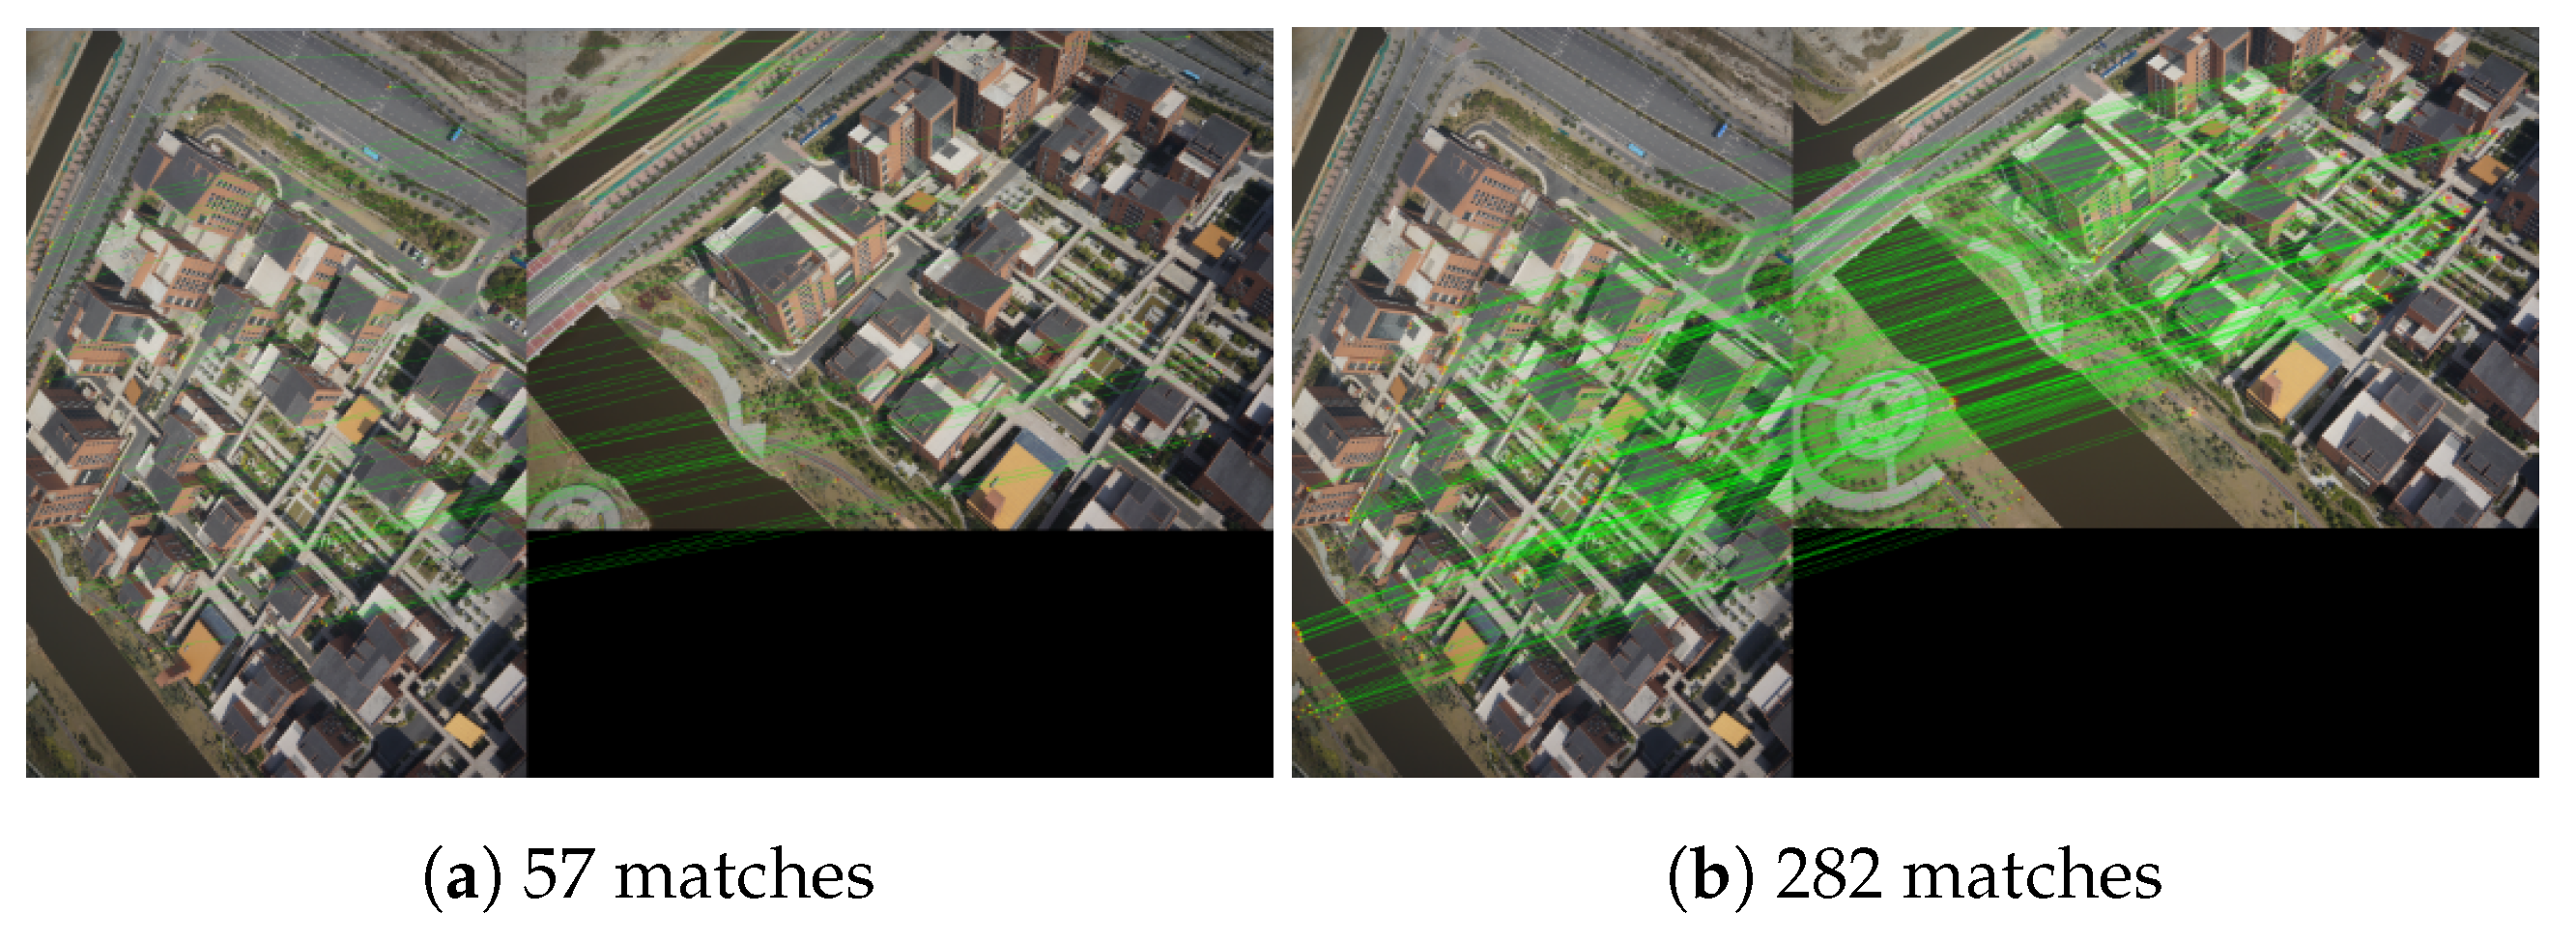
For the further performance analysis of the tiling strategy on feature matching, two extra image pairs from datasets 3 and 4 are also selected for matching tests, which are captured from absolutely different directions. The results are shown in Figure 9 and Figure 10, respectively, where Figure 9a and Figure 10a are matches by not using the tiling strategy. It is obviously shown that, due to large perspective deformations, feature matching between these image pairs is extraordinarily difficult, and only 67 and 57 features are respectively matched. In contrast, by using the tiling strategy, the number of matches can dramatically increase to 535 and 282 for the two image pairs, as shown in which Figure 9b and Figure 10b, respectively. In order to facilitate the interpretation of match results, these two image pairs have been rotated to ensure that the linked lines of correct matches are parallel to each other. Consequently, for feature extraction and matching, the tiling strategy can be a satisfying solution to increase the number of matches and improve their distribution.
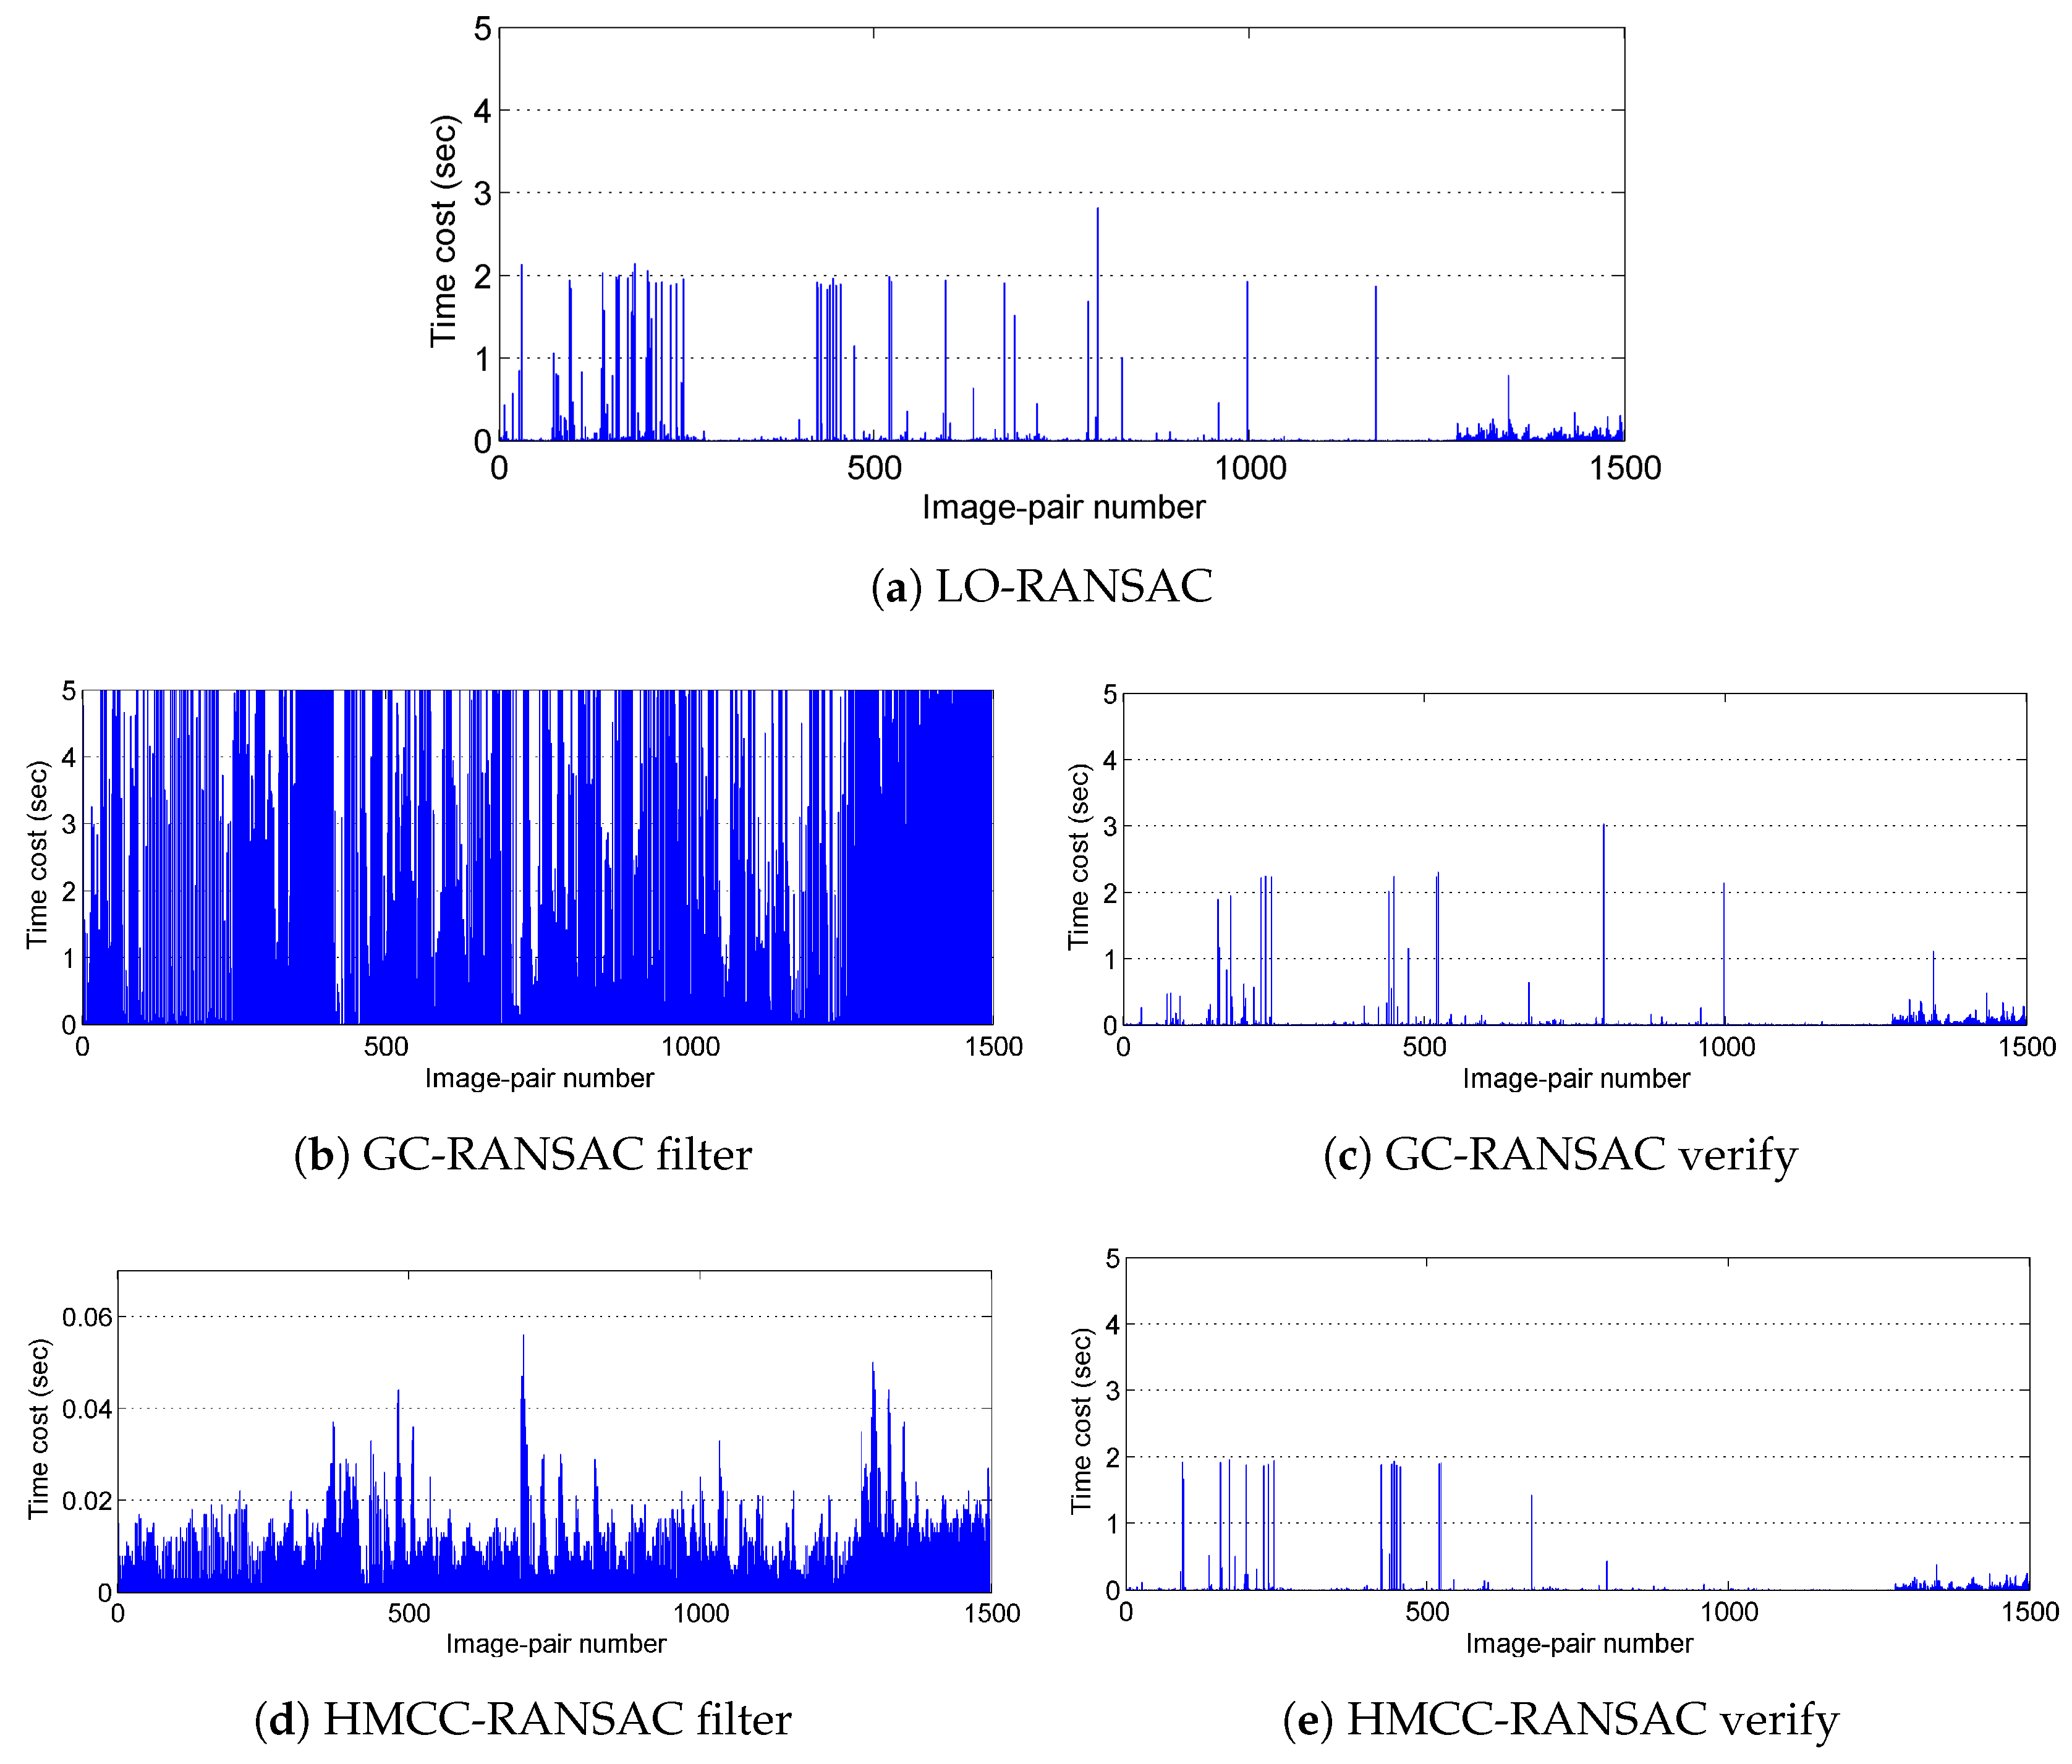
Initial matches are inevitably contaminated by outliers due to the only use of cross-checking and ratio-test for false match removal. The outlier ratio would be very high and lead to the low performance of the RANSAC. Thus, in this study, the HMCC is designed to remove obvious outliers by using the Hough voting scheme and increase the inlier ratios of initial matches. Table 5 shows statistical results of geometrical verification for three methods, including LO-RANSAC [38], GC-RANSAC [28] and HMCC-RANSAC (ours). In addition, Figure 11 shows the statistic of time costs for dataset 3. It is shown that the efficiency of the HMCC-RANSAC and LO-RANSAC is competitive, which can be observed from the results of dataset 1 and 2; when oblique imaging angle becomes larger, the advantages of the HMCC-RANSAC overcome that of the LO-RANSAC. Noticeably, two issues should receive attention. First, the sum of time costs of the GC-RANSAC is much larger than the other methods because of the large number of initial matches generated by the tiling strategy, which could cause the majority of time consumption in the filter stage. Thus, the efficiency of the GC-RANSAC is very sensitive to the number of initial matches. Second, compared with the results documented in Jiang et al. [31], the speedup ratios between the HMCC-RANSAC and the LO-RANSAC is not obvious due to the influence of match pair selection and the tiling strategy for feature matching. On the one hand, MST-Expansion can noticeably reduce the number of image pairs captured from varying viewing directions; on the other hand, the tiling strategy can decrease the ratio of false matches. Thus, the solution can increase the efficiency and reliability of feature matching.
3.3. Comparison with Other Software Packages
In this section, the proposed SfM solution would be compared with two software packages, including the open-source toolkit MicMac and the commercial software Agisoft PhotoScan. MicMac is a free and open-source software package [39]. It provides a complete framework, including image pair selection, SIFT feature extraction and matching, relative orientation and geo-referencing, to reconstruct 3D models based on principles of photogrammetry and computer vision. Among all functions of MicMac, the GrapheHom function is developed to search overlapped image pairs using image’s prior POS data, and the Tapioca function is designed for feature extraction and matching, which makes use of multi-core parallel computation technology. Features extracted and matched by the Tapioca function are set as the input of the orientation function Apero. With aids of GCPs (Ground Control Points), absolute orientation can be conducted for geo-referencing. Similarly, Agisoft PhotoScan [41] is also a widely used SfM-based software package for model reconstruction. In contrast to the flexibility of the open-source toolkit MicMac, Agisoft PhotoScan provides a more elegant workflow to facilitate the photogrammetric processing pipeline. By using the rough poses of images, it can also search overlapped image pairs and increase the efficiency of feature matching when incorporating the multi-core processing technique. Thus, to verify the validation of the proposed solution, this paper would make comparison tests with these two software packages for 3D reconstruction in terms of efficiency, completeness, and accuracy.
To achieve the impartial comparison tests, some special set of these two software packages is described, as shown in Table 6. The latest version of MicMac is downloaded from the official website [42], and Agisoft PhotoScan is the professional edition with version number 1.4.1. For image pair selection, both of them use rough POS data to predict image pairs with overlapped regions. In addition, the multi-scale strategy is adopted in Agisoft PhotoScan, which could further filter image pairs with few or without matches. The SIFT++ [43] and ANN [44] are the default libraries used in MicMac for feature extraction and matching, which does not use hardware acceleration. On the contrary, both the GPU and CPU are exploited by Agisoft PhotoScan to accelerate feature extraction and matching. For the processing of images with large size, the tiling strategy is only adopted in feature extraction for both of them. Due to the high computational costs of feature matching, the manual of MicMac proposes a scaling value between 0.3 and 0.5 for real images. Thus, in this study, the half size of original image dimension is used for feature matching in MicMac. Finally, the key point and tie point limits are set as 80,000 and 0 for feature matching with Agisoft PhotoScan, which means that the number of extracted features does not exceed 80,000 for one image; however, the number of tracked tie points is not limited.
3.3.1. Efficiency
Both the number of selected image pairs and the time involved in feature extraction and matching would be used for efficiency comparison due to two reasons. On the one hand, feature extraction and matching is the most time-consuming step in the SfM reconstruction; on the other hand, the main contribution of this paper focuses on the strategies for the rational selection of image pairs and the reliable matching of features. For all three of the methods, the rough poses of images and the mean altitude of test sites are required for image pair selection. In contrast to the direct adjacency principle used in the MicMac and PhotoScan, the MST-Expansion algorithm of the proposed solution aims to achieve further reduction of unessential image pairs by the topological analysis of image connection network.
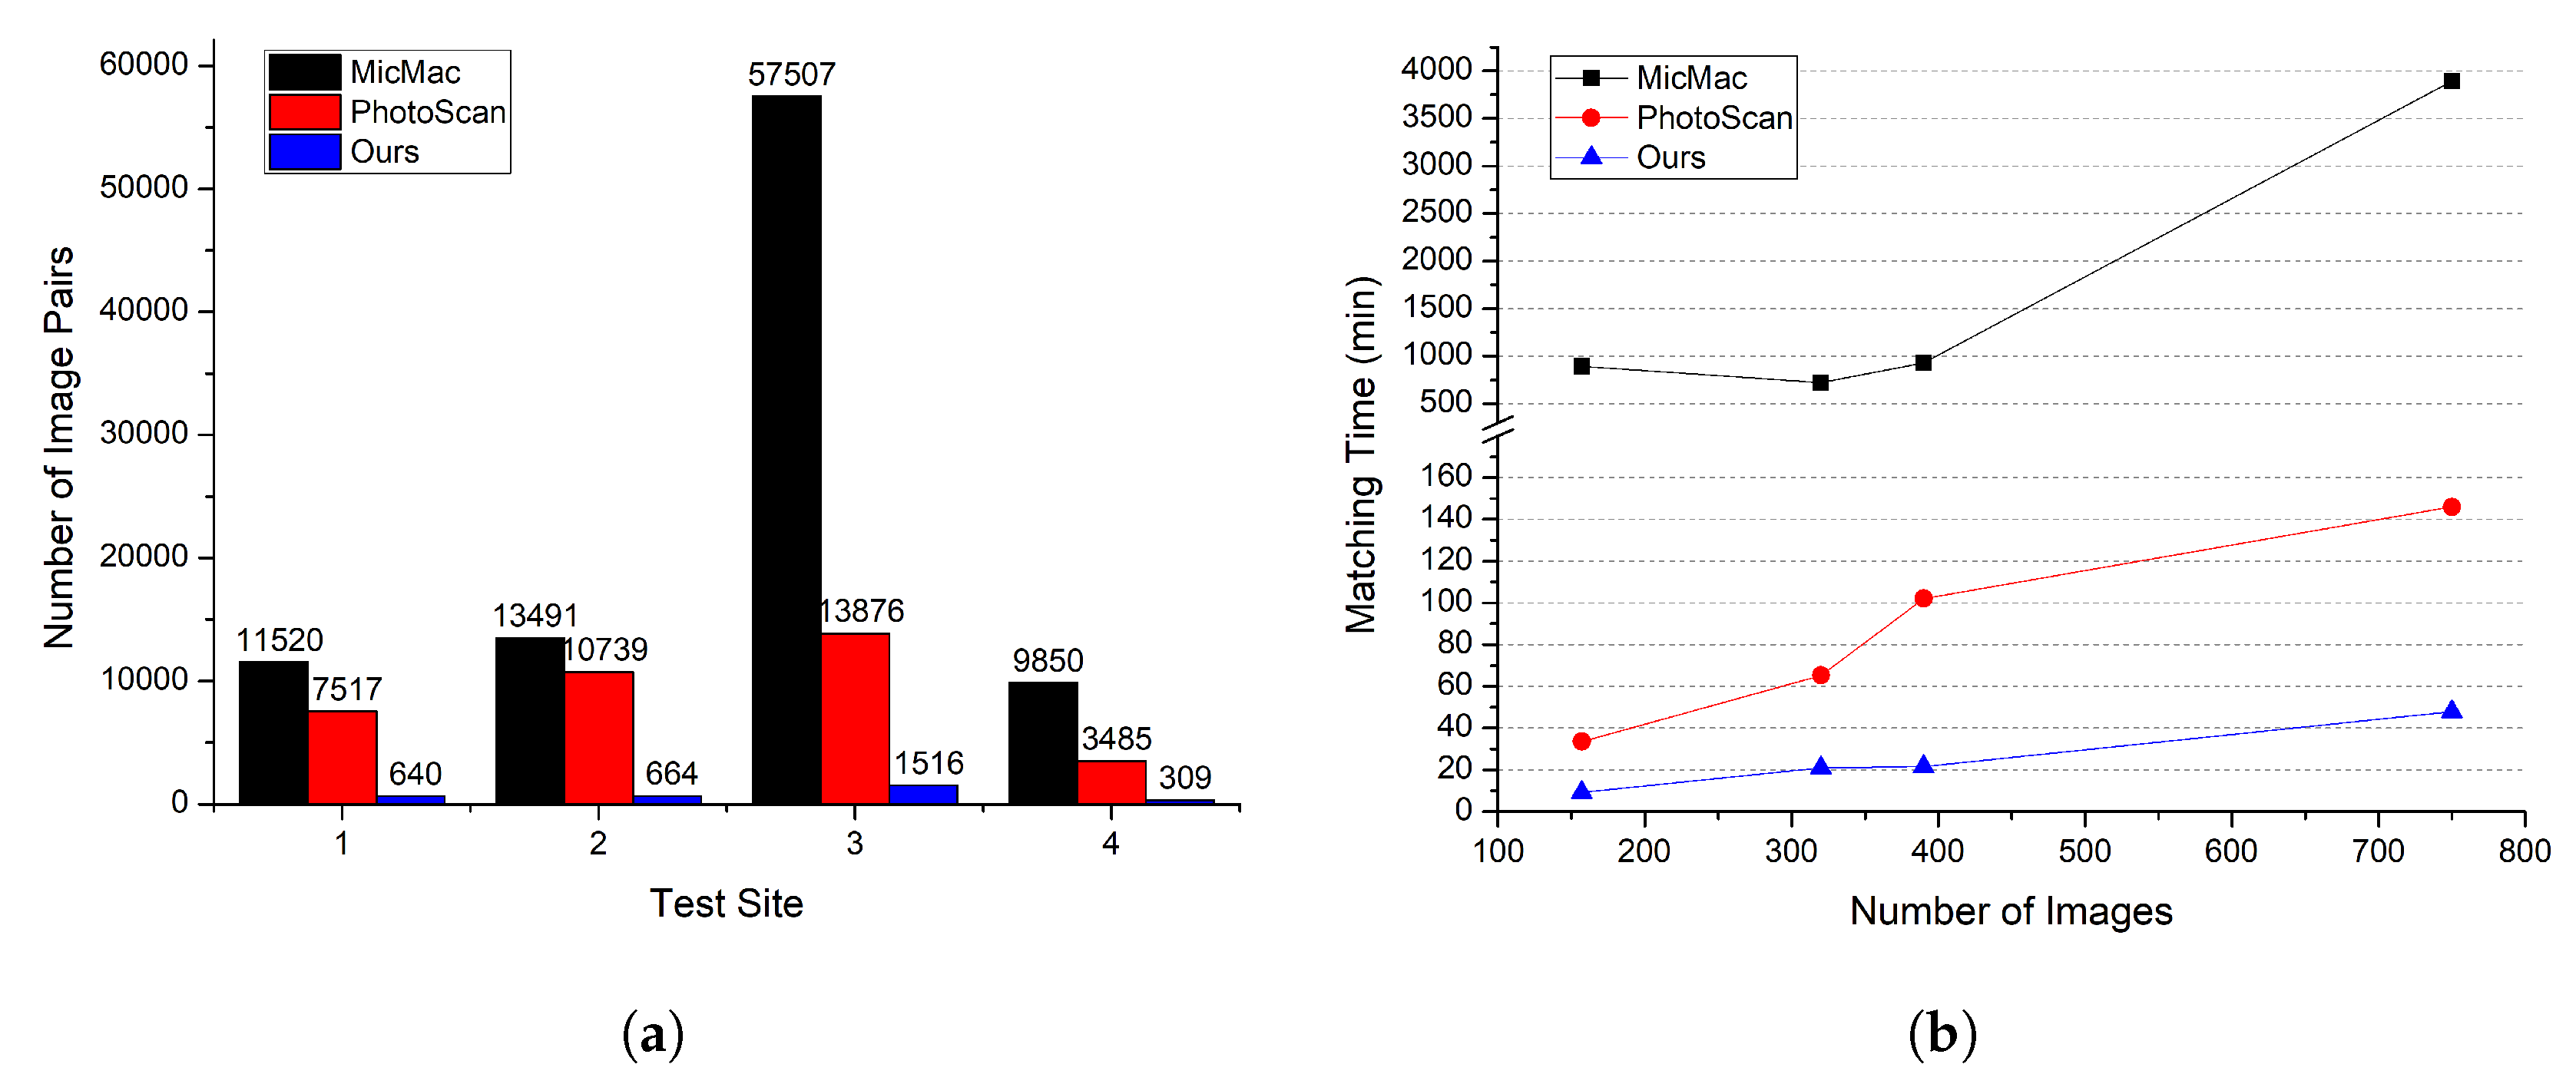
Figure 12a shows the statistical results of the numbers of selected image pairs. It is clearly shown that the largest numbers of image pairs are selected in MicMac, which is 11,520, 13,491, 57,507 and 9850 for datasets 1, 2, 3 and 4, respectively; due to the multi-scale strategy utilized in PhotoScan, the numbers of retained image pairs decrease to 7517, 10,739, 13,876 and 3485, respectively. By using the topological analysis of image network, the proposed solution in this study could achieve further reduction of image pairs, with values 640, 664, 1516 and 309 for datasets 1, 2, 3 and 4, respectively, whose simplification ratios are near or exceed 95% when compared with the results generated from MicMac. Noticeably, for datasets 3 and 4, the ratios of the number of image pairs between MicMac and PhotoScan are approximately 4.2 and 2.8, respectively, while the ratios for datasets 1 and 2 are about 1.5. The main reason is that for datasets 3 and 4, although many more image pairs are selected from the overlap principle used in MicMac, a large proportion of them are not essential for feature matching caused by their relative larger viewing angles compared with datasets 1 and 2, which would be filtered out by the multi-scale strategy used in PhotoScan. This is the further verification that the intersection angle is necessary for the weight calculation of image pairs used in the MST-Expansion.
Figure 12b illustrates the time of feature matching versus the number of images for the four datasets, where the numbers of images are 157, 320, 390 and 750 for datasets 4, 1, 2 and 3, respectively. It is shown that the highest time consumptions can be observed from MicMac due to the larger number of image pairs and the absence of GPU acceleration. On the contrary, the lowest time is consumed by the proposed solution, which is almost linear to the number of images, with values 9.15 min, 21.01 min, 21.56 min and 47.98 min for datasets 4, 1, 2 and 3, respectively, as presented in Table 7. Despite the use of the multi-scale strategy for image pair selection and the mixed mode with GPU and CPU for acceleration, the ratios of time costs between PhotoScan and Ours still exceed 3.0. Thus, the proposed solution can achieve the highest efficiency in feature matching.
3.3.2. Completeness
For the completeness comparison, the numbers of connected images and resumed points are utilized based on statistical results of 3D reconstruction models. Noticeably, for PhotoScan, the orientation procedure consists of two major steps. In the first step, models are constructed automatically without manual operations; in the second step, an optimization procedure is manually repeated by removing tie points with large re-projection errors and recalculating camera parameters, as published in the online tutorial [41], until no obvious decrease of re-projection errors can be observed. In addition, for MicMac, tie points are sequentially generated and exported, which leads to many duplicated 3D points. Therefore, in this study, we use the distance of one half GSD value to remove duplicates from 3D points generated by MicMac.
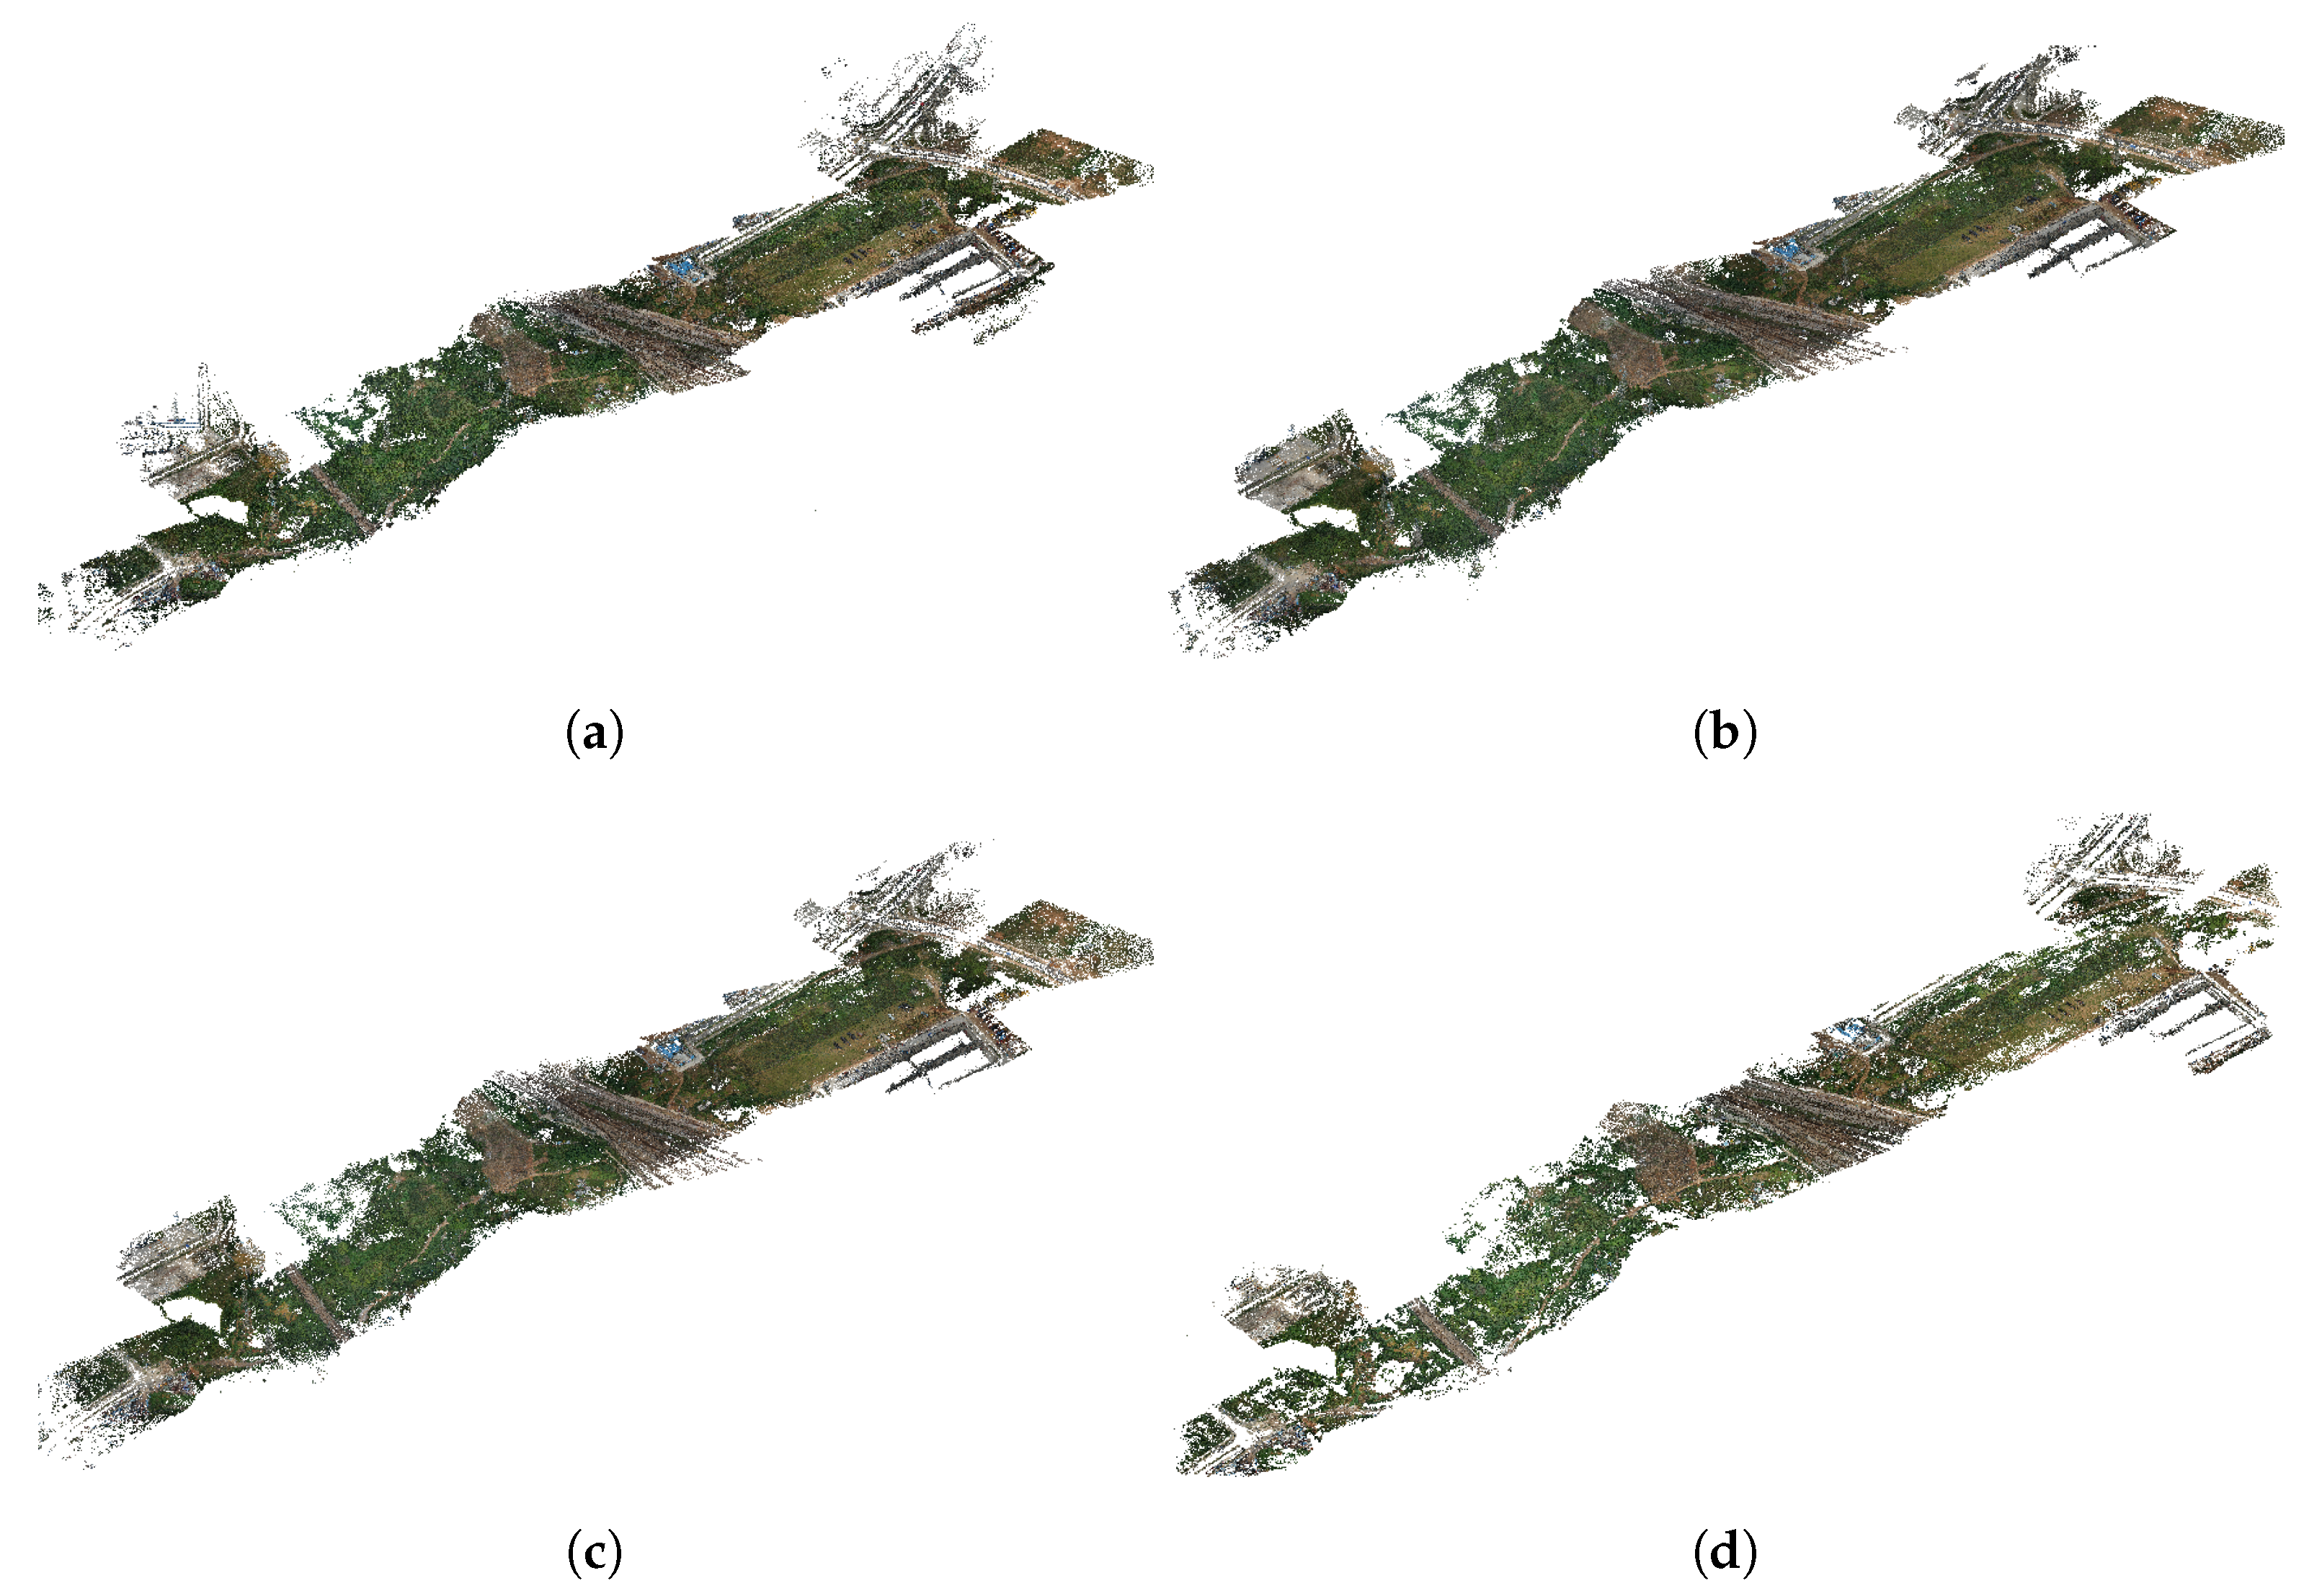
Table 8 shows the numbers of connected images and 3D points for completeness comparison, in which the terms Points-init and Points-opt stand for the numbers of points resumed in the first and second steps of PhotoScan, respectively. It is shown that, for the three solutions, all images of the four datasets are successfully connected. Although more than half of the initial resumed 3D points are filtered out in the optimization procedure, the relative orientation accuracy increases due to the fact that unreliable and false matches are removed in the optimization step from PhotoScan (details in the Accuracy Section). By further checking the number of reconstructed points, we can find that the number of points generated from the proposed solution is almost identical to that generated from PhotoScan after the optimization step, which includes the essential and necessary points for the reliable image orientation, as shown in Figure 13. Thus, compared with MicMac and PhotoScan, the proposed solution in this study can achieve the comparable reconstruction completeness in terms of the numbers of resumed images and 3D points.
3.3.3. Accuracy
The relative bundle adjustment tests without ground control points and the absolute bundle adjustment tests with GCPs are utilized to assess the accuracy of different solutions in this study. Without GCPs, SfM reconstruction models can be used to evaluate the relative orientation accuracy, and the statistical results are listed in Table 9. Similarly, for PhotoScan, both the initial orientation accuracy and the optimized accuracy are recorded. It is shown that competitive accuracy can be observed from MicMac when compared with results in the initial step of PhotoScan. This also indicates that the scaling factor used in MicMac with value 0.5 has negligible influence on the orientation accuracy. However, after the optimization step, the orientation accuracy of PhotoScan is obviously improved, with final precision value 0.404, 0.242, 0.562 and 0.319 for the four datasets, respectively. It is verified that, for PhotoScan, the optimization step is crucial to improving orientation accuracy. In other words, the image pair selection strategy can achieve the same optimization function as that in PhotoScan because almost the highest orientation accuracy can be observed from the solution in this study.
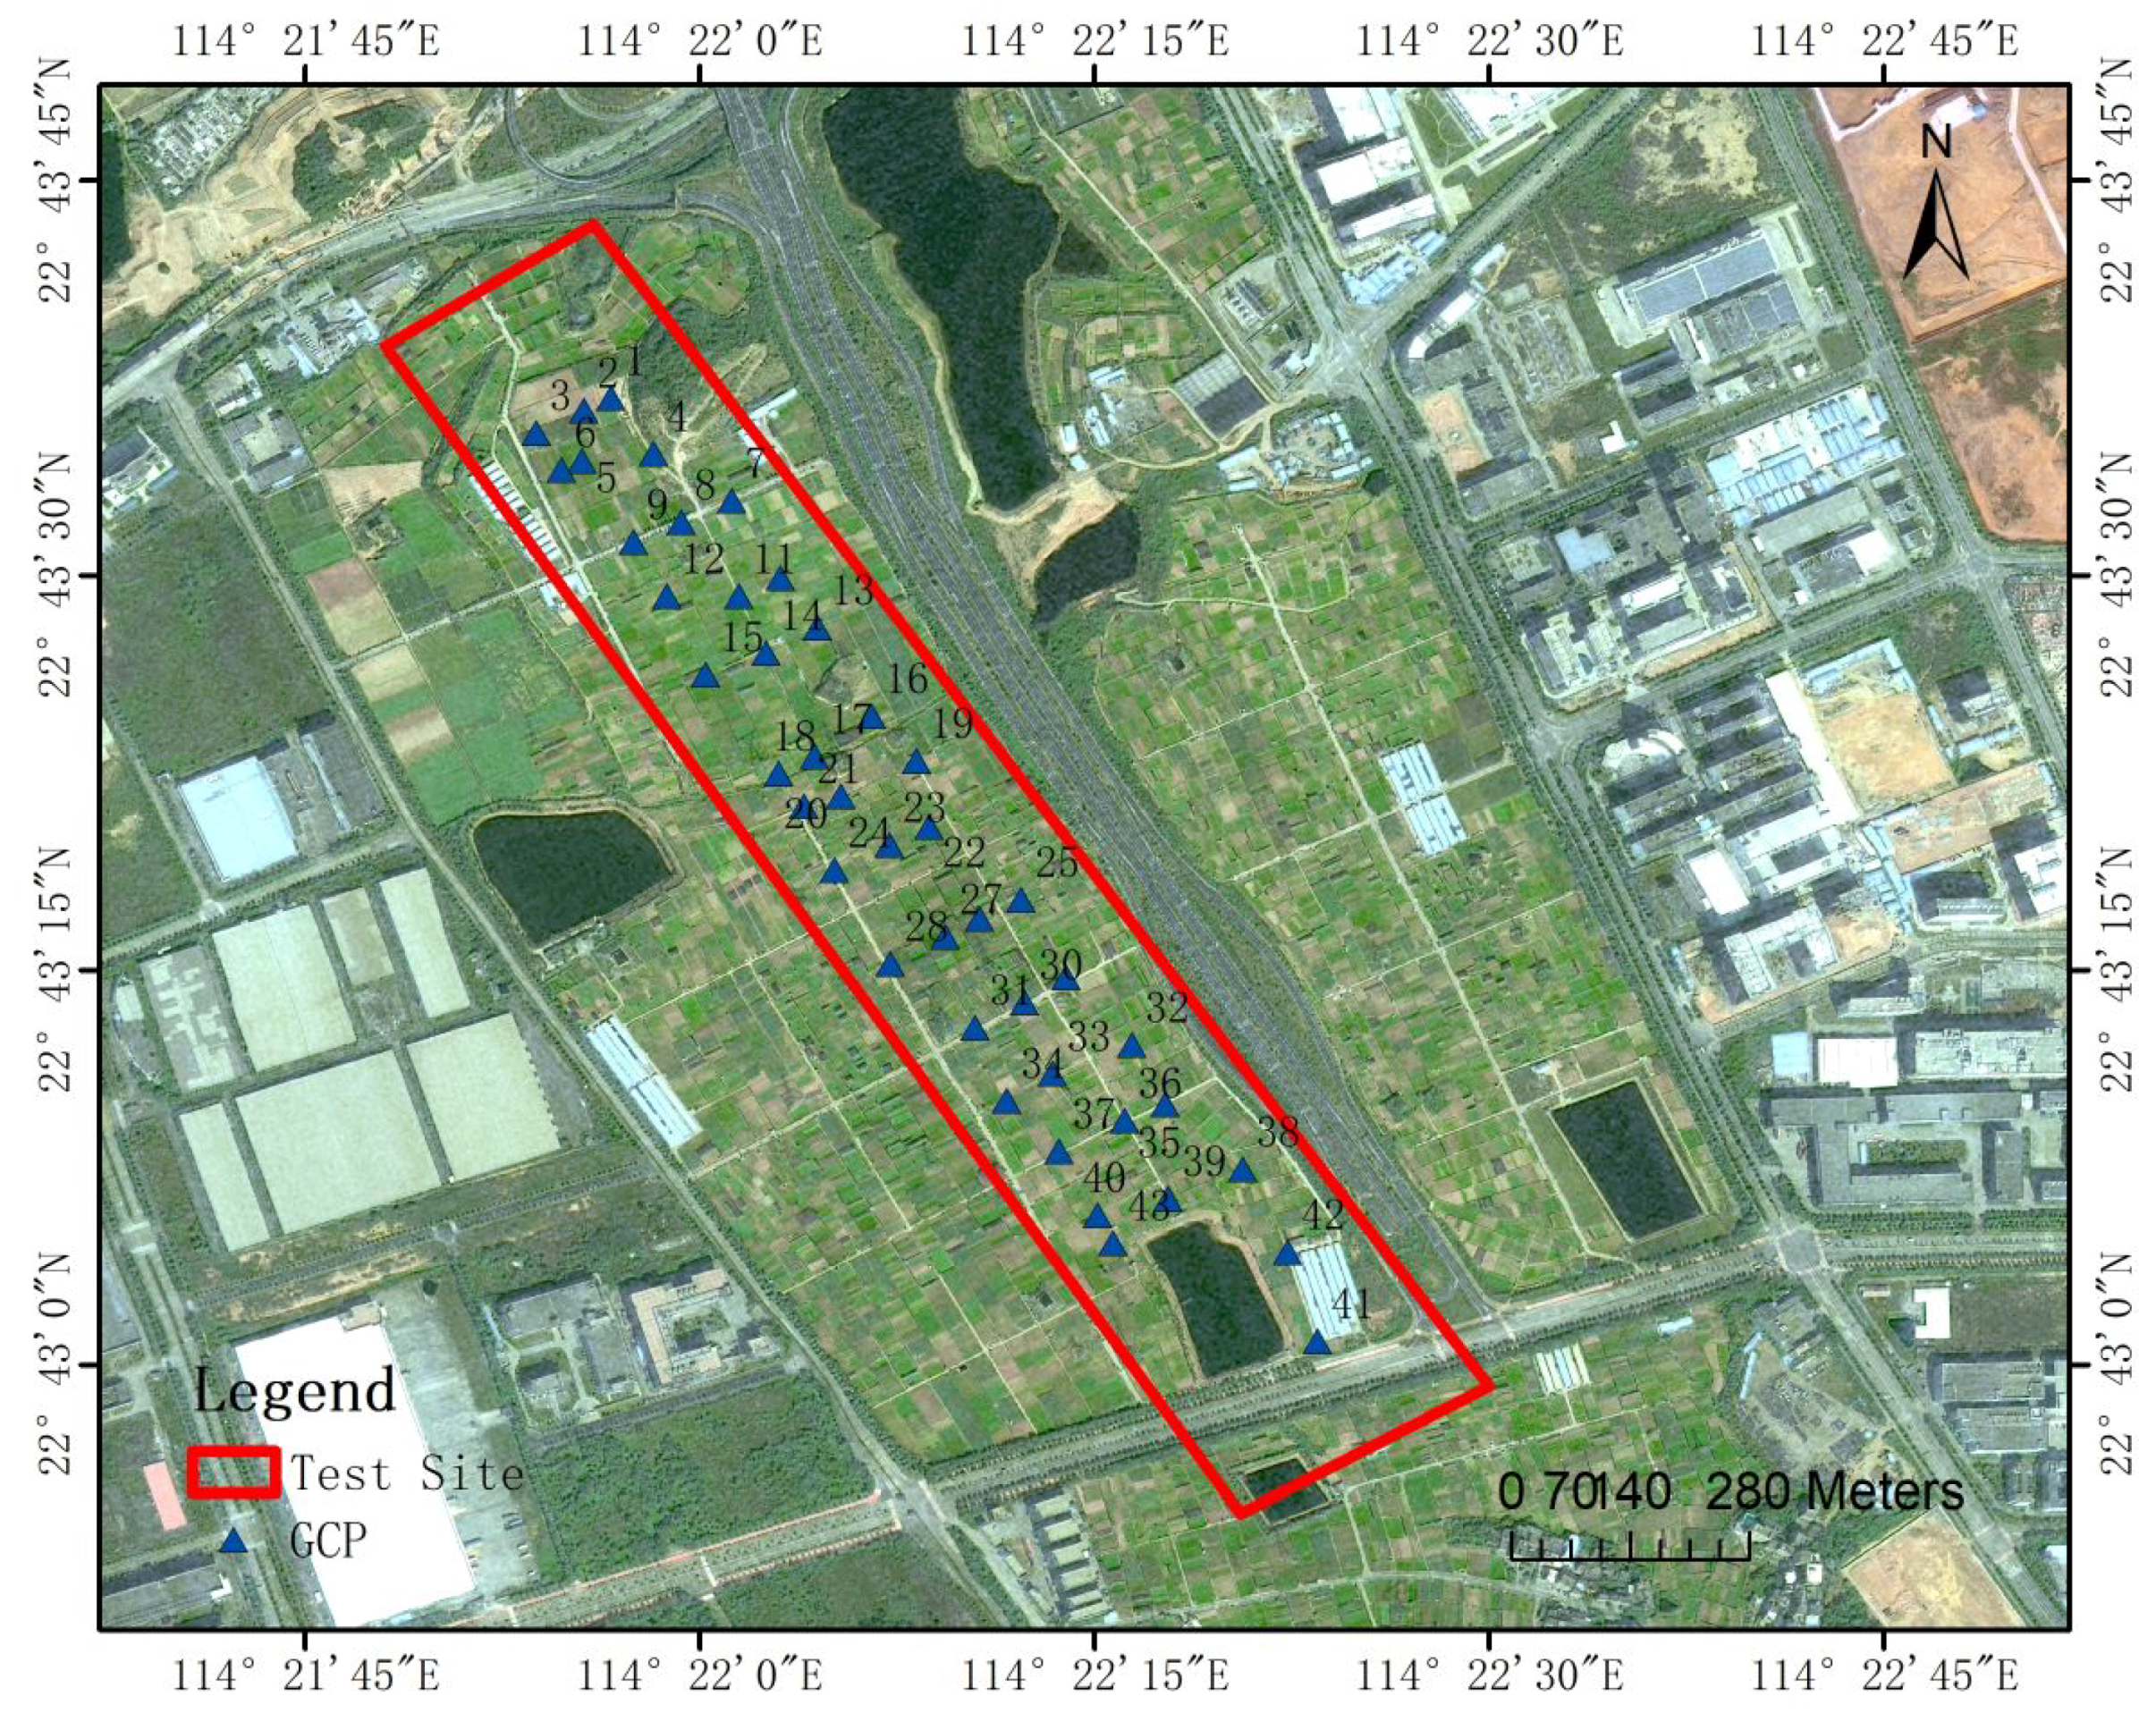
With the aid of ground-truth data, absolute orientation accuracy can be evaluated. In this study, 43 ground control points are designed and surveyed in the second test site, as shown in Figure 14. For geo-referencing of the reconstructed model, four GCPs, numbered 7, 9, 35 and 37, are involved in the absolute bundle adjustment tests, and all the others are used as check points (CPs) for accuratcy comparison.
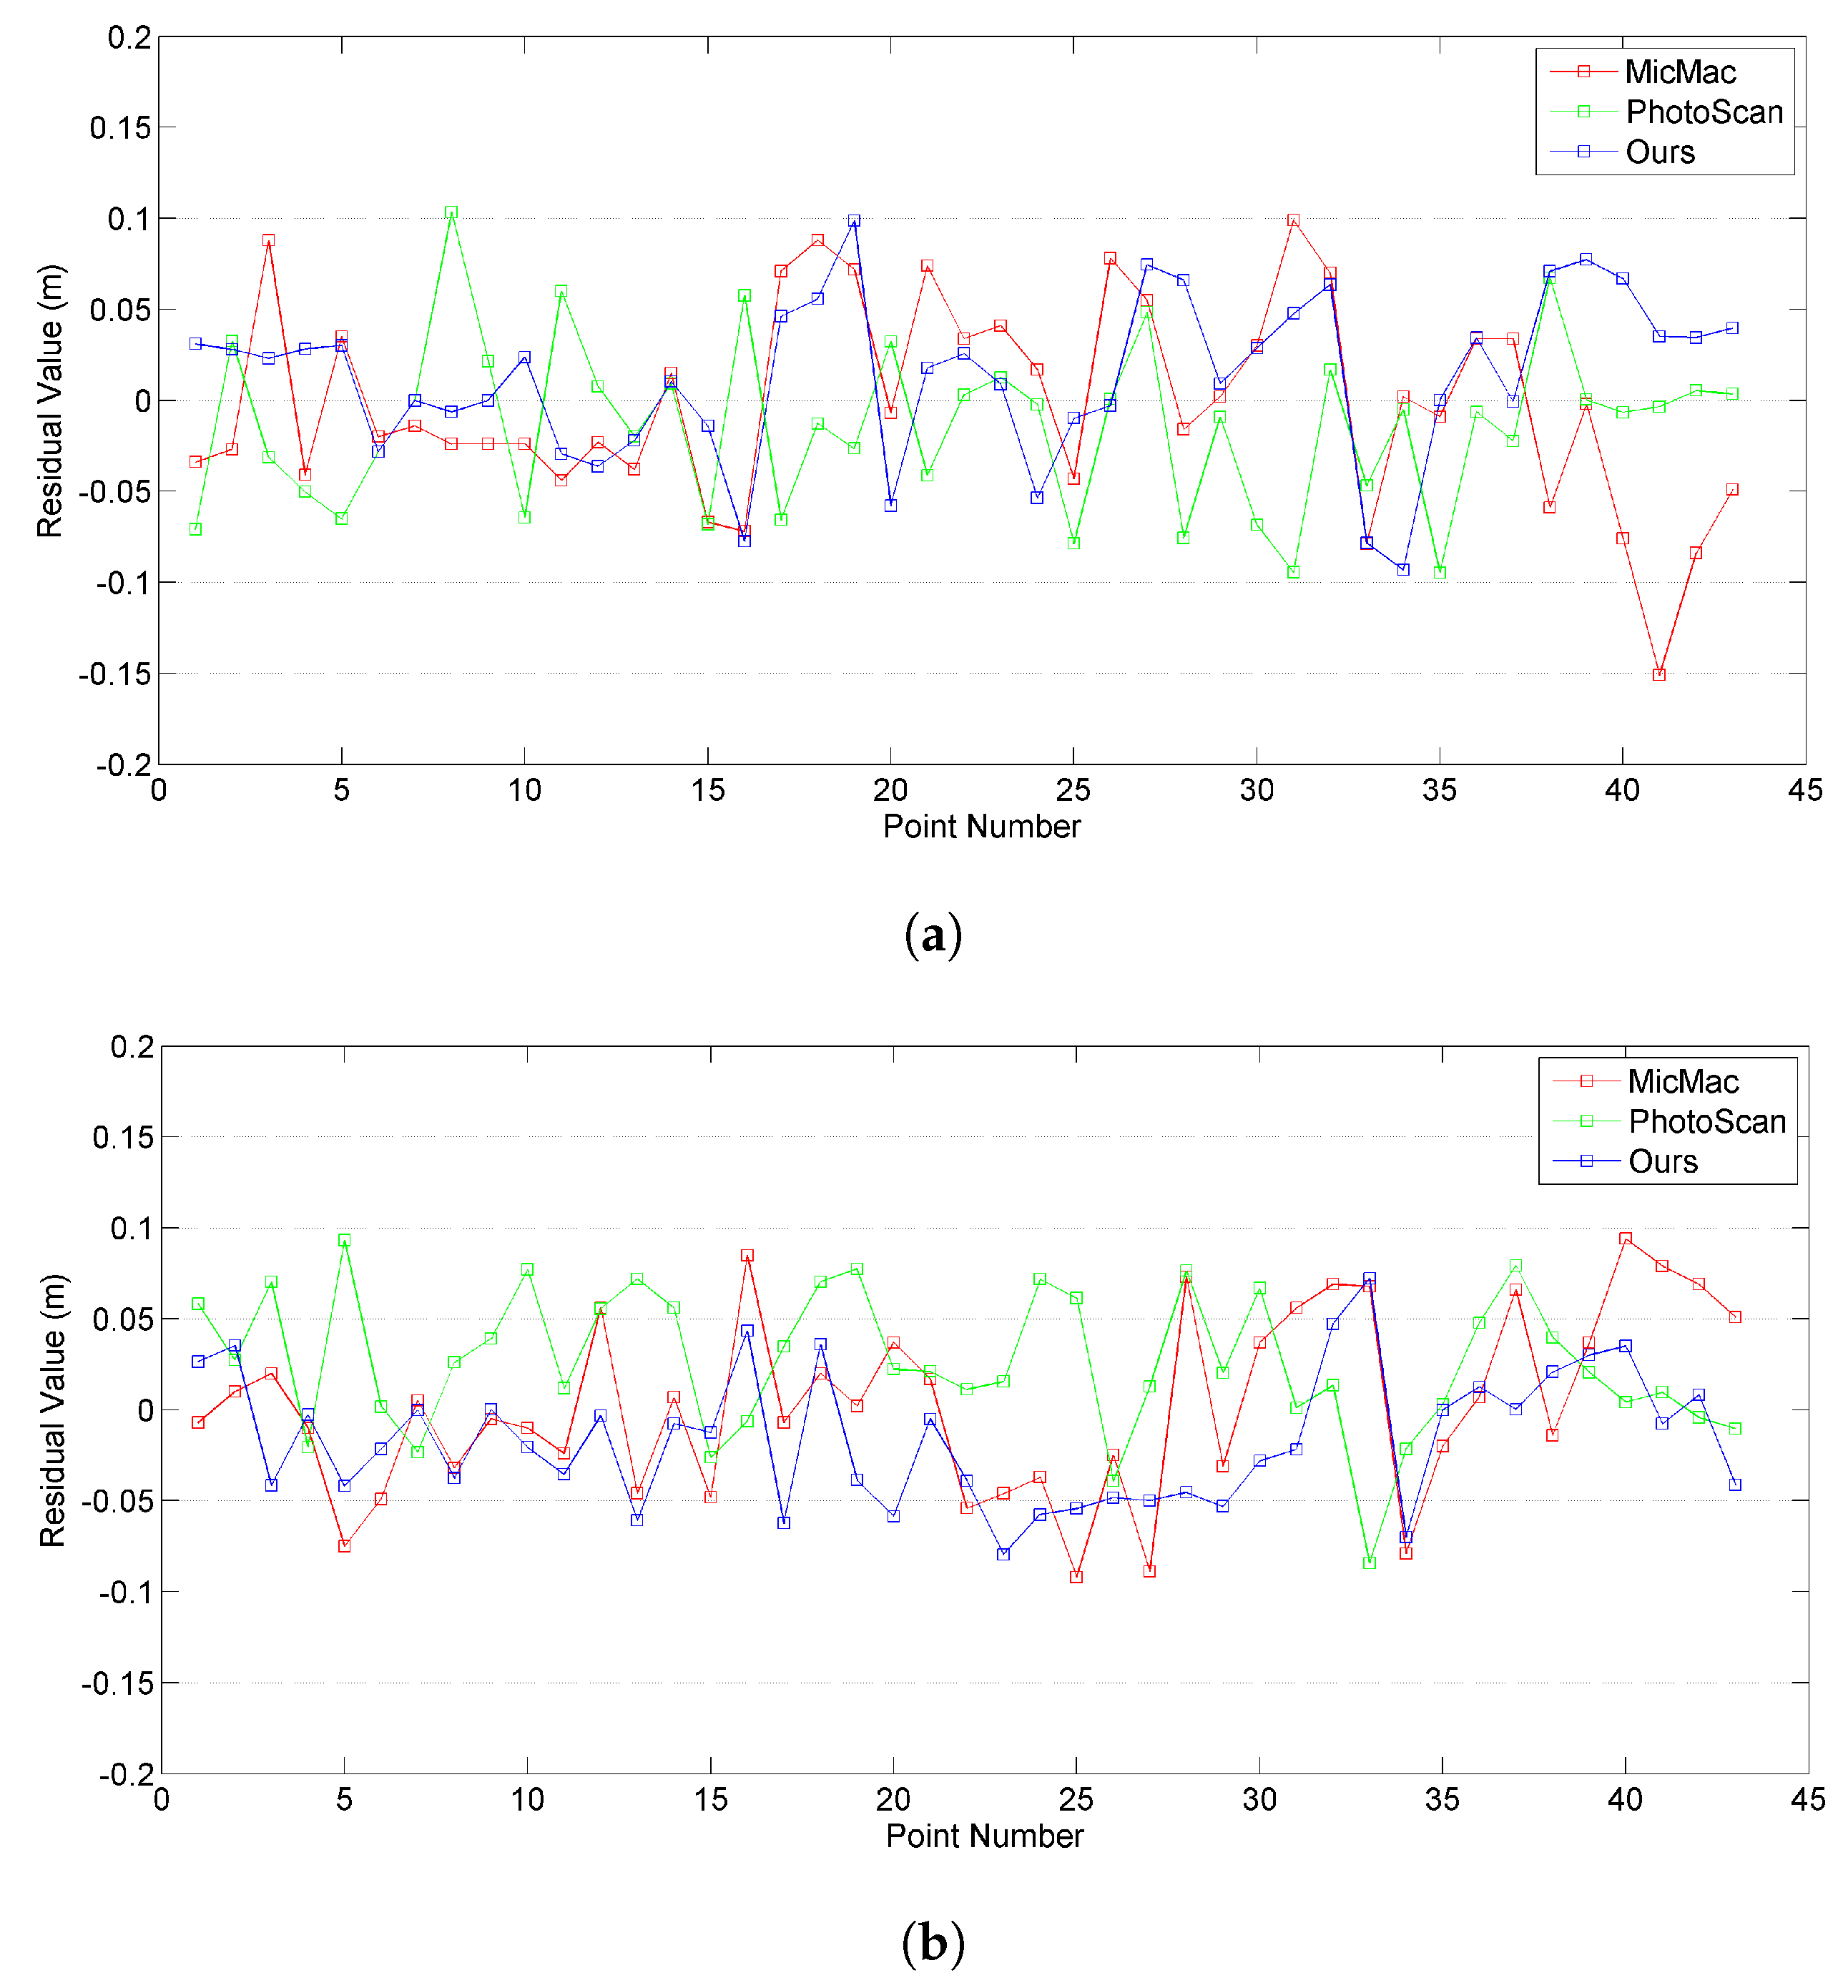
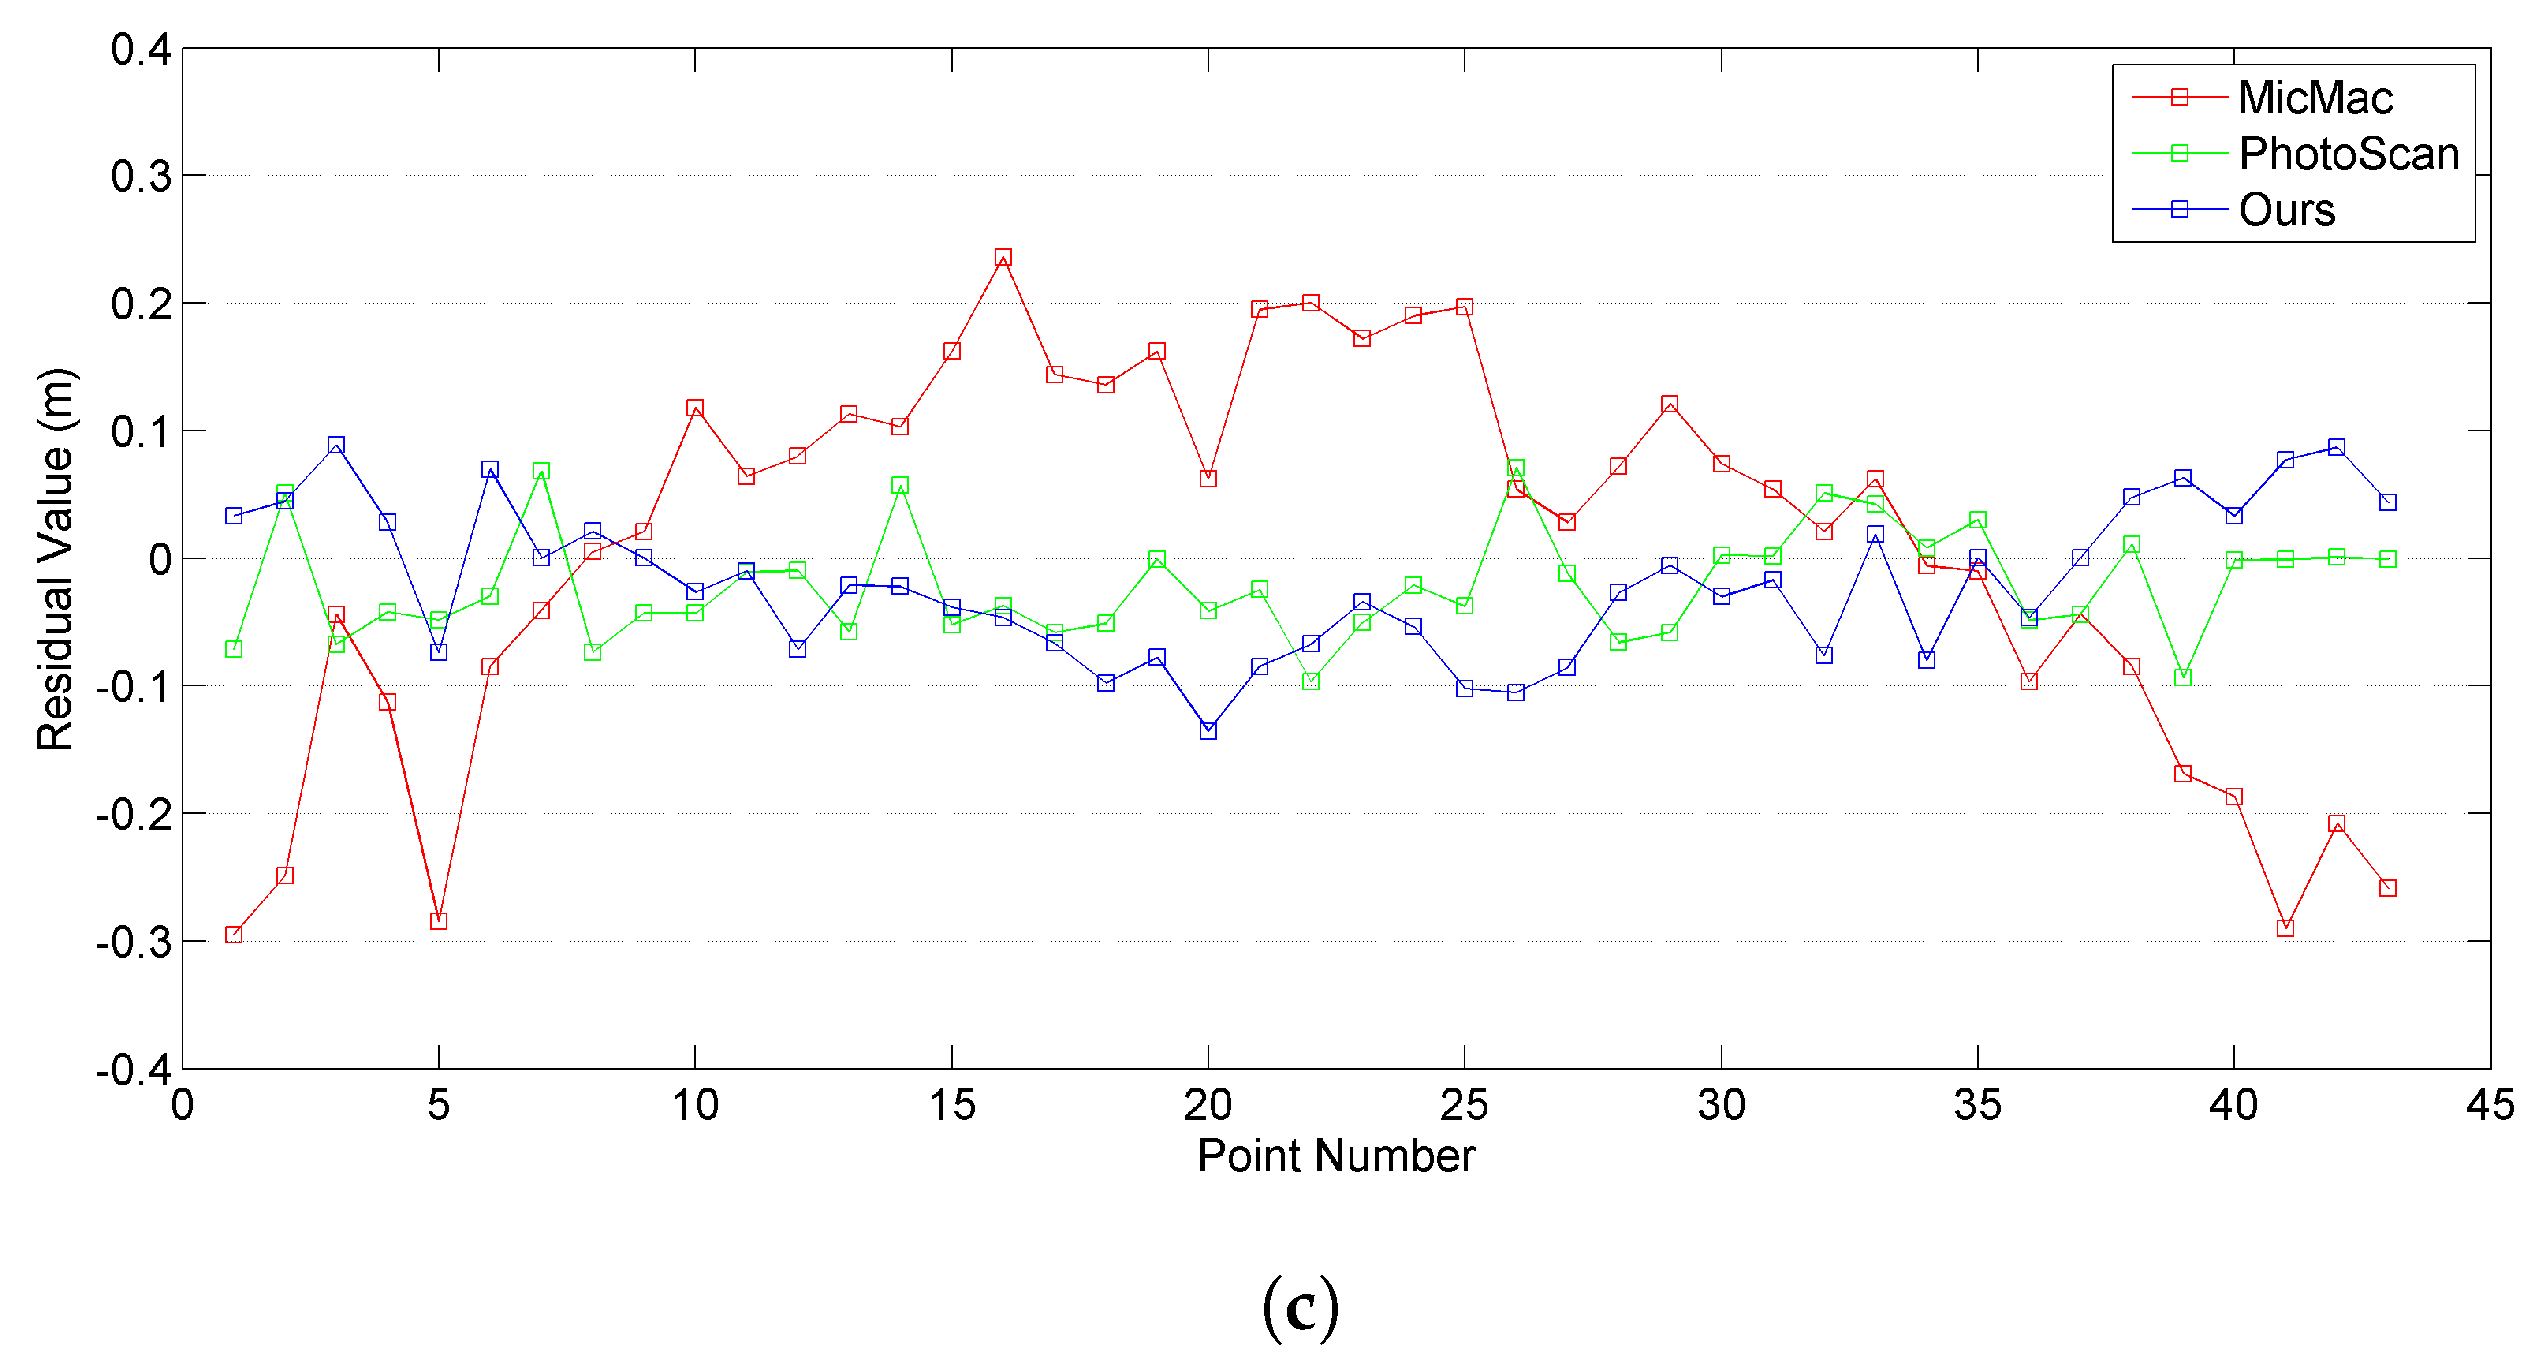
Figure 15 illustrates the results of absolute orientation. The metric, namely RMSE (Root Mean Square Error), is used, and the statistical results show that, for dataset 2, PhotoScan achieves the highest accuracy considering both the horizontal and vertical aspects, where RMSEs are 0.046, 0.039 and 0.043 in the x, y, and z-directions, respectively. Although the RMSE in the vertical direction is larger than that of PhotoScan, competitive accuracy can be observed from the proposed solution in this study, which is also verified by the coincident residual plots as presented in Figure 16. However, even though the largest number of image pairs and the most time costs are involved in feature matching of MicMac, the orientation precision is not satisfying, especially for the vertical direction, whose value is approximately 3.5 times that of PhotoScan. This can be explained by two aspects. First, a subset of images are used for camera calibration by using the RadialExtended mode, and insufficient calibration can cause the poor performance of orientation, although self-calibration has been used in bundle adjustment tests; second, too many image pairs does not ensure high accuracy of image orientation because false matches would be introduced from pairs without overlap areas and pairs with small overlap areas. On the contrary, the strategies for image pair selection used in both PhotoScan and the proposed solution can avoid the occurrence of excessive image pair selection. Therefore, the proposed solution can achieve orientation with RMSEs better than two times the GSD value (3.67 cm).
4. Discussion
This paper proposes an integrated SfM solution for oblique UAV images based on our previous studies [12,31,31]. The SfM solution consists of three steps, including image pair selection using the MST-Expansion, tiling strategy for feature extraction and matching, and efficient geometrical verification based on the HMCC-RANSAC. The results demonstrate that the proposed pipeline is an efficient and reliable solution for the orientation of oblique UAV images, whose performance can be evaluated from three aspects.
First, prior to feature matching, MST-Expansion can dramatically reduce the number of image pairs. On the one hand, image pairs with too small or too narrow overlap areas are removed because they are prone to pose difficulties for feature matching and cause false matches; on the other hand, image pairs that are not crucial for the stability of image connection network are pruned, due to the high overlap degree of oblique UAV images. For the four experimental datasets, the speedup ratios in terms of the numbers of image pairs range from 16 to 35, which can achieve noticeable acceleration for feature matching. For efficiency comparison, we can see that the time costs involved in feature matching are approximately linear in the number of images, as presented in Figure 12b. Second, the tiling strategy used in feature extraction and matching can not only increase the number of matches but also improve their distribution. In addition, this strategy can restrict nearest-neighbor searching in the corresponding blocks and increase the inlier ratios of initial matches. As reported in Jiang et al. [17], the MST-Expansion would sacrifice the reconstruction accuracy of 0.11, 0.08 and 0.26 GSD value in the x-, y- and z-direction for efficiency improvement. However, in this study, the experimental results, as documented in accuracy comparison, show that with the tiling strategy used in feature extraction and matching, the proposed solution could achieve competitive accuracy when compared with the solution generating the highest orientation accuracy in terms of relative orientation and absolute orientation. Third, for initial matches with high outlier ratios, the HMCC is designed to remove obvious false matches by using the efficient Hough voting scheme because of its robustness to noisy. For match pairs with high outlier ratios, the HMCC can noticeably improve the efficiency of verification, as reported in Jiang et al., [31], whose speedup ratios can reach 6. However, in this study, the performance of the HMCC cannot be observed because match pair selection and the tiling strategy can dramatically decrease outlier ratios.
Although the proposed SfM solution could achieve efficient orientation of oblique UAV images by using the three strategies, some issues should be noticed. The influence of the tiling strategy is two-edged. On the one hand, it can achieve reliable feature matching and improve the accuracy of reconstructed models; on the other hand, it would decrease the efficiency of feature extraction, feature matching and further increase time costs of orientation due to the increased number of tie-points. Thus, for real applications, one should modify the overall pipeline to adapt to varying situations, i.e., the solution without the tiling strategy for scenarios requiring high efficiency and with the strategy for scenarios requiring high accuracy. In addition, the time costs involved in reconstruction can also decrease from two aspects. First, some strategies should be designed to decrease the number of tie-points without sacrifices of the orientation accuracy; second, the global structure from motion solution can be considered as an alternative to the used incremental solution because of the repeated bundle adjustment in the incremental SfM solution.
5. Conclusions
In this paper, an integrated SfM solution is designed from aspects of image pair selection, feature extraction and matching, and geometrical verification. The proposed solution is designed based on our previous studies aiming to address the corresponding issues [12,31,31]. First, the MST-Expansion is used to simplify the combinational complexity of UAV images caused by their small size and large volume. Second, to increase the number of matches for image pairs captured from varying directions, feature extraction and matching are achieved by using the tiling strategy, which could also improve the distributions of matches. Third, considering the high outlier ratios of initial matches, the HMCC-RANSAC achieved by the Hough voting scheme is designed to remove obvious outliers. Four datasets, captured with different oblique systems, are used for individual performance evaluation and overall comparison tests with the other two open-source and commercial software packages. The experimental results demonstrate that the proposed SfM workflow can be an efficient and reliable solution for the orientation of oblique UAV images.
Author Contributions
S.J. and W.J. designed the experiments; S.J. performed the experiments and analyzed the test results; S.J. wrote the paper.
Funding
This research received no external funding.
Acknowledgments
The authors would like to thank authors who have made their algorithms of SiftGPU, L2-SIFT, and MicMac as open-source packages, which is really helpful to the research.
Conflicts of Interest
The authors declare no conflict of interest.
References
- Aicardi, I.; Chiabrando, F.; Grasso, N.; Lingua, A.M.; Noardo, F.; Spanò, A. UAV photogrammetry with oblique images: First analysis on data acquisition and processing. Int. Arch. Photogramm. Remote Sens. Spat. Inf. Sci. 2016, 41, 835–842. [Google Scholar] [CrossRef]
- Jiang, S.; Jiang, W.; Huang, W.; Yang, L. UAV-Based Oblique Photogrammetry for Outdoor Data Acquisition and Offsite Visual Inspection of Transmission Line. Remote Sens. 2017, 9, 278. [Google Scholar] [CrossRef]
- Qin, R. An Object-Based Hierarchical Method for Change Detection Using Unmanned Aerial Vehicle Images. Remote Sens. 2014, 6, 7911–7932. [Google Scholar] [CrossRef] [Green Version]
- Lin, Y.; Jiang, M.; Yao, Y.; Zhang, L.; Lin, J. Use of UAV oblique imaging for the detection of individual trees in residential environments. Urban For. Urban Green. 2015, 14, 404–412. [Google Scholar] [CrossRef]
- Fischler, M.A.; Bolles, R.C. Random sample consensus: A paradigm for model fitting with applications to image analysis and automated cartography. Commun. ACM 1981, 24, 381–395. [Google Scholar] [CrossRef]
- Westoby, M.; Brasington, J.; Glasser, N.; Hambrey, M.; Reynolds, J. ‘Structure-from-Motion’photogrammetry: A low-cost, effective tool for geoscience applications. Geomorphology 2012, 179, 300–314. [Google Scholar] [CrossRef] [Green Version]
- Zhang, R.; Schneider, D.; Strauß, B. Generation and Comparison of TLS and SfM based 3D Models of Solid Shapes in Hydromechanical Research. Int. Arch. Photogramm. Remote Sens. Spat. Inf. Sci. 2016, XLI-B5, 925–929. [Google Scholar] [CrossRef]
- Ippoliti, E.; Meschini, A.; Sicuranza, F. Structure from motion systems for architectural heritage. A survey of the internal loggia courtyard of Palazzo Dei Capitani, Ascoli Piceno, Italy. Int. Arch. Photogramm. Remote Sens. Spat. Inf. Sci. 2015, 40, 53. [Google Scholar] [CrossRef]
- Chidburee, P.; Mills, J.; Miller, P.; Fieber, K. Towards a low-cost real-time photogrammetric landslide monitoring system utilising mobile and cloud computing technology. Int. Arch. Photogramm. Remote Sens. Spat. Inf. Sci. 2016, 41, 791–797. [Google Scholar] [CrossRef]
- Hartmann, W.; Havlena, M.; Schindler, K. Recent developments in large-scale tie-point matching. ISPRS J. Photogramm. Remote Sens. 2016, 115, 47–62. [Google Scholar] [CrossRef]
- Heinly, J.; Schonberger, J.L.; Dunn, E.; Frahm, J.M. Reconstructing the world* in six days*(as captured by the yahoo 100 million image dataset). In Proceedings of the IEEE Conference on Computer Vision and Pattern Recognition, Hilton Head Island, SC, USA, 7–12 June 2015; pp. 3287–3295. [Google Scholar]
- Jiang, S.; Jiang, W. On-Board GNSS/IMU Assisted Feature Extraction and Matching for Oblique UAV Images. Remote Sens. 2017, 9, 813. [Google Scholar] [CrossRef]
- Irschara, A.; Hoppe, C.; Bischof, H.; Kluckner, S. Efficient structure from motion with weak position and orientation priors. In Proceedings of the 2011 IEEE Computer Society Conference on Computer Vision and Pattern Recognition Workshops (CVPRW), Colorado Springs, CO, USA, 20–25 June 2011; pp. 21–28. [Google Scholar]
- Rupnik, E.; Nex, F.; Remondino, F. Oblique Multi-Camera Systems - Orientation and Dense Matching Issues. ISPRS Int. Arch. Photogramm. Remote Sens. Spat. Inf. Sci. 2014, XL-3/W1, 107–114. [Google Scholar] [CrossRef]
- Xu, Z.; Wu, L.; Chen, S.; Wang, R.; Li, F.; Wang, Q. Extraction of Image Topological Graph for Recovering the Scene Geometry from UAV Collections. ISPRS Int. Arch. Photogramm. Remote Sens. Spat. Inf. Sci. 2014, XL-4, 319–323. [Google Scholar] [CrossRef]
- Xu, Z.; Wu, L.; Gerke, M.; Wang, R.; Yang, H. Skeletal camera network embedded structure-from-motion for 3D scene reconstruction from UAV images. ISPRS J. Photogramm. Remote Sens. 2016, 121, 113–127. [Google Scholar] [CrossRef]
- Jiang, S.; Jiang, W. Efficient structure from motion for oblique UAV images based on maximal spanning tree expansion. ISPRS J. Photogramm. Remote Sens. 2017, 132, 140–161. [Google Scholar] [CrossRef]
- Harris, C.; Stephens, M. A combined corner and edge detector. In Alvey Vision Conference; Plessey Research Roke Manor: Manchester, UK, 1988; Volume 15, pp. 10–5244. [Google Scholar]
- Lowe, D.G. Distinctive image features from scale-invariant keypoints. Int. J. Comput. Vis. 2004, 60, 91–110. [Google Scholar] [CrossRef]
- Ke, Y.; Sukthankar, R. PCA-SIFT: A more distinctive representation for local image descriptors. In Proceedings of the 2004 IEEE Computer Society Conference on Computer Vision and Pattern Recognition, Washington, DC, USA, 27 June–2 July 2004; p. II. [Google Scholar]
- Morel, J.M.; Yu, G. ASIFT: A New Framework for Fully Affine Invariant Image Comparison. Siam J. Imaging Sci. 2009, 2, 438–469. [Google Scholar] [CrossRef] [Green Version]
- Wu, C. SiftGPU: A GPU Implementation of David Lowe’s Scale Invariant Feature Transform (SIFT). Available online: http://cs.unc.edu/~ccwu/siftgpu (accessed on 19 June 2017).
- Hess, R. An open-source SIFTLibrary. In Proceedings of the 18th ACM International Conference on Multimedia, Firenze, Italy, 25–29 October 2010; pp. 1493–1496. [Google Scholar]
- Rublee, E.; Rabaud, V.; Konolige, K.; Bradski, G. ORB: An efficient alternative to SIFT or SURF. In Proceedings of the 2011 IEEE International Conference on Computer Vision (ICCV), Barcelona, Spain, 6–13 November 2011; pp. 2564–2571. [Google Scholar]
- Chum, O.; Matas, J. Optimal randomized RANSAC. IEEE Trans. Pattern Anal. Mach. Intell. 2008, 30, 1472–1482. [Google Scholar] [CrossRef] [PubMed]
- Hough, P.V.C. Method and Means for Recognizing Complex Patterns. U.S. Patent 3,069,654, 18 December 1962. [Google Scholar]
- Li, X.; Larson, M.; Hanjalic, A. Pairwise geometric matching for large-scale object retrieval. In Proceedings of the IEEE Conference on Computer Vision and Pattern Recognition, New York, NY, USA, 15–17 June 1993; pp. 5153–5161. [Google Scholar]
- Lu, L.; Zhang, Y.; Tao, P. Geometrical Consistency Voting Strategy for Outlier Detection in Image Matching. Photogramm. Eng. Remote Sens. 2016, 82, 559–570. [Google Scholar] [CrossRef]
- Tsai, C.H.; Lin, Y.C. An accelerated image matching technique for UAV orthoimage registration. ISPRS J. Photogramm. Remote Sens. 2017, 128, 130–145. [Google Scholar] [CrossRef]
- Zhuo, X.; Koch, T.; Kurz, F.; Fraundorfer, F.; Reinartz, P. Automatic UAV Image Geo-Registration by Matching UAV Images to Georeferenced Image Data. Remote Sens. 2017, 9, 376. [Google Scholar] [CrossRef]
- Jiang, S.; Jiang, W. Hierarchical Motion Consistency Constraint for Efficient Geometrical Verification in UAV Image Matching. ISPRS J. Photogramm. Remote Sens. 2018, 142, 222–242. [Google Scholar] [CrossRef]
- Rodriguez, E.; Morris, C.S.; Belz, J.E. A global assessment of the SRTM performance. Photogramm. Eng. Remote Sens. 2006, 72, 249–260. [Google Scholar] [CrossRef]
- Graham, R.L.; Hell, P. On the history of the minimum spanning tree problem. Ann. Hist. Comput. 1985, 7, 43–57. [Google Scholar] [CrossRef]
- Kruskal, J.B. On the shortest spanning subtree of a graph and the traveling salesman problem. Proc. Am. Math. Soc. 1956, 7, 48–50. [Google Scholar] [CrossRef]
- Hu, H.; Zhu, Q.; Du, Z.; Zhang, Y.; Ding, Y. Reliable spatial relationship constrained feature point matching of oblique aerial images. Photogramm. Eng. Remote Sens. 2015, 81, 49–58. [Google Scholar] [CrossRef]
- Agarwal, S.; Snavely, N.; Seitz, S.; Szeliski, R. Bundle adjustment in the large. In European Conference on Computer Vision; Springer: Berlin, Germany, 2010; pp. 29–42. [Google Scholar]
- Snavely, N.; Seitz, S.M.; Szeliski, R. Photo tourism: Exploring photo collections in 3D. In ACM Transactions on Graphics (TOG); ACM: Boston, MA, USA, 2006; Volume 25, pp. 835–846. [Google Scholar]
- Chum, O.; Matas, J.; Kittler, J. Locally optimized RANSAC. In Joint Pattern Recognition Symposium; Springer: Berlin/Heidelberg, Germany, 2003; pp. 236–243. [Google Scholar]
- Rupnik, E.; Daakir, M.; Deseilligny, M.P. MicMac—A free, open-source solution for photogrammetry. Open Geosp. Data Softw. Stand. 2017, 2, 14. [Google Scholar] [CrossRef]
- Agisoft PhotoScan. Available online: http://www.agisoft.com/ (accessed on 19 March 2018).
- Agisoft PhotoScan Manual. Available online: http://www.agisoft.com/downloads/user-manuals/ (accessed on 19 March 2018).
- MicMac. Available online: http://www.tapenade.gamsau.archi.fr/TAPEnADe/Tools.html (accessed on 19 March 2018).
- Vedaldi, A.; Fulkerson, B. VLFeat: An Open and Portable Library of Computer Vision Algorithms. 2018. Available online: http://www.vlfeat.org/ (accessed on 19 March 2018).
- Arya, S.; Mount, D.M.; Netanyahu, N.S.; Silverman, R.; Wu, A.Y. An optimal algorithm for approximate nearest neighbor searching fixed dimensions. J. ACM 1998, 45, 891–923. [Google Scholar] [CrossRef] [Green Version]
Figure 1.
Overall workflow for efficient SfM of oblique UAV images.

Figure 2.
Illustrations for (a) edge weight and (b) edge expansion [17].
Figure 2.
Illustrations for (a) edge weight and (b) edge expansion [17].

Figure 3.
Illustration of the HMCC algorithm [31].
Figure 3.
Illustration of the HMCC algorithm [31].

Figure 4.
Hough voting for the HMCC: (a) direction; (b) direction change.

Figure 5.
Integrated solution for efficient SfM of oblique UAV images.


Figure 7.
Image topological connection network: (a,b) dataset 1; (c,d) dataset 2; (e,f) dataset 3; (g,h) dataset 4 [12,17].

Figure 8.
Feature matching of one image pair from dataset 2: (a,b) without the tiling strategy; (c,d) with the tiling strategy.
Figure 8.
Feature matching of one image pair from dataset 2: (a,b) without the tiling strategy; (c,d) with the tiling strategy.

Figure 9.
Feature matching of one image pair from dataset 3: (a) without the tiling strategy; (b) with the tiling strategy.
Figure 9.
Feature matching of one image pair from dataset 3: (a) without the tiling strategy; (b) with the tiling strategy.

Figure 10.
Feature matching of one image pair from dataset 3: (a) without the tiling strategy; (b) with the tiling strategy.
Figure 10.
Feature matching of one image pair from dataset 3: (a) without the tiling strategy; (b) with the tiling strategy.

Figure 11.
Efficiency comparison of individual image pair: (a) LO-RANSAC; (b,c) GC-RANSAC; (d,e) HMCC-RANSAC.
Figure 11.
Efficiency comparison of individual image pair: (a) LO-RANSAC; (b,c) GC-RANSAC; (d,e) HMCC-RANSAC.

Figure 12.
Efficiency comparison: (a) number of image pairs; (b) time costs of feature matching.

Figure 13.
Reconstruction models of dataset 1: (a) MicMac; (b) PhotoScan-init; (c) PhotoScan-opt; (d) Ours.
Figure 13.
Reconstruction models of dataset 1: (a) MicMac; (b) PhotoScan-init; (c) PhotoScan-opt; (d) Ours.

Figure 14.
Ground control points in the second test site [2].
Figure 14.
Ground control points in the second test site [2].

Figure 15.
RMSEs for bundle adjustment tests of dataset 2 with GCPs: (a) MicMac; (b) PhotoScan; (c) Ours.
Figure 15.
RMSEs for bundle adjustment tests of dataset 2 with GCPs: (a) MicMac; (b) PhotoScan; (c) Ours.

Figure 16.
Individual residuals for bundle adjustment tests of dataset 2 with GCPs: (a) x-direction; (b) y-direction; (c) z-direction.
Figure 16.
Individual residuals for bundle adjustment tests of dataset 2 with GCPs: (a) x-direction; (b) y-direction; (c) z-direction.


Table 1.
The configuration of the MST-Expansion algorithm.
| Item Name | Value or Description |
|---|---|
| Inputs | Flight control data, camera install angles, mean altitude |
| Outpus | Image match pairs |
| Parameters | Overlap ratio |
| Weight ratio | |
| Eigenvalue ratio | |
| Expansion angle | |
| Expansion threshold |
Table 2.
The configuration of the tiling strategy.
| Item Name | Value or Description |
|---|---|
| Inputs | Two UAV images |
| Outpus | Feature matches |
| Parameters | Scale size |
| Block size | |
| Block expansion size |
Table 3.
The configuration of the tiling strategy.
| Item Name | Value or Description |
|---|---|
| Inputs | Initial matches, rough POS, mean altitude |
| Outpus | Inlier matches |
| Parameters | K nearest neighbors (KNN) |
| Z-score test | |
| Neighbor ratio for step 1 | |
| Neighbor ratio for step 2 |
Table 4.
Detailed information for data acquisition of the four datasets.
| Item Name | Dataset 1 | Dataset 2 | Dataset 3 | Dataset 4 |
|---|---|---|---|---|
| UAV type | multi-rotor | multi-rotor | multi-rotor | multi-rotor |
| Flight height (m) | 165 | 120 | 175 | 300 |
| Camera mode | Sony RX1R | Sony RX1R | Sony NEX-7 | Sony ILCE-7R |
| Number of cameras | 1 | 2 | 5 | 1 |
| Focal length (mm) | 35 | 35 | nadir: 16 oblique: 35 | 35 |
| Camera mount angle () | front: 25, −15 | front: 25, −15 back: 0, −25 | nadir: 0 oblique: 45/−45 | nadir: 0 oblique: 45/−45 |
| Number of images | 320 | 390 | 750 | 157 |
| Image size (pixel × pixel) | 6000 × 4000 | 6000 × 4000 | 6000 × 4000 | 7360 × 4912 |
| GSD (cm) | 5.05 | 3.67 | 4.27 | 4.20 |
Table 5.
Statistical results of geometrical verification (in seconds).
| Dataset | LO-RANSAC | GC-RANSAC | HMCC-RANSAC | ||||
|---|---|---|---|---|---|---|---|
| Filter | Verify | Sum | Filter | Verify | Sum | ||
| 1 | 24.3 | 15,594.6 | 15.5 | 15,610.1 | 14.8 | 15.6 | 30.4 |
| 2 | 11.1 | 9670.4 | 10.2 | 9680.6 | 23.9 | 10.7 | 34.6 |
| 3 | 125.7 | 7828.1 | 74.6 | 7902.7 | 14.6 | 61.8 | 76.4 |
| 4 | 47.9 | 6262.5 | 30.6 | 6293.1 | 5.7 | 22.4 | 28.1 |
Table 6.
Software configuration for comparison tests.
| Item Name | MicMac | PhotoScan |
|---|---|---|
| Use POS data | yes | yes |
| Use GPU acceleration | no (8 CPU cores) | yes (1 GPU + 8 CPU cores) |
| Use tiling strategy | yes (SIFT++ library) | yes |
| Image pair selection | POS aided | POS aided + multi-scale |
| Image size | half | original |
| Key point limit | 0 | 80,000 |
| Tie point limit | 0 | 0 |
Table 7.
Time costs in feature matching for the four datasets (in minutes).
| Method | Dataset 1 | Dataset 2 | Dataset 3 | Dataset 4 |
|---|---|---|---|---|
| MicMac | 722.12 | 928.05 | 2920.76 | 892.04 |
| PhotoScan | 65.24 | 102.03 | 146.04 | 33.52 |
| Ours | 21.01 | 21.56 | 47.98 | 9.15 |
Table 8.
The numbers of connected images and 3D points for completeness comparison.
| Dataset | MicMac | PhotoScan | Ours | ||||
|---|---|---|---|---|---|---|---|
| Images | Points | Images | Points-init | Points-opt | Images | Points | |
| 1 | 320/320 | 878,469 | 320/320 | 1,648,706 | 711,808 | 320/320 | 689,035 |
| 2 | 390/390 | 853,545 | 390/390 | 2,289,047 | 785,513 | 390/390 | 675,811 |
| 3 | 750/750 | 913,854 | 750/750 | 2,314,535 | 905,815 | 750/750 | 848,129 |
| 4 | 157/157 | 376,821 | 157/157 | 832,850 | 393,674 | 157/157 | 333,034 |
Table 9.
Relative accuracy for bundle adjustment tests without GCPs (in pixels).
| Dataset | MicMac | PhotoScan | Ours | |
|---|---|---|---|---|
| Initial | Optimization | |||
| 1 | 0.994 | 0.928 | 0.404 | 0.378 |
| 2 | 0.768 | 0.728 | 0.242 | 0.295 |
| 3 | 1.484 | 1.350 | 0.562 | 0.477 |
| 4 | 0.876 | 0.775 | 0.319 | 0.291 |
© 2018 by the authors. Licensee MDPI, Basel, Switzerland. This article is an open access article distributed under the terms and conditions of the Creative Commons Attribution (CC BY) license (http://creativecommons.org/licenses/by/4.0/).
Share and Cite
MDPI and ACS Style
Jiang, S.; Jiang, W. Efficient SfM for Oblique UAV Images: From Match Pair Selection to Geometrical Verification. Remote Sens. 2018, 10, 1246. https://0-doi-org.brum.beds.ac.uk/10.3390/rs10081246
AMA Style
Jiang S, Jiang W. Efficient SfM for Oblique UAV Images: From Match Pair Selection to Geometrical Verification. Remote Sensing. 2018; 10(8):1246. https://0-doi-org.brum.beds.ac.uk/10.3390/rs10081246
Chicago/Turabian StyleJiang, San, and Wanshou Jiang. 2018. "Efficient SfM for Oblique UAV Images: From Match Pair Selection to Geometrical Verification" Remote Sensing 10, no. 8: 1246. https://0-doi-org.brum.beds.ac.uk/10.3390/rs10081246
Note that from the first issue of 2016, this journal uses article numbers instead of page numbers. See further details here.