Article

FVI—A Floating Vegetation Index Formed with Three Near-IR Channels in the 1.0–1.24 μm Spectral Range for the Detection of Vegetation Floating over Water Surfaces

Remote Sensing Division, Code 7230, Naval Research Laboratory, Washington, DC 20375, USA
*
Author to whom correspondence should be addressed.
Submission received: 11 July 2018 / Revised: 25 August 2018 / Accepted: 5 September 2018 / Published: 7 September 2018

Abstract

:
Through the analysis of hyperspectral imaging data collected over water surfaces covered by floating vegetation, such as Sargassum and algae, we observed that the spectra commonly contain a reflectance peak centered near 1.07 μm. This peak results from the competing effects between the well-known vegetation reflectance plateau in the 0.81–1.3 μm spectral range and the absorption effects above 0.75 μm by liquid water within the vegetation and in the surrounding water bodies. In this article, we propose a new index, namely the floating vegetation index (FVI), for the hyperspectral remote sensing of vegetation over surface layers of oceans and inland lakes. In the formulation of the FVI, one channel centered near 1.0 μm and another 1.24 μm are used to form a linear baseline. The reflectance value of the third channel centered at the 1.07-μm reflectance peak above the baseline is defined as the FVI. Hyperspectral imaging data acquired with the AVIRIS (Airborne Visible Infrared Imaging Spectrometer) instrument over the Gulf of Mexico and over salt ponds near Moffett Field in southern portions of the San Francisco Bay were used to demonstrate the success in detecting Sargassum and floating algae with this index. It is expected that the use of this index for the global detection of floating vegetation from hyperspectral imaging data to be acquired with future satellite sensors will result in improved detection and therefore enhanced capability in estimating primary production, a measure of how much carbon is fixed per unit area per day by oceans and inland lakes.

Graphical Abstract

1. Introduction

Multi-channel satellite instruments, such as MODIS (Moderate Resolution Imaging Spectroradiometer) [1,2], MERIS (Medium Resolution Imaging Spectrometer) [3], SeaWiFS (Sea-Viewing Wide Field-of-View Sensor) [4], VIIRS (Visible Infrared Imaging Radiometer Suite) [5], and OLCI (Ocean and Land Color Instrument) [6], were designed for remote sensing of ocean color over open ocean waters. The retrieving algorithms for these instruments were mainly designed for the derivation of ocean constitutes suspended or dissolved in water, such as chlorophyll-a (Chl-a) concentration, absorption coefficients of colored dissolved organic matter (CDOM), and diffuse attenuation coefficient. The Chl-a data product does not fully include the chlorophyll-a contained in vegetation floating on water surfaces due to the fact that relevant bright pixels are frequently masked out prior to Chl-a retrieval. The use of the standard Chl-a data product for the derivation of ocean primary production can, therefore, result in an underestimation of primary production (which is a measure of carbon fixing rate per unit area per day).
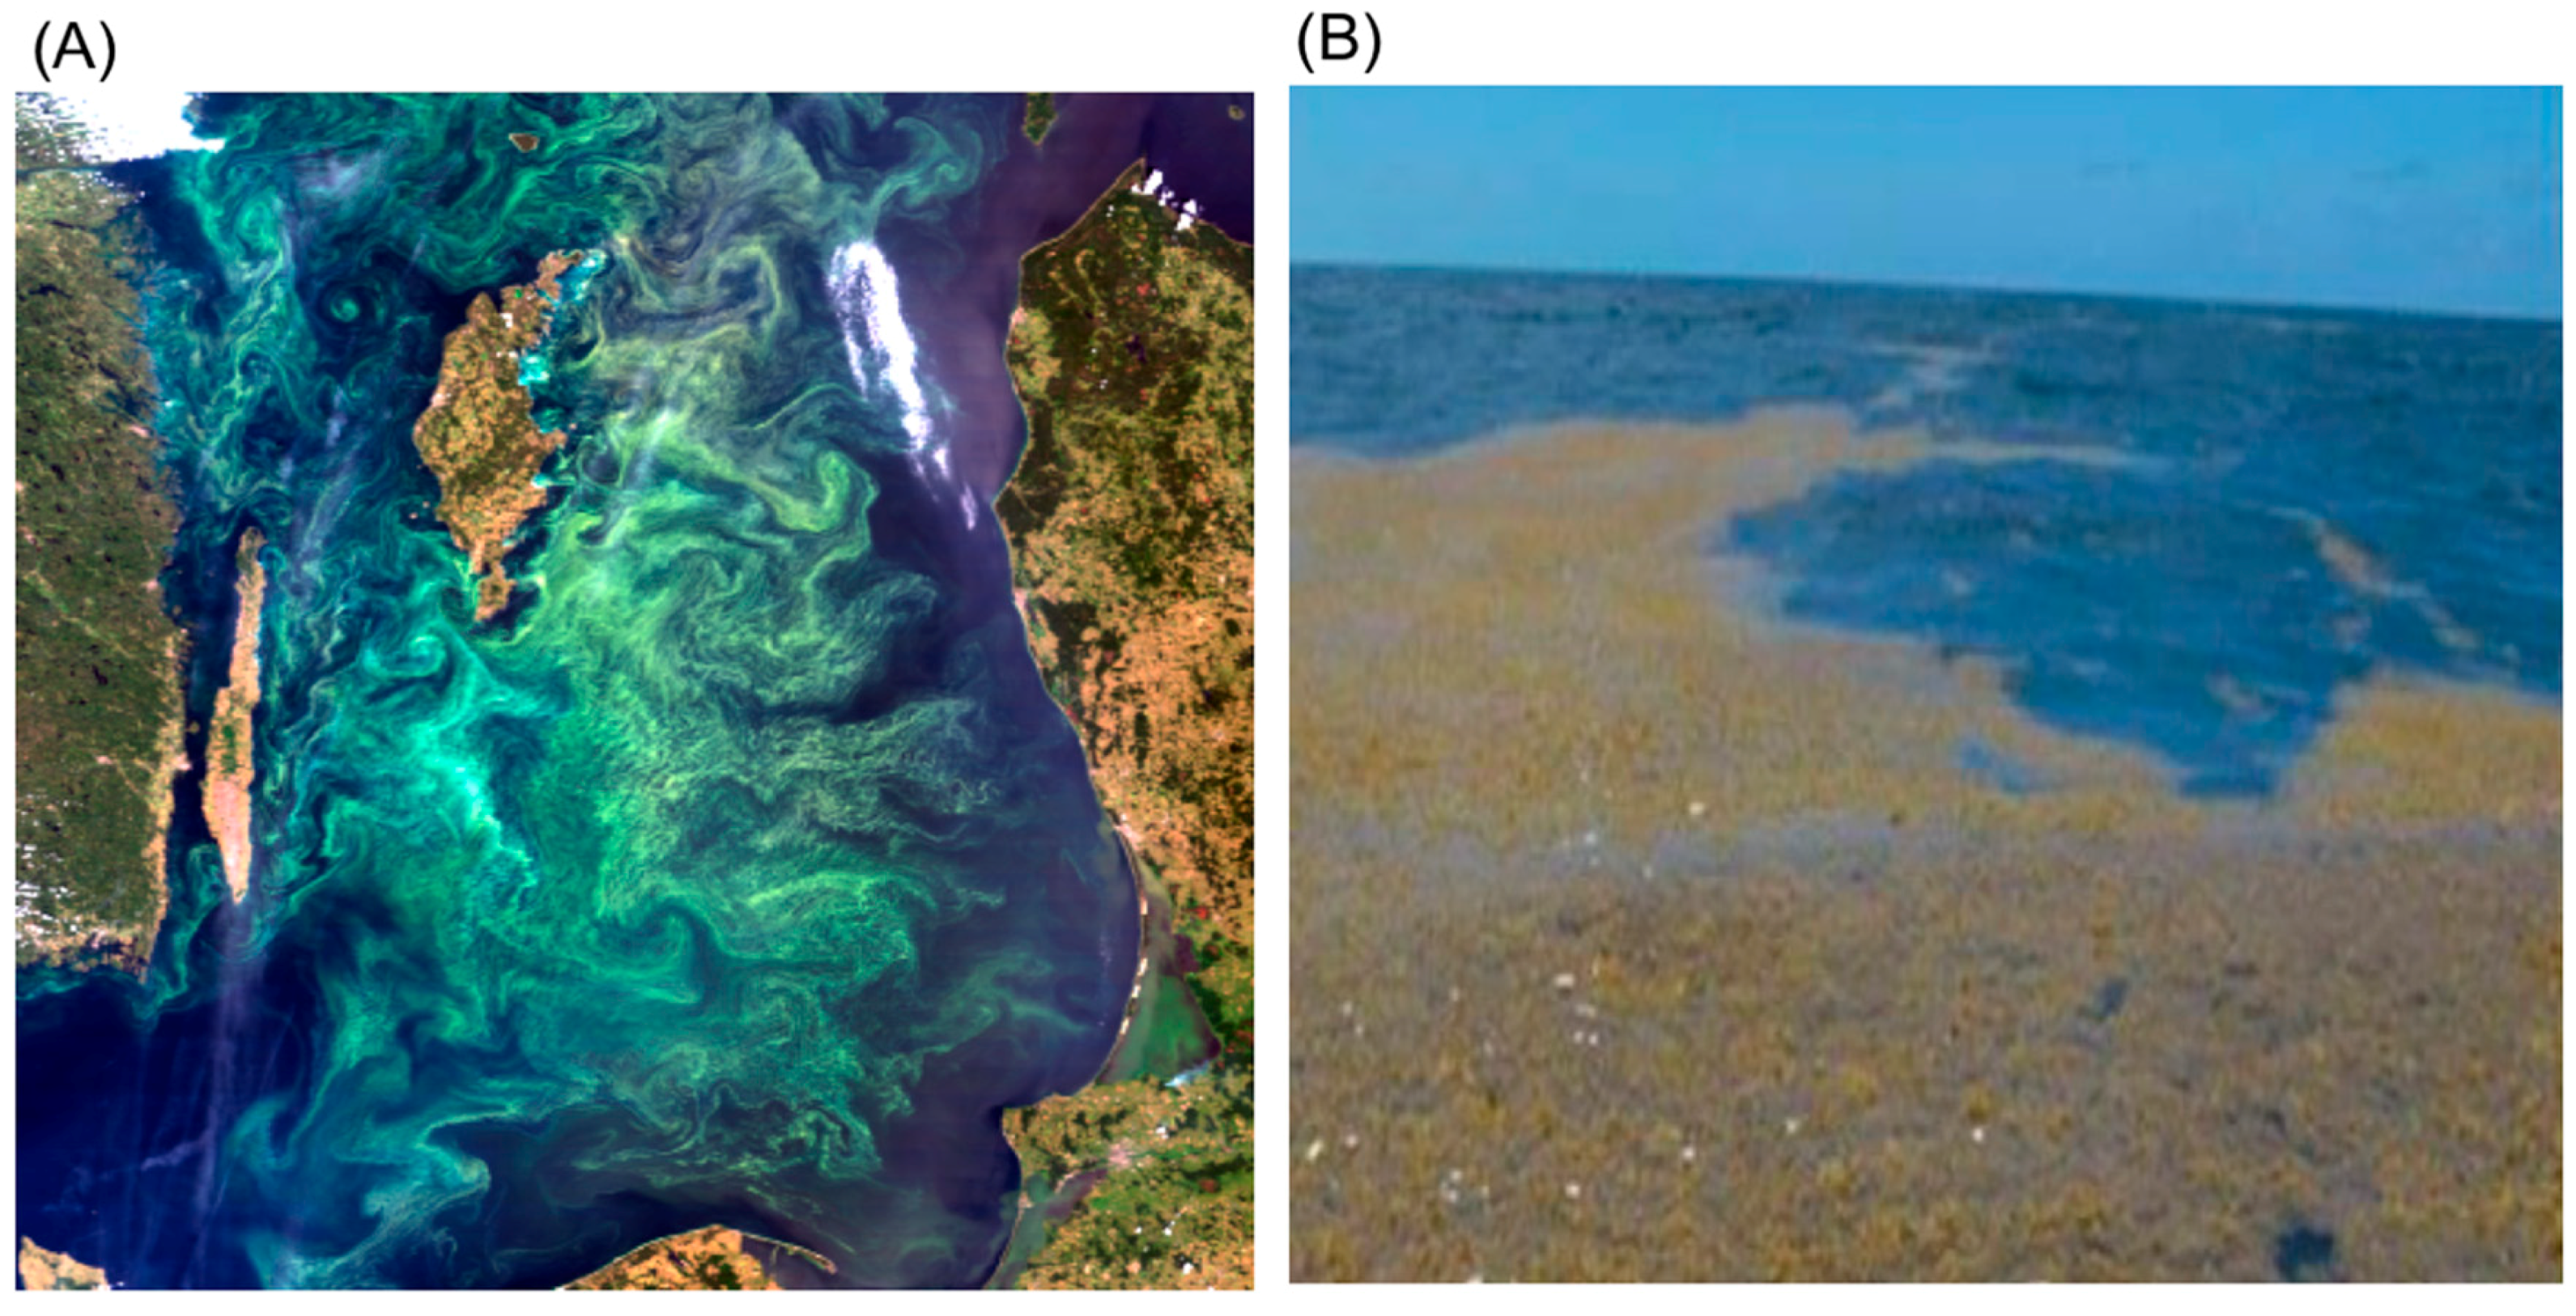
In certain situations, particularly algae bloom cases, floating vegetation can cover a large portion of a given water area. Figure 1A presents an example of a green algae blooming event. A true color RGB image (Red: 0.66 μm; Green: 0.55 μm; Blue: 0.47 μm) from a MODIS data set acquired over the Baltic Sea on 13 July 2005 is shown. It is obvious to see that large portions of the water surfaces were covered by floating green-colored algae. The ocean color data products over the large area were hardly derived with the operational NASA MODIS algorithm [7]. Therefore, the use of such data products for the estimation of the primary production would result in a significant underestimation of the primary production over the area. 
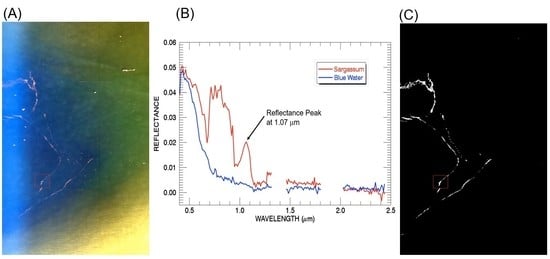
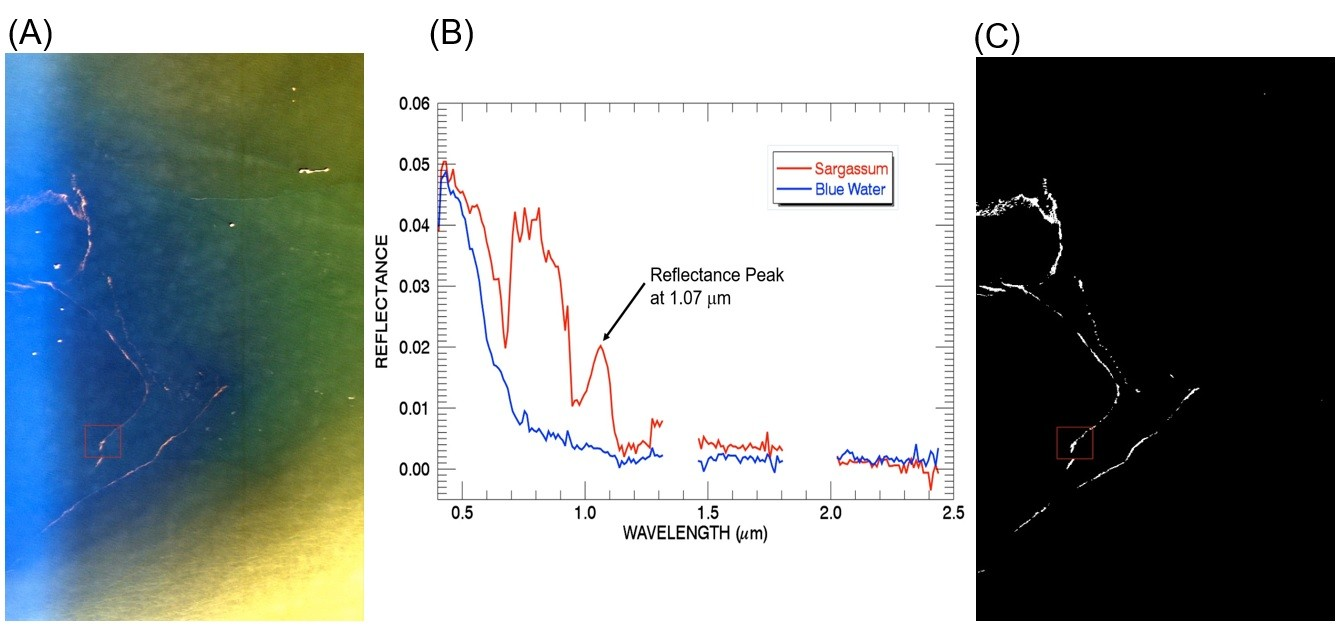
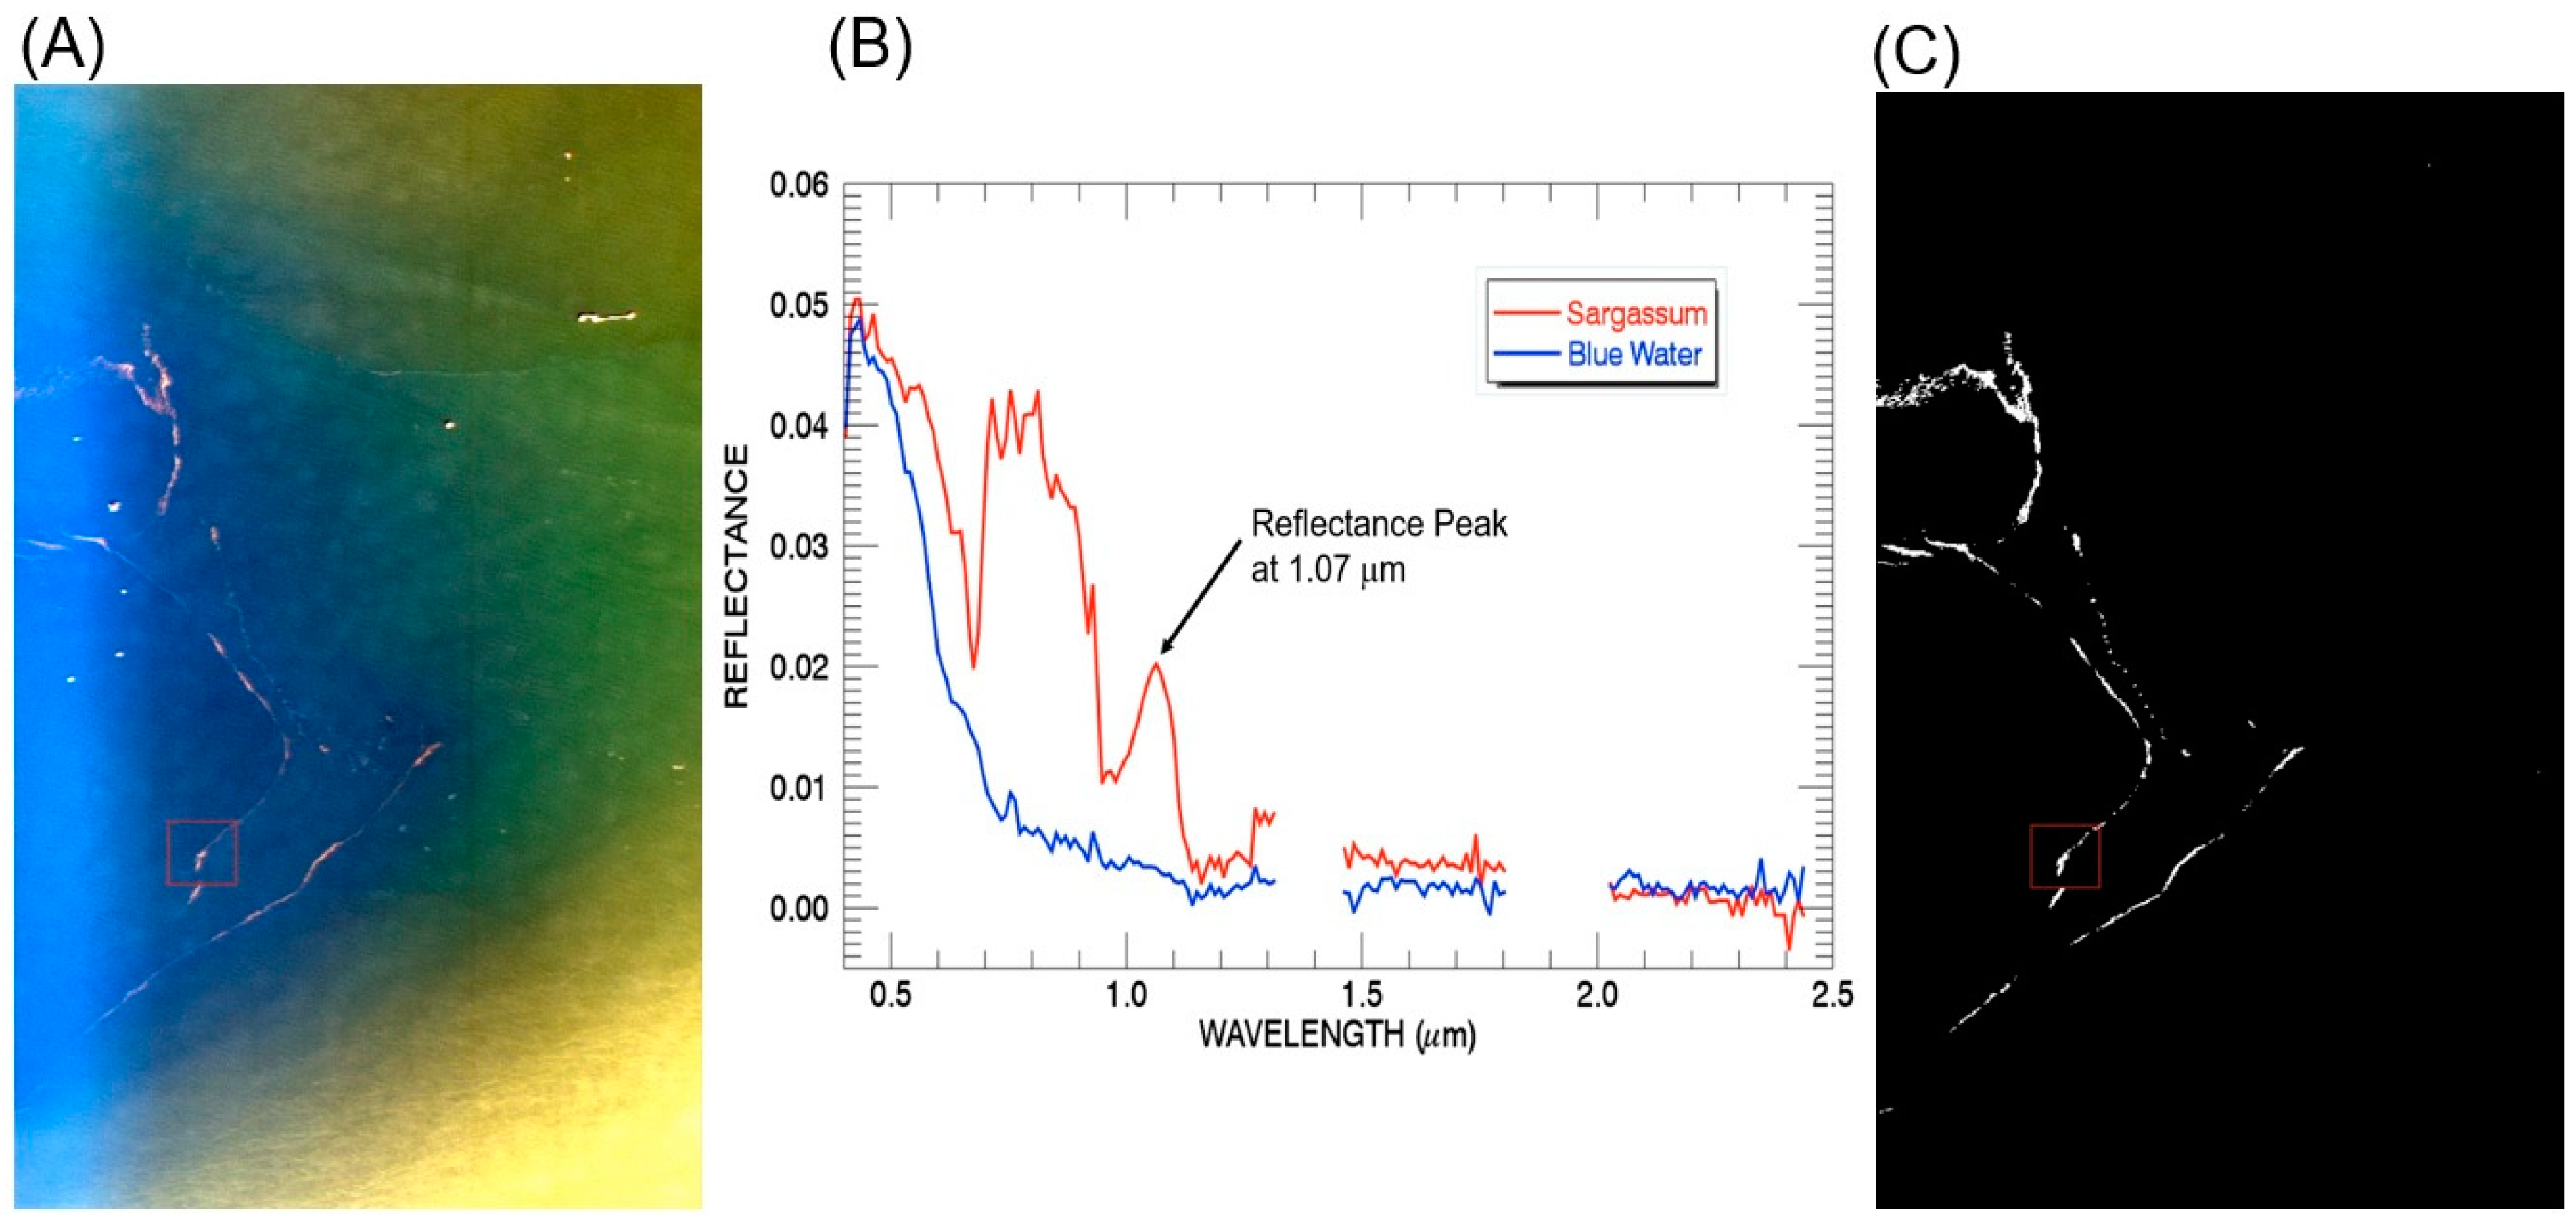
Figure 1B shows a photo taken from a sailing boat over an area south of Bermuda in late May of 2013 [8]. The brown-colored floating macroalgae Sargassum is seen.
Although large algae bloom features are often seen easily from MODIS-like images at a spatial resolution of approximately 1 km, smaller floating vegetation features can be difficult to identify from MODIS-like images. Gower et al. [9] first reported the capability of observing extensive lines of floating Sargassum in the Gulf of Mexico from MERIS, MODIS, and SeaWiFS images. Gower and King [10] used the maximum chlorophyll index (MCI) to make the first mapping of the full distribution of the population of Sargassum in the Gulf of Mexico. This index is formed with three MERIS narrow channels [11]. The radiances of the channels centered near 0.681 μm and 0.754 μm are used to define a linear baseline. The 0.709-μm MERIS channel is located within a small peak reflection region over highly productive waters. The radiance of this channel above the baseline is defined as MCI.
Unlike MERIS, MODIS does not have a channel to center at 0.709 μm. Hu [12] invented a different index, namely the floating algae index (FAI), and used it to detect floating algae in an open ocean environment from MODIS data. In the formulation of this index, a red channel (RED) centered near 0.66 μm and a SWIR (shortwave IR) channel centered near 1.24 μm are used to form a linear baseline. The reflectance of a near-IR (NIR) channel centered approximately at 0.86 μm above the baseline is defined as FAI. Since the 0.86-μm channel is located in the green vegetation’s high reflecting plateau spectral range (~0.81–1.3 μm), FAI essentially uses the higher reflectance value of the 0.86-μm channel above the background level for the detection of floating algae. It is known that, for all channels below about 0.75 μm, their reflectance values are not only affected by chlorophyll absorption, but also by scattering effects from suspended organic and inorganic particles in the water. In view of the presence of particle scattering effects, the MODIS 0.66-μm channel and the MERIS 0.681-μm channel are not ideally suited for use as anchoring channels to define the baselines and to form the FAI and MCI indices, respectively. This will be described further in a later portion of this article. Different FAI threshold values, even negative values, have been used in the detection of floating vegetation pixels from MODIS images [13].
Through analysis of the hyperspectral imaging data collected over water surfaces covered by floating vegetation, such as Sargassum and algae, we observed that the spectra commonly contain a reflectance peak centered near 1.07 μm. This peak results from the competing effects between the well-known vegetation reflectance plateau in the 0.81–1.3 μm spectral range and the absorption effects above 0.75 μm by liquid waters within the vegetation and in the surrounding water bodies. In this article, we propose a new index, namely the floating vegetation index (FVI), for the hyperspectral remote sensing of vegetation, regardless of green, red, or brown colored vegetation, floating on the water surfaces of oceans and inland lakes. Hyperspectral imaging data acquired with the NASA JPL AVIRIS (Airborne Visible Infrared Imaging Spectrometer) [14,15] over the Gulf of Mexico and over salt evaporation ponds near Moffett Field in southern portions of the San Francisco Bay were used to demonstrate the success in detecting Sargassum and floating algae with this index.

2. Materials and Methods

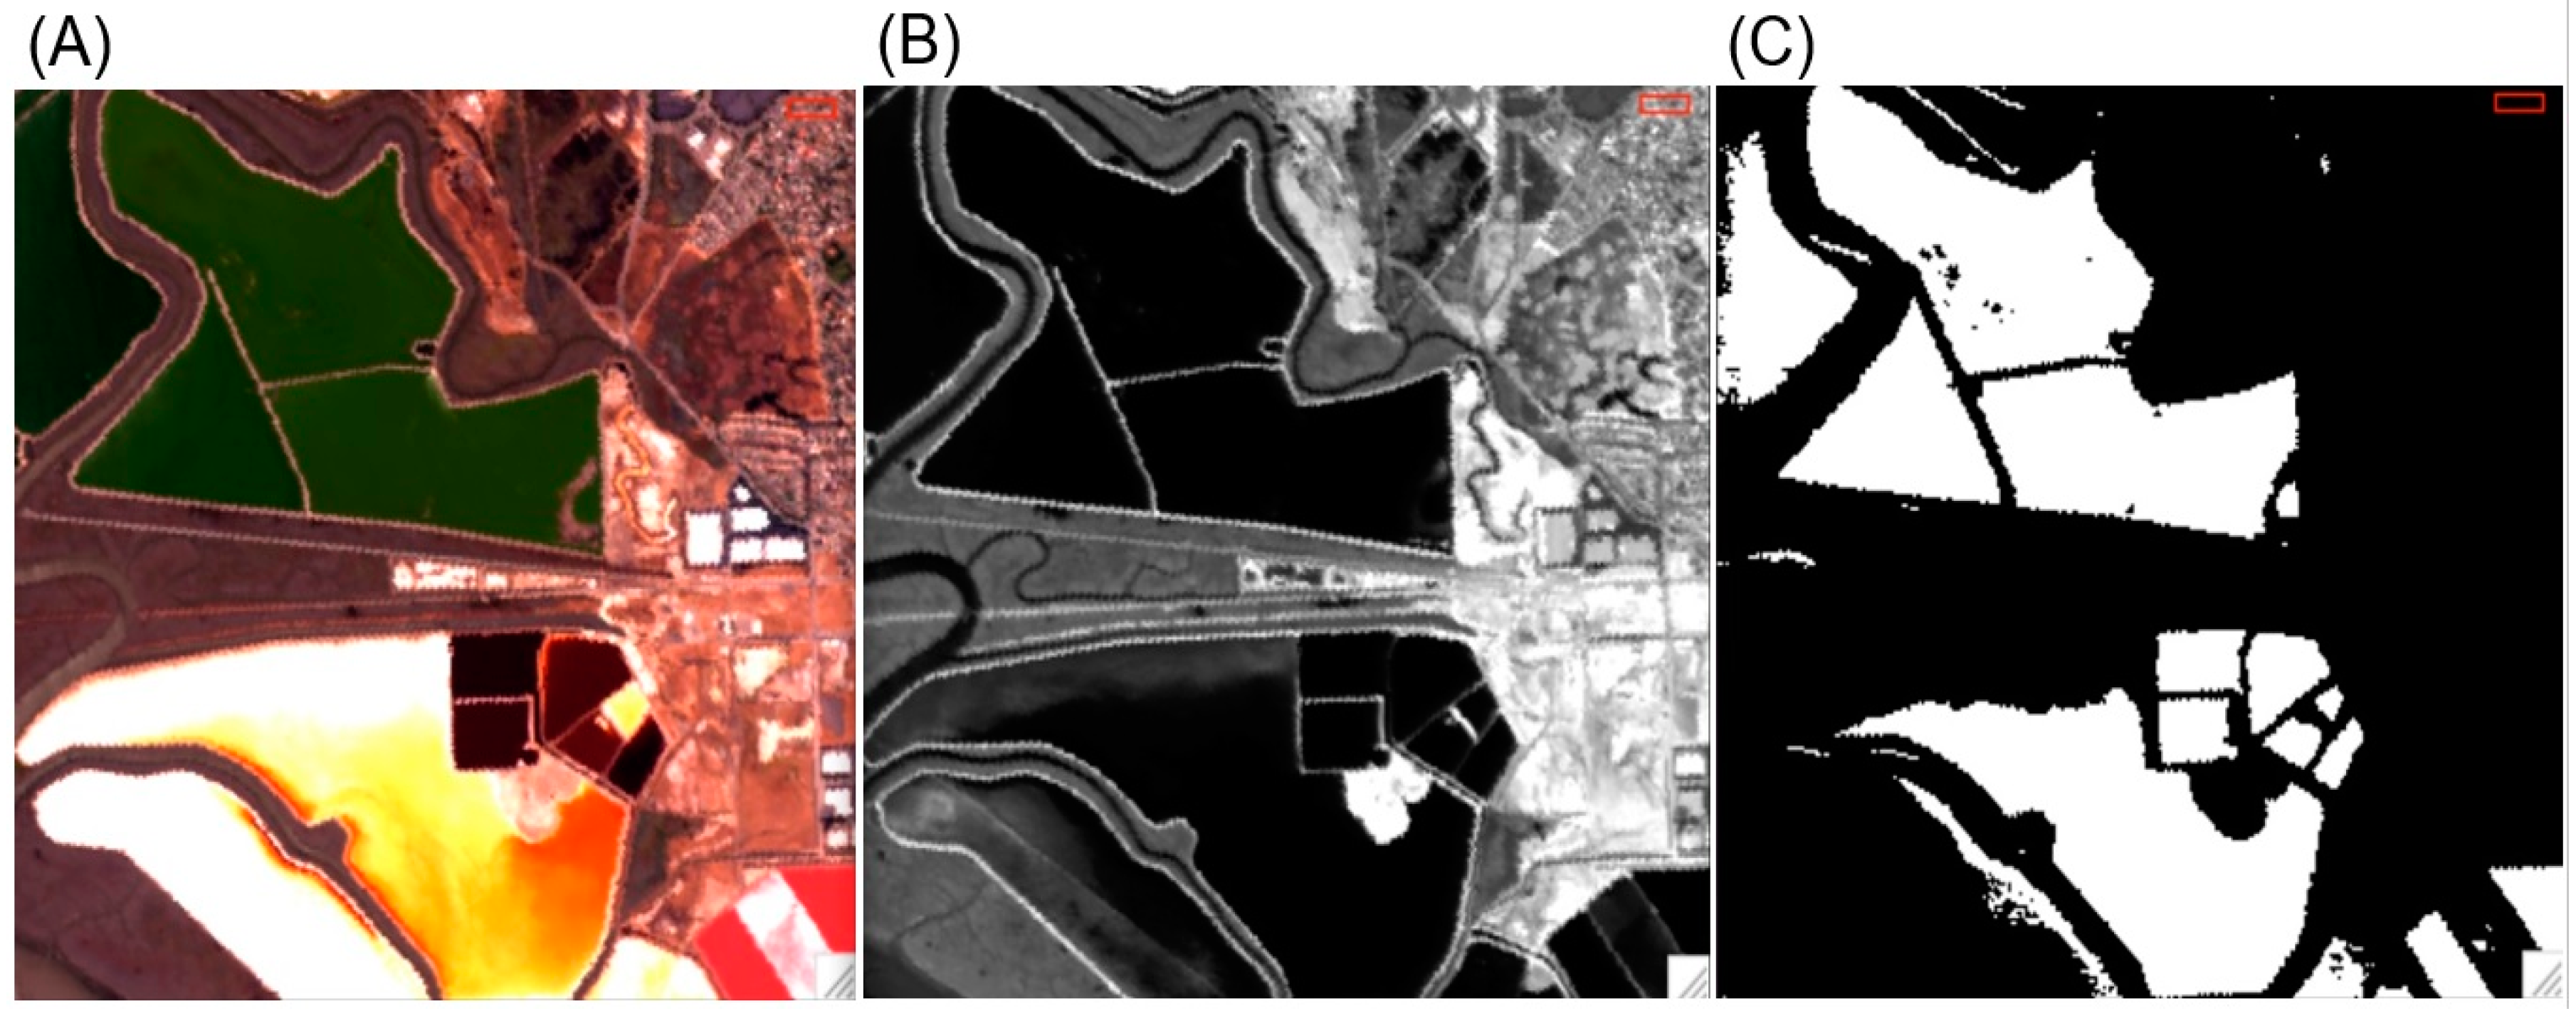
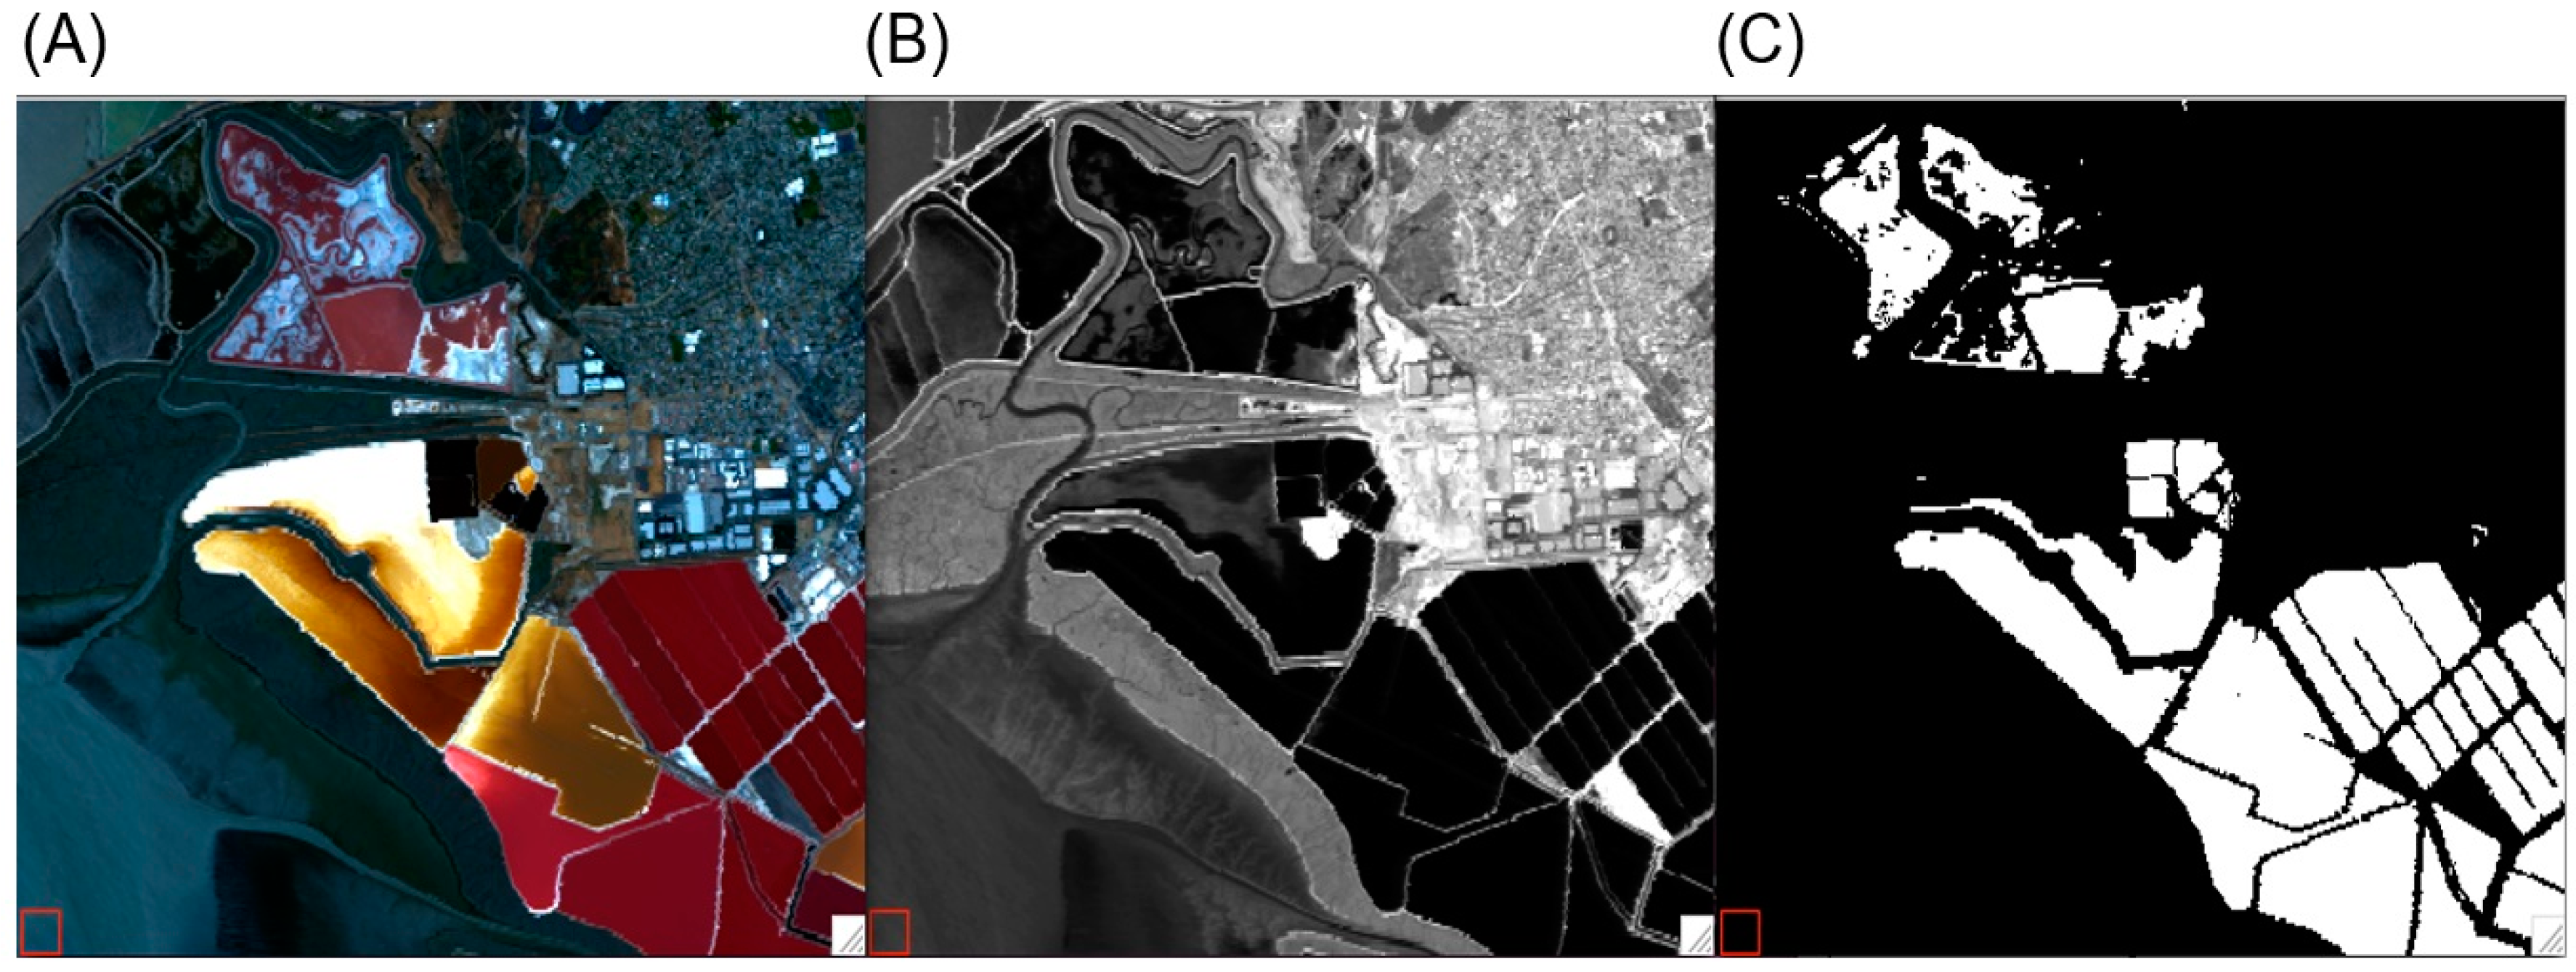
AVIRIS is an airborne imaging spectrometer built by the NASA Jet Propulsion Lab in the late 1980s, but it has been continuously upgraded for approximately 30 years. It can measure spectral radiances (W/m2-sr-μm) data from the high altitude ER-2 aircraft at an altitude of 20 km with a pixel size of 20 m on the ground. It has contiguous spectral coverage from about 0.365 μm to 2.5 μm with 224 narrow spectral channels. It can also operate from aircraft flying at lower altitudes and acquire data at a higher spatial resolution with the same 224 channels. Here we use a specific AVIRIS data set acquired over salt evaporation ponds in the southern portion of the San Francisco Bay at UTC 20:21:00 on 26 August 2009 to illustrate the FVI concept and the deficiency of the red channels used in the formation of the MODIS FAI and MERIS MCI indices.
Figure 2A is an RGB image of the scene. The upper left portion shows several ponds covered by green algae. The lower portion shows ponds covered by brown to red colored algae. 
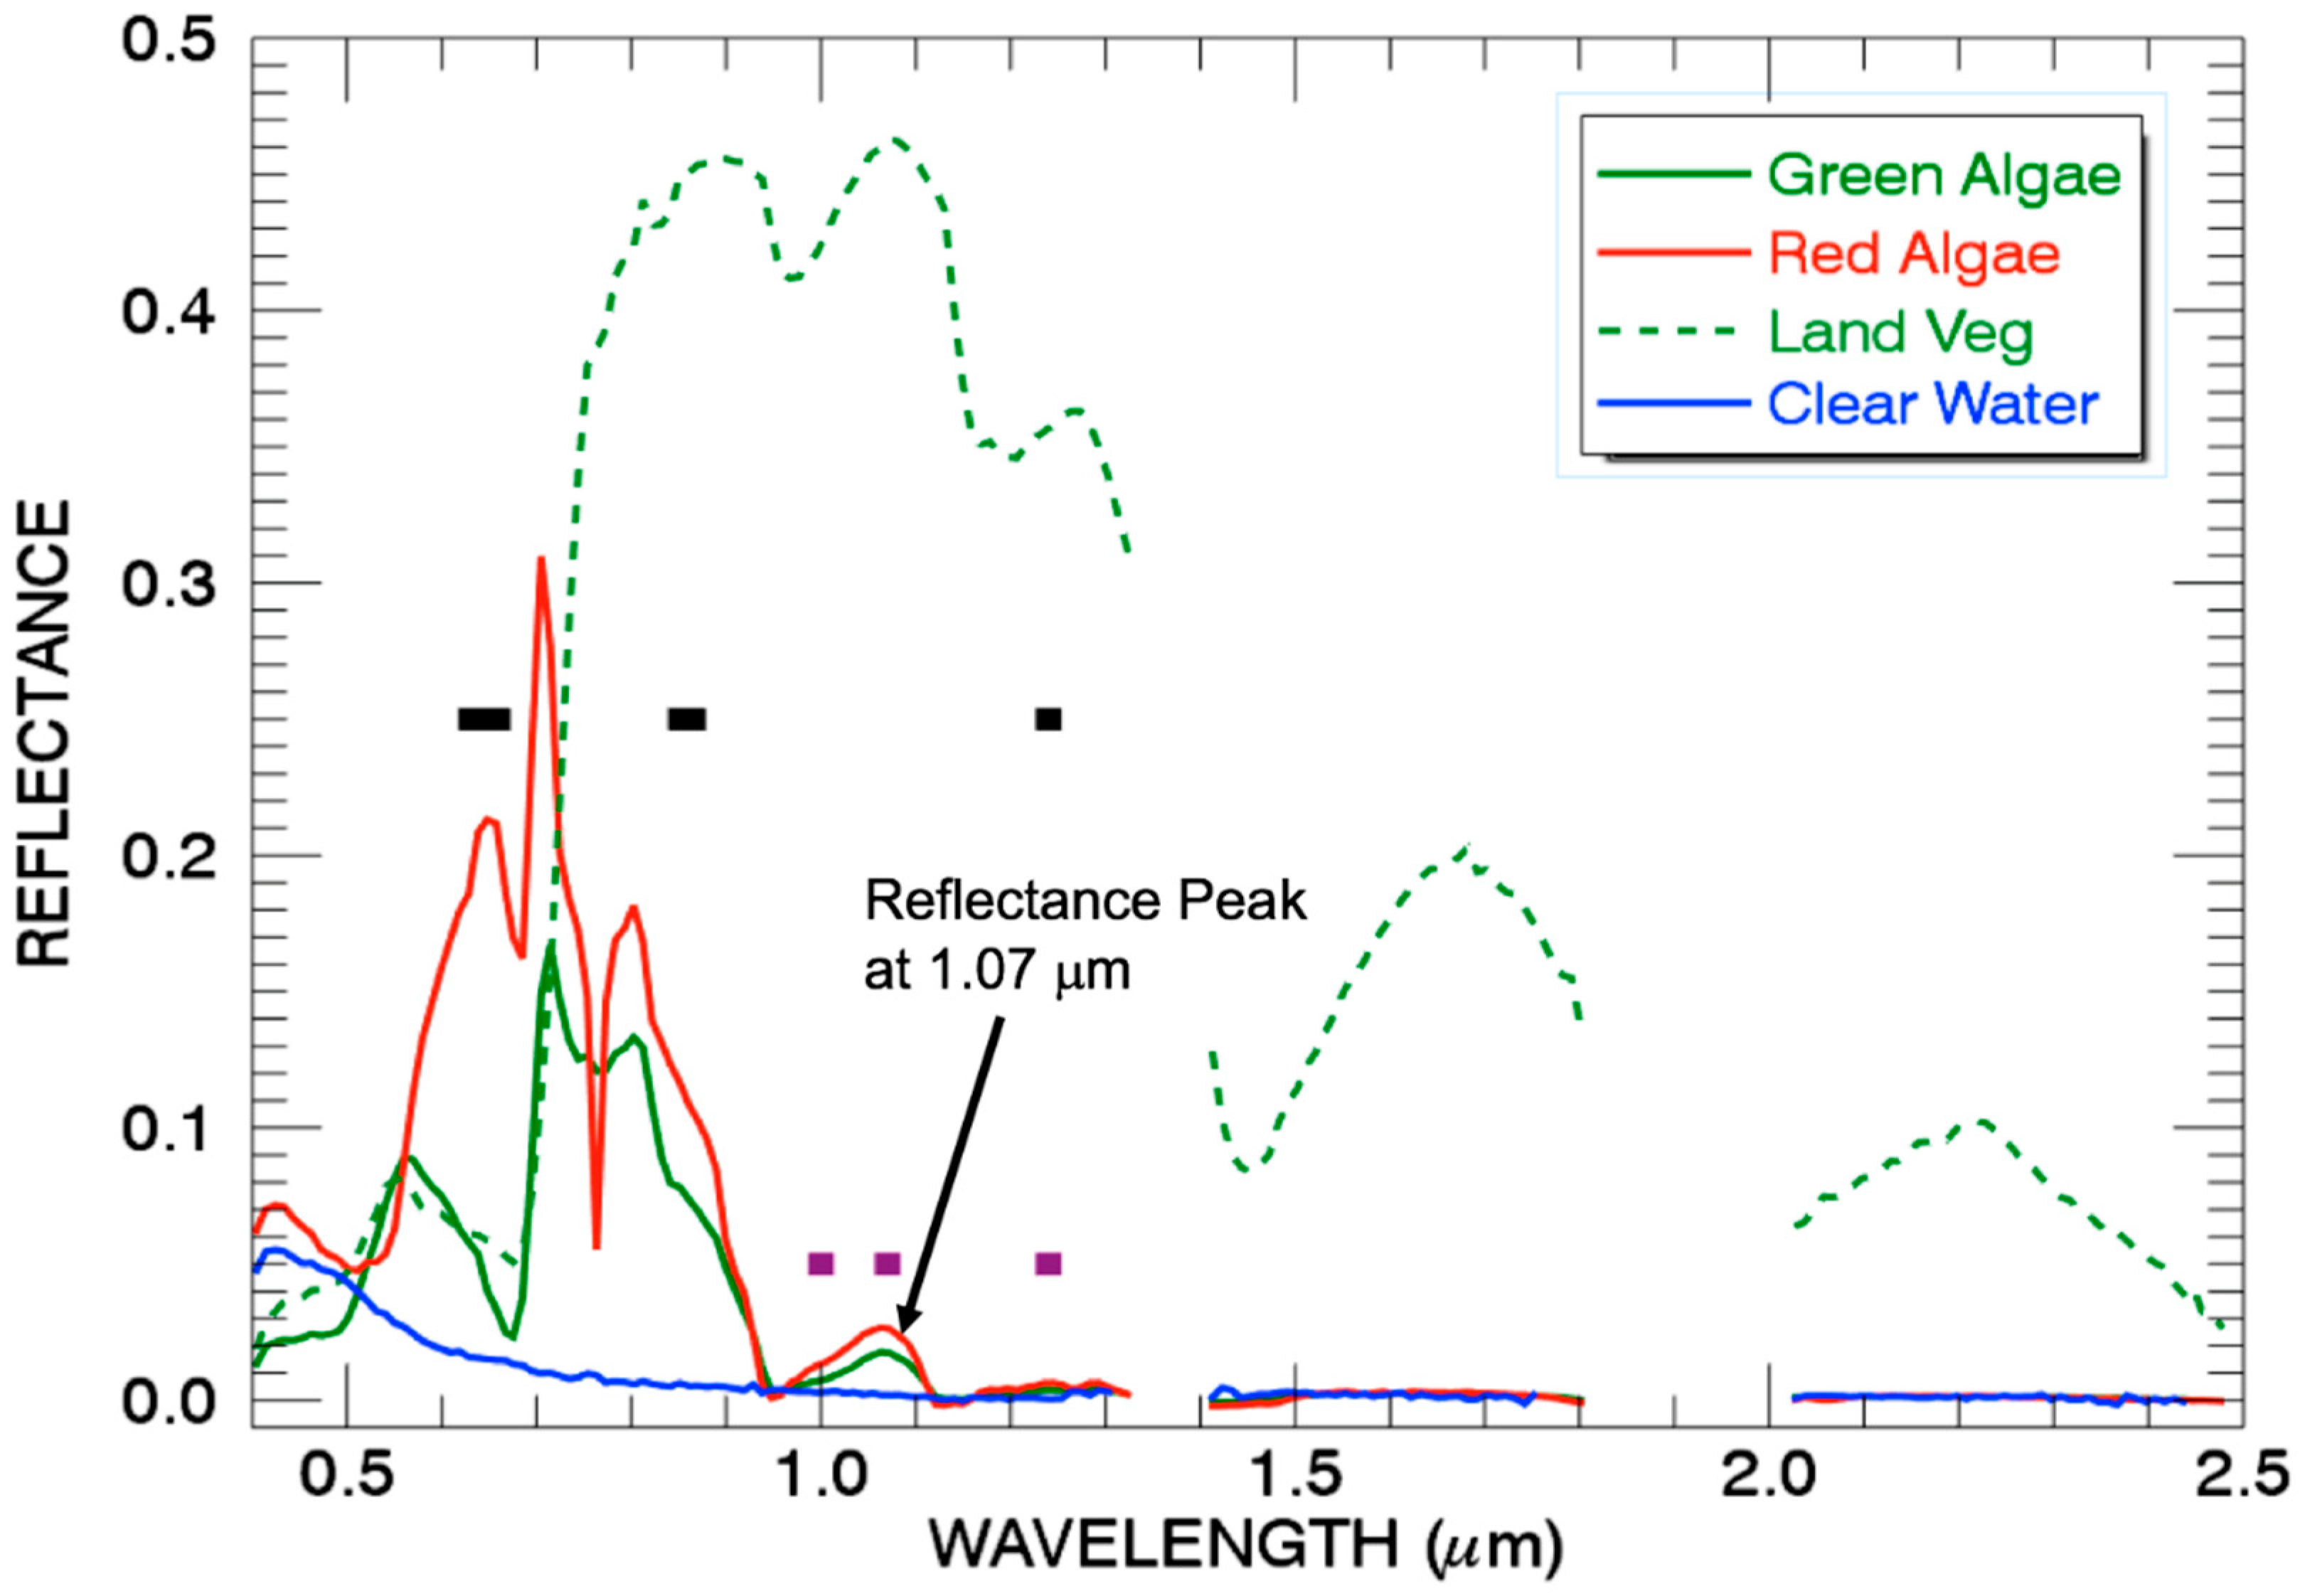
Figure 3 shows examples of reflectance spectra over areas covered by green algae and red algae. Here the reflectance at a given wavelength λ is defined as πLu(λ)/Ed(λ), where Lu(λ) is the upward radiance just above the surface assuming the surface is a Lambertian reflector, and Ed(λ) is the downward irradiance just above the surface. The reflectance spectra were derived from the AVIRIS-measured radiance spectra using our hyperspectral atmospheric correction code named ATREM (atmosphere removal algorithm) [16]. For the Figure 3 green colored spectrum, which is the mean spectrum of about 550 green algae pixels, a reflectance peak centered near 0.55 μm is observed. This peak verifies the fact that the color of the algae should be green to our eyes. For the red colored spectrum, which is the average spectrum of approximately 220 pixels, the reflectances in the 0.6–0.68 μm range are much larger than those near 0.55 μm, and therefore the color of the algae should indeed be red. The short and thick black horizontal bars in Figure 3 also illustrate the positions and widths of the MODIS RED (0.66-μm), NIR (0.86-μm), and SWIR (1.24-μm) channels. These three MODIS channels were used in the formation of FAI [12]. From the contiguous spectra in Figure 3, we were able to simulate the MODIS RED, NIR, and SWIR channels, and then to generate a FAI image for the scene. The FAI value corresponding to the green algae spectrum is 0.045, which is positive. However, the FAI value corresponding to the red algae spectrum is −0.022. The negative red algae FAI value is due to the fact that the RED channel received additional radiance from scattering by organic and inorganic particles in the water. After using the RED channel and SWIR channel reflectances to form a linear baseline, the interpolated reflectance value at the NIR bandpass is greater than the actual NIR reflectance value, and therefore results in a negative FAI. When the FAI becomes negative, the NIR channel is no longer a good measure of the high reflectance plateau above the baseline.
From Figure 3, it can be seen that the average reflectance values over the RED bandpass for the green algae spectrum and the red algae spectrum are very different. In view of the quite different RED channel reflectance values of green algae and red algae, it is conceivable that the MODIS RED channel is not ideally suited for use as an anchoring channel to define the linear baseline used in the computation of the FAI value. In practice, researchers [13] had to use a negative FAI threshold value in order to identify algae pixels from a MODIS data set acquired over Lake Taihu in the south-eastern part of China. The scattering problem for the MERIS red channel (0.681 μm) used in the formation of the MCI index [11] was also recognized previously [12].
By careful examination of the green and red algae spectra in the 0.95–1.3 μm range, a local reflectance peak centered at 1.07 μm was observed in both spectra. In order to explain the 1.07-μm reflectance maximum and the nearly zero reflectance of the two spectra in the 1.3–2.5 μm spectra range, two additional reflectance spectra are also shown in Figure 3. One is a green vegetation spectrum over a land surface located within the Figure 2A scene, and the other is a clear water spectrum in the Figure 4A scene. For the green vegetation spectrum, the reflectance maximum near 0.55 μm was present, a red edge located in the 0.69 and 0.81 μm spectral range (where the reflectance increases rapidly with increasing wavelength) was observed, and a high reflectance plateau in the ~0.81–1.3 μm was also present. Due to the absorption by liquid water within green vegetation, two weak liquid water absorption bands centered near 0.97 and 1.20 μm were also seen. The general shape of this green vegetation reflectance spectra was very similar to that of the green vegetation spectra compiled in a NASA report [17] for remote sensing and application purposes. For the clear water spectrum in Figure 3A, the reflectance values generally decrease with increasing wavelengths in the 0.4–0.75 μm spectral range. Beyond 0.75 μm, the reflectances are approximately zero due to the fact that the solar radiation penetrated below the water surface is mostly absorbed by liquid water under the surface. For the floating green algae and red algae pixels, the algae are saturated with liquid water, and a reflectance peak centered near 1.07 μm was observed in both spectra. This peak results from the competing effects between the vegetation reflectance plateau in the 0.81–1.3 μm spectral range and the absorption effects above 0.75 μm by liquid water located within algae and in the surrounding water bodies. The 1.07-μm reflectance peak was also present in the field-measured reflectance spectra over a floating sea plant wrack [18]. By now, we have provided a qualitative explanation of the presence of the 1.07-μm reflectance peak in the reflectance spectra acquired over the floating vegetation according to the vegetation reflectance and liquid water absorption properties.
Based on the shapes of green algae and red algae spectra in the 0.95–1.3 μm spectral range in Figure 3, we propose to use three narrow channels centered at 1.0, 1.07, and 1.24 μm to form a new index, namely the floating vegetation index (FVI). The center positions and widths of the three channels are illustrated as short thick purple bars. The reason for the selection of the 1.07-μm channel is obvious, because the channel is located at the reflectance peak position and also at an atmospheric ‘window’ region where the water vapor absorption effect is minimal [16]. The 1.24-μm channel is also an atmospheric window channel that has been implemented on many satellite instruments. This channel has a greater liquid water absorption effect than the 1.07-μm channel, as seen from the Figure 3 green vegetation reflectance spectrum over land. The 1.0-μm channel has similar properties in terms of atmospheric window and liquid water absorption as that of the 1.24-μm channel. We use the 1.0-μm channel reflectance (R1.0) and the 1.24-μm channel reflectance (R1.24) to form a linear baseline. The reflectance of the 1.07-μm channel (R1.07) above the linearly interpolated baseline value at 1.07 μm (RB1.07) is defined as FVI. The mathematical formulation is
FVI = R1.07 − RB1.07
with
RB1.07 = R1.0 + [R1.24 − R1.0] × (1.07 − 1.0)/(1.24 − 1.0)
At present, the FVI values can be calculated from spectrally contiguous hyperspectral data acquired with AVIRIS or other imaging spectrometers with a similar spectral coverage. It should be pointed out that, because both the 1.0-μm and 1.24-μm channels are hardly affected by the scattering effects of organic and inorganic particles underneath the water surface [12], the two channels are ideally suited for use in defining the linear baseline for the formation of FVI. On the other hand, because the RED channel centered near 0.66-μm is strongly affected by the scattering effects of particles within the water bodies, it is not suited for use as an anchoring channel to define a linear baseline [12].

3. Results

Three sets of hyperspectral imaging data acquired with the NASA JPL AVIRIS instrument over the Gulf of Mexico and over salt ponds near Moffett Field in the southern portions of San Francisco Bay were used to demonstrate the success in detecting Sargassum and floating algae with the newly formed FVI index.

3.1. Green and Red Colored Salt Ponds, San Francisco Bay, August 2009

One set of AVIRIS imaging data acquired on 26 August 2009 over the salt evaporation ponds in the southern portion of the San Francisco Bay near Moffett Field was selected for this study. The RGB image of the scene is shown in Figure 2A, as described previously. The acquisition of this AVIRIS data set and a few other data sets over the general Moffett Field areas between 2005 and 2011 were made primarily to support the South Bay Salt Pond Restoration Project [19]. The salt ponds in the Figure 2A scene were not included in the restoration efforts, i.e.; the ponds were left for continued salt production purposes. Our selection of this data set was influenced by the pioneering work of Richardson [20] on the remote sensing of algal bloom dynamics using AVIRIS data over the same area in the early 1990s. Basically, as sea water is pumped into ponds for salt extraction evaporation, dissolved nutrients are concentrated along with salt content, which supports the rapid growth of algae. As the salt concentration increases continuously with time, the dominating algae type over the pond also changes. The corresponding color changes can be observed by human eyes as well as with satellite instruments [20]. From the Figure 2A image, it is seen that several ponds in the upper left portion of the scene were covered by green colored algae. A few ponds in the lower portion of the scene were covered by brown to red colored algae. The color differences for different ponds were likely due to the fact that the ponds were in different stages of evaporation and the salt contents in different ponds were different at the time of the AVIRIS data acquisition.
Figure 2B is the B/W image of the 2.25-μm channel for the scene. The salt ponds, either green or red colored ponds in Figure 2A, appear quite dark in the Figure 2B image. This is because of strong absorption at 2.25 μm by liquid water located within algae and in the surrounding water body (for those pixels partially covered by algae and partially exposed to standing water). We retrieved spectral surface reflectances from the AVIRIS-measured radiances of the scene using the ATREM code [16], then computed the FVI for the scene according to Equation (1) from the retrieved surface reflectances. We also applied a land/water mask using the 2.25-μm reflectance image. Pixels with 2.25-μm reflectance values greater than 0.01 were masked out as land. With those tests, we found a FVI threshold value of 0.001, i.e.; pixels with FVI values greater than the threshold were classified as pixels containing floating vegetation, while those pixels with FVI values less than or equal to 0.001 (even negative values) were classified as pixels not containing floating vegetation. Figure 2C shows our derived floating vegetation mask image. By comparing Figure 2C with Figure 2A, it can be seen that almost all the ponds, either green colored or red colored ponds, have been selected in the Figure 2C image.

3.2. Sargassum Lines, Gulf of Mexico, May 2010

The second set of the AVIRIS data selected for this study was acquired over the Gulf of Mexico west of the Mississippi Bird-Foot Delta on 24 May 2010. The same AVIRIS scene was previously studied in detail [21] to establish the spectral and spatial requirements for remote measurements of pelagic Sargassum macroalgae. Hu et al. [21] identified the linear features in the AVIRIS scene to be Sargassum features. They used the requirement that radiances of the 0.704-μm channel be greater than that of the 0.675-μm channel in order to delineate the Sargassum features from other floating objects, such as boats. Figure 4A is an RGB image for the AVIRIS scene. The image was stretched in order to reveal the linearly-shaped Sargassum features. Using the data analysis procedures described in Section 3.1, including making hyperspectral atmospheric corrections and applications of the same threshold values, we calculated the float vegetation index (FVI).
Figure 4B shows a sample water-leaving reflectance spectrum for the Sargassum pixel located at the center of the red square in the lower left portion of Figure 4A and another spectrum over a nearby clear water pixel. The shapes of the Sargassum spectrum in the 0.4–1.3 μm spectral range are quite different from those of the clear water spectrum. For the Sargassum spectrum, the local reflectance maximum peak at 1.07 μm can be clearly seen. One weak absorption feature centered at 0.625 μm, which is related to the absorption by phycocyanin (a pigment component in algae) [8,20], can be seen. A major absorption feature centered at 0.67 μm, which is related to chlorophyll in algae, is also seen. Figure 4C shows our derived FVI mask image. By comparing this figure with Figure 5B from Hu et al. [21], it can be seen that our identified Sargassum features agree with those of Hu et al.

3.3. Red Colored Salt Ponds, San Francisco Bay, June 2008

The third set of AVIRIS data selected for this study was acquired on 11 June 2008 also over salt evaporation ponds in the southern portion of the San Francisco Bay near Moffett Field. Figure 5A–C are similar to Figure 2A–C, respectively, except that they were processed from the 11 June 2008 AVIRIS data set. In Figure 5A, most ponds are covered by red colored algae. Almost no green colored ponds are seen. As mentioned earlier, the color of the ponds changes with time as evaporation goes on continuously. We used similar data analysis procedures to those described in Section 3.1, including making hyperspectral atmospheric corrections and applying threshold values to the relevant data. The FVI threshold value for this case was selected as 0.001, the same value as the previous two cases. However, in this case we selected a larger 2.25-μm channel threshold value of 0.02, instead of 0.01 in the previous cases, to mask out brighter land pixels. The larger threshold value was needed because the June 2008 data was acquired under a higher sun angle condition (solar elevation angle ~75.6 degree), while the late August 2009 data was acquired under a lower sun angle condition (solar elevation angle ~62.7 degree). The bi-directional reflectance factors of the land surface materials for the two data sets were different. By comparing the Figure 5C image with the Figure 5A image as well as with the dark ponds in Figure 5B, it can be seen that almost all the red colored ponds in the Figure 5A image were properly selected as ponds covered by floating vegetation.

4. Discussion

The FVI index described here cannot be calculated from data collected with the current generation of satellite sensors, such as MODIS, VIIRS, and OLCI, because these instruments do not have narrow channels centered near 1.0 and 1.07 μm, as illustrated in Figure 3. The FVI can be calculated from data collected with airborne sensors, including AVIRIS which has contiguous spectral coverage from 0.365 to 2.5 μm, or similar sensors, such as the imaging spectrometer built for the National Ecological Observatory Network [22] in Boulder, Colorado USA by the Jet Propulsion Lab. FVI would be most useful for detecting areas covered by floating vegetation from data to be acquired with the near future hyperspectral sensor, such as Germany’s hyperspectral satellite for Earth observation (EnMap) [23], and a hyperspectral sensor currently under consideration by NASA for the future surface biology and geology satellite mission [24]. It should be pointed out that we have only used a few sets of AVIRIS data for the development of the FVI index. The index has not been quantitatively validated in large case studies. Such validation studies can be made in the future when more hyperspectral imaging data sets acquired over areas covered by floating vegetation with different hyperspectral sensors become available.
When large portions of water pixels are covered by floating plastic debris or whitecaps, the reflectance values for channels near 1 μm can be enhanced [25]. Under such situations, the FVI values calculated according to Equation (1) for these pixels are expected to be comparable with those from pixels containing floating vegetation. The use of FVI alone would not be able to separate plastic and whitecap pixels from floating vegetation pixels. Fortunately, floating vegetation generally contains absorption signatures of chlorophyll, phycocyanin, phycoerythrin, as well as other algae pigments [20], while floating plastic debris and whitecaps do not have similar absorption features [25]. Therefore, it is possible to separate floating vegetation pixels from those pixels containing floating plastic debris or whitecaps in hyperspectral imaging data.
We conducted a preliminary investigation on errors in the FVI calculations due to errors in the atmospheric corrections. We made atmospheric corrections to the Gulf of Mexico AVIRIS scene, from assuming no aerosol at all to assuming aerosol with an optical depth of 0.2 at 550 nm. The atmospheric correction results did not have any effect on the FVI calculations. We expect that when the aerosol optical depth is really large and the bottom surface is not seen well from an aircraft or a satellite platform, errors in atmospheric corrections will result in errors in the calculated FVI values.

5. Conclusions

We described a new index, the floating vegetation index (FVI), for the hyperspectral remote sensing of vegetation over surface layers of oceans and inland lakes. In the formulation of the FVI, one channel centered near 1.0 μm and another 1.24 μm are used to form a linear baseline. The reflectance value of the third channel centered on the 1.07-μm peak above the baseline is defined as the FVI. We used three sets of AVIRIS data to demonstrate the capability of using FVI to identify areas covered by Sargassum in the Gulf of Mexico and by floating algae over salt ponds in southern portions of the San Francisco Bay. The use of this index for the global detection of floating vegetation from remotely-sensed hyperspectral data to be acquired with future satellite sensors would result in improved detection and therefore enhanced capability in estimating the primary production by oceans and inland lakes in the future.

Author Contributions

B.-C.G. made the initial observation of a spectral reflectance peak for pixels covered by floating vegetation from AVIRIS data and drafted the manuscript. R.-R.L. carried out the data analysis.

Funding

This research received no external funding.

Acknowledgments

The authors are grateful to R.O. Green and S. Ludeen of Jet Propulsion Laboratory for providing the AVIRIS data used in this research, to L. Guild of the NASA Ames Research Center and to H. Dierssen of the University of Connecticut for technical discussions, and to Woody Turner of NASA Headquarters for supporting the research. This research is also supported by the US Office of Naval Research.

Conflicts of Interest

The authors declare no conflict of interest.

References

  1. Salomonson, V.V.; Barnes, W.L.; Maymon, P.W.; Montgomery, H.E.; Ostrow, H. MODIS: Advanced facility instrument for studies of the earth as a system. IEEE Trans. Geosci. Remote Sens. 1989, 27, 145–153. [Google Scholar] [CrossRef]
  2. King, M.D.; Menzel, W.P.; Kaufman, Y.J.; Tanré, D.; Gao, B.C.; Platnick, S.; Ackerman, S.A.; Remer, L.A.; Pincus, R.; Hubanks, P.A. Cloud and aerosol properties, precipitable water, and profiles of temperature and humidity from MODIS. IEEE Trans. Geosci. Remote Sens. 2003, 41, 442–458. [Google Scholar] [CrossRef]
  3. Rast, M.; Bezy, J.L.; Bruzzi, S. The ESA Medium Resolution Imaging Spectrometer MERIS: A review of the instrument and its mission. Int. J. Remote Sens. 1999, 20, 1681–1702. [Google Scholar] [CrossRef]
  4. Hooker, S.B.; Esaias, W.E.; Feldman, G.C.; Gregg, W.W.; McClain, C.R. SeaWiFS Technical Report Series: Volume 1, An Overview of SeaWiFS and Ocean Color. Available online: https://ntrs.nasa.gov/archive/nasa/casi.ntrs.nasa.gov/19920020443.pdf (accessed on 1 May 2018).
  5. Murphy, R.; Guenther, B.; Ip, J.; Jackson, J.; Olenijczak, D.; Iisager, B.; Hutchison, K. Update on the algorithmic basis and predicted performance of selected VIIRS environmental data records. In Proceedings of the 2006 IEEE International Symposium on Geoscience and Remote Sensing, Denver, CO, USA, 31 July–4 August 2006. [Google Scholar]
  6. Donlon, C.; Berruti, B.; Buongiorno, A.; Ferreira, M.H.; Féménias, P.; Frerick, J.; Goryl, P.; Klein, U.; Laur, H.; Mavrocordatos, C.; et al. The global monitoring for environment and security (GMES) Sentinel-3 mission. Remote Sens. Environ. 2012, 120, 35–57. [Google Scholar] [CrossRef]
  7. OceanColor Web. Available online: http://oceancolor.gsfc.nasa.gov (accessed on 1 May 2018).
  8. Russell, B.J.; Dierssen, H.M. Use of hyperspectral imagery to access cryptic color matching in Sargassum associated crabs. PLoS ONE 2015, 10, 1–26. [Google Scholar] [CrossRef] [PubMed]
  9. Gower, J.; Hu, C.; Borstad, G.; King, S. Ocean color satellites show extensive lines of floating Sargassum in the Gulf of Mexico. IEEE. Trans. Geosci. Remote Sens. 2006, 44, 3619–3625. [Google Scholar] [CrossRef]
  10. Gower, J.; King, S. Distribution of floating Sargassum in the Gulf of Mexico and the Atlantic Ocean mapped using MERIS. Int. J. Remote Sens. 2011, 32, 1917–1929. [Google Scholar] [CrossRef]
  11. Gower, J.; King, S.; Borstad, G.; Brown, L. Detection of intense plankton blooms using the 709 nm band of the MERIS imaging spectrometer. Int. J. Remote Sens. 2005, 26, 2005–2012. [Google Scholar] [CrossRef]
  12. Hu, C. A novel ocean color index to detect floating algae in the global oceans. Remote Sens. Environ. 2009, 113, 2118–2129. [Google Scholar] [CrossRef]
  13. Hu, C.; Lee, Z.; Ma, R.; Yu, K.; Li, D.; Shang, S. Moderate resolution imaging spectroradiometer (MODIS) observations of cyanobacteria blooms in Taihu Lake, China. J. Geophys. Res. 2010, 115, C04002. [Google Scholar] [CrossRef]
  14. Green, R.O.; Eastwood, M.L.; Sarture, C.M.; Chrien, T.G.; Aronsson, M.; Chippendale, B.J.; Faust, J.A.; Parvi, B.E.; Chovit, C.J.; Solis, M.; et al. Imaging spectrometry and the Airborne Visible/Infrared Imaging Spectrometer (AVIRIS). Remote Sens. Environ. 1998, 65, 227–248. [Google Scholar] [CrossRef]
  15. Vane, G.; Green, R.O.; Chrien, T.G.; Enmark, H.T.; Hansen, E.G.; Porter, W.M. The Airborne Visible Infrared Imaging Spectrometer. Remote Sens. Environ. 1993, 44, 127–143. [Google Scholar] [CrossRef]
  16. Gao, B.-C.; Heidebrecht, K.; Goetz, A.F.H. Derivation of scaled surface reflectances from AVIRIS data. Remote Sens. Environ. 1993, 44, 165–178. [Google Scholar] [CrossRef]
  17. Bowker, D.E.; Davis, R.E.; Myrick, D.L.; Stacy, K.; Jones, W.T. Spectral reflectances of natural targets for use in remote sensing studies. NASA Ref. Publ. 1985. Available online: https://ntrs.nasa.gov/archive/nasa/casi.ntrs.nasa.gov/19850022138.pdf.
  18. Dierssen, H.M.; Chlus, A.; Russell, B. Hyperspectral discrimination of floating mats of seagrass wrack and the macroalgae Sargassum in the coastal waters of Greater Florida Bay using airborne remote sensing. Remote Sens. Environ. 2015, 167, 247–258. [Google Scholar] [CrossRef]
  19. Technical Documents. Available online: http://www.southbayrestoration.org/documents/technical/ (accessed on 22 April 2018).
  20. Richardson, L. Remote sensing of algal bloom dynamics. BioScience 1996, 46, 492–501. [Google Scholar] [CrossRef]
  21. Hu, C.; Feng, L.; Hardy, R.F.; Hochberg, E.J. Spectral and spatial requirements of remote measurements of pelagic Sargassum macroalgae. Remote Sens. Environ. 2015, 167, 229–246. [Google Scholar] [CrossRef]
  22. National Ecological Observatory Network. Available online: https://www.neonscience.org/ (accessed on 5 September 2018).
  23. Guanter, L.; Kaufmann, H.; Segl, K.; Foerster, S.; Rogass, C.; Chabrillat, S.; Kuester, T.; Hollstein, A.; Rossner, G.; Chlebek, C.; et al. The EnMAP Spaceborne Imaging Spectroscopy Mission for Earth Observation. Remote Sens. 2015, 7, 8830–8857. [Google Scholar] [CrossRef] [Green Version]
  24. Decadal Survey. Available online: https://science.nasa.gov/earth-science/decadal-surveys (accessed on 30 May 2018).
  25. Garaba, S.; Dierssen, H. An airborne remote sensing case study of synthetic hydrocarbon detection using short wave infrared absorption features identified from marine-harvested macro- and microplastics. Remote Sens. Environ. 2018, 205, 224–235. [Google Scholar] [CrossRef]
Figure 1. (A) A true color RGB image (Red: 0.66 μm; Green: 0.55 μm; Blue: 0.47 μm) from a MODIS data set acquired over the Baltic Sea on 13 July 2005 during a major chlorophyll blooming event; (B) A photo taken of an area covered by floating brown-colored Sargassum south of Bermuda in the spring of 2013 [8].
Remotesensing 10 01421 g001
Figure 2. (A) A true color RGB image processed from an AVIRIS data set measured over salt evaporation ponds in the southern portion of the San Francisco Bay at UTC 20:21:00 on 26 August 2009 when the green and red algae were present; (B) The 2.25-μm channel image over the same area; (C) The floating vegetation mask.
Remotesensing 10 01421 g002
Figure 3. Sample AVIRIS-measured reflectance spectra over pixels covered by floating green algae, red algae, clear water, and green vegetation over land. The positions (1.0, 1.07, and 1.24 μm) and widths (20 nm) of the three channels proposed for use to form the floating vegetation index (FVI) are illustrated in short thick purple colored bars. In addition, the positions and widths of the MODIS RED, NIR, and SWIR channels used in the formation of MODIS FAI [12] are illustrated in short thick black bars.
Remotesensing 10 01421 g003
Figure 4. (A) A true color RGB image from an AVIRIS data set measured over the Gulf of Mexico in the west of the Mississippi Bird-Foot Delta at UTC 1425 on 24 May 2010; (B) A reflectance spectrum of a Sargassum pixel, and that of a nearby clear water pixel; (C) The floating vegetation mask.
Remotesensing 10 01421 g004
Figure 5. (A) A true color RGB image processed from an AVIRIS data set measured over salt evaporation ponds in the southern portion of the San Francisco Bay at UTC 2002 on 11 June 2008 when the red-colored algae were present; (B) the 2.25-μm channel image over the same area; (C) the floating vegetation mask.
Remotesensing 10 01421 g005

