Article

Drought-Induced Reduction in Net Primary Productivity across Mainland China from 1982 to 2015

1
School of Civil Engineering and Transportation, South China University of Technology, Guangzhou 510641, China
2
South China Institute of Environment Sciences, Ministry of Environment Protection of PRC, Guangzhou 510535, China
3
Guangdong Engineering Technology Research Center of Safety and Greenization for Water Conservancy Project, Guangzhou 510641, China
4
Center for Water Resource and Environment, Sun Yat-Sen University, Guangzhou 510275, China
5
The Prairie Research Institute, University of Illinois at Urbana-Champaign, 2204 Griffith Drive, Champaign, IL 61820, USA
6
State Key Laboratory of Simulation and Regulation of Water Cycle in River Basin, Research Center on Flood and Drought Disaster Reduction of the Ministry of Water Resources, China Institute of Water Resources and Hydropower Research, Beijing 100038, China
7
Department of Ecology, Jinan University, Guangzhou 510632, China
8
Department of Environmental Engineering, School of Environmental Science and Engineering, Guangdong University of Technology, Guangzhou 510006, China
*
Authors to whom correspondence should be addressed.
Submission received: 13 July 2018 / Revised: 16 August 2018 / Accepted: 5 September 2018 / Published: 8 September 2018
(This article belongs to the Special Issue Remote Sensing of Primary Productivity)

Abstract

:
Terrestrial net primary productivity (NPP) plays an essential role in the global carbon cycle as well as for climate change. However, in the past three decades, terrestrial ecosystems across mainland China suffered from frequent drought and, to date, the adverse impacts on NPP remain uncertain. This study explored the spatiotemporal features of NPP and discussed the influences of drought on NPP across mainland China from 1982 to 2015 using the Carnegie Ames Stanford Application (CASA) model and the standardized precipitation evapotranspiration index (SPEI). The obtained results indicate that: (1) The total annual NPP across mainland China showed an non-significantly increasing trend from 1982 to 2015, with annual increase of 0.025 Pg C; the spring NPP exhibited a significant increasing trend (0.031 Pg C year−1, p < 0.05) while the summer NPP showed a higher decreasing trend (0.019 Pg C year−1). (2) Most areas of mainland China were spatially dominated by a positive correlation between annual NPP and SPEI and a significant positive correlation was mainly observed for Northern China; specific to the nine sub-regions, annual NPP and SPEI shared similar temporal patterns with a significant positive relation in Northeastern China, Huang-Huai-Hai, Inner Mongolia, and the Gan-Xin Region. (3) During the five typical drought events, more than 23% areas of mainland China experienced drought ravage; the drought events generally caused about 30% of the NPP reduction in most of the sub-regions while the NPP in the Qinghai-Tibet Plateau Region generally decreased by about 10%.

Graphical Abstract

1. Introduction

With their vast land area and diverse ecosystems, global terrestrial ecosystems are functioning as large biological carbon sequestration bodies that partly offset fossil fuel emissions [1,2]. However, due to drought disturbances, terrestrial ecosystems contribute less to the carbon sink than previously assumed because terrestrial carbon sinks are weakening [3,4]. Even worse, the natural ecosystem affected by severe drought might change from a carbon sink into a carbon source [5,6,7]. In this case, understanding the effects of drought on ecosystems may provide a new perspective about carbon dynamics and, thus, help to develop sustainable ecosystems for humans. Terrestrial net primary productivity (NPP) is an indicator for the accumulation of atmospheric CO2 in terrestrial ecosystems and plays an essential role for the global carbon cycle as well as for climate change [8,9,10]. This index has been suggested as an integrative measure of ecosystem function, and it is a key variable for evaluating the effects of droughts on ecosystem conditions [11,12]. The exploration of the NPP response to drought disturbances presents significance for the understanding of the effects of climate change on regional/global carbon cycling.
Drought, with its long lasting and large acreage characteristics, is regarded as one of the most complex disturbances that induce profound impacts for ecosystem productivity [13]. The occurrence of frequent and severe drought interferes with numerous biochemical and physiological processes of ecosystems, including photosynthesis, respiration, and both nitrogen and protein metabolisms [14]. Long-term dry conditions also indirectly influence ecosystem productivity by increasing pest and disease infestations [3,4] and by triggering forest fires and tree mortality [15]. Additionally, frequent droughts that hit productive areas have caused abnormally high atmospheric CO2 growth rates [16]. Given the nonlinear connection between the variation of NPP and drought, for instance, a short-term water shortage in ecosystems may cause NPP losses; even worse, prolonged and severe drought can lead to increasingly high NPP losses due to the cumulatively negative impacts caused by long term water deficit [17,18]. Thus, the effects of drought on NPP have drawn a great deal of attention during recent years. On a global scale, studies have been conducted to evaluate drought effects on the terrestrial ecosystem productivity and they concluded that the occurrence of drought have decreased the global NPP [1,19,20]. For instance, Peng et al. [20] reported that 37% of the global decreased NPP was caused by drought during recent decades. Regionally, studies have also confirmed that recent severe droughts also led to a notable reduction of regional plant productivity [5,14,21,22,23,24,25,26]. For instance, about 30% reduction in gross primary productivity was detected during the widespread drought in Europe in 2003 [5]; during the 2009–2010 drought in the Amazon region, the NPP was observed an average decrease of 7% [26]; and the 2010 spring drought in southwest China decreased the NPP by 46 Tg C [14]. Generally, these discoveries provide references for regional or global carbon emission reduction, carbon exchange, as well as carbon management.
Mainland China has a vast land area with an abundant number of ecosystems and climates, providing a large potential for biological carbon sinks. The Chinese terrestrial ecosystem has acted as a sink for about 30% of the continental fossil carbon emissions every year, and thus undoubtedly plays a central role in dominating the regional or even global carbon budget [27,28]. It has been confirmed that the amount of CO2 absorbed by terrestrial ecosystem greatly depends on water availability in mainland China [29]. However, due to the monsoon system interacting with the complicated geographical topography and climatic variation, mainland China has suffered from a mass of severe and frequent drought events in the past several decades [30]. For example, aridity over North China has increased substantially, and drought affected areas and caused losses over these areas have greatly increased during the past 30 years [31]; some southern humid regions even experienced extreme droughts since the 2000s; for example, the winter–spring drought of southwest China during 2009–2010 and the spring–summer drought across the mid and lower reaches of the Yangtze River in 2011 caused immeasurable loss for agricultural production [32]. Under such circumstances, the impact of increasing droughts on China’s regional and national terrestrial carbon budgets has received increasing public attention. For example, Zhang et al. [14] focused on the effect of the 2010 spring drought on NPP in Southwest China; Sun et al. [33] investigated the NPP variation during the drought in Northeast China from 1999 to 2013; and Pei et al. [7] explored the relationship between NPP and drought for the whole of China from 2001 to 2010. Generally, these studies contributed to improve an insight into the variation of terrestrial ecosystem caused by drought disturbance, and consequentially provide more information on the potential biosphere feedback to drought risks. However, most of these studies concentrated on a specific/local region or used a short-term period. Studies that concerned the entire mainland of China with a long-term period are relatively rare; therefore, we have not been able to obtain a recent overview of the response of NPP to drought across mainland China to date. As is known, several severe and prolonged droughts have affected China during the 1980s and 1990s [27]; however, the investigated periods in most current studies excluded this period, which is not helping our understanding of drought induced NPP variation. Additionally, as droughts over East Asia are projected to become more frequent and more severe under climate change scenarios [5,7,30], the future response of NPP to drought of mainland China would be a rather intricate topic. Therefore, we believe that the exploration of the relationship between NPP and drought of the past decades could provide central clues for the future research of NPP variation.
For the measurement index of drought, previous studies generally used a simple drought index (e.g., the standardized precipitation index, SPI), which only considers precipitation to assess the effect of drought on NPP [7]. In fact, drought conditions are strongly related to other meteorological factors, such as temperature and evaporation [34], and these two climatic factors in turn also impact the variability of NPP [28]. This means that using a simple drought index (e.g., the SPI) cannot fully reflect the influence of drought on NPP. Therefore, a much more comprehensive drought index, such as the standardized precipitation evapotranspiration index (SPEI), should be utilized under changing climate. As an improved drought index of SPI, SPEI includes multiple meteorological factors (e.g., temperature, wind speed, relative humidity, and solar radiation) that are used to calculate potential evapotranspiration; therefore, SPEI is regarded as a more meaningful index to assess the impact of drought on vegetation productivity [19,35,36].
Accordingly, the primary objectives of this study were: (1) to systematically estimate the spatial-temporal change of NPP from 1982 to 2015; (2) to investigate the relationship between NPP and drought using the SPEI index; and (3) to quantify the variation of NPP during drought events. This research provides an overview understanding of the impact of climatic disturbance on terrestrial ecosystems of mainland China.

2. Data and Method

2.1. Method

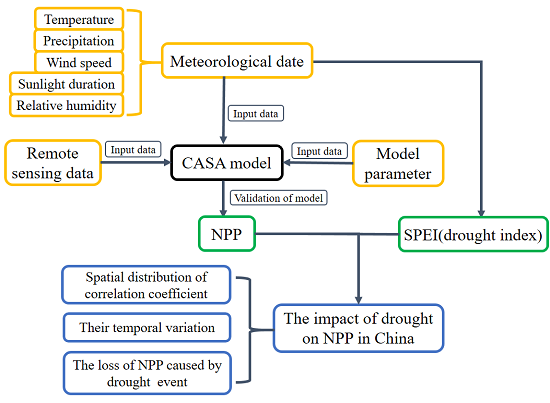
2.1.1. Carnegie Ames Stanford Application (CASA) Model

The CASA model was applied to assess the NPP in China from 1982 to 2015. As one of the satellite-based photosynthetic utilization models, this model has been widely employed to evaluate the global and regional NPP due to its convenience of use and quick calculation [7,37,38]. In this model, the NPP is computed as the product of the amount of photosynthetic active radiation absorbed by green vegetation (APAR, MJ m−2) and the light use efficiency ( ε , g C MJ−1) that converts the APAR into plant biomass increments with which the radiation is converted to plant biomass increment [8]. The process of calculation of NPP was described as follows:
  N P P ( x , t ) = A P A R × ε ( x , t )  
where NPP(x, t) represents the net primary productivity at a grid cell (x) in the month t; ε ( x , t ) represents the light use efficiency of the vegetation; A P A R represents the amount of absorbed photosynthetic active radiation which can be computed as follows:
  A P A R = F P A R   × S × 0.5  
where S represents the incoming shortwave radiation (MJ m−2); FPAR represents the fraction of photosynthetic active radiation absorbed by vegetation; the constant of 0.5 denotes the ratio of incident photosynthetically active radiation to solar radiation. FPAR can be expressed as:
S P A P = m i n [ S R ( x , t ) S R m i n S R m a x S R m i n , 0.95 ]
  S R = [ 1 + N D V I ( x ,   t ) ] [ 1 N D V I ( x ,   t ) ]  
where S R m i n refers to the factor SR for unvegetated land areas, and S R m a x approximates the values of SR when all downwelling solar radiation is intercepted. The ε can be calculated as:
  ε ( x , t ) = ε m a x × T 1 ( x , t ) × T 2 ( x , t ) × W ( x , t )  
where T 1 and T 2 account for the effect of temperature stress, W accounts for the effects of water stress, and ε m a x is the maximum possible efficiency and has been determined for Chinese ecosystem in the researches of Zhu et al. [39]. T 1 , T 2 , and W are calculated as:
  T 1 ( x , t ) = 0.8 + 0.02 × T o p t ( x ) 0.005 × T o p t ( x ) × T o p t ( x )  
  T 2 ( x , t ) = 1.1814 { 1 + e [ 0.2 ( T o p t ( x ) 10 T ( x , t ) ) ] } 1 + e [ 0.3 ( T o p t ( x ) 10 + T ( x , t ) ) ]  
  W ( x , t ) = 0.5 + 0.5 E E T ( x , t ) P E T ( x , t )  
where T o p t ( x ) is defined as the air temperature in the month when the NDVI researches its maximum for the year. EET (mm) refers to actual evapotranspiration and is derived from actual evapotranspiration model, and PET (mm) refers to the potential evapotranspiration and is calculated with the method of the FAO–Penman–Monteith equation (FAO P-M) [6]. EET is calculated as:
  E E T ( x , t ) = P × R n ( P 2 + R n 2 + P × R n ) ( P + R n ) × ( P 2 + R n 2 )  
where P refers to the precipitation (mm) at a grid cell (x) in the month t; and R n is the net radiation at the crop surface (MJm−2day−1) at a grid cell (x) in the month t.
The FAO P-M method for calculating monthly PET may be expressed as:
  P E T ( x , t ) = 0.408 Δ ( R n G ) + γ 900 T a + 273 u 2 ( e s e a ) Δ + γ ( 1 + 0.34 u 2 )  
where PET is the reference evapotranspiration (mm day−1); R n is the net radiation at the crop surface (MJ m−2 day−1); G is the soil heat flux density (MJ m−2 day−1); T a is the mean daily air temperature at 2 m height (°C); u 2 is the wind speed at 2 m height (ms−1); e s is the saturation vapor pressure (kPa); e a is the actual vapor pressure (kPa); e s e a is the saturation vapor pressure deficit (kPa); Δ is the slope of the vapor pressure (kPa °C−1); and γ is the psychrometric constant (kPa °C−1). The reference surface is defined as a hypothetical reference crop with height of 0.12 m, a fixed surface resistance of 70 sm−1 and an albedo of 0.23. Solar radiation ( R s ) represents R n in Equation (9) and is estimated from observed sunshine duration using the Ångström formula:   R s = ( a s + b s n / N ) R a . n is the actual duration of sunshine (in hours), N is the total day length (in hours), and R a is extraterrestrial radiation. The NPP anomaly caused by droughts can be assessed by utilizing an anomaly index that can be defined as:
  Δ N P P = ( N P P i N P P m ) / N P P m  
where Δ N P P represents the NPP anomaly at a grid cell for a drought event; N P P i represents the accumulated NPP value of the ith drought event; and N P P m represents the long-time average annual value of NPP corresponding to the period of the ith drought event. For example, if the drought occurred from January 1982 to March 1982, the N P P i   represents the accumulated NPP value for this period, while the N P P m represents the mean of NPP values of the corresponding drought period (i.e., January–March across 1982–2015).

2.1.2. SPEI

The SPEI was used to monitor the drought variation in China in this study. As an improved drought index of SPI, this index considers temperature, precipitation, wind speed, relative humidity, and solar radiation and is considered to be particularly suited for analyzing drought variation in the context of global warming [40]. The calculation process of SPEI was described as follows.
The SPEI is based on a climatic water balance which is determined by the difference between precipitation (P) and potential evapotranspiration (PET) for the month i:
  D i =   P i   P E T i  
which provides a simple measure of the water surplus or deficit for the analyzed month. The PET is calculated following the FAO P-M method [41]. The calculated D i values are aggregated at different time scales, following the same procedure as that for the SPI. The difference D i , j k in a given month j and year i depends on the chosen time scale, k. For example, the accumulated difference for one month in a particular year, i with a 12-month time scale is calculated according to:
X i , j k =   l = 13 k j 12 D i 1 , l +   l = 1 j D i , j ,   if   j < k ,   and   X i , j k =   l = j k + 1 j D i 1 , l ,   if   j k
where D i , l is the P-PET difference in the lth month of year i.
Then, the log-logistic distribution is selected for standardizing the D series to obtain the SPEI. The probability density function of log-logistic distributed variable is expressed as:
  f ( x ) =   β α ( x γ α ) β 1 [ 1 + ( x γ α ) β ] 2  
where α , β , and γ are scale, shape, and origin parameters, respectively, for D values in the range ( γ > D < ∞). Thus, the probability distribution function of the D series is given by:
  F ( x ) =   [ 1 + ( x γ α ) β ] 1  
With F(x), the SPEI can easily be obtained as the standardized values of F(x).
S P E I =   w c 0 c 1 w + c 2 w 2 1 + d 1 w + d 2 w 2 + d 3 w 3  
where w   = 2 l n ( p ) for p 0.05 and p is the probability of exceeding a determined D value, p = 1 – F(x). If p > 0.05, p is replaced by 1 – p and the sign of the resultant SPEI is reversed. The constants are: c0 = 2.515517, c1 = 0.802853, c2 = 0.010328, d1 = 1.432788, d2 = 0.189269, and d3 = 0.001308.
The SPEI can represent multiple time scales and monitor different drought types, including meteorological, agricultural, hydrological, and societal drought. It is verified that the three-month SPEI are more suitable to measure typical drought in China [42]. Therefore, this study applied the SPEI with three-month scales to explore the drought characteristics (including impacted area, frequency, duration, severity, and intensity). The drought area was accumulated by grid units (8 km × 8 km) featuring SPEI < −1.0. The drought frequency was simply defined as the number of months with SPEI < −1.0. Severity was defined as the absolute value of the integral area between the SPEI line and the horizontal axis (SPEI = 0) from the start to the end month of the drought. The intensity is referred to the lowest SPEI value of the drought event. The duration of a drought event is defined as the number of consecutive months with SPEI < −1.0. Details for the categorization of dryness/wetness grade of SPEI are provided in Table 1.

2.1.3. Mann–Kendall Analysis
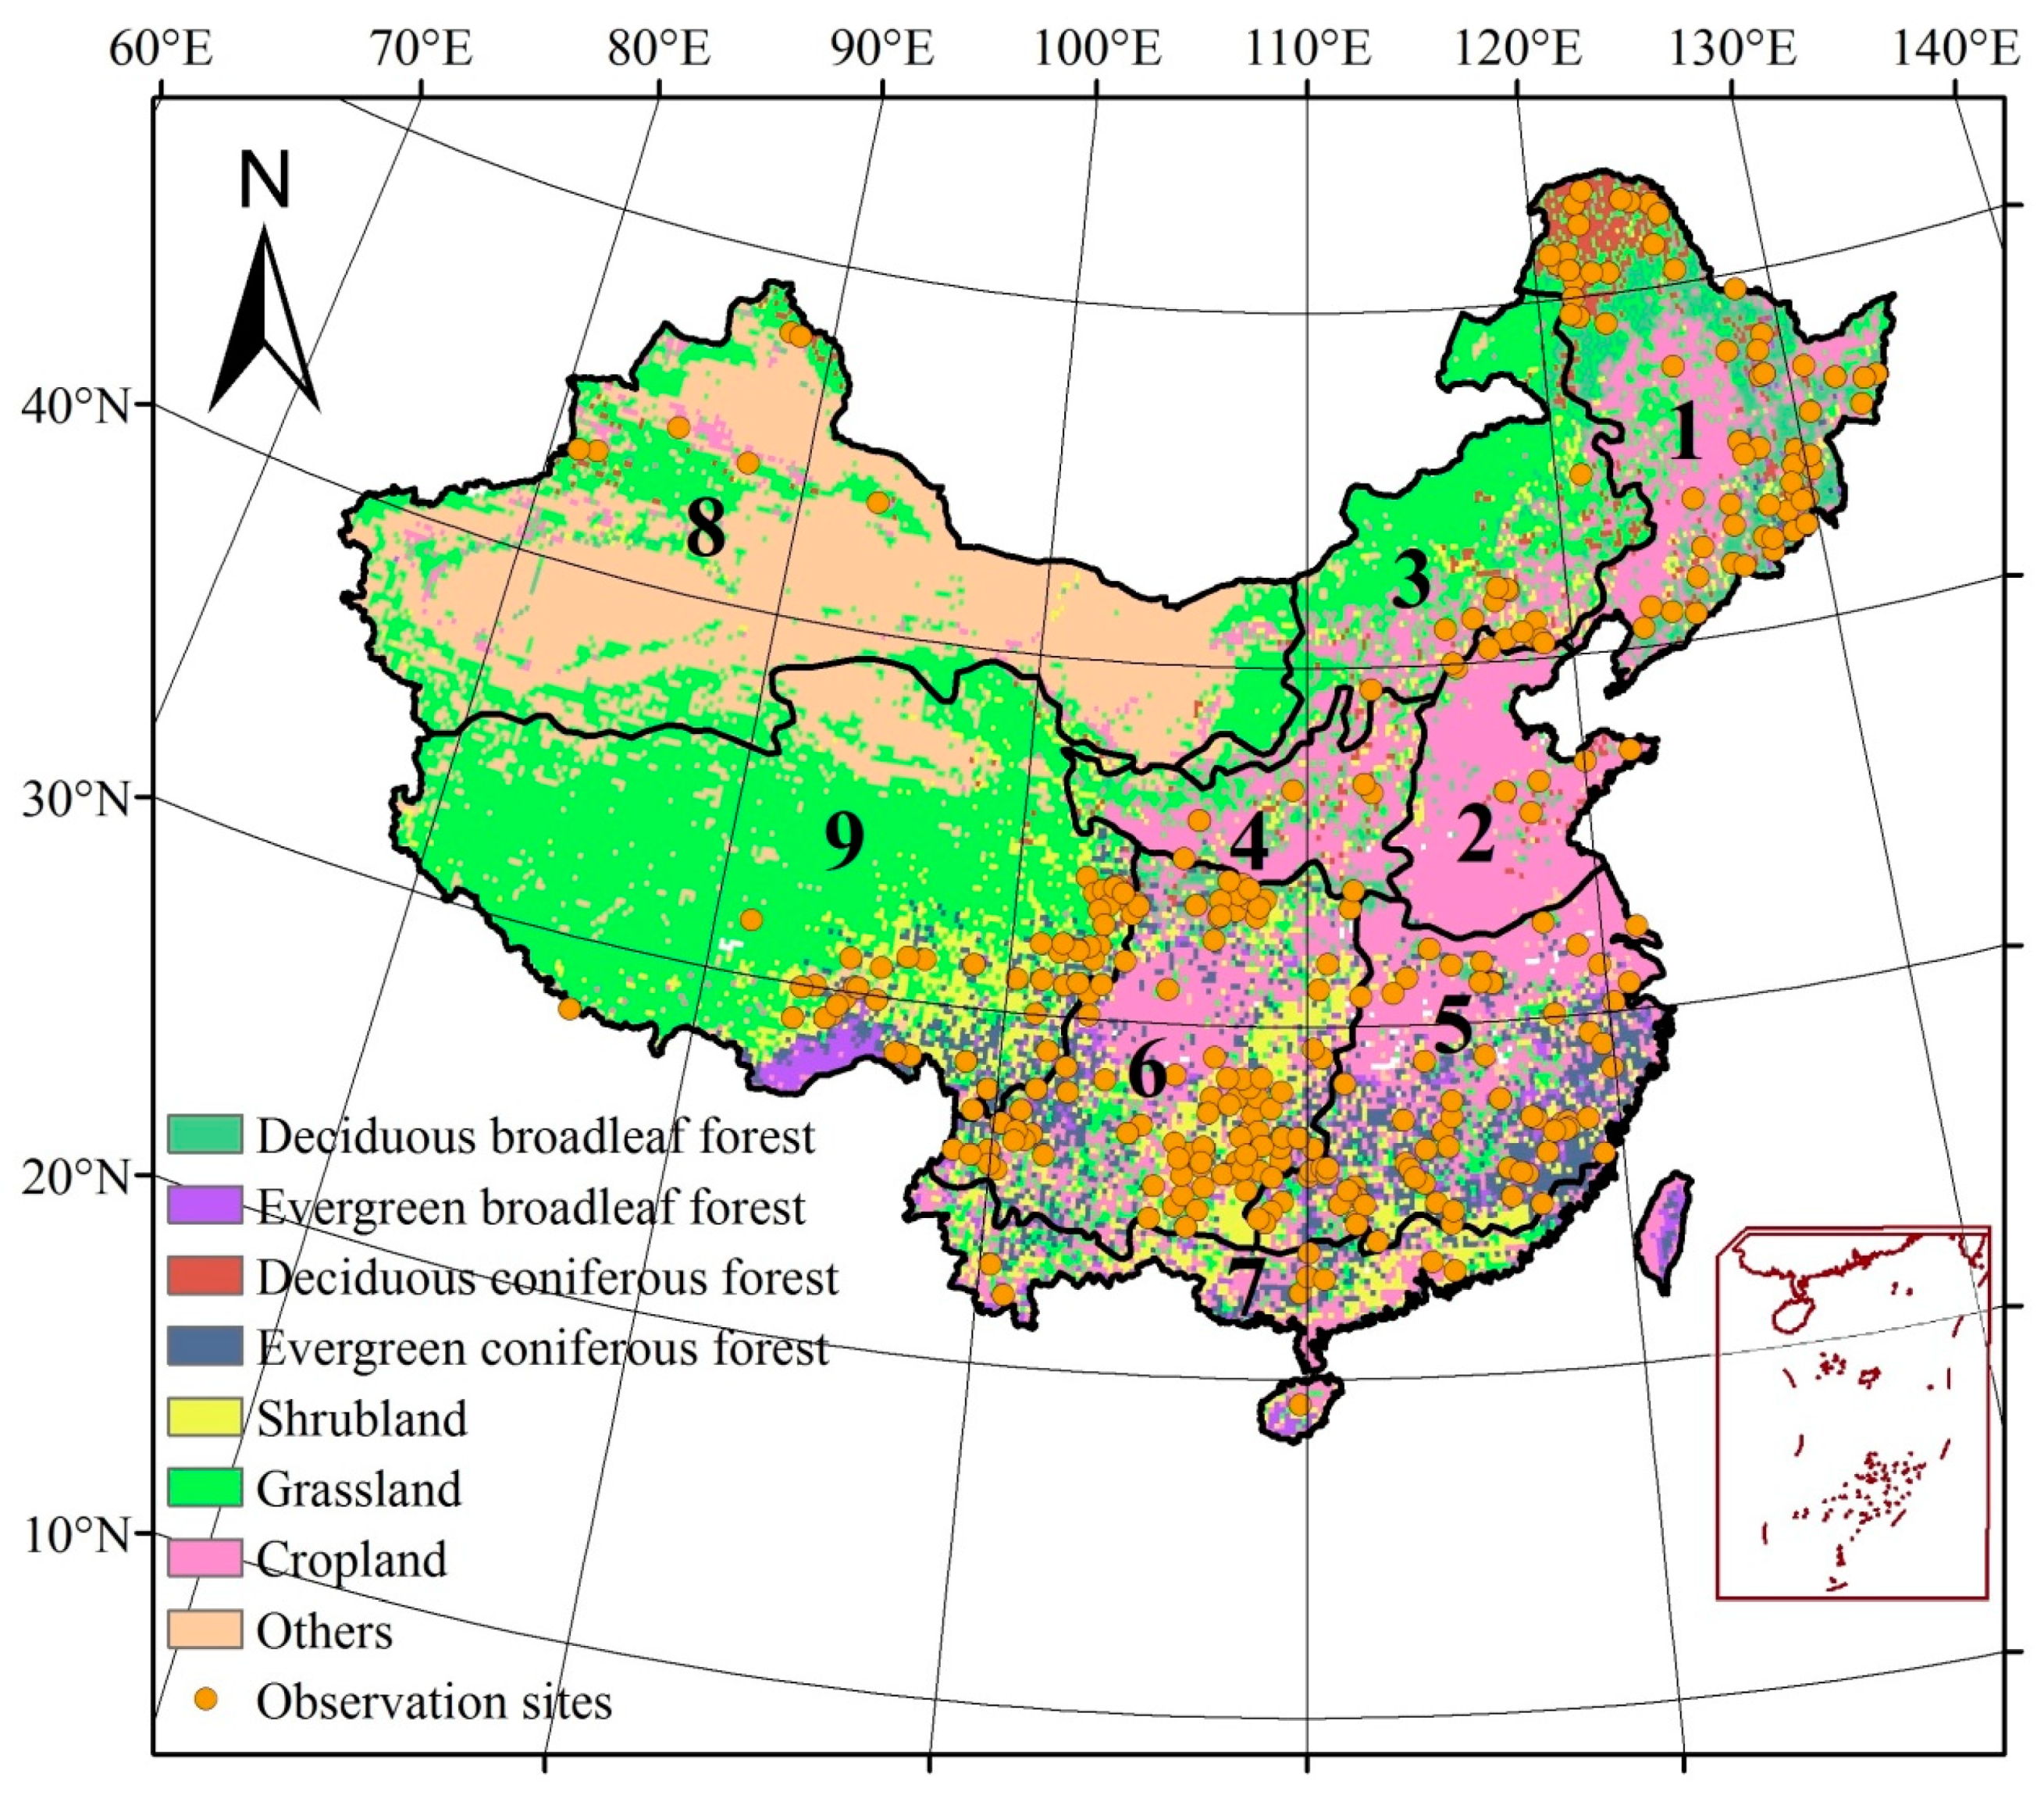
The Mann–Kendall (MK) analysis, proposed separately by Mann [43] and Kendall [44], was used to analyze the variation trend of NPP in this study. The advantage of MK analysis is that the series does not require a specific sample distribution, thus avoiding potential interference of a few outliers [45,46]. The adoption of MK trend test is initiated from the calculation of the statistic:
  S = i = 1 n 1   j = i + 1 n s g n ( x j x i )  
in which,
  sgn ( x j x i ) = { + 1   ( x j > x i ) 0   ( x j = x i ) 1   ( x j < x i )  
where x i and x j are the sequential data values and n is the length of the dataset; the statistics S is approximately normally distributed when n ≥ 8, with the mean and the variance as follows:
  E ( S ) = 0   V ( S ) = [ n ( n 1 ) ( 2 n + 5 ) i = 1 n t i i ( i 1 ) ( 2 i + 5 ) ] 18
where t is the extent of any given time. The standardized statistic (Z) then for one-tailed test is formulated as:
  Z = { ( S 1 ) / v a r ( S ) ( S > 0 ) 0 ( S = 0 ) ( S + 1 ) / v a r ( S ) ( S < 0 )  
where var (s) = n(n − 1)(2n + 5) /18. The null hypothesis of no trend is rejected if |Z| > 1.96 at the 0.05 significance level, and is rejected if |Z| > 2.32 at the 0.01 significance level. A positive value of Z denotes an increasing trend and a negative value corresponds to a decreasing trend. The Kendall slope representing magnitude of the monotonic change is given as follows:
  β = Median ( x j x i j i )            j < i  
where 1 < i < j < n. The estimator β is the median of all combinations of record pairs for the entire dataset.

2.2. Data

The monthly climatic data, including maximum air temperature, minimum air temperature, precipitation, wind speed, relative humidity, and solar radiation across China, were applied in this study to run the CASA model and calculate the SPEI. These datasets were obtained from the China Meteorological Administration (http://cdc.nmic.cn/home.do). The temperature, wind speed, relative humidity, and precipitation were produced from 819 climate stations across China. Solar radiation dataset was generated from 122 solar radiation observation stations. To run the CASA model, we used the inverse distance weighting method to interpolate observations stations data into spatial data with resolution of 8 km × 8 km.
The third-generation global inventory monitoring and modeling studies NDVI dataset downloaded from NASA (http://ecocast.arc.nasa.gov/data/pub/gimms/3g/) were also used to run the CASA model. Such remote sensing data feature a spatial resolution of 8 km × 8 km cover the period of 1982 to 2015. The maximum-value composite method was employed to choose the higher value of bimonthly NDVI to obtain the monthly NDVI [10]. Spatial distributions of various vegetation types in mainland China represents the vegetation distribution and were obtained from a vegetation map at a scale of 1:1,000,000 [37], which was mainly derived from ground observations. As required by the CASA model, seven vegetation types were obtained from the vegetation map, including deciduous broadleaf forest (DBF), evergreen broadleaf forest (EBF), deciduous needle-leaf forest (DNF), evergreen needle-leaf forest (ENF), shrubland, grassland, cropland, and others (with barren or sparse vegetation). In addition, to verify the CASA model, measured ground NPP were also utilized (Figure 1). The observations of NPP were collected from the national forest inventories conducted by the National Inventory of the Forest Ministry during 1989–1993 [28,47]. A series of measurements were made at intervals during the growing season within one year or more. Moreover, both aboveground and underground biomass was fully measured [37,47]. Thus, the observed NPP dataset was employed to verify the NPP simulation. However, in this dataset, NPP was provided in the unit of dry matter (DM) and thus a conversion was performed from DM to carbon content (g C m−2 year−1) by applying a conversion factor of 0.5.
In mainland China, the local terrestrial ecosystems are significantly impacted by various climate types [34,48], and for more specific analyses, we divided China into nine regions (Figure 1) based on the research of Xu et al. [49] and Wang et al. [50]: (1) Northeast China Region (NCR); (2) Huang-Huai-Hai Region (HHHR); (3) Inner Mongolia Region (MGR); (4) Loess Plateau Region (LPR); (5) middle and lower regions of the Yangtze River (YRR); (6) Southwest China Region (SWCR); (7) South China Region (SCR); (8) Gan-Xin Region (GXR); and (9) Qinghai-Tibet Plateau Region (QTPR).

3. Results

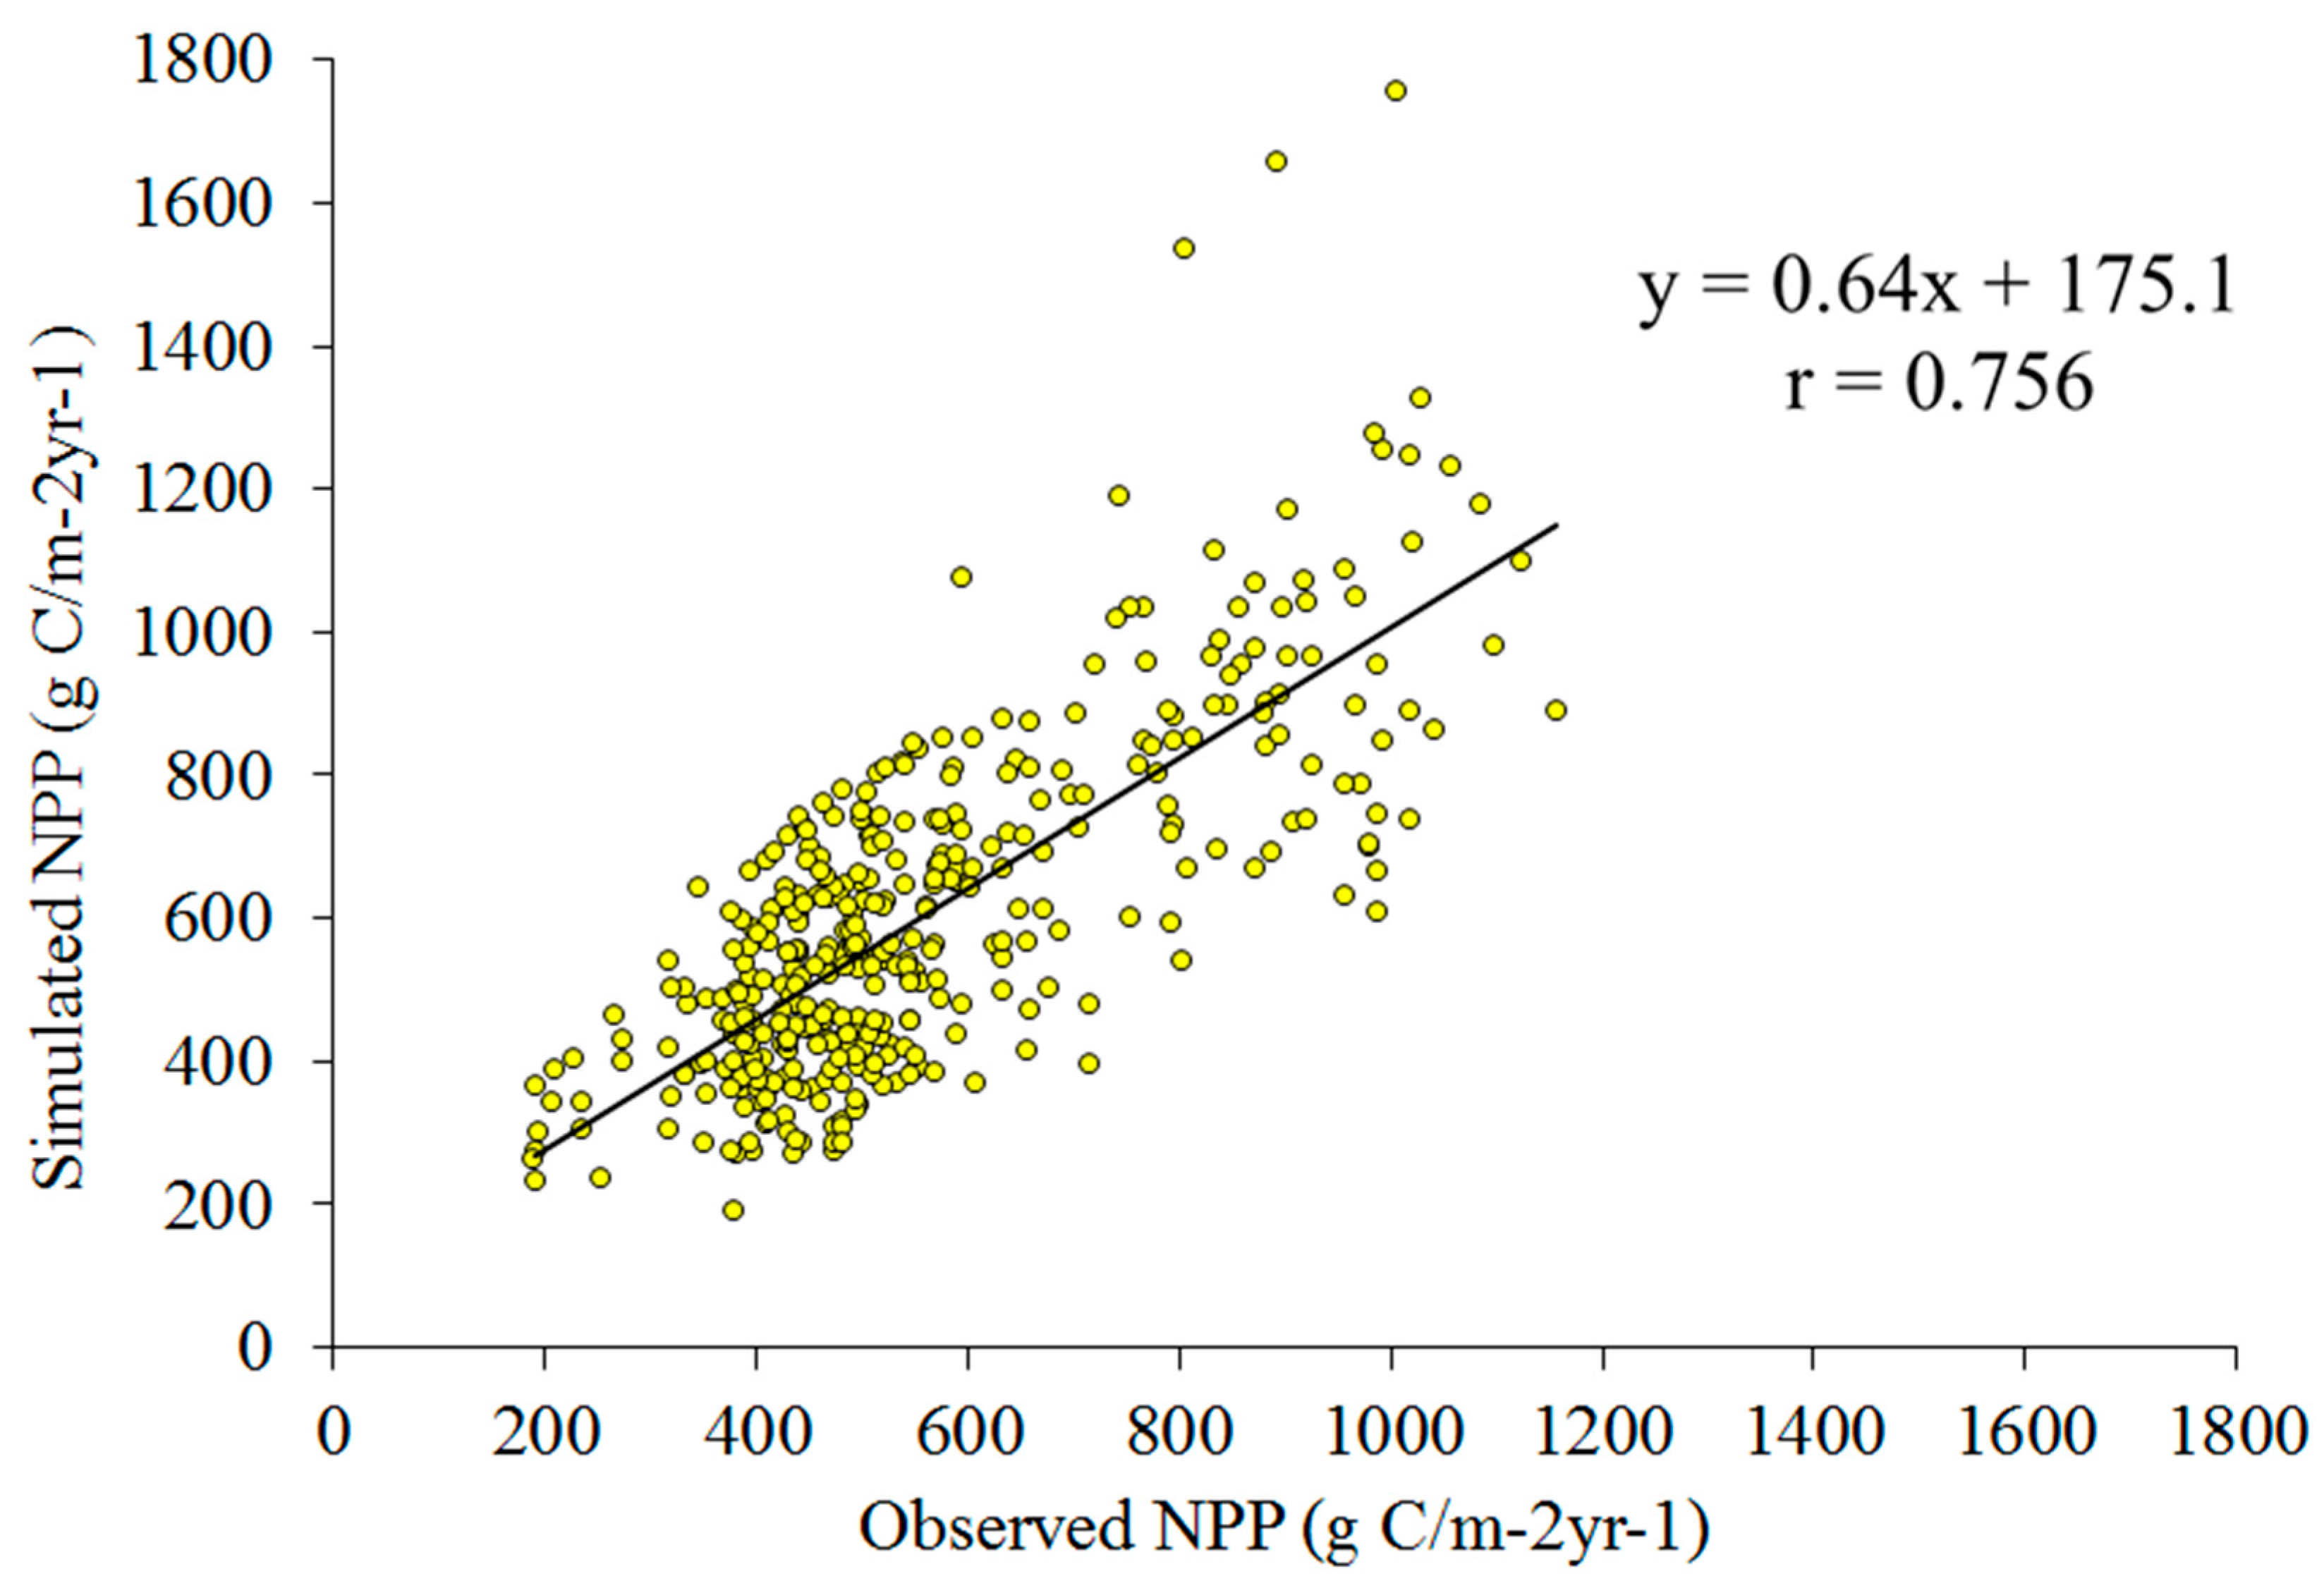
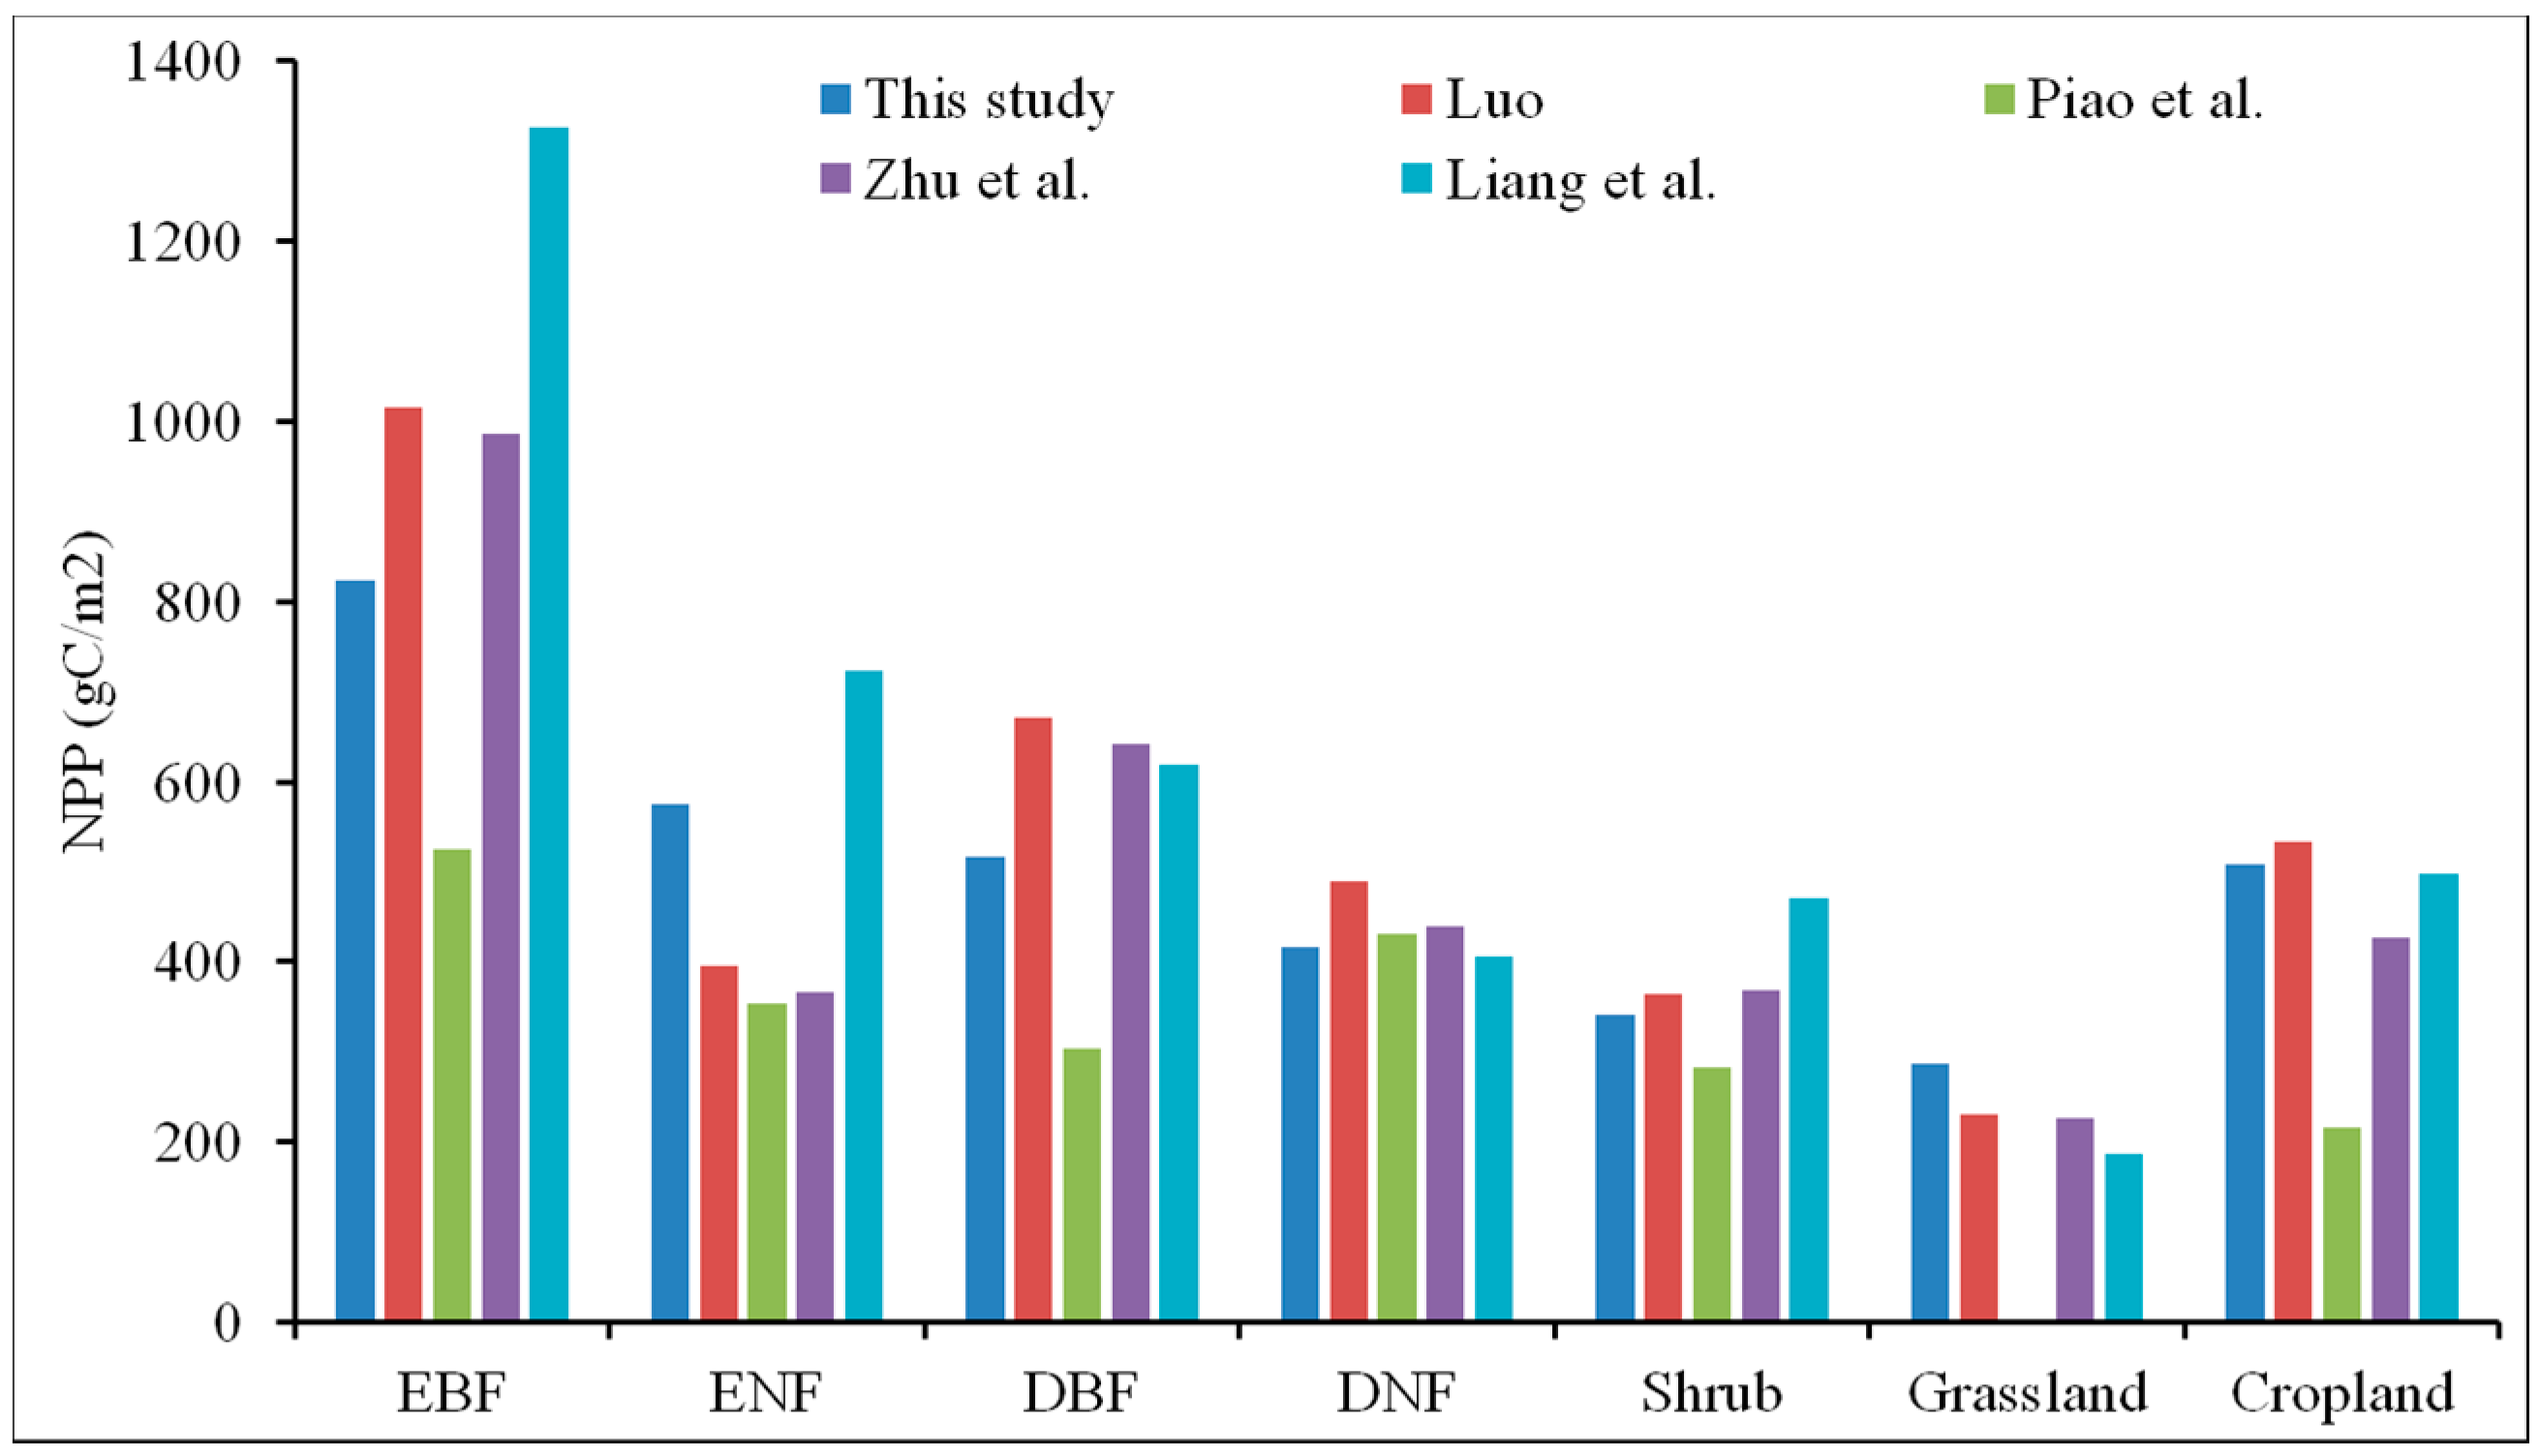
3.1. Validation of the NPP Calculation

Although the CASA is a mature model and has been widely used to determine the global and regional NPP [28,51], the reliability of the model still requires validation. To validate our NPP simulated from the CASA model, a comparison between the simulated NPP and the measured NPP data has been conducted. As shown in Figure 2, the estimated NPP and the averaged observation-based data (1989–1993) presents a good coincidence (r = 0.756, p < 0.001). To further verify the simulation result, we also compared the simulated NPP with previous findings [28,43,47,51]. We summarized the mean annual NPP of different land cover types in different periods (Figure 3). Forest ecosystems generally have a higher annual NPP than non-forest ecosystems except for DNF, which agrees well with the relative results given in Figure 3. However, the NPP of EBF and DBF in this study are generally lower than other researches. These differences might be related to the different studied period, data source, study area, as well as the vegetation types and their classification accuracy [28,43]. Figure 4 shows the spatial distribution of mean annual NPP across mainland China from 1982 to 2015. The maximum values mainly appear on the areas of the Hainan Province and the southern part of the Yunnan Province while the minimum values mainly locate in western Tibet. Generally, the mean annual NPP showed decreasing gradients from the southeast to the northwest, which is generally consistent with the reports of Pei et al. [37] and Liang et al. [28]. Overall, the above analyses suggest that the CASA is applicable to simulate NPP across China and that the NPP results simulated by this model are satisfactory.

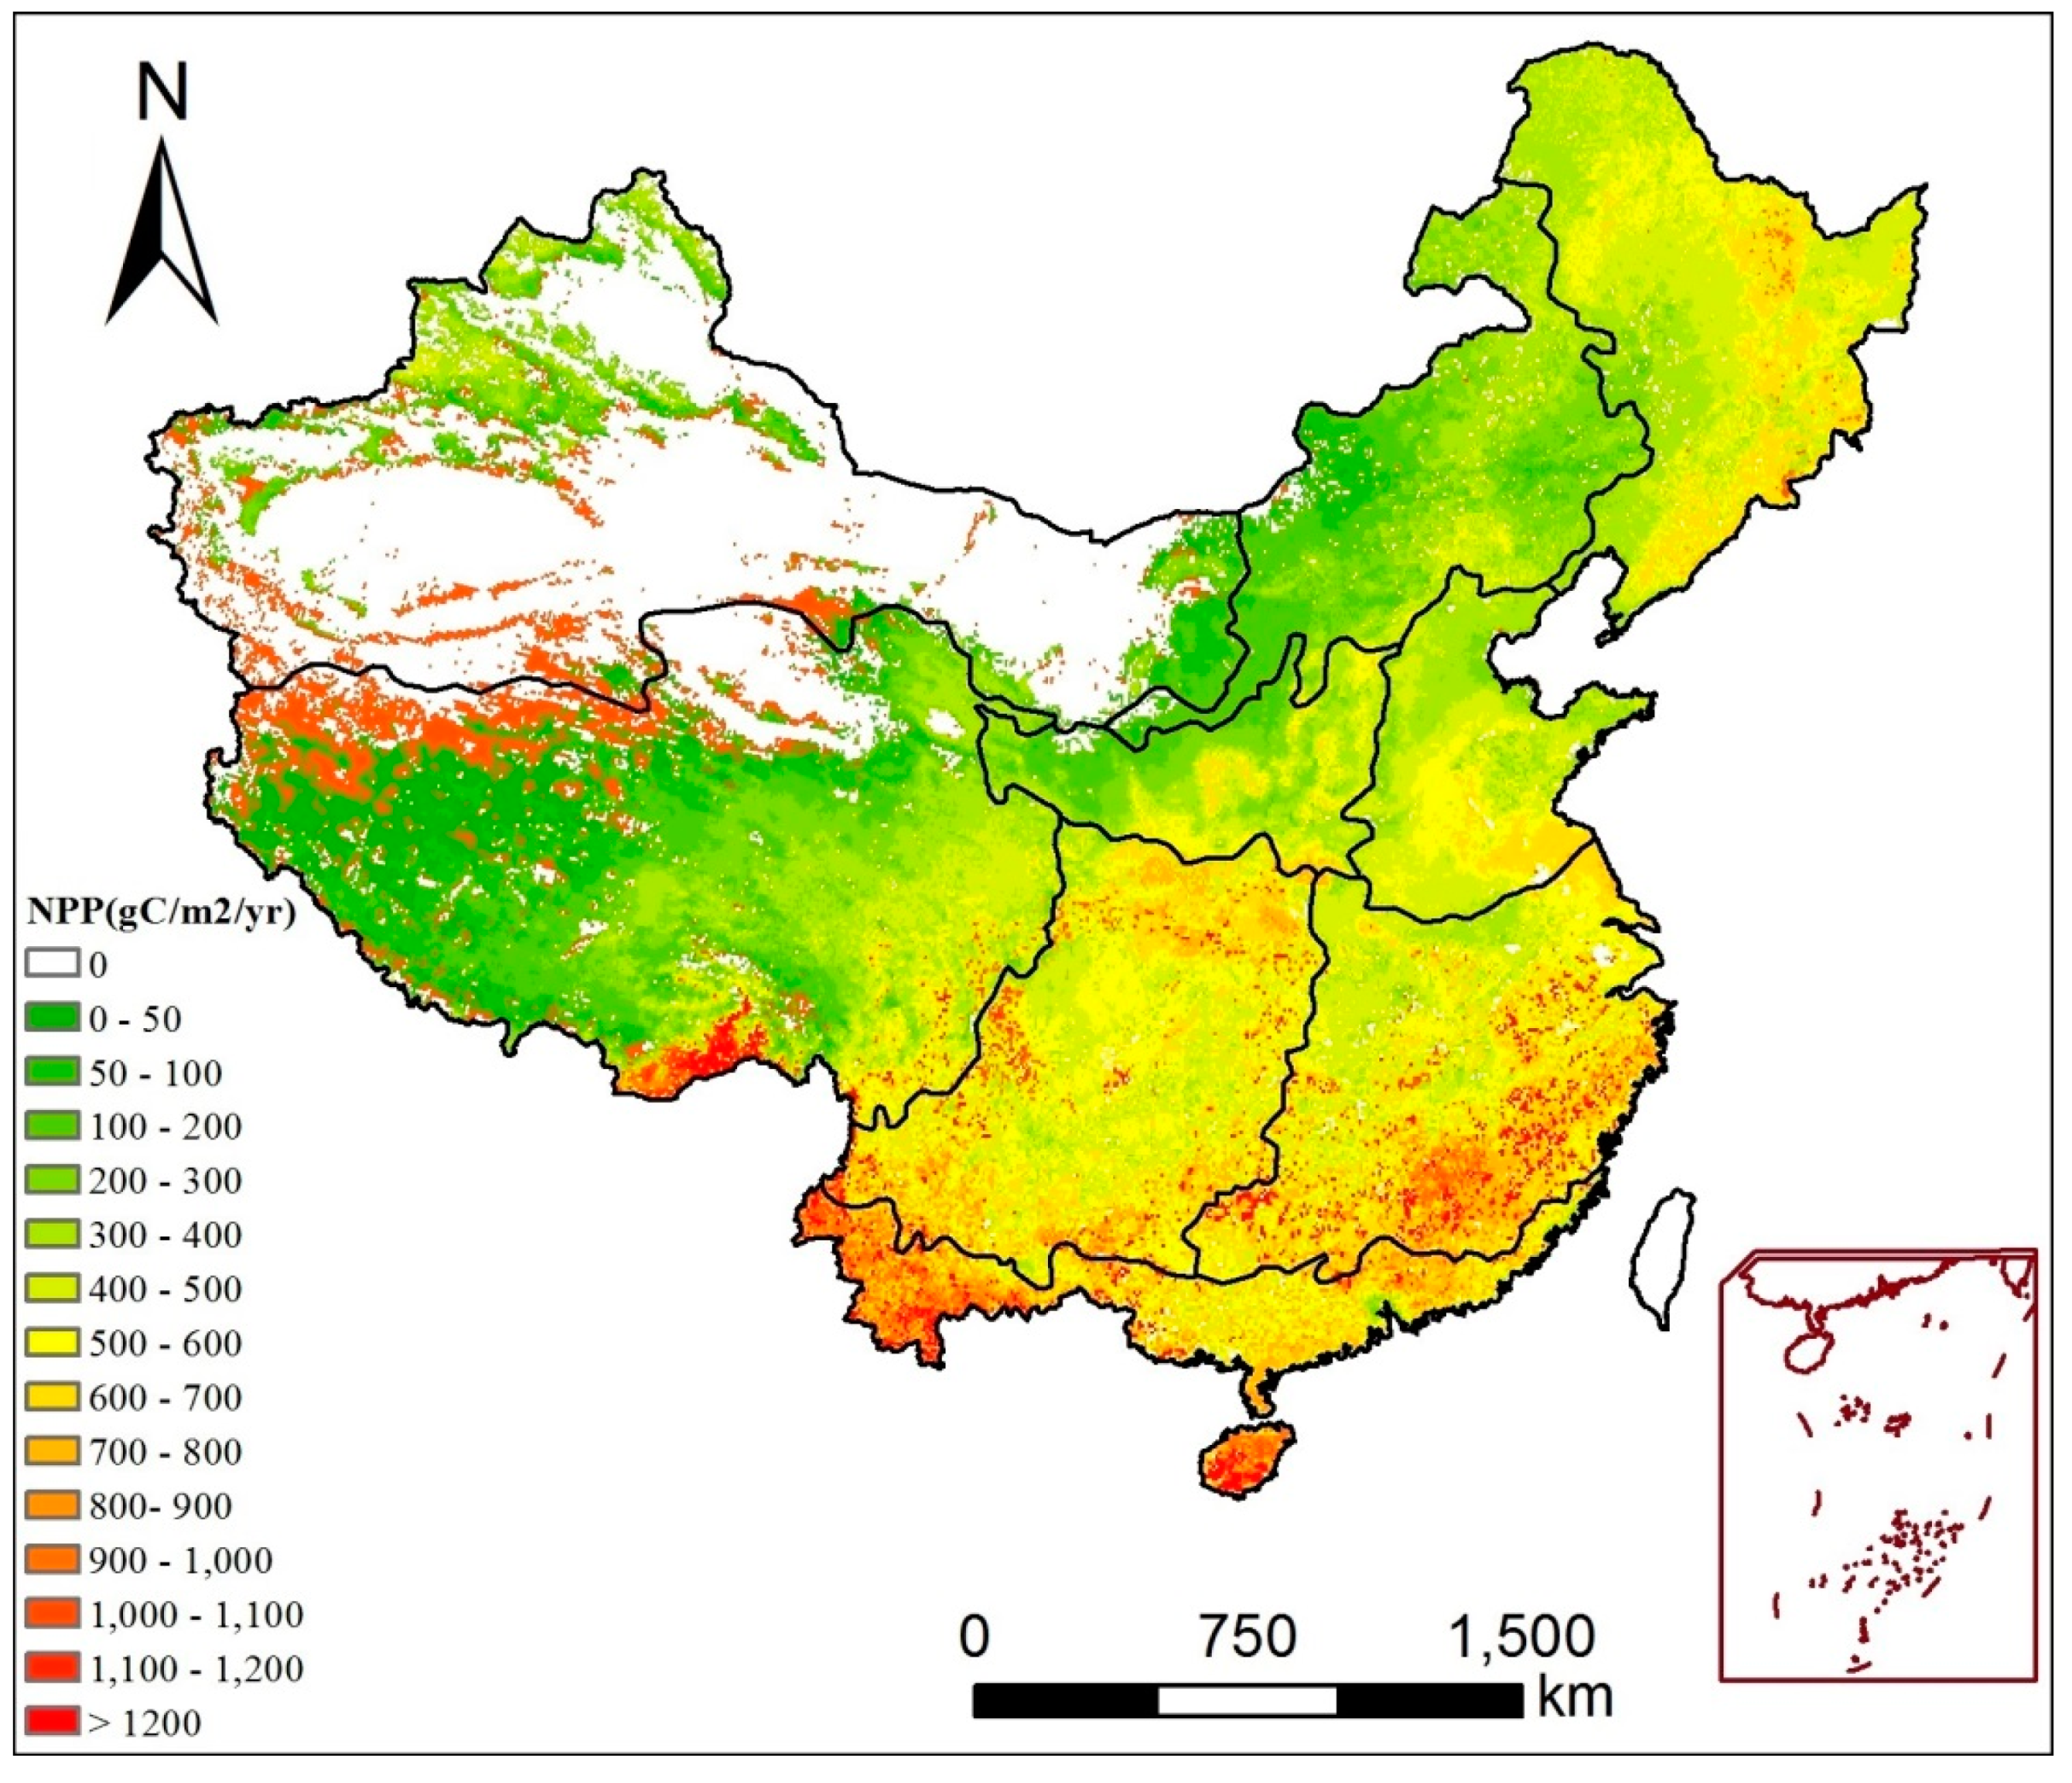
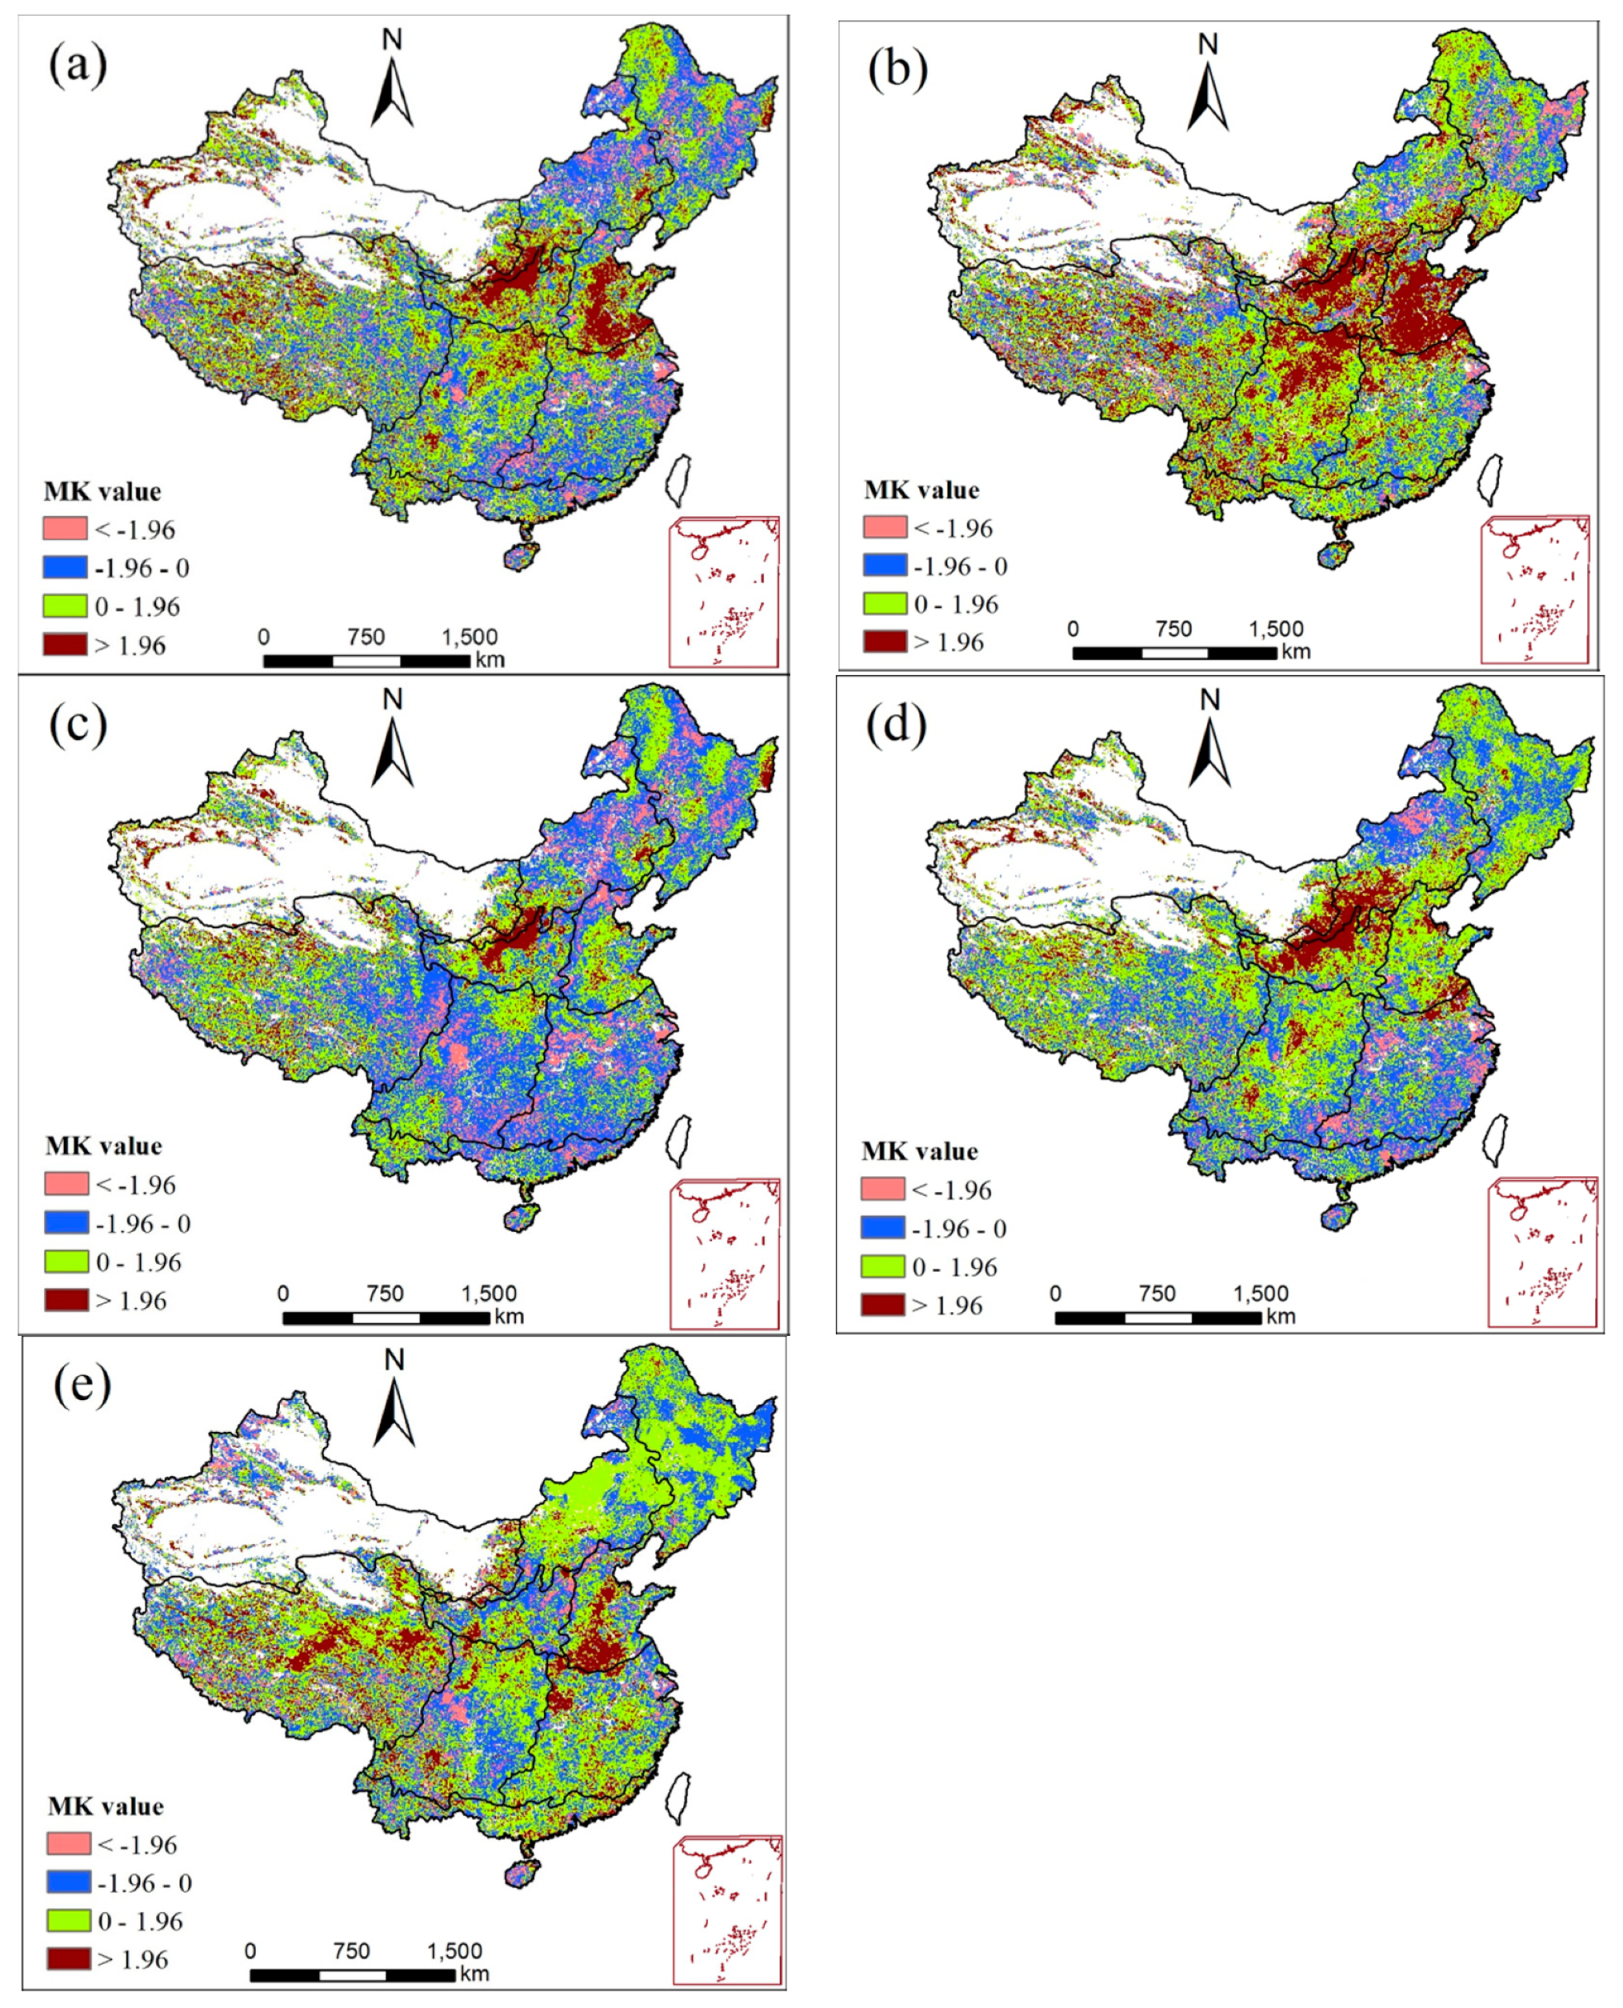
3.2. Spatiotemporal Trends of NPP

The temporal trends of the total annual and seasonal NPP during 1982–2015 were revealed by the MK values (Table 2). In summary, the NPP showed a decreasing trend in most of the regions for summer, while all regions showed an increasing trend for NPP in spring. The annual NPP of mainland China showed a slightly increased trend from 1982 to 2015, with an annual increase of 0.024 Pg C; spring NPP displayed a significantly increased trend, while the summer NPP showed a higher decreased trend. Specifically, the NPP in the YRR displayed an apparent declining trend in summer. In contrast, NPP had a significantly increasing trend in the SWCR and MGR in spring. Over the past 34 years, NPP showed a significantly increased trend except during the summer season in the HHHR where no non-significant change was detected, while a significant increasing trend of NPP was observed in the LPR (except for winter). Interestingly, autumn NPP showed a significant uptrend in the GXR. However, there were no apparent changes of NPP in the NCR throughout the year.
The spatial patterns of MK value of annual and seasonal NPP trends from 1982 to 2015 are summarized in Figure 5. Generally, the annual NPP increased by more than 54.9% and significantly increased over 13.8% across mainland China. The significant increase of NPP was mainly detected in HHHR and LPR (Figure 5a). In contrast, 45.1% showed a declining trend and 7.2% of the decreasing areas presented a significant downtrend, which was mainly scattered in the Pearl and Yangtze River deltas (Figure 5a). In spring, NPP across 67.6% of mainland China showed an increasing trend, 13.9% of the areas were statistically significant, which mainly occurred in LPR, HHHR, and SWCR (Figure 5b). More than half of mainland China showed a decreasing trend in summer NPP and 10.4% presented a significantly declining trend (Figure 5c). Autumn NPP increased over 55.9% of mainland China and the remaining parts decreased (Figure 5d). Interestingly, 8.5% and 11.6% of mainland China showed a significant uptrend in summer and autumn NPP, respectively, which were primarily distributed in LPR. In winter, 9.8% of the study areas showed a significant increase in NPP, mainly in QTPR and HHHR (Figure 5e). Area proportion of different trends in annual and seasonal NPP over China during 1982–2015 is listed in Table 3.

3.3. Drought Impact on NPP

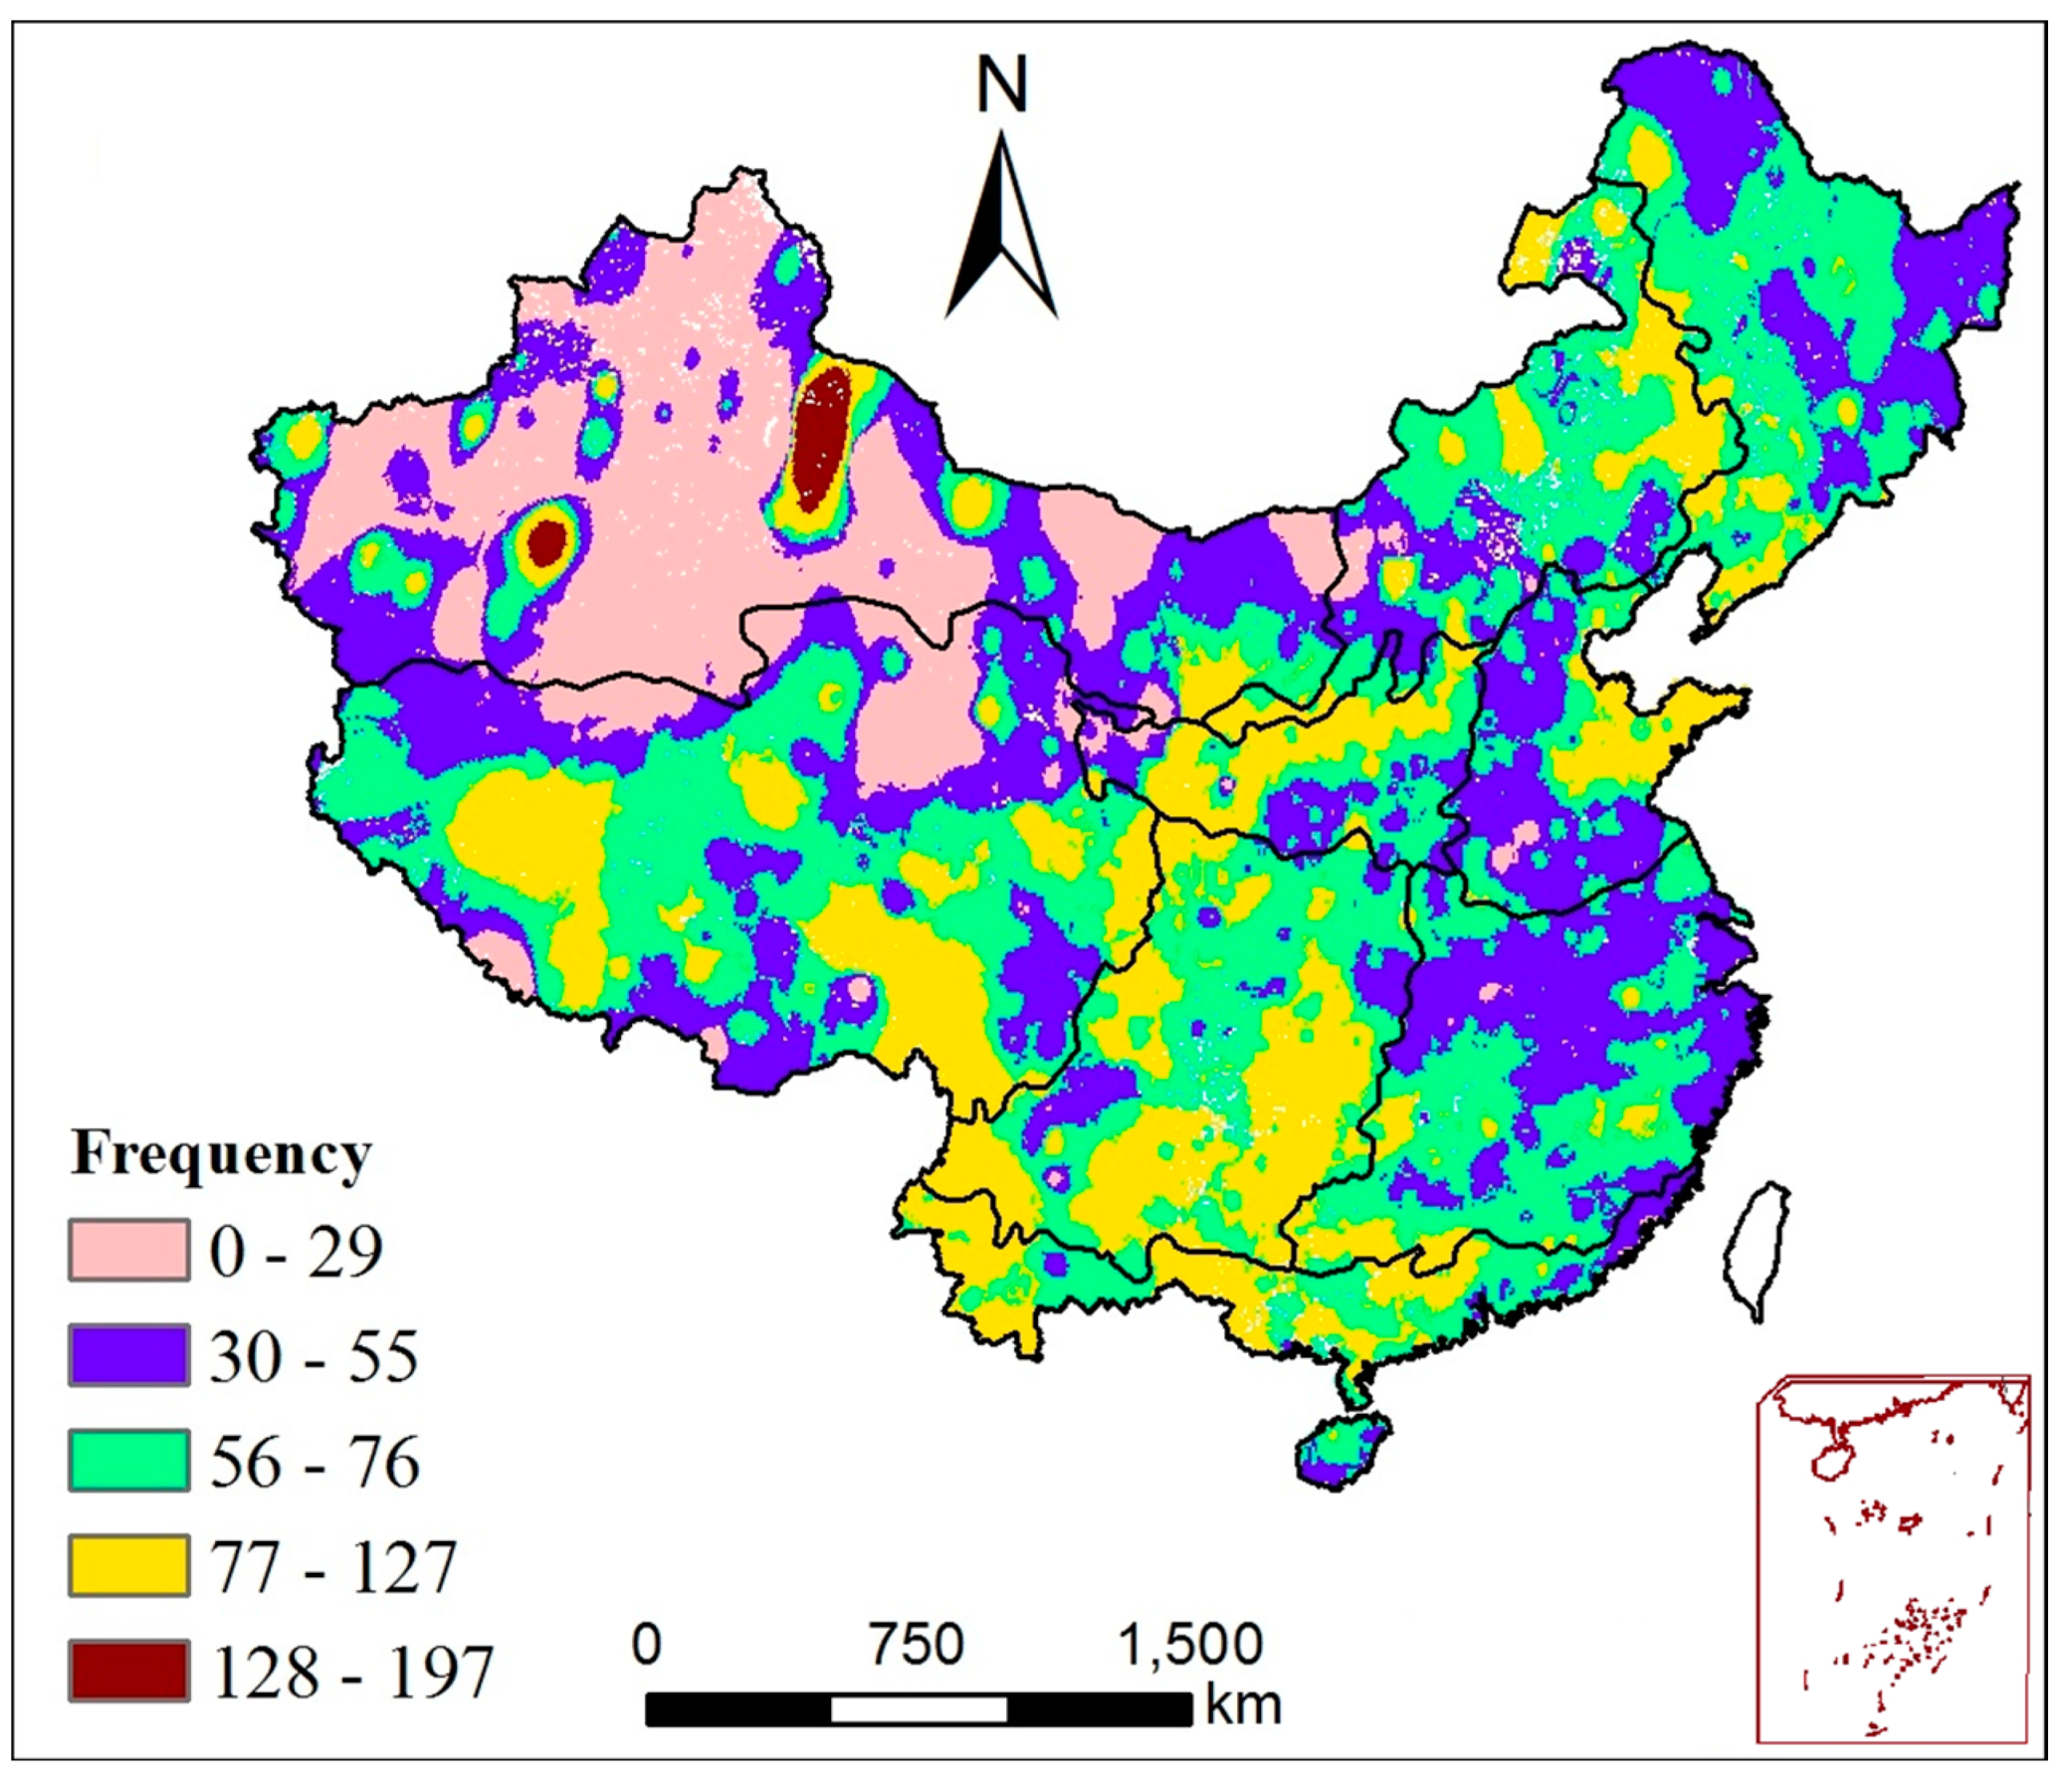
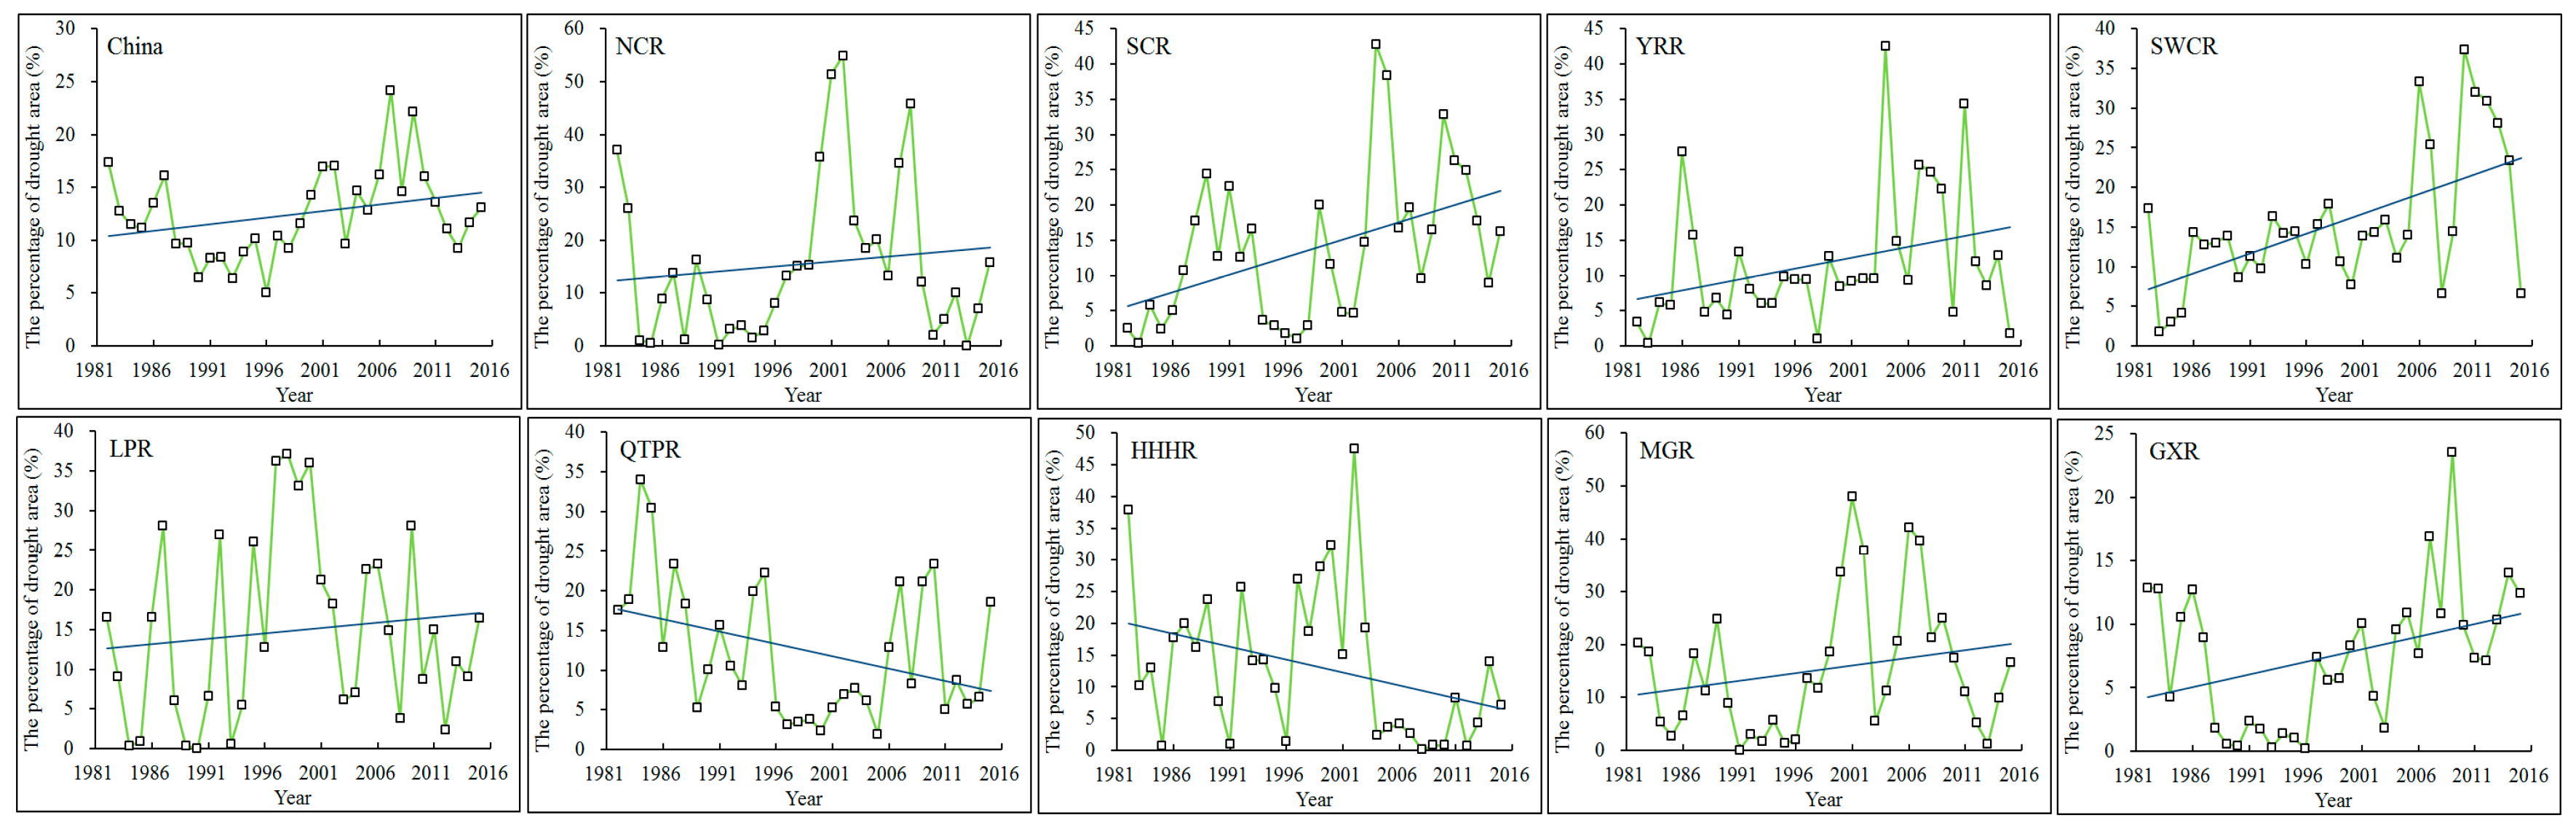
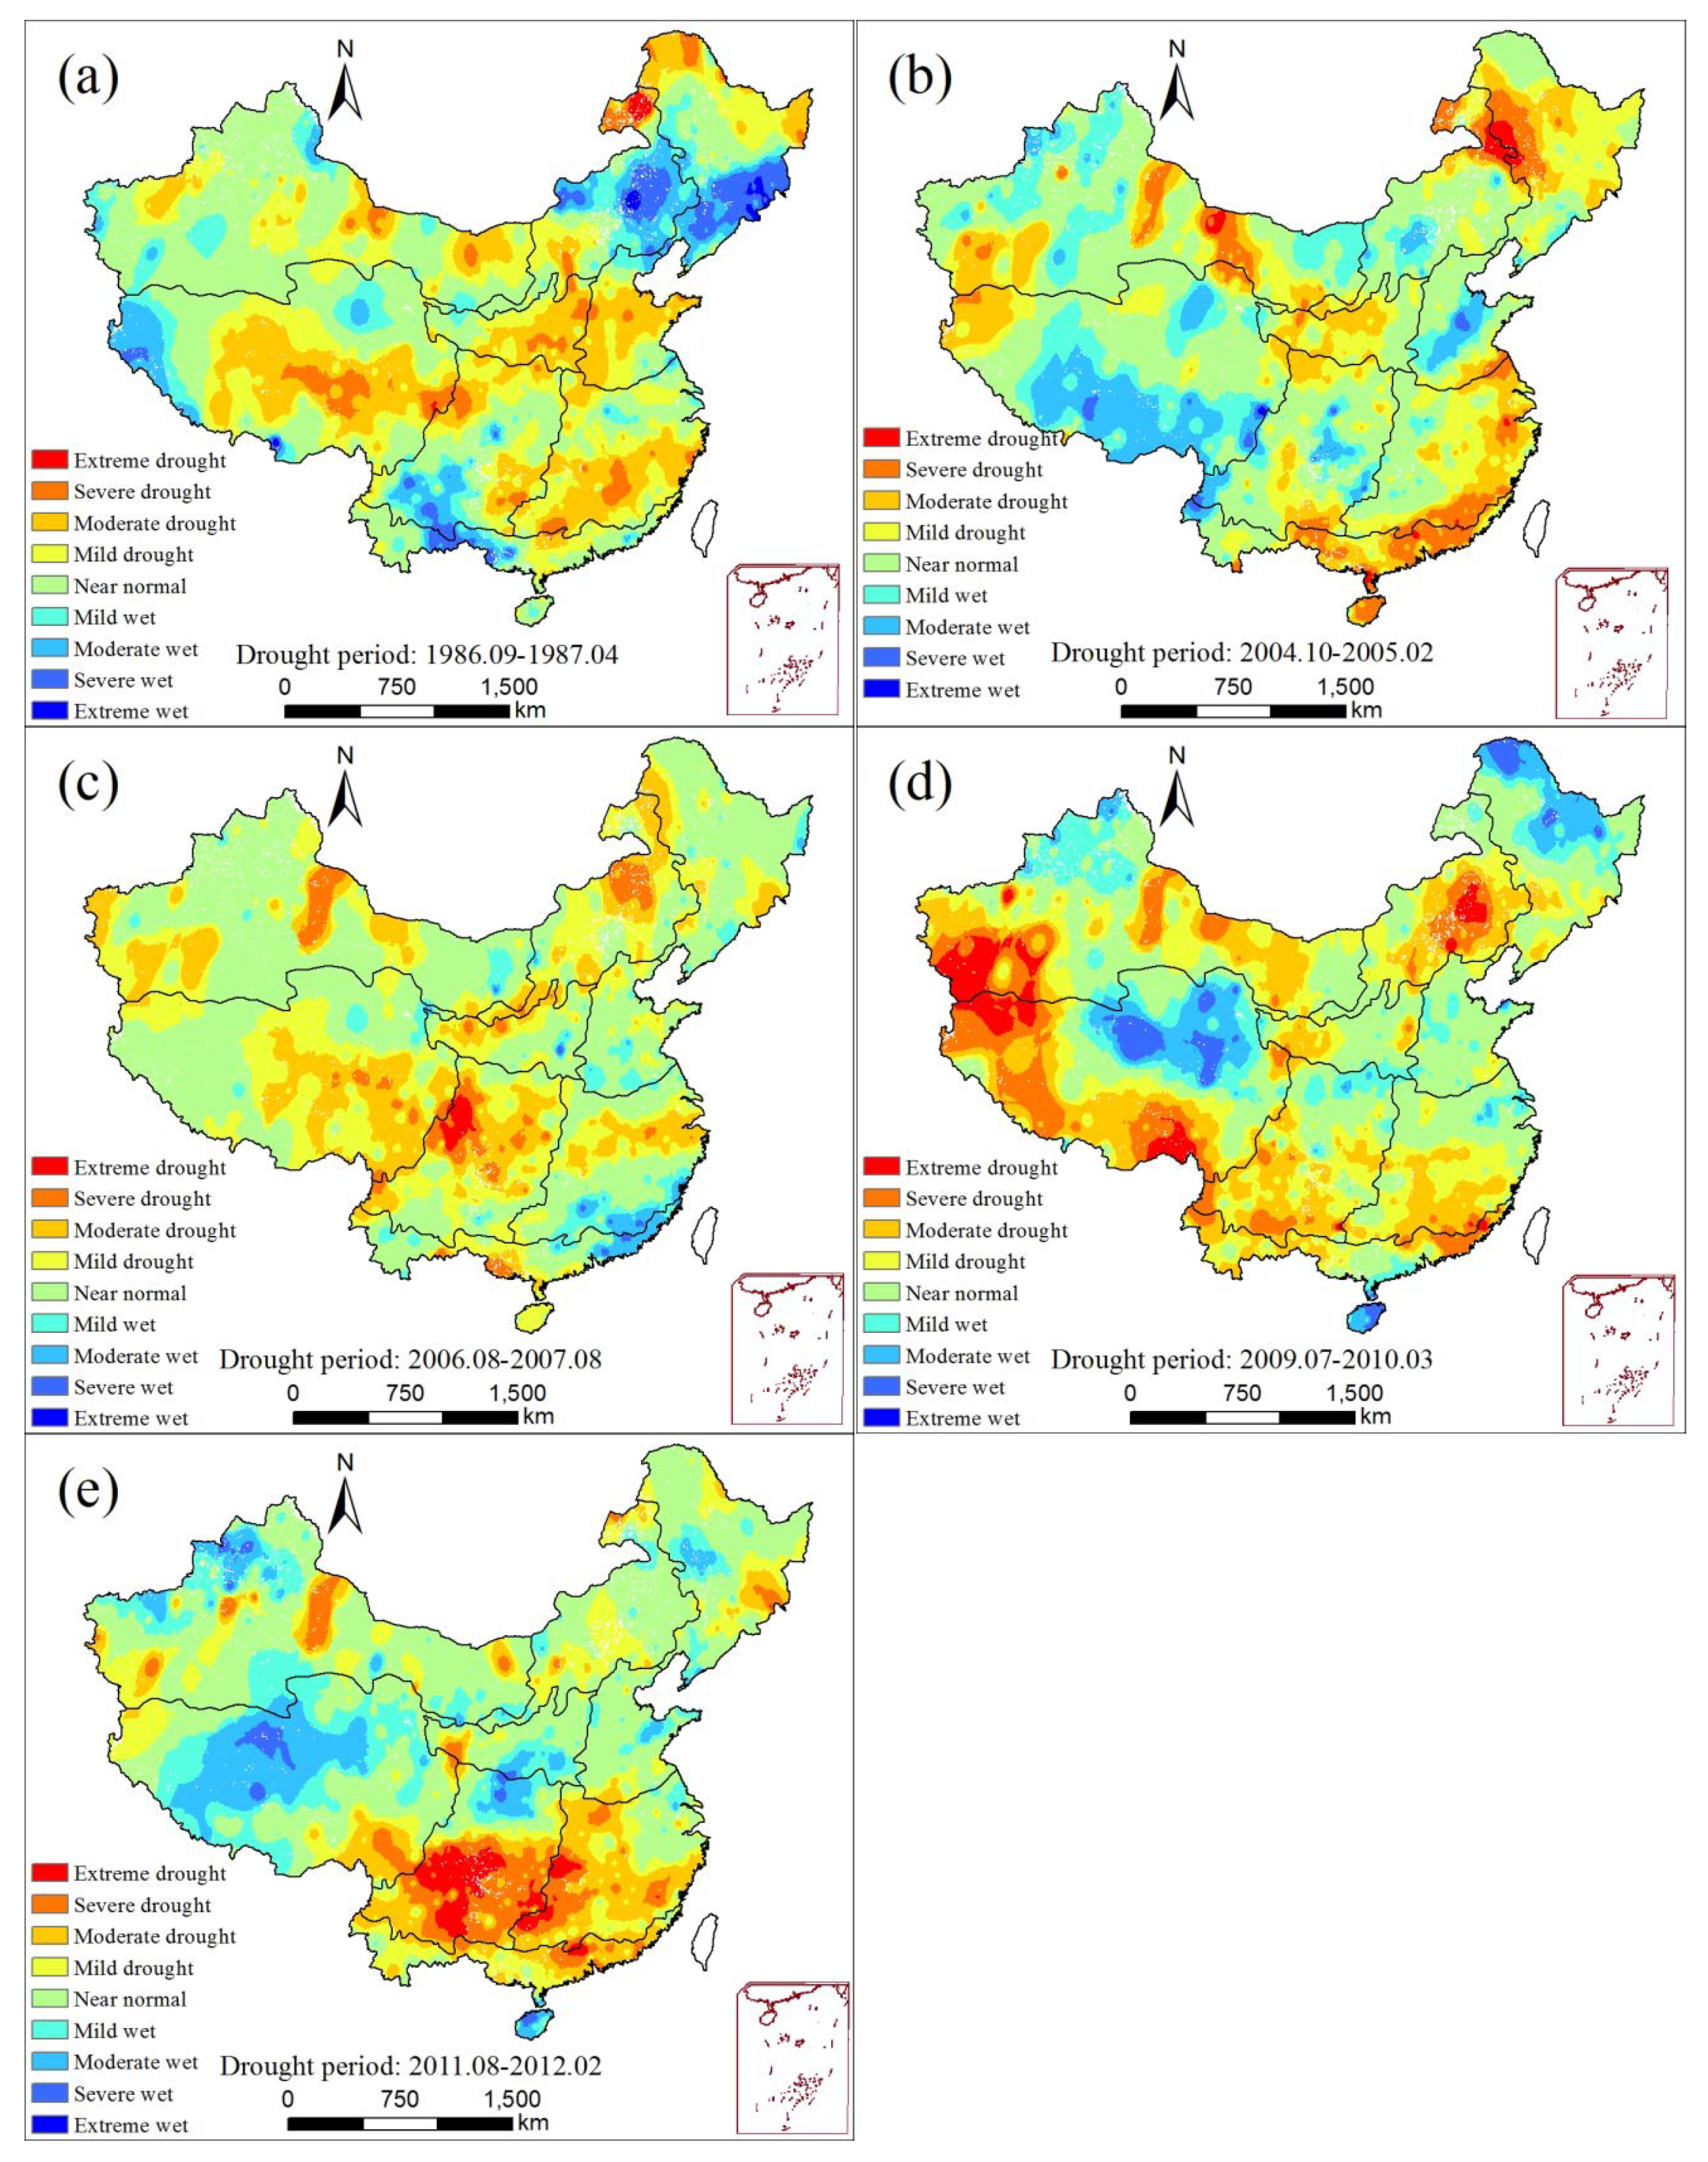
3.3.1. Characteristics of Drought

The spatial pattern of total drought frequency across mainland China from 1982 to 2015 is shown in Figure 6. Low drought frequency was detected in GXR, while high drought frequency was mainly identified for SWCR and QTPR. According to our statistic, MGR was identified as the highest drought frequency (with 2.09 times of drought each year, drought times refer to the frequency of annual average drought occurrence), while the frequency is very low in GXR with a mean of 0.09 times per year. Generally, the frequency of droughts across mainland China was 1.29 times every year. Figure 7 illustrates the percentages of annual drought area in each sub-region and mainland China from 1982 to 2015. The percentage of the drought area in the entire area of mainland China showed a slightly increasing trend and the average annual area affected by drought accounted for 13.54% every year. The drought-affected area of each year in both SWCR and LPR were relatively high, accounting for 15.43% and 14.93%, respectively, while the drought area in GXR only accounted for only 7.45% every year.
The drought events in the nine sub-regions and for the whole of mainland China from 1982 to 2015 were identified and the top five drought events were ranked by their severities, as listed in Table 4. For the whole mainland of China (Figure 7), the most severe and longest drought occurred from September 2006 to August 2007 and continued for 12 months and the drought area reached 2.89 × 10⁶ km2, which accounts for about 33.4% of the total land areas of mainland China. During this drought period, drought mainly occurred in QTPR, SWCR, and MGR (Figure 8c). The most widespread drought lasted from July 2009 to March 2010 and affected 3.29 × 10⁶ km2 area, covering 37.8% areas of mainland China; during this period, vast areas of QTPR, GXT, SWCR, YRR, and MGR experienced moderate to extreme drought (Figure 8d). During September 1986–April 1987, most of QTPR, HHHR, LPR, and YRR experienced moderate and severe drought (Figure 8a). The drought from October 2004 to February 2005 mainly affected areas in NCR, YRR, and LPR (Figure 8b). During August 2011–February 2012, drought mainly occurred in SWCR, YRR, and SCR (Figure 8e).
In NCR, the most severe drought was from September 2001 to July 2002 (11 months) and has affected an area of approximately 7.28 × 10⁵ km2 (73.2% of the whole NCR). Surprisingly, the longest lasting drought in SCR lasted for 12 months (October 2003 to September 2004) with an affected area of 2.86 × 10⁵ km2 (accounting for 77.2% of the total area). In YRR, the widespread drought occurred from February 2004 to January 2005 (12 months) and the drought area reached 4.96 × 10⁵ km2, accounting for 61.8% of the whole YRR. SWCR has experienced frequent large droughts in recent decades; for example, severe and widespread droughts occurred during July 2006–June 2007, September 2009–September 2010, July 2011–June 2012, and June 2013–July 2014, with a drought area of more than 4.85 × 10⁵ km2 (about 60% of the total area). The most severe drought in LPR lasted from August 1997 to June 1998 with nearly a 87.1% drought area. QTPR suffered the most large and extensive drought during August 1984–August 1985, with a coverage of over 1.14 × 10⁶ km2. In HHHR, the most severe drought lasted from July 2002 to May 2003, covering about 2.61 × 10⁵ km2, while the most extensive drought area during July 1999–January 2000 reached 3.87 × 10⁵ km2, accounting for 96.8% of total areas. In MGR, the most prolonged and severe drought happened from April 2001 to May 2002 (14 months) and the drought area covered about 5.39 × 10⁵ km2, accounting for 69.6% of the total area. There were no the typical drought events in GXR from 1982 to 2015.

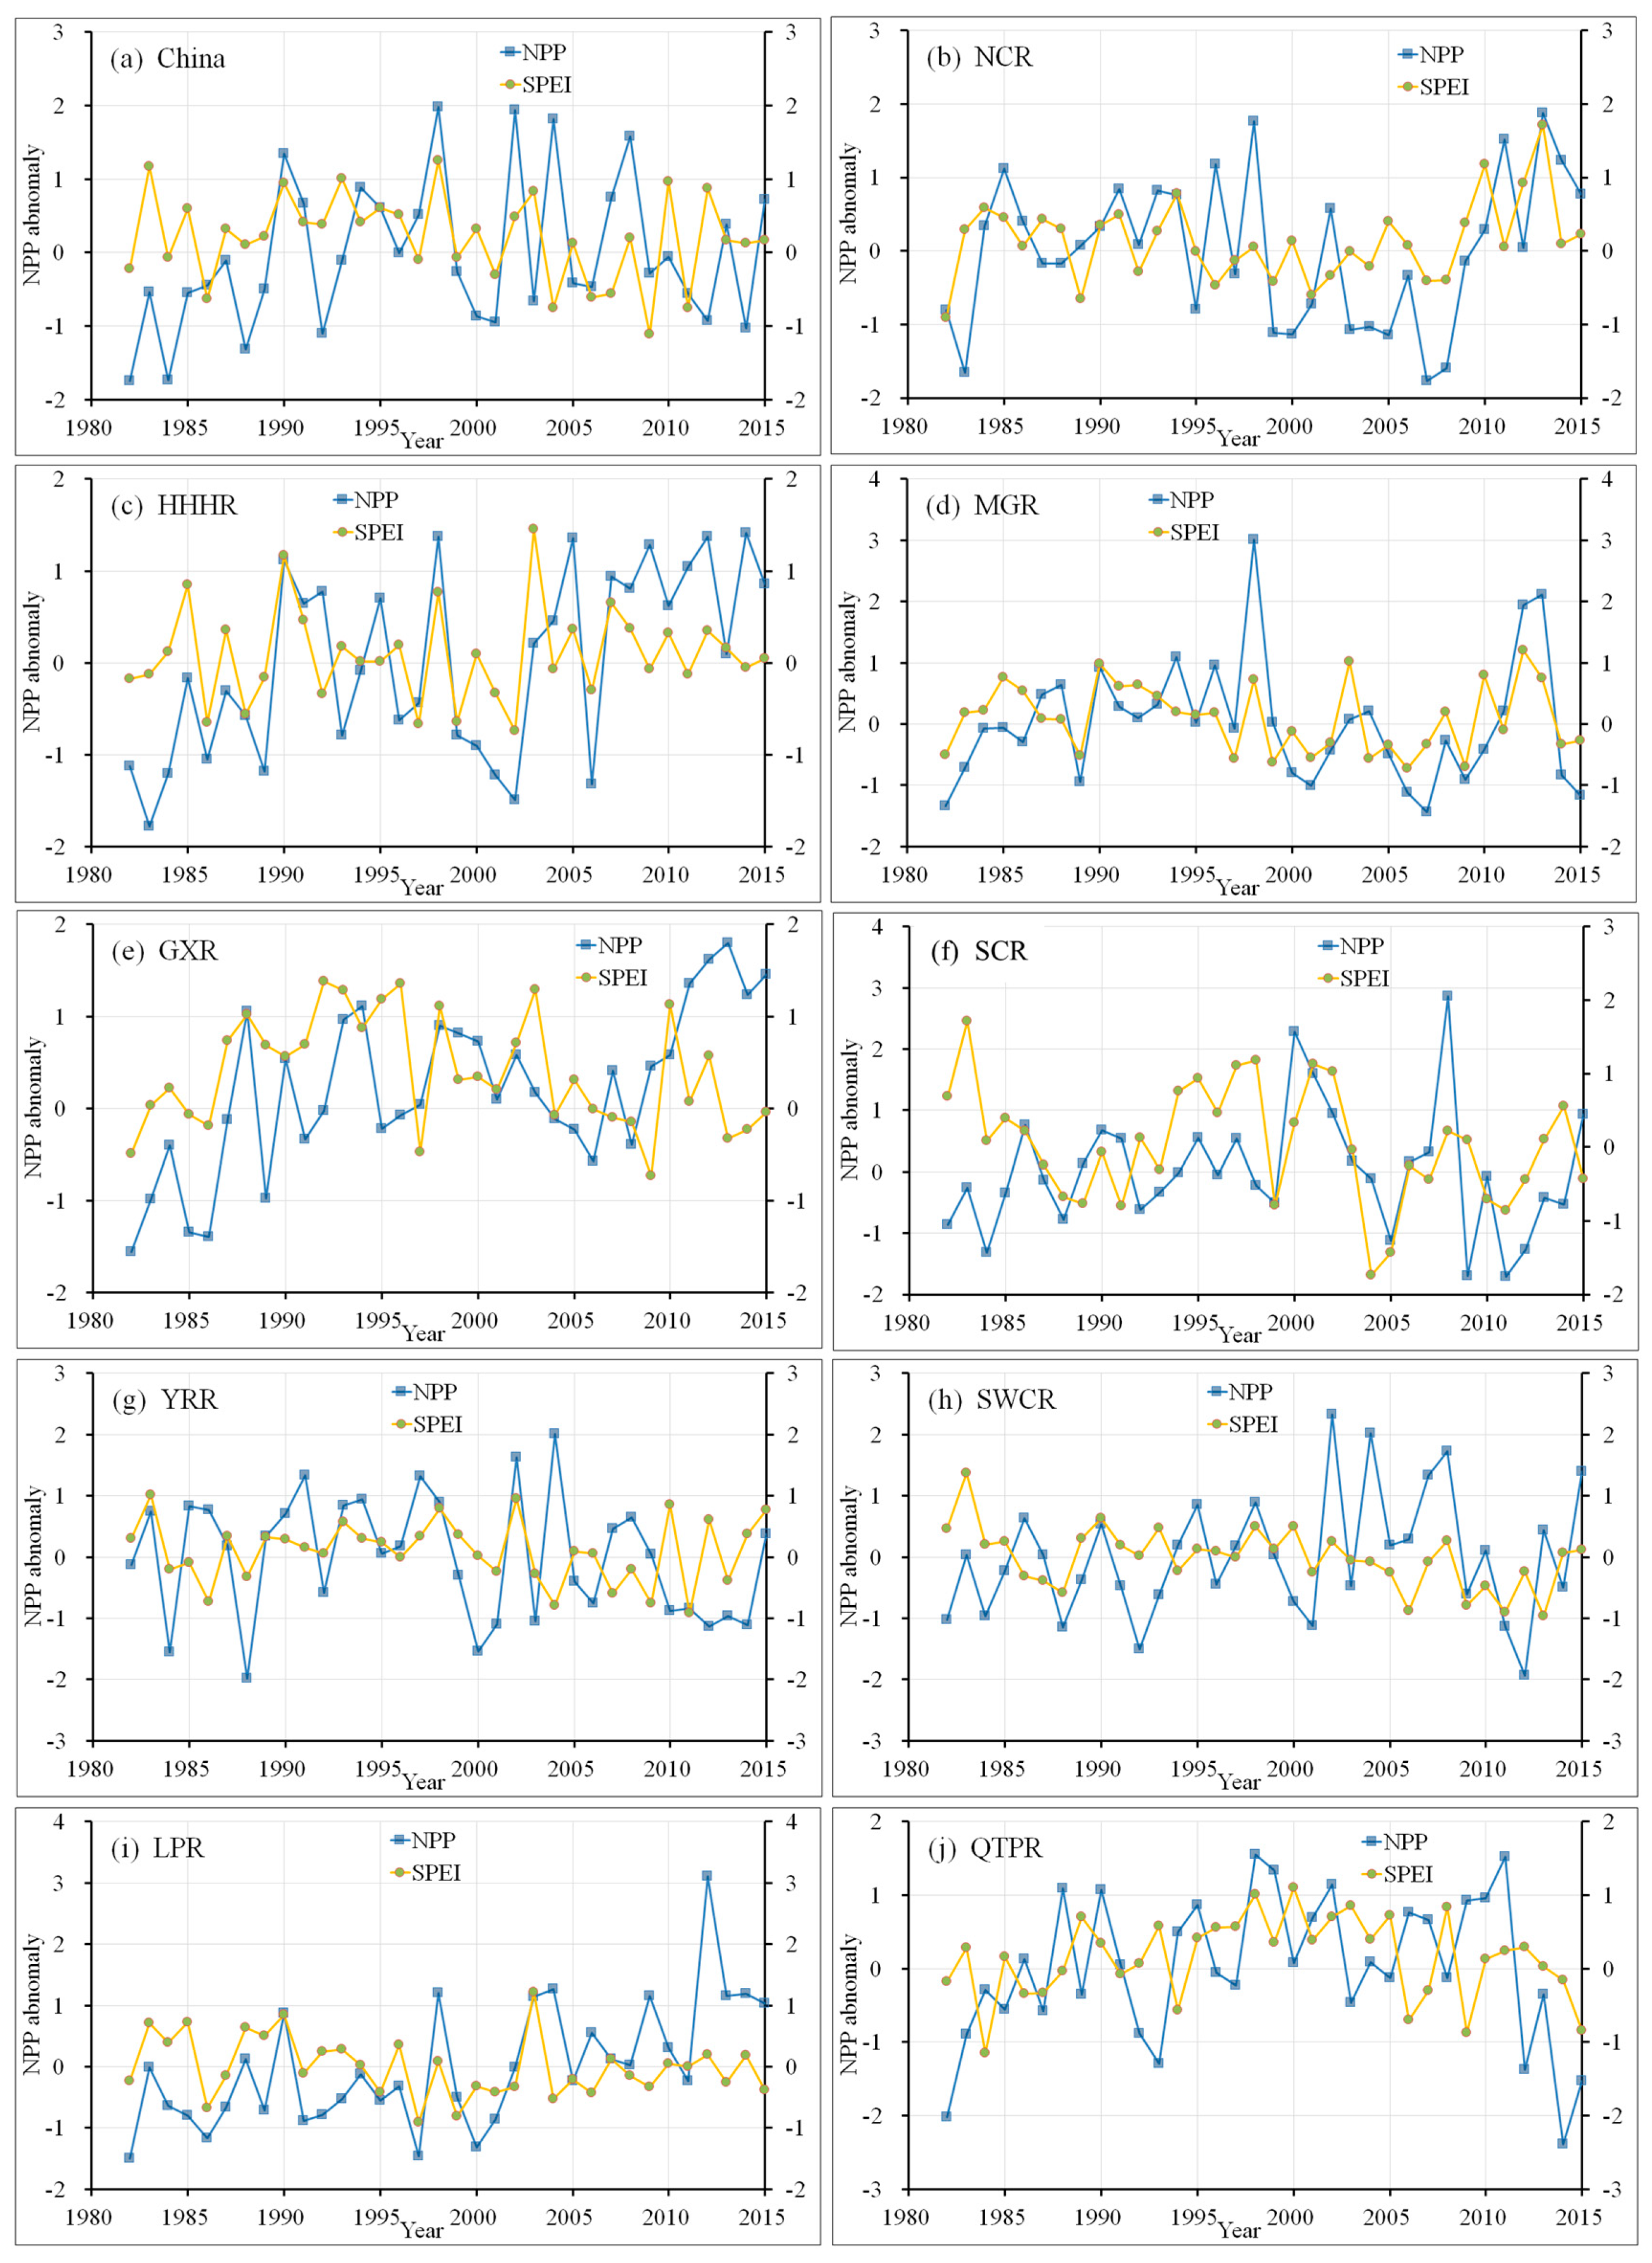
3.3.2. NPP Variation during Drought Events

To explore the NPP response under drought conditions, we concluded the spatial pattern of NPP changes percentages across China during some typical drought events (Figure 9). Figure 9a indicates that nearly 39.9% of the national area of NPP showed a declining trend during the drought from September 1986 to April 1987; a 10–30% reduction of NPP was detected in moderate drought areas, mainly in HHHR, LPR, and QTPR. A decrease of NPP was observed over 32.3% of the area of mainland China during the drought period of October 2004–February 2005; the severe drought areas in SCR generally observed a 20–30% decrease; a 10–30% decrease in NPP was found for mild and moderate drought areas of NCR (Figure 9b). During the period of September 2006 to August 2007, NPP generally reduced by about 10% in most of moderate drought areas, which were scattered in YRR and concentrated in QTPR and LPR; a decrease by 20–30% was found in MGR; however, NPP showed a reduction in non-drought areas in NCR (Figure 9c). Approximately 38.0% of the total area in mainland China displayed a reduction in NPP during July 2009 to March 2010; a slight reduction (0 to 20%) was generally observed in SCR and most areas of SWCR, while MGR showed a considerable decrease and a small part of the regions even decreased by more than 50% (Figure 9d). Figure 9e indicates that NPP presented a reduction of 39.7% of the whole of mainland China during August 2011 to February 2012; a decrease by 20 to 30% was detected in moderate and severe drought areas of the southern China, and a high decline was also detected in mild drought areas of MGR.
To further identify the impact of typical drought disasters on NPP variation, we explored the spatial pattern of NPP change percentage of each sub-region during drought events. The variation of NPP of SCR induced by each drought event were distinct; the most extensive and longest drought during October 2003–May 2005 generally decreased the NPP by 20–30%; NPP generally reduced by 10–30% during the widespread drought (June 2011–March 2012). In YRR, NPP generally decreased by approximately 15% during the drought periods while the short severe drought from August 2009 to December 2009 caused an abnormal reduction of 20–30%. Nearly the entire MGR showed a high decrease of NPP during the most widespread and lasting drought (September 2000–May 2002) and in some areas even reduced by more than 50%; during the long duration drought (February 2006–February 2007 and June 2007–May 2008), NPP across the entire MGR displayed a reduction to a different extent. In SWCR, a reduction by about 20% was observed during most of drought events; for example, during the most extensive drought (July 2011–June 2012), most of the areas showed a high reduction (20–30%). NPP usually decreased by about 20% in HHHR, while a 20–30% reduction was observed during January–July 1982. In NCR, NPP generally decreased by about 20% during drought events. QTPR generally showed a reduction NPP by about 10% during droughts. NPP in LPR showed a decrease to a different extent during droughts.
The white colored areas on land are non-vegetated pixels. The changes percentage refers to the NPP variation during drought events relative to the long-time average annual value of NPP corresponding to the period. The positive/negative value represents the increase/decrease in NPP during the drought event.

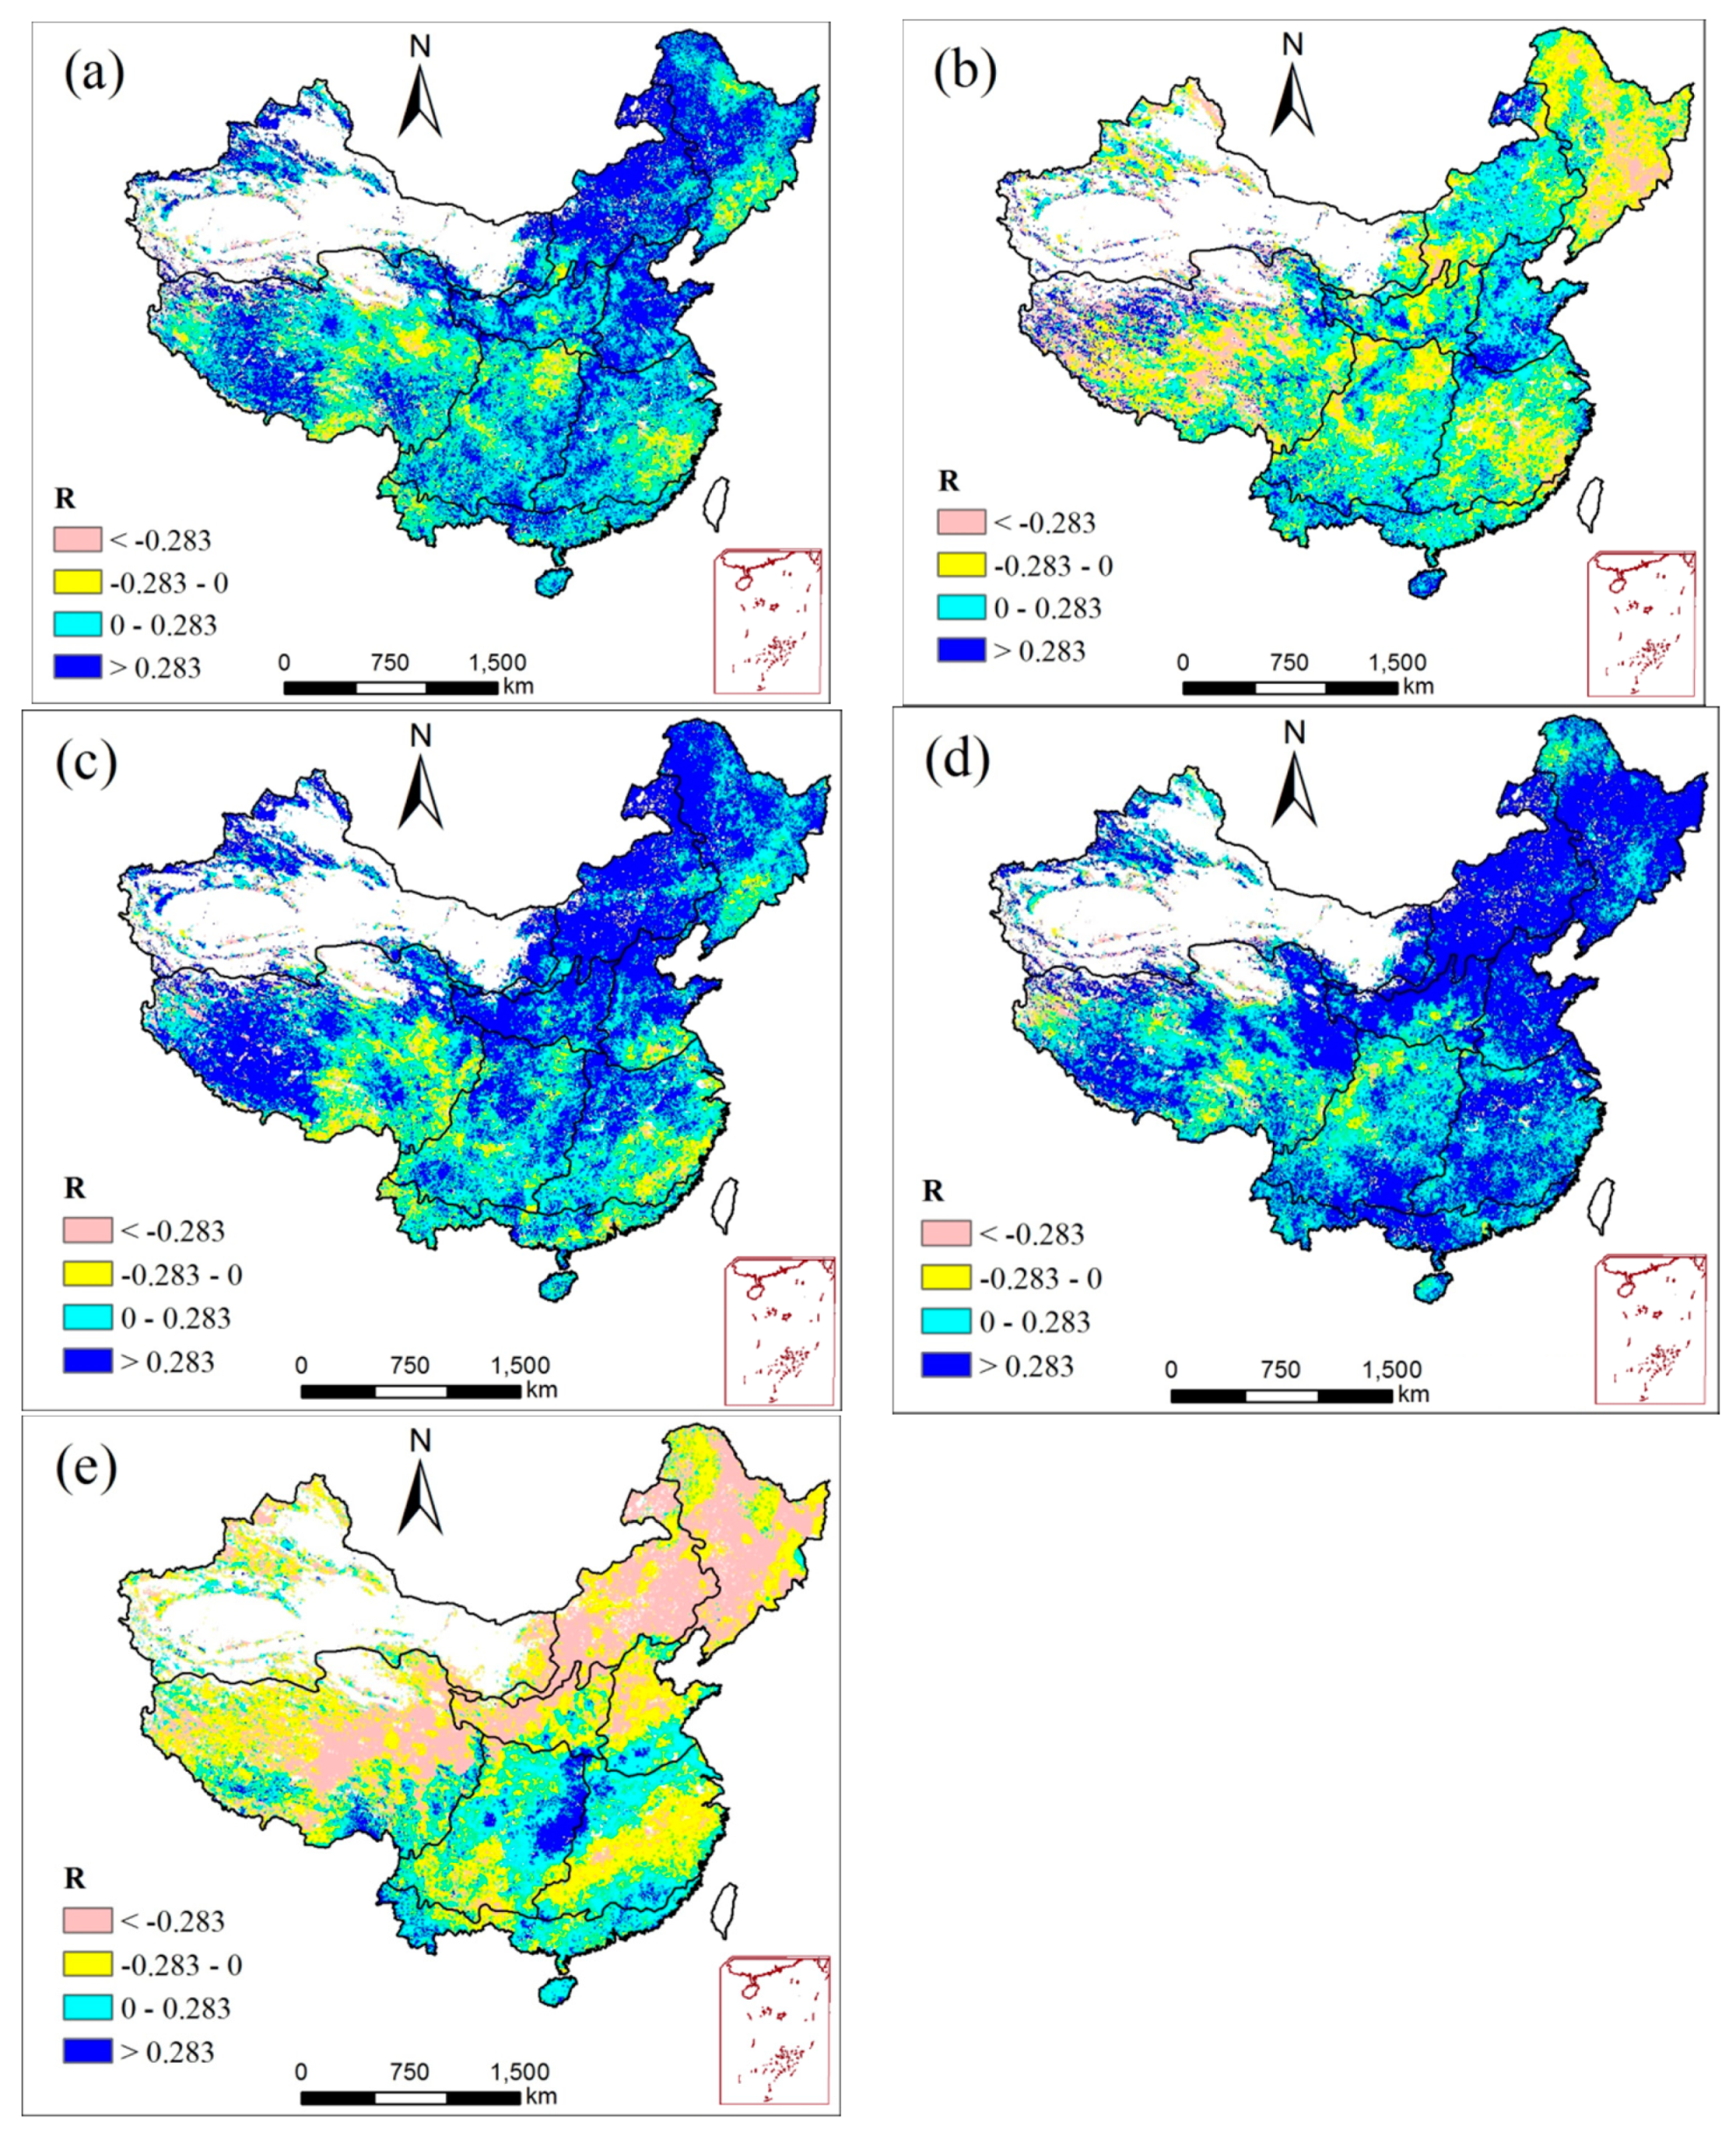
3.3.3. Relationship between NPP and Drought

According to Section 3.3.2, we found that the NPP reduced at different levels during the drought events. Before analyzing the drought response on NPP change, we conducted a correlation analysis between the NPP change and LUCC from 1990 to 2015 by GIS technique. We found that the correlation coefficient of the two maps was −0.242 (p < 0.05), indicating that the LUCC and NPP change showed a weak correlation at nation scale. Then we would mainly focus on the relationship between NPP and drought. Figure 10a shows the spatial distribution of the correlation coefficient between annual NPP and SPEI during 1982–2015. Overall, most of the areas of mainland China were dominated by positive correlations, accounting for 82.0% of the total area. The significant positive correlations (p < 0.1) were mainly distributed in GXR, MGR, NCR, and HHHR, covering 37.7% of mainland China. Negative correlations were mainly scattered throughout QTPR, YRR, and SWCR (covering 18% of mainland China), where only 10.0% were significantly negative. Seasonal relationships between NPP and SPEI over China are summarized in Figure 10b–e. In spring (Figure 10b), positive correlations were observed in more than half of the area of mainland China, mainly distributed in MGR, HHHR, and SCR. Negative correlations were generally detected in central QTPR, YRR, and NCR. Positive correlations between summer NPP and SPEI (Figure 10c) were identified for most regions of mainland China, while negative correlations were dispersed in QTPR and southern China; 45.4% of the national area showed significant positive relations, mainly distributed throughout Northern China. The spatial distribution of correlation coefficient in autumn (Figure 10d) shared similar situations with summer; a significant positive relation was detected in 53.3% of areas in mainland China while only 0.9% of these were markedly negative. In winter (Figure 10e), 62.5% of the total area displayed negative correlations, and these where mainly distributed in northern China and QTPR; among which 48.0% was statistically significant. Area percentage of correlation coefficient between annual NPP and SPEI during 1982–2015 is listed in Table 5.
The temporal correlations between NPP and SPEI in nine regions and in whole China are concluded in Table 6. For the entirety of mainland China, NPP and SPEI displayed a significant positive correlation in summer and autumn, while a negative correlation was detected in spring and winter. NCR, SCR, MGR, and GXR showed a significant positive correlation in summer and autumn as well as annually. Interestingly, a significant positive correlation was detected in HHHR except in winter. A significant positive correlation was observed in summer and autumn in LPR. In addition, YRR had an apparent positive correlation in autumn. However, in NCR, a significant negative correlation was observed in spring and winter. To complement Table 6, Figure 11 shows times series of annual SPEI and NPP anomalies between 1982 and 2015 in the nine sub-regions and mainland China. Annual NPP showed a weak relation to SPEI in whole China, while NPP was relatively low during the drought period (Figure 11a). As shown in Figure 11b–e, annual NPP was significantly correlated to the wet and drought conditions in NCR, HHHR, MGR, and GXR; higher NPP values were found during the wetter periods, and lower NPP values were found during typical drought events. However, a weak positive correlation was observed in most of the humid regions, including SCR, YRR, and SWCR, indicating that NPP variation was less sensitive to drought stress in these areas. In addition, NPP and SPEI also exhibited a weak positive correlation during the whole study period in QTPR and LPR.

4. Discussion

4.1. NPP Trends Related to Climate Variation

In this study, an increase of total annual NPP was observed across mainland China from 1982 to 2015, indicating that China plays an increasing role for regional and global carbon sinks. However, the summer NPP showed a highly decreased trend and the downtrend might be closely related to the increasing summer temperature over the past three decades [38]. An increased temperature in summer has imposed further environmental stresses on vegetation growth [28] and the high temperature led to higher soil moisture evaporation and therefore reduced the available soil water in vegetation growth. Moreover, increased summer temperature may accelerate plant respiration, thus resulting in less than optimal conditions for vegetation productivity [9,25]. In contrast, the spring NPP across mainland China displayed a significant increase, which is consistent with previous findings that the spring NPP over the Northern Hemisphere has increased over the past several [51]. Several studies have also reported that temperature mainly dominated the vegetation growth in spring and then showed a higher correlation with NPP in China [52,53]. Warm temperature in spring generally increased vegetation productivity by lengthening the growing season and by improving photosynthetic efficiency [54]. NPP in GXR also showed a high increase, which could result from the significant wetness in this region over the past three decades [34]. However, a high decline in annual NPP was detected in YRR, SWCR, and SCR, particularly after 2000. Decreased precipitation and increased temperature in these regions might have contributed to the considerable decrease of NPP in recent decades [38,55,56].

4.2. NPP Variation Induced by Drought

This study found a positive correlation between annual NPP and SPEI across most areas of mainland China, suggesting that the variation of NPP was (to some extent) related to drought conditions. In northern China, a significantly positive correlation was detected except during spring and winter. The global terrestrial ecosystem is mainly dominated by radiation, temperature, and water availability [19,57]. However, in northern China (i.e., arid and semi-arid regions), water availability rather than radiation or temperature is considered as the major constraint on plant productivity since in those areas, the heat energy is adequate. The occurrence of drought in those regions is usually caused by a deficiency of precipitation or higher evaporation [58], and thus leads to soil water deficits. Moreover, the response of NPP to drought is also related to vegetation type. The major vegetation types in GXR and MGR are meadows featuring typical desert steppe. Productivity would generally increase either linearly or asymptotically with increasing rainfall amount in these two regions [59], resulting in the SPEI and NPP exhibiting significant correlations. In winter, a negative relation between SPEI and NPP was observed for northern China during winter because most of the vegetation in these areas is normally dormant during winter [60,61] and water availability may not be an important limiting factor. In contrast, temperature in those regions showed higher positive correlations with plant productivity in winter [28]. Warm winter climate and increased radiation during the drought period might increase plant productivity in this season, resulting in a negative correlation.
A weakly positive correlation was found between annual NPP and SPEI in most humid areas, including SCR, YRR, and SWCR, which is consist with the previous findings that the variation of NPP presented low sensitivity to drought stress in humid areas [1,19]. In wet regions that characterize water surplus, a small or negative SPEI does not necessarily indicate water deficit [35], and thus the vegetation productivity might not be affected. In addition, the cloud cover in wet areas is noticeably larger compared to the rest of mainland China (less cloud coverage leads to more solar radiation). During the drought period, the increase of radiation caused by declining cloud coverage might increase plant productivity [53,62]. Additionally, the weak correlation might be related to the time scale of SPEI (three-month) used in this study [36]. Generally, the resilience and restorability of vegetation to drought stress is strong in the humid regions compared to other areas [63]. Most of the vegetation in humid areas possesses residual water and deep root systems that can reduce the impact of short-term water shortages on plant productivity [64]. Such an understanding may explain the weak relationship between SPEI and NPP in those humid regions. In LPR, the weak correlation was related to drastic human activities. The drought resistant vegetation that was widely planted in recent decades over LPR was capable of adapting to dry conditions [65], and mitigated the drought effect on plant productivity to a certain degree. In QTPR, temperature was the dominant factor effecting the NPP variation, and the recent climate warming contributed greatly to the increase in NPP [1]. The weak correlation in QTPR indicated that the increase of NPP caused by warm temperature might offset the impact of drought on plant productivity.
Although the above analysis indicates that the variation of NPP exhibited a weakly positive relation to drought conditions in some local areas, our results still confirmed that, to different degrees, NPP showed a reducing trend during the drought events. We believe that vegetation damage or even mortality caused by drought was the main reason for the significantly decreasing NPP observed for some regions. Most of the vegetation has some ability to resist a short-term or general drought via physiological activities such as improving water use efficiency, reducing leaf area, and using deep roots to transport water; however, they are vulnerable to long-term or severe droughts, which then resulted in a high decrease of vegetation productivity [62,66]. These long-term and severe droughts can drive vegetation damage or even mortality due to hydraulic-failure or carbon starvation [6,63]. For instance, a period of drought occurred from 2009 to 2010 in southwest China, which resulted in damage and mortality of large areas of vegetation and also triggered widespread forest fires [14,67], causing sharp declines in plant productivity. With the ongoing economic and social development, mainland China has become one of the major carbon emitters and the diverse vegetation of the prevailing ecosystems provided a great potential for ecosystem carbon sinks [28,68]. However, according to the above analysis, the carbon sequestration capacity of the terrestrial ecosystem might be wakened due to the disturbance of the frequently severe droughts, indicating that effective measures are required to sustain and enhance the carbon sink of the terrestrial ecosystem for removing the increase of CO2 emissions across mainland China.

4.3. Other Potential Factors Affecting NPP Variation

Although the NPP variation is closely related to climate fluctuation, NPP change in some region may mainly be dominated by other factors, such as land use/cover change (LUCC) and agricultural activity. LUCC triggered by human activity fundamentally alters structures and functions of natural ecosystem [37,69]. As one of the anthropogenic LUCC, the process of urbanization is associated with the immigration from rural residential land to urban areas, accompanied by encroaching forests and converting from cropland to urban land [70,71]. Such human disturbance directly decreases the productivity of natural ecosystem, and even decline carbon sequestration potential of vegetation and soil [72]. In this study, a significant decrease was found in Yangtze River delta, Pearl River Delta, and Beijing region, which may be related to rapid urbanization in these regions during the past 30 years. For Pearl River Delta, although warm and humid climate with abundant rainfall and heat are more favorable to increase vegetation productivity in the urban areas [11,73], the increase of vegetation productivity is still not enough to offset the NPP losses induced by urbanization [11,37,73]. Generally, the LUCC has significant impact on NPP change at relatively small spatial scale. For the nation scale, Tian and Qiao [74] assessed the impact of the urbanization process on net primary productivity in China from 1989 to 2000, and they concluded that the total loss of NPP due to urban development in China was speculated as 0.95 Tg C, which accounted for 0.03% of the national total NPP of 1989 (3129 Tg C). Li et al. [2] reported that the total losses of NPP in China attributed to urbanization reached 1.695 Tg C between the late 1980s and 2015, which accounted for 0.06% of the national total NPP of 2015 (2928 Tg C); and they also concluded that the conversion to grassland and forestland from other land use typed have increased the total NPP by 5.703 Tg C from the late 1980s to 2015, accounting for 0.19% of the national total NPP of 2015. In addition, He et al. [42] investigated the impact of urban expansion on the cropland NPP in China from 1992 to 2015; they found that the total loss of the cropland NPP due to urban expansion from 1992 to 2015 was 13.77 Tg C, accounting for 1.88% of the cropland NPP in 1992. These results indicate that LUCC indeed have certain impacts on NPP variation at nation scale especially in the mid-eastern and southeast coastal areas, however, the NPP loss were relatively low relative to the annual total NPP. Overall, the LUCC induced by human activity has decreased NPP to a certain extent.
Agricultural activity (e.g., irrigation, CO2 fertilization, and nitrogen (N) fertilization) is another significant factor affecting NPP variation [75,76]. In this study, a significant increase of NPP was observed in HHHR. This region is regarded as one of the most important grain production bases of China where the increased NPP was greatly attributed to agricultural activities such as increased irrigation and fertilization over the recent several decades [56]. The use of N fertilization could contribute to increasing vegetation productivity to a certain extent; the addition N can accelerate the uptake of carbon dioxide, increase water-use efficiency of foliage, and reduce the thermally dissipated light [76]. During the past century, the atmospheric CO2 concentrations showed a significant increase in the world [27]. With the social and economic development, China has become one of the major CO2 emitters since 2006 (about 1.5 Pg C year−1) [28]. The increasing CO2 concentrations cause a warming climate and then enhance photosynthesis efficiency of vegetation independently of climatic impacts and land-use patterns, making it conducive to extend the growing season of vegetation and increase the vegetation productivity [77,78,79]. Although the CASA model is widely used to simulate the NPP at regional or global scale [2,7,10,11,28], it does not directly consider N or CO2, which limits studies concerning the NPP variation and its control more or less. Therefore, it is essential to consider the impacts of N or CO2 on NPP variation and a more comprehensive model needs to be employed to simulate NPP in the future studies.

5. Conclusions

In this study, the influences of drought on NPP across mainland China were investigated for 1982–2015 based on the CASA model and the SPEI index. The spatiotemporal characteristics of NPP and droughts as well as their relation were also analyzed. The findings of this study are of scientific and practical importance for improving our general understanding of the impact of climatic disturbance on terrestrial ecosystem across mainland China. The main conclusions of this study can be summarized as:
  • The estimate of NPP across mainland China conducted via the CASA model is satisfactory. For the temporal dimension, the annual NPP of mainland China showed a slightly increased trend from 1982 to 2015; the NPP of spring increased significantly, while the summer NPP showed a higher decreasing trend. For the spatial dimension, the annual NPP across mainland China increased over 54.9% areas and over 13.8% of them significantly increased; 45.1% areas showed a declining trend and 7.2% of them presented a significantly declining trend.
  • A positive spatial correlation between annual SPEI and NPP was observed in most areas of mainland China. The temporal relationship between NPP and SPEI showed a significant positive correlation in summer and autumn, while a negative relation was detected in spring and winter. Specific to each region, annual NPP and SPEI showed a significant positive relation in NCR, HHHR, MGR, and GXR. A weak positive correlation was observed for the remaining areas, namely SCR, YRR, SWCR, LPR, and QTPR.
  • Based on the SPEI index, typical drought events were identified in the nine regions and in mainland China from 1982 to 2015. There were five typical drought events in mainland China that occurred during the periods of 1986–1987, 2004–2005, 2006–2007, 2009–2010, and 2011–2012. During these drought events, more than 23% of the area of mainland China experienced drought ravage, in which NPP decreased to different extents. The NPP in most sub-regions decreased by approximately 30% during these events, while the NPP in QTPR generally decreased by about 10%. Generally, the NPP showed a reducing trend during the drought events.

Author Contributions

C.L. and Z.W. conceived and designed the research; J.L. performed the data analysis and wrote the manuscript; extensive editing and revisions to the final manuscript and conclusions were contributed by X.W. and Z.Z.; H.Y., P.W. and X.B. helped collect and analyze the data; and Y.L. and X.C. proposed some constructive suggestions about the research. All authors read and approved the manuscript.

Funding

The research was funded by the National Natural Science Foundation of China (Grant Nos. 51579105, 51709117, 91547202, and 51479216); China Postdoctoral Science Foundation (2017M612662); the Science and Technology Program of Guangzhou City (201707010072); the Science and Technology Planning Project of Guangdong Province, China (2017A040405020); and the special fund of water resources conservation and protection of Guangdong Province (2017).

Acknowledgments

We appreciate China Meteorological Administration, National Inventory of the Forest Ministry of China and NASA for freely providing the data. We also acknowledge the handling editor and anonymous reviewers that helped improve this paper with their comments and suggestions.

Conflicts of Interest

The authors declare that they have no conflict of interest.

References

  1. Zhao, M.; Running, S.W. Drought-induced reduction in global terrestrial net primary production from 2000 through 2009. Science 2010, 329, 940–943. [Google Scholar] [CrossRef] [PubMed]
  2. Li, J.; Wang, Z.; Lai, C.; Wu, X.; Zeng, Z.; Chen, X. Response of net primary production to land use and land cover change in mainland China since the late 1980s. Sci. Total Environ. 2018, 639, 237–247. [Google Scholar] [CrossRef] [PubMed]
  3. Kurz, W.A.; Stinson, G.; Rampley, G.J.; Dymond, C.C.; Neilson, E.T. Risk of natural disturbances makes future contribution of Canada’s forests to the global carbon cycle highly uncertain. Proc. Natl. Acad. Sci. USA 2008, 105, 1551–1555. [Google Scholar] [CrossRef] [PubMed]
  4. Anderegg, W.R.; Kane, J.M.; Anderegg, L.D. Consequences of widespread tree mortality triggered by drought and temperature stress. Nat. Clim. Chang. 2013, 3, 30. [Google Scholar] [CrossRef]
  5. Ciais, P.; Reichstein, M.; Viovy, N. Europe-wide reduction in primary productivity caused by the heat and drought in 2003. Nature 2005, 437, 529–533. [Google Scholar] [CrossRef] [PubMed]
  6. Allen, R.G.; Pereira, L.S.; Raes, D.; Smith, M. Crop Evapotranspiration—Guidelines for Computing Crop Water Requirements—FAO Irrigation and Drainage Paper 56; Food and Agriculture Organization of the United Nations: Rome, Italy, 1998. [Google Scholar]
  7. Pei, F.; Li, X.; Liu, X.; Lao, C. Assessing the impacts of droughts on net primary productivity in China. J. Environ. Manag. 2013, 114, 362–371. [Google Scholar] [CrossRef] [PubMed]
  8. Potter, C.S.; Randerson, J.T.; Field, C.B.; Matson, P.A.; Vitousek, P.M.; Mooney, H.A. Terrestrial ecosystem production: A process model based on global satellite and surface data. Glob. Biogeochem. Cycl. 1993, 7, 811–841. [Google Scholar] [CrossRef]
  9. Roxburgh, S.H.; Berry, S.L.; Buckley, T.N.; Barnes, B.; Roderick, M.L. What is NPP? Inconsistent accounting of respiratory fluxes in the definition of net primary production. Funct. Ecol. 2005, 19, 378–382. [Google Scholar] [CrossRef] [Green Version]
  10. Zhang, M.; Lai, R.; Zhao, Y.; Jiang, W.; Chen, Q. Estimating net primary production of natural grassland and its spatio-temporal distribution in China. Sci. Total Environ. 2016, 553, 184–195. [Google Scholar] [CrossRef] [PubMed]
  11. Jiang, C.; Wu, Z.; Cheng, J.; Yu, Q.; Rao, X. Impacts of urbanization on net primary productivity in the Pearl River Delta, China. Int. J. Plant Prod. 2015, 9, 581–598. [Google Scholar]
  12. Li, X.; Chen, G.; Liu, X.; Liang, X.; Wang, S.; Chen, Y.; Xu, X. A new global land-use and land-cover change product at a 1-km resolution for 2010 to 2100 based on human–environment interactions. J. Ann. Am. Assoc. Geogr. 2017, 107, 1040–1059. [Google Scholar] [CrossRef]
  13. Zhang, B.; Zhang, L.; Guo, H.; Leinenkugel, P.; Zhou, Y.; Li, L.; Shen, Q. Drought impact on vegetation productivity in the lower Mekong basin. Int. J. Remote Sens. 2014, 35, 2835–2856. [Google Scholar] [CrossRef]
  14. Zhang, L.; Xiao, J.; Li, J.; Wang, K.; Lei, L.; Guo, H. The 2010 spring drought reduced primary productivity in southwestern China. Environ. Res. Lett. 2012, 7, 045706. [Google Scholar] [CrossRef]
  15. Xiao, J.; Zhuang, Q. Drought effects on large fire activity in Canadian and Alaskan forests. Environ. Res. Lett. 2007, 2, 044003. [Google Scholar] [CrossRef] [Green Version]
  16. Van der Molen, M.K.; Dolman, A.J.; Ciais, P. Drought and ecosystem carbon cycling. Agric. For. Meteorol. 2011, 151, 765–773. [Google Scholar] [CrossRef]
  17. Law, B.E.; Falge, E.; Gu, L. Environmental controls over carbon dioxide and water vapor exchange of terrestrial vegetation. Agric. For. Meteorol. 2002, 113, 97–120. [Google Scholar] [CrossRef] [Green Version]
  18. Liu, Y.; Zhou, Y.; Ju, W.; Wang, S.; Wu, X.; He, M.; Zhu, G. Impacts of droughts on carbon sequestration by China’s terrestrial ecosystems from 2000 to 2011. Biogeosciences 2014, 11, 2583–2599. [Google Scholar] [CrossRef]
  19. Chen, T.; Werf, G.R.; Jeu, R.A.M.; Wang, G. A global analysis of the impact of drought on net primary productivity. Hydrol. Earth Syst. Sci. 2013, 17, 3885–3894. [Google Scholar] [CrossRef] [Green Version]
  20. Peng, D.; Zhang, B.; Wu, C.; Huete, A.R.; Gonsamo, A. Country-level net primary production distribution and response to drought and land cover change. Sci. Total Environ. 2017, 574, 65–77. [Google Scholar] [CrossRef] [PubMed]
  21. Reichstein, M.; Ciais, P.; Papale, D. Reduction of ecosystem productivity and respiration during the European summer 2003 climate anomaly: A joint flux tower, remote sensing and modelling analysis. Glob. Chang. Biol. 2007, 13, 634–651. [Google Scholar] [CrossRef]
  22. Phillips, O.L.; Aragao, L.E.O.C.; Lewis, S.L. Drought sensitivity of the Amazon rainforest. Science 2009, 323, 1344–1347. [Google Scholar] [CrossRef] [PubMed] [Green Version]
  23. Kwon, H.; Pendall, E.; Ewers, B.E.; Cleary, M.; Naithani, K. Spring drought regulates summer net ecosystem CO2 exchange in a sagebrush-steppe ecosystem. Agric. For. Meteorol. 2008, 148, 381–391. [Google Scholar] [CrossRef]
  24. Xiao, J.F.; Zhuang, Q.L.; Law, B.E. A continuous measure of gross primary production for the conterminous United States derived from MODIS and AmeriFlux data. Remote Sens. Environ. 2010, 114, 576–591. [Google Scholar] [CrossRef]
  25. Xiao, J.F.; Zhuang, Q.L.; Law, B.E. Assessing net ecosystem carbon exchange of U.S. terrestrial ecosystems by integrating eddy covariance flux measurements and satellite observations. Agric. For. Meteorol. 2011, 151, 60–69. [Google Scholar] [CrossRef] [Green Version]
  26. Potter, C.; Klooster, S.; Hiatt, C.; Genovese, V.; Castillarubio, J.C. Changes in the carbon cycle of Amazon ecosystems during the 2010 drought. Environ. Res. Lett. 2011, 6, 034024. [Google Scholar] [CrossRef] [Green Version]
  27. Piao, S.; Ciais, P.; Huang, Y. The impacts of climate change on water resources and agriculture in China. Nature 2010, 467, 43. [Google Scholar] [CrossRef] [PubMed]
  28. Liang, W.; Yang, Y.; Fan, D.; Guan, H.; Zhang, T.; Long, D.; Zhou, Y.; Bai, D. Analysis of spatial and temporal patterns of net primary production and their climate controls in China from 1982 to 2010. Agric. For. Meteorol. 2015, 204, 22–36. [Google Scholar] [CrossRef]
  29. Yu, G.R.; Zhu, X.J.; Fu, Y.L. Spatial patterns and climate drivers of carbon fluxes in terrestrial ecosystems of China. Glob. Chang. Biol. 2013, 19, 798–810. [Google Scholar] [CrossRef] [PubMed]
  30. Zhang, L.; Zhou, T. Drought over East Asia: A review. J. Clim. 2015, 28, 3375–3399. [Google Scholar] [CrossRef]
  31. Wang, H.; Chen, Y.; Pan, Y.; Li, W. Spatial and temporal variability of drought in the arid region of China and its relationships to teleconnection indices. J. Hydrol. 2015, 523, 283–296. [Google Scholar] [CrossRef]
  32. Xu, K.; Yang, D.; Yang, H.; Li, Z.; Qin, Y.; Shen, Y. Spatio-temporal variation of drought in China during 1961–2012: A climatic perspective. J. Hydrol. 2015, 526, 253–264. [Google Scholar] [CrossRef]
  33. Sun, B.; Zhao, H.; Wang, X. Effects of drought on net primary productivity: Roles of temperature, drought intensity, and duration. Chin. Geogr. Sci. 2016, 26, 270–282. [Google Scholar] [CrossRef] [Green Version]
  34. Wang, Z.; Li, J.; Lai, C.; Zeng, Z.; Zhong, R.; Chen, X.; Zhou, X. Does drought in china show a significant decreasing trend from 1961 to 2009? Sci. Total Environ. 2017, 579, 314–324. [Google Scholar] [CrossRef] [PubMed]
  35. Vicente-Serrano, S.M.; Gouveia, C.; Camarero, J.J. Response of vegetation to drought time-scales across global land biomes. Proc. Natl. Acad. Sci. USA 2013, 110, 52–57. [Google Scholar] [CrossRef] [PubMed] [Green Version]
  36. Li, X.; He, B.; Quan, X.; Bai, X. Use of the standardized precipitation evapotranspiration index (SPEI) to characterize the drying trend in Southwest China from 1982–2012. Remote Sens. 2015, 7, 10917–10937. [Google Scholar] [CrossRef]
  37. Pei, F.; Li, X.; Liu, X.; Wang, S.; He, Z. Assessing the differences in net primary productivity between pre- and post-urban land development in China. Agric. For. Meteorol. 2013, 171–172, 174–186. [Google Scholar] [CrossRef]
  38. He, C.; Liu, Z.; Xu, M.; Ma, Q.; Dou, Y. Urban expansion brought stress to food security in China: Evidence from decreased cropland net primary productivity. Sci. Total Environ. 2017, 576, 660–670. [Google Scholar] [CrossRef] [PubMed]
  39. Zhu, W.; Pan, Y.; Zhang, J. Estimation of net primary productivity of Chinese terrestrial vegetation based on remote sensing. J. Plant Ecol. 2007, 31, 413–424. [Google Scholar]
  40. Vicente-Serrano, S.M.; Beguería, S.; López-Moreno, J.I. A multi-scalar drought index sensitive to global warming: The standardized precipitation evapotranspiration index. J. Clim. 2010, 23, 1696–1718. [Google Scholar] [CrossRef]
  41. Allen, C.D.; Macalady, A.K.; Chenchouni, H. A global overview of drought and heat-induced tree mortality reveals emerging climate change risks for forests. For. Ecol. Manag. 2010, 259, 660–684. [Google Scholar] [CrossRef]
  42. Chen, H.; Sun, J. Changes in drought characteristics over china using the standardized precipitation evapotranspiration index. J. Clim. 2015, 28, 540–5447. [Google Scholar] [CrossRef]
  43. Mann, H.B. Nonparametric tests against trend. Econometrica 1945, 13, 245–259. [Google Scholar] [CrossRef]
  44. Kendall, M.G. Rank Correlation Methods; Hafner Publishing Co.: Oxford, UK, 1975. [Google Scholar]
  45. Wang, Z.; Lai, C.; Chen, X.; Yang, B.; Zhao, S.; Bai, X. Flood hazard risk assessment model based on random forest. J. Hydrol. 2015, 527, 1130–1141. [Google Scholar] [CrossRef]
  46. Yue, S.; Wang, C.Y. Applicability of prewhitening to eliminate the influence of serial correlation on the Mann-Kendall test. Water Resour. Res. 2002, 38, 4-1–4-7. [Google Scholar] [CrossRef]
  47. Luo, T.X. Patterns of Net Primary Productivity for Chinese Major Forest Types and Its Mathematical Models. Ph.D. Thesis, Chinese Academy of Sciences, Beijing, China, 1996. [Google Scholar]
  48. Wu, X.; Guo, S.; Yin, J.; Yang, G.; Zhong, Y.; Liu, D. On the event-based extreme precipitation across China: Time distribution patterns, trends, and return levels. J. Hydrol. 2018, 562, 305–317. [Google Scholar] [CrossRef]
  49. Xu, X.G.; Lin, H.P.; Hou, L.S.; Yao, X. An assessment for sustainable developing capability of integrated agricultural regionalization in China. Chin. Geogr. Sci. 2002, 12, 1–8. [Google Scholar] [CrossRef]
  50. Wang, Z.; Xie, P.; Lai, C.; Chen, X.; Wu, X.; Zeng, Z. Spatiotemporal variability of reference evapotranspiration and contributing climatic factors in China during 1961–2013. J. Hydrol. 2017, 544, 97–108. [Google Scholar] [CrossRef]
  51. Piao, S.L.; Fang, J.Y.; Guo, Q.H. Application of CASA model to the estimation of Chinese terrestrial net primary productivity. Acta Phytoecol. Sin. 2001, 25, 603–608. [Google Scholar]
  52. Mohammat, A.; Wang, X.; Xu, X.; Peng, L.; Yang, Y.; Zhang, X. Drought and spring cooling induced recent decrease in vegetation growth in Inner Asia. Agric. For. Meteorol. 2013, 178, 21–30. [Google Scholar] [CrossRef]
  53. Wang, H.; Chen, A.; Wang, Q.; He, B. Drought dynamics and impacts on vegetation in China from 1982 to 2011. Ecol. Eng. 2015, 75, 303–307. [Google Scholar] [CrossRef]
  54. Mao, J.; Shi, X.; Thornton, P.E.; Wang, X. Causes of spring vegetation growth trends in the northern mid–high latitudes from 1982 to 2004. Environ. Res. Lett. 2012, 7, 014010. [Google Scholar] [CrossRef] [Green Version]
  55. Liu, Y.; Ju, W.; He, H.; Wang, S.; Sun, R.; Zhang, Y. Changes of net primary productivity in China during recent 11 years detected using an ecological model driven by MODIS data. Front. Earth Sci. 2013, 7, 112–127. [Google Scholar] [CrossRef]
  56. Wang, Z.; Zhong, R.; Lai, C.; Chen, J. Evaluation of the GPM IMERG satellite-based precipitation products and the hydrological utility. Atmos. Res. 2017, 196, 151–163. [Google Scholar] [CrossRef]
  57. Nemani, R.R.; Keeling, C.D.; Hashimoto, H.; Jolly, W.M.; Piper, S.C.; Tucker, C.J. Climate-driven increases in global terrestrial net primary production from 1982 to 1999. Science 2003, 300, 1560–1563. [Google Scholar] [CrossRef] [PubMed]
  58. Wang, Z.; Zhong, R.; Lai, C.; Zeng, Z.; Lian, Y.; Bai, X. Climate change enhances the severity and variability of drought in the Pearl River Basin in South China in the 21st century. Agric. For. Meteorol. 2018, 249, 149–162. [Google Scholar] [CrossRef]
  59. Shi, Z.; Thomey, M.L.; Mowll, W.; Litvak, M.; Brunsell, N.A.; Collins, S.L.; Pockman, W.T.; Smith, M.D.; Knapp, A.K. Differential effects of extreme drought on production and respiration: Synthesis and modeling analysis. Biogeosci. Discuss. 2013, 10, 16043–16074. [Google Scholar] [CrossRef]
  60. Li, Z.; Liu, G.; Fu, B.; Zhang, J. The potential influence of seasonal climate variables on the net primary production of forests in Eastern China. Environ. Manag. 2011, 48, 1173–1181. [Google Scholar] [CrossRef] [PubMed]
  61. Paul, A.; Kumar, S. Responses to winter dormancy, temperature, and plant hormones share gene networks. Funct. Integr. Genom. 2011, 11, 659–664. [Google Scholar] [CrossRef] [PubMed]
  62. Saleska, S.R.; Didan, K.; Huete, A.R.; da Rocha, H.R. Amazon forests green-up during 2005 drought. Science 2007, 318, 612. [Google Scholar] [CrossRef] [PubMed]
  63. Huang, L.; He, B.; Chen, A.; Wang, H.; Liu, J.; Lu, A.; Chen, Z. Drought dominates the interannual variability in global terrestrial net primary production by controlling semi-arid ecosystems. Sci. Rep. 2016, 6, 24639. [Google Scholar] [CrossRef] [PubMed] [Green Version]
  64. Xue, Z.; An, S.; Cheng, M.; Wang, W. Plant functional traits and soil microbial biomass in different vegetation zones on the Loess Plateau. J. Plant Interact. 2014, 9, 889–900. [Google Scholar] [CrossRef] [Green Version]
  65. Willson, C.J.; Manos, P.S.; Jackson, R.B. Hydraulic traits are influenced by phylogenetic history in the drought-resistant, invasive genus Juniperus (Cupressaceae). Am. J. Bot. 2008, 95, 299–314. [Google Scholar] [CrossRef] [PubMed] [Green Version]
  66. Zhang, X.; Moran, M.S.; Zhao, X.; Liu, S.; Zhou, T.; Ponce-Campos, G.E.; Liu, F. Impact of prolonged drought on rainfall use efficiency using MODIS data across china in the early 21st century. Remote Sens. Environ. 2014, 150, 188–197. [Google Scholar] [CrossRef]
  67. Xiong, H.; Wang, S.; Rong, L.; Cheng, A.; Li, Y. Effects of extreme drought on plant species in karst area of Guizhou Province, southwest China. Chin. J. Appl. Ecol. 2011, 22, 1127–1134. [Google Scholar]
  68. Zhang, C.; Ju, W.; Chen, J.; Wang, X.; Yang, L.; Zheng, G. Disturbance-induced reduction of biomass carbon sinks of China’s forests in recent years. Environ. Res. Lett. 2015, 10, 114021. [Google Scholar] [CrossRef] [Green Version]
  69. Yan, Y.; Liu, X.; Wang, F.; Li, X.; Ou, J. Assessing the impacts of urban sprawl on net primary productivity using fusion of Landsat and MODIS data. Sci. Total Environ. 2018, 613, 1417–1429. [Google Scholar] [CrossRef] [PubMed]
  70. Wise, M.; Kyle, G.P.; Dooley, J.J. The impact of electric passenger transport technology under an economy-wide climate policy in the United States: Carbon dioxide emissions, coal use, and carbon dioxide capture and storage. Int. J. Greenh. Gas Control. 2010, 4, 301–308. [Google Scholar] [CrossRef]
  71. Shochat, E.; Warren, P.S.; Faeth, S.H.; McIntyre, N.E. From patterns to emerging processes in mechanistic urban ecology. Trends Ecol. Evol. 2006, 21, 186–191. [Google Scholar] [CrossRef] [PubMed]
  72. Clerici, N.; Paracchini, M.L.; Maes, J. Land-cover change dynamics and insights into ecosystem services in European stream riparian zones. Ecohydrol. Hydrobiol. 2014, 14, 107–120. [Google Scholar] [CrossRef]
  73. Pei, F.; Li, X.; Liu, X.; Lao, C. Exploring the response of net primary productivity variations to urban expansion and climate change: A scenario analysis for Guangdong Province in China. J. Environ. Manag. 2015, 150, 92–102. [Google Scholar] [CrossRef] [PubMed]
  74. Tian, G.; Qiao, Z. Assessing the impact of the urbanization process on net primary productivity in China in 1989–2000. Environ. Pollut. 2014, 184, 320–326. [Google Scholar] [CrossRef] [PubMed]
  75. Du, Z.; Wang, W.; Zeng, W.; Zeng, H. Nitrogen deposition enhances carbon sequestration by plantations in northern China. PLoS ONE 2014, 9, e87975. [Google Scholar] [CrossRef] [PubMed]
  76. He, L.; Chen, J.M.; Liu, J.; Bélair, S.; Luo, X. Assessment of SMAP soil moisture for global simulation of gross primary production. J. Geophys. Res. Biogeosci. 2017, 122, 1549–1563. [Google Scholar] [CrossRef]
  77. Woodward, F.I.; Kelly, C.K. Responses of global plant diversity capacity to changes in carbon dioxide concentration and climate. Ecol. Lett. 2008, 11, 1229–1237. [Google Scholar] [CrossRef] [PubMed]
  78. Wang, Z.; Li, J.; Lai, C.; Wang, R.Y.; Chen, X.; Lian, Y. Drying tendency dominating the global grain production area. Glob. Food Sec. 2018, 16, 138–149. [Google Scholar] [CrossRef]
  79. Jeong, S.J.; HO, C.H.; GIM, H.J.; Brown, M.E. Phenology shifts at start vs. end of growing season in temperate vegetation over the Northern Hemisphere for the period 1982–2008. Glob. Chang. Biol. 2011, 17, 2385–2399. [Google Scholar] [CrossRef]
Figure 1. Spatial pattern of vegetation types and the nine sub-regions across mainland China. The Arabic notation denote as: 1, Northeast China Region (NCR); 2, Huang-Huai-Hai Region (HHHR); 3, Inner Mongolia Region (MGR); 4, Loess Plateau Region (LPR); 5, middle and lower regions of the Yangtze River (YRR); 6, Southwest China Region (SWCR); 7, South China Region (SCR); 8, Gan-Xin Region GXR; 9, Qinghai-Tibet Plateau Region (QTPR). The solid dots show locations of the 393 forest validation sites.
Remotesensing 10 01433 g001
Figure 2. Validation of the NPP estimate at 393 forest sites across mainland China (Li et al., 2018). Each dot represents averaged NPP from 1989 to 1993.
Remotesensing 10 01433 g002
Figure 3. Comparisons of annual mean NPP between this study and other studies. Note: The unit is g C m−2 year−1; EBF, ENF, DBF, and DNF represent evergreen broad-leaf forest, evergreen needle-leaf forest, deciduous broad-leaf forest, and deciduous needle-leaf forest, respectively; the study periods of Liang et al. [28], Luo [47], Piao et al. [51], and Zhu et al. [39] were 1989–1993, 1997, 1989–1993, and 1982–2010, respectively.
Remotesensing 10 01433 g003
Figure 4. Spatial distribution of mean annual NPP across mainland China from 1982 to 2015. The white colored areas on land are non-vegetated pixels.
Remotesensing 10 01433 g004
Figure 5. Spatial pattern of NPP trend across mainland China from 1982 to 2015. The white colored areas on land are non-vegetated pixels. Time scale: (a) annual; (b) spring; (c) summer; (d) autumn; and (e) winter.
Remotesensing 10 01433 g005
Figure 6. Spatial pattern of drought frequency across mainland China from 1982 to 2015.
Remotesensing 10 01433 g006
Figure 7. Percentage of annual drought areas across the nine sub-regions and mainland China.
Remotesensing 10 01433 g007
Figure 8. Spatial pattern of drought events (top 5) from 1982 to 2015 across the nine sub-regions and mainland China. (a) Drought period: September 1986–April 1987, (b) Drought period: October 2004–February 2005, (c) Drought period: August 2006–August 2007, (d) Drought period: July 2009–March 2010, (e) Drought period: August 2011–February 2012.
Remotesensing 10 01433 g008
Figure 9. Spatial pattern of NPP changes percentages across mainland China during drought events (Top 5). (a) the NPP variation drought period: September 1986–April 1987, (b) the NPP variation drought period: October 2004–February 2005, (c) the NPP variation drought period: August 2006–August 2007, (d) the NPP variation drought period: July 2009–March 2010, (e) the NPP variation drought period: August 2011–February 2012.
Remotesensing 10 01433 g009
Figure 10. Spatial distribution of correlation coefficient of different time scales between NPP and SPEI across the nine sub-regions and mainland China during 1982–2015. The white colored areas on land are non-vegetated pixels. Time scale: (a) annual; (b) spring; (c) summer; (d) autumn; and (e) winter.
Remotesensing 10 01433 g010
Figure 11. Times series of both annual SPEI and NPP anomalies across the nine sub-regions and mainland China during 1982–2015. (a) China, (b) NCR, (c) HHHR, (d) MGR, (e) GXR, (f) SCR, (g) YRR, (h) SWCR, (i) LPR, and (j) QTPR.
Remotesensing 10 01433 g011
Table 1. Categorization of dryness/wetness of Standardized Precipitation Evaporation Index (SPEI) values.
CategorySPEI ValueCategorySPEI Value
Extreme droughtLess than −2Mild wet0.50 to 0.99
Severe drought−1.99 to −1.5Moderate wet1.0 to 1.49
Moderate drought−1.49 to −1.0Severe wet1.50 to 1.99
Mild drought−0.99 to −0.50Extreme wetMore than 2
Near normal−0.49 to 0.49
Table 2. Temporal trend of annual and seasonal NPP across nine sub-regions and entire mainland China.
RegionYearSpringSummerAutumnWinter
MKSlope (Pg C Year−1)MKMKMKMK
NCR0.2370.0050.474−0.8010.6230.682
SCR0.2370.0041.749−0.919−1.5420.937
YRR−1.364−0.0270.534−1.957−1.8380.937
SWCR1.1860.0202.757−0.9191.1270.511
LPR3.7950.0582.9352.6093.1720.312
QTPR0.7710.0181.660−0.3850.3260.256
HHHR3.0240.0584.5660.5042.1351.988
MGR−0.623−0.0102.520−1.2750.9490.227
GXR1.8380.0581.3051.2752.105−0.966
Mainland China0.7710.0253.083−1.1560.2371.25
Note: MK denotes MK statistics; Slope denotes trends (Pg C year−1); values for the trends at the 0.05 significant level are shown in bold; the abbreviations represent as: Northeast China Region (NCR), Huang-Huai-Hai Region (HHHR), Inner Mongolia Region (MGR), Loess Plateau Region (LPR), middle and lower regions of the Yangtze River (YRR), Southwest China Region (SWCR), South China Region (SCR), Gan-Xin Region GXR, Qinghai-Tibet Plateau Region (QTPR).
Table 3. Statistic summary of the percentages of pixels showing different trends in annual and seasonal NPP over China during 1982–2015.
Time ScaleNon-Significant Increase (%)Significant Increase (%, p < 0.05)Non-Significant Decrease (%)Significant Decrease (%, p < 0.05)
Year54.913.845.17.2
Spring67.623.932.46.7
Summer43.78.556.310.4
Autumn55.911.644.15.4
Winter60.69.839.45.9
Table 4. Typical drought events across nine sub-regions and mainland China.
RegionPersistent Period (Month Year)Duration (Month)Maximum Affected Area (105 km2)Percentage of Drought Areas (%)SeverityIntensity
Mainland China09.2006–08.20071228.933.415.56−1.9
07.2009–03.2010932.737.811.55−1.8
08.2011–02.2012720.824.07.72−1.5
09.1986–04.1987822.425.87.38−1.2
10.2004–02.2005519.722.74.54−1.2
NCR09.2001–07.2002117.2873.219.38−2.1
07.2007–06.2008127.0170.417.46−2
07.1982–05.1983116.4264.515.34−1.7
10.2004–03.200563.8839.06.01−1.3
06.2000–10.200054.7647.94.54−1.4
SCR10.2003–09.2004122.8677.219.39−2.2
06.2011–03.2012102.6070.211.80−1.8
2009.10–2010.0582.2761.28.50−1.5
08.1989–02.199071.7647.68.11−1.5
04.1999–08.199952.4466.05.68−1.7
YRR02.2004–01.2005124.9661.816.26−1.8
05.2011–02.2012104.2849.8-14.18−1.8
07.2007–05.2008114.4255.111.12−1.7
08.1986–04.198793.7646.89.76−1.3
08.2009–12.200953.6845.84.64−1.3
SWCR07.2006–06.2007125.3662.922.71−2.3
07.2011–06.2012125.6766.521.62−2.3
09.2009–09.2010135.1460.420.13−2.1
07.2013–07.2014134.8556.917.53−1.5
11.1992–07.199394.0747.78.73−1.5
LPR08.1997–06.1998113.1387.122.67−2.8
09.1986–05.198792.1960.710.39−1.5
05.1999–10.199962.5370.37.52−2.3
04.2000–09.200062.6673.87.41−1.9
02.1992–07.199262.9281.26.91−1.7
QTPR08.1984–08.1985131.1458.219.86−2.0
08.1994–07.1995121.0453.117.10−1.8
08.2006–06.2007116.7934.513.50−1.6
09.1986–06.1987107.4437.810.50−1.3
09.2009–03.201078.8044.77.70−1.3
HHHR07.2002–05.2003112.6165.213.16−1.5
1982.01–1982.0772.9674.010.50−1.9
1997.08–1998.0493.3082.610.16−1.8
07.1999–01.200073.8796.88.69−2.0
11.2001–04.200262.7969.77.32−1.8
MGR04.2001–05.2002145.3969.619.79−1.8
06.2007–05.2008124.3556.214.78−1.5
03.2006–02.2007124.5659.013.34−1.3
08.2009–03.201084.2955.49.72−1.6
02.2000–07.200064.9063.44.90−1.6
Table 5. Area percentage of correlation coefficient between annual NPP and SPEI across mainland China during 1982–2015.
PeriodPositive Correlation (%)Significantly Positive Correlation (%)Negative Correlation (%)Significantly Negative Correlation (%)
Year82.037.7181.8
Spring51.80.9848.29.2
Summer83.845.416.21.4
Autumn88.753.011.30.9
Winter37.5762.530
Table 6. Temporal correlation coefficient between NPP and SPEI across nine sub-regions and mainland China.
RegionYearSpringSummerAutumnWinter
NCR0.409−0.3740.3410.548−0.387
SCR0.2720.0520.380.5050.277
YRR0.175−0.1470.1130.4320.118
SWCR0.1290.0250.2280.2350.112
LPR0.2270.0840.5190.402−0.155
QTPR0.137−0.198−0.1320.211−0.096
HHHR0.4850.340.3310.5750.001
MGR0.6320.0780.6880.639−0.622
GXR0.334−0.2910.4440.401−0.326
Mainland China0.134−0.2160.3780.322−0.119
Note: values for the trend at 0.05 significant level are shown in bold.

