Long-Term Changes in Water Clarity in Lake Liangzi Determined by Remote Sensing


1
National Field Station of Freshwater Ecosystem of Liangzi Lake, College of Life Sciences, Wuhan University, Wuhan 430072, Hubei, China
2
Taihu Laboratory for Lake Ecosystem Research, State Key Laboratory of Lake Science and Environment, Nanjing Institute of Geography and Limnology, Chinese Academy of Sciences, Nanjing 210008, Jiangsu, China
*
Authors to whom correspondence should be addressed.
Remote Sens. 2018, 10(9), 1441; https://0-doi-org.brum.beds.ac.uk/10.3390/rs10091441
Submission received: 24 August 2018
/
Accepted: 6 September 2018
/
Published: 10 September 2018
(This article belongs to the Section Remote Sensing in Geology, Geomorphology and Hydrology)
Abstract
:Water clarity (via the Secchi disk depth, SDD) is an important indicator of water quality and lake ecosystem health. Monitoring long-term SDD change is vital for water quality assessment and lake management. In this study, we developed and validated an empirical model for estimating the SDD based on Landsat ETM+ and OLI data using the combination of band ratio of the near-infrared (NIR) band to the blue band and the NIR band. Time series data of remotely estimated SDD in Lake Liangzi were retrieved from 2007 to 2016 using the proposed models based on forty Landsat images. The results of the Mann–Kendall test (p = 0.002) and linear regression (R2 = 0.352, p < 0.001) indicated that the SDD in Lake Liangzi demonstrated a significant decreasing trend during the study period. The annual mean SDD in Lake Liangzi was significantly negatively correlated with the population (R2 = 0.530, p = 0.017) and gross domestic product (R2 = 0.619, p = 0.007) of the Lake Liangzi basin. In addition, water level increase and the flood have an important effect on SDD decrease. Our study revealed that anthropogenic activities may be driving factors for the long-term declining trend in the SDD. Additionally, floods and heavy precipitation may decrease the SDD over the short term in Lake Liangzi. A declining trend in the SDD in Lake Liangzi may continue under future intense anthropogenic activities and climate change such as the extreme heavy precipitation event increase.
1. Introduction
Freshwater, which is mainly stored in lakes and reservoirs, is an essential resource for natural and human needs. However, the water quality of many lakes is becoming degraded, and people find it necessary to monitor water quality change [1]. Traditional water quality monitoring is based on in situ measurements and laboratory analysis, which are accurate but time-consuming and expensive and cannot monitor an overview of large regions [2,3]. Satellite remote sensing is a powerful tool that has been widely used to assess spatial and temporal variations in water quality [4,5,6]. More importantly, satellite remote sensing is the only way to retrospectively view long-term variations due to many in situ water environment monitoring efforts only having been started in the past several years. Landsat series data have been widely used for monitoring surface water quality. Many reliable algorithms for Landsat data and water quality parameters have been developed, such as chlorophyll-a (Chl-a), total suspended matter (TSM), total nitrogen, and total phosphorus [3,7,8].
The Secchi disk depth (SDD) is a measure of water clarity that is widely accepted to indicate water quality conditions [9,10]. Water clarity is related to many other water quality parameters, such as TSM, Chl-a, and dissolved organic carbon and is a basic and important water quality parameter [11]. Water clarity also can reflect essential information on light availability in aquatic ecosystems [12,13]. Therefore, it is important to monitor long-term SDD changes to benefit our understanding of lake ecosystems and lake management. A large number of studies have used Landsat data to retrieve SDDs, and most of them use the simple linear regression of single band or band ratios [14]. However, these retrieved algorithms of the SDD are empirical regional algorithms and cannot be used in Lake Liangzi directly. Thus, customized retrieval models of the SDD based on Landsat data in Lake Liangzi need to be developed and validated.
The water quality of inland waters is determined by numerous factors, such as hydrologic conditions, phytoplankton, and anthropogenic activities [11,15]. The watershed human population and economic development in the area are also important factors of declining water quality with many direct and indirect effects [16]. The gross domestic product (GDP) provides an indicator of economic development. Most studies have focused on the effects of anthropogenic activities on water chemical parameters and trophic status [17,18]. Furthermore, the number of studies linking socioeconomic metrics to water quality are limited due to administrative units not holding jurisdiction over entire watersheds in most cases [1]. Alternatively, some extreme weather events, such as floods and heavy rainfall, may also strongly influence water quality. The immediate and short-term effects of floods and heavy rainfall on water quality are usually associated with elevated turbidity, total suspended matter and nutrient matter by inputting a large amount of domestic, industrial, and agricultural effluents into the lake [19,20,21,22]. However, little attention has been given to the effects of the relationship between anthropogenic activities and climate change on water clarity.
Therefore, the main objectives of this study are to (1) develop empirical remote sensing models to retrieve SDDs in Lake Liangzi based on Landsat ETM+ and OLI images, (2) document the temporal and spatial variations in SDDs from 2007 to 2016 using the proposed estimation models, and (3) understand the long-term changes in lake water SDDs driven by anthropogenic activities and climate change.
2. Materials and Methods
2.1. Study Area
Lake Liangzi (30°5′–30°18′N, 114°21′–114°39′E), which has a water surface area of 362.5 km2, a catchment area of 3260 km2, a mean water depth of 3.0 m, and a water volume of 12.65 × 10⁸ m3, is the largest shallow lake in Hubei Province, historically, China. Lake Liangzi is a macrophyte-dominated lake in the middle and lower reaches of the Yangtze River but the macrophytes have degraded in the past few decades [23,24]. The mean water level of Lake Liangzi is 18.01 m. From 2007 to 2016, two major floods occurred in Lake Liangzi in 2010 and 2016. The maximum water levels of Lake Liangzi in 2010 and 2016 were 21.29 m and 21.49 m, respectively. Lake Liangzi is the backup potable water source of Wuhan. However, in recent years, some areas of Lake Liangzi have become lightly eutrophic [25].
2.2. Sampling Sites and Water Quality Parameters Measurements
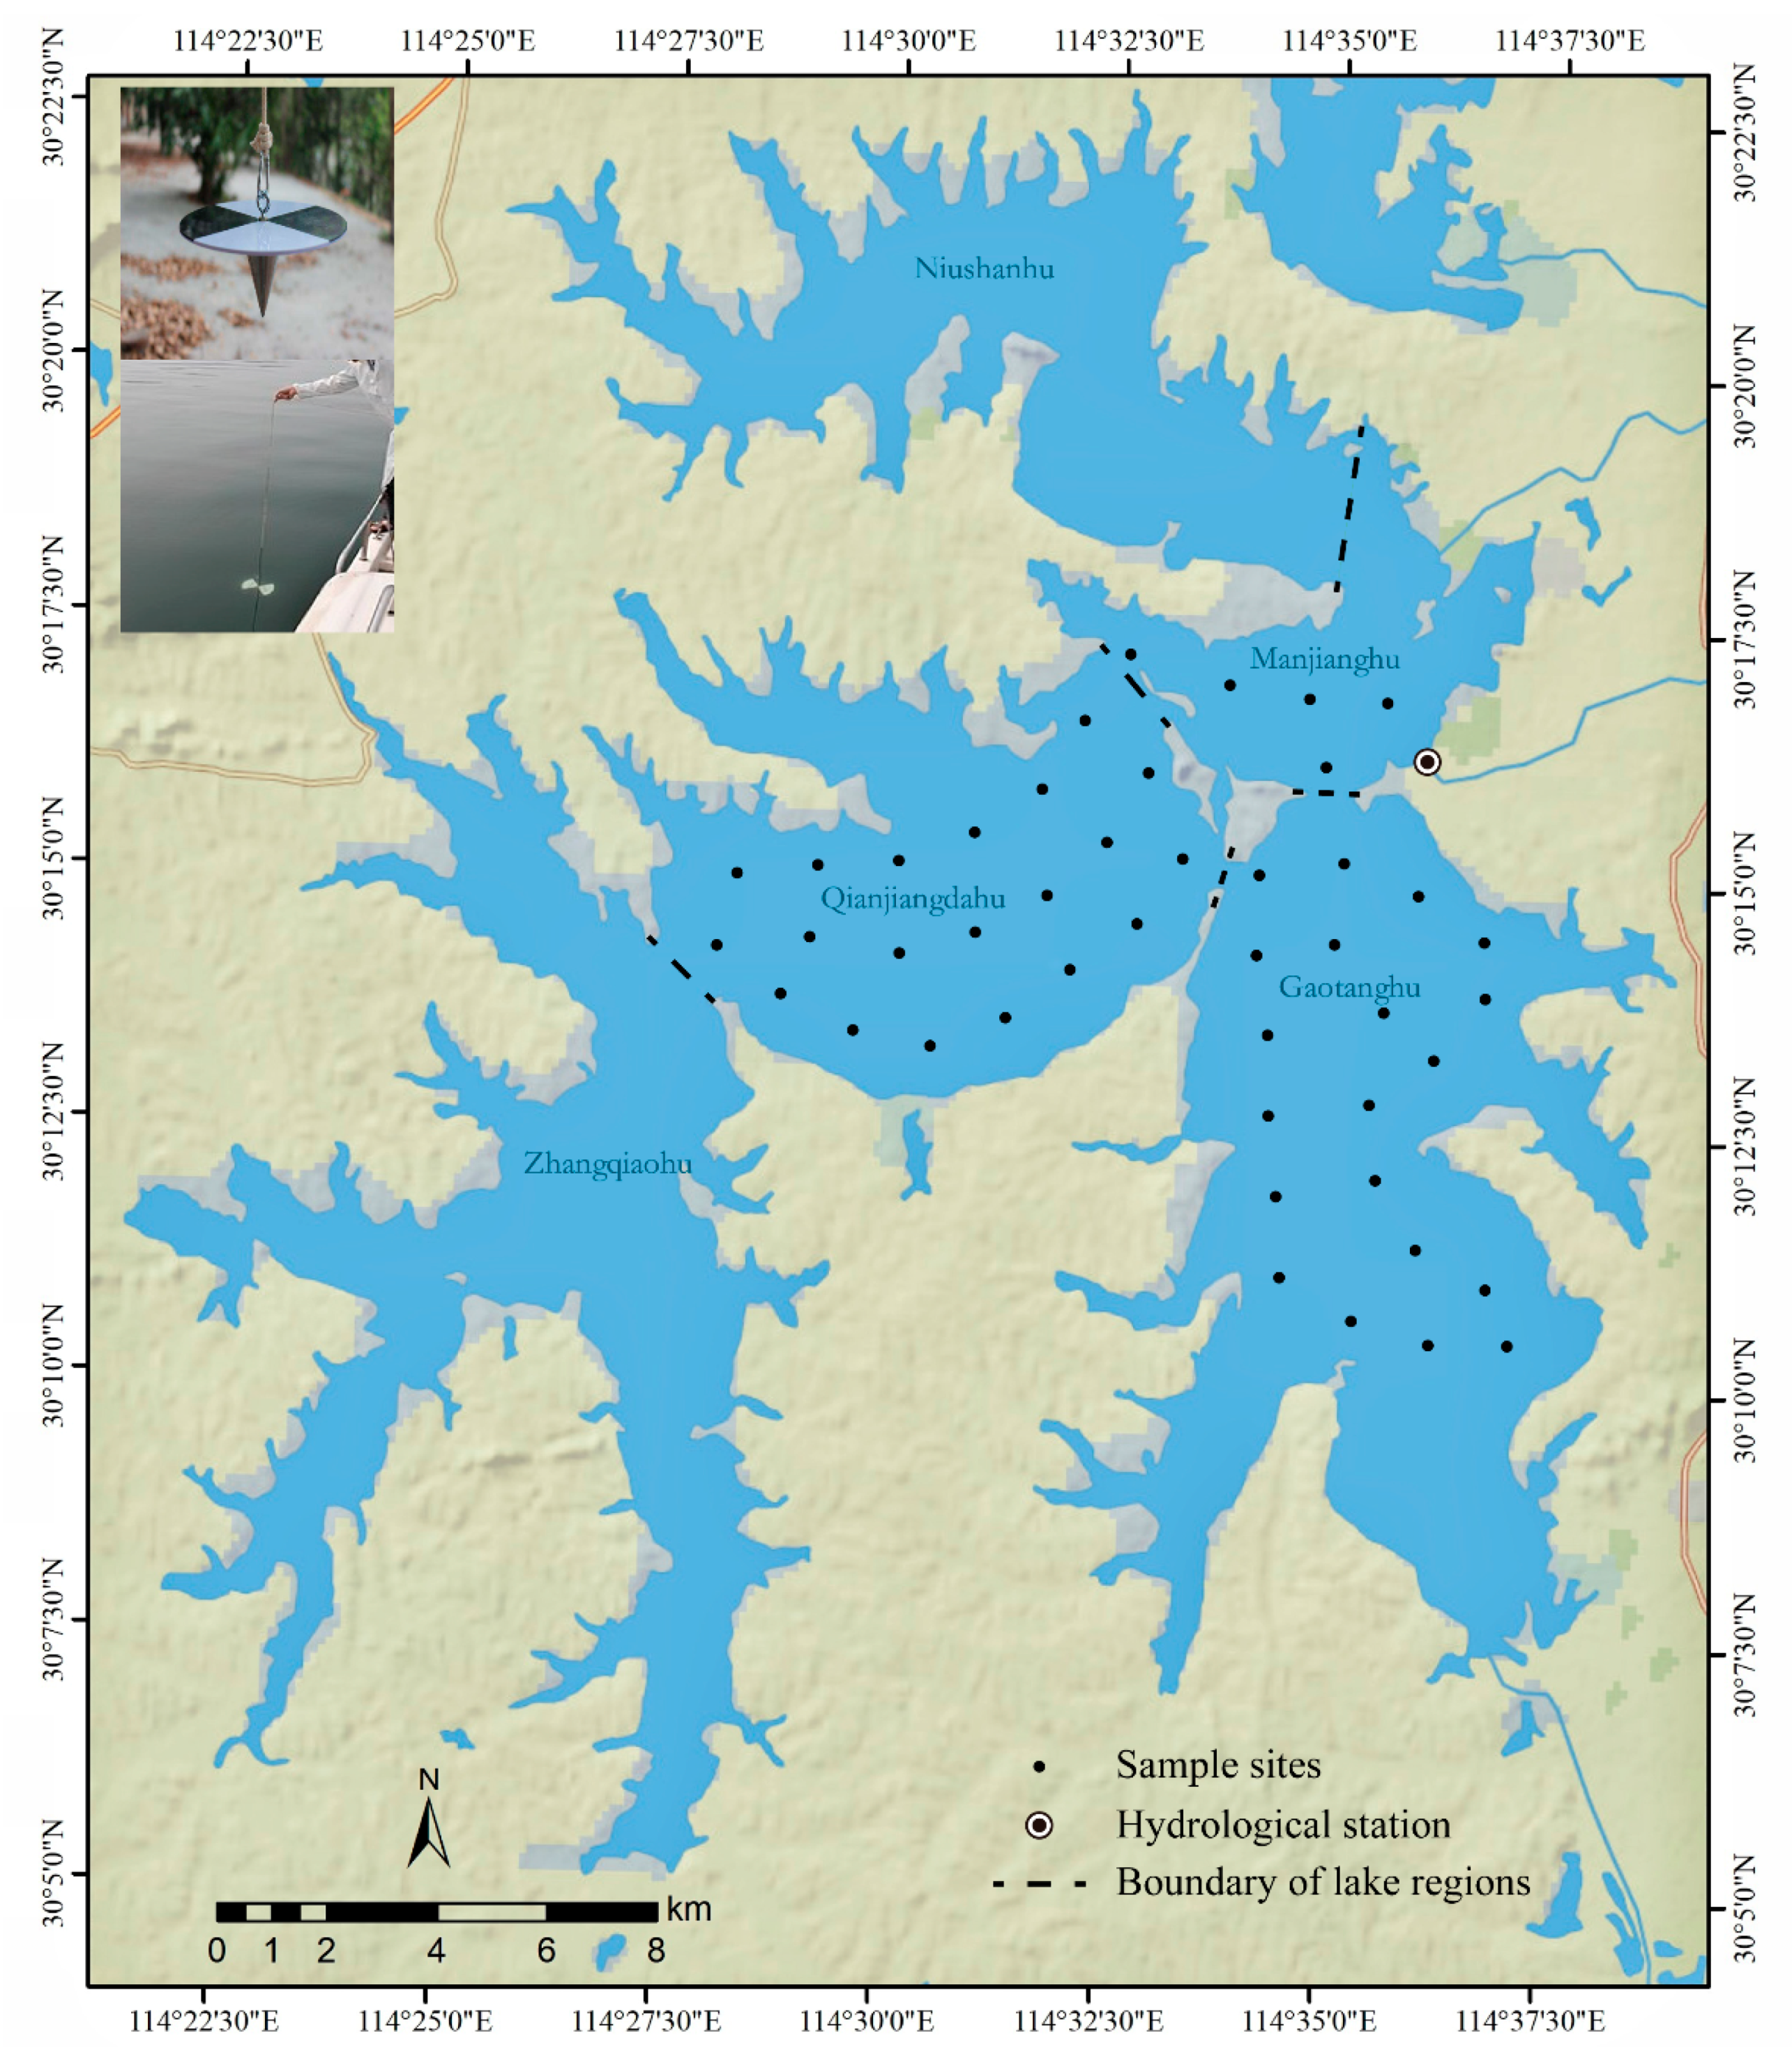
The in situ SDD observations were conducted monthly at predefined sites in Lake Liangzi in 2016. Forty-five sampling sites were distributed uniformly across Qianjiangdahu, Manjianghu, and Gaotanghu (Figure 1). The sampling vessel used could not reach the Zhangqiaohu and Niushanhu areas due to the steel cable enclosure between regions. Thus, there were no sampling sites in these two lake regions. For each season, 90 samples from every two surveys (Spring: April and May; Summer: July and August; Fall: September and November; Winter: January and February) that were close to the date of Landsat images were selected and then divided into two groups randomly. One group was used for calibration and the other for validation. A total of 180 samples (45 samples × 4 seasons) were used to develop the SDD remote estimate model and another 180 samples (45 samples × 4 seasons) were used for model validation. A standard 20 cm diameter Secchi disk was used to measure the SDD. The Secchi disk is a circular black and white disk that is placed by an observer into a water column until it disappears from view. When the disk is no longer visible, the depth is recorded as the SDD (Figure 1).
2.3. Satellite Data Acquisition and Process
For the shape and size of Lake Liangzi, Landsat series imagery is suitable for estimating water quality because of its 30 m spatial resolution [26]. A total of forty cloud-free Landsat Level 1T images (24 Landsat ETM+ and 16 Landsat OLI images) from 2007 to 2016 were downloaded from the Geospatial Data Cloud (http://www.gscloud.cn). First, Landsat ETM+ and OLI data were rescaled to top of the atmosphere (TOA) radiance values using the radiometric calibration coefficients in the metadata file (MTL file) via the ENVI 5.3 software (Boulder, CO, USA). The MODTRAN4 radiation transfer code which is incorporated in the FLAASH module has been widely used in inland water bodies [27,28,29]. Thus, the atmospheric correction in this study was based on the MODTRAN4 radiation transfer calculations from the FLAASH module.
2.4. Water Level, Rainfall, Air Temperature, Population, and GDP Data
The daily water level of Lake Liangzi was collected from of the hydrological station of Liangzi (Figure 1), which belongs to the Hubei Provincial Department of Water Resources (http://219.140.162.169:8800/rw4/report/fa07.asp). The water level data were collected from January 1, 2007 to December 31, 2016. The rainfall and air temperature data from three meteorological stations near Lake Liangzi, including Jiayu (29.55°N, 113.58°E), Jiangxia (30.21°N, 114.2°E), and Huangshi (30.14°N, 115.02°E), were collected from 1957 to 2016. These data can be downloaded from the China Meteorological Data Sharing Service System (http://cdc.nmic.cn). The population and GDP of the Lake Liangzi basin from 2007 to 2016 were collected from Hubei Statistics Bureau (http://www.stats-hb.gov.cn/info/iIndex.jsp?cat_id=10055).
2.5. Statistical Analysis and Accuracy Assessment
Previous studies showed that the log-transformed water quality parameter relationship to Landsat images would be better than the relationships between the original data [30,31]. Thus, the SDD data were log-transformed to obtain stronger corrections to the Landsat data in this study. The Pearson correlation between the log-transformed in situ water clarity data and band reflectance of Landsat ETM+ and OLI was conducted to determine which spectral band, or band ratio, was most suitable for predicting the SDD. Levels are reported as significant if p < 0.05. Then, simple and multiple regression models were constructed to develop the best prediction algorithms. The root mean square error (RMSE) between the in situ and estimated values was used to assess the accuracy of the algorithms. The RMSE was calculated with the following equation:
where n represents the number of samples, and Xobs and Xmodel represent the in situ observed and estimated values, respectively. All data analyses were conducted using SPSS 19.0 (SPSS Incorporated, Illinois, USA). To assess variation trends in the water SDD in Lake Liangzi, we conducted a Mann–Kendall test using Kendall.exe (which can be downloaded from http://pubs.usgs.gov/sir/2005/5275/downloads/).
3. Results
3.1. In Situ SDD Characteristics
Table 1 summarizes the characteristics of in situ SDD of Lake Liangzi for calibration and validation across each season in 2016. The SDD dataset for calibration ranged from 0.25 to 1.10 m, with a mean (± standard deviation) of 0.63 ± 0.16 m, and the dataset for validation ranged from 0.25 to 1.15 m, with a mean of 0.64 ± 0.10 m in the aggregated dataset (Table 1).
3.2. Algorithm Development and Validation
The results of the Pearson correlation coefficients showed negative correlations between the log-transformed SDD and preprocessed Landsat spectral bands. The blue band, near-infrared (NIR) band and the ratio of the NIR to the blue band in the Landsat images showed a strong negative association with the SDD (R = −0.815, −0.855, and −0.925, respectively).
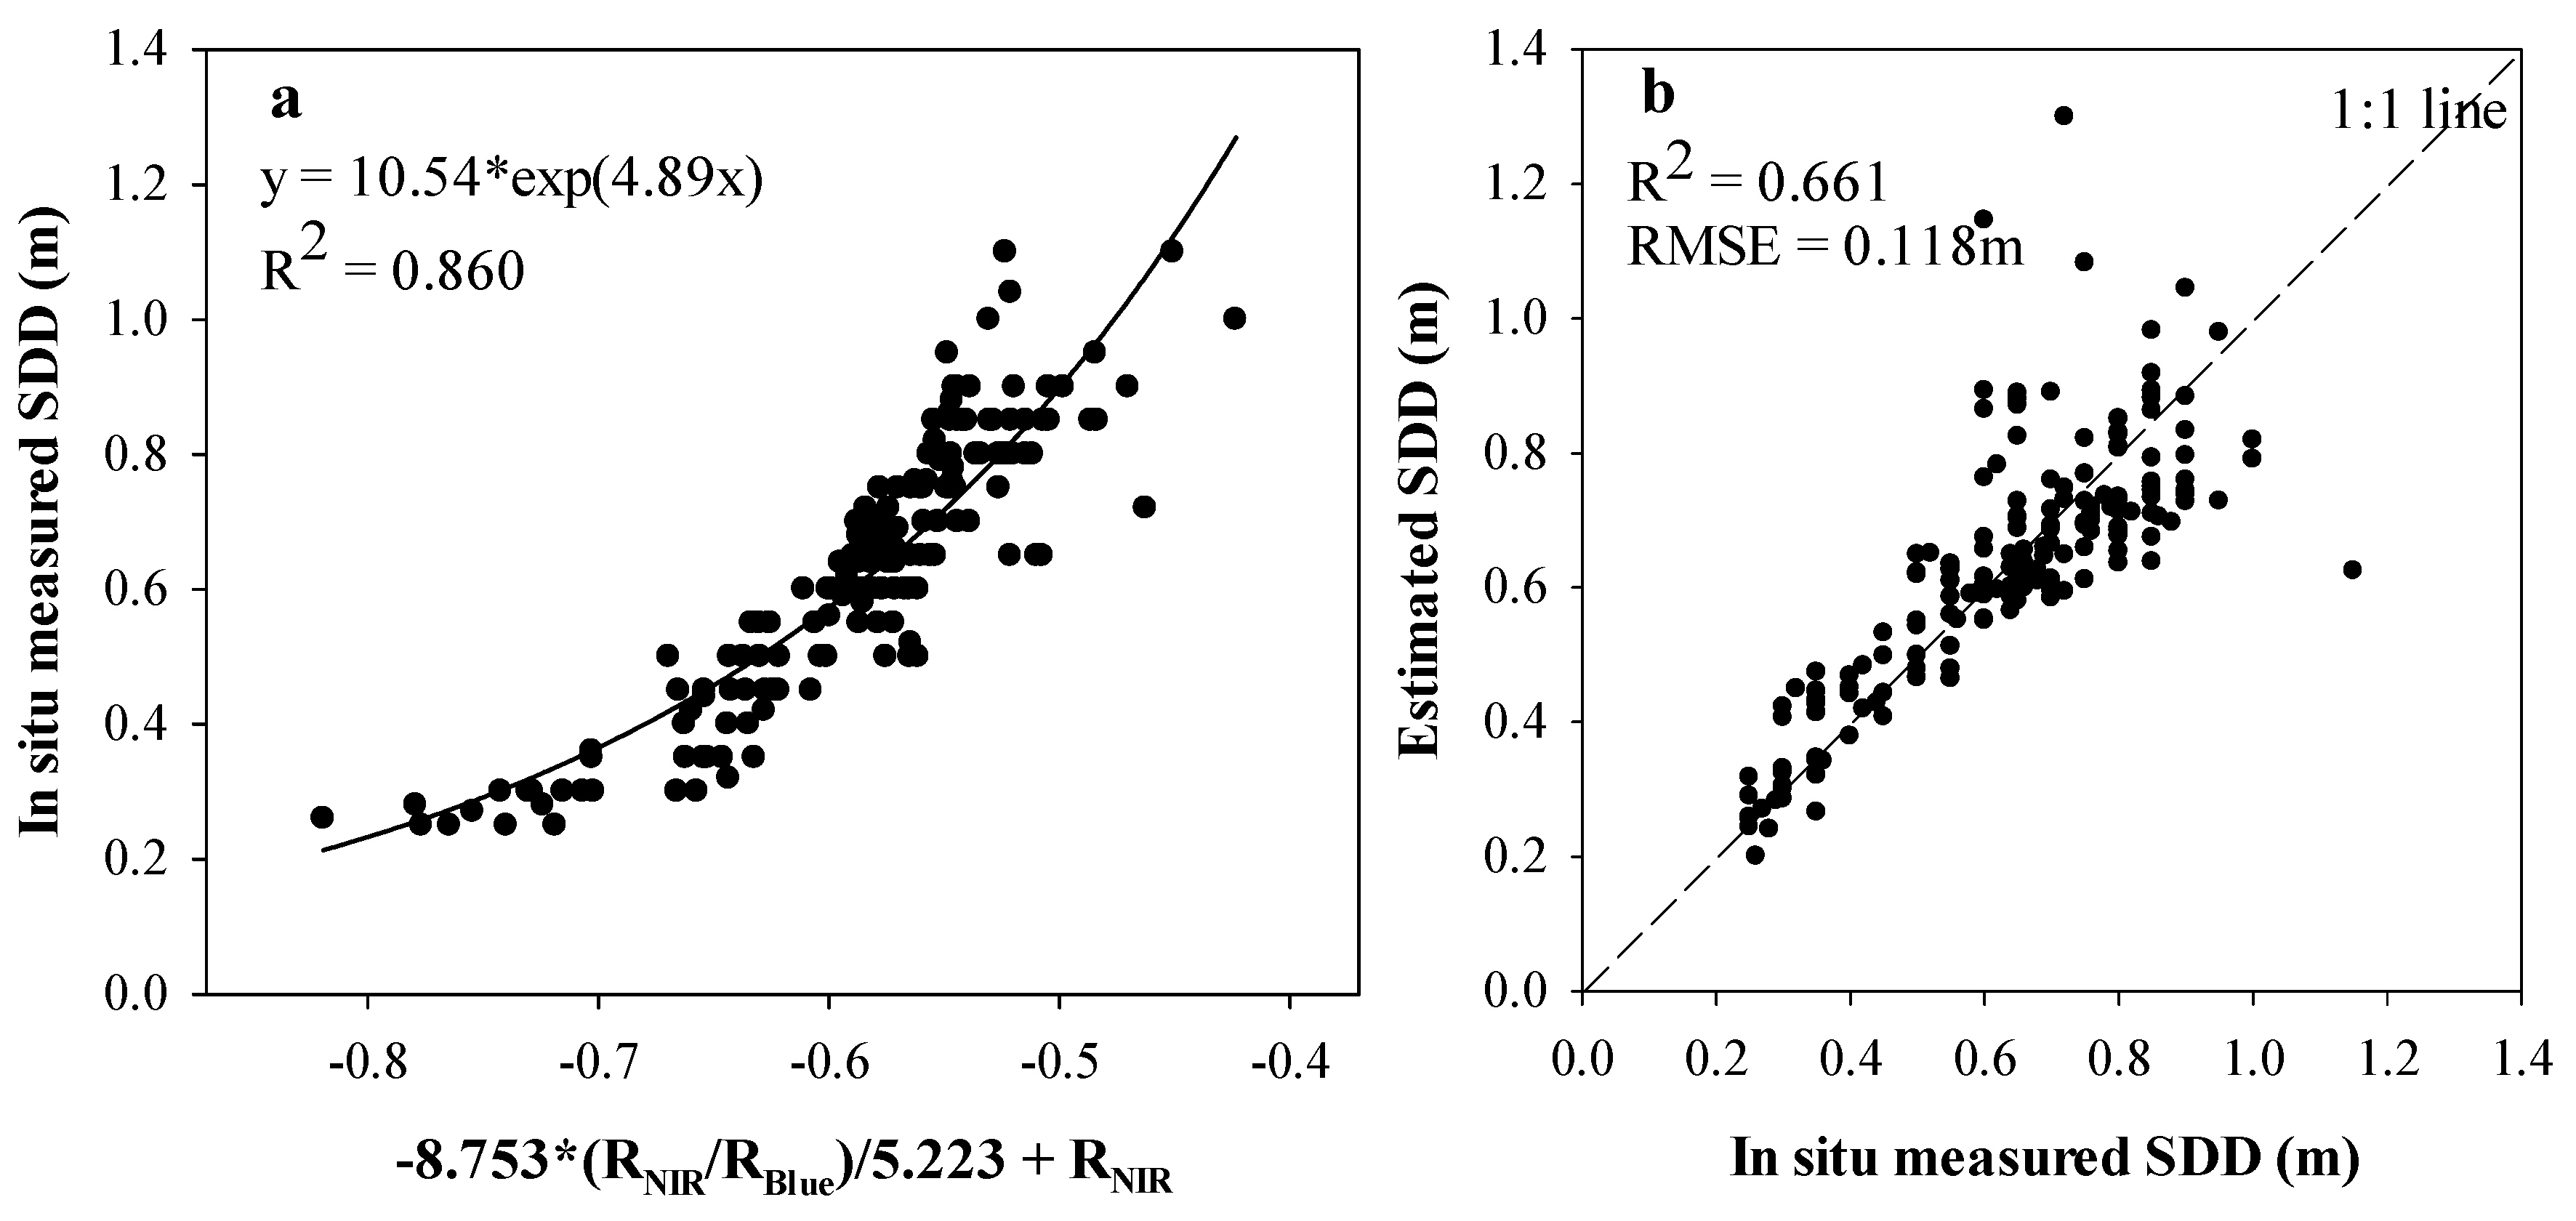
To develop the predictive SDD algorithm, we constructed empirical models using simple and multiple linear regression models relating log-transformed in situ data and reflectance values of selected bands and band ratios (Table 2). The multivariate linear regression model with reflectance of NIR band and ratio of the NIR to blue bands showed the highest coefficient of determination (R2 = 0.860) for predicting ln(SDD) (Table 2, Figure 2).
To assess the performance of the selected SDD estimation models, regressions between the Landsat estimated SDD and independent in situ measured SDD were conducted. The estimated SDD retrieved by the selected algorithms showed a highly significant linear correlation with the in situ measured SDD (R2 = 0.661) (Figure 2). In addition, the in situ measured and estimated data were distributed along the 1:1 line demonstrating the consistency (Figure 2). The RMSE of the validation results between the measured and retrieved SDDs were 0.118 m (Figure 2). The results of validation indicate that the selected models can be used to retrieve SDD.
3.3. Variations in SDD
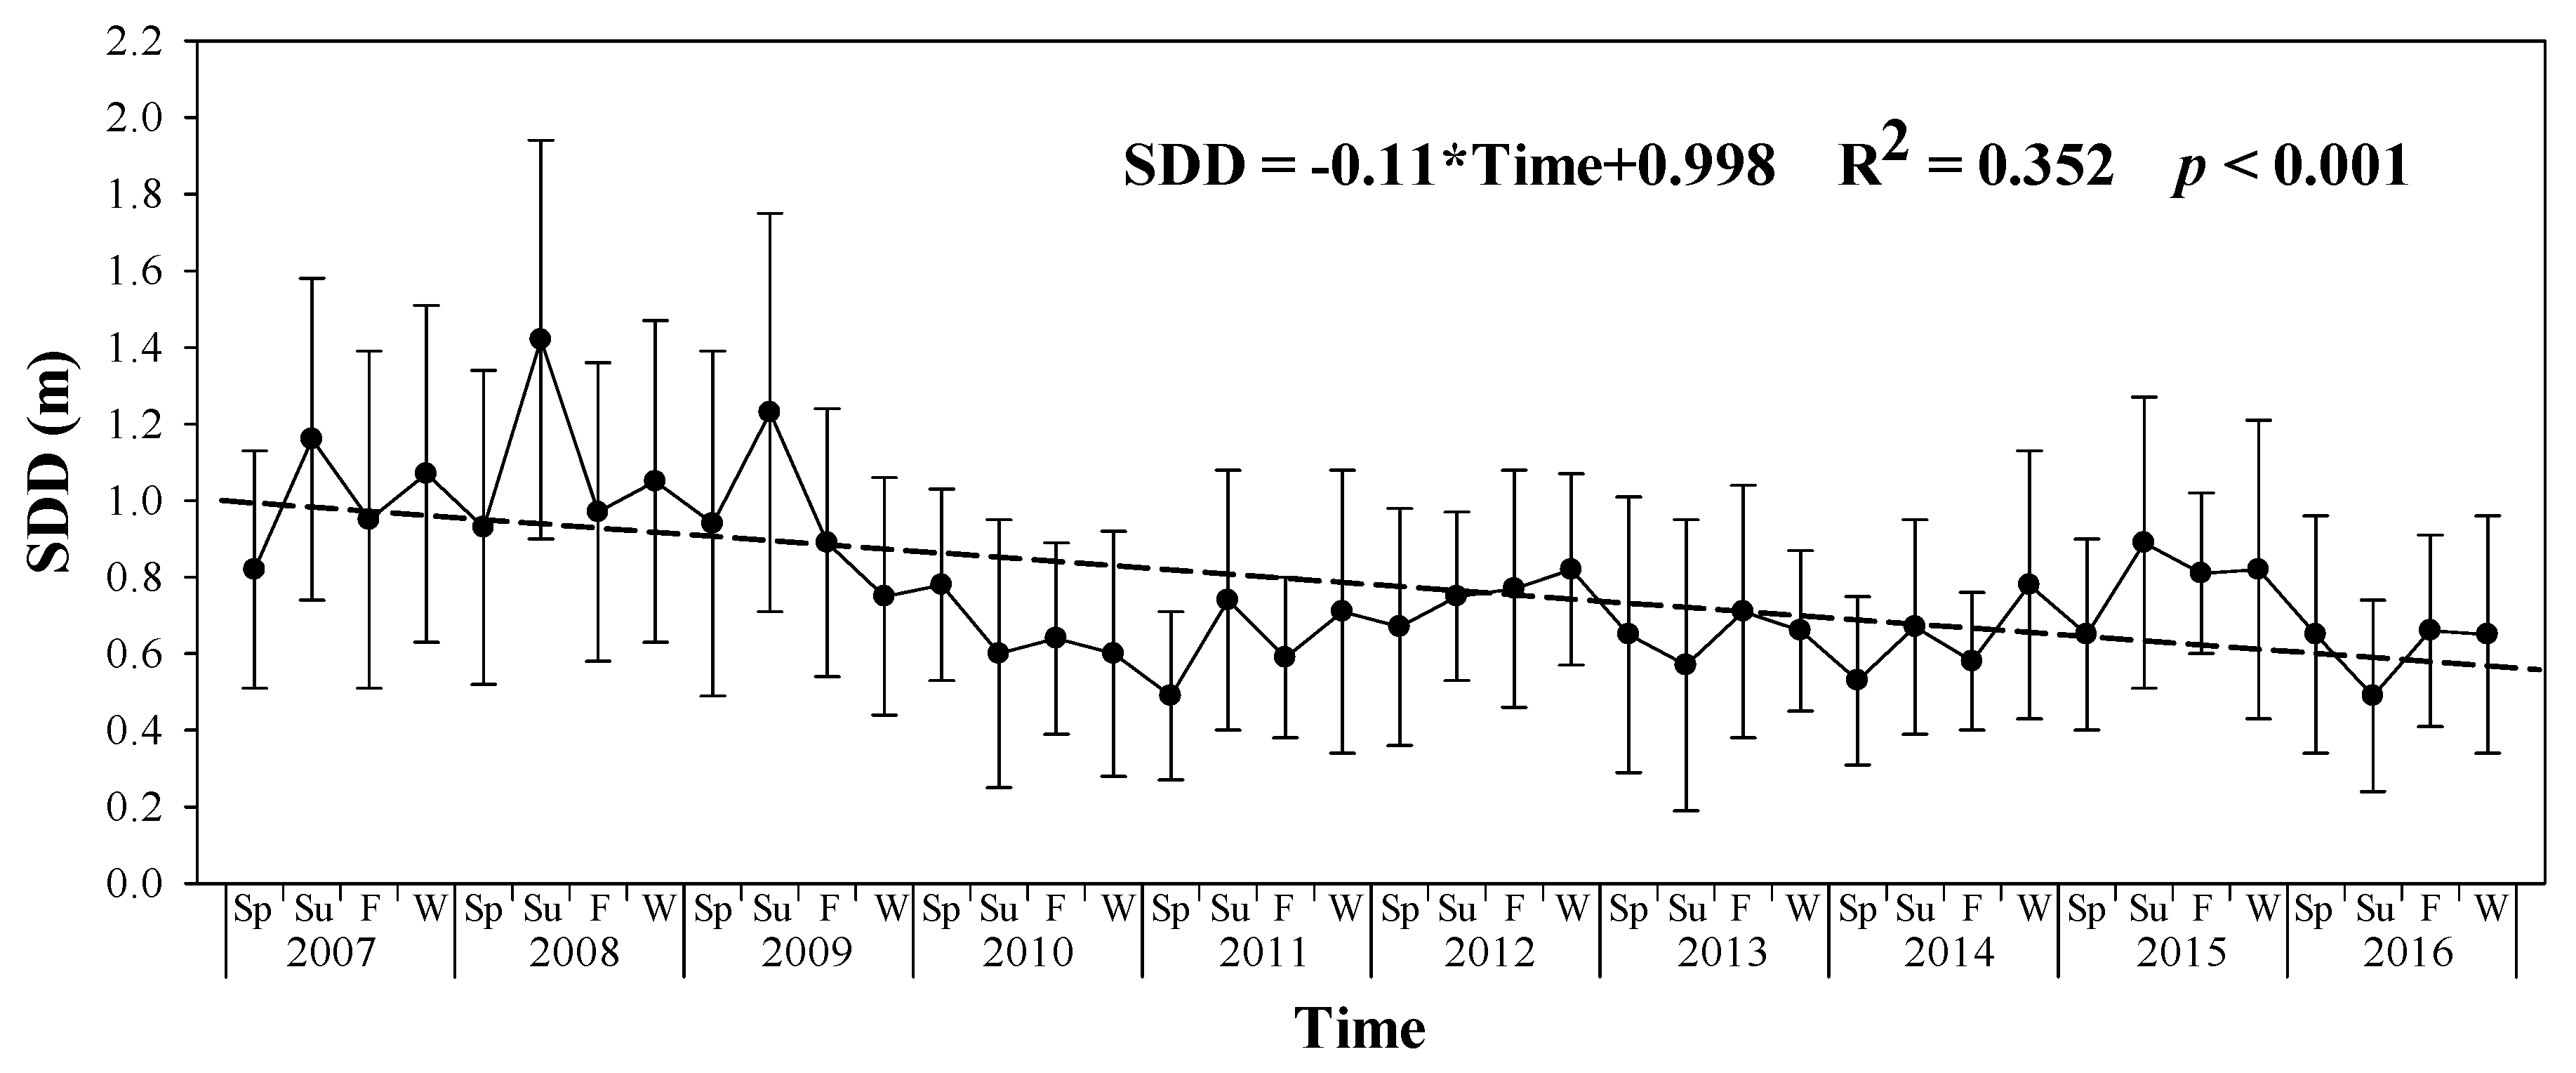
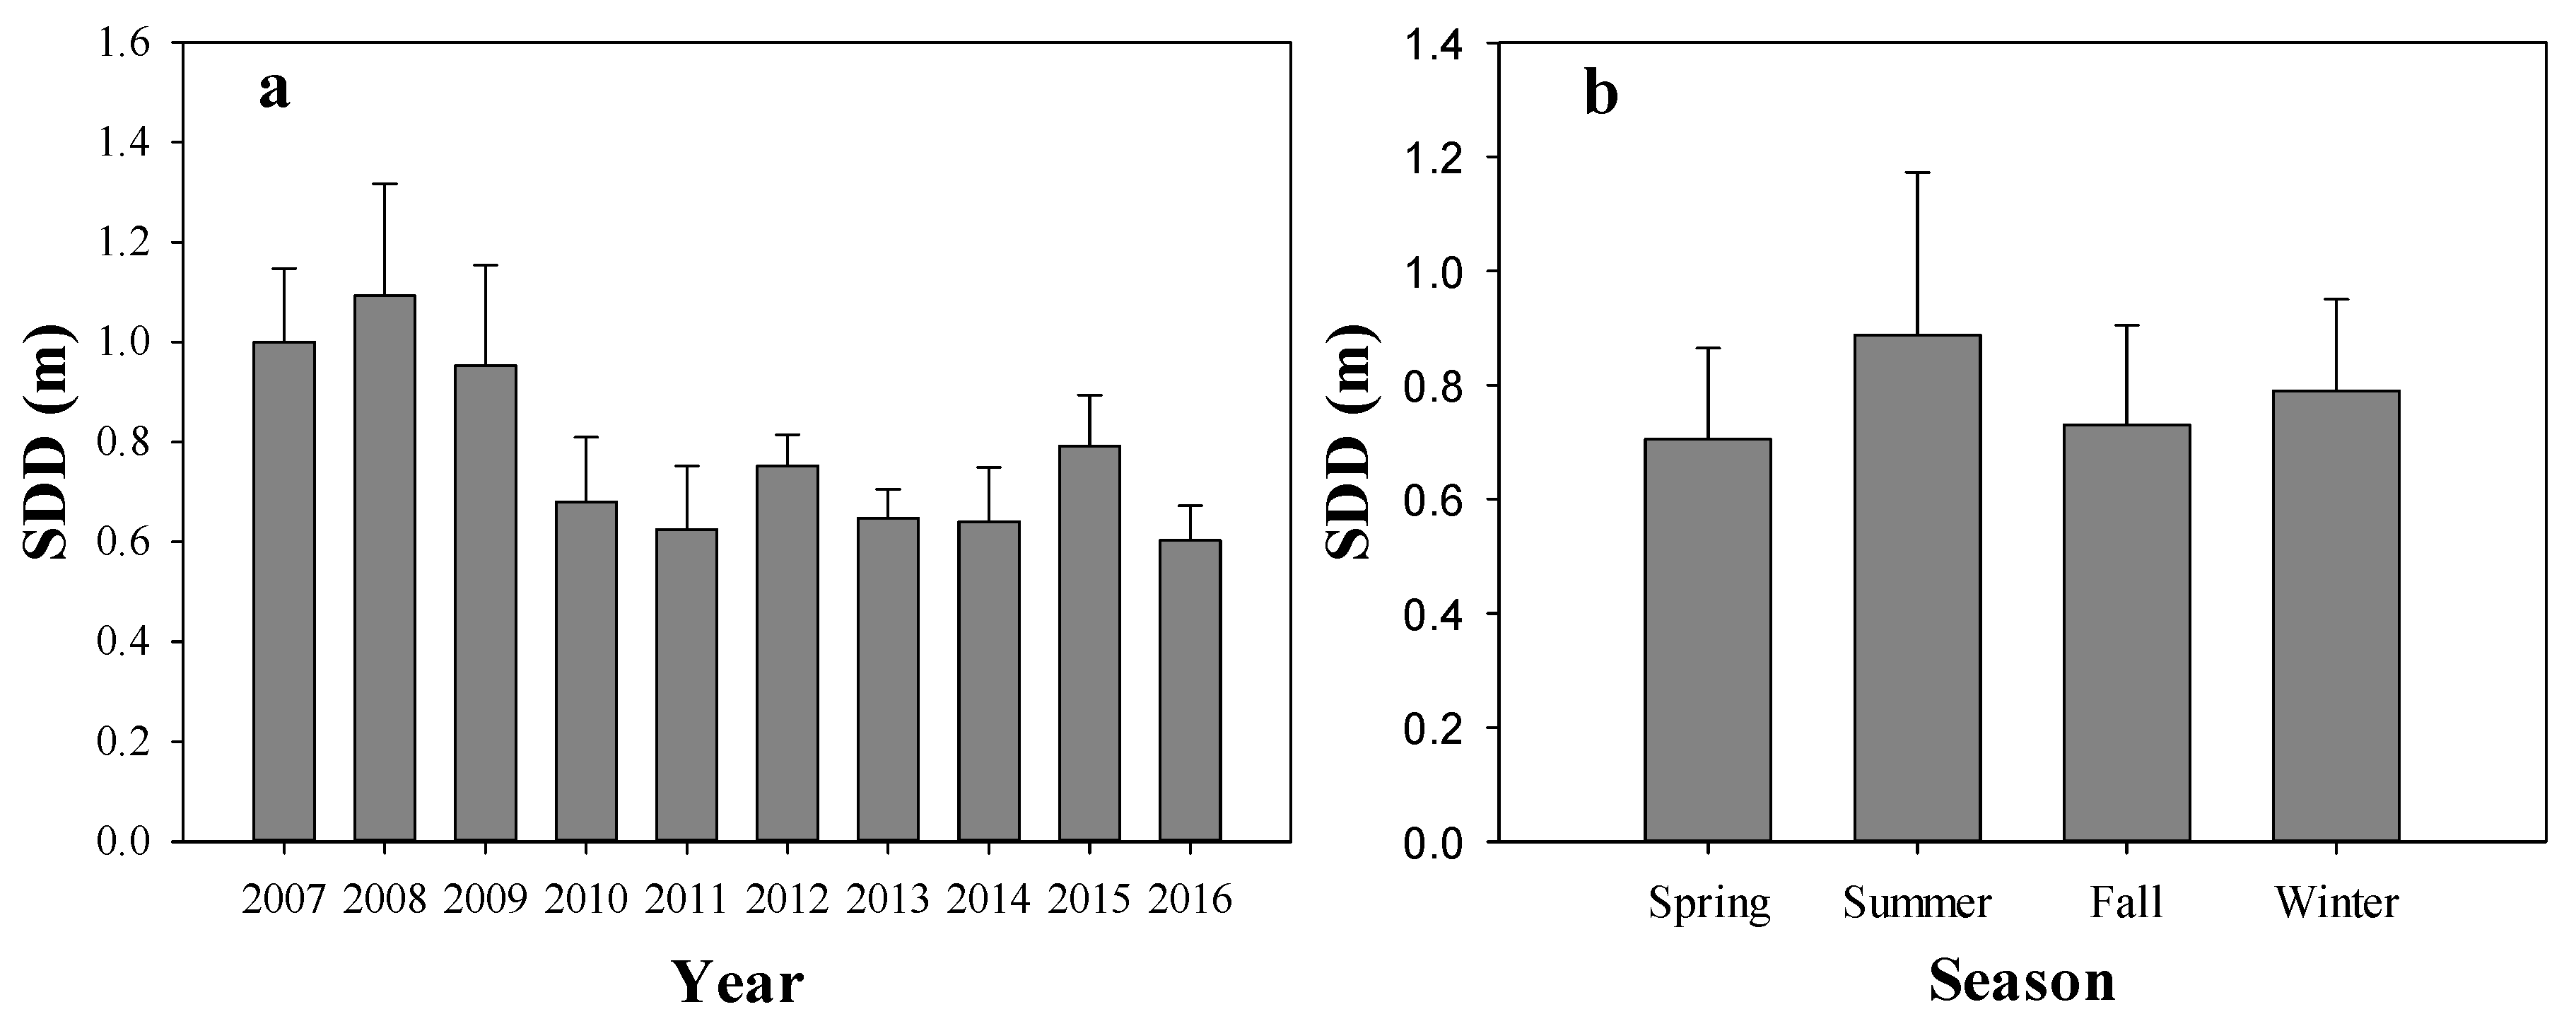
The developed SDD estimated algorithms were applied to forty Landsat ETM+ and OLI images to retrieve SDD values in Lake Liangzi from 2007 to 2016. Then mean and standard deviation values of the SDD were extracted to explore variation trends. The results of the Mann–Kendall test indicated that the SDD in Lake Liangzi showed a significant declining trend during the study period (Z = −3.069, p = 0.002) (Table 3). The results of the linear regression indicated that the SDD in Lake Liangzi showed a significant declining trend from 2007 to 2016 (R2 = 0.352, p < 0.001) (Figure 3). The mean seasonal SDD was highest in summer, with a value of 0.89 m, and lowest was in spring, with a value of 0.71 m, during the study period (Figure 4). However, the SDD in Lake Liangzi did not present a significant seasonal variation (p = 0.201).
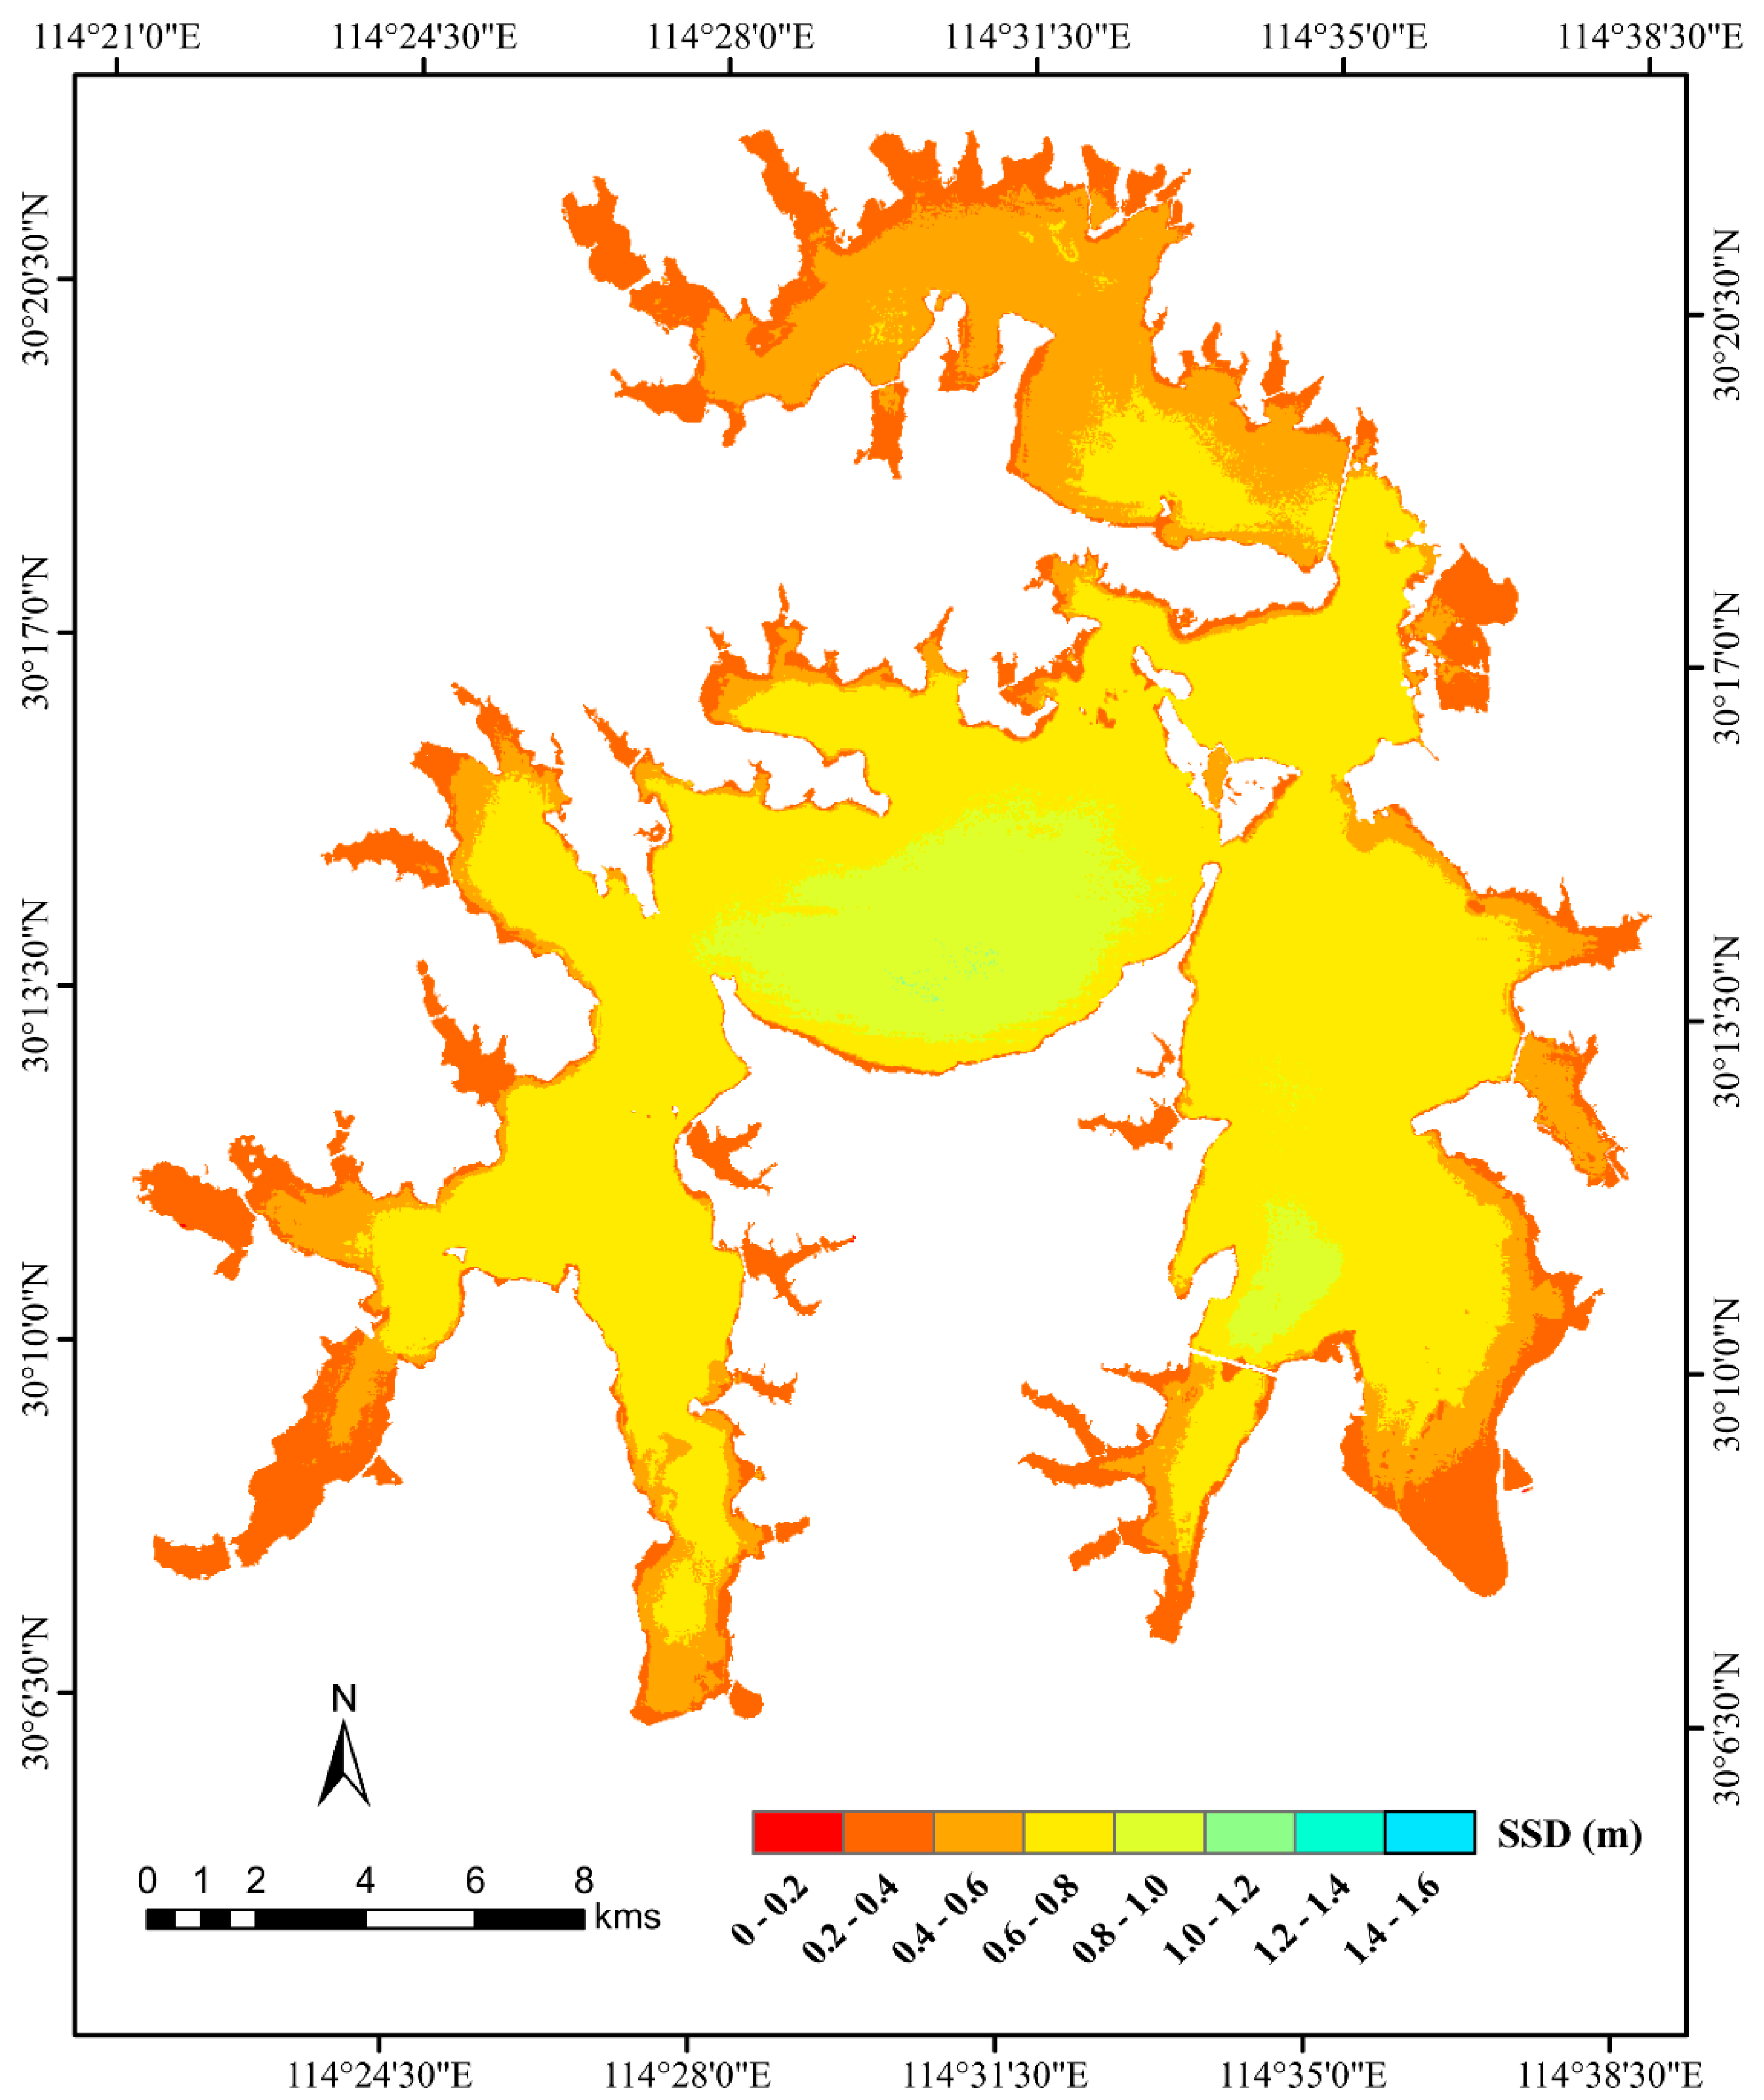
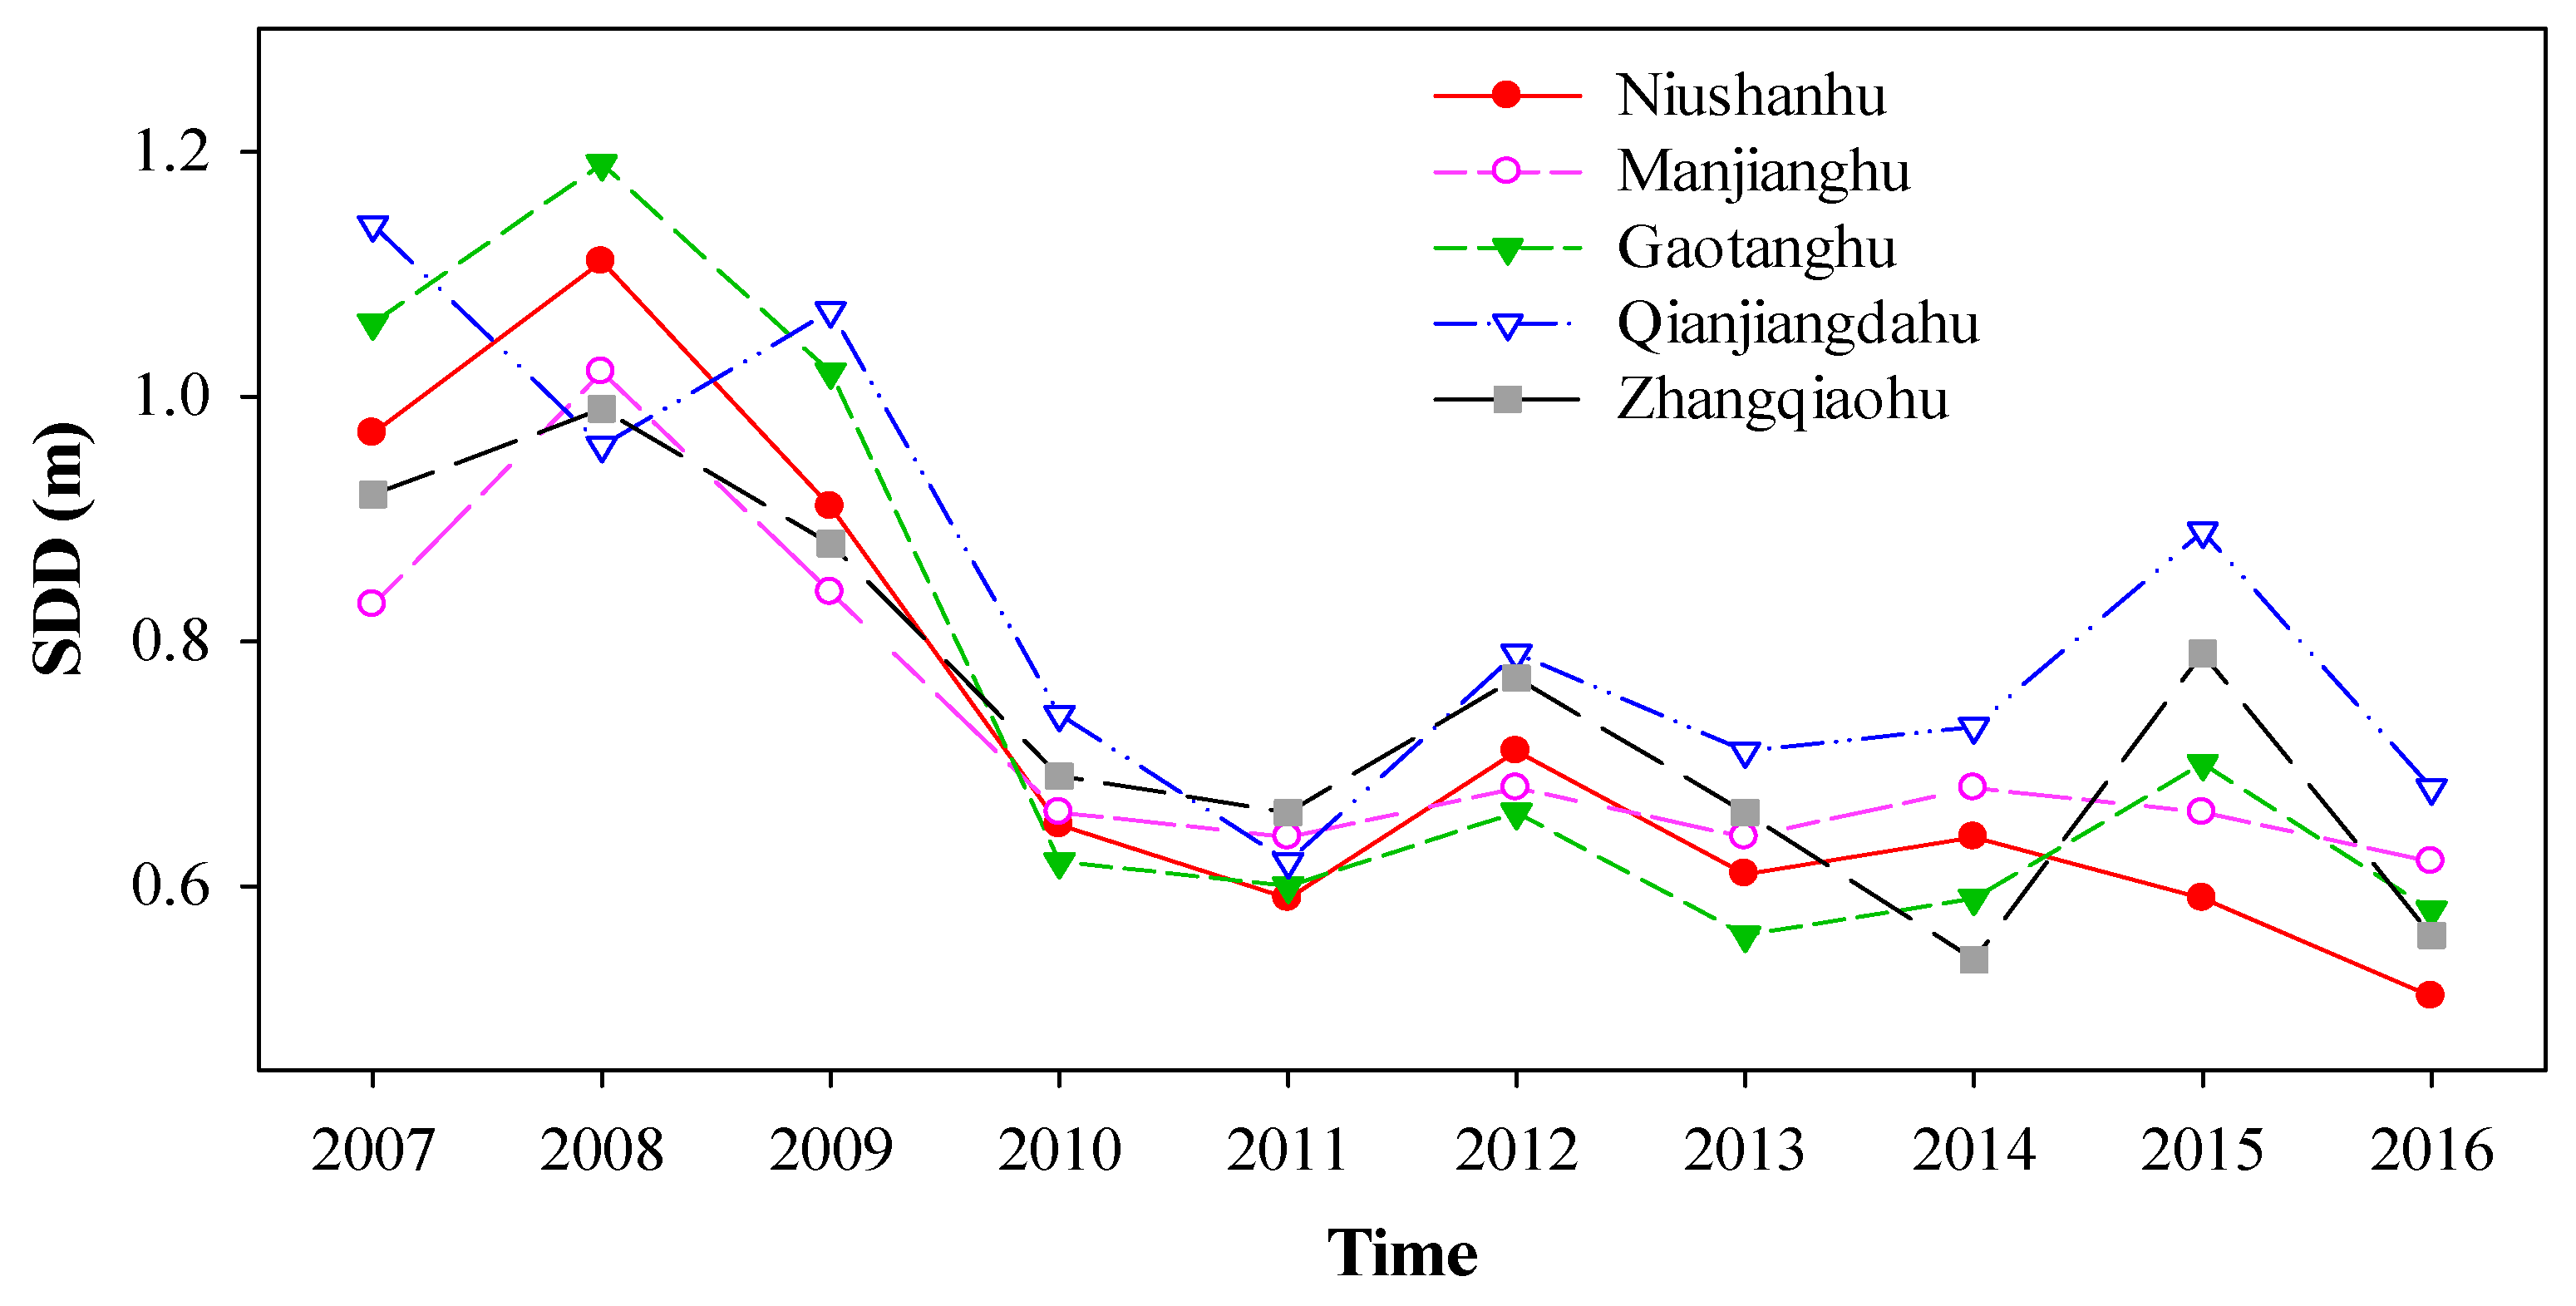
The SDD of small lake bays was lower than the center of lake (Figure 5). The SDD of Qianjiangdahu region was usually higher than other regions in Lake Liangzi (Figure 5 and Figure 6). The SDD of Niushanhu was usually lower than other regions (Figure 5 and Figure 6). The SDD of five lake regions experienced a declining trend the same as the whole lake (Table 3, Figure 6). Furthermore, the SDD of Gaotanghu and Niushanhu decreased much more and much faster than other regions (Figure 6).
3.4. Relationships of Water Clarity with Population and GDP
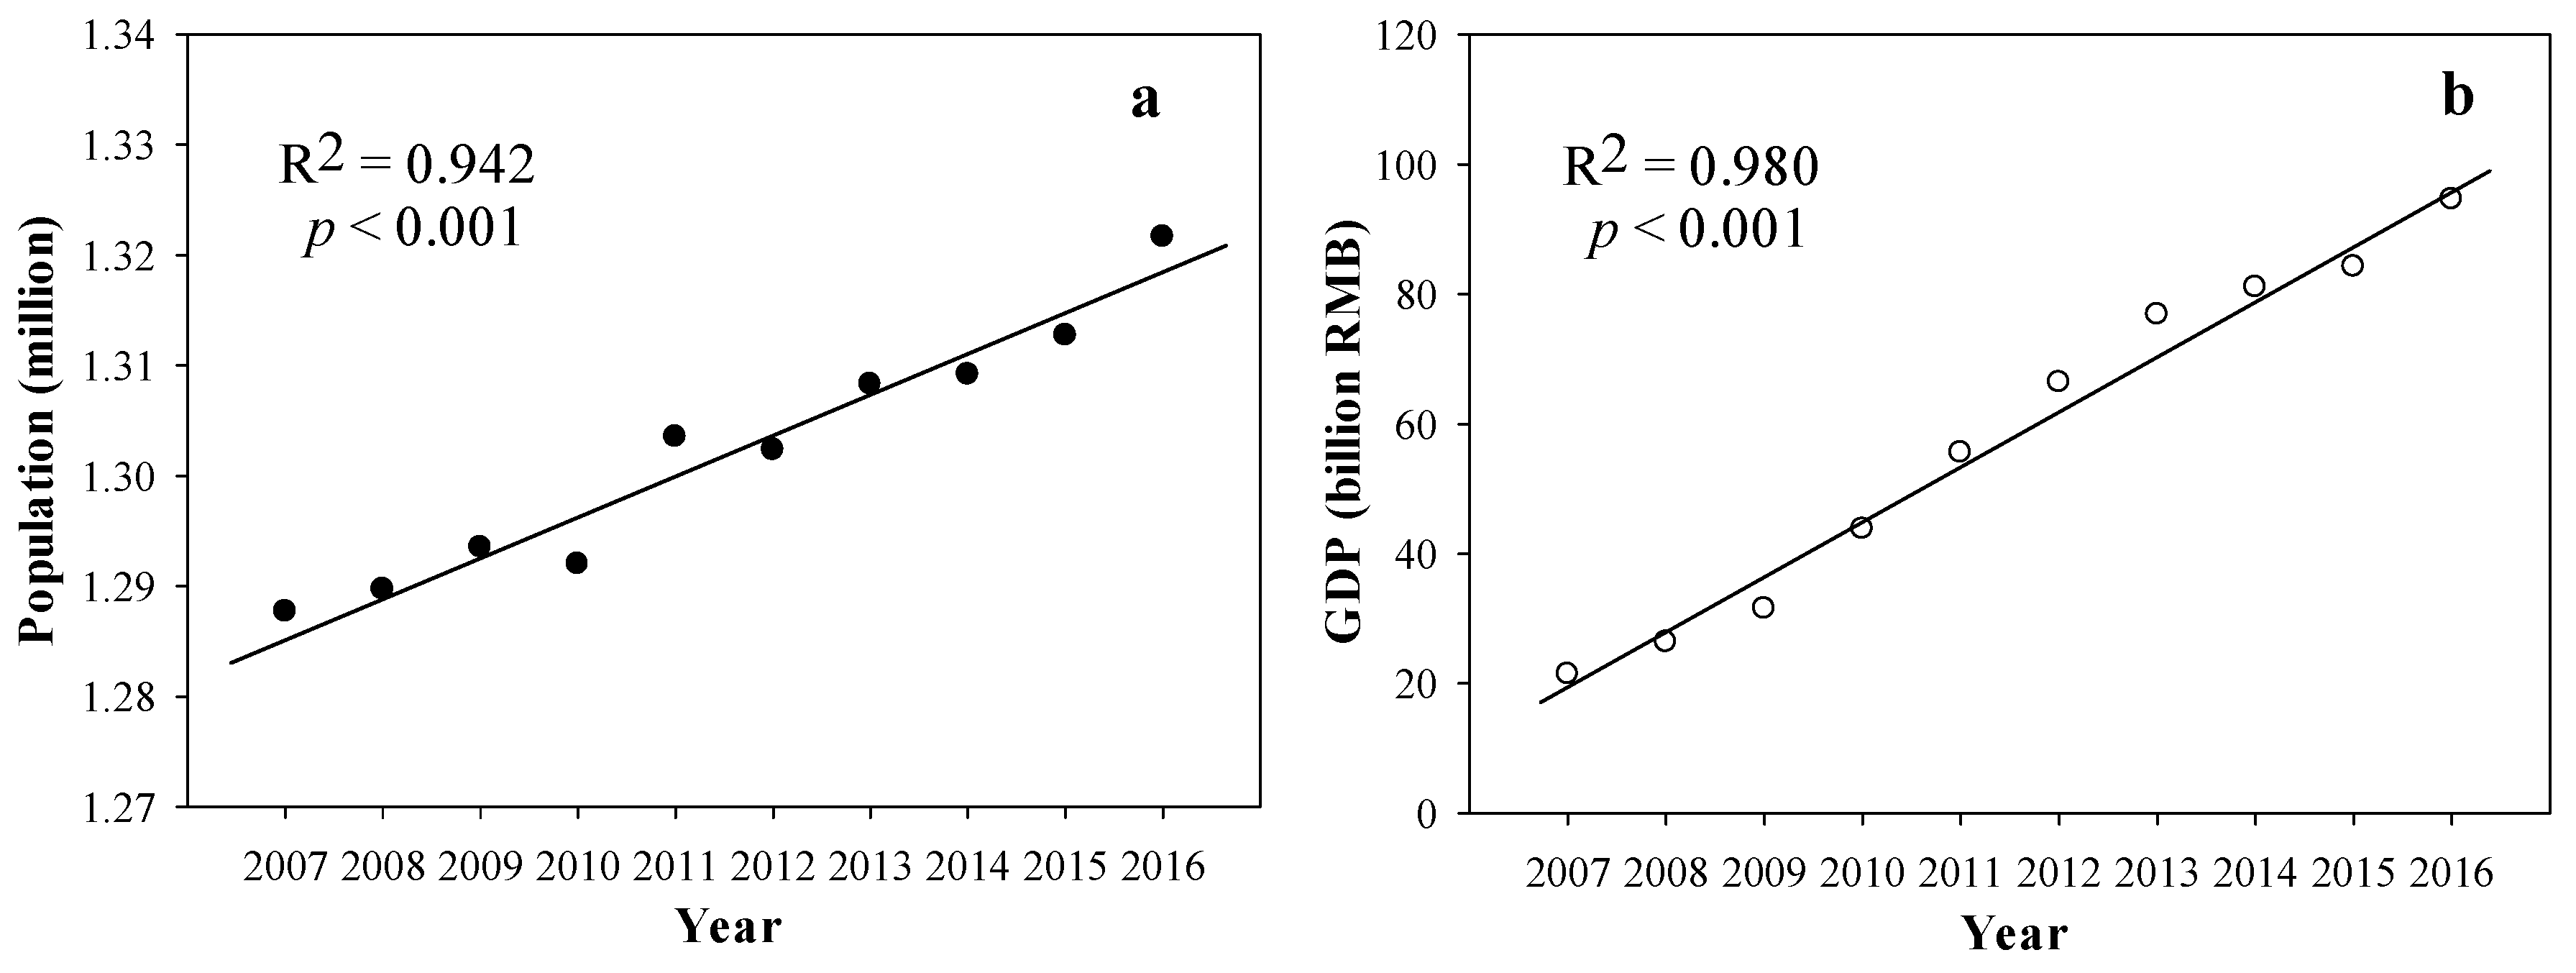
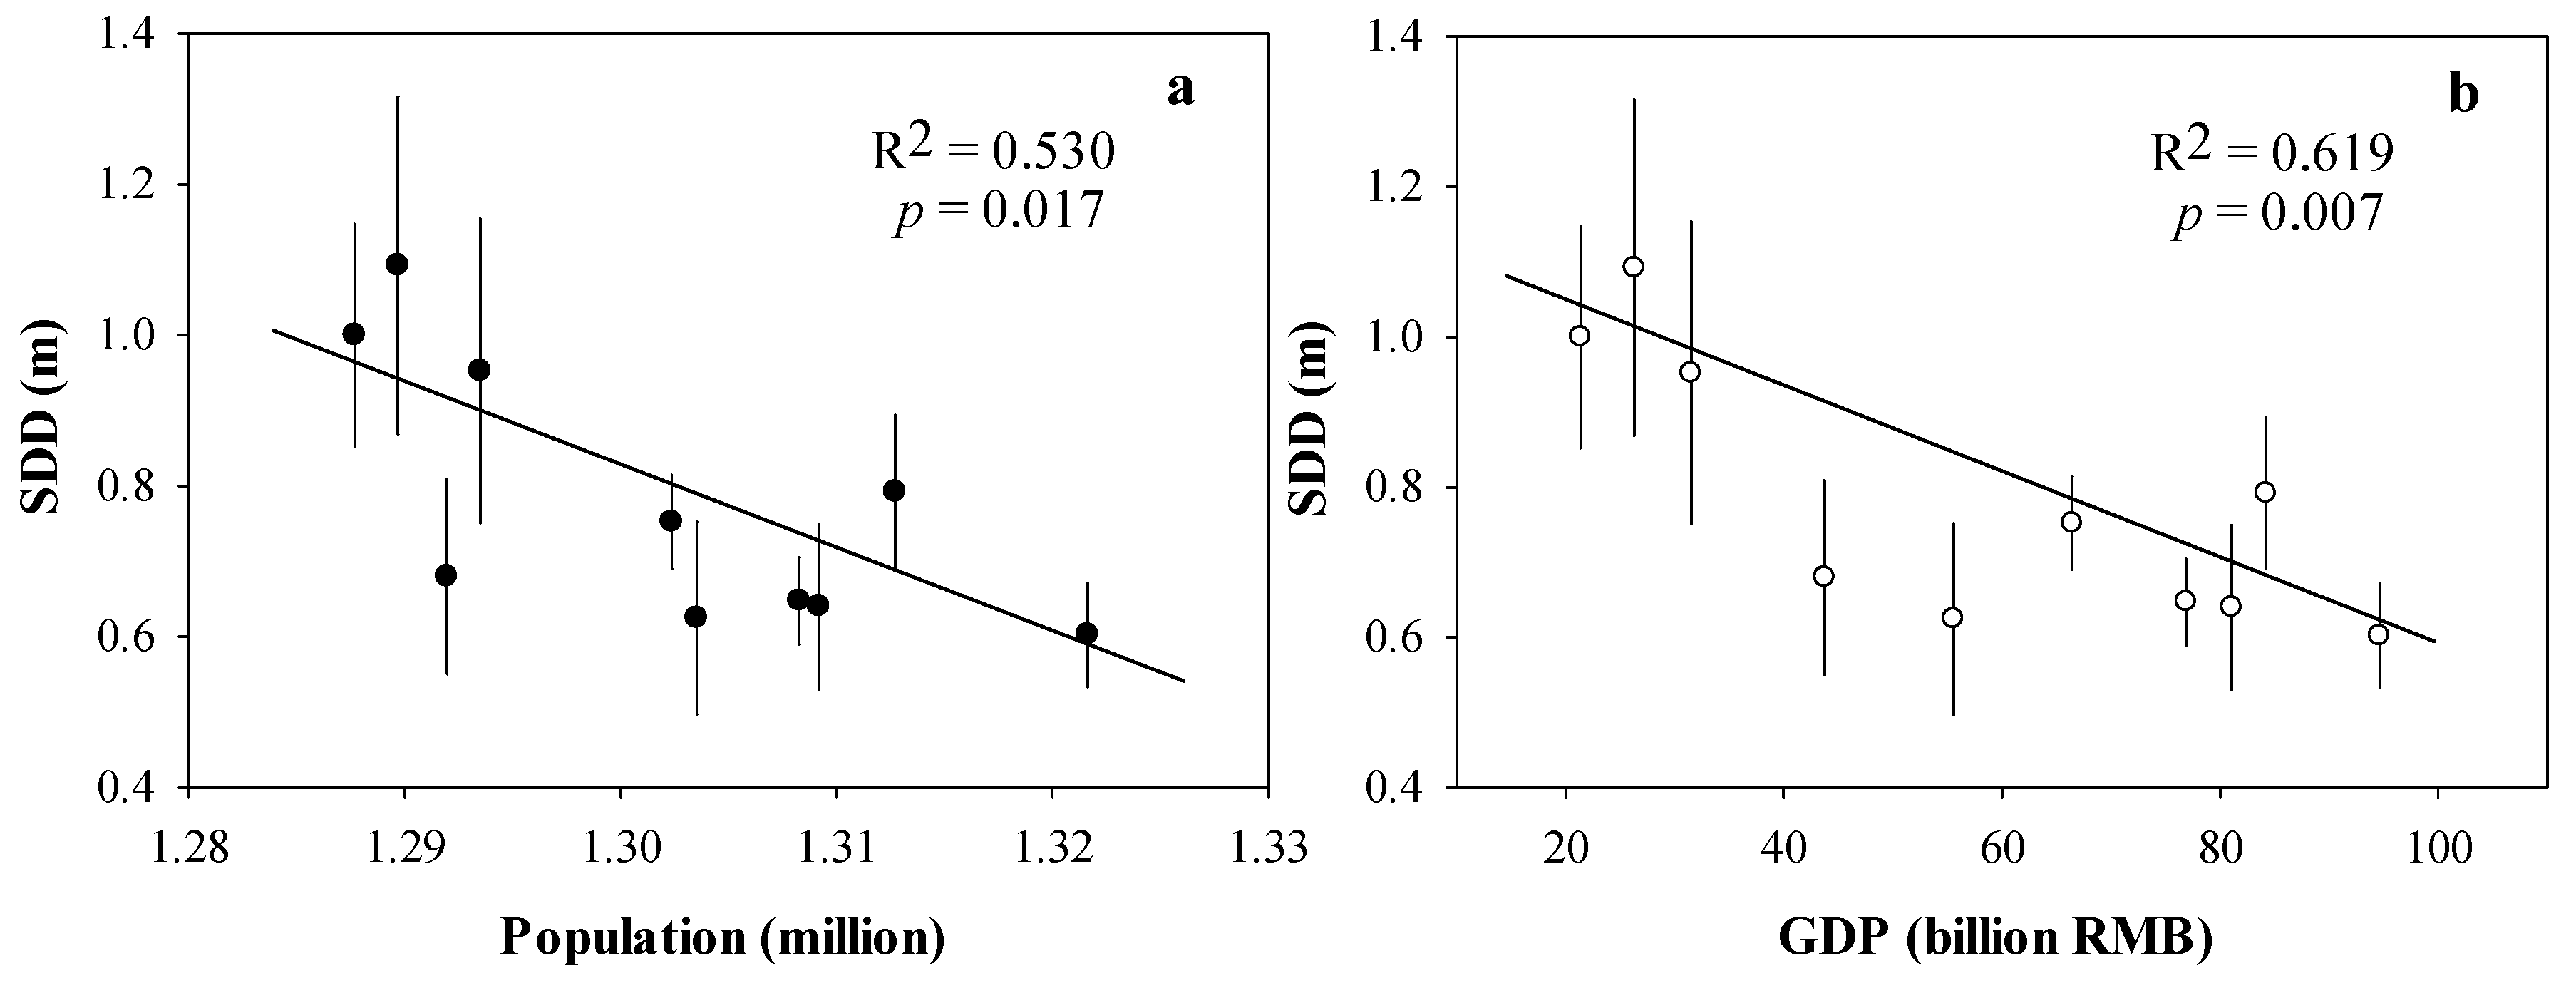
The population of the Lake Liangzi basin experienced a slow but significant growth from 1.288 million people in 2007 to 1.322 million people in 2016 (R2 = 0.942, p < 0.001; Figure 7a). The GDP of the Lake Liangzi basin showed significantly rapid growth from 21.38 billion yuan in 2007 to 94.60 billion yuan in 2016 (R2 = 0.980, p < 0.001; Figure 7b). To evaluate the relationship between the SDD and anthropogenic activities, linear regressions of the SDD with population and GDP were conducted. Significant negative correlations were observed when comparing the annual mean SDD in Lake Liangzi with population (R2 = 0.530, p = 0.017 < 0.05; Figure 8a) and GDP (R2 = 0.619, p = 0.007 < 0.01; Figure 8b).
3.5. Relationships between Water Clarity and Air Temperature, Water Levels, and Rainfall
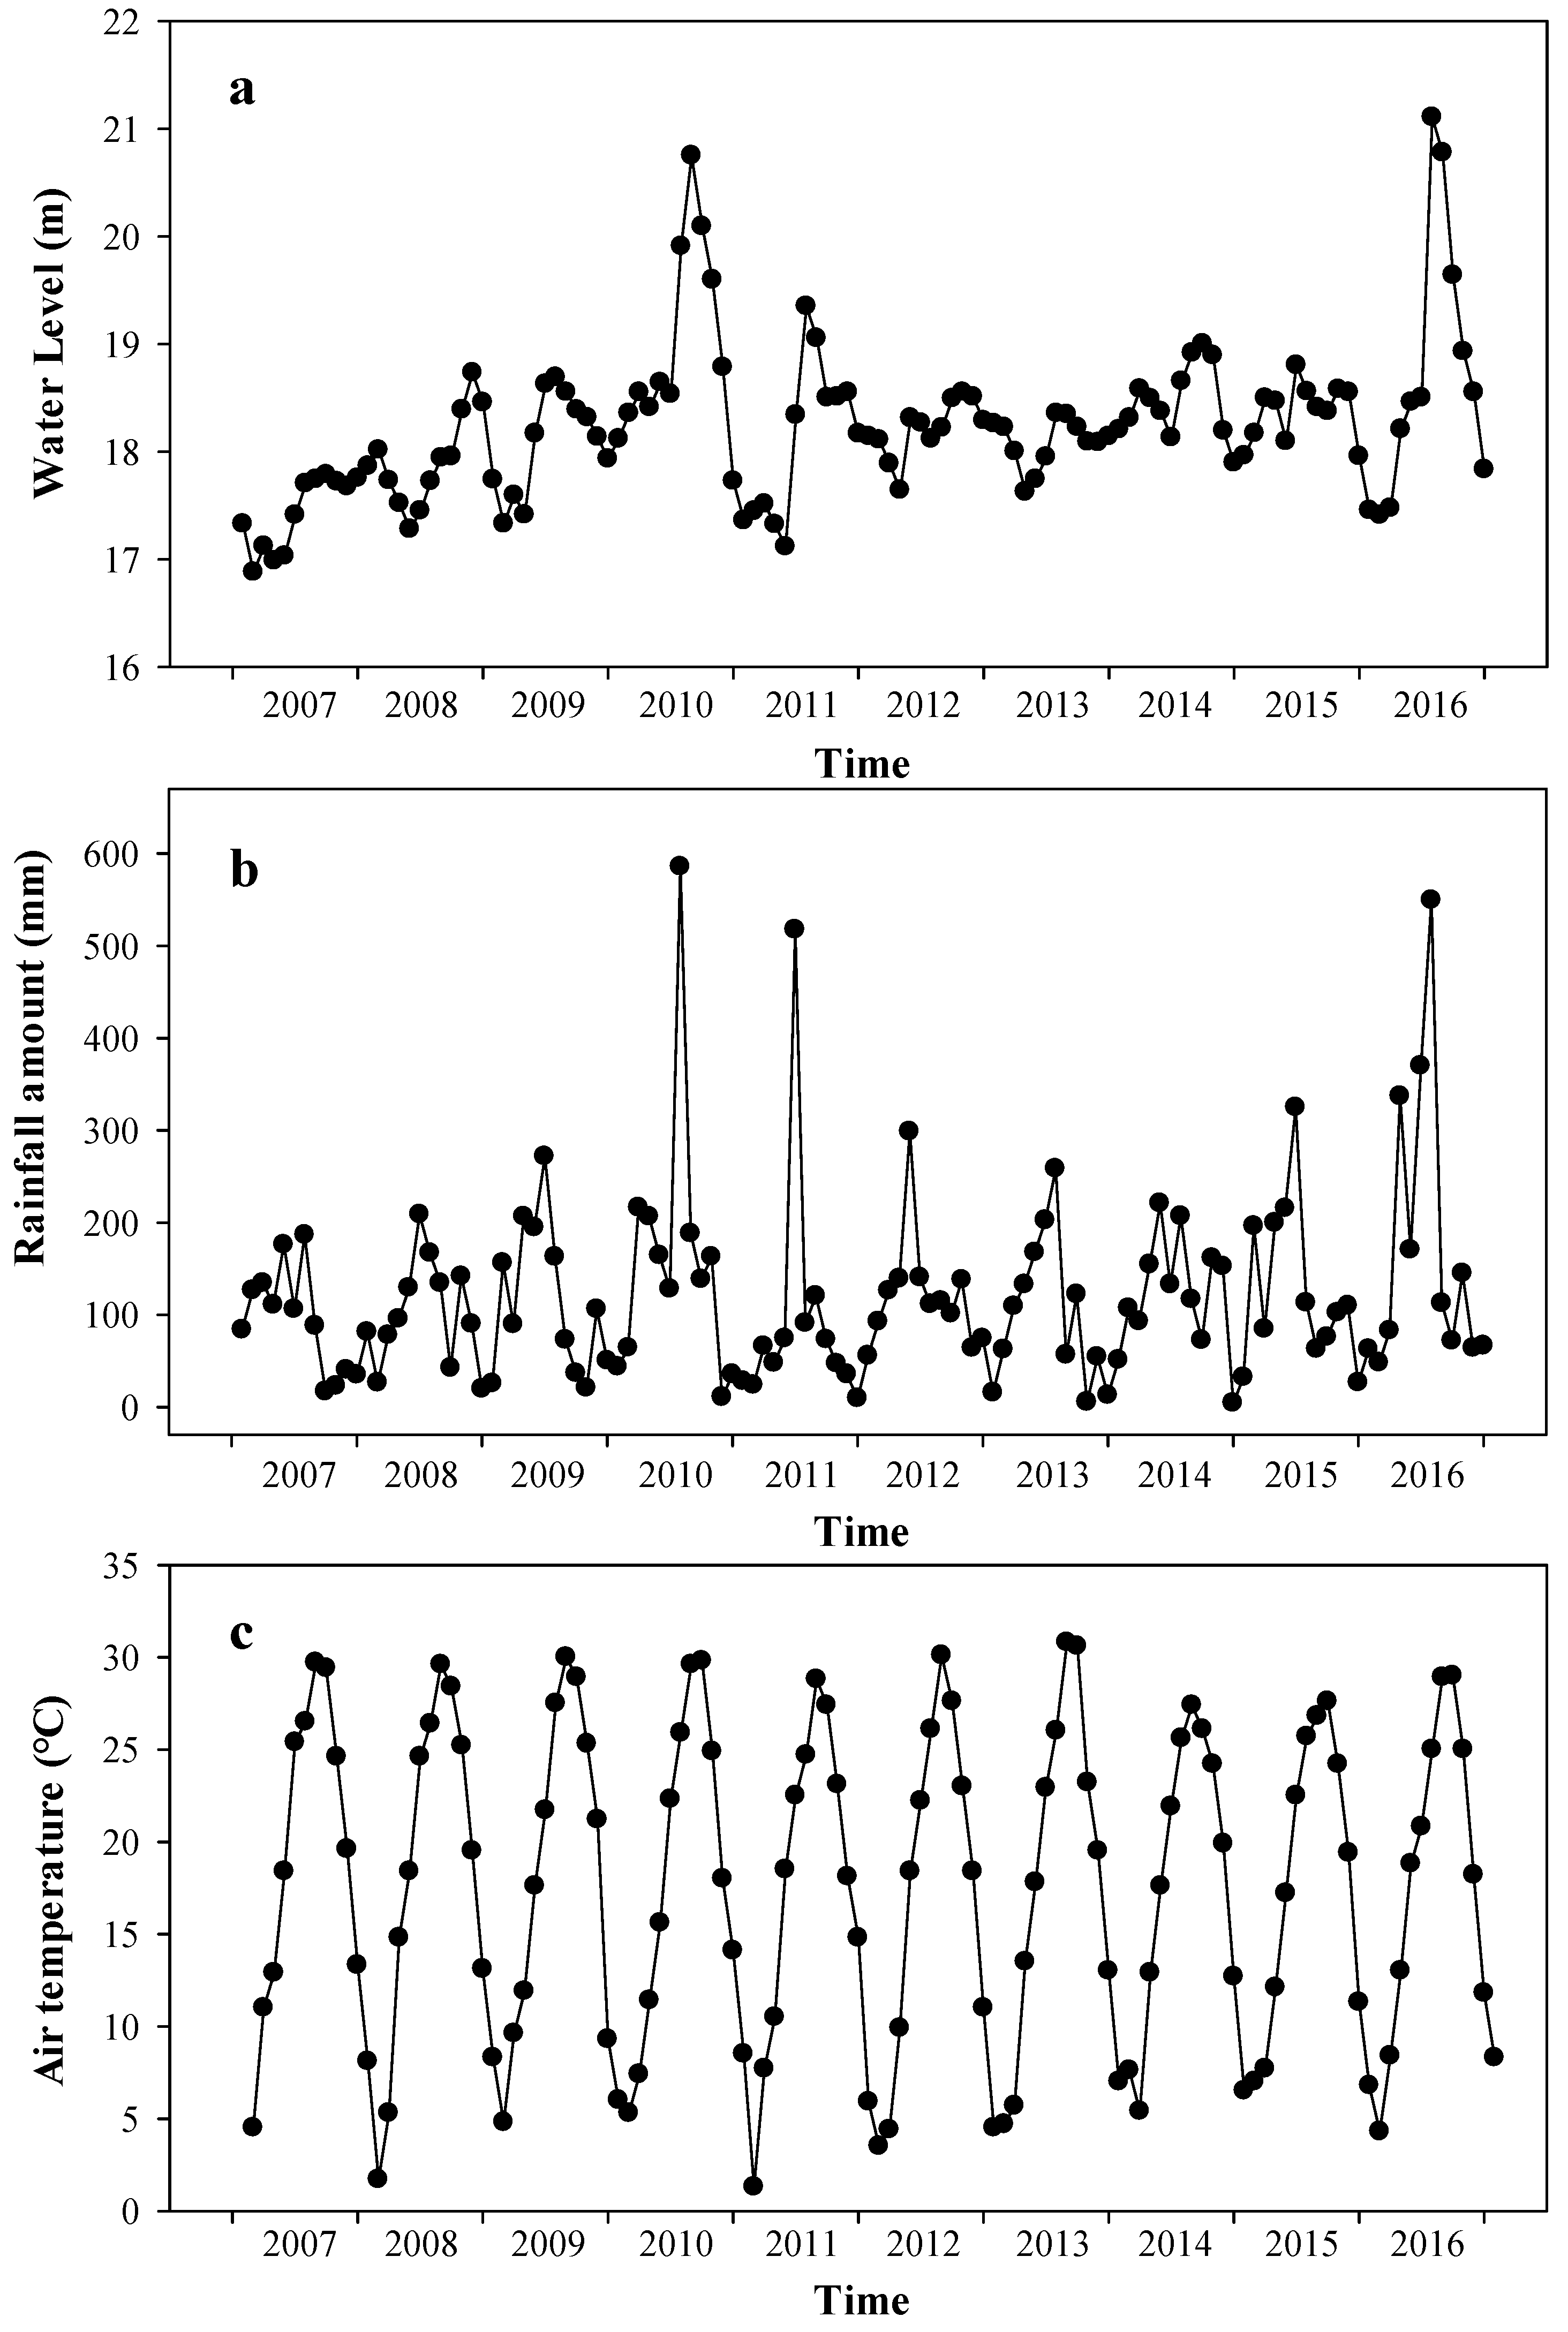
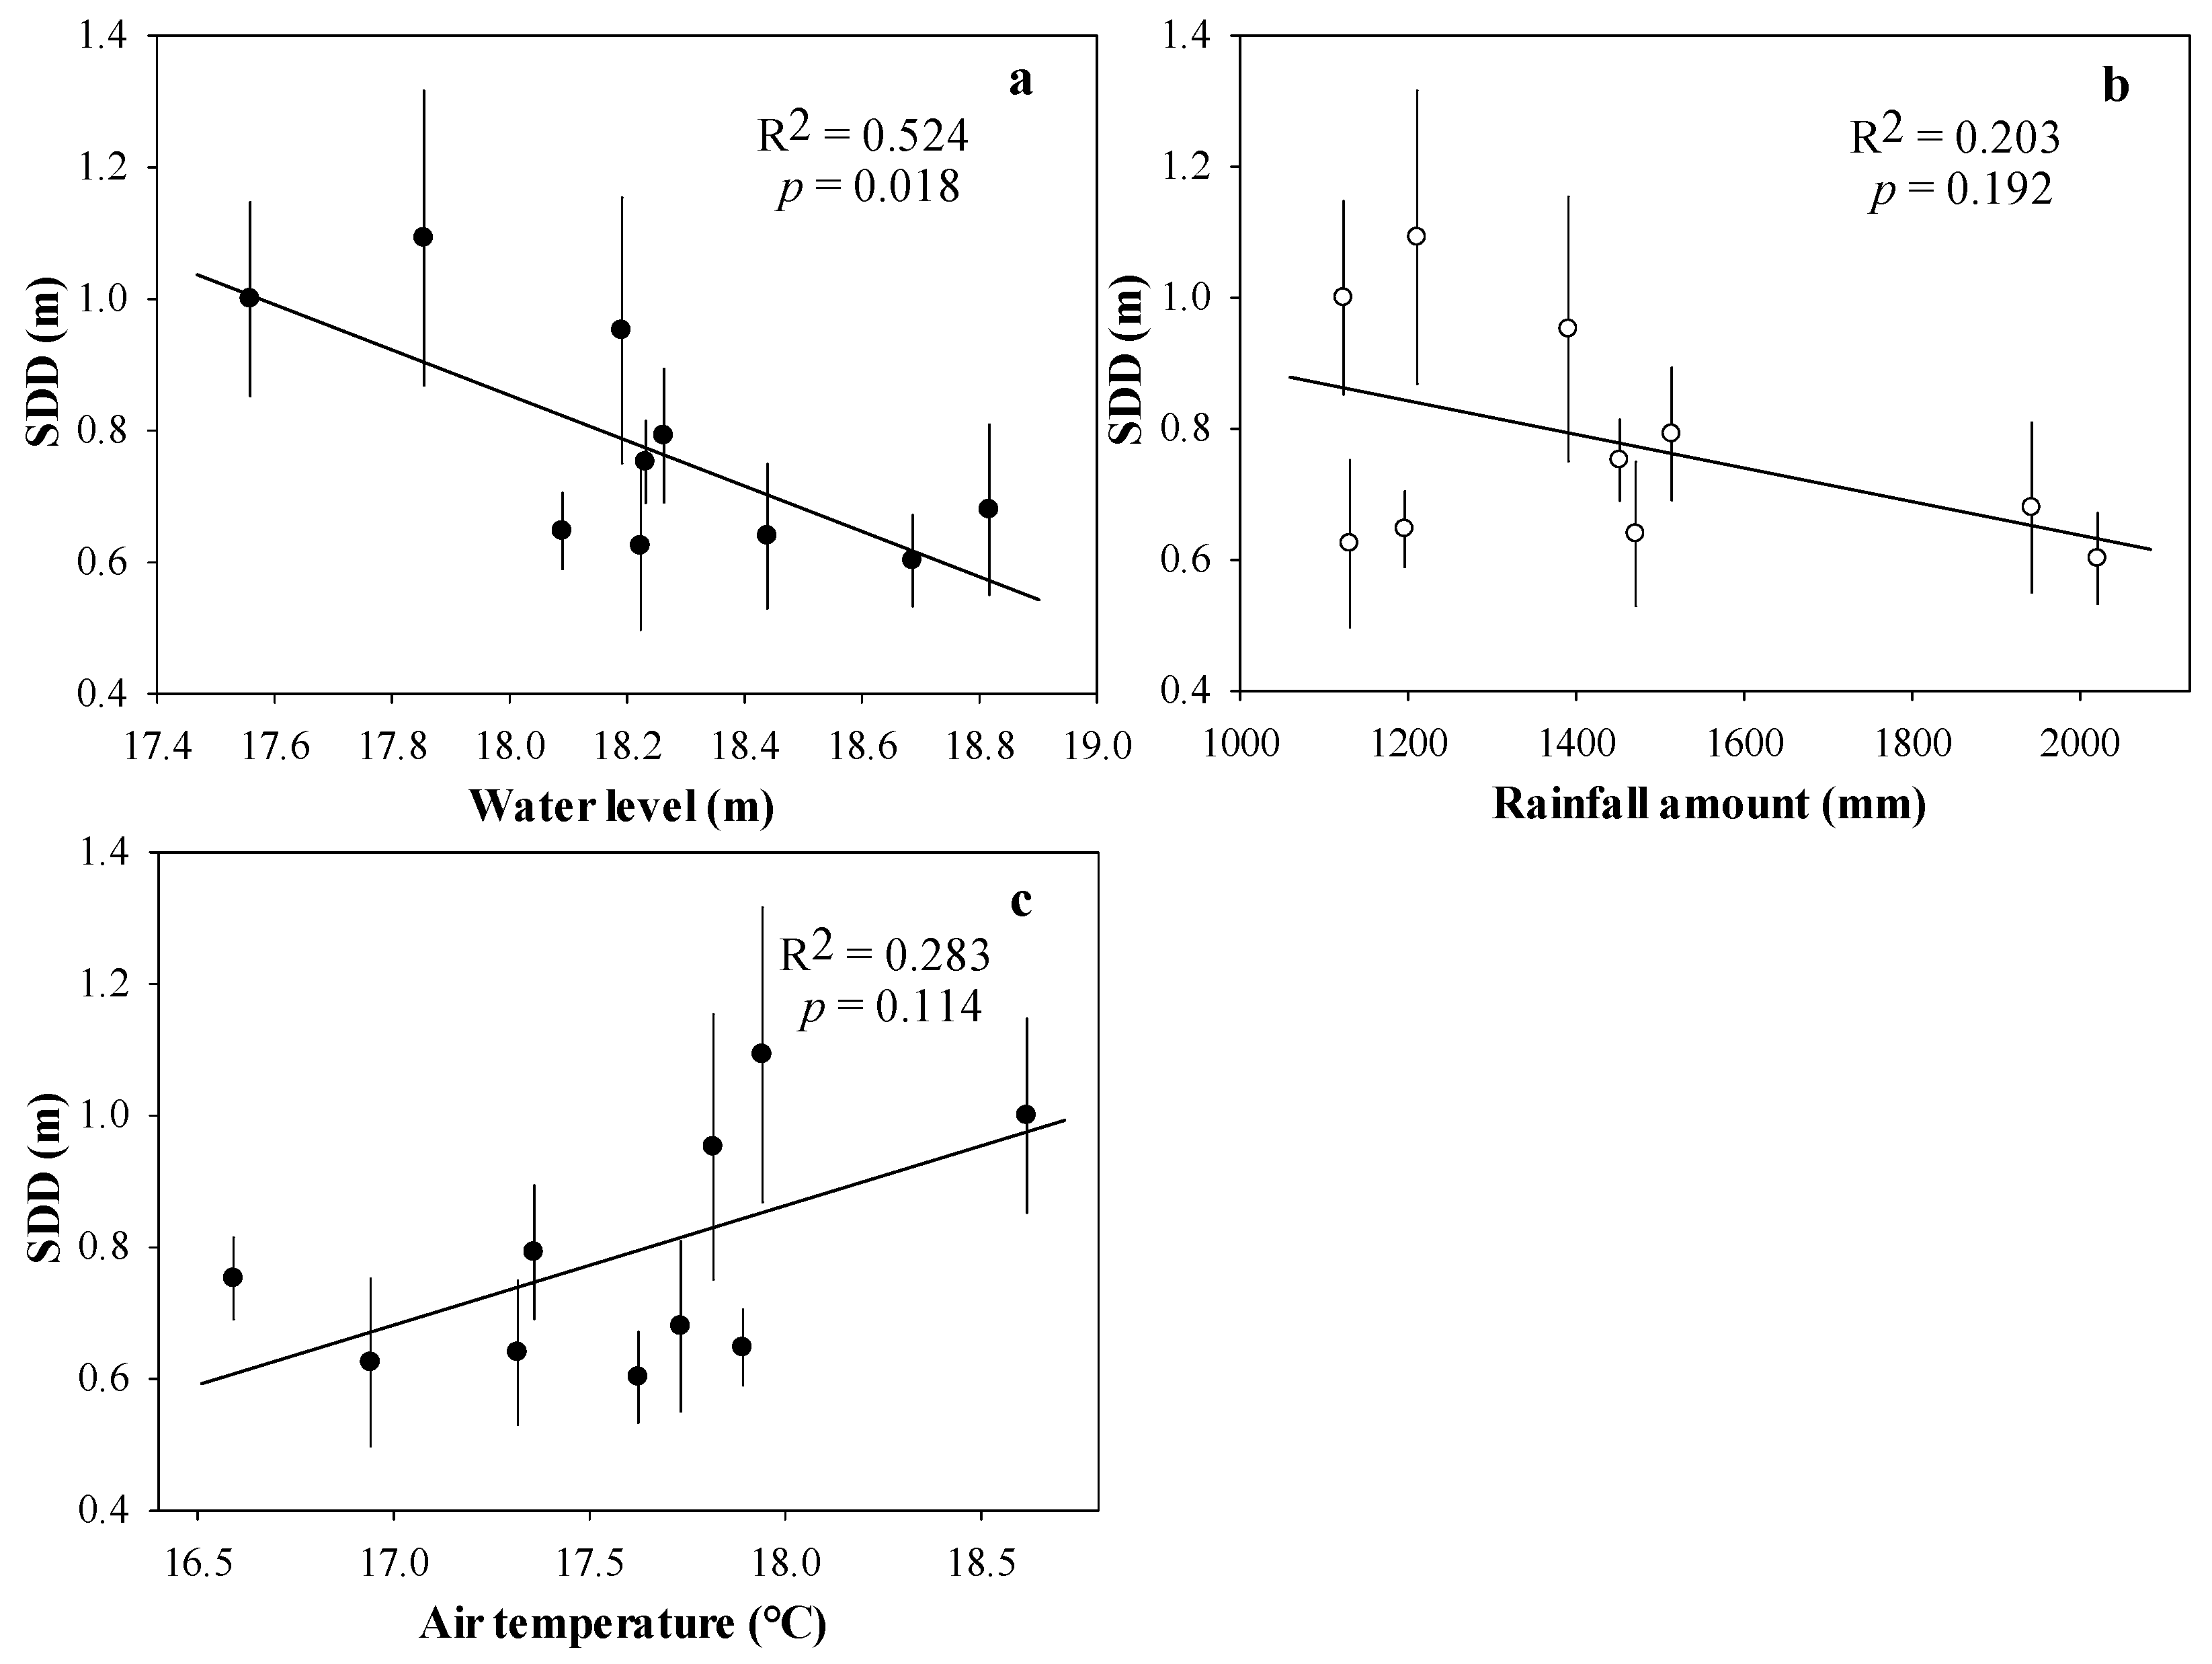
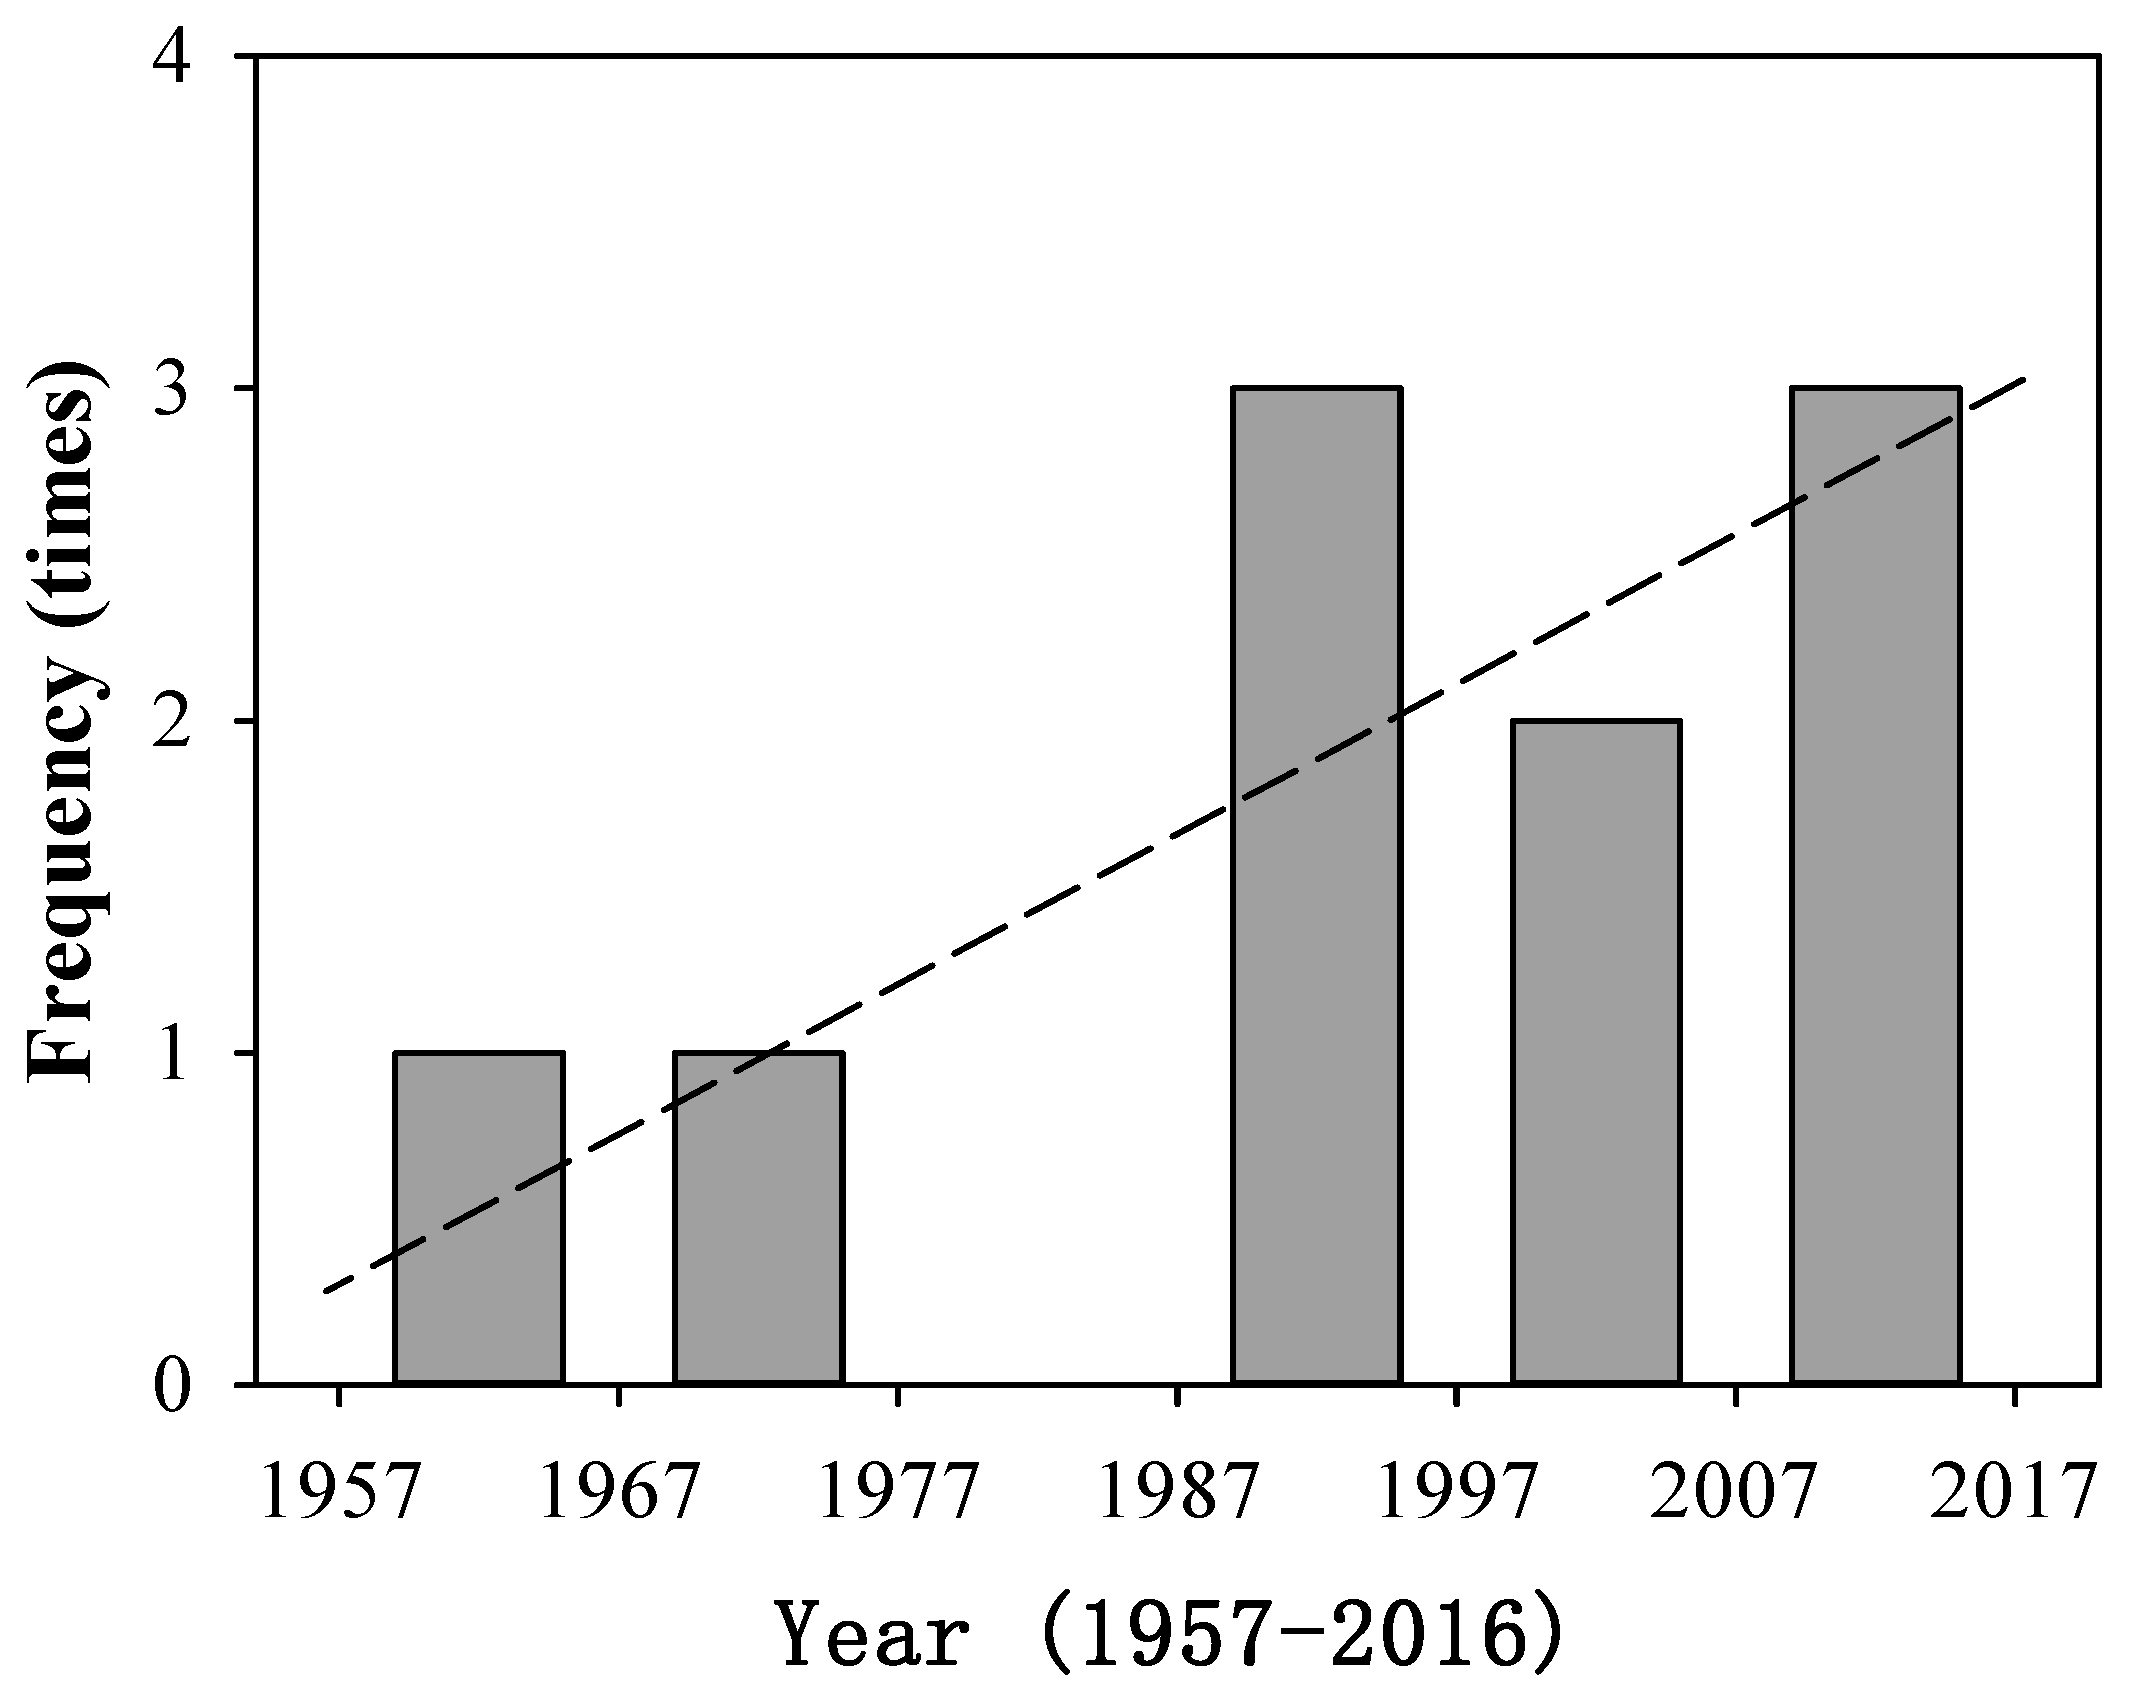
From 2007 to 2016, the monthly maximum, minimum, and mean water levels were 21.11 m, 16.99 m, and 18.25 m, respectively (Figure 9a). To evaluate the relationship between the SDD and water level, rainfall amount, and air temperature, linear regressions were conducted. The results showed that the SDD was significantly negatively correlated with water level (R2 = 0.524, p = 0.018 < 0.05; Figure 10a). During the ten years, two floods occurred in 2010 and 2016. When floods occurred, the lake SDD decreased. The lake SDD decreased from 0.78 m to 0.6 m during the flood of 2010 and decreased from 0.65 m to 0.49 m during the flood of 2016 (Figure 3). The monthly maximum water levels in 2010 and 2016 were 20.75 m and 21.11 m, respectively, corresponding to monthly rainfall amounts of 586 mm and 549 mm, respectively (Figure 9). The rainfall amount during month of multiple floods were 586 mm and 549 mm, which means that a monthly rainfall amount above 500 mm may lead to a flood in Lake Liangzi. Thus, we conducted frequency statistics of the monthly rainfall greater than 500 mm from 1957 to 2016. The results indicated that the frequency of heavy rainfall or floods increased from 1956 to 2016 (Figure 11).
4. Discussion
4.1. Predictive SDD Algorithm for Landsat Imagery
Landsat series data provide a historical data set covering almost 40 years and Landsat ETM+ and OLI data have been widely used to estimate water quality parameters, including the SDD [8,32]. Previous studies have shown that the blue and red bands of Landsat were successfully correlated to water clarity [9,33,34]. In addition, the band ratios of red and blue may be the most suitable relationship to retrieve SDDs [31,35]. However, in our results, the red band of Landsat did not show good correlations to SDD in Lake Liangzi. Zhao et al. (2011) considered that band selection for retrieving SDDs may depend on the image quality and limnological properties of a water body [34]. In our study, the NIR band and band ratio of the NIR to blue band showed strong negative correlations to the SDD, which was used for predicting the SDD in Lake Liangzi. The NIR band was strongly absorbed by water, and the reflectance of the NIR was probably suspended matter reflection. The blue band was dominated by the absorbing effects of phytoplankton and detritus, and dividing by the blue band serves to normalize the brightness in the NIR band [2]. Thus, the band and band ratio selection of the SDD algorithm in our study was reasonable. In addition, the dataset used to develop the algorithm included all seasons (spring, summer, fall, and winter) covering a large variability of SDD from 0.25 m to 1.10 m. These characteristics indicated that the developed empirical model was acceptable for predicting the SDD in Lake Liangzi.
4.2. Potential Factors for Long-Term Changes in SDD
Our results of the Mann–Kendall test and linear regression demonstrate that Lake Liangzi is experiencing a declining trend in SDD, with a relatively high SDD value of 1 m in 2007 and a low value of 0.6 m in 2016 (Table 3, Figure 3 and Figure 4). Previous studies showed that the decline in SDD may be attributed to more intensive agriculture land use [33], increased phytoplankton [11,36], and increased total suspended matter [37]. The water quality of lakes is seriously affected by anthropogenic activities in the watershed, such as pollutant emissions, agricultural nonpoint source pollutants, and domestic sewage, which could be associated with human population growth and economic development [18].
In this study, human population and GDP in the lake basin were used to elucidate the effects of anthropogenic activities on the decreased SDD in Lake Liangzi. Our results showed that the SDD was significantly negatively correlated with the population and GDP in the watershed. The population in the watershed was growing slowly from 1.288 million people to 1.322 million people during the ten years of the study. The population in the watershed increased with growing demand for water resources for domestic use, agriculture, and industry, which resulted in the accumulation of contaminants flowing into lakes [15]. The GDP in watershed was growing rapidly during the ten years. The rapid growth of the GDP resulted in more resource input and more intensive human influence on the lake [17]. These may result in increased nutrients input and lake eutrophication, which would decrease the lake SDD. These indicate that increased human activity intensity in the watershed may contribute to the SDD decrease in Lake Liangzi. Furthermore, with the fast growing rate of GDP, the SDD in Lake Liangzi may be further reduced.
The SDD in Lake Liangzi did not show significant correlations with rainfall amount and air temperature (p = 0.192 and p = 0.114, respectively, Figure 10b, c). However, the SDD was significantly negatively correlated with water levels in Lake Liangzi (Figure 10a). High water levels could introduce terrestrial phosphorus and nitrogen from flood land areas, which could fuel algal populations [21]. Furthermore, high water levels could also cause light limitations to submerged macrophytes and reduce their effects in maintaining the water’s clarity [38].
In addition, flood events and heavy rainfall may have great impacts on water quality and aquatic ecosystems [20,21]. The mean SDD during the flood years (2010 and 2016) was significantly decreased compared to that of the previous year. This indicates that floods decrease the water clarity in Lake Liangzi during the short term. Flooding could introduce significant amounts of suspended matter and nutrients from land [19]. High inflows in floods and heavy precipitation events could bring in higher concentrations of colored dissolved organic materials, and these all could reduce water SDD in the lake [39]. Therefore, a negatively but nonsignificant linear relationship was found between SDD and rainfall amount. Furthermore, some studies found that heavy precipitation may induce river plumes and the frequency of heavy precipitation in past decades was increased [22]. Our results indicate an increase in the frequency of heavy precipitation (monthly rainfall amount >500 mm) in the Lake Liangzi basin (Figure 11). These results suggest that the frequency of flood events and heavy precipitation in the Lake Liangzi basin may increase in future decades. The SDD in Lake Liangzi may be further decreased in the future if these trends continue.
There are some other factors that may also be contributing to the SDD decrease in Lake Liangzi. Some regions of Lake Liangzi are used for the aquaculture of fish and crabs [40]. Aquaculture activities could increase the concentration of nutrients in water, causing eutrophication and reducing water SDD [41]. In addition, some regions of Lake Liangzi were polluted with the discharge of toxic wastewater which could kill macrophytes [25]. Macrophytes can help in stabilizing the sediment and keeping water clarity for shallow Lake Liangzi.
4.3. Implications of Decreasing SDD for Ecosystem Evolution
A declining trend in the SDD of Lake Liangzi may continue with the growth of the human population, economic development, and climate change such as the extreme precipitation events increase. Decreases in SDD will reduce the available light entering the water column [42]. In addition, the temperature of the surface water may increase, and that of the deep water may decrease due to more solar radiation being absorbed at the water surface [43]. For a macrophyte-dominated lake, the macrophytes, especially submerged macrophytes, play a key role in maintaining healthy aquatic ecosystems and providing ecological service in lakes [44]. The available light and temperature decrease in the water column, especially at lake bottom, will reduce the biomass, growth rate, and photosynthetic capacity of submerged macrophytes and may result in the degradation of submerged macrophytes and a state shift from clear macrophyte-dominated status to turbid phytoplankton-dominated status [24,45]. Additionally, the cover and biomass of floating plants (e.g., Eichhornia crassipes, Lemna minor, and Hydrocharis dubia) may be enhanced due to the increased temperature of surface water and trophic status induced by anthropogenic activities [46].
The implications of a decrease in SDD are not limited to macrophytes but could also affect phytoplankton. A decreasing SDD may affect the critical depth of phytoplankton communities and reduce primary production [47]. The increased temperature of surface water due to global warming and SDD decrease may affect the dominated community and phenophase of phytoplankton [48,49].
5. Conclusions
In this study, we developed an empirical model to retrieve the SDD in Lake Liangzi based on Landsat ETM+ and OLI data and validated its accuracy. Subsequently, the temporal and spatial variations of the SDD in Lake Liangzi were derived from Landsat data from 2007 to 2016. During the study period, the SDD in Lake Liangzi presented a significant decreasing trend. The SDD was significantly and negatively correlated to the human population and GDP in the lake basin. Anthropogenic activities may be the driving factors for the decreasing SDD trend over long timescales, and flood events may affect the SDD in the short term. A decreasing SDD may lead to the degradation of submerged macrophytes and a state shift in the lakes. A declining trend in the SDD in Lake Liangzi may be continued under future anthropogenic activities and climate change. Remote sensing imagery can be used to increase the current knowledge of water quality and develop management strategies for lake conservation.
Author Contributions
Conceptualization, X.X., Y.Z. and D.Y.; Data curation, X.H.; Methodology, X.X.; Resources, X.H.; Software, X.X. and X.H.; Validation, X.H.; Writing—original draft, X.X.; Writing—review & editing, Y.Z.
Funding
This work was jointly supported by the Project funded by the China Postdoctoral Science Foundation (BX20180320), the National Natural Science Foundation of China (41621002 and 41771514), the Key Program of the Chinese Academy of Sciences (ZDRW-ZS-2017-3-4), and the Key Program of Nanjing Institute of Geography and Limnology, Chinese Academy of Sciences (NIGLAS2017GH03).
Acknowledgments
We thank the Geospatial Data Cloud site, Computer Network Information Center, Chinese Academy of Sciences for providing the Landsat data.
Conflicts of Interest
The authors declare no conflict of interest.
References
- Zhou, Y.Q.; Ma, J.R.; Zhang, Y.L.; Qin, B.Q.; Jeppesen, E.; Shi, K.; Brookes, J.D.; Spencer, R.G.M.; Zhu, G.W.; Gao, G. Improving water quality in China: Environmental investment pays dividends. Water Res. 2017, 118, 152–159. [Google Scholar] [CrossRef] [PubMed]
- Bonansea, M.; Rodriguez, M.C.; Pinotti, L.; Ferrero, S. Using multi-temporal Landsat imagery and linear mixed models for assessing water quality parameters in Río Tercero Reservoir (Argentina). Remote Sens. Environ. 2015, 158, 28–41. [Google Scholar] [CrossRef]
- Li, Y.; Zhang, Y.; Shi, K.; Zhu, G.; Zhou, Y.; Zhang, Y.; Guo, Y. Monitoring spatiotemporal variations in nutrients in a large drinking water reservoir and their relationships with hydrological and meteorological conditions based on Landsat 8 imagery. Sci. Total Environ. 2017, 599, 1705–1717. [Google Scholar] [CrossRef] [PubMed]
- Shi, K.; Zhang, Y.L.; Zhou, Y.Q.; Liu, X.H.; Zhu, G.W.; Qin, B.Q.; Gao, G. Long-term MODIS observations of cyanobacterial dynamics in lake taihu: Responses to nutrient enrichment and meteorological factors. Sci. Rep. 2017. [Google Scholar] [CrossRef] [PubMed]
- Zhang, Y.L.; Giardino, C.; Li, L.H. Water optics and water colour remote sensing. Remote Sens. 2017, 9, 818. [Google Scholar] [CrossRef]
- Zheng, Z.; Li, Y.; Guo, Y.; Xu, Y.; Liu, G.; Du, C. Landsat-based long-term monitoring of total suspended matter concentration pattern change in the wet season for Dongting lake, China. Remote Sens. 2015, 7, 13975–13999. [Google Scholar] [CrossRef]
- Tebbs, E.J.; Remedios, J.J.; Harper, D.M. Remote sensing of Chlorophyll-a as a measure of cyanobacterial biomass in Lake Bogoria, a hypertrophic, saline-alkaline, flamingo lake, using Landsat ETM. Remote Sens. Environ. 2013, 135, 92–106. [Google Scholar] [CrossRef]
- Zhang, Y.; Zhang, Y.; Shi, K.; Zha, Y.; Zhou, Y.; Liu, M. A Landsat 8 OLI-based, semianalytical model for estimating the total suspended matter concentration in the slightly turbid Xin’anjiang Reservoir (China). IEEE J. 2017, 9, 398–413. [Google Scholar] [CrossRef]
- Mccullough, I.M.; Loftin, C.S.; Sader, S.A. Combining lake and watershed characteristics with Landsat TM data for remote estimation of regional lake clarity. Remote Sens. Environ. 2012, 123, 109–115. [Google Scholar] [CrossRef]
- Olmanson, L.G.; Brezonik, P.L.; Finlay, J.C.; Bauer, M.E. Comparison of Landsat 8 and Landsat 7 for regional measurements of CDOM and water clarity in lakes. Remote Sens. Environ. 2016, 185, 119–128. [Google Scholar] [CrossRef]
- Shi, K.; Zhang, Y.; Zhu, G.; Qin, B.; Pan, D. Deteriorating water clarity in shallow waters: Evidence from long term modis and in-situ observations. Int. J. Appl. Earth Obs. 2018, 68, 287–297. [Google Scholar] [CrossRef]
- Shang, S.L.; Lee, Z.; Shi, L.H.; Lin, G.; Wei, G.M.; Li, X.D. Changes in water clarity of the Bohai Sea: Observations from MODIS. Remote Sens. Environ. 2016, 186, 22–31. [Google Scholar] [CrossRef]
- Xu, X.; Yang, L.; Huang, X.; Li, Z.; Yu, D. Water brownification may not promote invasions of submerged non-native macrophytes. Hydrobiologia 2018, 817, 215–225. [Google Scholar] [CrossRef]
- Matthews, M.W. A current review of empirical procedures of remote sensing in inland and near-coastal transitional waters. Int. J. Remote Sens. 2011, 32, 6855–6899. [Google Scholar] [CrossRef]
- Juma, D.; Wang, H.T.; Li, F.T. Impacts of population growth and economic development on water quality of a lake: Case study of Lake Victoria Kenya water. Environ. Sci. Pollut. Res. 2014, 21, 5737–5746. [Google Scholar] [CrossRef] [PubMed]
- Duan, H.T.; Ma, R.H.; Xu, X.F.; Kong, F.X.; Zhang, S.X.; Kong, W.J.; Hao, J.Y.; Shang, L.L. Two-decade reconstruction of algal blooms in China’s Lake Taihu. Environ. Sci. Technol. 2009, 43, 3522–3528. [Google Scholar] [CrossRef] [PubMed]
- Cheng, X.; Chen, L.D.; Sun, R.H.; Kong, P.R. Land use changes and socio-economic development strongly deteriorate river ecosystem health in one of the largest basins in China. Sci. Total Environ. 2018, 616, 376–385. [Google Scholar] [CrossRef] [PubMed]
- Huang, C.C.; Wang, X.L.; Yang, H.; Li, Y.M.; Wang, Y.H.; Chen, X.; Xu, L.J. Satellite data regarding the eutrophication response to human activities in the plateau lake Dianchi in China from 1974 to 2009. Sci. Total Environ. 2014, 485, 1–11. [Google Scholar] [CrossRef] [PubMed]
- Goransson, G.; Larson, M.; Bendz, D. Variation in turbidity with precipitation and flow in a regulated river system-river Variation in turbidity with precipitation and flow in a regulated river system-river Göta Älv, SW Sweden. Hydrol. Earth Syst. Sci. 2013, 17, 2529–2542. [Google Scholar] [CrossRef]
- Khan, S.J.; Deere, D.; Leusch, F.D.L.; Humpage, A.; Jenkins, M.; Cunliffe, D. Extreme weather events: Should drinking water quality management systems adapt to changing risk profiles? Water Res. 2015, 85, 124–136. [Google Scholar] [CrossRef] [PubMed]
- Murshed, M.F.; Aslam, Z.; Lewis, R.; Chow, C.; Wang, D.S.; Drikas, M.; van Leeuwen, J. Changes in the quality of river water before, during and after a major flood event associated with a La Niña cycle and treatment for drinking purposes. J. Environ. Sci. 2014, 26, 1985–1993. [Google Scholar] [CrossRef] [PubMed] [Green Version]
- Zhang, Y.L.; Shi, K.; Zhou, Y.Q.; Liu, X.H.; Qin, B.Q. Monitoring the river plume induced by heavy rainfall events in large, shallow, Lake Taihu using MODIS 250 m imagery. Remote Sens. Environ. 2016, 173, 109–121. [Google Scholar] [CrossRef]
- Xie, D.; Zhou, H.; Zhu, H.; Ji, H.; Li, N.; An, S. Differences in the regeneration traits of potamogeton crispus turions from macrophyte- and phytoplankton-dominated lakes. Sci. Rep. 2015, 5, 12907. [Google Scholar] [CrossRef] [PubMed]
- Zhang, Y.L.; Jeppesen, E.; Liu, X.H.; Qin, B.Q.; Shi, K.; Zhou, Y.Q.; Thomaz, S.M.; Deng, J.M. Global loss of aquatic vegetation in lakes. Earth Sci. Rev. 2017, 173, 259–265. [Google Scholar] [CrossRef]
- Liu, G.H.; Li, E.H.; Yuan, L.Y.; Li, W. Occurrence of aquatic macrophytes in a eutrophic subtropical lake in relation to toxic wastewater and fish overstocking. J. Freshw. Ecol. 2008, 23, 13–19. [Google Scholar] [CrossRef]
- Lee, Z.; Shang, S.; Qi, L.; Yan, J.; Lin, G. A semi-analytical scheme to estimate secchi-disk depth from Landsat-8 measurements. Remote Sens. Environ. 2016, 177, 101–106. [Google Scholar] [CrossRef]
- Kaufman, Y.J.; Tanré, D.; Remer, L.A.; Vermote, E.; Chu, A.; Holben, B. Operational remote sensing of tropospheric aerosol over land from EOS moderate resolution imaging spectroradiometer. J. Geophys. Res. Atoms. 1997, 102, 17051–17067. [Google Scholar] [CrossRef] [Green Version]
- Liu, D.; Fu, D. Atmospheric correction of Hyperion imagery over estuarine waters: A case study of the Pearl River Estuary in southern China. Int. J. Remote Sens. 2017, 38, 199–210. [Google Scholar] [CrossRef]
- Zhang, M.; Hu, C.; English, D.; Carlson, P.; Muller-Karger, F.E.; Toro-Farmer, G.; Herwitz, S.R. Atmospheric correction of Aisa measurements over the Florida keys optically shallow waters: Challenges in radiometric calibration and aerosol selection. IEEE J. 2015, 8, 4189–4196. [Google Scholar] [CrossRef]
- Brezonik, P.; Menken, K.D.; Bauer, M. Landsat-based remote sensing of lake water quality characteristics, including Chlorophyll and colored dissolved organic matter (CDOM). Lake Reserv. Manag. 2005, 21, 373–382. [Google Scholar] [CrossRef]
- Sriwongsitanon, N.; Surakit, K.; Thianpopirug, S. Influence of atmospheric correction and number of sampling points on the accuracy of water clarity assessment using remote sensing application. J. Hydrol. 2011, 401, 203–220. [Google Scholar] [CrossRef]
- Tan, W.X.; Liu, P.C.; Liu, Y.; Yang, S.; Feng, S.N. A 30-year assessment of phytoplankton blooms in Erhai Lake using Landsat imagery: 1987 to 2016. Remote Sens. 2017, 9, 1265. [Google Scholar] [CrossRef]
- Olmanson, L.G.; Bauer, M.E.; Brezonik, P.L. A 20-year Landsat water clarity census of Minnesota’s 10,000 lakes. Remote Sens. Environ. 2008, 112, 4086–4097. [Google Scholar] [CrossRef]
- Zhao, D.; Cai, Y.; Jiang, H.; Xu, D.; Zhang, W.; An, S. Estimation of water clarity in Taihu Lake and surrounding rivers using Landsat imagery. Adv. Water Resour. 2011, 34, 165–173. [Google Scholar] [CrossRef]
- Urbanski, J.A.; Wochna, A.; Bubak, I.; Grzybowski, W.; Lukawska-Matuszewska, K.; Łącka, M.; Śliwińska, S.; Wojtasiewicz, B.; Zajączkowski, M. Application of Landsat 8 imagery to regional-scale assessment of lake water quality. Int. J. Appl. Earth Obs. 2016, 51, 28–36. [Google Scholar] [CrossRef]
- Fleming-Lehtinen, V.; Laamanen, M. Long-term changes in secchi depth and the role of phytoplankton in explaining light attenuation in the Baltic Sea. Estuar. Coast. Shelf. Sci. 2012, 102, 1–10. [Google Scholar] [CrossRef]
- Capuzzo, E.; Stephens, D.; Silva, T.; Barry, J.; Forster, R.M. Decrease in water clarity of the southern and central North sea during the 20th century. Glob. Chang. Biol. 2015, 21, 2206–2214. [Google Scholar] [CrossRef] [PubMed]
- Cao, N.; Lee, H.; Jung, H.C.; Yu, H.W. Estimation of water level changes of large-scale Amazon wetlands using ALOS2 ScanSAR differential interferometry. Remote Sens. 2018, 10, 966. [Google Scholar] [CrossRef]
- Hongve, D.; Riise, G.; Kristiansen, J.F. Increased colour and organic acid concentrations in Norwegian forest lakes and drinking water–a result of increased precipitation? Aquat. Sci. 2004, 66, 231–238. [Google Scholar] [CrossRef]
- Zhang, K.; Dong, X.H.; Yang, X.D.; Kattel, G.; Zhao, Y.J.; Wang, R. Ecological shift and resilience in China’s lake systems during the last two centuries. Glob. Planet. Chang. 2018, 165, 147–159. [Google Scholar] [CrossRef]
- Alongi, D.M.; Chong, V.C.; Dixon, P.; Sasekumar, A.; Tirendi, F. The influence of fish cage aquaculture on pelagic carbon flow and water chemistry in tidally dominated mangrove estuaries of peninsular Malaysia. Mar. Environ. Res. 2003, 55, 313–333. [Google Scholar] [CrossRef]
- Fee, E.J.; Hecky, R.E.; Kasian, S.E.M.; Cruikshank, D.R. Effects of lake size, water clarity, and climatic variability on mixing depths in Canadian Shield lakes. Limnol. Oceanogr. 1996, 41, 912–920. [Google Scholar] [CrossRef] [Green Version]
- Strock, K.E.; Theodore, N.; Gawley, W.G.; Ellsworth, A.C.; Saros, J.E. Increasing dissolved organic carbon concentrations in northern boreal lakes: Implications for lake water transparency and thermal structure. J. Geophys. Res. Biogeosci. 2017, 122, 1022–1035. [Google Scholar] [CrossRef]
- Scheffer, M.; Carpenter, S.; Foley, J.A.; Folke, C.; Walker, B. Catastrophic shifts in ecosystems. Nature 2001, 413, 591–596. [Google Scholar] [CrossRef] [PubMed]
- Scheffer, M.; Hosper, S.H.; Meijer, M.L.; Moss, B.; Jeppesen, E. Alternative equilibria in shallow lakes. Trends Ecol. Evol. 1993, 8, 275–279. [Google Scholar] [CrossRef]
- Villamagna, A.M.; Murphy, B.R. Ecological and socio-economic impacts of invasive water hyacinth (Eichhornia crassipes): A review. Freshw. Biol. 2010, 55, 282–298. [Google Scholar] [CrossRef]
- Leach, T.H.; Beisner, B.E.; Carey, C.C.; Pernica, P.; Rose, K.C.; Huot, Y.; Brentrup, J.A.; Domaizon, I.; Grossart, H.P.; Ibelings, B.W.; et al. Patterns and drivers of deep Chlorophyll maxima structure in 100 lakes: The relative importance of light and thermal stratification. Limnol. Oceanogr. 2018, 63, 628–646. [Google Scholar] [CrossRef]
- Gobler, C.J.; Doherty, O.M.; Hattenrath-Lehmann, T.K.; Griffith, A.W.; Kang, Y.; Litaker, R.W. Ocean warming since 1982 has expanded the niche of toxic algal blooms in the north Atlantic and north Pacific oceans. Proc. Natl. Acad. Sci. USA 2017, 114, 4975–4980. [Google Scholar] [CrossRef] [PubMed]
- Henson, S.A.; Cole, H.S.; Hopkins, J.; Martin, A.P.; Yool, A. Detection of climate change-driven trends in phytoplankton phenology. Glob. Chang. Biol. 2018, 24, E101–E111. [Google Scholar] [CrossRef] [PubMed]
Figure 1.
Distributions of sample sites and hydrological station in Lake Liangzi.

Figure 2.
The SDD algorithms for (a) the calibration of in situ measured SDDs and Landsat reflectance and (b) the validation of Landsat-estimated SDDs with in situ measured SDD. RBlue and RNIR represent the atmospherically corrected reflectance values of the blue band and near-infrared band in the Landsat images, respectively.

Figure 3.
Long-term trend in Landsat retrieved seasonal mean SDD of Lake Liangzi during the study period. Sp: spring; Su: summer; F: fall; W: winter.
Figure 3.
Long-term trend in Landsat retrieved seasonal mean SDD of Lake Liangzi during the study period. Sp: spring; Su: summer; F: fall; W: winter.

Figure 4.
The (a) annual mean SDD and (b) seasonal mean SDD in Lake Liangzi.

Figure 5.
Maps of the averaged SDD retrieved from Landsat images from 2007 to 2016.

Figure 6.
Long-term trend in Landsat retrieved annual mean SDD of five regions in Lake Liangzi during the study.
Figure 6.
Long-term trend in Landsat retrieved annual mean SDD of five regions in Lake Liangzi during the study.

Figure 7.
The increase in (a) population and (b) GDP in the Lake Liangzi basin from 2007 to 2016.

Figure 8.
Correlations of the SDD with (a) population and (b) GDP. Error bars represent SDD standard deviations.
Figure 8.
Correlations of the SDD with (a) population and (b) GDP. Error bars represent SDD standard deviations.

Figure 9.
Variation in (a) monthly mean water levels, (b) monthly rainfall amounts, and (c) monthly mean air temperature in Lake Liangzi from 2007 to 2016.
Figure 9.
Variation in (a) monthly mean water levels, (b) monthly rainfall amounts, and (c) monthly mean air temperature in Lake Liangzi from 2007 to 2016.

Figure 10.
Correlations of the SDD with (a) water level, (b) rainfall amount, and (c) air temperature. Error bars represent SDD standard deviations.
Figure 10.
Correlations of the SDD with (a) water level, (b) rainfall amount, and (c) air temperature. Error bars represent SDD standard deviations.

Figure 11.
Long-term trends in the frequency of heavy rainfall from 1957 to 2016 in Lake Liangzi.


Table 1.
Statistics of the in situ water Secchi disk depth (SDD) for calibration and validation in Lake Liangzi.
Table 1.
Statistics of the in situ water Secchi disk depth (SDD) for calibration and validation in Lake Liangzi.
| Calibration SDD Dataset (m) | Validation SDD Dataset (m) | |||||
|---|---|---|---|---|---|---|
| Min | Max | Mean ± SD | Min | Max | Mean ± SD | |
| Spring (April and May) | 0.45 | 0.90 | 0.63 ± 0.10 | 0.40 | 1.00 | 0.66 ± 0.13 |
| Summer (July and August) | 0.25 | 0.65 | 0.44 ± 0.09 | 0.25 | 0.60 | 0.42 ± 0.10 |
| Fall (September and November) | 0.45 | 1.10 | 0.73 ± 0.12 | 0.50 | 1.15 | 0.75 ± 0.12 |
| Winter (January and February) | 0.35 | 1.00 | 0.73 ± 0.13 | 0.40 | 1.00 | 0.72 ± 0.13 |
| Total dataset | 0.25 | 1.10 | 0.63 ± 0.16 | 0.25 | 1.15 | 0.64 ± 0.17 |
Table 2.
The estimated ln(SDD) algorithms and statistical parameters of Lake Liangzi (n = 180).
| Algorithms | R2 | p |
|---|---|---|
| ln(SDD) = 28.16 × RBlue − 72.38 × RNIR − 0.531 | 0.646 | <0.001 |
| ln(SDD) = −6.781 × (RNIR/RBlue) + 2.023 | 0.806 | <0.001 |
| ln(SDD) = −8.266 × (RNIR/RBlue) + 1.863 × RBlue + 2.386 | 0.813 | <0.001 |
| ln(SDD) = −8.753 × (RNIR/RBlue) + 5.223 × RNIR + 2.552 | 0.860 | <0.001 |
RBlue and RNIR represent the atmospherically corrected reflectance values of the blue band and near-infrared band in the Landsat images respectively. The best fit algorithm is shown in bold.
Table 3.
Mann–Kendall test of water SDD variation trends in Lake Liangzi during the study period.
| Tau Correlation Coefficient | S | Z | p Value | |
|---|---|---|---|---|
| Whole lake | −0.392 | −67 | −3.069 | 0.002 |
| Niushanhu | −0.480 | −82 | −3.752 | <0.001 |
| Manjianghu | −0.345 | −59 | −2.690 | 0.007 |
| Gaotanghu | −0.415 | −71 | −3.260 | 0.001 |
| Qianjiangdahu | −0.421 | −72 | −3.296 | 0.001 |
| Zhangqiaohu | −0.450 | −77 | −3.524 | <0.001 |
© 2018 by the authors. Licensee MDPI, Basel, Switzerland. This article is an open access article distributed under the terms and conditions of the Creative Commons Attribution (CC BY) license (http://creativecommons.org/licenses/by/4.0/).
Share and Cite
MDPI and ACS Style
Xu, X.; Huang, X.; Zhang, Y.; Yu, D. Long-Term Changes in Water Clarity in Lake Liangzi Determined by Remote Sensing. Remote Sens. 2018, 10, 1441. https://0-doi-org.brum.beds.ac.uk/10.3390/rs10091441
AMA Style
Xu X, Huang X, Zhang Y, Yu D. Long-Term Changes in Water Clarity in Lake Liangzi Determined by Remote Sensing. Remote Sensing. 2018; 10(9):1441. https://0-doi-org.brum.beds.ac.uk/10.3390/rs10091441
Chicago/Turabian StyleXu, Xuan, Xiaolong Huang, Yunlin Zhang, and Dan Yu. 2018. "Long-Term Changes in Water Clarity in Lake Liangzi Determined by Remote Sensing" Remote Sensing 10, no. 9: 1441. https://0-doi-org.brum.beds.ac.uk/10.3390/rs10091441
Note that from the first issue of 2016, this journal uses article numbers instead of page numbers. See further details here.