Article

Spectral Responses of As and Pb Contamination in Tailings of a Hydrothermal Ore Deposit: A Case Study of Samgwang Mine, South Korea

1
Department of Astronomy, Space Science and Geology, Chungnam National University, 99 Daehak-ro, Yuseong-gu, Daejeon 34134, Korea
2
Department of Geology and Earth Environmental Sciences, Chungnam National University, 99 Daehak-ro, Yuseong-gu, Daejeon 34134, Korea
3
Department of Geography & Anthropology, Louisiana State University, Baton Rouge, LA 70803, USA
*
Author to whom correspondence should be addressed.
Remote Sens. 2018, 10(11), 1830; https://0-doi-org.brum.beds.ac.uk/10.3390/rs10111830
Submission received: 17 October 2018 / Revised: 13 November 2018 / Accepted: 15 November 2018 / Published: 19 November 2018
(This article belongs to the Section Remote Sensing in Geology, Geomorphology and Hydrology)

Abstract

:
We analyzed chemical composition, mineralogy, and spectral characteristics of the tailings of a hydrothermal gold mine in South Korea. We measured spectral responses of tailings to arsenic (As) and lead (Pb) concentration and developed and validated a prediction model for As and Pb in the tailings. The tailing was heavily contaminated with heavy metal elements and composed of rock forming minerals, gangue minerals and hydrothermal alteration minerals. The spectral features of the tailing were closely related to hydrothermal alteration minerals. The spectral responses associated with As and Pb concentrations were detected in shortwave infrared (SWIR) region at absorption positions of the hydrothermal alteration minerals. The prediction models were constructed using spectral bands of absorption features of the hydrothermal alteration minerals and were statistically significant. We found distinctive differences in spectral characteristics and spectral response to heavy metal contamination between the tailings and soils in the mining area. While the spectral signals to heavy metal concentration of tailings were associated with the hydrothermal alteration minerals, those of soils in mining area were manifested by clay minerals originated from weathering processes. This infers that geological processes associated with formation of soils and tailings are the major controlling factors of spectral responses to heavy metal contamination. This study provides a rare reference for the estimation of As and Pb concentration in the tailings with similar types of ore deposit and host rock.

Graphical Abstract

1. Introduction

Heavy metal pollution from mine waste or ore waste scattered over a tailing field can cause disastrous damage to vegetation, soils, crops, water systems, and animals and hazards to the inhabitants [1,2,3,4]. Accumulated heavy metals in tailing field can be transported by water and wind and contaminate a larger eco-region. In addition, waste rocks can be oxidized to a soluble form that can produce an acid mine drainage [1,2,5]. Numerous efforts have sought to establish a cost-efficient monitoring system to detect heavy metal contamination based on the spectral characteristics of the contaminated soils.
Arsenic (As) and lead (Pb) are well-known elements due to its toxic effects on the environment, including human health and ecosystems (e.g., crops and ground water) [6,7]. Indeed, US Environmental Protection Agency (EPA) reported As and Pb as the most commonly found pollutant among the five most common contaminants of concern at Superfund sites of soil remediation [8]. Furthermore, in a report by The Ministry of Environment of Korea, As is the most serious heavy metal pollutant with the highest contamination in abandoned metal mines, originating from tailings and mine waste having the highest priority for treatment [9].
Spectroscopic analysis provides a low-cost, fast, and repeatable solution to detect heavy metal elements in soil [10,11,12,13,14,15]. Besides, remote sensing of heavy metal contamination relies on spectroscopic test results [15]. The spectroscopic test provides valuable information on the spectral responses associated with heavy metal contamination, and thus, the test results give a band combination and spectral signatures useful for remote sensing approaches. The visible-near infrared-shortwave infrared (VNIR-SWIR) spectral ranges (350 to 2500 nm) have been used to study the physicochemical properties of mineral objects and the associated environmental changes [12,16,17,18,19,20,21,22,23,24,25,26,27,28,29].
Pure heavy metal elements have no direct absorption features in the infrared spectral region [10,30]. In general, heavy metal elements can be retained within a particular chemical or oxidizing environment. The process of heavy metal element retention, mainly in the solid phase of the soil, is stabilized by mechanisms such as adsorption by surface active minerals and organic components and diffusion to primary and secondary minerals [10,31,32,33]. In other words, organic matter, clay minerals, as well as Fe and Mn oxides, are the most important components of sorption and desorption of heavy metals in soils [34]. The organic components form stable metal–organic complexes with a variety of metals, while clay minerals and oxides concentrate heavy metal ions through surface ion exchange and metal-complex surface adsorption [32]. Therefore, the prediction of the heavy metal content of soils based on the spectroscopic approach is made by indirect measurements of the heavy metals adsorbed on soil-constituting materials such as Fe-oxide, organic matter, and clay minerals, [5,10,15,30,35,36,37,38,39,40,41,42].
Most studies on heavy metal contamination of mining activities have focused on soils in the vicinity of mines, mainly originated from the tailings [5,41]. Unlike natural soil, tailings are waste of mining materials artificially crushed to produce ore concentration. In other words, mechanical process is the dominant method of tailings instead of the biochemical one that dominates natural soil production. Thus, geochemical processes of heavy metals associated with soils and tailing should be different. It infers that spectral characteristics of heavy metal contaminated soils and tailings are likely to be different.
Most environmental pollution associated with mining activities is from tailings. However, almost all of the previous spectroscopic studies only focused on heavy metal contamination of common soils, while the contamination originating from tailings was barely studied. In addition, the origin of the tailings is fundamentally different from soils in the formative geochemical process and spectral characteristics. Therefore, monitoring the tailings as contamination sources requires systematic geological and spectroscopic approaches to understand the geochemical processes and spectral response of tailings associated with heavy metal concentration. Moreover, previous studies reported that prediction models constructed from one area cannot be applicable to other areas [11,30,43]. It indicates that most models on heavy metal contamination in soils are site specific. Lack of systematic geological interpretation associated with a spectral response of heavy metal contaminated soils is the main reason for the site-specific spectroscopic studies in exploration of heavy metal contamination, which may be affected by participating minerals on adsorption and desorption of metal ions [11,30,43].
This paper reports on our spectroscopic analyses of heavy metal contaminated tailings from a hydrothermal gold mine, which were especially associated with As and Pb concentration. We analyzed chemical composition, mineralogy, and spectral characteristics of the contamination source, tailing materials, and explored the relationship between As and Pb concentration and reflectance. Finally, we proposed a prediction model of As and Pb concentration for tailings under the specific geological settings.

2. Materials and Methods
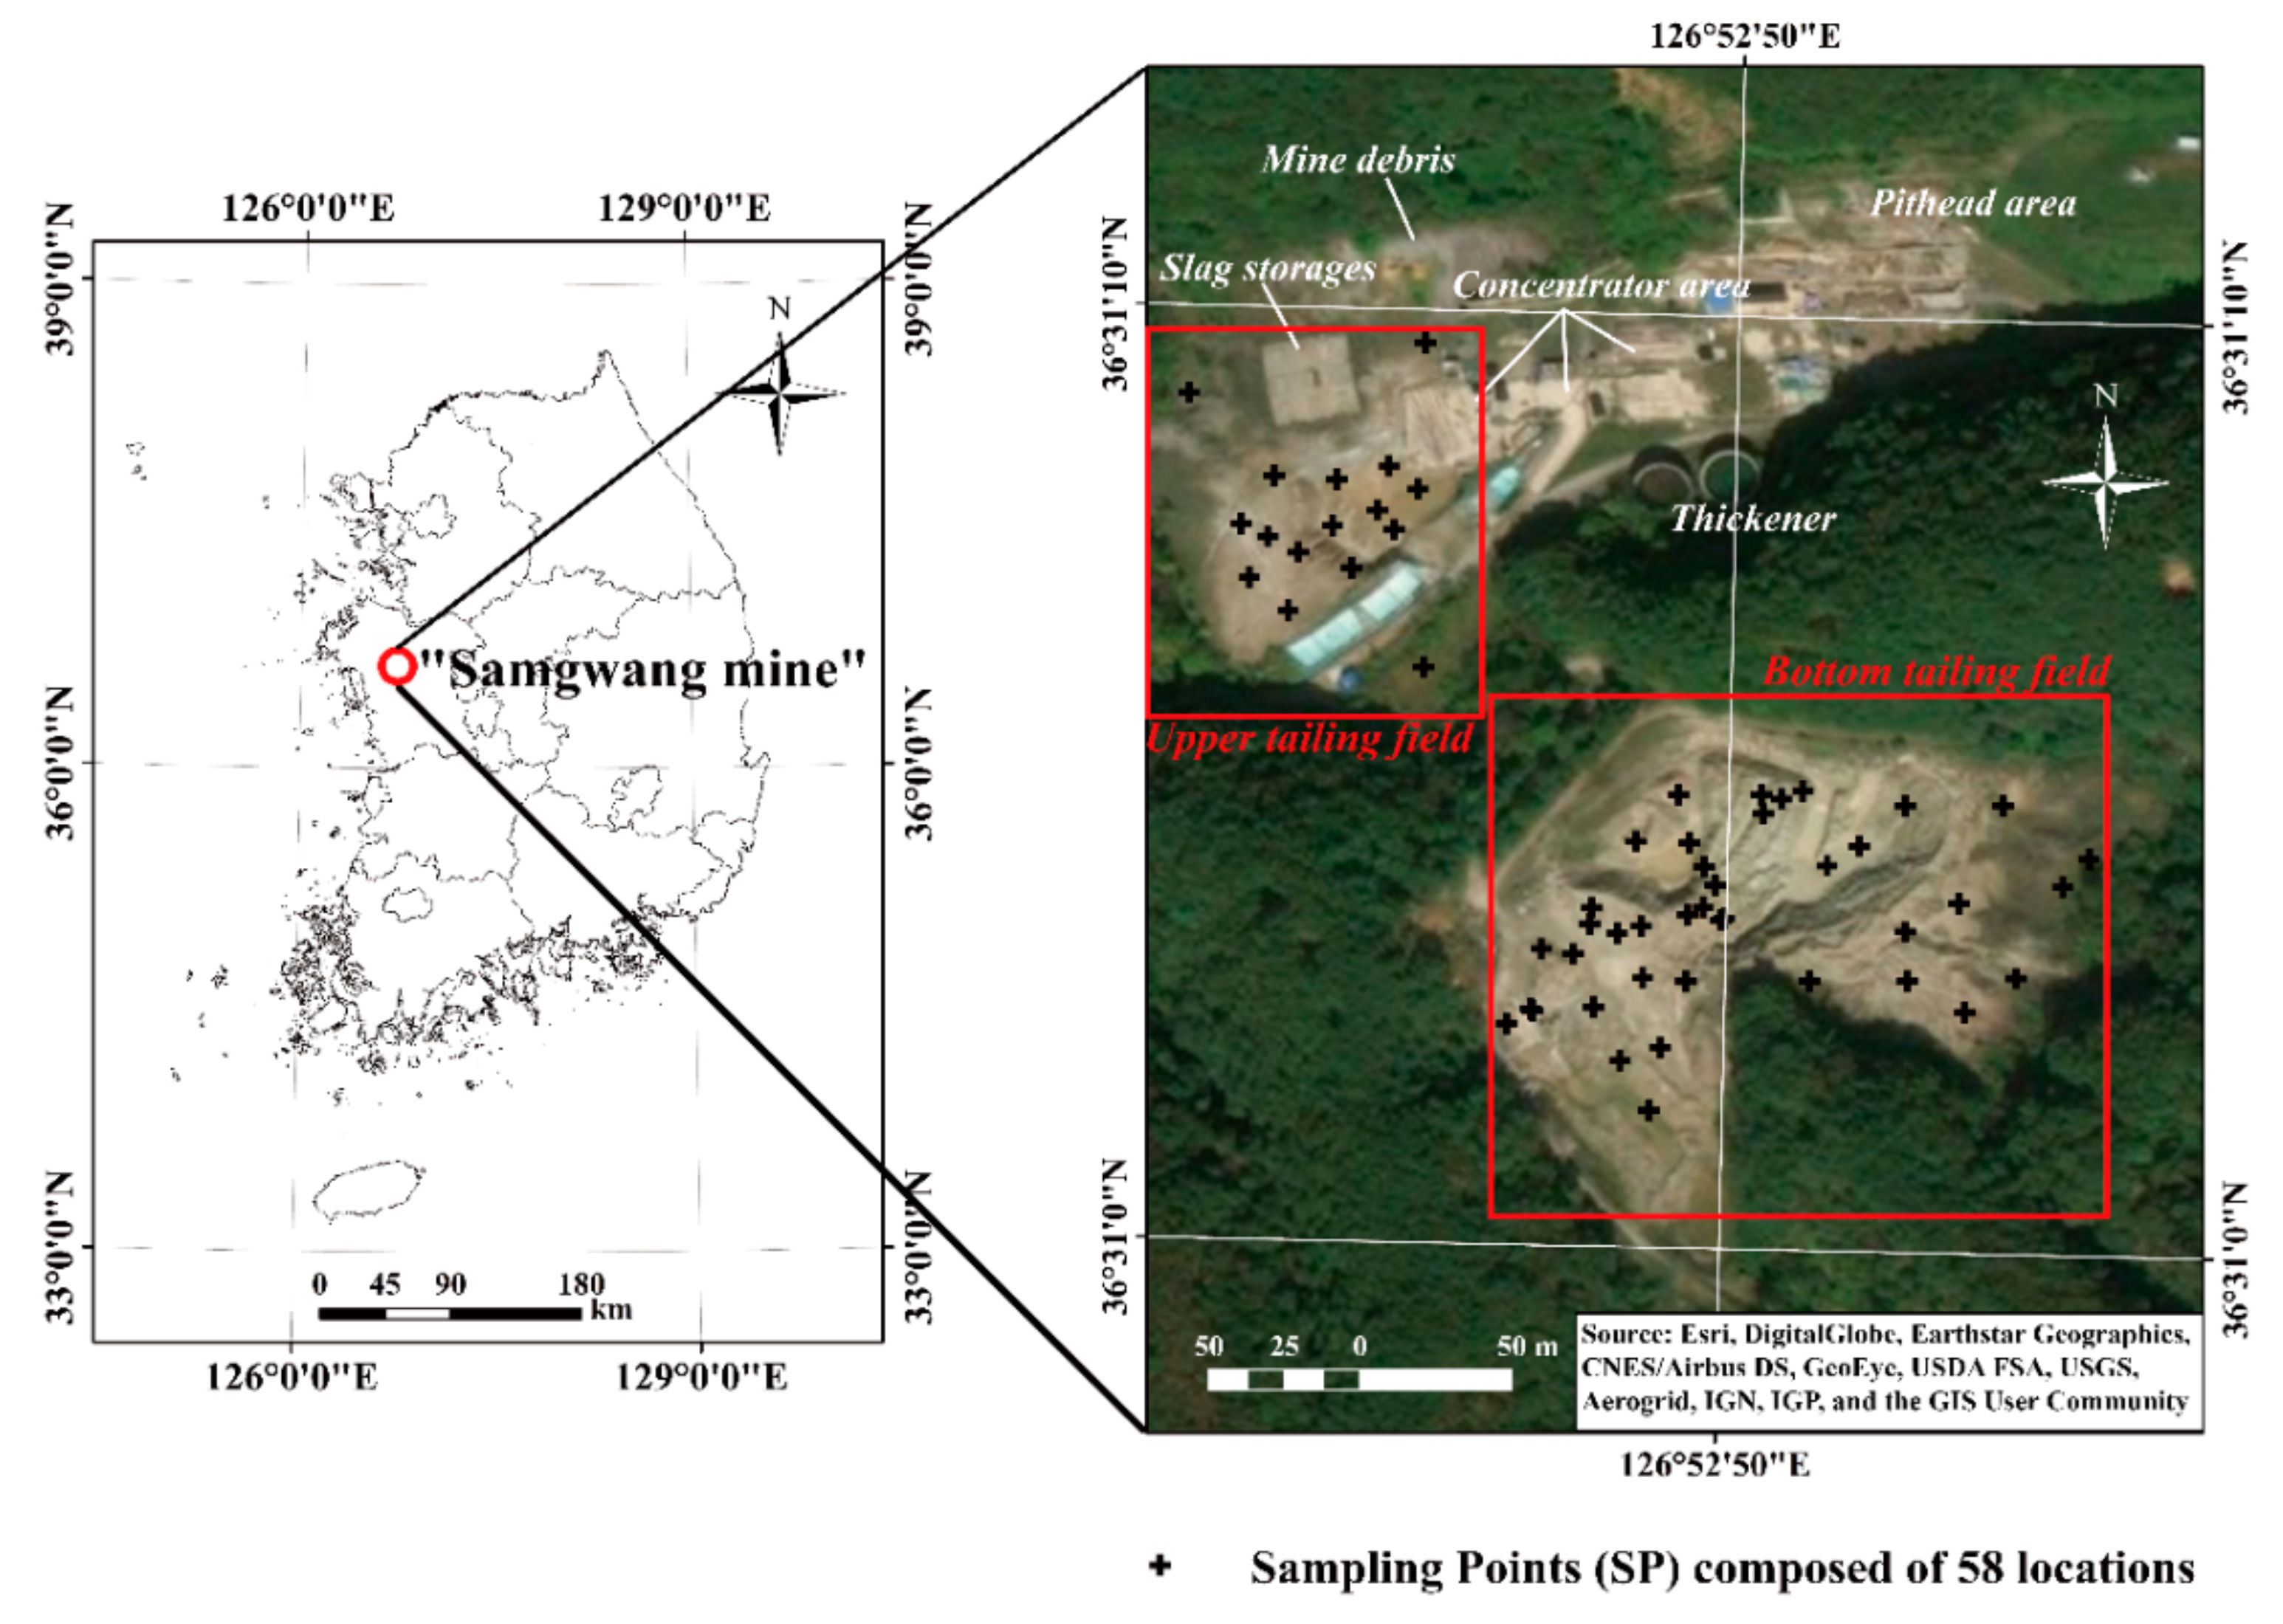
2.1. Study Area

2.1.1. Geology and Ore Deposit

The study area, Samgwang mine, is located in the Cheongyang gold district (Cheonan Metallogenic Province), one of the major gold/silver-bearing quartz vein mineralization area of South Korea [44] (Figure 1). This ore deposit spatially coincides with Jurassic and Cretaceous igneous activity hosted in Precambrian metasedimentary rocks [44,45,46,47,48,49]. The Samgwang mine was one of the largest gold producers in South Korea and stopped operation in 1959 [50]. The geology of the Samgwang mine area is composed of Precambrian metasedimentary rocks and granitic paragneiss. The main ore minerals are arsenopyrite (FeAsS), chalcopyrite (CuFeS2), galena (PbS), pyrrhotite (FeS), pyrite (FeS2), sphalerite ((Zn, Fe)S), gold, and silver [50]. Quartz, calcite, dolomite, chlorite, and alkali feldspar are reported as gangue minerals. Major hydrothermal alteration minerals were found in the study site; they include quartz, pyrite, sericite, epidote, chlorite, clays, and carbonate minerals [51].

2.1.2. Mine Dumps

The tailing fields and waste facilities of this mine were abandoned without any treatment or maintenance. For decades, massive amounts of contaminants originated from the tailings have been polluting the environment of the mine site and the ecoregion downstream. The dumps of tailings are distributed over two districts near the mine (Figure 1). The upper dump is located around abandoned mine facilities in a mound shape and the bottom dump is developed in a mountainous region contained as a tailing dam (Figure 1). The total volume of the tailings is 424,167 m3. According to The Ministry of Environment of Korea, the tailings are seriously contaminated with heavy metal elements at a rate far exceeding the soil environmental pollution standard [9]. The tailing field is the number one target requiring a restoration treatment by The Ministry of Environment of Korea [9]. In addition, many previous studies have reported heavy metal contamination of the tailings and soils in acid drainage from a mine area [52,53,54,55,56].

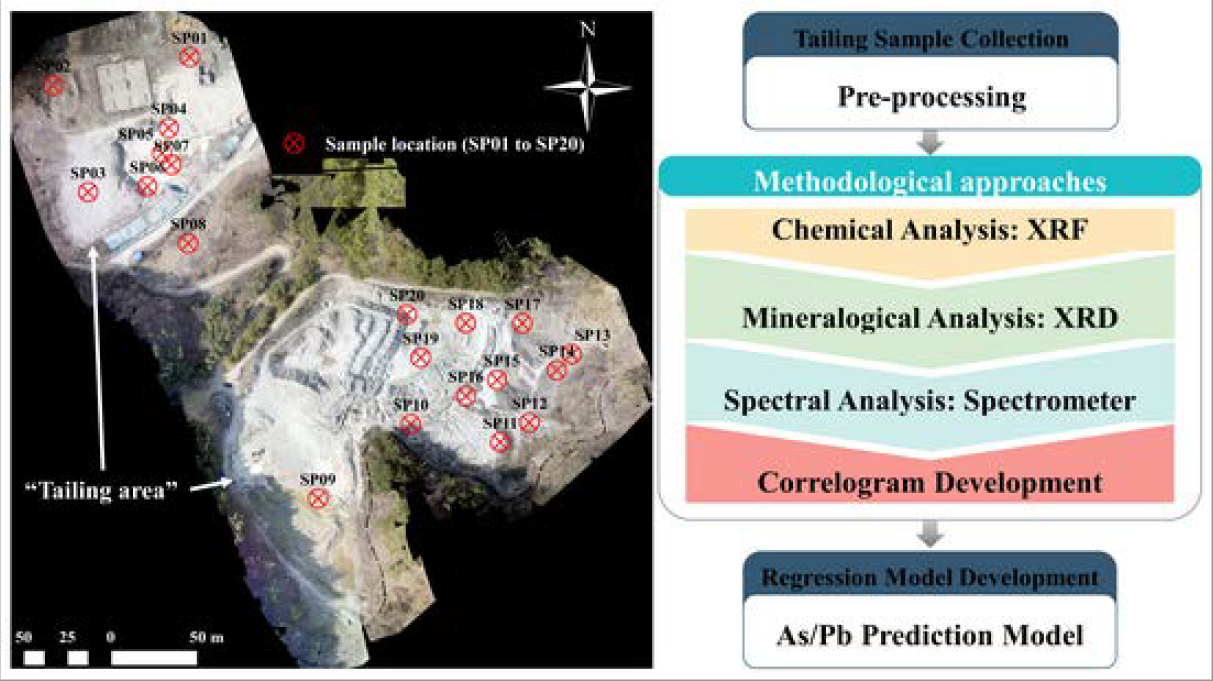
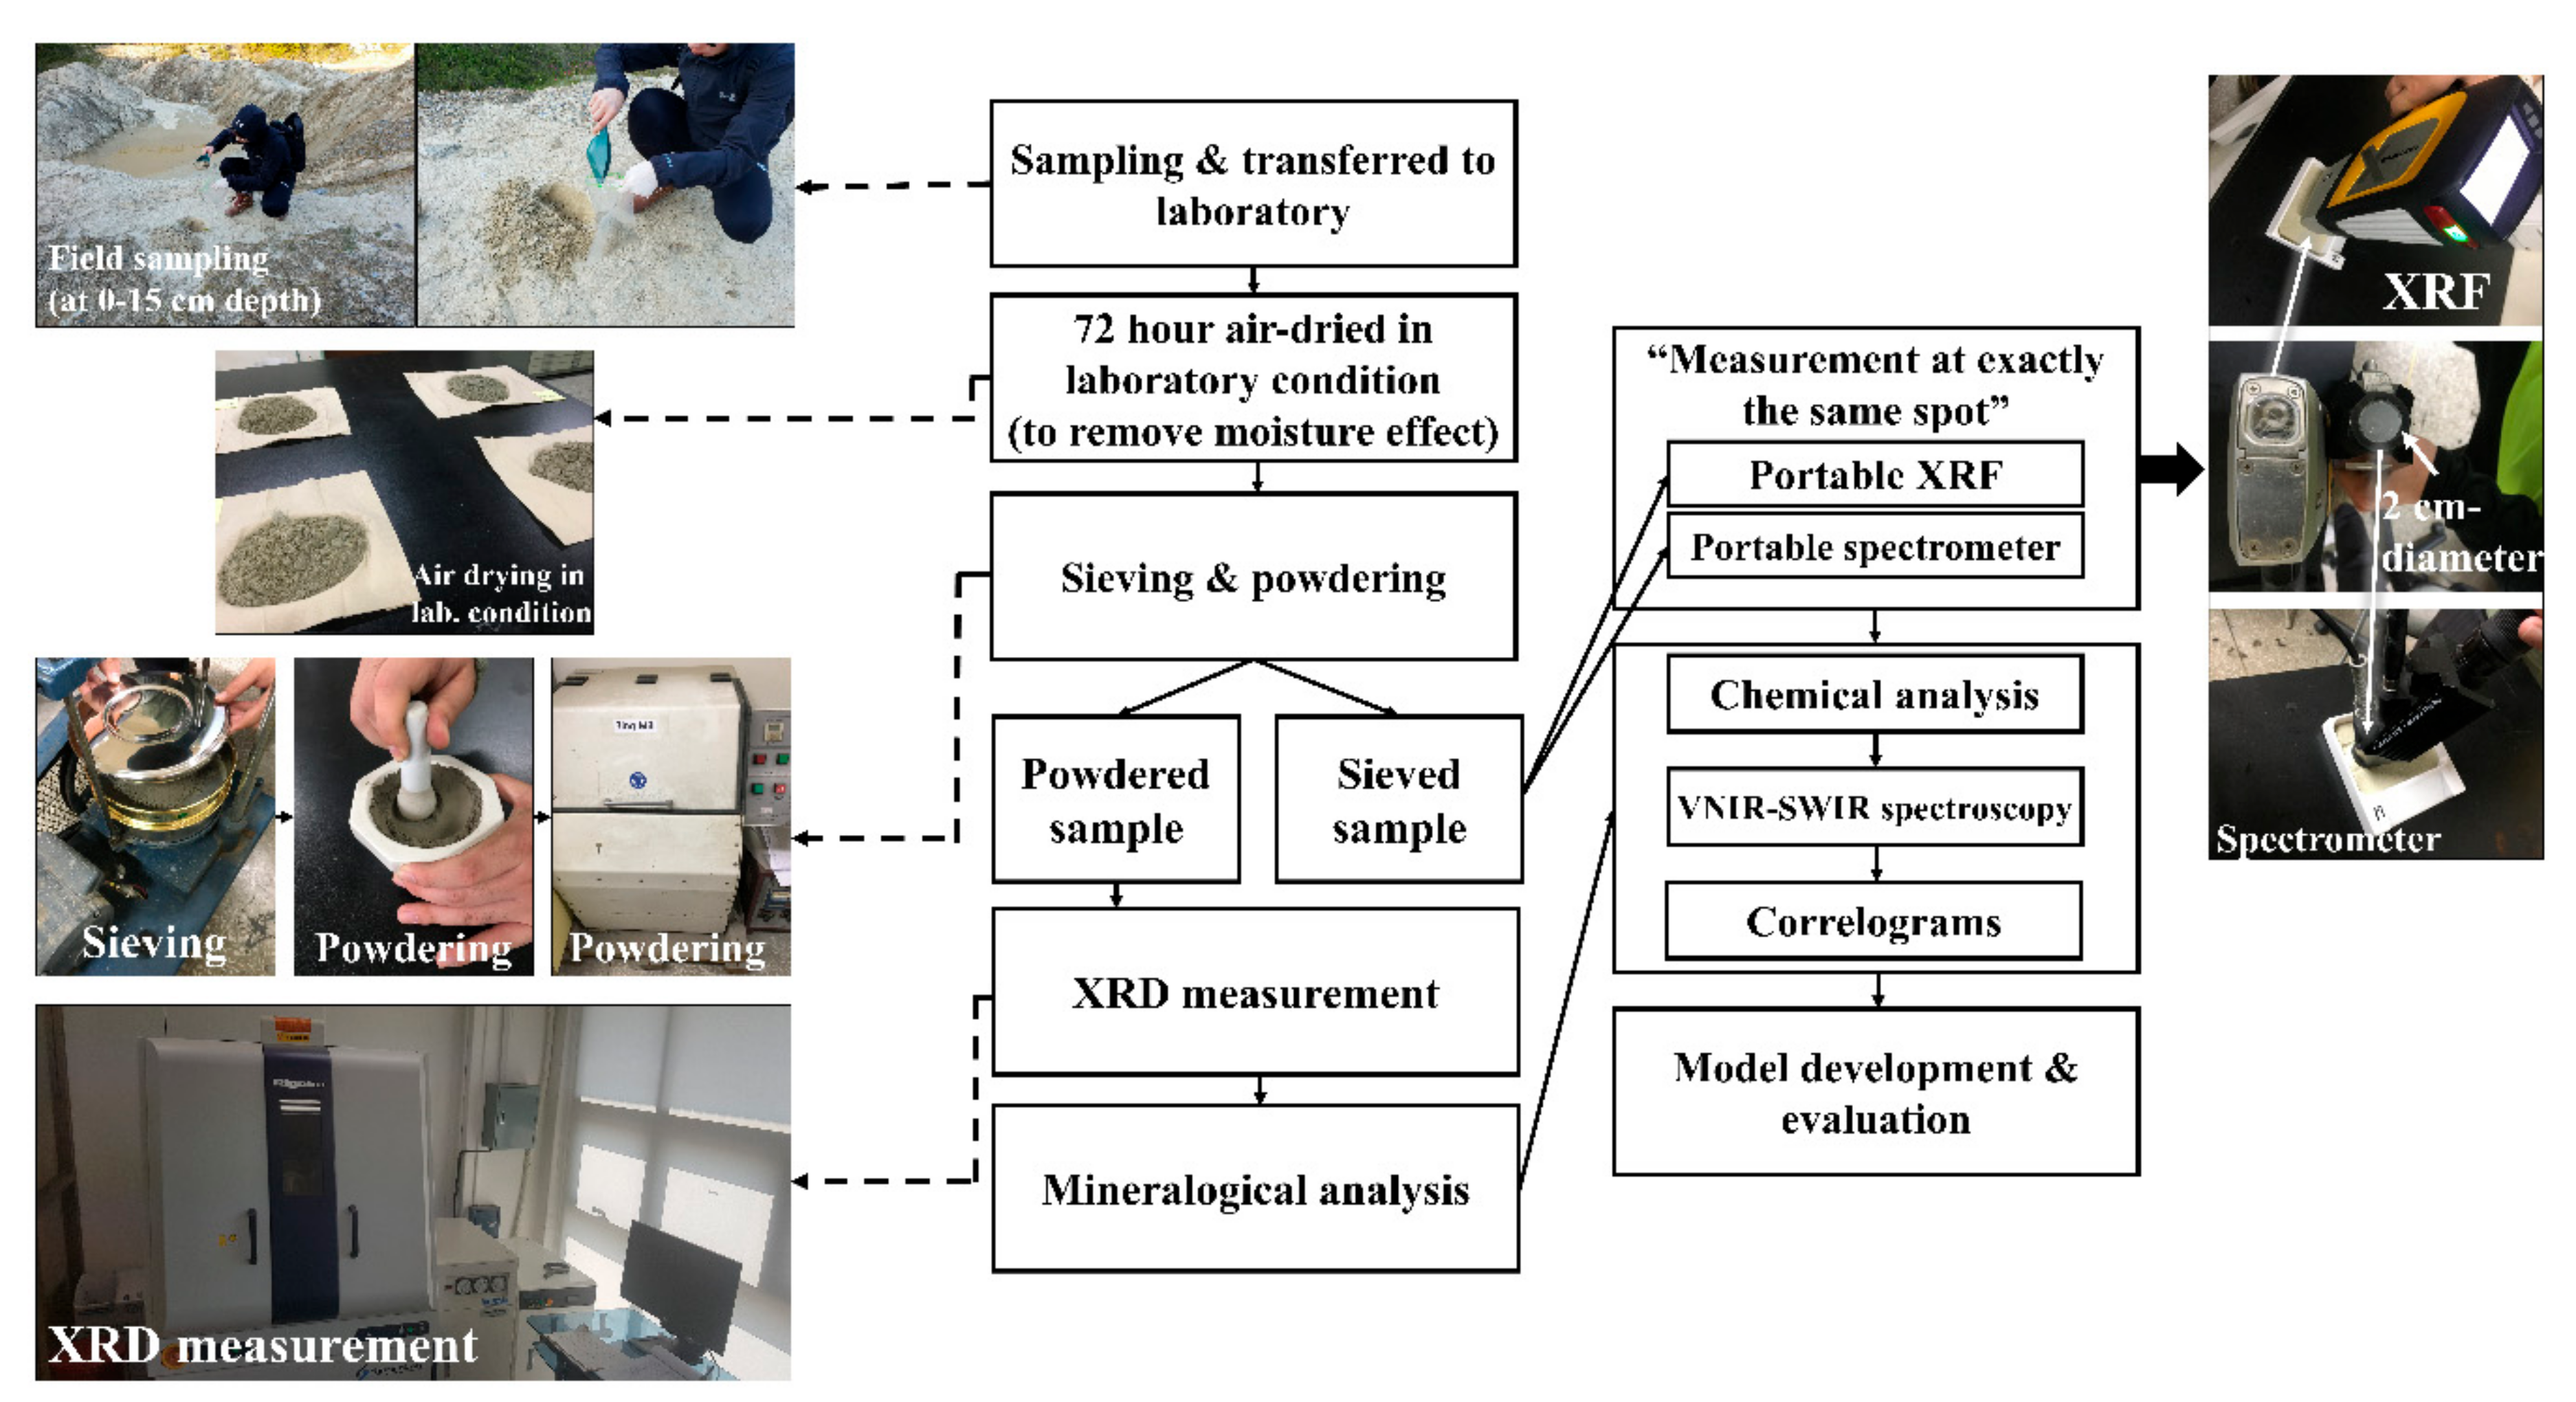
2.2. Sample Collection and Pre-Processing

A total number of 174 samples were collected from the 58 sample locations (3 random samples per 1 sample site) (Figure 1). The 58 sampling points (SP) of SP01 to SP58 were from the tailing dumps around mine facilities, including slag storages, mine debris, concentrator area, thickener, and pithead area and the bottom tailing field (Figure 1). The samples were collected at a depth of 0–15 cm from the surface to remove shallow and surface organic layers to remove possible effects from organic materials (Figure 2) [57]. The samples were contained in polyethylene bags and transported to the laboratory. The samples were dried in laboratory conditions for 72 h to remove moisture effect (Figure 2). The dried samples were sieved with 100 mesh diameter to exclude granule and bidirectional reflectance function effects (Figure 2). We used the preprocessed tailing samples for X-ray fluorescence (XRF) and spectral measurements (Figure 2). Furthermore, the sieved samples were powdered to conduct X-ray diffraction (XRD) analysis (Figure 2).

2.3. Chemical and Mineralogical Analysis

We measured the heavy metal concentration of preprocessed tailing samples with portable XRF (Figure 2). We used Innov-X delta professional portable XRF with 40kV beam condition and a resolution of <165 eV and measured heavy metal concentration of tailings including Cr, Ni, Cu, Zn, As, Cd, and Pb. The XRF limits of detection is 3 to 10 ppm for Cr, 4 to 10 ppm for Ni, 3 to 7 ppm for Cu, 2 to 5 ppm for Zn, 1 to 3 ppm for As, 8 to 15 ppm for Cd, and 2 to 4 ppm for Pb, respectively. Each measurement took 60 seconds and the average of three readings was used. The instrument was calibrated with a stainless steel 316 alloy chip at each measurement to retain consistent calibration.
XRD analysis was conducted to extract mineral composition of the samples (Figure 2). We used Rigaku Ultima IV X-ray diffractometer with Cu-K radiation (λ = 1.5406 Å) for the analysis. The XRD analysis was conducted for seven representative samples based on visual inspection and geographic distribution. We used Crystallographica Search Match 3 software with International Center for Diffraction Data (ICDD) PDF-2 2004 reference data for mineral identification.

2.4. Spectral Analysis

Spectral measurement was taken for the preprocessed tailing samples in laboratory conditions by Analytic Spectral Devices (ASD) Labspec 5100 portable spectrometer with a 3–6 nm spectral interval over the 350–2500 nm (visible-near infrared-shortwave infrared, VNIR-SWIR) region. First, we acquired the raw reflectance spectra with the contact probe from the preprocessed samples with a 2 cm-diameter aperture using a halogen light source (Figure 2) [5,40]. The spectrometer was calibrated with a Spectralon panel (LabSphere, Inc., North Sutton, NH, USA) coated by barium sulfate (BaSO4) before each spectral measurement. Because the aperture size of the portable XRF and spectrometer are almost identical, the measurements were made at exactly the same spot of a sample to obtain pairs of chemical and spectral readings that the spectral variation, by chemical compositions, can be allowed by direct comparison.
Second, the acquired raw reflectance spectra were processed into continuum-removed reflectance (CR hereafter) and first derivative reflectance (FDR hereafter) using a Savizky-Golay derivative filter with a second order polynomial fit [58]. CR can enhance absorption features where a higher intensity of an absorption can be expressed to a lower CR value than a smaller intensity of an absorption [58,59,60]. The FDR is efficient to improve the interfered background and overlapped spectra by reducing the analytical problem such as scattering, baseline shift, and anomalistic broad absorbing components [11,61]. The Savizky-Golay smoothing algorithm was applied to the FDR to remove noise [11]. Because an inappropriate number of smoothing points could introduce additional artifacts in its final output [11], we set the smoothing interval to 12 nm, based on the second-order polynomial method for the best smoothing effect.
Third, the VNIR-SWIR spectroscopy procedure was adopted to relate both the mineral composition and acquired spectra for minerals associated with the spectral characteristics of the tailings and spectral responses to the As and Pb concentrations. A mineral identification procedure based on spectral analysis involved a comparison of reference spectra and unknown sample spectra in terms of the wavelength position, intensity, and the shape of absorption features [16,20]. We manually selected candidate mineral spectra by using both raw reflectance and CR and extracted mineral information from unknown sample spectra [23,62]. We used the Spectral Geologist (TSG) 7.5 and ENVI 4.8 software for spectroscopic analysis. In addition, we referenced two mineral spectral libraries, United States Stated Geological Survey (USGS) spectral library version 6 to 7 and Jet Propulsion Laboratory (JPL) Advanced Spaceborne Thermal Emission and Reflection Radiometer (ASTER) spectral library version 2.0 [63,64,65]. Finally, we used the spectral measurements to develop correlograms and prediction models for heavy metal contamination (Figure 2).

2.5. Model Development and Evaluation

First, we selected the most responsive wavelength to heavy metal concentration in tailings from the three correlograms, showing the correlations between a concentration of heavy metal elements and their corresponding raw reflectance, CR, and FDR, respectively. The candidate wavebands are those with the square of correlation coefficient (r2) greater than 0.5.
The sample spectra were divided into calibration and test datasets. Out of the 174 sample spectra, 116 were used as the calibration set and 58 for the test set, which were selected by using a random sampling method. The stepwise multiple linear regression (SMLR) method was used to develop the prediction models based on the relationship between the heavy metal concentration and spectral values of calibration set [11,66]. The SMLR method selects the best variables by adding and subtracting variables to the model and uses t-test and F-test to evaluate model performance [67]. We set the confidence interval of 95% (p < 0.05) for the model significance test. This method has been proven effective for estimation of heavy metal contamination in soils [5,11,68,69,70].
To evaluate the performance of the empirical equations derived from the calibration model, we used the coefficient of determination (R2), standard error (SE), and p-value for the constant (b0) and coefficients (bn). The models were then evaluated with the test set based on the R2, RMSE, and slope with a 95% confidence limit [28]. The Statistical Package for the Social Sciences (SPSS) Statistics was used for statistical analysis.

3. Results

3.1. Heavy Metal Concentration and Mineral Composition

The XRF results show that concentration of Cr, Ni, Zn, As, Cd, Zn, and Pb of tailing samples exceeded the standard of soil pollution reference (Table 1). Specifically, Cr, As, and Cd showed a mean value exceeding ~30 to 120 times of the standard (Table 1).
The XRD analysis revealed mineral composition of the tailings. The mineral composition extracted from the samples could be categorized into gangue, rock-forming, and alteration minerals (Table 2). In the results, quartz, muscovite, phlogopite (subgroup of biotite), clinochlore (subgroup of chlorite), illite, and montmorillonite were detected in most of the samples (Table 2). Quartz was the most dominant mineral crushed during the mining process from gangue and/or rock-forming minerals from quartz vein and host rock in the study area [50,51] (Table 2). Calcite originated from calcite vein, being a gangue mineral [50,51]. Albite and muscovite could be regarded as representative rock-forming minerals from the host rock [50,51]. Furthermore, phlogopite, dolomite, and clay minerals (clinochlore, illite, montmorillonite, and vermiculite) were found in all the samples, reported as major hydrothermal alteration minerals [50,51] (Table 2).

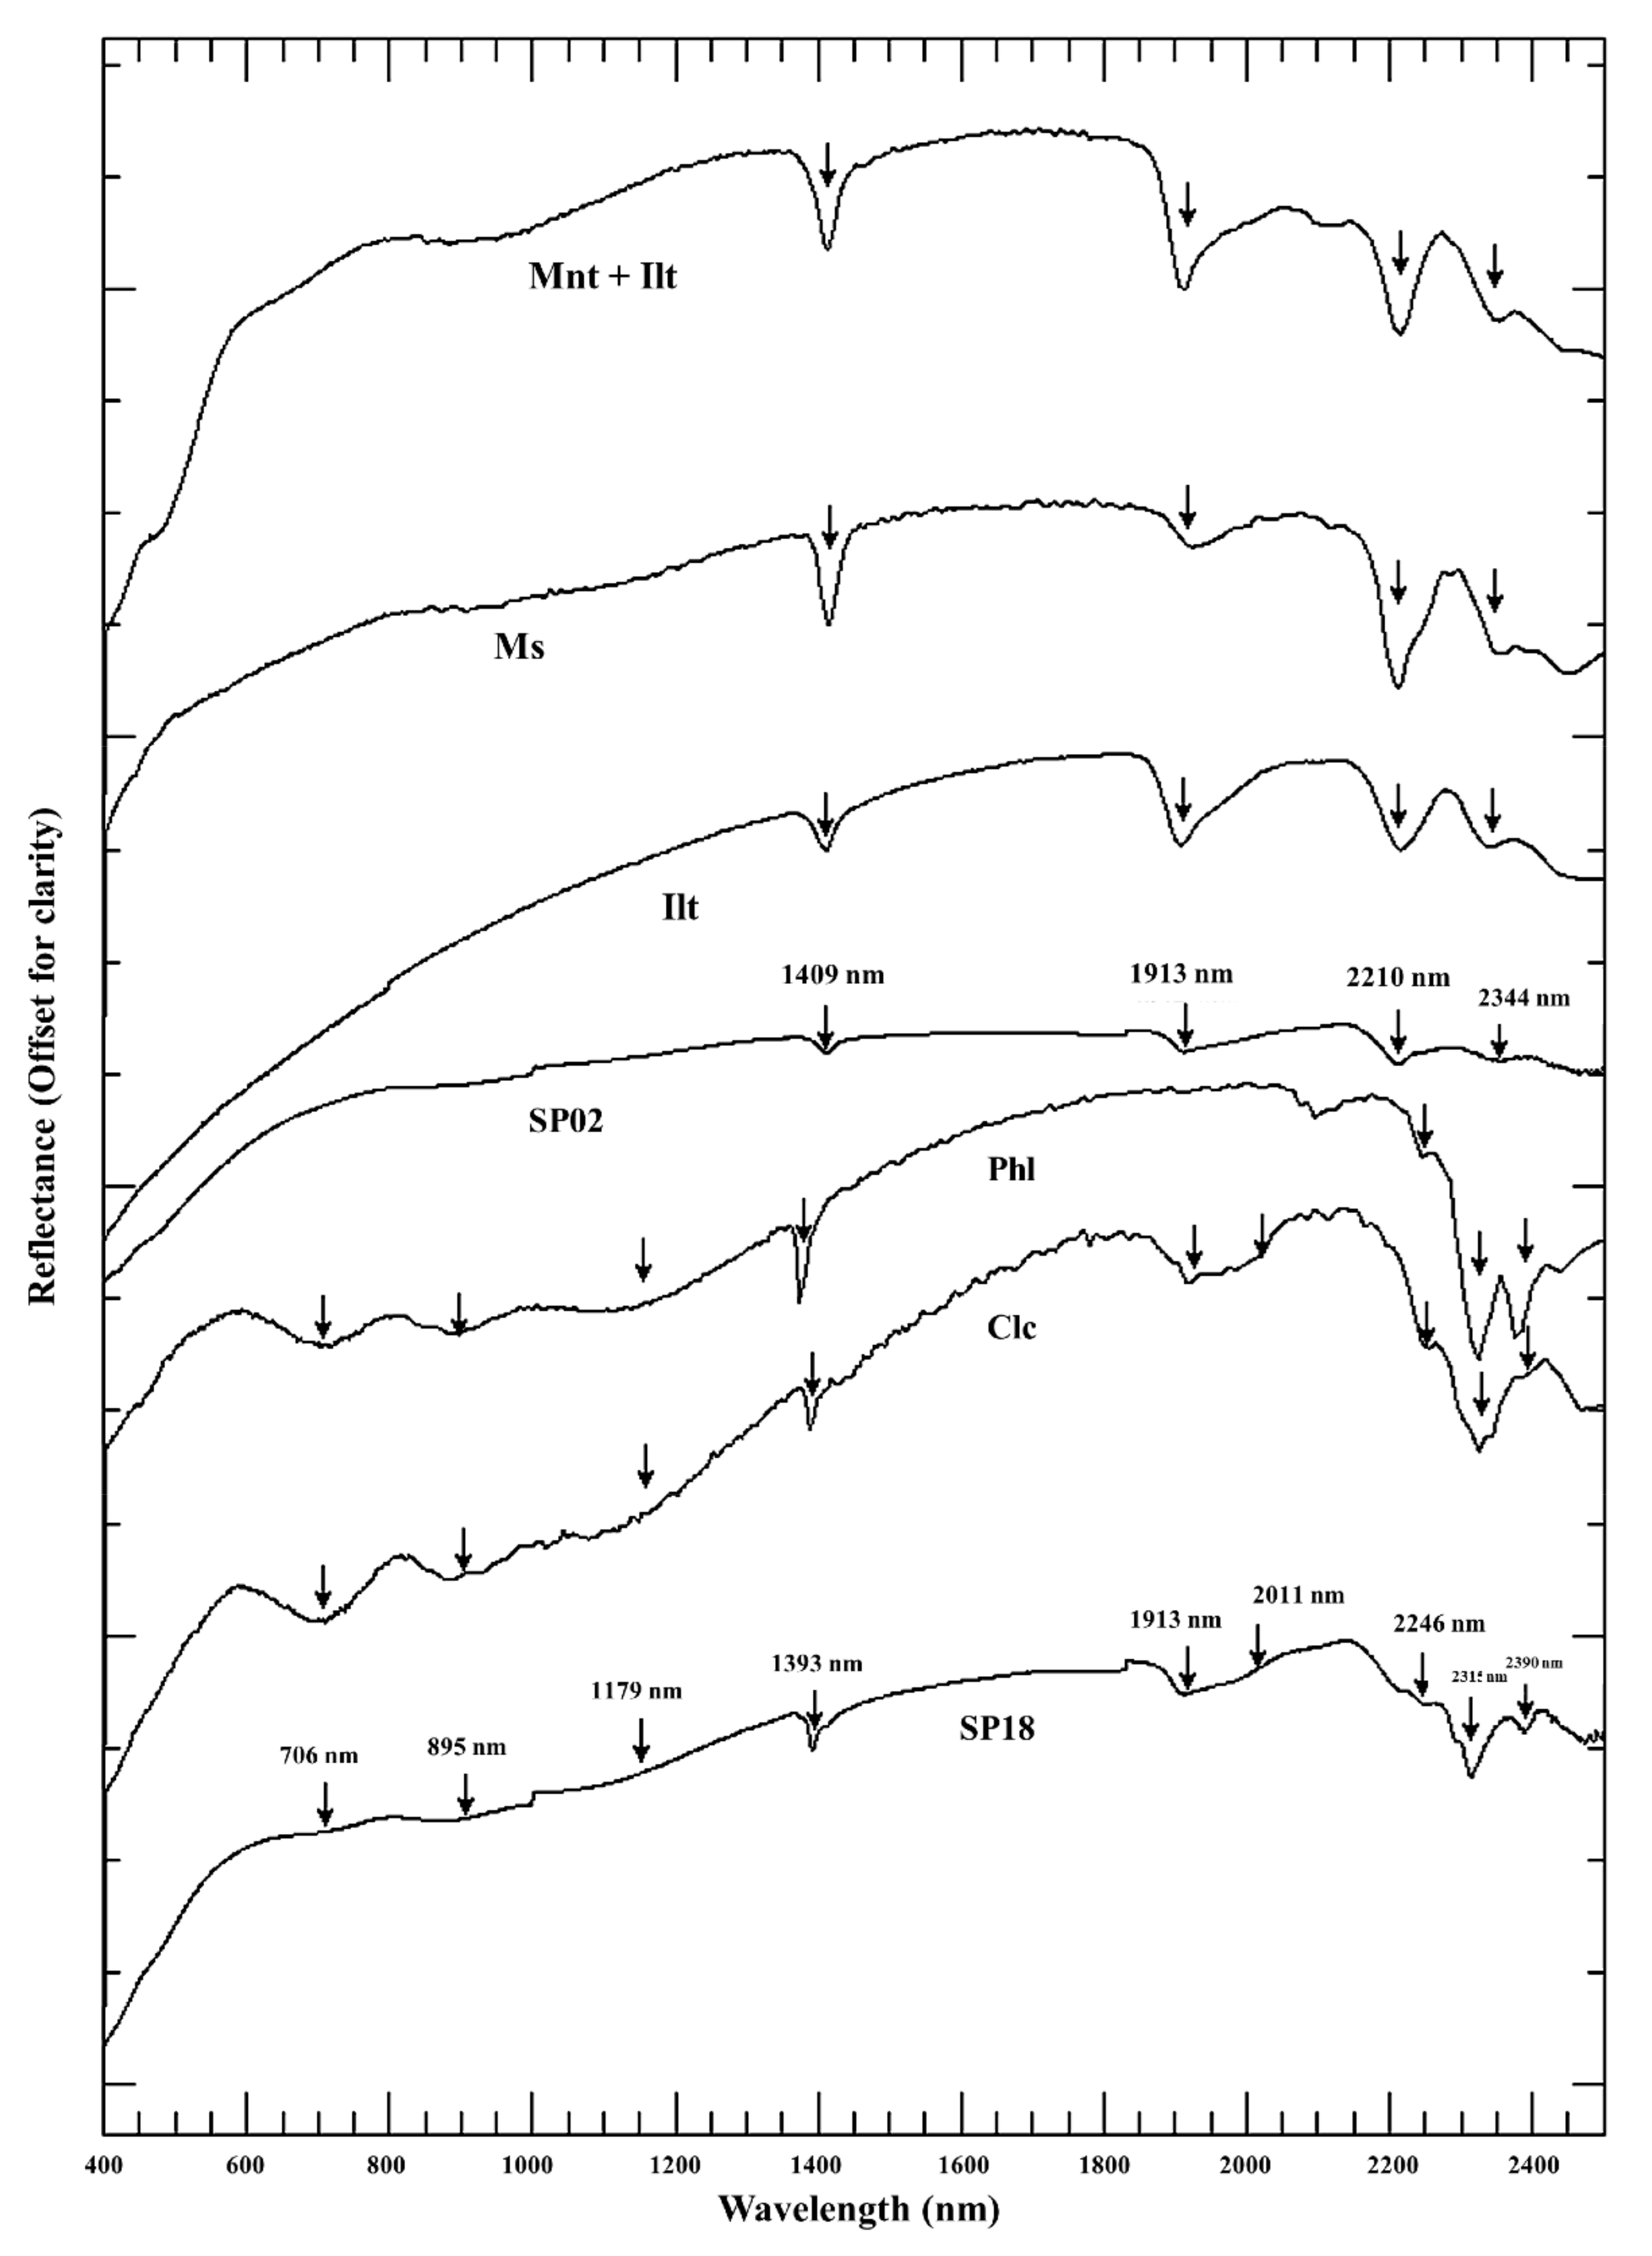
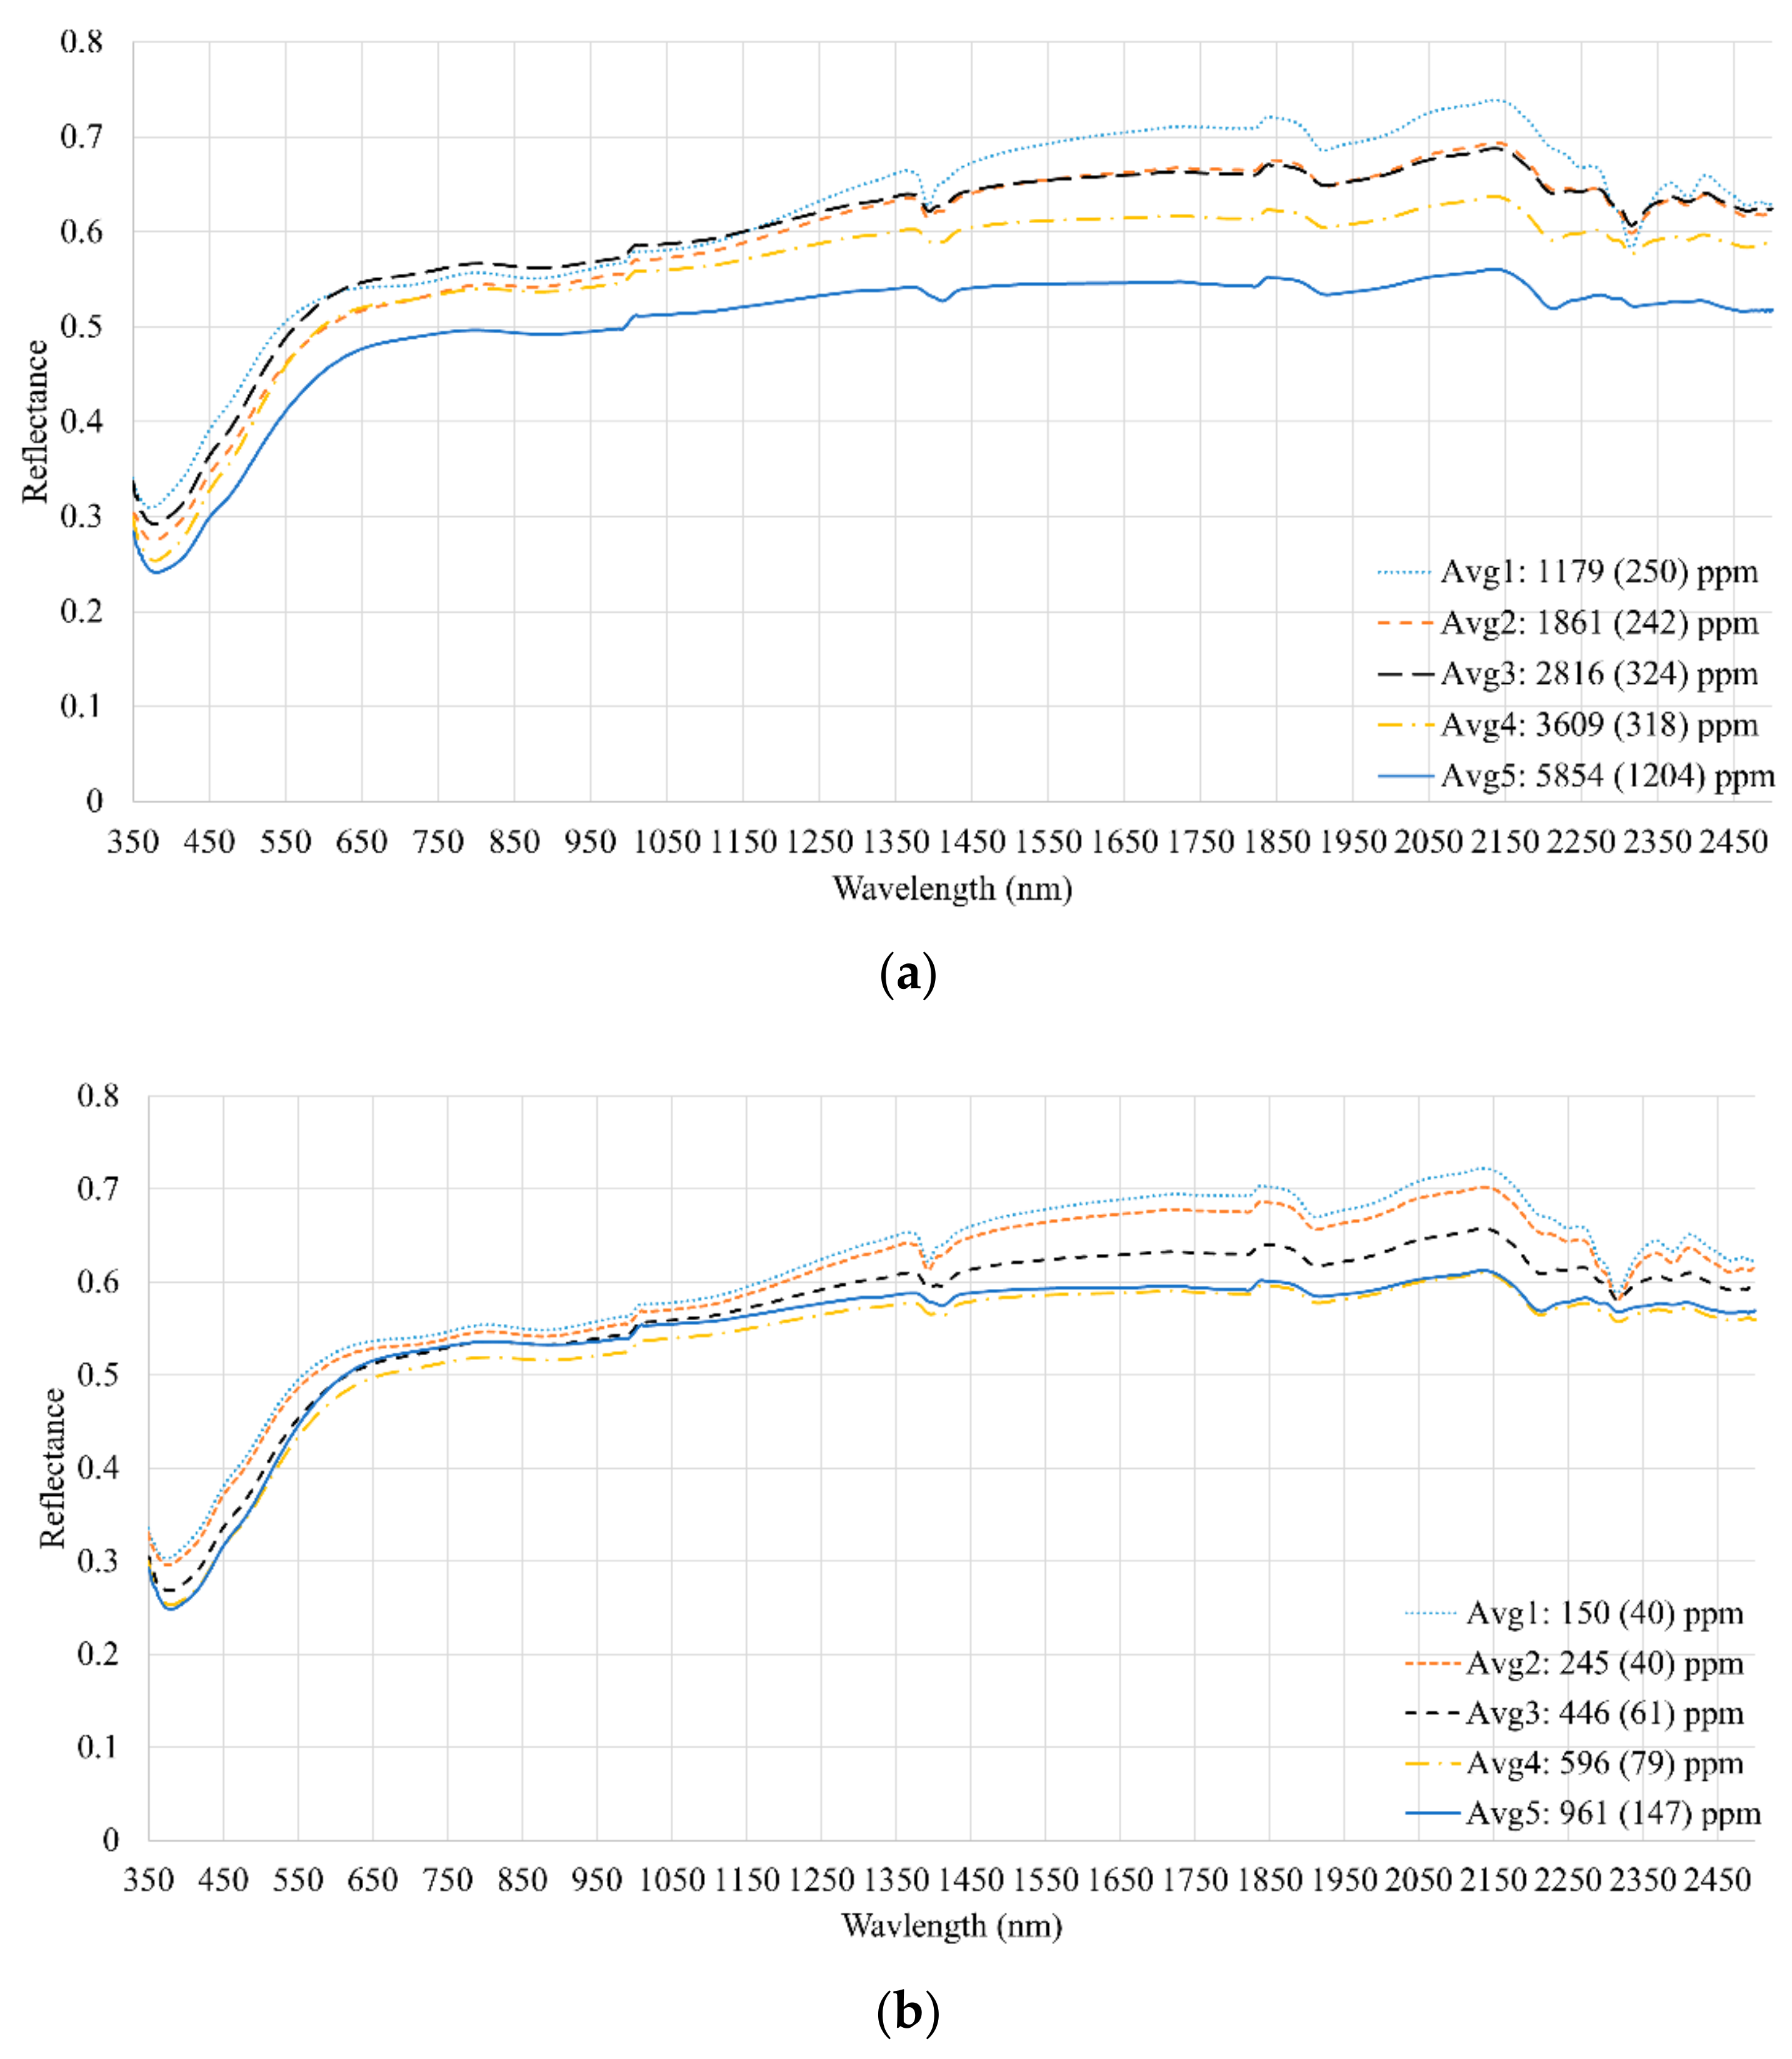
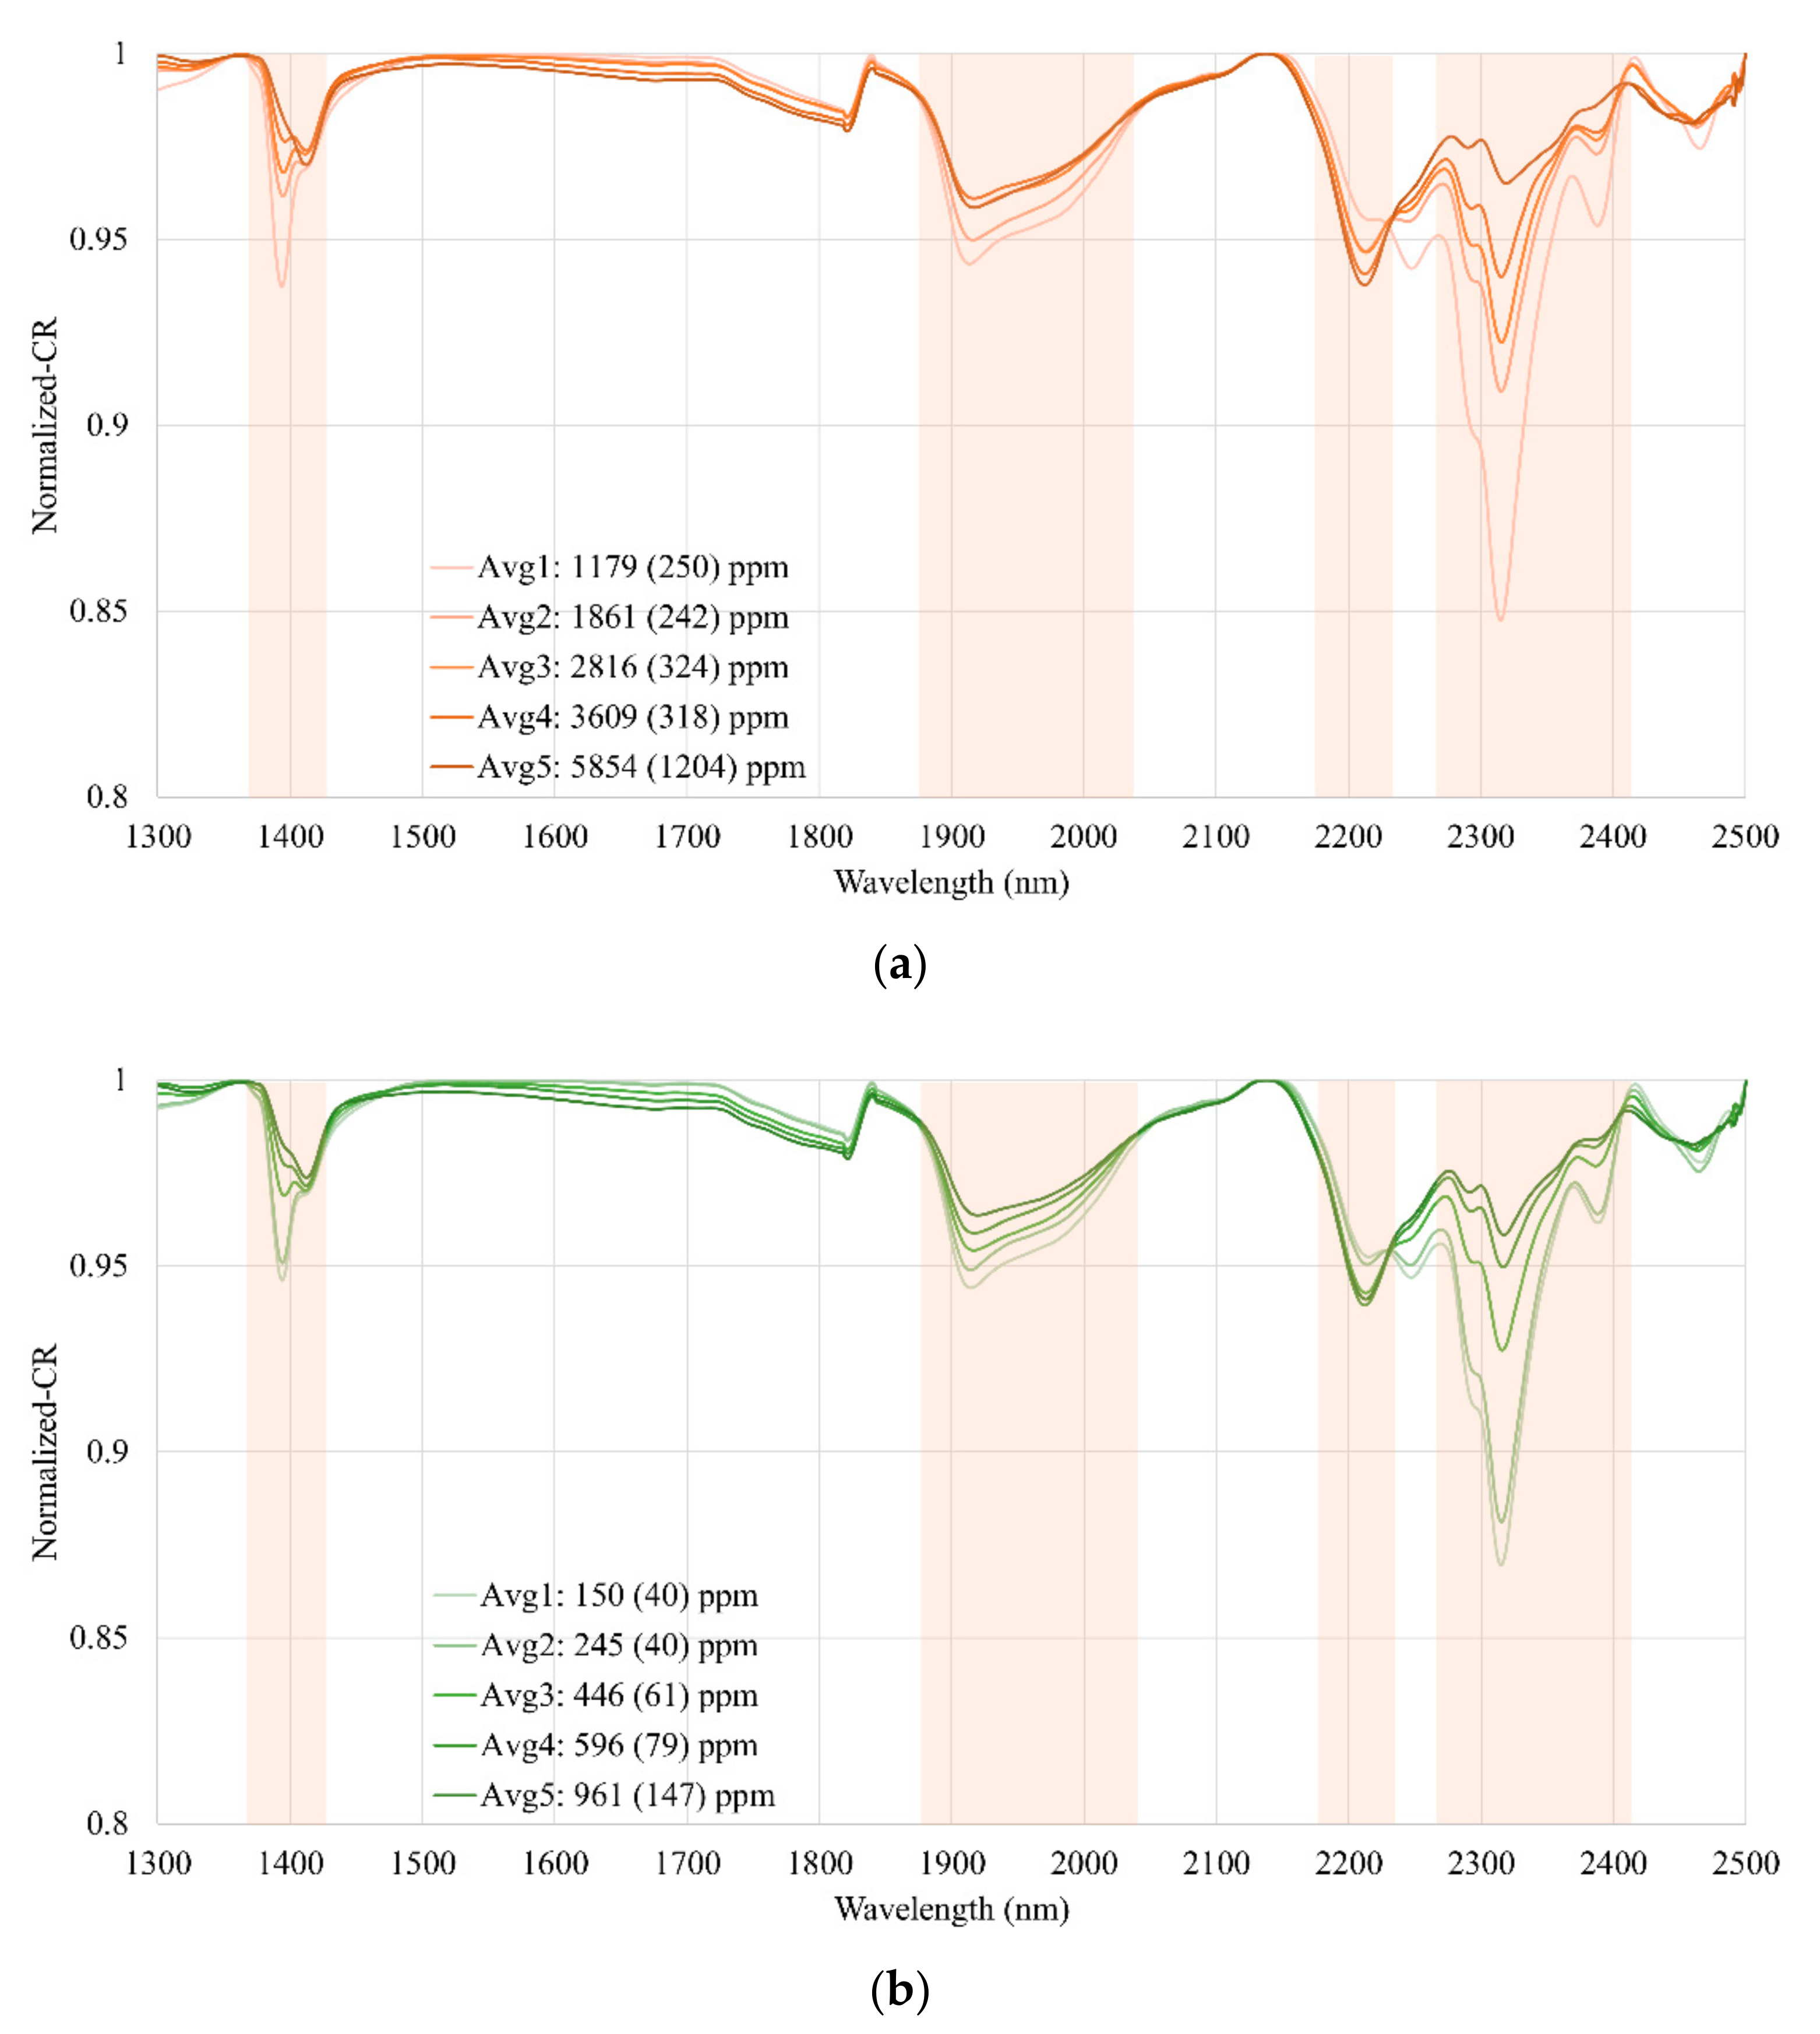
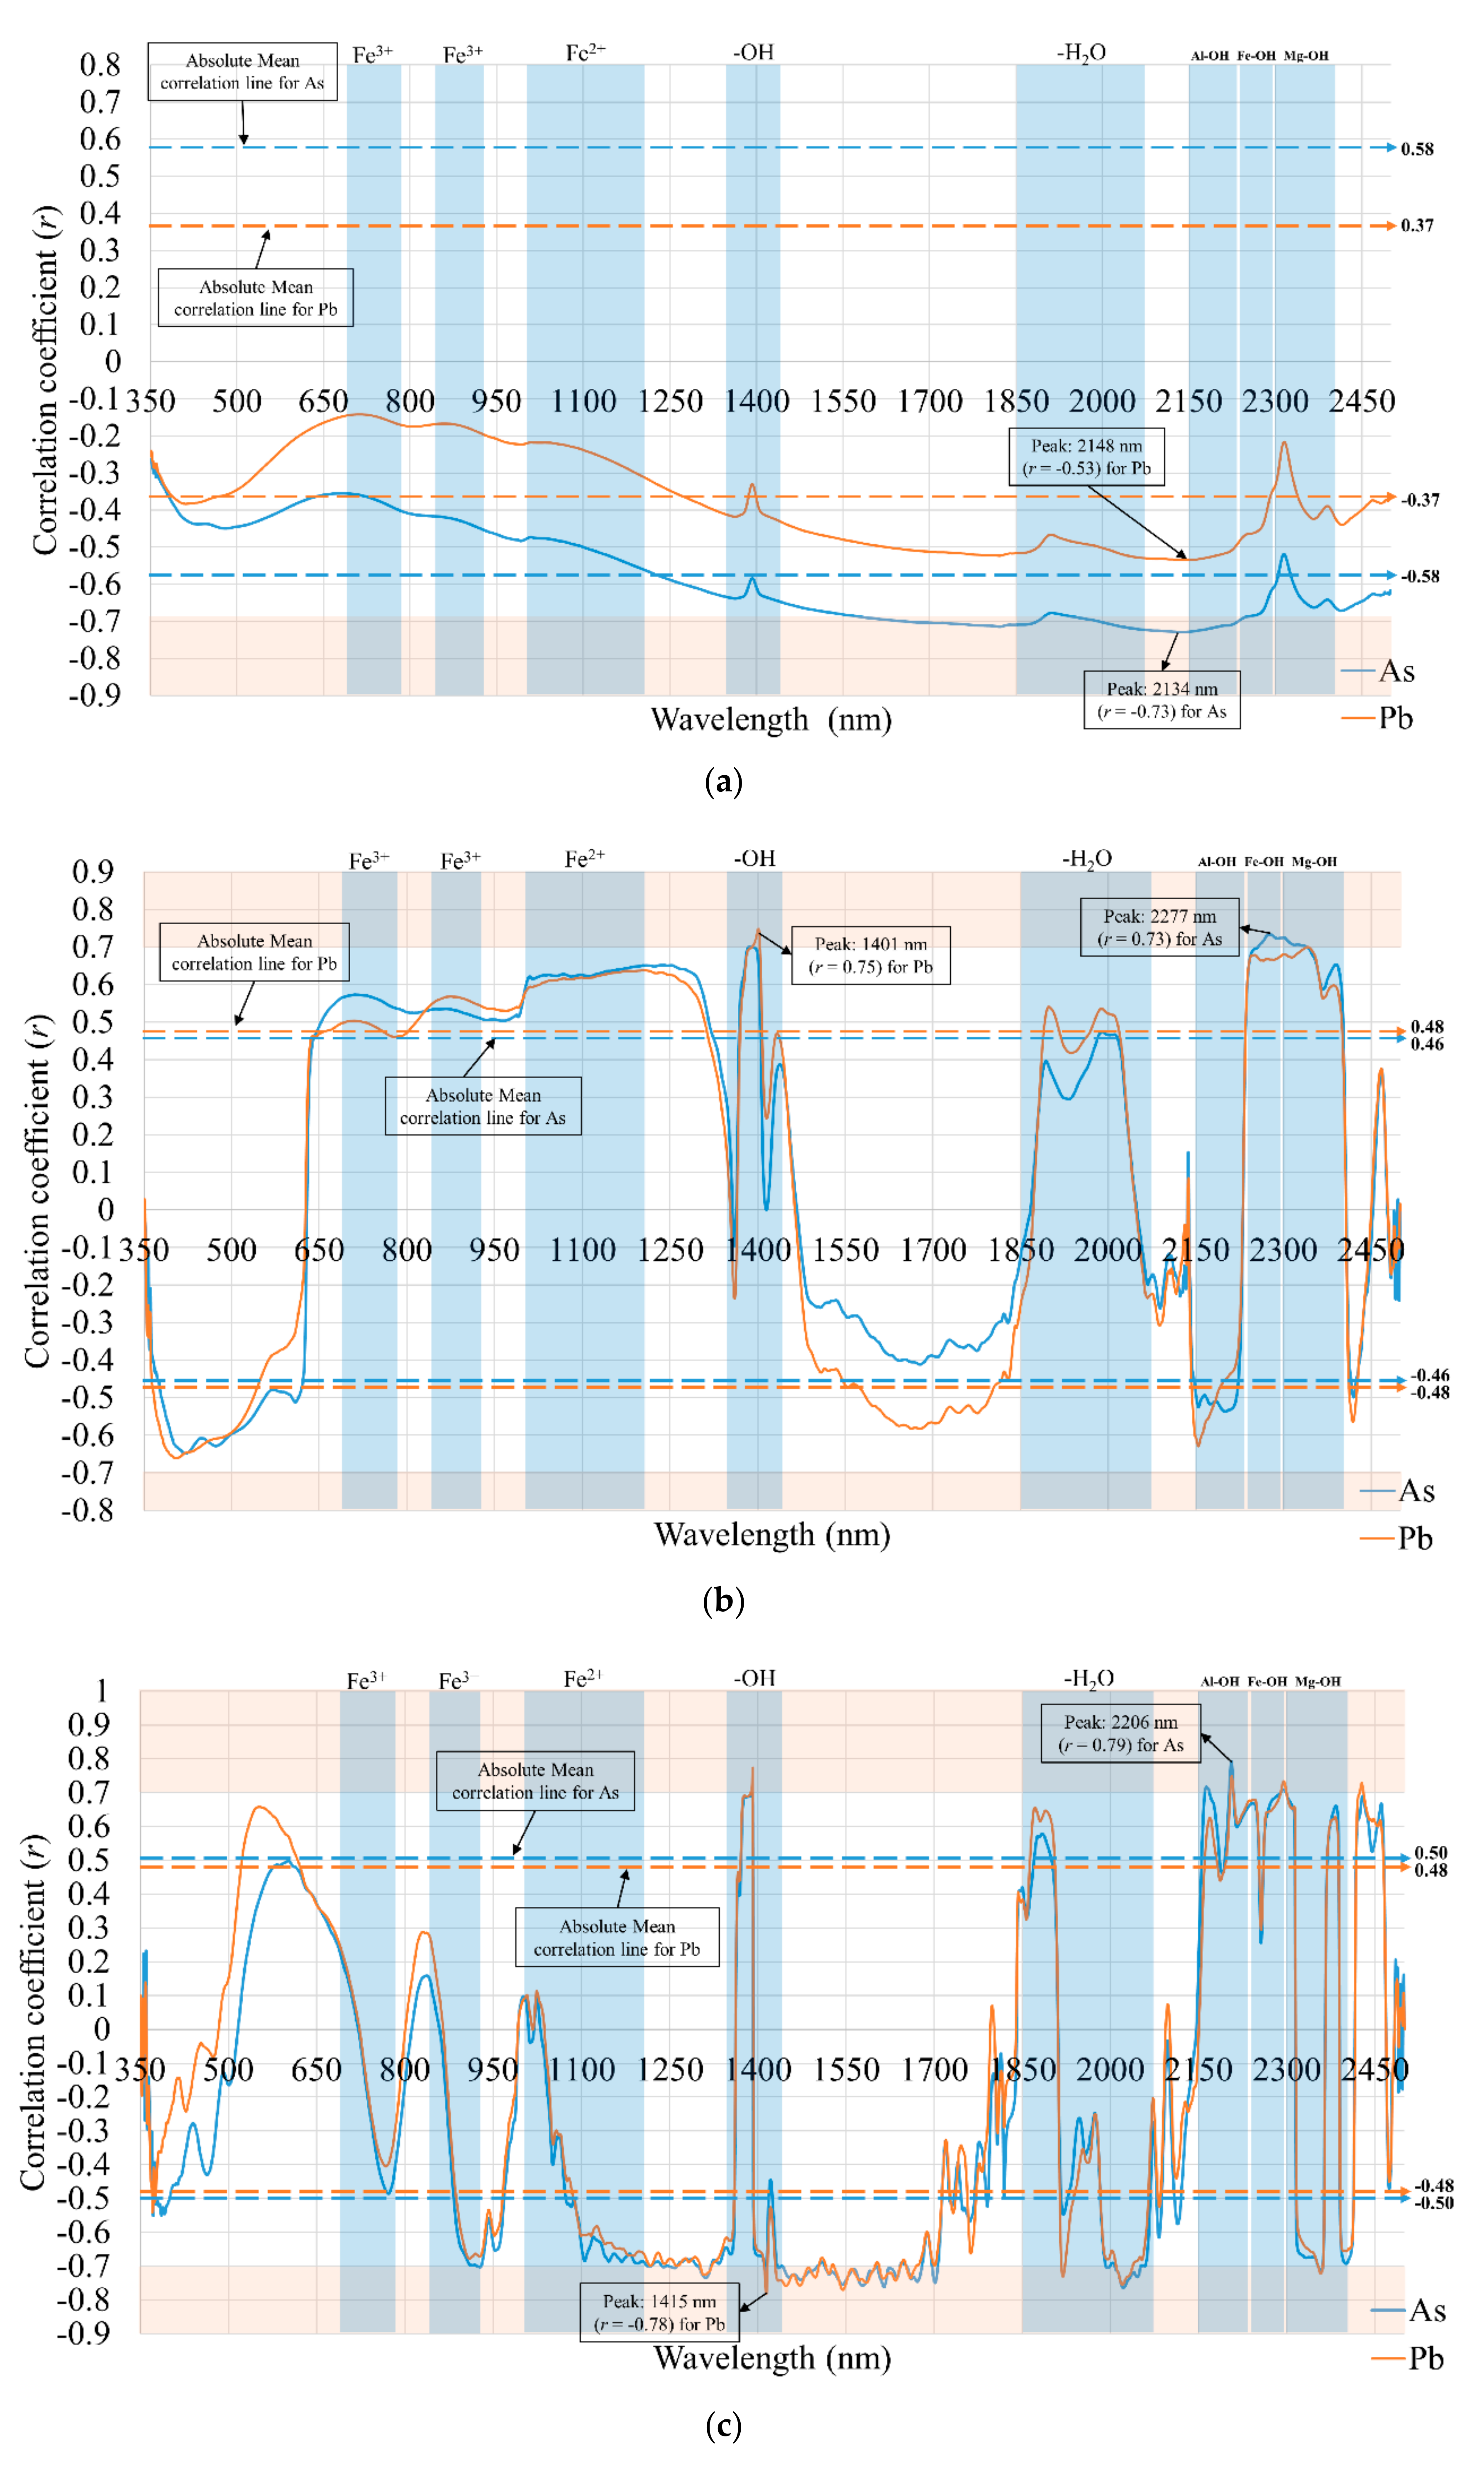
3.2. VNIR-SWIR Spectral Characteristics and Spectroscopy

We found that the spectral signatures of the tailings were mainly associated with hydrothermal alteration minerals and can be represented by two different types (Figure 3). SP18 showed distinctive absorption features of phlogopite and clinochlore, and broad features by ferrous and ferric irons (Fe3+ and Fe2+), –OH absorption, water (H2O) absorption, Fe-OH absorption, and Mg-OH doublet absorptions (Figure 3, Table 3) [26,27,62,72,73]. SP02 showed spectral characteristics associated with montrmorillonite, illite, and muscovite with distinctive absorptions at ~1400, ~1900, ~2200, and ~2350 nm (Figure 3, Table 3).
We analyzed the spectral characteristics of tailing samples associated with heavy metal concentration in the VNIR-SWIR region. To analyze spectral responses regarding heavy metal concentration, the samples were grouped in five heavy metal concentration levels and their average spectra were calculated. Among the heavy metal elements, we found that raw reflectance intensity generally decreased with increasing As and Pb contents, except for the concentration level 3 of As and level 5 of Pb (Figure 4). In the SWIR region (~1400 to 2500 nm), the change of raw reflectance with the As and Pb concentration levels were more consistent (Figure 4). It indicates that the SWIR region would be more effective in understanding the spectral response associated with As and Pb concentration.
Considering the absorption depth calculated by CR, we found a systematic decrease of absorption depth at ~1400, ~1900 to 2000, and ~2300 to 2400 nm with increase in As and Pb concentration (Figure 5). Different from other absorptions, absorption depth of ~2200 nm increased with As and Pb concentration. In general, absorption depth is related to the amount of chemical component responsible for the absorptions, and it infers that chemical components of –OH, H2O, and Mg-OH were consumed with increase in As and Pb in the tailings.

Wavelength Selection

In order to select the best wavelengths to develop prediction models of As and Pb concentration in the tailings, we constructed correlograms showing the correlation between raw reflectance, CR, and FDR of tailing spectra and As/Pb concentrations (Figure 6). The result showed that CR and FDR of the tailing spectra have a higher correlation than the raw reflectance with As/Pb concentrations, although overall patterns of correlation distribution were similar (Figure 6). The average absolute correlation coefficient for raw reflectance was 0.58 for As and 0.37 for Pb, and that of preprocessed CR and FDR was higher for Pb and lower for As than raw reflectance (Figure 6). However, the variance between the average absolute correlation coefficient and peak correlation value was significantly higher for preprocessed CR and FDR than raw reflectance, which identifies spectral bands sensitive to As and Pb concentrations more effectively.
We found relatively high correlations (|r| > 0.7) between raw reflectance/CR and As/Pb concentrations at –OH, H2O, Al-OH, Fe-OH, and Mg-OH absorption positions. The highest correlation coefficient between raw reflectance and As concentration was observed at 2134 nm with r = −0.73 for As, where it is related to the near region of Al-OH absorption position (Figure 6). The peak of correlation coefficients between CR and As/Pb concentrations were distributed at 1401 nm with r = 0.75 for Pb and 2277 nm with r = 0.73 for As, where the absorptions of –OH and Fe-OH were located (Figure 6). The correlation between FDR and As/Pb concentrations showed more variation, and high correlation coefficients were found at both absorption-related positions and non-absorption related positions. High correlations (|r| > 0.7) related to the absorption features were located at the absorptions of Fe3+, Fe2+, -OH, H2O, Al-OH, Fe-OH, and Mg-OH. The wavelengths of ~1250 to 1300 and ~1500 to 1700 nm had high correlations, although there were no absorption features (Figure 6). The strongest correlation coefficient between FDR and Pb was detected at 1415 nm with r = −0.78, and that of As was 2206 nm with r = 0.79. Those positions were absorption features of –OH and Al-OH, respectively (Figure 6).
Based on the coefficient analysis, we selected the wavelength positions with r2 > 0.5 for the development of prediction models for As/Pb concentrations in the tailings.

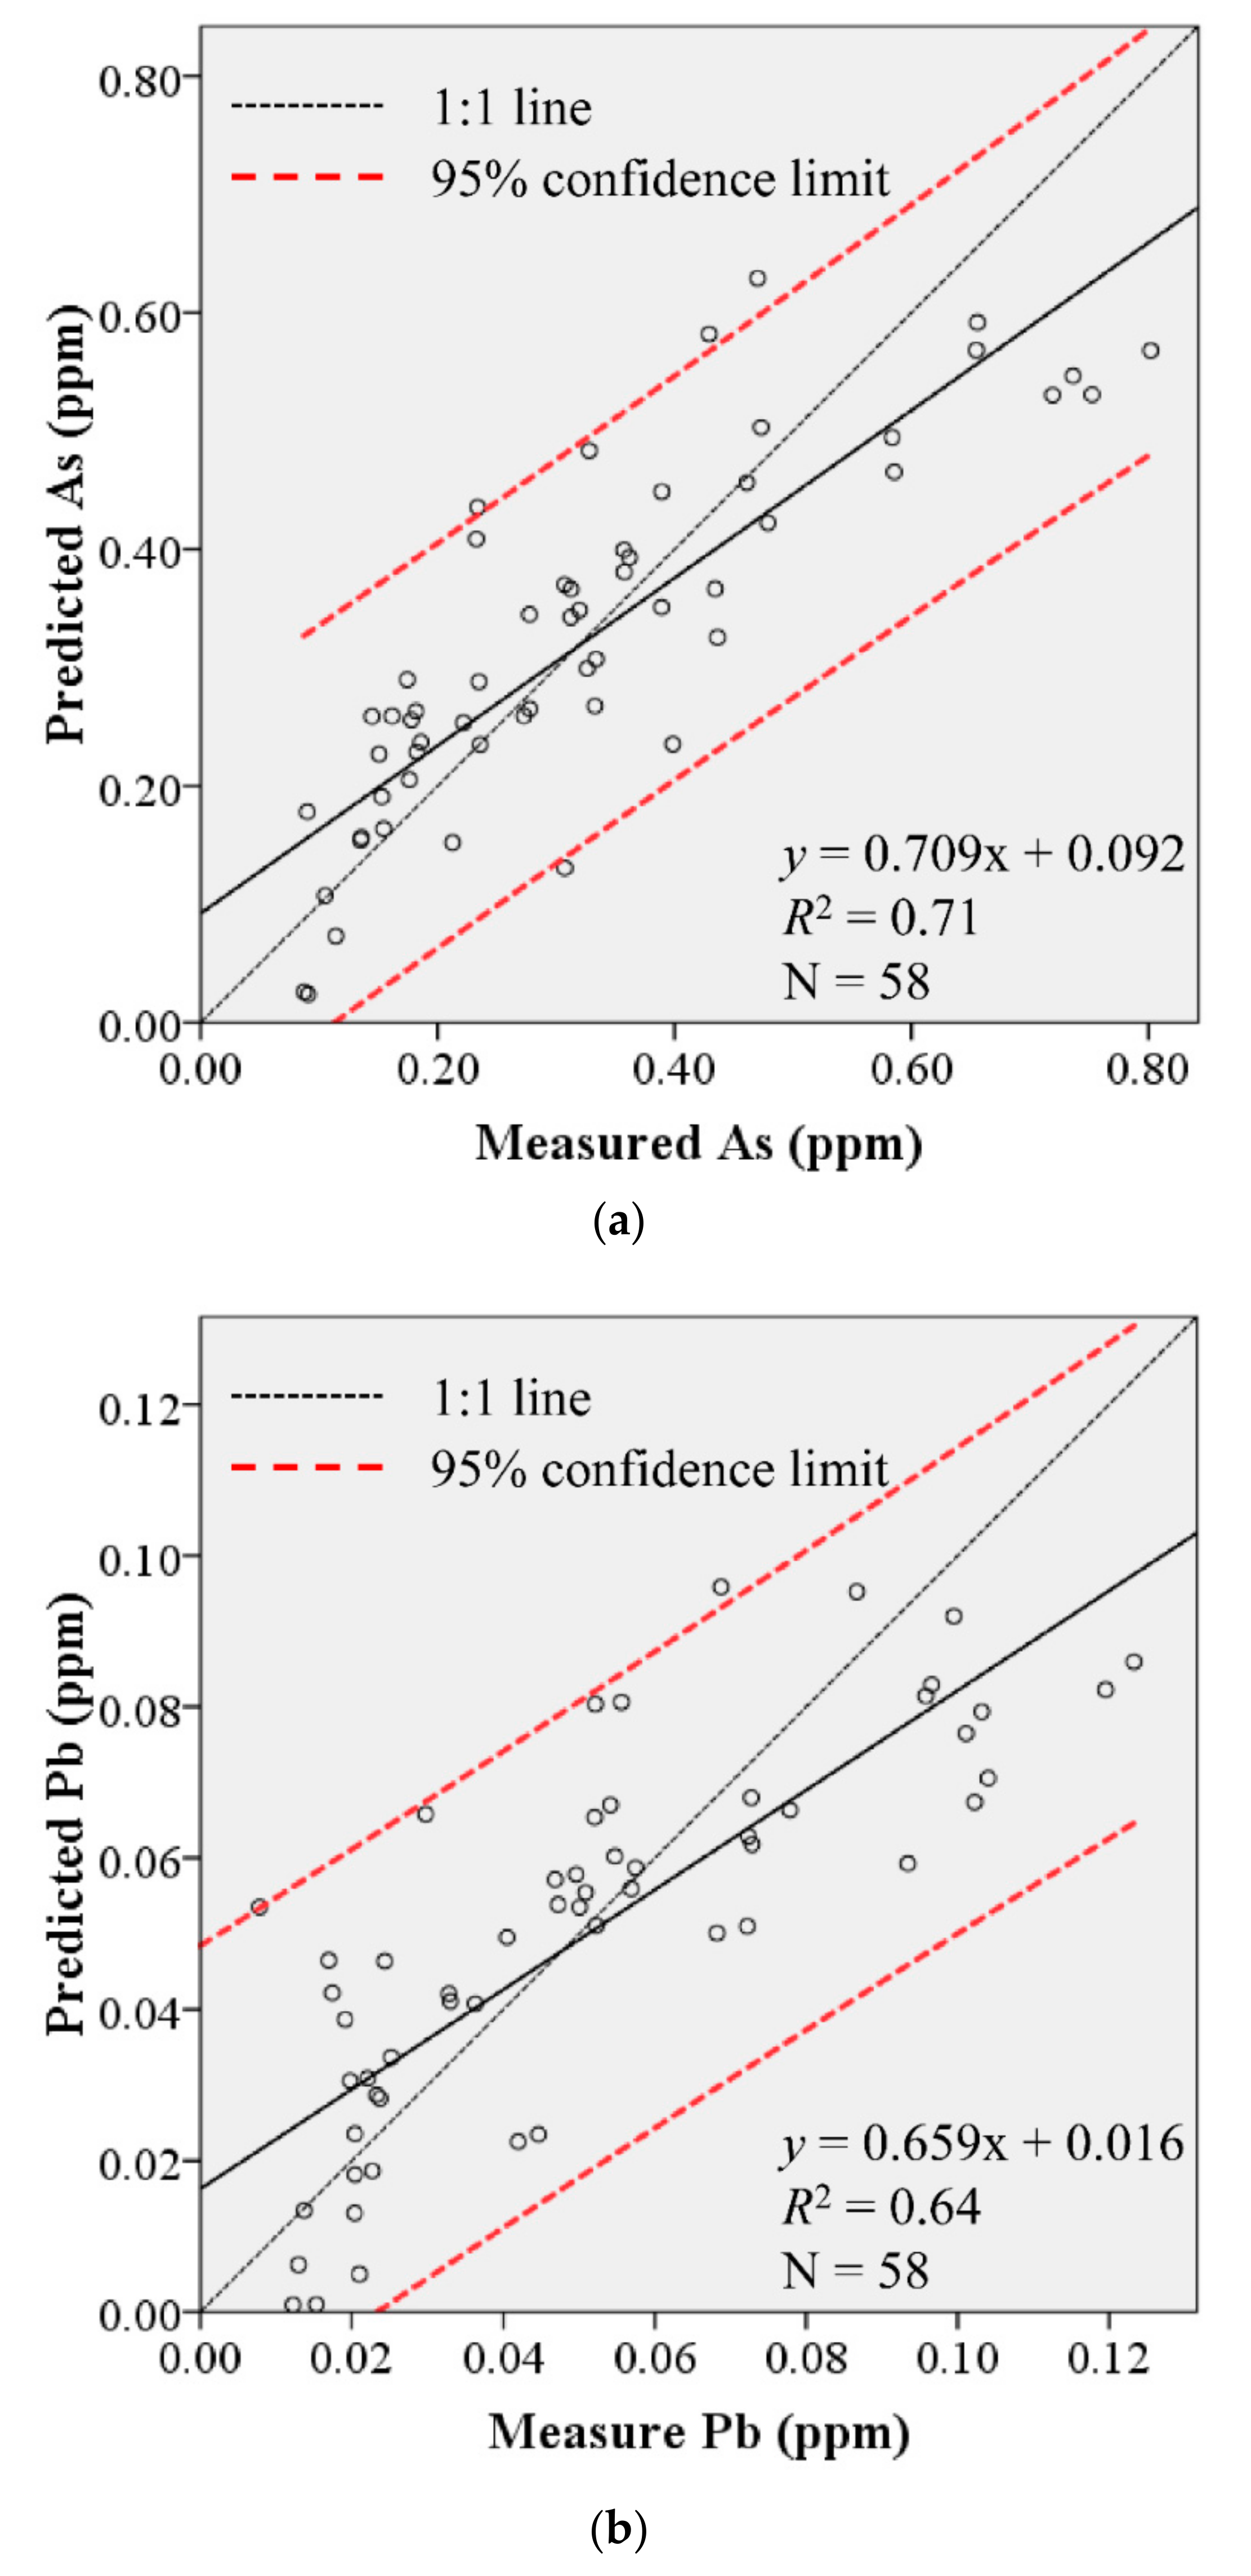
3.3. Prediction Models and Evaluations

3.3.1. Development of Stepwise Multiple Linear Regression Models

Based on the SMLR models applied to the selected wavelength positions including raw reflectance, CR and FDR, the prediction models for As and Pb concentration in the tailings were derived:
Asp = 1.291 + (643.059 × FDR2206) + (785.727 × FDR2161) − (371.206 × FDR2361)
Pbp = 0.187 − (181.951 × FDR1414) + (118.476 × FDR2205)
where, Asp, and Pbp = predicted heavy metal contents for As, and Pb, respectively; FDRwavelegnth = first derivative reflectance value at 2206, 2161, 2361, 1414, and 2205 nm, respectively.
The models statistically rejected a null-hypothesis (H0: regression model is unsuitable to explain a relationship between dependent (As and Pb contents) and independent (selected wavelengths) variables), based on its p-value for all cases at a 95% significance level (Table 4). Coefficients of determination (adj-R2 in this case) were 0.714 for As and 0.646 for Pb (Table 5). The variance inflation factor (VIF) and Durbin-Watson values ranged from 2.276 to 4.430 and 1.137 to 1.173, respectively (Table 5). The prediction models for As and Pb statistically rejected the null-hypothesis (H0: β = 0) at significance level of 95% (p-value) (Table 5). Those statistical values mentioned above showed that the prediction models would be statistically suitable to make an acceptable estimation of heavy metal concentrations.

3.3.2. Model Evaluations

We tested the prediction models developed by the SMLR method by calculating the RMSE from the test set. The RMSE of calibration set (RMSEc) was 0.095 for As and 0.018 for Pb concentrations (Table 5). The models showed adequate accuracy, while the error range for As concentration was relatively larger than the Pb concentration. The RMSE of test set (RMSEv) suggests that the prediction model for As and Pb efficiently predicted the concentration with an error range of 0.099 and 0.019 (Table 5). In addition, the evaluation models assessed the measured and predicted concentrations, and the results showed a statistical significance with acceptable R2 and slope ranges (Figure 7).

4. Discussion

We investigated the spectral response of tailings to heavy metal concentration produced by mining activities. The ore deposit is a hydrothermal fissure filling ore deposit developed in the metasedimentary host rock. The tailing was seriously contaminated with Cr, Ni, Zn, As, Cd, Zn, and Pb (Table 1). The tailings are mainly composed of quartz and albite as a major minerals and muscovite, phlogopite, calcite, dolomite, clinochlore, illite, vermiculite, and montmorillonite as secondary minerals (Table 2). Geologically, the major minerals originated from parent rocks and quartz vein, while the secondary minerals are considered as a by-product of hydrothermal alteration. Notably, those secondary minerals, especially phlogopite and clinochlore, are not commonly found in general soils. This shows a distinctive difference in mineral composition between tailings and general soils.
The spectroscopic characteristics of the tailings showed a decreasing trend in overall raw reflectance with an increase in As and Pb contents (Figure 4). This pattern was also recognized from the heavy metal contaminated soils in metal mine areas [5]. The tailing spectra were mainly associated with spectral features of secondary minerals, such as phlogopite, clinochlore, muscovite, illite, and montmorillonite (Figure 3, Table 3). To figure out the spectral difference between the tailings and standard soil, we compared the averaged tailing spectrum and standard soil spectrum from JPL spectral library (Figure 8) [65]. Comparing the spectra of standard soil, the spectral characteristics of this tailings showed more absorptions in Fe3+/Fe2+ and Al-OH, and additional absorptions of Fe-OH and Mg-OH promoted by hydrothermal alteration minerals (Figure 8) [5]. This result coincides with the distinctive difference in mineral composition between tailings and soils. It infers that spectral characteristics are affected by geochemical processes.
Moreover, we found that the spectral response of tailings is different from heavy metal contaminated soils based on the comparative analysis between the tailing spectra and soil spectra from previous studies. The previous studies reported systematic adsorptions of heavy metal elements by clay minerals, resulting in a decrease in absorption depth of clays with increase in heavy metal concentration [5,40]. Different from the previous studies, a positive correlation between an absorption depth of 2200 nm and As and Pb concentration was observed (Figure 5). Given the fact that absorptions at 2200 nm are usually associated with clay minerals such as illite and smectite, it is highly possible that the geochemical behavior responsible for spectral response to heavy metal concentration in the tailings is different from that in soils. However, systematic geochemical modeling such as a tailing model would be necessary to quantify this phenomenon. Excluding the minerals associated with absorption in 2200 nm, the spectral response associated with the As and Pb concentration in the tailings is related to phlogopite and clinochlore, the hydrothermal alteration minerals.
The As and Pb showed statistically significant correlation with spectral features in the correlograms (Figure 6). The overall patterns of correlations between As/Pb concentration and CR/FDR correlograms were very similar in all spectral range. Given the fact that CR and FDR are spectral features closely related to absorption features, it indicates that the spectral response of As and Pb associated with absorption features is alike in the tailings (Figure 6). The highly correlated spectral bands included the reflectance absorption positions related to Fe3+, Fe2+, –OH, H2O, Al-OH, Fe-OH, and Mg-OH in CR- and FDR-based correlograms (Figure 6). It may provide an indirect evidence of geochemical components responsible for chemical adsorption of As and Pb chemical components responsible for the absorption bands. It is well known that As and Pb are strongly adsorbed to clay minerals in general soils by cation exchange capacity (CEC), metal-cation sorption property (in 2:1 sheet structure), and replaceable ion substitution [3,31,74,75,76,77]. It concludes that the correlation between As and Pb concentration and spectral response was mainly caused by hydrothermal alteration minerals in this study such as clinochlore. However, further study is required to confirm this phenomenon with systematic geochemical experiment, which is out of the scope of this study.
Moreover, the raw reflectance-based correlogram of As and Pb in the tailings showed a distinctive difference from previous studies that focused on heavy metal concentration in soils. While [5] reported high correlation between As and Pb concentration and reflectance in the VNIR region, which is highly related to Fe-oxides, we found the high correlation in the SWIR region (Figure 6). It may be interpreted as a geochemical process associated with soil formation and tailing production. In general, soils are formed by the weathering processes associated with oxidation and the products produce Fe/Mn oxide as well as clay minerals. However, different from soil process, tailings are mainly produced by mechanical process such as crushing and grinding, causing artificial fine particles of minerals originated from wall rock, gangue minerals, ore minerals and alteration minerals. As a result, the color and composition of soils and tailings are different, and therefore chemical components participating in the adsorption reactions with heavy metal elements are different. The spectral response of As and Pb concentration in this study informed that different formation mechanisms of tailing and soil may cause difference in spectral characteristics.
In addition, the prediction models constructed by the SMLR method selected 2206, 2161, and 2361 nm for As and 1414 and 2205 nm for Pb, with statistical significance (R2 = 0.7 for As and Pb) and adequate error range (RMSEV = 0.099 and 0.019 for As and Pb) (Figure 7, Table 5). Previous studies on heavy metal contaminated soils associated with mining activity selected 500 and 610 nm for Pb and 778, 1344, and 2200 nm for As, where the band selection is different from this study [39,40,78]. We think this difference in band selection is associated with adsorption preference of As and Pb to Fe-oxides (e.g., goethite, jarosite, and hematite) compared to other heavy metal elements [6]. Again, this phenomenon can also explain the difference in mineral composition where soils contain significantly more amount of iron oxide minerals [39,40,78].
We defined the spectral characteristics of tailings in an Au-Ag hydrothermal ore deposit and spectral response of the tailings associated with As and Pb concentration. The spectral signature of the tailings introduced in this study revealed that geological settings such as formation process and mineral composition are the major control factors of spectral characteristics. Moreover, the difference in geological settings between soils and tailings is responsible for spectral response to the heavy metal concentration. In a similar geological setting, our prediction model of tailing sites’ heavy metal concentration can accurately estimate the spatial distribution of heavy metal from spectral data.

5. Conclusions

We investigated spectral responses of As and Pb contaminated tailings from a hydrothermal gold mine. The tailing was seriously contaminated with heavy metal elements and its minerals composition was composed of rock forming minerals, gangue minerals, and alteration minerals. We found rare minerals in tailings such as phlogopite and clinochlore in the samples. The spectral characteristics of tailings is mainly manifested by hydrothermal alteration minerals while that of the non-contaminated soils is from clay minerals originated from weathering process. The spectral difference of tailings from the standard soils was more absorptions in Fe3+/Fe2+ and Al-OH, and additional absorptions of Fe-OH and Mg-OH of hydrothermal alteration minerals. The SWIR raw reflectance of tailing spectra decreased and the systematic decrease of absorption depth associated absorption features of –OH, H2O, and Mg-OH was observed with an increase in As and Pb concentration. Different from the soil spectra, the absorption depth of 2200 nm indicating Al-OH absorption increased with increasing As and Pb contents. This indicates that the spectral response to heavy metal concentration in the tailings is different from that in soils. The sensitive spectral bands regarding As and Pb concentration in tailings are associated with absorption positions of hydrothermal alteration minerals. The prediction models of As and Pb concentration were constructed using spectral bands of 2206, 2161, 2361, 1414, and 2205 nm, and all models were statistically significant with R2 = 0.7 and RMSEV = 0.099 and 0.019 for As and Pb. We found that the difference in geological settings such as formation process and mineral composition between soils and tailings was responsible for spectral response to the heavy metal concentration. This research is a fundamental work and pilot study using remote sensing technology to map heavy metal concentration in tailing sites.

Author Contributions

Conceptualization, J.Y. and Y.J.; Methodology, J.Y. and Y.J.; Software, Y.J.; Validation, J.Y., J.H.S. and L.W.; Formal Analysis, Y.J.; Investigation, J.Y., Y.J. and L.W.; Resources, Y.J.; Data Curation, Y.J. and J.H.S.; Writing-Original Draft Preparation, Y.J. and J.Y.; Writing-Review & Editing, L.W.; Visualization, Y.J. and J.H.S.; Supervision, J.Y.; Project Administration, J.Y.; Funding Acquisition, J.Y.

Funding

This study was supported by the National Research Foundation of Korea (NRF) grant funded by the Korea government, grant number [NRF-2017R1D1A1A02018524] and [NRF-2018R1A4A1059956].

Acknowledgments

The authors deeply appreciate anonymous academic editor and reviewers for their constructive comments.

Conflicts of Interest

The authors declare no conflict of interest.

References

  1. Thornton, I. Soil contamination in urban areas. Palaeogeogr. Palaeoclimatol. Palaeoecol. 1990, 82, 121–140. [Google Scholar] [CrossRef]
  2. Xian, X.; Shokohifard, G.I. Effect of pH on chemical forms and plant availability of cadmium, zinc, and lead in polluted soils. Water Air Soil Pollut. 1989, 45, 265–273. [Google Scholar] [CrossRef]
  3. Smedley, P.L.; Kinniburgh, D. A review of the source, behaviour and distribution of arsenic in natural waters. Appl. Geochem. 2002, 17, 517–568. [Google Scholar] [CrossRef]
  4. Rashed, M.N. Monitoring of contaminated toxic and heavy metals, from mine tailings through age accumulation, in soil and some wild plants at southeast Egypt. J. Hazard. Mater. 2010, 178, 739–746. [Google Scholar] [CrossRef] [PubMed]
  5. Kemper, T.; Sommer, S. Estimate of heavy metal contamination in soils after a mining accident using reflectance spectroscopy. Environ. Sci. Technol. 2002, 36, 2742–2747. [Google Scholar] [CrossRef] [PubMed]
  6. Alloway, B.J. Sources of heavy metals and metalloids in soils. In Heavy Metals in Soils; Springer: Dordrecht, The Netherlands, 2013; Volume 22, pp. 11–50. ISBN 978-94-007-4469-1. [Google Scholar]
  7. Wetzel, M.A.; Wahrendorf, D.-S.; Peter, C. Sediment pollution in the Elbe estuary and its potential toxicity at different trophic levels. Sci. Total Environ. 2013, 449, 199–207. [Google Scholar] [CrossRef] [PubMed]
  8. USEPA. Proven Alternatives for Aboveground Treatment of Arsenic in Groundwater; EPA-542-S-02-002; Office of Solid Wastes and Emergency of United States Environmental Protection Agency: Seattle, WA, USA, 2002; pp. 1–38. Available online: https://www.epa.gov/sites/production/files/2015-06/documents/arsenic_issue_paper.pdf (accessed on 22 August 2018).
  9. The Ministry of Environment of Korea. Survey on Soil Contamination in Waste Metal Mines (Chungnam Province); M045470; The Ministry of Environment of Korea: Seoul, Korea, 2005; pp. 5–14. Available online: http://webbook.me.go.kr/DLi-File/F004/000/141833.pdf (accessed on 22 August 2018).
  10. Rathod, P.H.; Rossiter, D.G.; Noomen, M.F.; Van der Meer, F.D. Proximal spectral sensing to monitor phytoremediation of metal-contaminated soils. Int. J. Phytoremediat. 2013, 15, 405–426. [Google Scholar] [CrossRef] [PubMed]
  11. Shi, T.; Chen, Y.; Liu, Y.; Wu, G. Visible and near-infrared reflectance spectroscopy—An alternative for monitoring soil contamination by heavy metals. J. Hazard. Mater. 2014, 265, 166–176. [Google Scholar] [CrossRef] [PubMed]
  12. Rossel, R.V.; Walvoort, D.; McBratney, A.; Janik, L.J.; Skjemstad, J. Visible, near infrared, mid infrared or combined diffuse reflectance spectroscopy for simultaneous assessment of various soil properties. Geoderma 2006, 131, 59–75. [Google Scholar] [CrossRef]
  13. Stenberg, B.; Rossel, R.A.V.; Mouazen, A.M.; Wetterlind, J. Visible and near infrared spectroscopy in soil science. In Advances in Agronomy; Elsevier: Burlington, MA, USA, 2010; Volume 107, pp. 163–215. [Google Scholar]
  14. Bellon-Maurel, V.; Fernandez-Ahumada, E.; Palagos, B.; Roger, J.-M.; McBratney, A. Critical review of chemometric indicators commonly used for assessing the quality of the prediction of soil attributes by NIR spectroscopy. TrAC Trends Anal. Chem. 2010, 29, 1073–1081. [Google Scholar] [CrossRef]
  15. Song, L.; Jian, J.; Tan, D.-J.; Xie, H.-B.; Luo, Z.-F.; Gao, B. Estimate of heavy metals in soil and streams using combined geochemistry and field spectroscopy in wan-sheng mining area, Chongqing, china. Int. J. Appl. Earth Obs. Geoinf. 2015, 34, 1–9. [Google Scholar] [CrossRef]
  16. Thompson, A.J.B.; Hauff, P.L.; Robitaille, A.J. Alteration mapping in exploration: Application of short wave infrared (SWIR) spectroscopy. Soc. Econ. Geol. Newsl. 1999, 30, 16–27. [Google Scholar]
  17. Yang, K.; Browne, P.; Huntington, J.; Walshe, J. Characterising the hydrothermal alteration of the Broadlands–Ohaaki geothermal system, New Zealand, using short-wave infrared spectroscopy. J. Volcanol. Geotherm. Res. 2001, 106, 53–65. [Google Scholar] [CrossRef]
  18. Yang, K.; Huntington, J.F.; Browne, P.R.; Ma, C. An infrared spectral reflectance study of hydrothermal alteration minerals from the Te Mihi sector of the Wairakei geothermal system, New Zealand. Geothermics 2000, 29, 377–392. [Google Scholar] [CrossRef]
  19. Sun, Y.; Seccombe, P.K.; Yang, K. Application of short-wave infrared spectroscopy to define alteration zones associated with the Elura zinc–lead–silver deposit, NSW, Australia. J. Geochem. Explor. 2001, 73, 11–26. [Google Scholar] [CrossRef]
  20. Kerr, A.; Rafuse, H.; Sparkes, G.; Hinchey, J.; Sandeman, H. Visible/Infrared Spectroscopy (VIRS) as a Research Tool in Economic Geology: Background and Pilot Studies from Newfoundland and Labrador; Geological Survey, Report 11-1; Newfoundland and Labrador Department of Natural Resources: St. John’s, NL, Canada, 2011; pp. 145–166. [Google Scholar]
  21. Sonntag, I.; Laukamp, C.; Hagemann, S.G. Low potassium hydrothermal alteration in low sulfidation epithermal systems as detected by IRS and XRD: An example from the Co–O mine, Eastern Mindanao, Philippines. Ore Geol. Rev. 2012, 45, 47–60. [Google Scholar] [CrossRef]
  22. Zadeh, M.H.; Tangestani, M.H.; Roldan, F.V.; Yusta, I. Spectral characteristics of minerals in alteration zones associated with porphyry copper deposits in the middle part of Kerman copper belt, SE Iran. Ore Geol. Rev. 2014, 62, 191–198. [Google Scholar] [CrossRef]
  23. Jeong, Y.; Yu, J.; Koh, S.-M.; Heo, C.-H.; Lee, J. Spectral characteristics of minerals associated with skarn deposits: A case study of Weondong skarn deposit, South Korea. Geosci. J. 2016, 20, 167–182. [Google Scholar] [CrossRef]
  24. Rosso, P.H.; Pushnik, J.C.; Lay, M.; Ustin, S.L. Reflectance properties and physiological responses of Salicornia virginica to heavy metal and petroleum contamination. Environ. Pollut. 2005, 137, 241–252. [Google Scholar] [CrossRef] [PubMed]
  25. Mohamed, E.; Saleh, A.; Belal, A.; Gad, A.A. Application of near-infrared reflectance for quantitative assessment of soil properties. Egypt. J. Remote Sens. Space Sci. 2017. [Google Scholar] [CrossRef]
  26. Hauff, P.L. An Overview of VIS-NIR-SWIR Field Spectroscopy as Applied to Precious Metals Exploration; Spectral International Inc.: Arvada, CO, USA, 2008; Volume 80001, pp. 303–403. [Google Scholar]
  27. Herrmann, W.; Blake, M.; Doyle, M.; Huston, D.; Kamprad, J.; Merry, N.; Pontual, S. Short wavelength infrared (SWIR) spectral analysis of hydrothermal alteration zones associated with base metal sulfide deposits at Rosebery and Western Tharsis, Tasmania, and Highway-Reward, Queensland. Econ. Geol. Newsl. 2001, 96, 939–955. [Google Scholar] [CrossRef]
  28. Shin, H.; Yu, J.; Kim, J.; Yang, D.; Lee, G. Mapping the moisture content of coastal sediments using aster data for spectroscopic and mineralogical analyses: A case study in South Korea. IEEE Geosci. Remote Sens. Lett. 2015, 6, 488–497. [Google Scholar] [CrossRef]
  29. Shin, J.H.; Yu, J.; Kim, S.; Koh, S.-M.; Park, G. Spectral characteristics of heavy metal contaminated soils in the vicinity of Boksu mine. J. Miner. Soc. Korea 2016, 29, 89–101. [Google Scholar] [CrossRef]
  30. Wang, F.; Gao, J.; Zha, Y. Hyperspectral sensing of heavy metals in soil and vegetation: Feasibility and challenges. ISPRS J. Photogramm. Remote Sens. 2018, 136, 73–84. [Google Scholar] [CrossRef]
  31. Salminen, R.; Batista, M.; Bidovec, M.; Demetriades, A.; De Vivo, B.; De Vos, W.; Duris, M.; Gilucis, A.; Gregorauskiene, V.; Halamić, J. Geochemical Atlas of Europe, Part 1, Background Information, Methodology and Maps; Geological survey of Finland: Espoo, Finland, 2005; p. 526. [Google Scholar]
  32. Sipos, P.; Németh, T.; Kis, V.K.; Mohai, I. Sorption of copper, zinc and lead on soil mineral phases. Chemosphere 2008, 73, 461–469. [Google Scholar] [CrossRef] [PubMed]
  33. McBride, M.B. Environmental Chemistry of Soils; Oxford University Press: Oxford, NY, USA, 1994; p. 416. [Google Scholar]
  34. Vega, F.A.; Covelo, E.F.; Andrade, M. Competitive sorption and desorption of heavy metals in mine soils: Influence of mine soil characteristics. J. Colloid Interface Sci. 2006, 298, 582–592. [Google Scholar] [CrossRef] [PubMed]
  35. Wu, Y.; Chen, J.; Wu, X.; Tian, Q.; Ji, J.; Qin, Z. Possibilities of reflectance spectroscopy for the assessment of contaminant elements in suburban soils. Appl. Geochem. 2005, 20, 1051–1059. [Google Scholar] [CrossRef]
  36. Wu, Y.Z.; Chen, J.; Ji, J.F.; Tian, Q.J.; Wu, X.M. Feasibility of reflectance spectroscopy for the assessment of soil mercury contamination. Environ. Sci. Technol. 2005, 39, 873–878. [Google Scholar] [CrossRef] [PubMed]
  37. Xia, X.Q.; Mao, Y.Q.; Ji, J.F.; Ma, H.R.; Chen, J.; Liao, Q.L. Reflectance spectroscopy study of Cd contamination in the sediments of the Changjiang River, China. Environ. Sci. Technol. 2007, 41, 3449–3454. [Google Scholar] [CrossRef] [PubMed]
  38. Wu, Y.; Zhang, X.; Liao, Q.; Ji, J. Can contaminant elements in soils be assessed by remote sensing technology: A case study with simulated data. Soil Sci. 2011, 176, 196–205. [Google Scholar] [CrossRef]
  39. Choe, E.; Kim, K.-W.; Bang, S.; Yoon, I.-H.; Lee, K.-Y. Qualitative analysis and mapping of heavy metals in an abandoned au–ag mine area using NIR spectroscopy. Environ. Geol. 2009, 58, 477–482. [Google Scholar] [CrossRef]
  40. Choe, E.; van der Meer, F.; van Ruitenbeek, F.; van der Werff, H.; de Smeth, B.; Kim, K.-W. Mapping of heavy metal pollution in stream sediments using combined geochemistry, field spectroscopy, and hyperspectral remote sensing: A case study of the Rodalquilar mining area, Se Spain. Remote Sens. Environ. 2008, 112, 3222–3233. [Google Scholar] [CrossRef]
  41. Ren, H.-Y.; Zhuang, D.-F.; Singh, A.; Pan, J.-J.; Qiu, D.-S.; Shi, R.-H. Estimation of as and cu contamination in agricultural soils around a mining area by reflectance spectroscopy: A case study. Pedosphere 2009, 19, 719–726. [Google Scholar] [CrossRef]
  42. Ji, J.; Song, Y.; Yuan, X.; Yang, Z. Diffuse reflectance spectroscopy study of heavy metals in agricultural soils of the Changjiang River Delta, China. In Proceedings of the 19th World Congress of Soil Science, Brisbane, Australia, 1–6 August 2010. [Google Scholar]
  43. Al Maliki, A.; Bruce, D.; Owens, G. Prediction of lead concentration in soil using reflectance spectroscopy. Environ. Technol. Innovation. 2014, 1, 8–15. [Google Scholar] [CrossRef]
  44. Shelton, K.L.; So, C.-S.; Chang, J.-S. Gold-rich mesothermal vein deposits of the Republic of Korea; geochemical studies of the Jungwon gold area. Econ. Geol. 1988, 83, 1221–1237. [Google Scholar] [CrossRef]
  45. So, C.-S.; Shelton, K.L. Stable isotope and fluid inclusion studies of gold-and silver-bearing hydrothermal vein deposits, Cheonan-Cheongyang-Nonsan mining district, Republic of Korea; Cheonan area. Econ. Geol. 1987, 82, 987–1000. [Google Scholar] [CrossRef]
  46. So, C.-S.; Yun, S.-T.; Shelton, K. Mesothermal gold vein mineralization of the Samdong mine, Youngdong mining district, Republic of Korea. Miner. Depos. 1995, 30, 384–396. [Google Scholar] [CrossRef]
  47. Choi, S.G.; Kwon, S.T.; Ree, J.H.; So, C.S.; Pak, S.J. Origin of mesozoic gold mineralization in South Korea. Isl. Arc 2005, 14, 102–114. [Google Scholar] [CrossRef]
  48. Choi, S.-G.; Park, S.J.; Choi, S.-H.; Shin, H.J. Mesozoic granitoids and associated gold-silver mineralization in Korea. Econ. Environ. Geol. 2001, 34, 25–38, (In Korean with English Abstract). [Google Scholar]
  49. Choi, S.-G.; Park, S.-J.; Kim, S.-W.; Kim, C.-S.; Oh, C.-W. Mesozoic gold-silver mineralization in South Korea: Metallogenic provinces reestimated to the geodynamic setting. Econ. Environ. Geol. 2006, 39, 567–581, (In Korean with English Abstract). [Google Scholar]
  50. Yoo, B.C.; Lee, H.K.; White, N.C. Mineralogical, fluid inclusion, and stable isotope constraints on mechanisms of ore deposition at the Samgwang mine (Republic of Korea)—A mesothermal, vein-hosted gold–silver deposit. Miner. Depos. 2010, 45, 161–187. [Google Scholar] [CrossRef]
  51. Yoo, B.-C.; Lee, G.-J.; Lee, J.-K.; Ji, E.-K.; Lee, H.-K. Element dispersion and wallrock alteration from Samgwang deposit. Econ. Environ. Geol. 2009, 42, 177–193, (In Korean with English Abstract). [Google Scholar]
  52. Lee, H.-G.; Choi, Y.-S. A study on the soil contamination (maps) using the handheld XRF and GIS in abandoned mining areas. J. Korean Assoc. Geogr. Inf. Stud. 2014, 17, 195–206, (In Korean with English Abstract). [Google Scholar] [CrossRef]
  53. Lee, J.Y.; Kim, H.J.; Yang, J.E. Contamination of stream and reservoir waters with arsenic from abandoned gold mine. Environ. Eng. Res. 2008, 13, 33–40. [Google Scholar] [CrossRef]
  54. Cho, I.-H.; Chun, S.-Y.; Chang, S.-W. Statistical assessment on the heavy metal variation in the soils around abandoned mine (case study for the Samgwang mine). J. Environ. Sci. Int. 2007, 16, 1451–1462. [Google Scholar]
  55. Jung, M.C. Contamination by Cd, Cu, Pb, and Zn in mine wastes from abandoned metal mines classified as mineralization types in Korea. Environ. Geochem. Health 2008, 30, 205–217, (In Korean with English Abstract). [Google Scholar] [CrossRef] [PubMed]
  56. Kim, K.-R.; Lee, B.-T.; Kim, K.-W. Arsenic stabilization in mine tailings using nano-sized magnetite and zero valent iron with the enhancement of mobility by surface coating. J. Geochem. Explor. 2012, 113, 124–129. [Google Scholar] [CrossRef]
  57. Tenedero, R.A.; Surtida, M.B. Soil Sampling and Preparation for Laboratory Analysis; SEAFDEC Aquaculture Department: Iloilo, Philippines, 1986; p. 11. ISBN 971-8511-10-5. [Google Scholar]
  58. Mutanga, O.; Skidmore, A.K.; Prins, H. Predicting in situ pasture quality in the Kruger National Park, South Africa, using continuum-removed absorption features. Remote Sens. Environ. 2004, 89, 393–408. [Google Scholar] [CrossRef]
  59. Kokaly, R.F. Investigating a physical basis for spectroscopic estimates of leaf nitrogen concentration. Remote Sens. Environ. 2001, 75, 153–161. [Google Scholar] [CrossRef]
  60. Kokaly, R.F.; Clark, R.N. Spectroscopic determination of leaf biochemistry using band-depth analysis of absorption features and stepwise multiple linear regression. Remote Sens. Environ. 1999, 67, 267–287. [Google Scholar] [CrossRef]
  61. Owen, T. Fundamentals of UV-Visible Spectroscopy: A Primer; Hewlett-Packard Company: Baden-Württemberg, Germany, 1996; p. 142. [Google Scholar]
  62. Pontual, S.; Merry, N.; Gamson, P. GMEX: Guides for Mineral Exploration: Spectral Interpretation Field Manual; AusSpec International Ltd.: Queenstown, New Zealand, 2010; Volume 1, p. 191. [Google Scholar]
  63. Clark, R.N.; Swayze, G.A.; Wise, R.; Livo, K.E.; Hoefen, T.; Kokaly, R.F.; Sutley, S.J. USGS Digital Spectral Library Splib06a; Digital Data Series 231; U.S. Geological Survey: Reston, VA, USA, 2007. Available online: http://speclab.cr.usgs.gov/spectral.lib06 (accessed on 22 August 2018).
  64. Kokaly, R.F.; Clark, R.N.; Swayze, G.A.; Livo, K.E.; Hoefen, T.M.; Pearson, N.C.; Wise, R.A.; Benzel, W.M.; Lowers, H.A.; Driscoll, R.L. USGS Spectral Library Version 7; Data Series 1035; U.S. Geological Survey: Reston, VA, USA, 2017. Available online: https://pubs.er.usgs.gov/publication/ds1035 (accessed on 22 August 2018).
  65. Baldridge, A.; Hook, S.; Grove, C.; Rivera, G. The aster spectral library version 2.0. Remote Sens. Environ. 2009, 113, 711–715. [Google Scholar] [CrossRef]
  66. Dunagan, S.C.; Gilmore, M.S.; Varekamp, J.C. Effects of mercury on visible/near-infrared reflectance spectra of mustard spinach plants (Brassica rapa P.). Environ. Pollut. 2007, 148, 301–311. [Google Scholar] [CrossRef] [PubMed]
  67. Vasques, G.; Grunwald, S.; Sickman, J. Comparison of multivariate methods for inferential modeling of soil carbon using visible/near-infrared spectra. Geoderma 2008, 146, 14–25. [Google Scholar] [CrossRef]
  68. Nan, Z.; Zhao, C.; Li, J.; Chen, F.; Sun, W. Relations between soil properties and selected heavy metal concentrations in spring wheat (Triticum aestivum L.) grown in contaminated soils. Water Air Soil Pollut. 2002, 133, 205–213. [Google Scholar] [CrossRef]
  69. Tyler, G. Heavy metal pollution, phosphatase activity, and mineralization of organic phosphorus in forest soils. Soil Biol. Biochem. 1976, 8, 327–332. [Google Scholar] [CrossRef]
  70. Zeng, F.; Ali, S.; Zhang, H.; Ouyang, Y.; Qiu, B.; Wu, F.; Zhang, G. The influence of pH and organic matter content in paddy soil on heavy metal availability and their uptake by rice plants. Environ. Pollut. 2011, 159, 84–91. [Google Scholar] [CrossRef] [PubMed]
  71. Whitney, D.L.; Evans, B.W. Abbreviations for names of rock-forming minerals. Am. Mineral. 2010, 95, 185–187. [Google Scholar] [CrossRef]
  72. Clark, R.N. Spectroscopy of rocks and minerals, and principles of spectroscopy. In Manual of Remote Sensing; Rencz, A.N., Ed.; John Wiley and Sons: New York, NY, USA, 1999; Volume 3, pp. 3–58. ISBN 0471-29405-5. [Google Scholar]
  73. Götze, C.; Denk, M.; Riedel, F.; Gläßer, C. Interlaboratory comparison of spectrometric laboratory measurements of a chlorite rock sample. PFG–J. Photogramm. Remote Sens. Geo-Inf. Sci. 2017, 85, 307–316. [Google Scholar] [CrossRef]
  74. Manning, B.A.; Goldberg, S. Adsorption and stability of arsenic (III) at the clay mineral− water interface. Environ. Sci. Technol. 1997, 31, 2005–2011. [Google Scholar] [CrossRef]
  75. Rybicka, E.H.; Calmano, W.; Breeger, A. Heavy metals sorption/desorption on competing clay minerals; an experimental study. Appl. Clay Sci. 1995, 9, 369–381. [Google Scholar] [CrossRef]
  76. Reimann, C.; Siewers, U.; Tarvainen, T.; Bityukova, L.; Eriksson, J.; Giucis, A.; Gregorauskiene, V.; Lukashev, V.K.; Matinian, N.N.; Pasieczna, A. Agricultural Soils in Northern Europe: A Geochemical Atlas; E. Schweizerbart: Stuttgart, Germany, 2003; p. 279. [Google Scholar]
  77. Fletcher, P.; Sposito, G. Chemical modeling of clay/electrolyte interactions of montmorillonite. Clay Miner. 1989, 24, 375–391. [Google Scholar] [CrossRef]
  78. Gannouni, S.; Rebai, N.; Abdeljaoued, S. A spectroscopic approach to assess heavy metals. J. Geog. Inf. Syst. 2012, 4, 242–253. [Google Scholar] [CrossRef]
Figure 1. Location map of Samgwang mine (left), and distribution of mining facilities, tailing areas, and sampling locations (SP01–SP58) in Esri World Imagery Map (available at http://goto.arcgisonline.com/maps/World_Imagery) (right).
Remotesensing 10 01830 g001
Figure 2. Overall flow chart of pre-processing and method development used in this study and photographic descriptions.
Remotesensing 10 01830 g002
Figure 3. SP02 and SP18 spectra stacked with reference spectra of clinochlore (Clc), phlogopite (Phl), illite (Ilt), muscovite (Ms), and montmorillonite (Mnt).
Remotesensing 10 01830 g003
Figure 4. Stacked averaged raw reflectance sample spectra divided into 5 level-concentrations with standard deviation (in the parentheses): (a) As concentration; (b) Pb concentration.
Remotesensing 10 01830 g004
Figure 5. Continuum-removed reflectance spectra of tailing samples at 5 levels of (a) As and (b) Pb concentration showing systematic variations in absorption depths in the SWIR region.
Remotesensing 10 01830 g005
Figure 6. Correlograms between As/Pb concentrations and (a) raw reflectance, (b) continuum-removed reflectance, and the (c) first derivative reflectance where a correlation coefficient larger |r| > 0.7 is highlighted by color blocks. Each dashed arrow line indicates an absolute mean correlation coefficient values.
Remotesensing 10 01830 g006
Figure 7. Evaluation models of (a) As and (b) Pb prediction models based on the comparison between measured and predicted concentrations using a test set. The slope (solid black line) close to 1:1 line indicates no bias between the predicted and measured values.
Remotesensing 10 01830 g007
Figure 8. Comparison between the spectra of standard soil (from JPL spectral library) and Samgwang tailing.
Remotesensing 10 01830 g008
Table 1. Descriptive statistics quantity of heavy metal concentrations for the 174 samples and soil pollution reference (standard from The Ministry of Environment of Korea).
ElementsStatisticsSoil Pollution Reference
NMinMaxMeanSD
Cr174010214842865
Ni1740600266174100
Cu1740623111119150
Zn1741991504676334300
As17478880193208181925
Cd17404451511544
Pb174661233505312200
Note: a unit of ppm (mg/kg) was applied to min, max, mean, standard deviation (SD), and soil pollution reference; soil pollution references indicate remediation standards of residential areas including field, paddy field, orchard, pasture, land, park, and so on.
Table 2. Mineral composition of the tailing samples derived from XRD analysis.
Site No.Mineral Categories
GangueRock-FormingAlteration
Sp01Qtz, CalQtz, MsMs, Phl, Dol, Clc, Ilt, Mnt
Sp02Qtz, CalQtz, Ab, MsMs, Phl, Dol, Clc, Ilt, Mnt, Vrm
Sp03Qtz, CalQtzPhl, Dol, Clc, Ilt, Mnt
Sp04QtzQtz, MsMs, Dol, Clc, Ilt
Sp13Qtz, CalQtz, Ab, MsMs, Phl, Clc, Ilt, Mnt
Sp17QtzQtz, Ab, MsMs, Phl, Dol, Clc, Ilt, Mnt
Sp18Qtz, CalQtz, Ab, MsMs, Phl, Dol, Clc, Ilt, Mnt
Abbreviation (after [71]): Qtz = quartz; Ms = muscovite; Phl = phlogopite; Ab = albite; Cal = calcite; Dol = dolomite; Clc = clinochlore; Ilt = illite; Mnt = montmorillonite; Vrm = vermiculite.
Table 3. The common absorption features of major components in VNIR-SWIR regions [26,27,62,72,73].
Major Chemical ComponentAbsorption Position (nm)
Fe3+~900 (charge transfer slope from 750 to shorter wavelength)
Fe2+~1000–1200
-OH~1400 (~1550, ~1750–1850 in some minerals)
H2O~1400, ~1900, and ~1950–2100
Al-OH~2160–2228
Fe-OH~2230–2298
Mg-OH~2300–2370 and ~2400
Table 4. Parameters of the prediction models derived from the stepwise multiple linear regression to confirm determining the suitability of the models.
ElementsSource of VariationSum of SquaresDegree of FreedomMean Sum of SquaresFp
AsBetween groups2.72530.90896.7780.000
Within groups1.0511120.009
Total3.776115-
PbBetween groups0.07320.037106.0510.000
Within groups0.0391130.000
Total0.112115-
Note: Source of variation for “between groups” indicates “the variability between each spectral band used for regression model”; source of variation for “within groups” describes “the variability within spectral bands combined that are used for regression model” or “unexplained random error”; total means “the total variation in the data from the grand mean”; the groups refer to the spectral bands selected in this study.
Table 5. Parameters of the prediction model derived from the empirical relationships between the heavy metal concentrations and FDR spectra.
ElementsWavelength (nm)B (SE)βtpVIFR2adj-R2Durbin-WatsonRMSEcRMSEv
As(coefficient)1.291 0.7220.7141.1730.0950.099
FDR2206643.059
(209.722)
0.3223.0660.0034.430
FDR2161785.727
(177.104)
0.3344.4370.0002.276
FDR2361−371.206
(92.565)
−0.321−4.0100.0002.578
Pb(coefficient)0.187 0.6520.6461.1370.0180.019
FDR1414−181.951
(32.543)
−0.518−5.5910.0002.794
FDR2205118.476
(33.240)
0.3303.5640.0012.794
Note: SE is a standard error value of a regression coefficient; the variance inflation factor (VIF) explains interdependence of explanatory variables that could lead to multicollinearity problem at >10; the Durbin-Watson value tests autocorrelation in the residuals from a regression analysis where the value from 0 to 2 indicates positive autocorrelation.

