Super-Resolution Multi-Look Detection in SAR Tomography


1
Department of Applied Electronics and Information Engineering, University Politehnica of Bucharest, 060042 Bucharest, Romania
2
Institute for Electromagnetic Sensing of the Environment, National Research Council of Italy, 00185 Rome, Italy
3
Remote Sensing Technology Institute, German Aerospace Center, D-82234 Wessling, Germany
*
Author to whom correspondence should be addressed.
Remote Sens. 2018, 10(12), 1894; https://0-doi-org.brum.beds.ac.uk/10.3390/rs10121894
Submission received: 29 September 2018
/
Revised: 15 November 2018
/
Accepted: 22 November 2018
/
Published: 27 November 2018
(This article belongs to the Special Issue Urban Deformation Monitoring using Persistent Scatterer Interferometry and SAR tomography)
Abstract
:Synthetic Aperture Radar (SAR) Tomography (TomoSAR) allows extending the 2-D focusing capabilities of SAR to the elevation direction, orthogonal to the azimuth and range. The multi-dimensional extension (along the time) also enables the monitoring of possible scatterer displacements. A key aspect of TomoSAR is the identification, in the presence of noise, of multiple persistent scatterers interfering within the same 2-D (azimuth range plane) pixel. To this aim, the use of multi-look has been shown to provide tangible improvements in the detection of single and double interfering persistent scatterers at the expense of a minor spatial resolution loss. Depending on the system acquisition characteristics, this operation may require also the detection of multiple scatterers interfering at distances lower than the Rayleigh resolution (super-resolution). In this work we further investigated the use of multi-look in TomoSAR for the detection of multiple scatterers located also below the Rayleigh resolution. A solution relying on the Capon filtering was first analyzed, due to its improved capabilities in the separation of the responses of multiple scatterers and sidelobe suppression. Moreover, in the framework of the Generalized Likelihood Ratio Test (GLRT), the single-look support based detection strategy recently proposed in the literature was extended to the multi-look case. Experimental results of tests carried out on two datasets acquired by TerraSAR-X and COSMO-SkyMED sensors are provided to show the performances of the proposed solution as well as the effects of the baseline span of the dataset for the detection capabilities of interfering scatterers.
1. Introduction
Synthetic Aperture Radar (SAR) provides high resolution 2-D (azimuth and range) microwaves images of the illuminated scene at night and day and in all-weather conditions. This results in a systematic acquisition capability, which is an essential feature with reference to the environmental risk monitoring applications.
Advanced Differential Interferometric SAR (A-DInSAR) [1] techniques are routinely used for the accurate monitoring of slow, long-term displacements of ground targets. Among them, the class of Persistent Scatterer Interferometry (PSI) methods, typically operating at full resolution [2], relies on the assumption that the scattering response is spatially concentrated and persistent over the observation time interval, hence the name of Permanent Scatterer (PS). This scattering assumption, along with the use of a multi-acquisition model, allows accurately estimating the scatterers parameters, which are the residual topography (RT) and the related deformation parameters, typically given by the mean deformation velocity (MDV) and the thermal dilation (TD).
SAR Tomography (TomoSAR or 3-D imaging) [3] is a method that exploits multiple observations over different orbits typically achieved by repeated passes to synthesize a large antenna also along the direction orthogonal to the azimuth and range, referred to as elevation or slant height. The resulting fine-beam can be steered (by ground data processing) to scan the object of interest to achieve a high (meter) resolution of the scattering profile along slant height. Upon extension to the time and more dimensions (Multi-D imaging) [4], similar to PSI, TomoSAR allows the estimation of the scatterers parameters related to possible deformations (i.e., MDV and TD) as well.
A simple algorithm to reconstruct the vertical scattering profile is based on Beam-Forming (BF) [5]: its capability of separating the responses of multiple scatterers along the elevation is however limited to the so-called Rayleigh resolution [6]. Alternative methods, e.g., Compressive Sensing (CS) [7,8] Capon filtering [9] or based on proper transformation [10], allow improving such a separation and at the same time achieving better sidelobe suppression. Different from CS, Capon is typically characterized by a spatial (azimuth and range) resolution loss, although a full resolution version has been proposed [11].
Low frequency (L- or P-Band) TomoSAR applications regard the imaging of volume scattering, such as forests and ice mapping [3,12,13]. However, even in the case of limited microwaves penetration capability (e.g., X-Band), TomoSAR allows achieving improved 3-D reconstruction and monitoring in complex scenes, such as urban areas, due to the geometric distortions (layover) induced by the vertical development of the scattering [8]. In this case, TomoSAR extends PSI, improving the PSs identification and the estimation of the parameters of interest.
PSs identification, i.e., the discrimination in each image pixel of different and interfering PS mechanisms, is a key problem in PSI and TomoSAR. Such a problem can be approached in the framework of the detection theory, thus exploiting algorithms (detectors) that allow controlling the false alarm rate (FAR). Among them, the Generalized Likelihood Ratio Test (GLRT) achieves, at least asymptotically, the best Detection Rate (DR) for a given FAR. For a simple model assuming a single (dominant) PS immersed in additive white Gaussian noise, it has been shown in [14] that the GLRT statistic is simply provided by a normalization of the BF reconstruction.
The extraction of multiple (typically two) scatterers, interfering in the same image pixel, is a more complex issue and different solutions have been proposed in the literature. A simple strategy, based on sequential projections, has been proposed in [15]. Such approach, referred to as sequential GLRT with cancellation (SGLRTC), is affected by low detection performances when the interfering scatterers are located at elevation differences close to or lower than the Rayleigh resolution. It also suffers from the effects of leakage related to the influence of sidelobes.
More effective approaches for the detection of multiple scatterers are based on the joint testing of multiple directions in the data space. The support based GLRT (sup-GLRT) [16], which performs a Maximum Likelihood Estimation (MLE) of the elevation support, has been proposed as a refinement of the SGLRTC for improving the performances in the scatterers detection for elevation separation below the Rayleigh resolution. Its disadvantage is the higher computational requirement, related to the need to test the data power distribution in subspaces spanned by multiple directions. The fast sup-GLRT approach [17] provides an interesting improvement that allows retaining almost the same computation efficiency of SGLRTC while keeping, to some degree, the super-resolution capability of sup-GLRT. The rationale of this method relies on testing the signal power in higher dimensionality subspaces by sequentially adding a single direction starting from the first one provided by BF.
Inspired by the small baseline approach [18], which improves the interferometric analysis by increasing the signal to noise ratio through a spatial multi-look, recent PSI-based methods have included local averaging. The SqueeSAR approach [19] and the Component extrAction and sElectionSAR (CAESAR) [20], which is based on the Principal Component Analysis, are examples along this line.
With reference to the TomoSAR context, the use of local spatial averaging has been shown to significantly improve the detection performances as well as the accuracy in the estimation of the scatterers parameters, obviously at the expense of a spatial resolution loss. This is the case of the CAESAR based tomographic processing [21] and of the noise robust multi-look version of the single-look GLRT, hereafter referred to as M-GLRT [22]. M-GLRT is based on a proper normalization of the multi-look BF and shows (asymptotically) optimal performances on the detection of single scatterers. Following the line of the single-look SGLRTC, a M-GLRT detection scheme accounting for the presence of multiple scatterers has also been investigated [22]. Significant improvements in the detection performances have also been observed in this case. However, similar to its single-look counterpart, such a detection scheme does not allow achieving super-resolution and may suffer of the effects of leakage.
To fully address the issue of effective detection of multiple scatterers, in this work, we deepened the investigation of noise robust detection schemes with reference to their capability of separating scatterers located also below the Rayleigh resolution (super-resolution).
In the context of multi-look SAR Tomography, the Capon filtering is known to guarantee sidelobes reduction and improve separation of the responses of multiple scatterers. For this reason, the Capon based detection algorithm in [23] was first analyzed and framed in the context of the GLRT detection, to investigate the possible effects of the improved separation in terms of super-resolution detection. Limitations of such a super-resolution tomographic detection method were highlighted. Accordingly, a multi-look extension of the sup-GLRT, the M-sup-GLRT, was therefore proposed along with its fast (computationally efficient) version. It benefits from the super-resolution capabilities of the sup-GLRT as well as the improvements achieved by use of multi-look. This scheme was tested on two datasets acquired by Very High Resolution (VHR) SAR systems with different baseline spans, i.e., elevation resolutions, to appreciate on real data the different detection performances.
The paper is organized as follows. Section 2 presents a review of the multi-look TomoSAR, with a particular emphasis to the Capon and BF reconstruction algorithm. The problem of PSs detection is then addressed, summarizing the GLRT schemes already derived at full (single-look) and reduced (multi-look) spatial resolution and providing a deeper analysis of the Capon based detector proposed in [23]. The multi-look extension of the sup-GLRT detector derived in [16] is described in Section 2.5. Section 3 is devoted to the analysis of the estimation and detection results on data acquired by operative systems. Conclusions and suggestions for further developments are provided in Section 4.
2. Material and Methods
2.1. Multi-Look SAR Tomography: Problem Formulation and Filter Design
Let us consider a stack of N azimuth-range focused SAR images, co-registered with respect to a given reference (master) image. We assume that the dataset has compensated for the atmospheric phase screen (APS) as well as for possible nonlinear deformation resulting from a small scale (lower resolution) analysis. In a given image pixel, the signal is a noisy version of the integrated backscattering function over the so-called multi-dimensional parameter space.
The vector collecting the parameters of interest (i.e., RT for 3-D case; RT and MDV for 4-D case; and RT, MDV, and TD for the 5-D case) is referred to as parameter vector p. It spans the parameter space, which is discretized in K bins, corresponding to the parameter vectors . RT can be referred to the elevation direction (orthogonal to the range and azimuth) or to the vertical direction: in the following, both definitions are used and specified according to the context.
In a given pixel, the N-length data vector, e.g., g, is modeled as
where the dependence on the pixel has been omitted for sake of simplicity. In Equation (1), the K-length vector
where (·)T is the transposition operator, collects the samples of the backscattering distribution function over the bins (backscattering coefficients), whereas w is the additive noise contribution. Furthermore, A is the N × K system matrix whose columns are referred to as steering vectors.
With reference to the kth bin, the corresponding steering vector, e.g., , is a structured versor () whose nth component is
where is the vector collecting the Fourier mate variables of the parameter vector. Such variables, whose spans determine the Rayleigh resolution (i.e., the resolution capability of the imaging system), depend on the adopted system parameters (transmitted wavelength, spatial baseline distribution, acquisition epochs, and so on) (see references [4,24,25] for the 3-D, 4-D, and 5-D cases, respectively).
At this point, it is worth noting that Equation (1) models the signal component as a superposition over the bins of contributions (steering vectors) weighted according to the corresponding backscattering coefficients. On the one hand, along the elevation dimension, a real scenario can certainly involve the superposition of contributions associated to different bins corresponding to physically distinct scatterers. The same reasoning cannot be extended along the velocity and thermal dilation. For instance, for the 4-D case, the velocity can be interpreted as a spectral variable describing the harmonic content composing a generic, non-linear scatterer deformation. For PSI/TomoSAR it follows that, along the velocity (4-D) and thermal dilation (5-D) directions, the presence of backscattering distribution over multiple bins does not imply the presence of multiple (physical) PS, but only a spreading of the backscattering contribution associated with a deformation of a (physical) PS that cannot be described by a linear motion (4-D) or linear motion and a thermal dilation (5-D) according to the available temperatures. For the sequel, we assume that, for a given elevation, the backscattering is impulsive along the velocity and thermal dilation directions.
It is as well as understood that Equation (1) neglects the presence of decorrelation across the data-stack.
From a statistical point of view, the data vector is typically modeled as a zero-mean complex circular Gaussian random vector, with covariance matrix
where and are the variance of the backscattering coefficient corresponding to the kth bin contribution and the power spectral density (PSD) of the (white) noise contribution, respectively; E(·) and are the statistical expectation operator and the N × N identity matrix, respectively; and (·)H stands for hermitian operator. Notice that, according to the previous assumption on the backscattering distribution, the variance turns out to be concentrated in a single bin along the additional directions with respect to the elevation (4-D/5-D spaces).
Multi-look SAR tomography is aimed at reconstructing, pixel by pixel, the backscattering distribution along the bins (γ) from a set of L independent and homogeneous looks, e.g., .
A proper filter, e.g., , is exploited to carry out, look by look, an estimate of the backscattering coefficient γk. To mitigate the noise effect, such an estimate is subsequently averaged over all the looks, although this leads to an unavoidable spatial (range-azimuth) resolution loss. The multi-look reconstruction is thus
where
is the sampling covariance matrix of the data. It is worth noting that, under the Gaussian assumption, the sampling covariance matrix in Equation (6) is also the Maximum Likelihood Estimate (MLE) of the statistical covariance matrix in Equation (4).
Since the data and the unknowns in Equation (1) are related by a (typically non-uniformly sampled) Fourier operator, some filter design criteria coming from the spectral estimation theory have been effectively exploited. Among them, the minimum output energy (MOE) criterion allows recovering the spectral component corresponding to the kth bin while limiting as much as possible the effects of interfering contribution. The problem is cast as:
being the statistical covariance matrix in Equation (4).
The Capon filter [26] is the solution of the problem in Equation (7). Standard Lagrangian optimizations lead to the expression
showing that the Capon is an adaptive (data dependent) filter, because of the presence of the (inverse) statistical covariance matrix. In practical situations, the matrix is unknown and, therefore, its sampling (multi-look) estimation , defined as in Equation (6), is exploited. Accordingly, by substituting the filter expression in Equation (8) within the multi-look reconstruction in Equation (5), the Capon reconstruction can be written as:
A consideration is now in order.
The use of the inverse sampling covariance matrix makes the Capon filter to be intrinsically a multi-look processing. In other words, the Capon reconstruction in Equation (9) cannot be straightforwardly specialized to the single-look case, although a single-look Capon based TomoSAR algorithm has been proposed in paper [11].
A much simpler nonparametric filter usually exploited for the reconstruction of the backscattering profile is Beam Forming (BF). Interestingly, BF can be considered as the solution of the problem in Equation (7) when the data are assumed to be a white process, that is, when is proportional to the identity matrix. Such a condition leads in fact to the solution:
which provides the multi-look reconstruction
obtained by substituting Equation (10) into Equation (5).
Differently from the Capon, the BF in Equation (10) is a non-adaptive (data independent filter). To emphasize this aspect, the Capon is sometimes referred to as adaptive BF (ABF). Moreover, the BF reconstruction in Equation (11) can be straightforwardly specialized to the single-look case (), which makes it preferable to the Capon when a full spatial resolution analysis is required.
2.2. Multi-Look Detection in SAR Tomography: Problem Formulation and Solution Strategies
The assumed correspondence between (physical) PSs and bins allows identifying the presence of the stronger PSs interfering in the same pixel and estimating their tomographic parameters by selecting the highest peaks of the tomographic reconstruction.
However, the disturbance (noise and clutter) in the processed data along with the leakage level introduced by the exploited reconstruction technique could determine a misinterpretation of the results that makes necessary a further processing aimed at testing the reliability of the revealed PSs.
In this context is framed the TomoSAR detection problem, which in the multi-look case consists of determining, pixel by pixel, the number of present PSs and estimating the corresponding parameters vectors from a set of L independent and homogeneous looks. Such a problem can be conveniently cast in terms of the multiple (composite) hypothesis test
where are the exploited looks. The mth hypothesis in Equation (12) assumes the presence of m PSs, characterized by the (unknown) parameters vectors which are look-independent because of the looks homogeneity. The corresponding steering vectors are collected by the system matrix
whereas the backscattering coefficients form the look-dependent vector
Finally, each look is corrupted by an additive noise contribution , usually modelled as a white complex circular Gaussian random vectors, with (unknown) PSD .
In the following, Equation we deal with the problem of detecting up to two interfering scatterers (i.e.,).
From a statistical point of view, the joint probability density function (pdf) of the looks can be modeled according to two different complex multivariate Gaussian distributions. The first one leads to the zero-mean model, which characterizes the backscattering coefficients in Equation (14) as uncorrelated zero-mean complex circular Gaussian random variables with (unknown) variances , The second one corresponds to the nonzero-mean model, which considers, instead, the backscattering coefficients in Equation (14) as (unknown) deterministic parameters.
Different detection strategies can be followed.
A first possibility is to start from the tomographic reconstruction and exploit proper indexes to extract the information about peaks corresponding to possible persistent scatterers. In this case, the exploited reconstruction technique plays a key role in terms of achievable tomographic resolution and estimation accuracy: a particular interest is thus for the Capon based algorithms.
A second strategy is strictly framed in the detection theory context and exploits schemes based on the Generalized Likelihood Ratio Test (GLRT). In this case, according to the assumed statistical model, the estimates of the unknown parameters are based on the Least Squares (LS) criterion that, in the case of single scatterers, provides the same solution achievable by selecting the highest peak of the BF reconstruction. Moreover, this strategy also has the advantage of allowing to control the false alarm rate (FAR).
2.3. GLRT Detection
The multi-look GLRT for the binary hypotheses test is:
where, under (), is the joint pdf of the looks and is the vector collecting all the unknown parameters. Moreover, T is the detection threshold, set according to the desired FAR.
As for the detection of single scatterers, the single-look and, more recently, the multi-look GLRT detector for the binary hypothesis test have been derived in references [14,22] respectively.
By assuming the zero-mean model for the joint pdf of the looks, the test in Equation (15) leads to the multi-look GLRT detector [22]:
where
is the multi-look MLE under of the parameter vector p associated with the present PS and is the sample covariance matrix, defined as in Equation (6).
It is worth noting that the test in Equation (16) is a BF-based detector, since its statistic represents the highest normalized peak (belonging to the interval [0, 1]) of the BF reconstruction in Equation (11). It can be rewritten as
which is the correlation index (according to the Frobenius inner product) between the estimated (sample) covariance matrix and the estimated, so-called signature matrix , associated with the ideal response (signature) of a PS with parameter vector [22]. Equation (18) is also referred to as BF correlation index, because of the relation that defines the BF filter at the bin .
It can be easily shown that, under , the test statistic in Equation (18) increases with the signal to noise ratio (SNR) of the present PS, defined as
As final remarks, it is worth underlining that the detector in Equation (16) has the CFAR property that reflects in the possibility to use the same detection threshold for processing all pixels with the same (constant) FAR. Moreover, the reduction of the noise effect induced by the multi-look processing translates in a higher detection rate (DR). It has been demonstrated, indeed, that, for a fixed FAR, the DR increases with the number L of the exploited looks [22].
As for the double scatterers case, a GLRT-based detector for the ternary hypothesis test has been proposed for the single-look case in [15] and subsequently extended to the multi-look case in [22]. It is a simple and efficient two-stage scheme, referred to as sequential GLRT with cancelation (SGLRTC), that sequentially tests the pairs of hypotheses and , where denotes the complement of (i.e., or ). At the first stage, aimed at testing the presence of two scatterers, the decision rule from Equation (16) is applied to the vector obtained by canceling from the data the contribution of the dominant scatterer. The latter is in turn provided by the highest peak of the BF reconstruction. If hypothesis is selected, the final decision is demanded to the second stage that select among the null and the single scatterer hypothesis, again according to the rule in Equation (16).
The SGLRTC results to be in practice CFAR. Moreover, from the computational point of view, it is a very efficient detection scheme, since the cancelation step allows just doubling the effort required by the GLRT detector for single scatterers. Unfortunately, this is paid for by a reduction of the (tomographic) resolution capabilities, since the cancellation process does not allow locating scatterers whose distance in the parameter space is below the Rayleigh resolution. Moreover, it has limited capabilities in contrasting the leakage.
To provide super-resolution capabilities, a single-look double-stage GLRT-based detector, referred to as sup-GLRT (since it deals with a signal support estimation problem), has been proposed in [16]. Similar to the single-look SGLRTC, the sup-GLRT assumes the nonzero-mean model for the pdf of the data. However, differently from the SGLRTC that implements the binary tests starting from the higher hypothesis, the sup-GLRT sequentially tests the pairs of hypotheses and ( being the complement of ), thus starting from the lower hypothesis. More specifically, letting g be the (single) exploited look, the first stage implements the rule
where
is the joint MLE of the parameter vectors associated with the two present PSs under ,
is the projector in the noise subspace, which is the orthogonal complement to the signal subspace spanned by the two estimated directions and , and
is the projector in the signal subspace, being the matrix collecting the two estimated directions.
The second stage acts when the first one selects . It implements the rule
where and are still given by Equation (21), and
>is the MLE of the parameter vector associated with the present PS under . Moreover,
is the projector in the noise subspace, which is the orthogonal complement to the signal subspace spanned by the estimated direction .
The sup-GLRT is a CFAR detection scheme, and very effective compared to SGLRTC in terms of resolution capability. Indeed, by exploiting the join estimation procedure from Equation (21), it is also able to detect scatterers whose separation in the parameter space is below the Rayleigh resolution. Moreover, for separation above the Rayleigh resolution, the avoidance of the cancellation step exploited in the SGLTRC allows improving the handling of leakage associated to sidelobes. However, the super-resolution capability is paid for by a high computational effort, which turns out to be combinatorial [16]. Accordingly, the sup-GLRT is very computationally demanding, especially when the dimensionality of the parameter space increases and its discretization is carried out with a high number of bins [27].
To overcome the high computational complexity limitation of the sup-GLRT, the so-called (single-look) fast-sup-GLRT is introduced in [17]. The basic idea is on splitting the joint estimate of the two parameters vectors, performed as in Equation (21), into two decoupled estimates and . To this aim, the estimate is firstly carried out by Equation (25). Subsequently, the estimate is performed as
The reduction of the computational effort is paid for by a higher leakage effect on the dominant scatterer when a secondary scatterer is present. Nevertheless, the fast sup-GLRT has been demonstrated to achieve better detection performances with respect to the SGLRTC. This improvement depends on the fact that, differently from the cancelation carried out by the SGLRTC, the estimation procedure in Equation (27) does not constrain the steering vectors associated with and to be orthogonal.
2.4. Capon-Based Detection
The attractive characteristic of the Capon reconstruction related to the mitigation of the leakage effect has encouraged the derivation of multi-look Capon-based detectors which should be able to achieve better performances in presence of multiple PSs interfering in the same pixel. One possibility could be the modification of the GLRT in Equation (16), which is a BF-based detector, in a Capon-based detection scheme. To this aim, the BF correlation index from Equation (18) could be substituted with the Capon correlation index
where is the Capon filter at the bin corresponding to the highest peak of the Capon reconstruction. Unfortunately, because of the presence of the inverse sampling covariance matrix in the filter (see Equation (8)), the use of the index in Equation (28) results to be critical in terms of numerical instability related to the finite precision number representation, especially for high values of SNR.
Another possibility is given by the multi-look Capon-based iterative detector addressed in [23]. It exploits the L looks to sequentially test the hypotheses in Equation (12), that is
, where the matrix accounts for the vector parameters corresponding to the m highest peaks of the Capon reconstruction.
The mth iteration verifies the presence of a further scatterer with respect to the m−1 already detected in the previous one, by ending the algorithm if the additional scatterer is declared to be absent. To this aim, the following joint condition is tested
where εm is a properly defined fitting error exploited to limit the FAR,
is the SNR corresponding to the mth scatterer, and and are two fixed (independent from m) thresholds.
The fitting error is a normalized index accounting for the data contribution within the noise subspace, i.e., the orthogonal complement to the signal subspace
where
is the least squares (LS) estimate of the vector .
It is worth noting that, by increasing the iteration number m, which represents the dimensionality of the signal subspace, the fitting error from Equation (32) decreases. Accordingly, it is enough to verify the fitting error condition just for , whereas for the detection rule in Equation (30) reduces to
As for the SNR in Equation (31), the power of the mth scattarer is evaluated as
where is the last (mth) component of in Equation (33).
Regarding to the noise power , in [23] the authors did not provide any information on the adopted estimation strategy. However, assuming the nonzero-mean Gaussian model for the looks (see Section 2.1), Equation (33) turns out to be the MLE of the backscattering coefficients and, thus, the MLE of the noise level can also be exploited [15]
Some considerations are now in order.
It can be shown that, for , the fitting error condition is equivalent to the one on the SNR, thus the test turns out to always be equivalent to that in Equation (34) or, in other words, the condition on the fitting error is redundant.
Furthermore, it can be shown that the test in Equation (34) is equivalent to the multi-look GLRT for the pair derived by assuming the looks following the nonzero-mean Gaussian model. However, differently from the GLRT, which exploits the MLEs of all the unknown parameters, the test in Equation (34) makes use of the parameter vectors provided by the highest peaks of the Capon reconstruction. It has been empirically demonstrated, however, that simple peaks location leads to the worst results in terms of resolution even with respect to the method based on signal orthogonal projections. Additionally, the corresponding test statistic is always lower than the one of the “full” GLRT rule (which is maximized by the MLEs).
These considerations make evident the difficulty to derive, in the context of super-resolution multi-look detection, an effective Capon-based detection scheme. On the other hand, multi-look SGLRTC does not provide super-resolution capabilities, differently from the sup-GLRT proposed in article [16], which however has been designed for the single-look case. Accordingly, in the next subsection, we derive the multi-look version of the sup-GLRT.
2.5. Proposed Multi-Look Sup-GLRT Detection Algorithm
The single-look sup-GLRT detector and its fast implementation proposed in references [16,17], respectively, are described in Section 2.3. Such schemes carry out the estimation of the parameters vector without imposing the orthogonally of the corresponding directions, thus achieving satisfactory performances also when multiple interfering PSs below the (tomographic) Rayleigh resolution are present in the same pixel. Accordingly, to profitably exploit such feature also when the processed datasets are characterized by low SNRs, in this section, we propose the extension of the sup-GLRT detector to the multi-look case. Additionally, for the fast implementation of the multi-look sup-GLRT, a Capon reconstruction is also proposed.
Let us consider a set of L independent and homogeneous looks, modeled according to the nonzero-mean statistical characterization (see Section 2.1), which extends the model exploited in [16] to the multi-look case. By supposing the presence of up to two scatterers, the first stage of the multi-look sup-GLRT implements the decision rule
where , defined as in Equation (6), represents the sampled correlation matrix of the exploited looks, and is given by Equation (22). Moreover,
is the joint MLE of the parameters vector under .
The second stage, instead, operates the decision according to the rule
where and are still given by Equation (21), and
is the MLE of the parameter vector under .
It is worth noting that, assuming the zero-mean statistical model for the exploited looks, Equations (37) and (39) can be shown to be still the decision rules of the multi-look sup-GLRT only if (scatterers with the same power level).
Similar to the single-look counterpart, a fast implementation of the proposed multi-look detector can be obtained by splitting the joint estimate into two decoupled estimates and , the latter performed as
The estimate is given, instead, by the position corresponding to the highest peak of the multi-look tomographic reconstruction. However, differently from the (single-look) fast implementation proposed in [17,27] which exploits the Beam-Forming reconstruction, we prefer to use the Capon reconstruction carried out on the selected looks. Indeed, the capability of the Capon filter to mitigate the leakage effect should guarantee a better estimate of the parameters vector when multiple interfering PSs are actually present in the same pixel, thus improving also the subsequent estimate in Equation (41).
3. Results
To test the effectiveness of the proposed detection scheme, experiments were carried out on two datasets involving highly urbanized environments. The first dataset was acquired by the TerraSAR-X sensors over the city of Bucharest in the area of the national arena; the second one by the COSMO-SkyMED sensor on the city of Rome. Sensors and datasets characteristics are summarized in Table 1.
The two datasets were analyzed with both single- and multi-look sup-GLRT. The estimate of the parameter vector associated to the dominant was used for implementing the fast version of the detector. In the proposed multi-look solution, this vector was provided by the Capon reconstruction, which is expected to reduce the leakage effect. With this regard, before starting with the analysis of the detection performances, a comparison of the elevation estimates achieved by Capon and BF was first performed with reference to the Bucharest dataset, which is characterized by a poor vertical resolution.
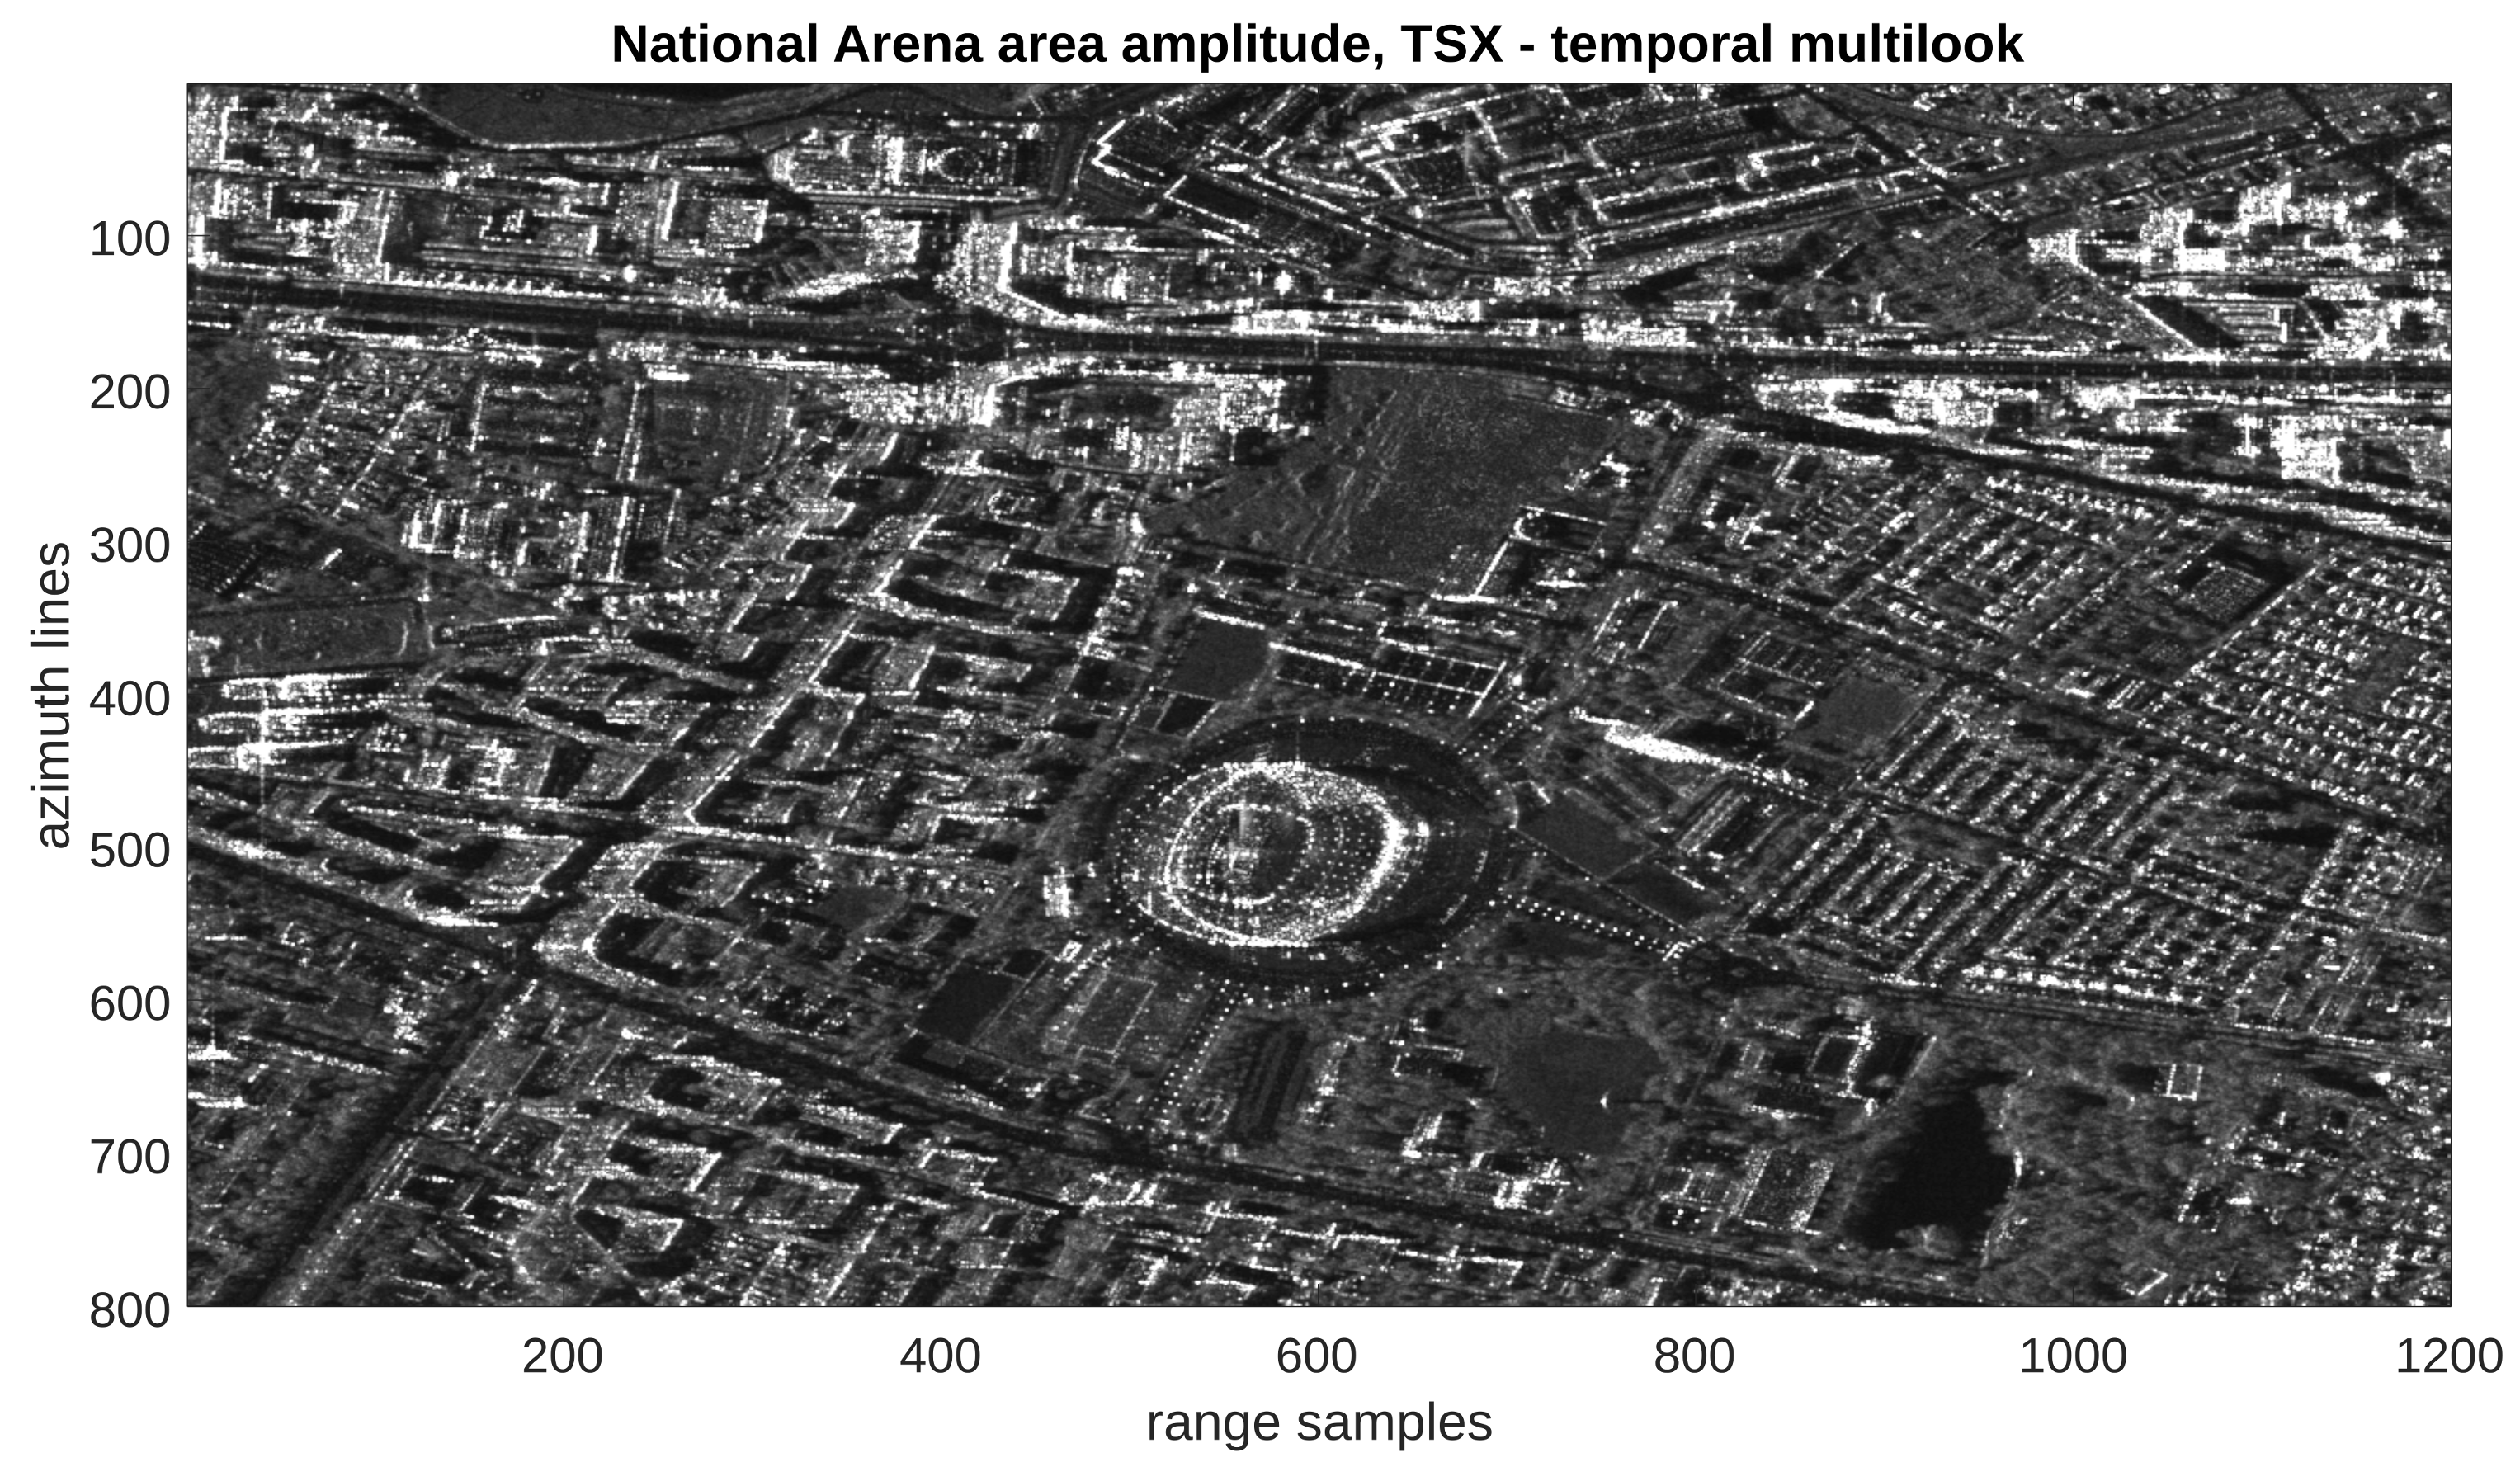
The TerraSAR-X dataset over the Bucharest national arena area is composed by 32 (SLC) images of 800 (azimuth) × 1200 (range) pixels, acquired between July 2011 and December 2012 with the system operating in the stripmap, single polarization mode. Orbits are descending, the spatial 2-D resolution is 2 m in azimuth and 1 m in range. Figure 1 shows the (temporal) multi-look amplitude image corresponding to the investigated area, i.e., the result of an averaging on all the available acquisitions.
The acquisitions are distributed on the so-called spatial/temporal baselines domain, as shown in Figure 2, with a span of 432 m and 528 days. The corresponding Rayleigh elevation resolution is about 23 m; this number converts vertically to about 14 m, which compares with the average building height in the area. The Rayleigh resolutions along the linear deformation rate and thermal dilation equals 1 cm/year and 0.35 mm/°C, respectively. Based on the limited spatial extension of the analyzed area, the data were calibrated for the APS by compensating for a constant phase offset.
The adaptive (spatial) multi-look operation was carried out via a Kolmogorov–Smirnov (KS) test [19,28]: The search window was set to 9 × 9 pixels and 25 pixels were selected inside each window.
The reconstructions in Equations (9) and (11) were carried out in the 4-D space, by exploiting the statistically similar looks selected as described above for the covariance matrix estimation. The RT (elevation) interval was scanned in the [−60, 60] m interval with a 3 m spacing, the MDV interval was set to [−2.5, 2.5] cm/year with a spacing of 0.25 cm/year.
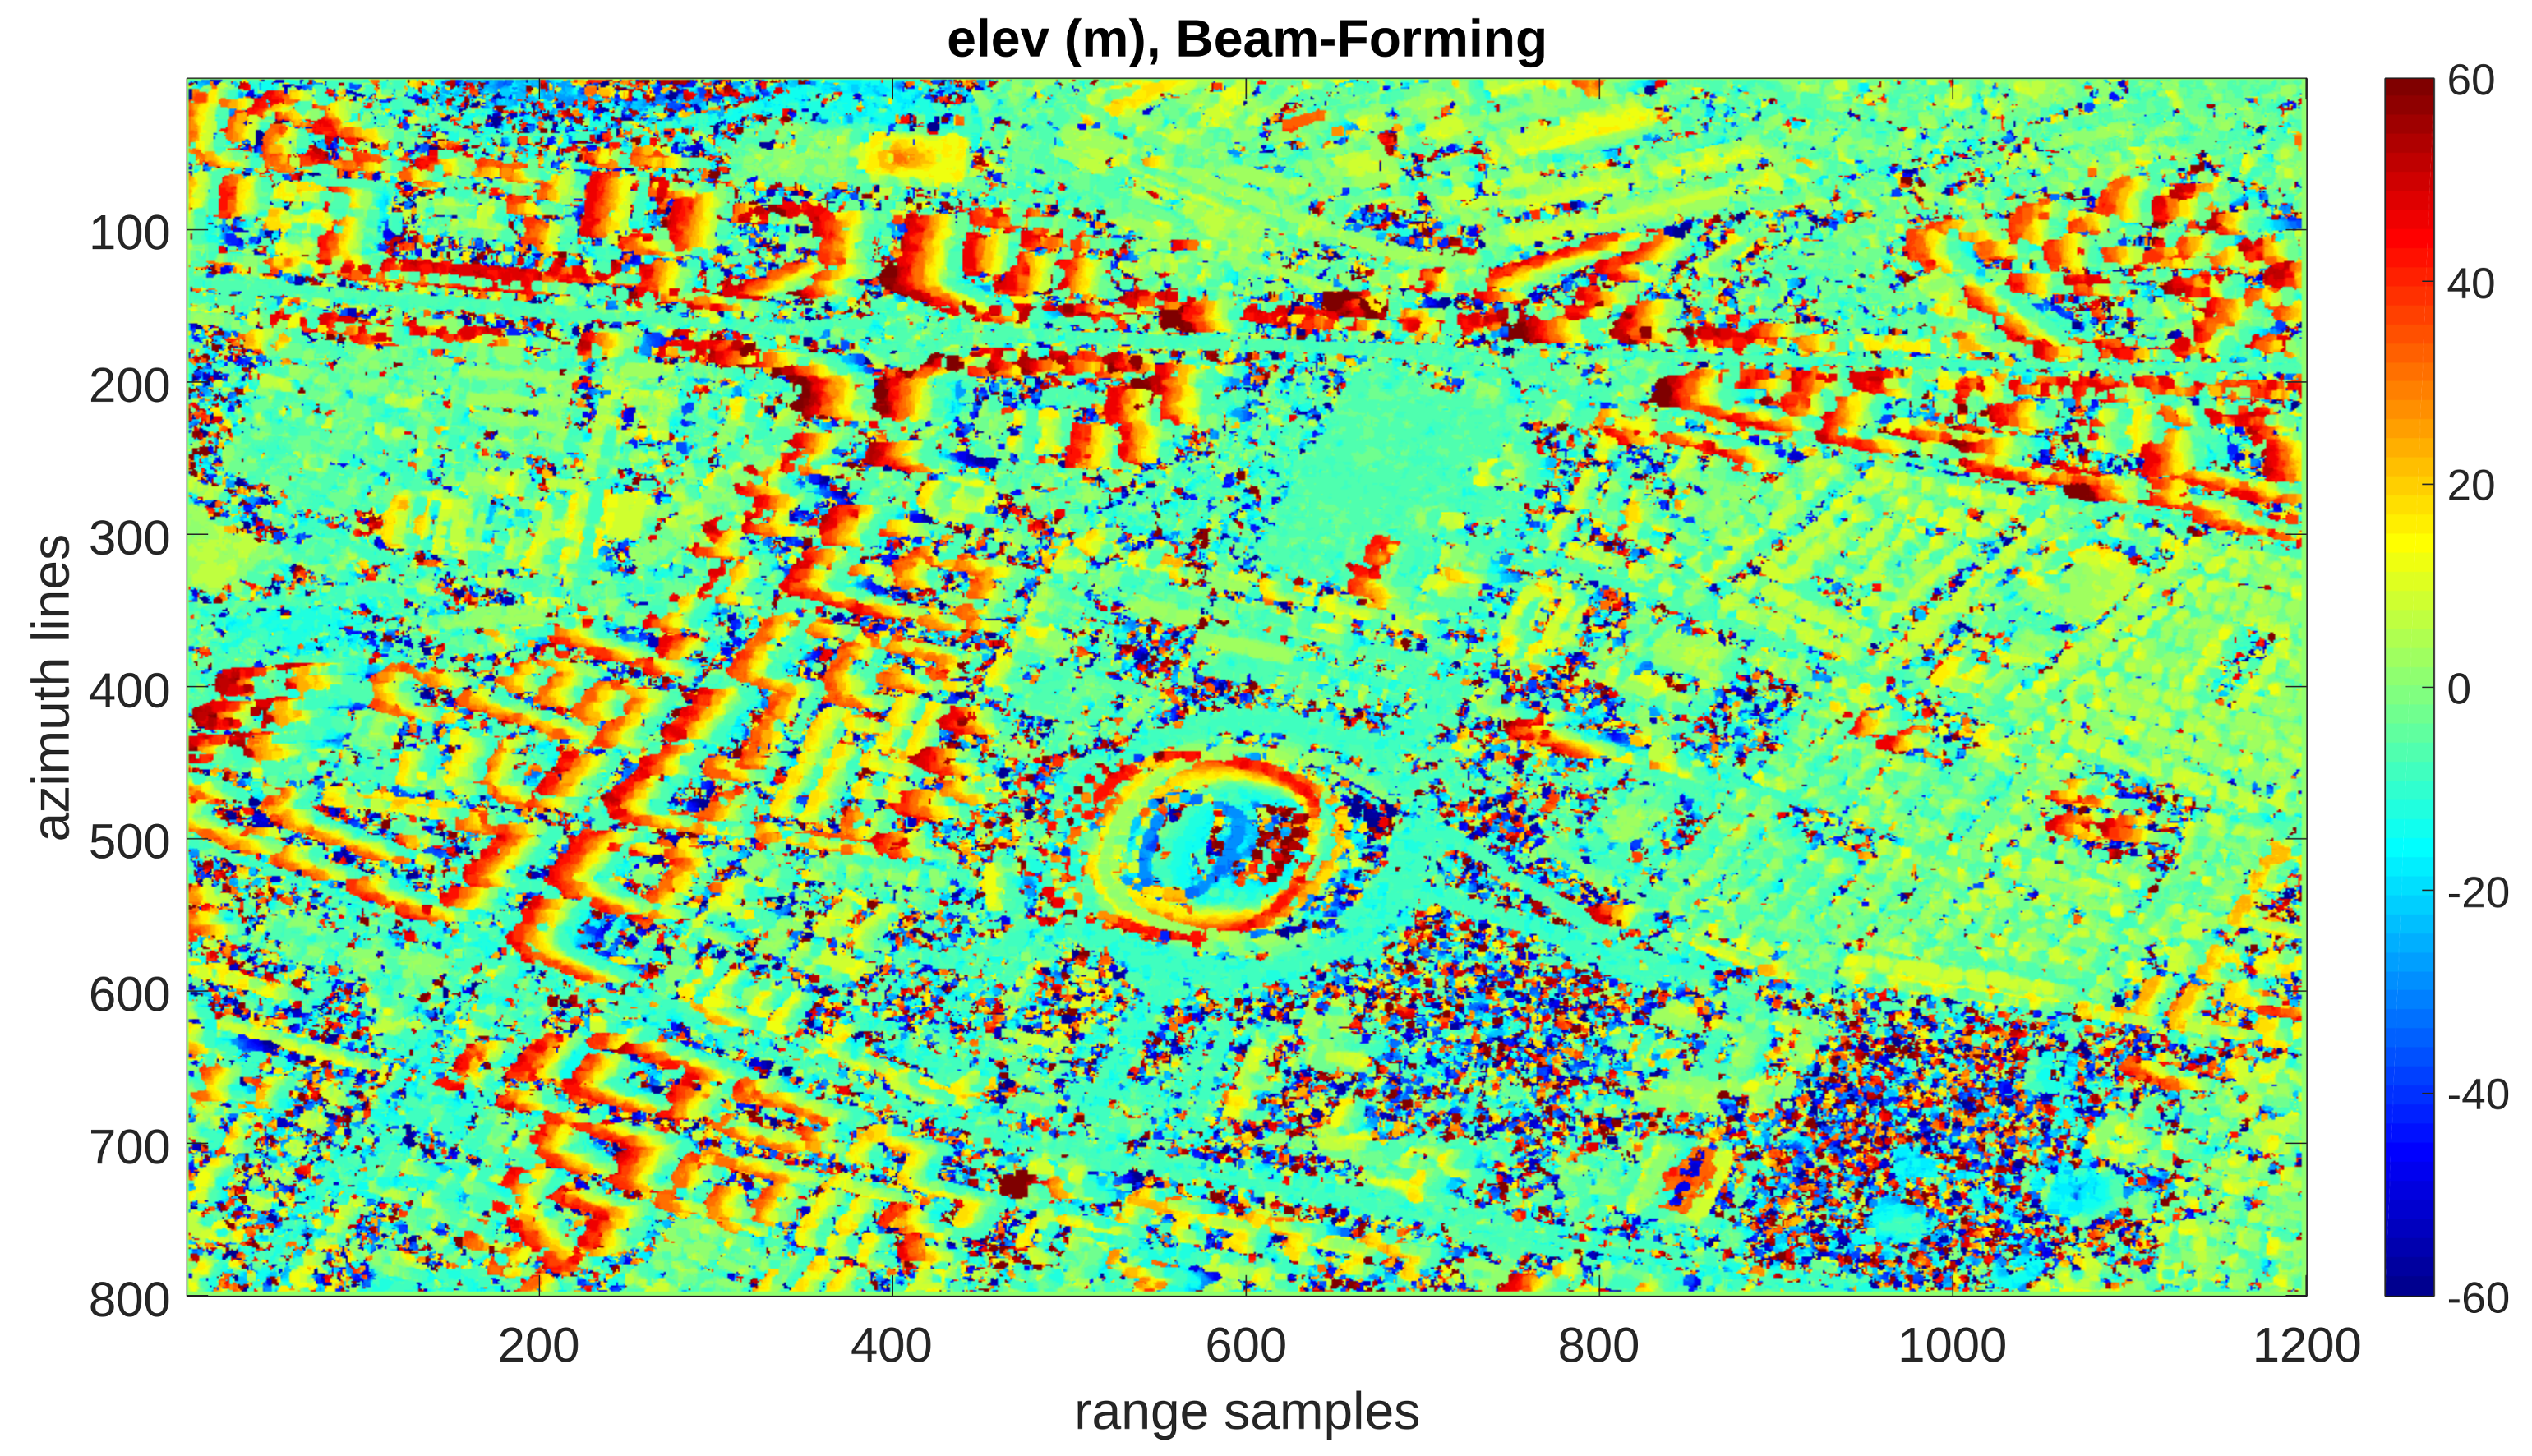
The elevation map of the dominant scatterers, i.e., for each pixel, the positions of the highest peak of the tomographic reconstruction, is shown in Figure 3 for the Beam-Forming (Figure 3a) and Capon (Figure 3b). The comparison of the two maps shows that the better leakage mitigation associated with Capon leads to a generally less noisy reconstruction with respect to the plain BF. For this reason, although characterized by a higher computational cost due to the inversion of the covariance matrix, the Capon filter is considered in the implementation of the detection multi-look fast sup-GLRT scheme.
This detection scheme was then applied to select the monitored PSs. The adaptive KS test was again used for the estimation. Due to the presence of metallic structures in the test area, which can be sensitive to the phenomenon of thermal dilations, the 5-D case was considered. The TD coefficient interval [−1.6, 1.6] mm/°C was scanned with a sampling step of 0.2 mm/°C.
Figure 4 shows the maps of the detected single (Figure 4a,b) and higher double (Figure 4c,d) PSs, when the single-look (Figure 4a,c) and multi-look (Figure 4b,d) fast sup-GLRT were used. Colormaps were set according to the estimated RT (elevation). The results show a significant increase of the detection performance achieved by the multi-look detector with respect to the single-look processing. This increase is particularly evident for the double scatterers, which were mainly identified on almost all the structures extending vertically. All pixels belonging to the top of the stadium, as well as to the roofs of the residential buildings in the neighborhood, were in fact detected as double scatterers, whereas single scatterers were mostly located on the ground. The thermal dilation map of the detected PSs, which is not reported for sake of brevity, shows that the highest values corresponded to the metallic structures, including the stadium.
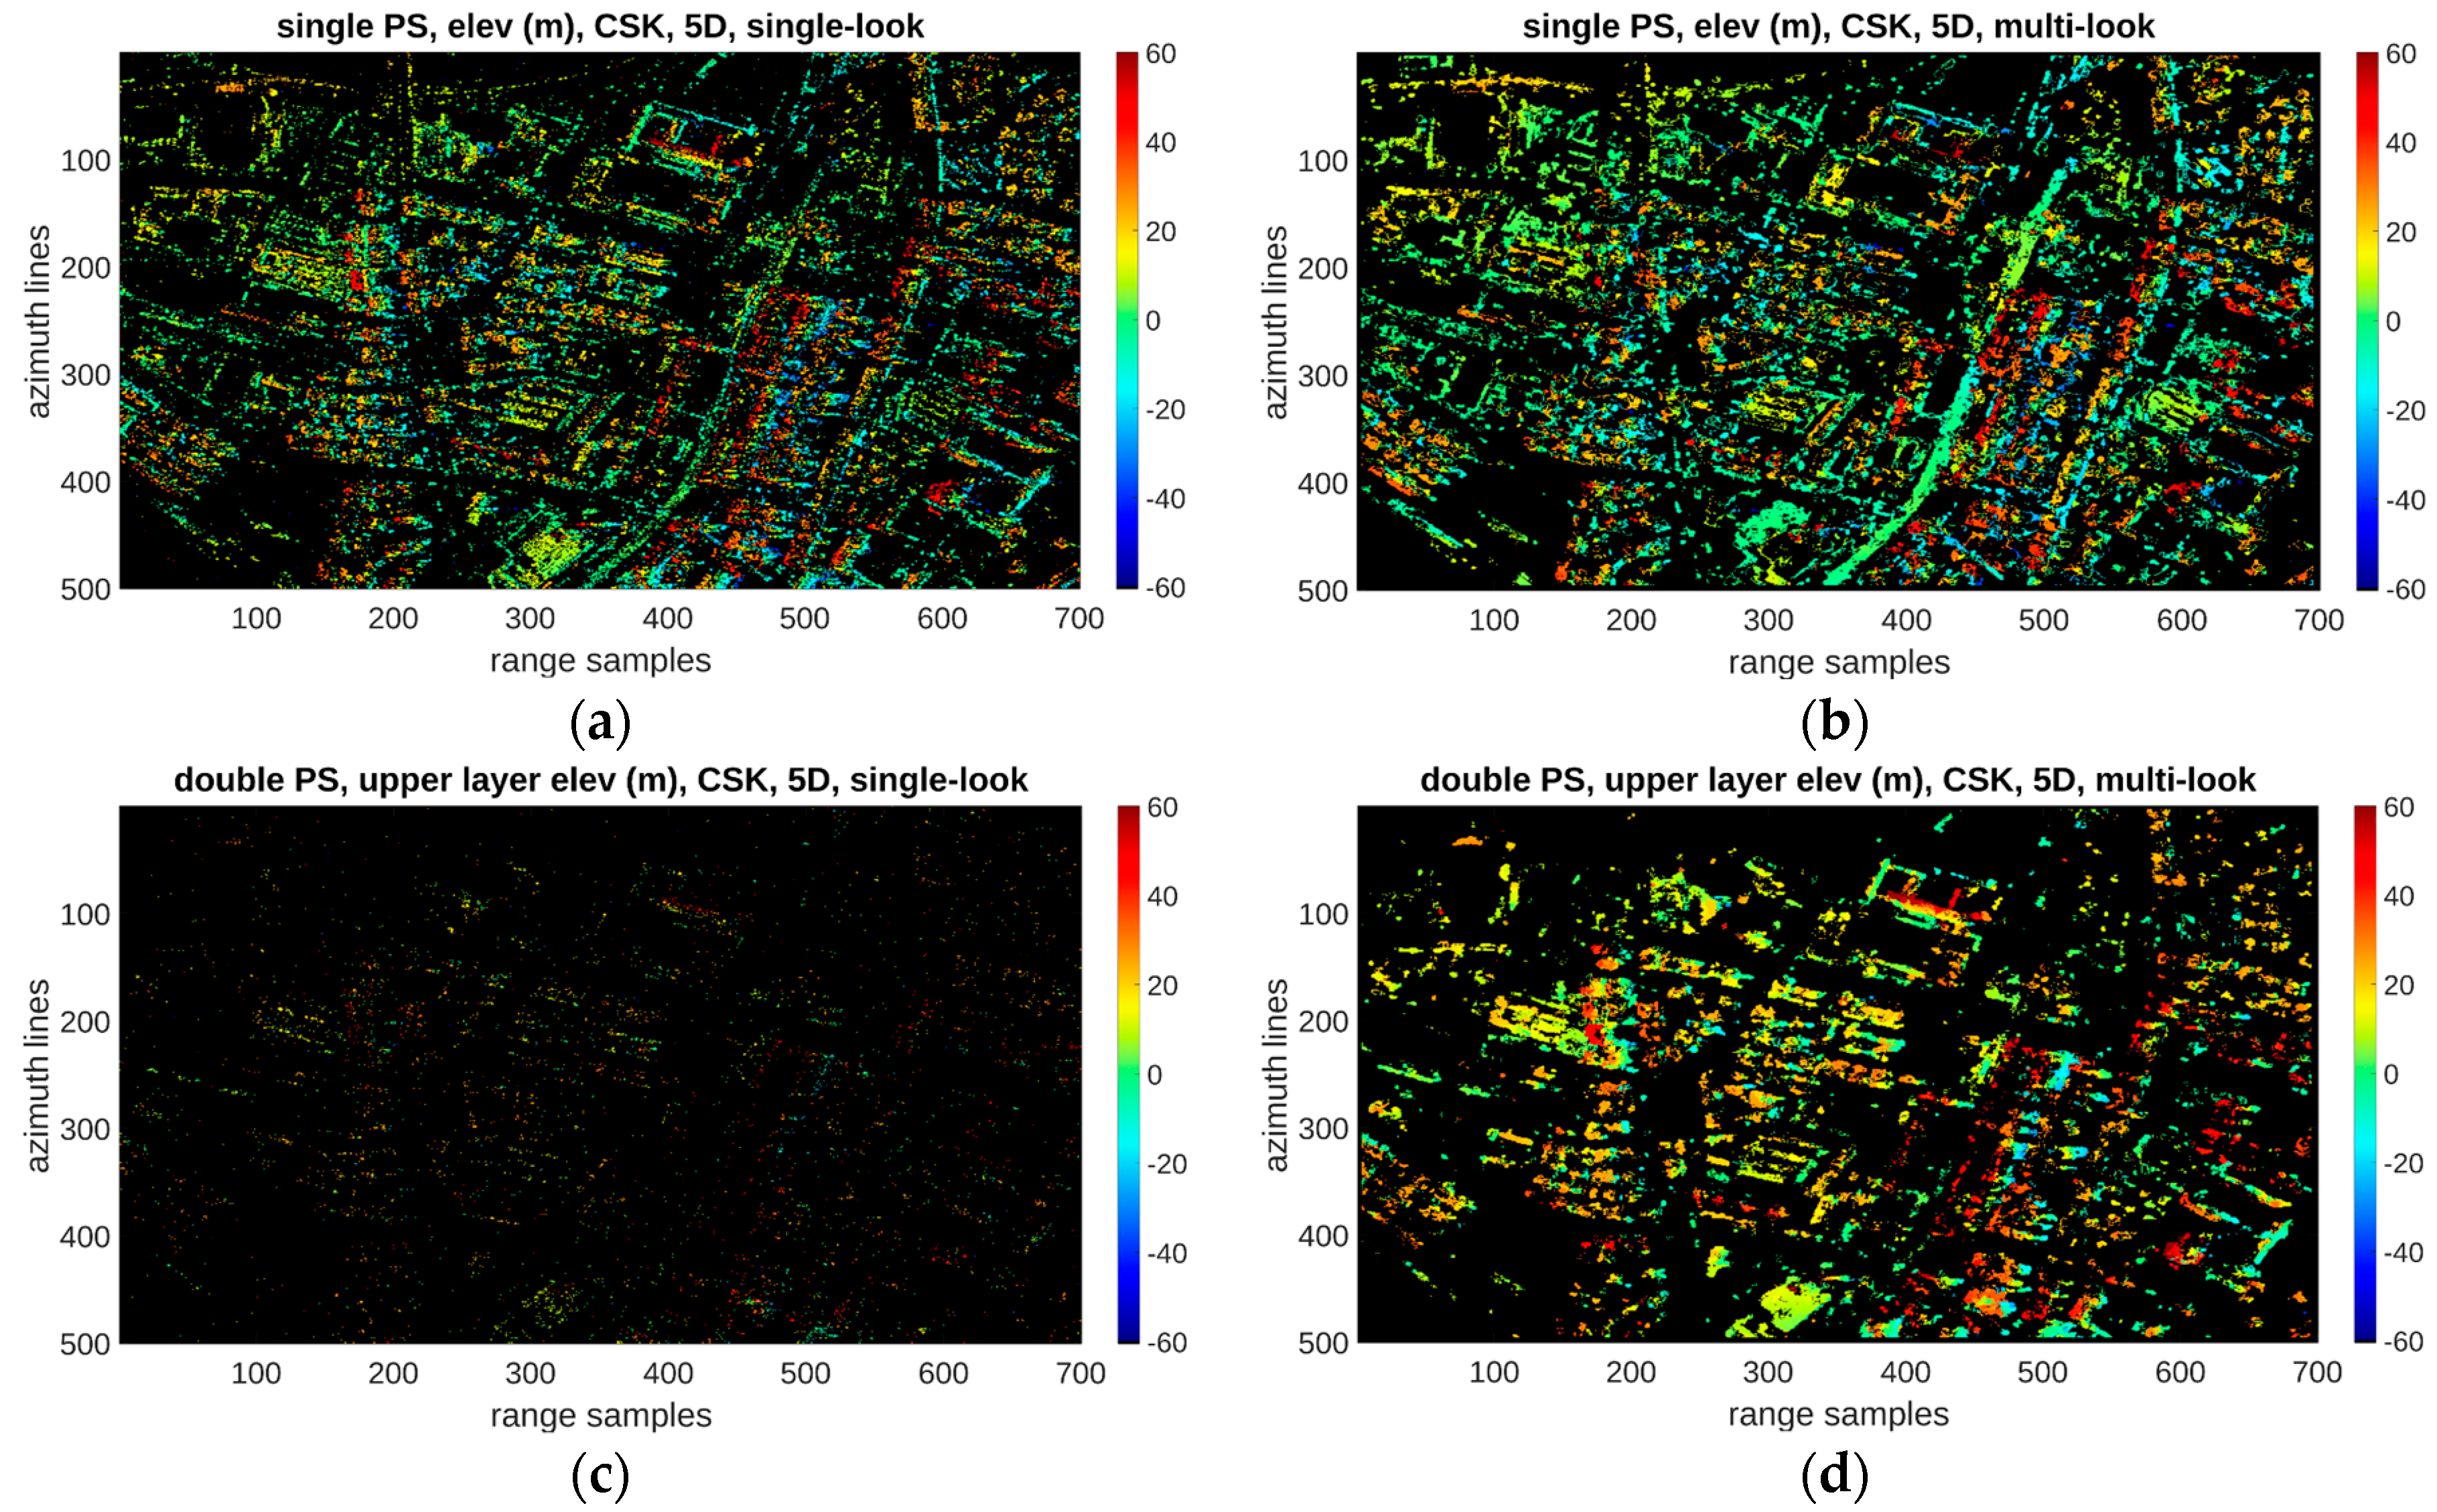
The COSMO-SkyMED dataset over the city of Rome is composed by 29 (SLC) images of 500 (azimuth) × 700 (range) pixels, acquired between April 2011 and October 2012 by the Cosmo-SkyMed constellation, operating in the stripmap image mode on ascending orbits, with a resolution of 3 m in azimuth and 1.45 m in range.
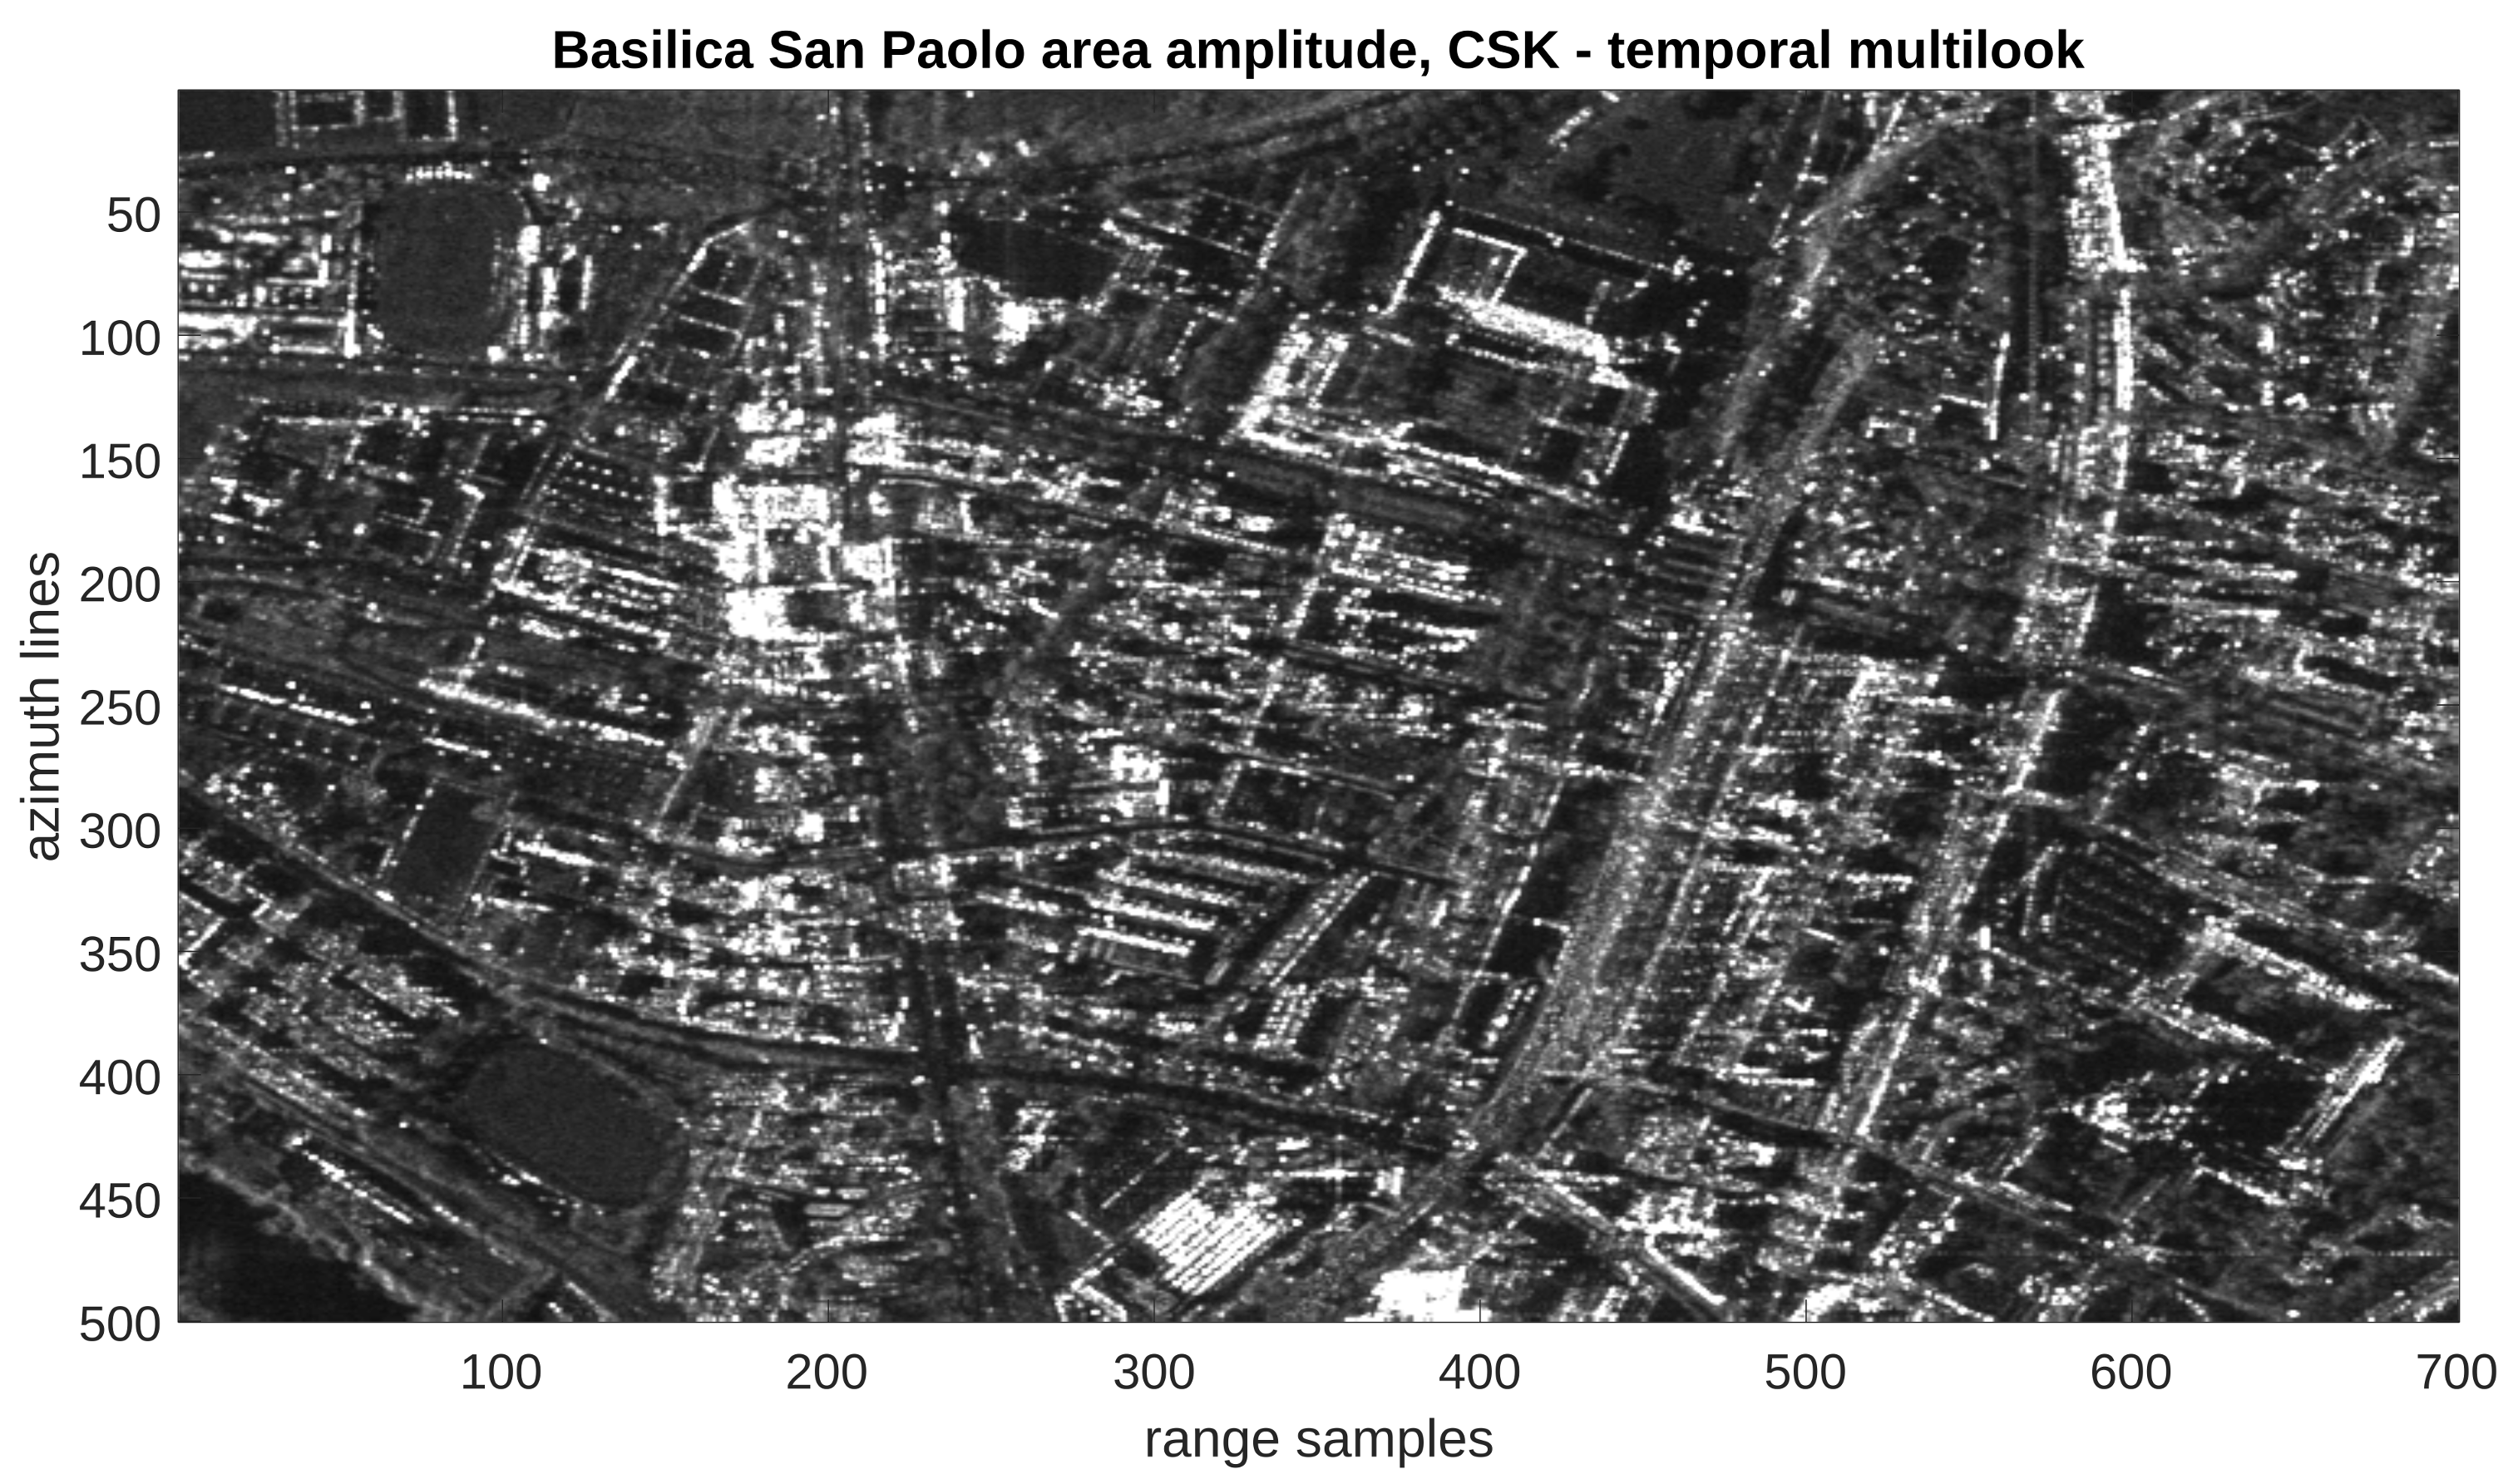
Figure 5 shows multi-look master image amplitude of the investigated area. The adaptive multi-look method based on the KS test was implemented also in the case of this dataset, again by setting the search window to 9 × 9 pixels and selecting 25 pixels inside each window. The acquisitions are distributed on the spatial/temporal baselines domain as in Figure 6, with a span of 1469.2 m and 556 days. The Rayleigh resolution is equal to 7.89 m in elevation and therefore much better than the Bucharest case. For linear deformation (MDV), the resolution is 1 cm/year, hence comparable to the previous case, whereas for the thermal coefficient the resolution decreases to 0.8 mm/°C.
The APS was compensated in this case by exploiting a two-scale analysis: APS was extracted at the stage of low resolution processing (see reference [5]).
The estimation and detection processes were carried in 5-D space, over a uniformly discretized grid, picked over the RT (elevation) interval [−60, 60] m with a spacing of 1 m, the MDV interval [−2.5, 2.5] cm/year with 0.25 cm/year spacing and the TD coefficient interval [−1.6, 1.6] mm/°C with a spacing of 0.4 mm/°C.
4. Discussions
Results achieved by the processing of the two datasets shows the capabilities of multi-look sup-GLRT in providing higher densities of detected PS. Moreover, detected double scatterers well matched the building and structures developed vertically, which are subject to the effects of layover.
To quantitatively compare the detection performance of the proposed multi-look detector with that of its single-look counterpart, the number of detected single and double PSs and their percentages with respect to the total number of pixels interested by the detection of at least one stable target are synthetized in Table 2 for both processed datasets.
Table 2 shows that, with respect to the single-look, the multi-look processing provides a significant increase on the total number of the detected scatterers (singles plus twice the doubles). Moreover, the percentages highlight the better capability of the multi-look processing in detecting the double PSs, also with respect to the single-look analysis reported in the literature [29,30]. The numerical results in Table 2, along with the visual evidence in Figure 4 and Figure 7, allow concluding that many single scatterers detected by the single-look processing were detected as double scatterers by the multi-look processing. Table 2 also shows a significant increase of the detected double scatterers in the case of Cosmo-SkyMed dataset with respect to the TerraSAR-X case: this can be ascribed to the higher elevation resolution. Lower Rayleigh resolution along the elevation calls for super-resolution detection capability but this impacts negatively the detection rate, as demonstrated in reference [25] where an analysis of the detection rates as a function of the super-resolution ratio is performed for the single-look case.
In the following, we follow lines for a validation of the results.
First, it is worth noting that a visual comparison of the estimated heights for the single- and multi-look case achieved on both datasets, shown in Figure 4 for TerraSAR-X and Figure 7 for the COSMO-SkyMED case, provides evidence of a spatial consistency of the results for the single as well as double scatterers. For both single- and multi-look processing, high estimated heights for the double scatterer case are located in areas where single scatterers also show the presence of buildings. This aspect can be analyzed on those pixels where the single-look processing declares the presence of single PSs, whereas the multi-look processing detects double PSs. It is reasonable to expect that the noise reduction induced by the multi-look enables to revealing the presence of an additional (weaker) scatterer, which the single-look (noisier) processing cannot detect. This is confirmed by the results in Figure 8, which is related to the COSMO-SkyMED dataset. It shows the histogram of the difference, on a common grid of pixels, between the heights associated with the single scatterers detected by the single-look processing and the closest (Figure 8a) and farthest (Figure 8b) double scatterers detected by the multi-look scheme.
Mean and standard deviation of the differences are −0.04 m and 2.6 m for the closest case, whereas for the farthest case are −0.26 m and 10.5 m, respectively. The presence of pronounced peeks in the first histogram is an indication of the consistency of the results corresponding to the single scatterers and double scatterers. Moreover, the distribution of the RT (height) separation for the farthest scatterers in the bottom histogram in Figure 8 compares well to the distribution of the heights of the buildings in the analyzed area.
Furthermore, a quantitative validation of the results, though not exhaustive, was carried out on both the processed datasets.
For the National Arena of Bucharest (TerraSAR-X dataset), 15 buildings were selected with heights between 6 and 35 m. Heights derived by Google Earth were compared with the building heights estimated by the multi-look processing. Mean and standard deviation of the absolute height differences result to be 0.65 and 0.5 m, respectively, thus confirming the effectiveness of the estimation process.
A different validation procedure was carried out on the Rome (COSMO-SkyMED) dataset.
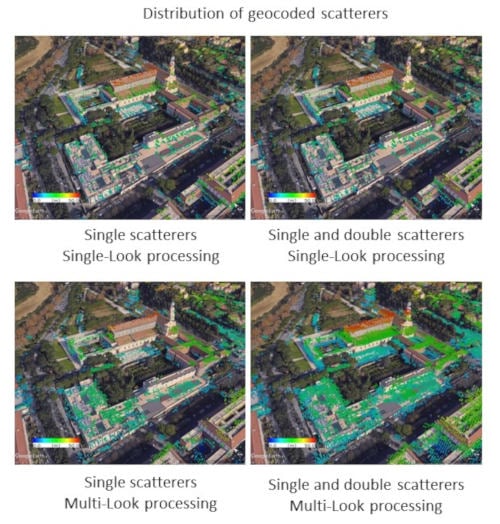
The detected targets over a proper selected area were geocoded and overlapped to the Google Earth layer corresponding to the same area. The results of this operation are shown in Figure 9. Single PSs are shown in Figure 9a,b, whereas all (single and double) PSs are shown in Figure 9c,d. Figure 9a,c, and Figure 9b,d, instead, shows single-look and multi-look processing, respectively.
The tomographic geocoded points fit well the shape of the buildings in the optical layer, thus providing evidence of the reliability of detected targets and excluding the presence of substantial errors in the estimated height parameters.
5. Conclusions
The use of multi-look allows providing improved detection of multiple scatterers with reference to the application of SAR tomography to the context of building reconstruction and monitoring. Depending on the system resolution along the elevation direction and the scene height distribution, the identification of multiple scatterers may be affected by the limitations in the detection of interfering scatterers below the Rayleigh resolution as well as by the effects of leakage.
This study deepened the investigation of possibilities related to the use of multi-look for improved detection of multiple persistent scatterers even below the Rayleigh resolution. A multi-look extension of the so-called sup-GLRT, which in the single-look case has been shown to have super-resolution capabilities, was derived. Following the literature for single-look, a fast version of such a detector was considered. The Capon inversion was exploited in this case for the reconstruction of the backscatter distribution in the tomographic domain to take benefit of its leakage mitigation characteristics. The detector showed good performance in urban areas, being able to achieve the discrimination of double interfering scatterers associated with the layover phenomenon, typically affecting highly urbanized areas. In particular, the double scatterers detection scheme was tested on TerraSAR-X data characterized by poor elevation resolution. Application of the method to Cosmo-SkyMED data, characterized by higher resolution along the elevation, further showed the importance of handling the layover problem in urban areas. Reported densities of double scatterers compare favorably to percentages reported in the literature for the single-look case.
Author Contributions
Conceptualization, C.D. G.F. and A.P; Methodology, C.D., G.F., A.P., and D.R.; Software, C.D.; Validation, G.F., A.P. and D.R.; Writing—Original Draft Preparation, C.D., A.P. and G.F.; and Supervision, G.F., A.P. and M.D.
Funding
This research received no external funding.
Acknowledgments
The authors wish to thank the German Aerospace Center for providing the TerraSAR-X dataset within the LAN1628 proposal and the Italian Space Agency for providing the COSMO-SkyMED dataset within the ASI AO Project ID2246. Selected algorithms presented in this work will be implemented within the frame of research project SPERO—Space technologies used in the management of disasters and major crises, manifested at local, national and regional levels, funded by the Romanian Minister of Research and Innovation, UEFISCDI, project reference: PN-III-P2-2.1-SOL-2016-03-0046. This work was supported by the I-AMICA project (PONa3_00363).
Conflicts of Interest
The authors declare no conflict of interest.
References
- Fornaro, G.; Pauciullo, A. Interferometric and Tomographic SAR. In Novel Radar Techniques and Applications; Scitech Publishing: London, UK, 2018; pp. 361–402. [Google Scholar]
- Ferretti, A.; Prati, C.; Rocca, F. Permanent scatterers in SAR interferometry. IEEE Trans. Geosci. Remote Sens. 2001, 39, 8–20. [Google Scholar] [CrossRef] [Green Version]
- Reigber, A.; Moreira, A. First demonstration of airborne SAR tomography using multibaseline L-band data. IEEE Trans. Geosci. Remote Sens. 2000, 38, 2142–2152. [Google Scholar] [CrossRef]
- Fornaro, G.; Reale, D.; Serafino, F. Four-Dimensional SAR Imaging for Height Estimation and Monitoring of Single and Double Scatterers. IEEE Trans. Geosci. Remote Sens. 2009, 47, 224–237. [Google Scholar] [CrossRef]
- Fornaro, G.; Lombardini, F.; Pauciullo, A.; Reale, D.; Viviani, F. Tomographic Processing of Interferometric SAR Data: Developments, applications, and future research perspectives. IEEE Signal Process. Mag. 2014, 31, 41–50. [Google Scholar] [CrossRef]
- Fornaro, G.; Pauciullo, A.; Reale, D.; Zhu, X.; Bamler, R. SAR Tomography: An advanced tool for spaceborne 4D radar scanning with application to imaging and monitoring of cities and single buildings. IEEE Geosci. Remote Sens. Soc. Newslett. 2012, 9–17. [Google Scholar]
- Budillon, A.; Evangelista, A.; Schirinzi, G. Three-Dimensional SAR Focusing from Multipass Signals Using Compressive Sampling. IEEE Trans. Geosci. Remote Sens. 2011, 49, 488–499. [Google Scholar] [CrossRef]
- Zhu, X.; Bamler, R. Very High Resolution Spaceborne SAR Tomography in Urban Environment. IEEE Trans. Geosci. Remote Sens. 2010, 48, 4296–4308. [Google Scholar] [CrossRef] [Green Version]
- Gini, F.; Lombardini, F.; Montanari, M. Layover solution in multibaseline SAR interferometry. IEEE Trans. Aerosp. Electron. Syst. 2002, 38, 1344–1356. [Google Scholar] [CrossRef]
- Biondi, F. SAR tomography optimization by interior point methods via atomic decomposition—The convex optimization approach. In Proceedings of the 2014 IEEE International Geoscience and Remote Sensing Symposium (IGARSS), Quebec City, QC, Canada, 13–18 July 2014; pp. 1879–1882. [Google Scholar]
- Lombardini, F.; Viviani, F. Single-look light-burden superresolution differential SAR tomography. Electron. Lett. 2016, 52, 557–558. [Google Scholar] [CrossRef]
- Banda, F.; Dall, J.; Tebaldini, S. Single and Multipolarimetric P-Band SAR Tomography of Subsurface Ice Structure. IEEE Trans. Geosci. Remote Sens. 2016, 54, 2832–2845. [Google Scholar] [CrossRef]
- Moreira, A.; Prats-Iraola, P.; Younis, M.; Krieger, G.; Hajnsek, I.; Papathanassiou, K.P. A Tutorial on Synthetic Aperture Radar. IEEE Geosci. Remote Sens. Mag. 2013, 1, 6–43. [Google Scholar] [CrossRef] [Green Version]
- De Maio, A.; Fornaro, G.; Pauciullo, A. Detection of Single Scatterers in Multidimensional SAR Imaging. IEEE Trans. Geosci. Remote Sens. 2009, 47, 2284–2297. [Google Scholar] [CrossRef]
- Pauciullo, A.; Reale, D.; de Maio, A.; Fornaro, G. Detection of Double Scatterers in SAR Tomography. IEEE Trans. Geosci. Remote Sens. 2012, 50, 3567–3586. [Google Scholar] [CrossRef]
- Budillon, A.; Schirinzi, G. GLRT Based on Support Estimation for Multiple Scatterers Detection in SAR Tomography. IEEE J. Sel. Top. Appl. Earth Observ. Remote Sens. 2016, 9, 1086–1094. [Google Scholar] [CrossRef]
- Budillon, A.; Johnsy, A.; Schirinzi, G. A Fast Support Detector for Superresolution Localization of Multiple Scatterers in SAR Tomography. IEEE J. Sel. Top. Appl. Earth Observ. Remote Sens. 2017, 10, 2768–2779. [Google Scholar] [CrossRef]
- Berardino, P.; Fornaro, G.; Lanari, R.; Sansosti, E. A new algorithm for surface deformation monitoring based on small baseline differential SAR interferograms. IEEE Trans. Geosci. Remote Sens. 2002, 40, 2375–2383. [Google Scholar] [CrossRef]
- Ferretti, A.; Fumagalli, A.; Novali, F.; Prati, C.; Rocca, F.; Rucci, A. A New Algorithm for Processing Interferometric Data-Stacks: SqueeSAR. IEEE Trans. Geosci. Remote Sens. 2011, 49, 3460–3470. [Google Scholar] [CrossRef]
- Fornaro, G.; Verde, S.; Reale, D.; Pauciullo, A. CAESAR: An Approach Based on Covariance Matrix Decomposition to Improve Multibaseline–Multitemporal Interferometric SAR Processing. IEEE Trans. Geosci. Remote Sens. 2015, 53, 2050–2065. [Google Scholar] [CrossRef]
- Fornaro, G.; Pauciullo, A.; Reale, D.; Verde, S. Multilook SAR Tomography for 3-D Reconstruction and Monitoring of Single Structures Applied to COSMO-SKYMED Data. IEEE J. Sel. Top. Appl. Earth Observ. Remote Sens. 2014, 7, 2776–2785. [Google Scholar] [CrossRef]
- Pauciullo, A.; Reale, D.; Franze, W.; Fornaro, G. Multi-Look in GLRT-Based Detection of Single and Double Persistent Scatterers. IEEE Trans. Geosci. Remote Sens. 2018, 1–13. [Google Scholar] [CrossRef]
- Lombardini, F.; Pardini, M. Superresolution Differential Tomography: Experiments on Identification of Multiple Scatterers in Spaceborne SAR Data. IEEE Trans. Geosci. Remote Sens. 2012, 50, 1117–1129. [Google Scholar] [CrossRef] [Green Version]
- Fornaro, G.; Serafino, F.; Soldovieri, F. Three-dimensional focusing with multipass SAR data. IEEE Trans. Geosci. Remote Sens. 2003, 41, 507–517. [Google Scholar] [CrossRef]
- Reale, D.; Fornaro, G.; Pauciullo, A. Extension of 4-D SAR Imaging to the Monitoring of Thermally Dilating Scatterers. IEEE Trans. Geosci. Remote Sens. 2013, 51, 5296–5306. [Google Scholar] [CrossRef]
- Stoica, P.; Moses, R. Spectral Analysis of Signals; Pearson Prentice Hall: Upper Saddle River, NJ, USA, 2005. [Google Scholar]
- Budillon, A.; Johnsy, A.; Schirinzi, G. Extension of a Fast GLRT Algorithm to 5D SAR Tomography of Urban Areas. Remote Sens. 2017, 9, 844. [Google Scholar] [CrossRef] [Green Version]
- Stephens, M.A. Use of the Kolmogorov-Smirnov Cramer-Von Mises and related statistics without extensive tables. J. R. Stat. Soc. Ser. B 1970, 32, 115–122. [Google Scholar]
- Siddique, M.A.; Wegmüller, U.; Hajnsek, I.; Frey, O. Single-Look SAR Tomography as an Add-On to PSI for Improved Deformation Analysis in Urban Areas. IEEE Trans. Geosci. Remote Sens. 2016, 54, 6119–6137. [Google Scholar] [CrossRef]
- Zhu, X.; Bamler, R. Superresolving SAR tomography for multidimensional imaging of urban areas: Compressive sensing-based TomoSAR inversion. IEEE Signal Process. Mag. 2014, 31, 51–58. [Google Scholar] [CrossRef]
Figure 1.
Amplitude of the test area from the TerraSAR-X dataset (National Arena in Bucharest, Romania), averaged across dataset’s acquisitions.
Figure 1.
Amplitude of the test area from the TerraSAR-X dataset (National Arena in Bucharest, Romania), averaged across dataset’s acquisitions.

Figure 2.
Distribution of the acquisitions, depicted as circles, in the temporal/spatial baseline domain. Red circle corresponds to the master acquisition.
Figure 2.
Distribution of the acquisitions, depicted as circles, in the temporal/spatial baseline domain. Red circle corresponds to the master acquisition.

Figure 3.
Maps of the estimated dominant scatterers elevation, corresponding to the peaks of the BF (a) and Capon (b) reconstructions. Colormap is in meters and set according to the estimated elevation.
Figure 3.
Maps of the estimated dominant scatterers elevation, corresponding to the peaks of the BF (a) and Capon (b) reconstructions. Colormap is in meters and set according to the estimated elevation.


Figure 4.
Distribution of the detected single scatterers (a,b) and higher double (c,d) scatterers, for single-look (a,c) and multi-look (b,d) analysis. Colormap is in meters and set according to the estimated elevation.
Figure 4.
Distribution of the detected single scatterers (a,b) and higher double (c,d) scatterers, for single-look (a,c) and multi-look (b,d) analysis. Colormap is in meters and set according to the estimated elevation.

Figure 5.
Amplitude of the test area from the COSMO-SkyMED dataset relevant to the Basilica S. Paolo area in Rome, Italy, averaged across dataset’s acquisitions.
Figure 5.
Amplitude of the test area from the COSMO-SkyMED dataset relevant to the Basilica S. Paolo area in Rome, Italy, averaged across dataset’s acquisitions.

Figure 6.
Distribution of the acquisitions, depicted as circles, in the temporal/spatial baseline domain. Red circle corresponds to the master acquisition.
Figure 6.
Distribution of the acquisitions, depicted as circles, in the temporal/spatial baseline domain. Red circle corresponds to the master acquisition.

Figure 7.
Distribution of the detected single scatterers (a,b) and higher double (c,d) scatterers, for single-look (a,c) and multi-look (b,d) analysis Colormap is in meters and set according to the estimated elevation.
Figure 7.
Distribution of the detected single scatterers (a,b) and higher double (c,d) scatterers, for single-look (a,c) and multi-look (b,d) analysis Colormap is in meters and set according to the estimated elevation.

Figure 8.
Histograms of the differences on a common grid of pixels between the residual topography (height) associated with the single scatterers single-look and the closest (a) and farthest (b) double scatterer resulting from the multi-look processing.
Figure 8.
Histograms of the differences on a common grid of pixels between the residual topography (height) associated with the single scatterers single-look and the closest (a) and farthest (b) double scatterer resulting from the multi-look processing.

Figure 9.
Geocoded scatterers detected on Rome dataset for the single-look (a,b) and multi-look (c,d) cases for the single scatterers (a,c) and both single and double scatterers (b,d).
Figure 9.
Geocoded scatterers detected on Rome dataset for the single-look (a,b) and multi-look (c,d) cases for the single scatterers (a,c) and both single and double scatterers (b,d).


Table 1.
Detected single and double PSs for single-look (SL) and multi-look (ML) sup-GLRT.
| TSX | CSK | |
|---|---|---|
| number of acquisitions | 32 | 29 |
| time span | July 2011–December 2012 | April 2011–October 2012 |
| incidence angle | 37.32° | 34° |
| range resolution | 1.17 m | 1.47 m |
| azimuth resolution | 3.3 m | 3 m |
| Rayleigh resolution | 23 m | 7.89 m |
| wavelength | 3.1 cm | 3.1 cm |
| sensor altitude | 500.54 km | 628.15 km |
| beam ID | strip_010 | H4-05 |
| acquisition mode | stripmap | stripmap |
| orbit direction | descending | ascending |
Table 2.
Detected single and double PSs for single-look (SL) and multi-look (ML) sup-GLRT.
| Dataset | PS | SL Detections | ML Detections | SL Percentage | ML Percentage |
|---|---|---|---|---|---|
| TSX | single | 11,6065 | 25,0899 | 97.17% | 76.7% |
| double | 3380 | 7,5934 | 2.83% | 23.3% | |
| CSK | single | 5,3415 | 7,2279 | 91.99% | 59.9% |
| double | 4648 | 4,8220 | 8.01% | 40.1% |
© 2018 by the authors. Licensee MDPI, Basel, Switzerland. This article is an open access article distributed under the terms and conditions of the Creative Commons Attribution (CC BY) license (http://creativecommons.org/licenses/by/4.0/).
Share and Cite
MDPI and ACS Style
Dănișor, C.; Fornaro, G.; Pauciullo, A.; Reale, D.; Datcu, M. Super-Resolution Multi-Look Detection in SAR Tomography. Remote Sens. 2018, 10, 1894. https://0-doi-org.brum.beds.ac.uk/10.3390/rs10121894
AMA Style
Dănișor C, Fornaro G, Pauciullo A, Reale D, Datcu M. Super-Resolution Multi-Look Detection in SAR Tomography. Remote Sensing. 2018; 10(12):1894. https://0-doi-org.brum.beds.ac.uk/10.3390/rs10121894
Chicago/Turabian StyleDănișor, Cosmin, Gianfranco Fornaro, Antonio Pauciullo, Diego Reale, and Mihai Datcu. 2018. "Super-Resolution Multi-Look Detection in SAR Tomography" Remote Sensing 10, no. 12: 1894. https://0-doi-org.brum.beds.ac.uk/10.3390/rs10121894
Note that from the first issue of 2016, this journal uses article numbers instead of page numbers. See further details here.