Technical Note

Rockfall Simulation Based on UAV Photogrammetry Data Obtained during an Emergency Declaration: Application at a Cultural Heritage Site

1
Geological Survey of Spain, Ríos Rosas 23, 28003 Madrid, Spain
2
Department of Civil Engineering, University of Alicante, P.O. Box 99, E-03080 Alicante, Spain
3
Geological Survey of Spain, Urb. Alcázar del Genil 4. Edificio Zulema, 18006 Granada, Spain
*
Author to whom correspondence should be addressed.
Remote Sens. 2018, 10(12), 1923; https://doi.org/10.3390/rs10121923
Submission received: 15 October 2018 / Revised: 17 November 2018 / Accepted: 27 November 2018 / Published: 30 November 2018
(This article belongs to the Special Issue Landslide Hazard and Risk Assessment)

Abstract

:
In recent years, there was an increasing number of studies focusing on rockfalls due to their impacts on social and sustainable development. This work carries out a three-dimensional (3D) simulation of rockfalls at a cultural heritage site nearby the village of Cortes de Pallás (Valencian Community, East Spain). The simulation is based on data collected previously, during an emergency declaration due to the occurrence of a considerable rockfall (7980 m3) on the southern bank of the Cortes de Pallás reservoir, on 6 April 2015. The hydroelectric power plant was damaged, and the main access road to the village of Cortes de Pallás was blocked for eight months. The predominant discontinuities of the rock mass were analyzed by means of the application of structure from motion (SfM) photogrammetry techniques to the set of images taken by remotely piloted aircraft systems (RPAS). The average size of the block was determined as 3.2 m in diameter and 17.6 m3 in volume. Additionally, a digital elevation model (DEM) was generated from an aerial laser scanning (ALS)-derived point cloud using a 1 × 1 grid. These data were implemented in RocPro3D software, obtaining the distances traveled by the blocks detached from different source areas at a cultural heritage site located near the rockfall event, which presents the same geological context. The simulation presented herein shows aggravating circumstances that endanger the cultural heritage area, with higher rockfall hazards than previous official studies (1991) displayed.

Graphical Abstract

1. Introduction

Rockfalls are the most frequent and dangerous rock movements in mountainous zones, generating high economic and social damages [1,2]. The danger is mainly due to the high speed of the falling rocks that, in terms of defining protective measures, is translated into the difficulty of achieving fast response times [3,4,5,6]. Rockfalls occur because of different instability mechanisms, detachments, rollovers, displacement of wedges, etc. from source areas located in the rock. These source areas are not randomly distributed, and are conditioned by geological, geomorphological, and environmental factors [7]. The source areas that originate the movements are mostly controlled by existing discontinuities, such as joints, faults, etc. [8,9,10].
Currently, the landslide research community is focusing on advances in the early detection of precursor mechanisms and on the temporal prediction of detachments. The rock slopes affected by progressive ruptures provide a series of early indicators, such as small deformations or micro-seismicity, which are currently the object of several analyses and studies, producing innovative work methodologies [11,12,13,14]. There are also several new contributions in optimization and simulation models for rockfalls. The interaction of the blocks with the topographic surface during successive impacts is one of the greatest challenges [15]. Recent studies include the effect of the fragmentation of blocks during impact, which can considerably modify trajectories, extensions, rebound heights, and simulated speeds [16,17]. Ruiz-Carulla et al. [18] developed the rockfall fractal fragmentation model (RFFM), where rock fragmentation starts with the disaggregation of the rock, from pre-existing discontinuities. Therefore, the correct identification of the discontinuities that affect the rock mass is crucial for successful modeling, as it determines the size of the block, which is a fundamental parameter.
The gradual evolution and application of remote-sensing techniques enabled the monitoring of rockfalls and detection of early movements, changing the state of this field. The most employed technique is light detection and ranging (LiDAR), which provides a three-dimensional point cloud (3DPC) of the scanned surface. This geometric information can be used for the characterization of detachments, production of risk and susceptibility maps, and for monitoring and modeling slides, detachments, and flows [19].
The high costs and restrictions associated with LiDAR instrumentation (e.g., high weight and occlusion areas) motivated the scientific community to investigate alternative techniques, such as structure from motion (SfM), for the development of topographic models. SfM emerged at the end of the 1970s [20] and is currently very well accepted [21], and along with multiview-stereo (MVS) algorithms, enables 3D automatic reconstruction of surfaces and does not require background knowledge from the user [22]. The SfM technique entails less costs and is easier to use than LiDAR instrumentation, as a conventional digital camera can be mounted on a remotely piloted aircraft system (RPAS). Precision is limited by the calibration model of the selected camera, but usually reaches 1:1000 (i.e., centimeter precision for 10-m distances) [22]. The resolution, precision, and quality of the point cloud generated depends not only on the photos, but also on the acquisition strategy [23] and metric information introduced in the model.
Digital surface models (DSM) include vegetation and existing constructions (buildings, roads, bridges, etc.). The analysis of rockfalls requires the use of digital elevation models (DEM) and, therefore, the classification of the 3D point cloud is a key factor to determine the surface of the terrain. DSM can be generated using interferometry [24], radargrammetry techniques [25,26], aerial laser scanning (ALS) instruments [27], or with the SfM technique [22], despite the disadvantages associated with errors and parameter sensitivity of the latter [28]. Existing software packages enable the generation of DEMs from basic topographic information (e.g., ArcView; Terrain Modeler, Intergraph; INROAD, Microstation; etc.). DEM can also be generated from 3D point clouds and from the application of classification techniques [29].
The SfM technique is widely employed by the scientific community in the field of slope and hillside stability [16,30,31,32]. Recently, its validity was demonstrated for the generation of point clouds and extraction of plane discontinuity sets for the evaluation of the stability of slopes [33]. This technique enables the identification of plane discontinuities through the application of algorithms [34,35,36,37,38,39,40,41,42], and the determination of the normal spacing of each set [43] followed by the estimation of the volume of the block.
The work presented herein utilizes data obtained during an emergency declaration due to a rockfall event that occurred in the surroundings of the village of Cortes de Pallás in 2015. There was intense media coverage because the rockfall damaged the Iberdrola hydroelectricity power plant and blocked traffic in the main access road to Cortes de Pallás for several months. The SfM technique was applied to the 2015 detachment slope to determine the average block volume, fundamental information for the simulation. The estimated average block size and the DEM generated from the analyzed area with its surface parameters extracted from scientific literature were utilized to carry out a 3D rockfall simulation at the Barranco de la Barbulla area. This area presents similar geological conditions (morphology, lithology, and structural conditions of the source areas), and is a cultural heritage site due to the presence of Moorish terraces from the 16th century. The objectives of this study were (1) to analyze the rockfall hazard that could affect new constructions located on a cultural heritage site; (2) to determine, precisely, the run-out of the simulated blocks; and (3) to update the existing rockfall hazard map [44] for the urban area.

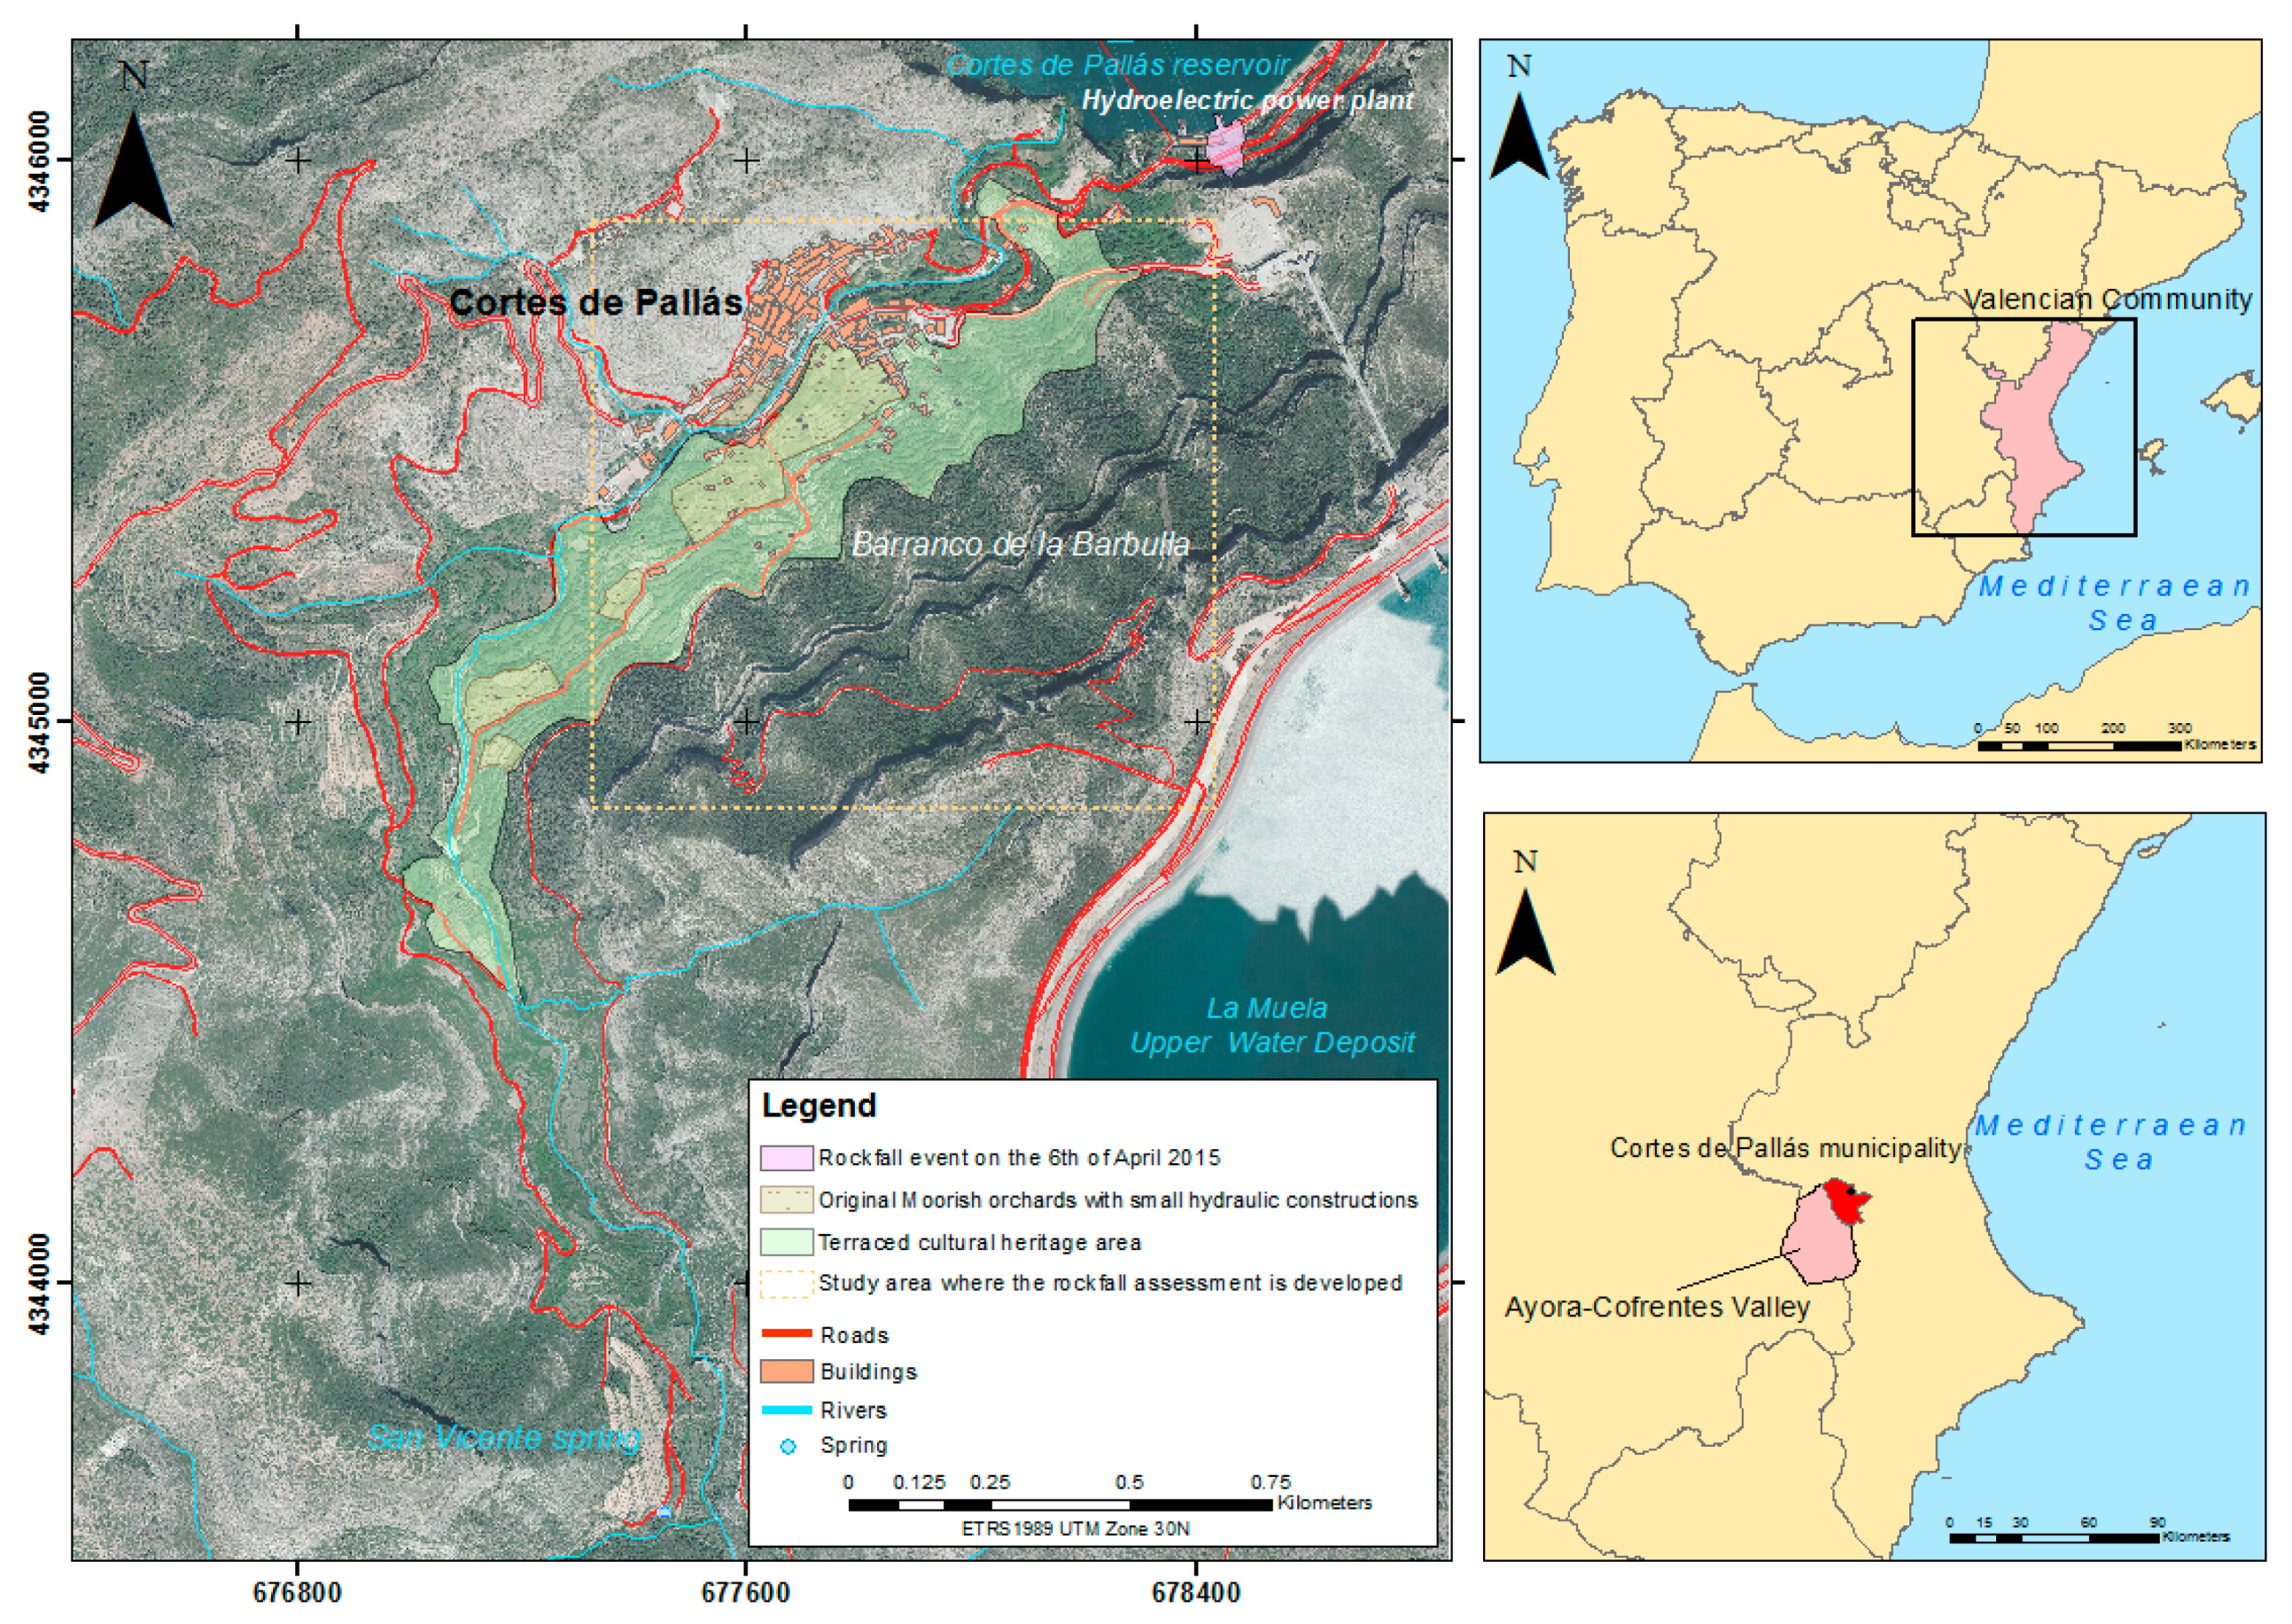
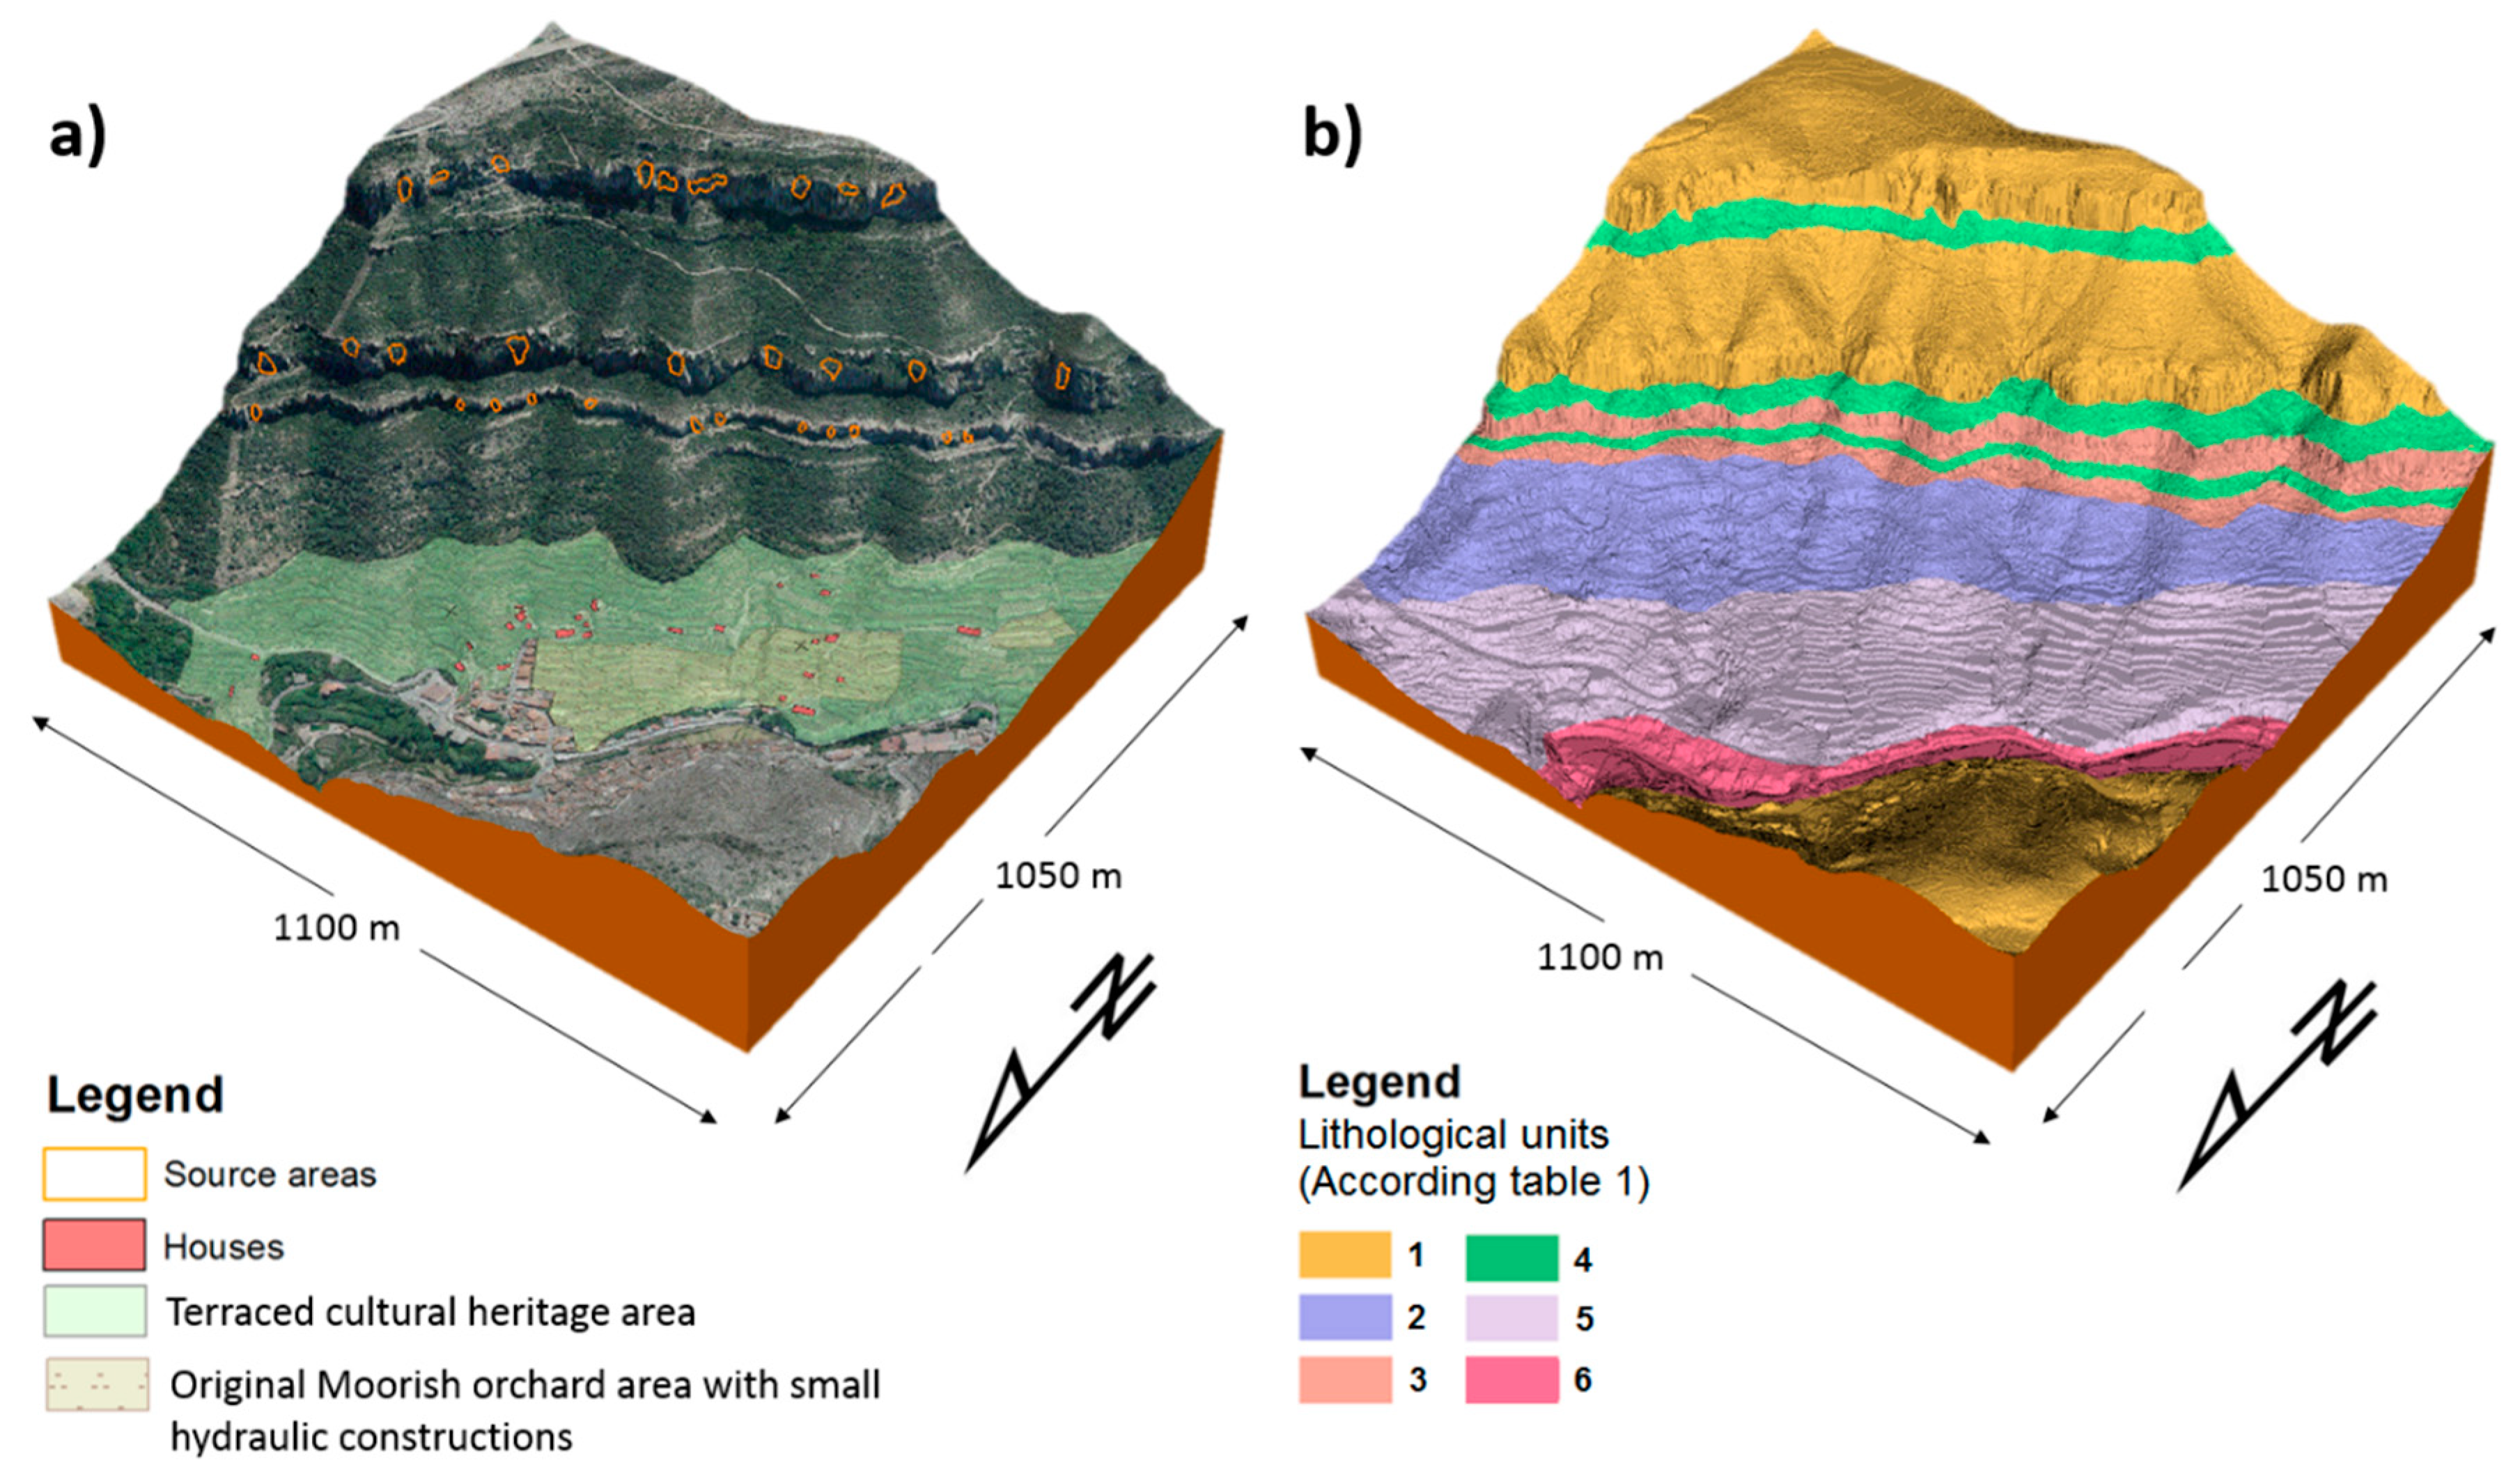
2. Test Site Description

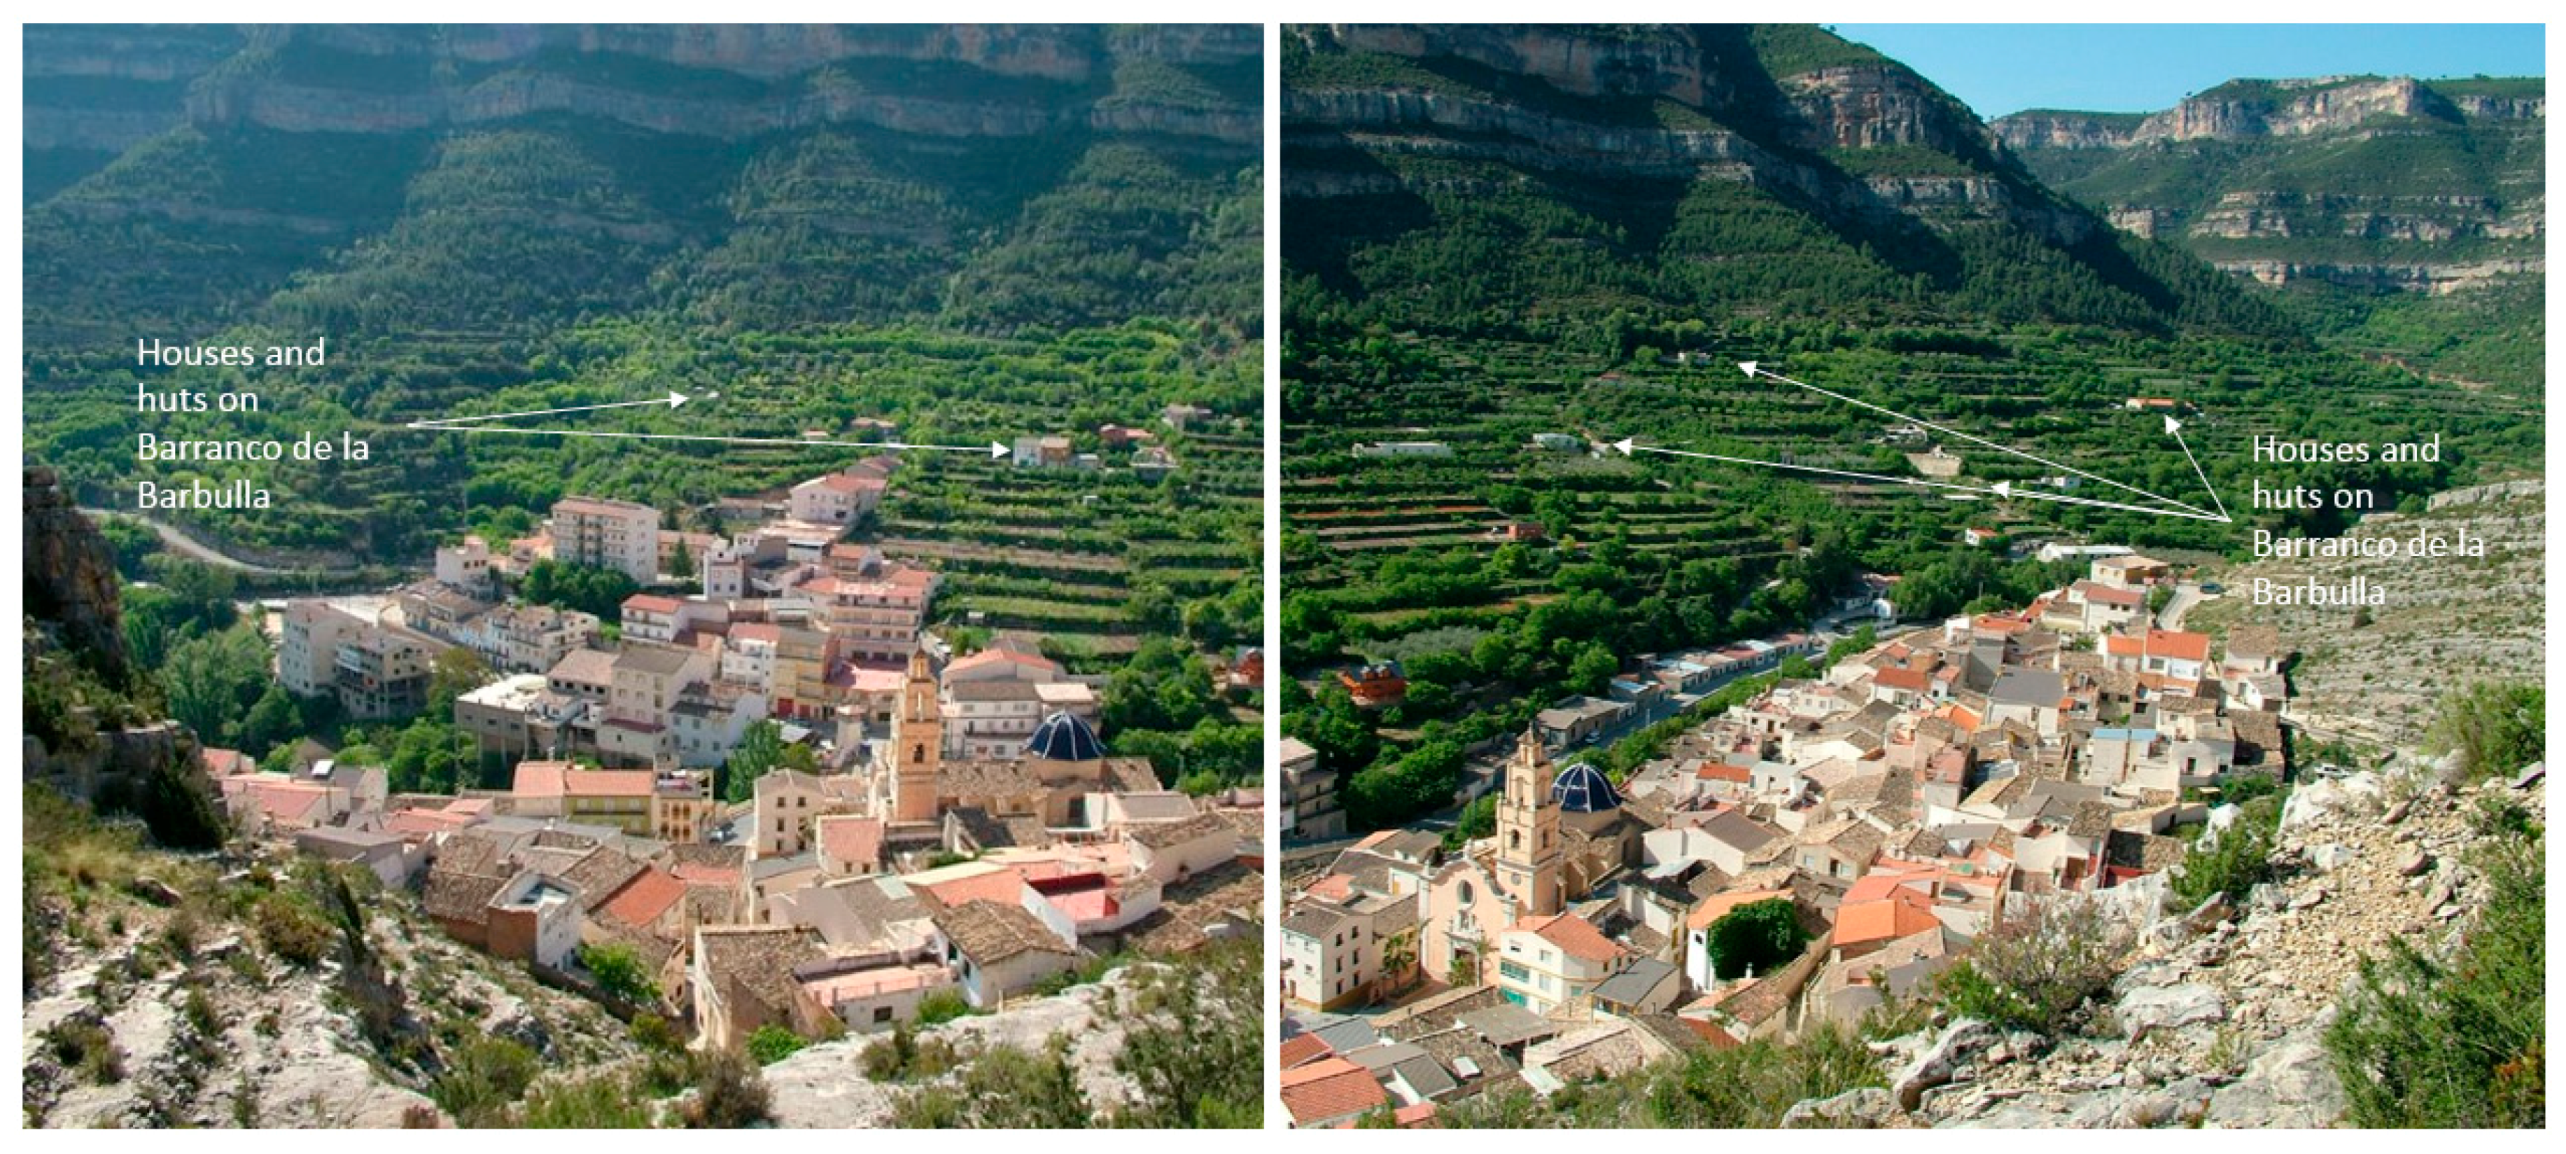
2.1. Geographic and Geological Settings

Cortes de Pallás is a municipality of the Valencia province, in the Valencian Community (Spain), situated in the region of the Ayora-Cofrentes Valley (Figure 1). It is located in a mountainous region, with steep orography constituted by a series of peaks with heights of approximately 1000 m above sea level (asl). The Júcar River crosses the region, forming an impressive canyon. The river is dammed in the Corte de Pallás reservoir, the largest pumped-storage hydroelectric scheme in Europe, which includes the Cortes de Pallás hydroelectric plant and the La Muela upper water deposit (Figure 1). The municipality of Cortes de Pallás is located on a valley bottom at the south bank of the reservoir, with a population of 876 inhabitants (Instituto Nacional de Estadística (INE) 2018).
From a geological point of view, the municipality of Cortes de Pallás is located on the most meridional reliefs of the Iberian Mountain Range, which is originally Hercynian and posteriorly Alpine, with a clear predominance of calcareous materials of marine origin from the Cretaceous age. The area is characterized by a rhythmical sequence of the superior Cretaceous, constituted fundamentally by limestone and dolomite with intercalated loamy levels. The sequence is disposed of metric–decimetric layers, with sub-horizontal geological dip [45]. The disposition of these materials generates a scenery constituted by flat-topped hills, crowned by the most competent levels of limestone and dolomite, locally named “muelas”. Because of the rhythmical deposit, there is preferential erosion in the loamy levels, leaving the hardest levels of limestone and dolomite exposed and, therefore, more vulnerable to rock detachments.
The Barranco de la Barbulla is located at the southern part of the village of Cortes de Pallás, and was transformed into terraces by the Moorish (16th century) through the construction of scalloped dry stone terraces from the bottom of the valley to the top, for the cultivation of almonds, grapevines, olives, and vegetables. The fast-flowing Sant Vicent spring was used to irrigate the terraces. Irrigation channels, reservoirs, and several small-scale hydraulic engineering systems for irrigation were built at the lower part of the slope, and currently continue to operate partially. This area is located close to the village and is represented in Figure 1 as a polygon encompassing the original Moorish orchards (Figure 2). Most of these agricultural areas were abandoned in the mid-20th century and are actually disappearing in many locations. In this sense, regional authorities are developing a specific plan to protect the entire area by nominating it as a cultural heritage site (guaranteeing that the site is maintained and preserved for the benefit of future generations). The construction of hydroelectric and nuclear power plants in the area between the 1970s and the 1980s propelled socioeconomic prosperity in Cortes de Pallás, and caused the abandonment of agriculture practices. There was uncontrolled construction of sheds, huts, and shacks for temporary housing. Currently, a series of studies are being carried out to quantify the patrimonial value of the historical terraces of Cortes de Pallás and to suggest measures for protection and conservation.

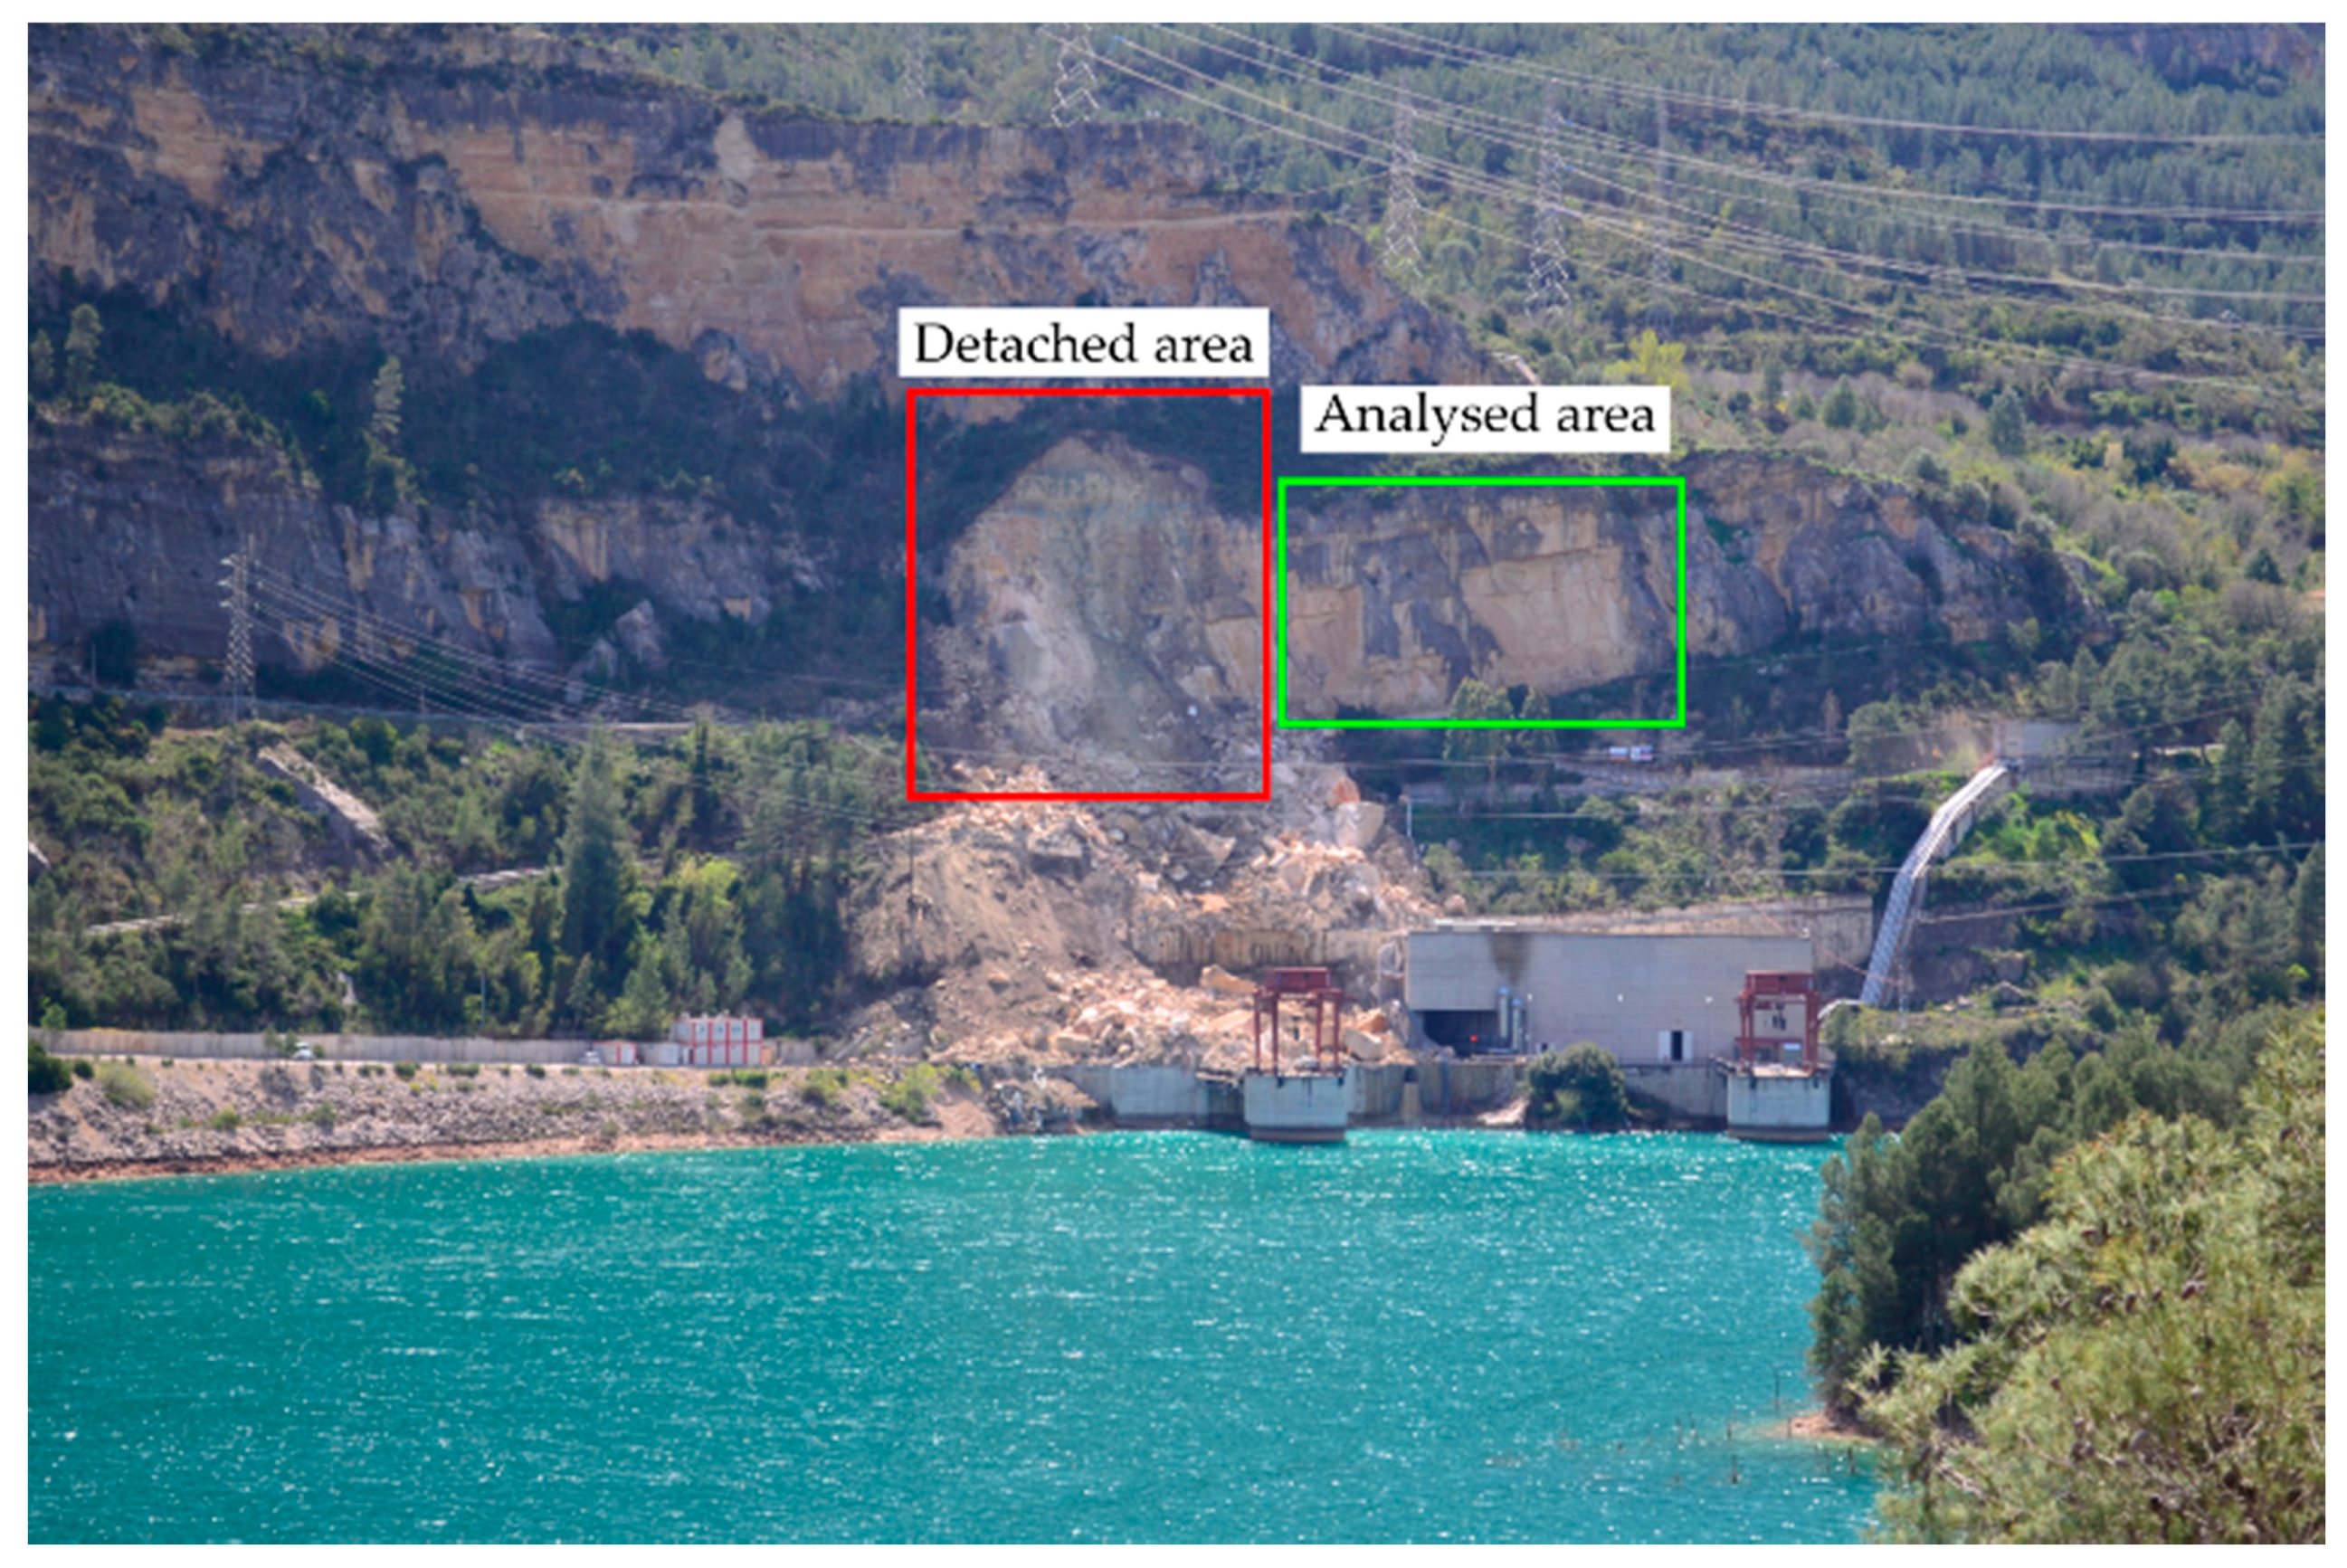
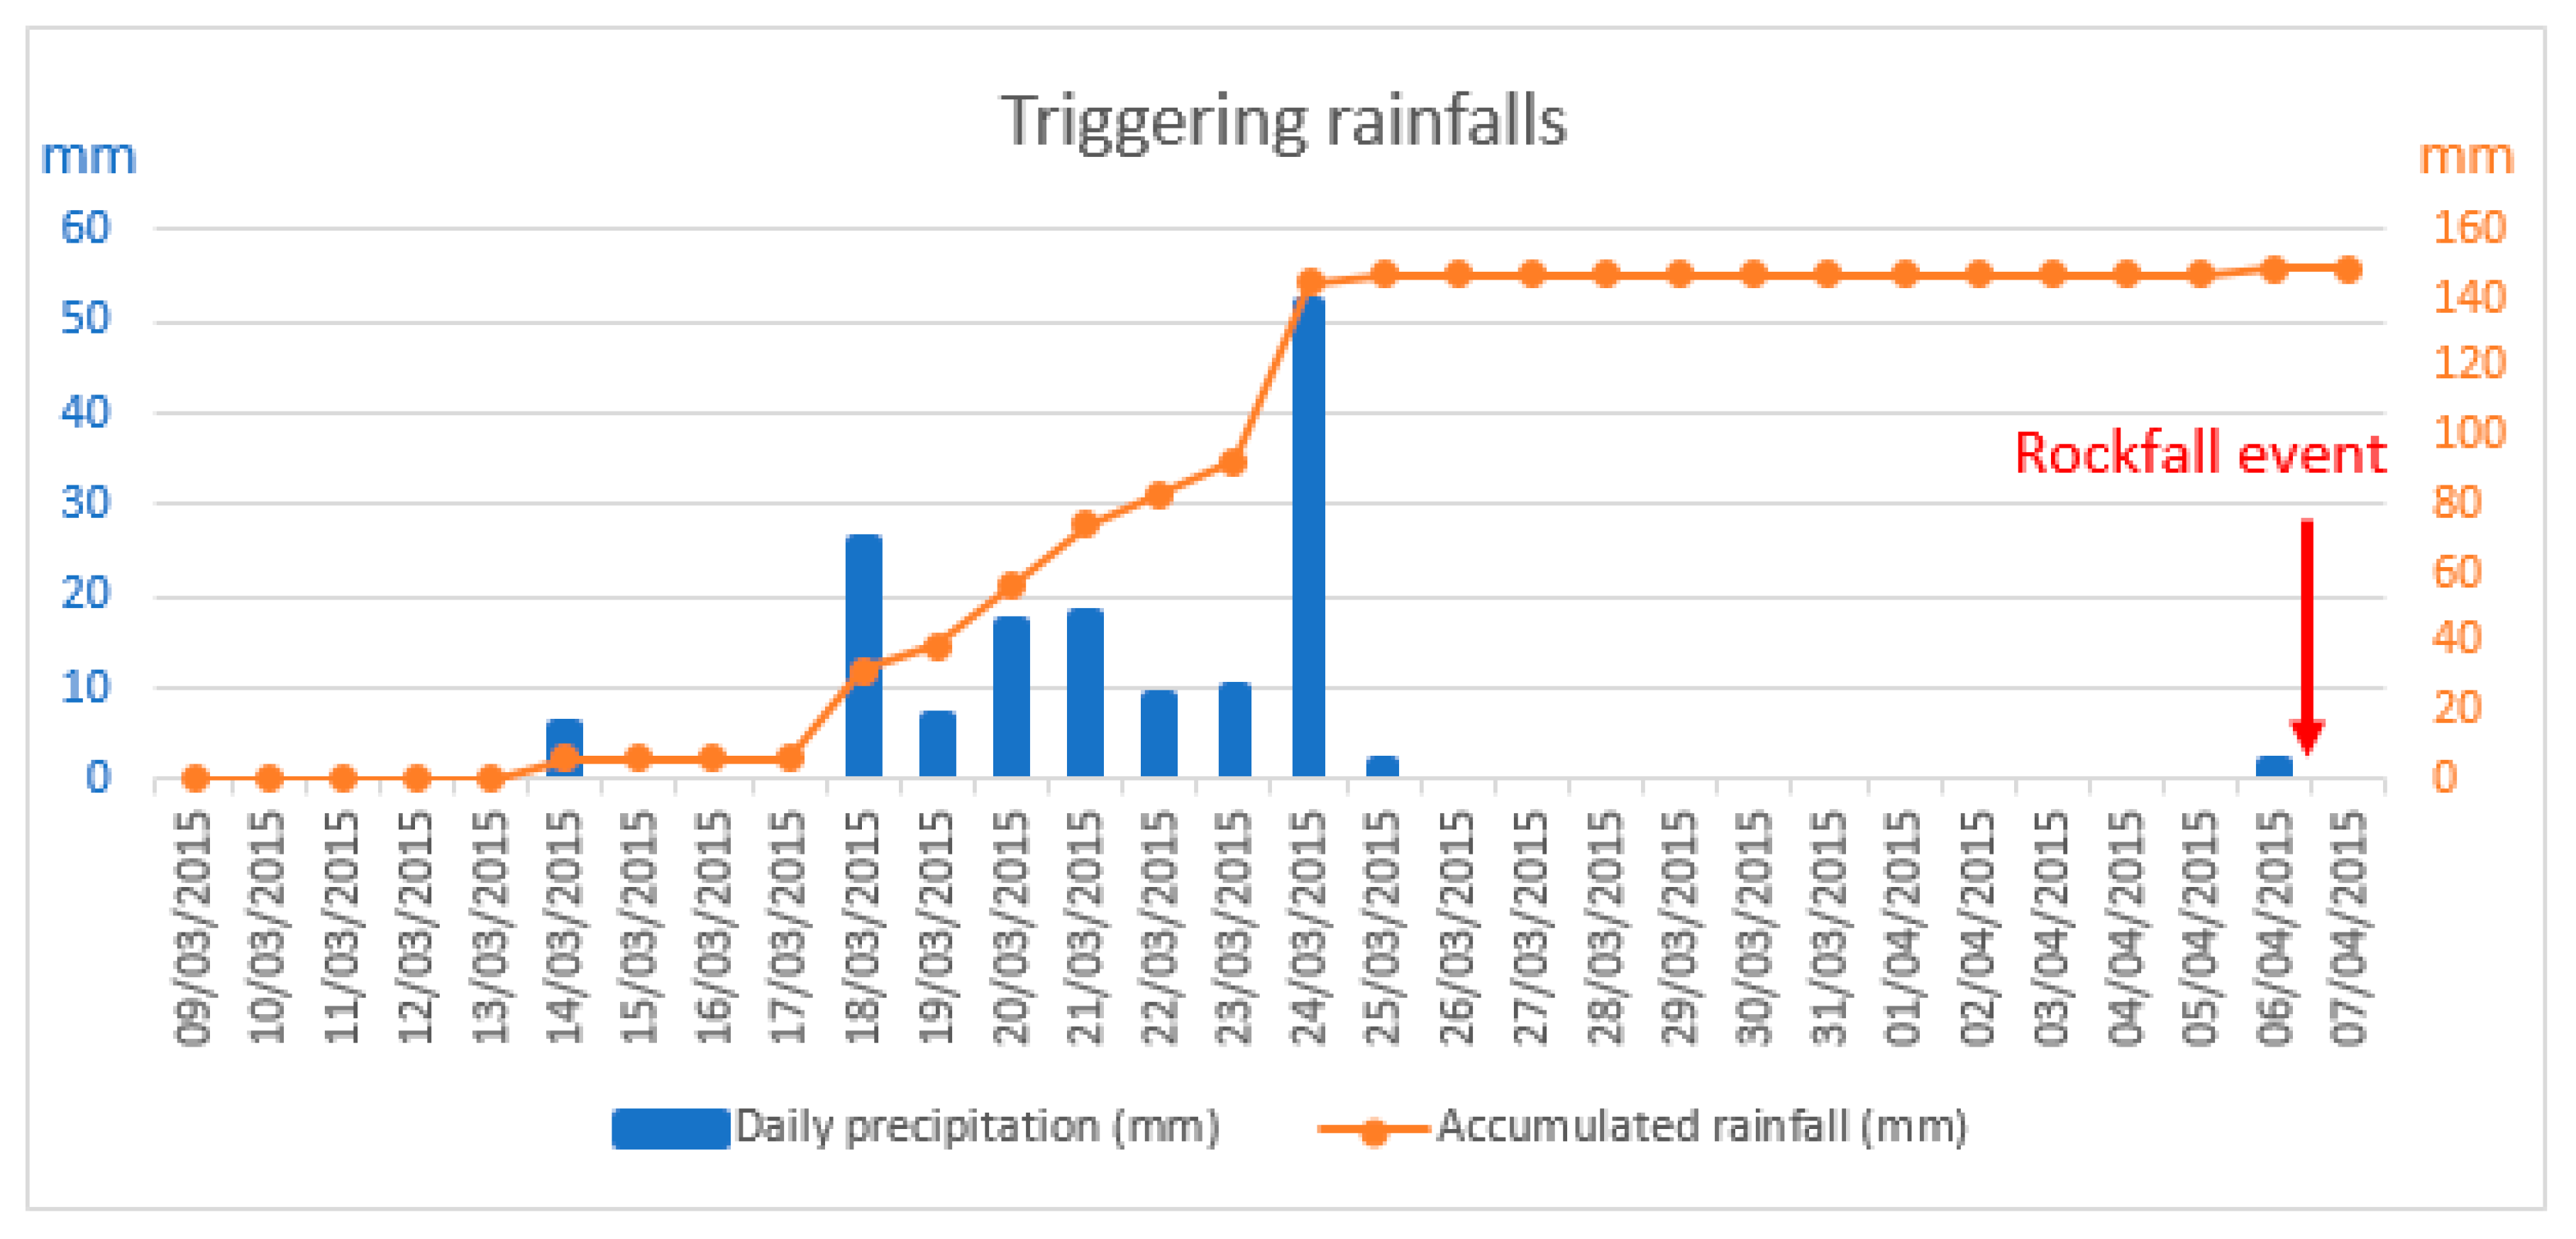
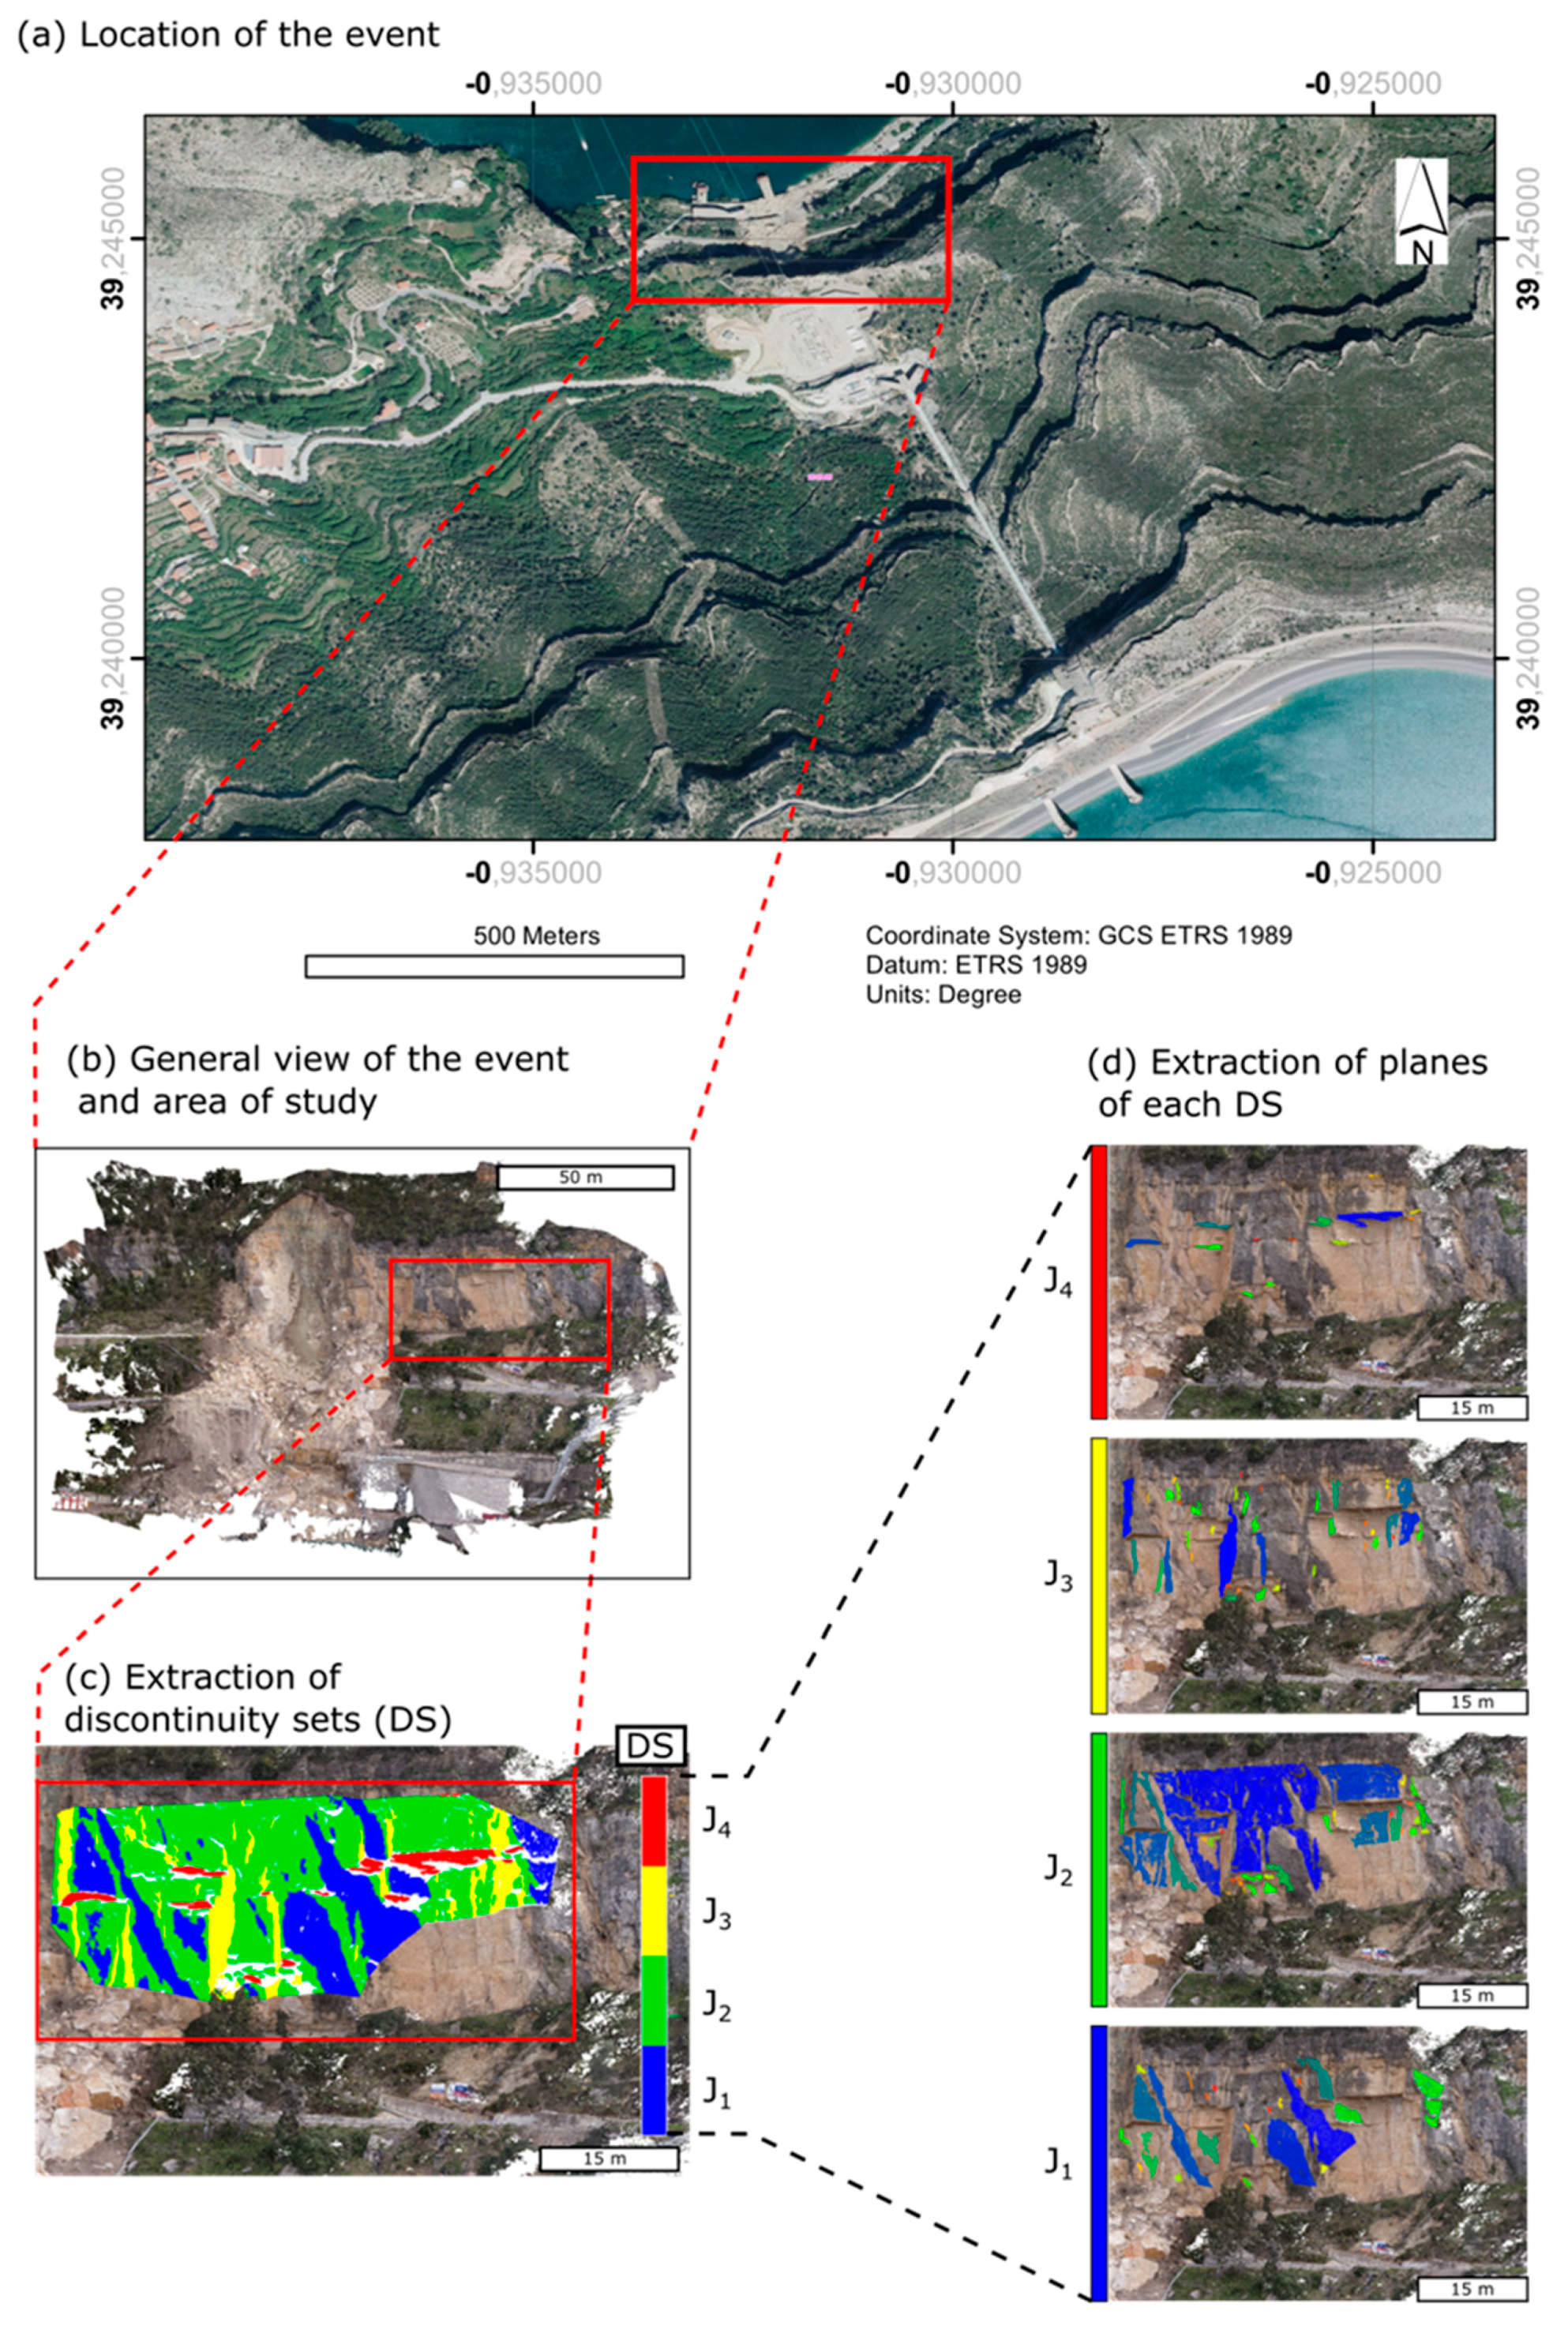
2.2. The Cortes de Pallas (Valencia, Spain) 2015 Rockfall Event
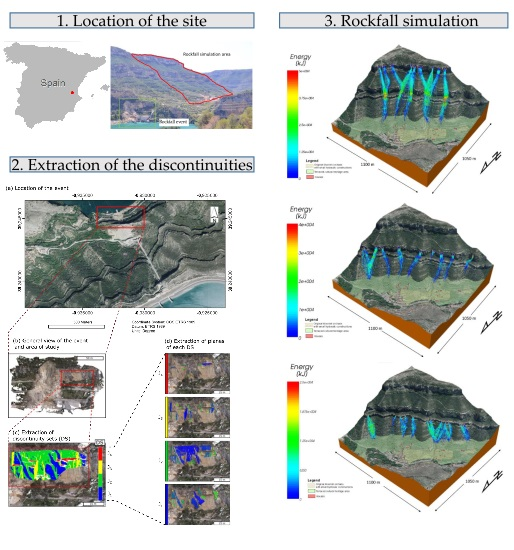
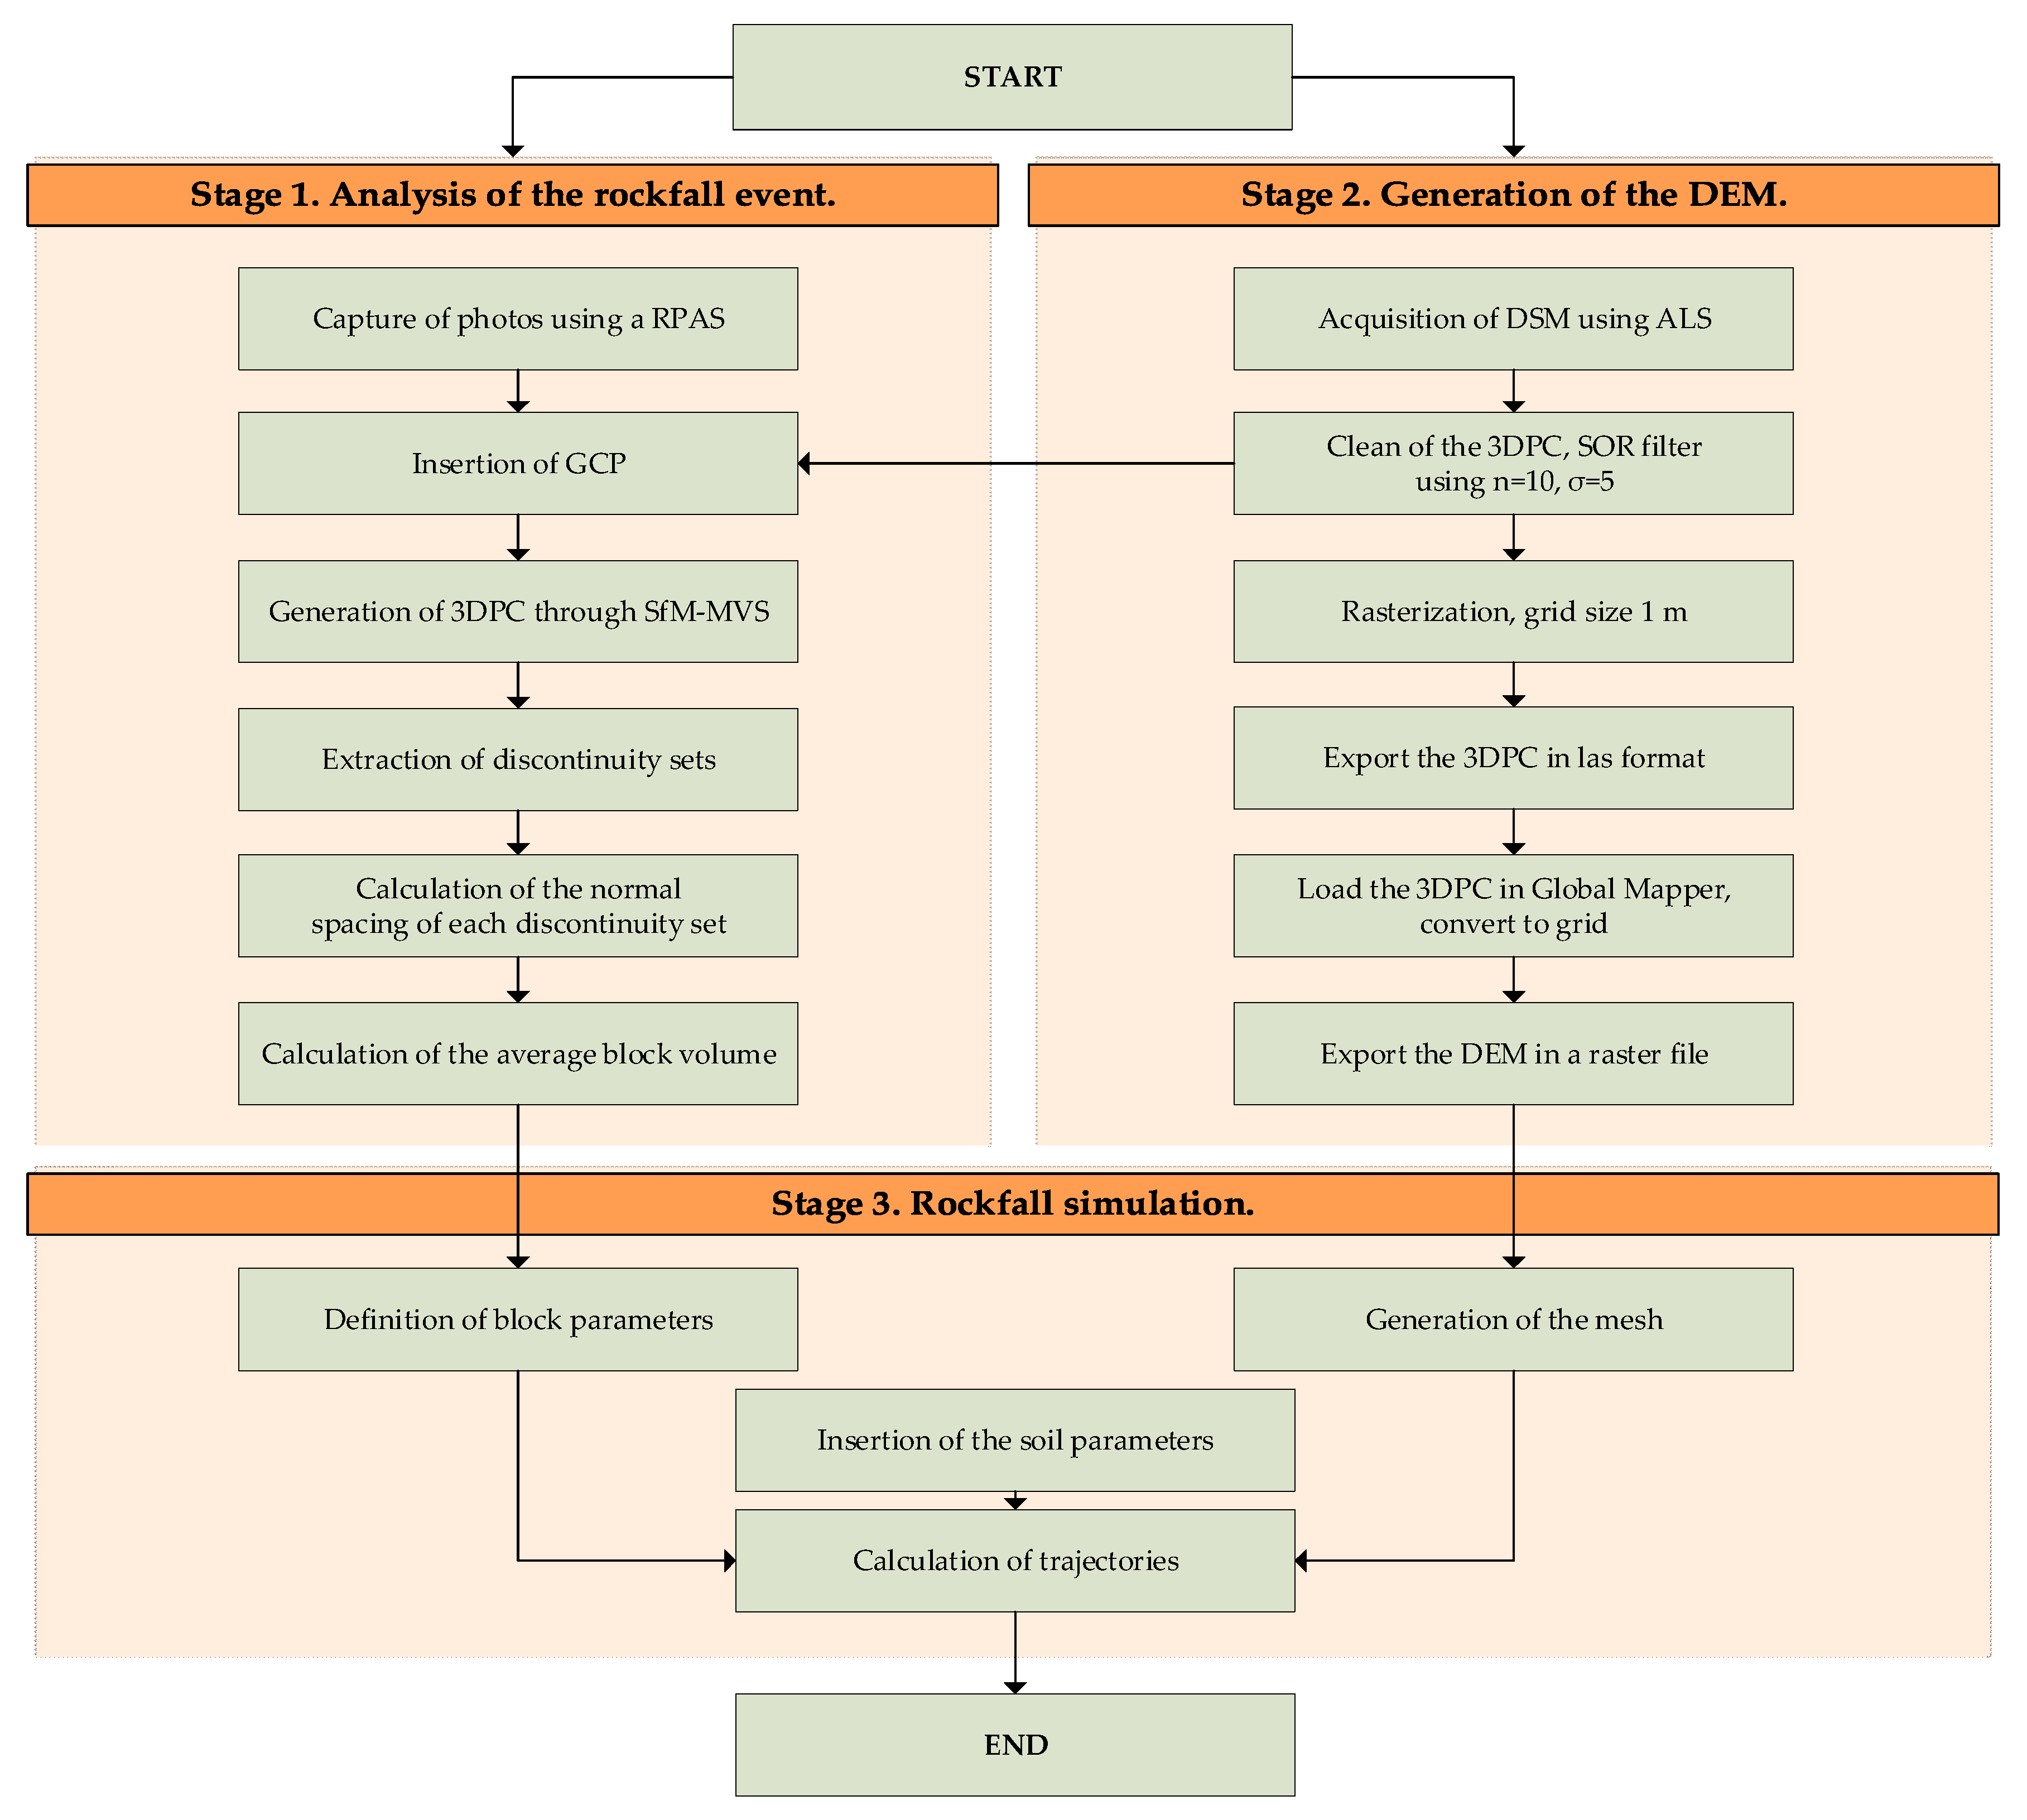
On 6 April 2015, at approximately 8:00 p.m., a rockfall event occurred on the southern bank of the Cortes de Pallás reservoir. The hydroelectric power plant was partially damaged, slightly wounding a security officer that was on site. The detached rock mass was estimated as 7980 m3 [46] and blocked approximately 100 m of main access road CV-428 (Figure 3), which is the only asphalted access to the village of Cortes de Pallás. The access road remained closed for eight months.
Technicians of the Geological Survey of Spain carried out the first field observations after the event, and identified the fracture mechanism (a large wedge of limestone, with posterior sliding and fragmentation of the unstable mass). Morphometry analysis and determination of the volume of the movement were also accomplished. It was determined that the rockfall occurred due to a confluence of several factors: (a) favorable orientation of discontinuities; (b) pronounced differential erosion that affected the stability of the most competent limestone layers; and (c) increased interstitial pressures within the rock mass, due to saturation and the occurrence of hydrostatic forces in the pre-existing cracks caused by previous rainfall events.
Rainfall events were analyzed, based on meteorological data recorded from the nearest rain gauge, located 300 m from the rockfall event. Figure 4 shows the daily and accumulated rainfall (mm) recorded from the beginning of March 2015. Analysis of Figure 4 reveals that the rockfall took place after a rainy period, with 148 mm of accumulated rainfall in 24 days.
When the state of emergency was declared, the hydroelectric company (Iberdrola España, S.A.U.) started carrying out recognition works of the slope, while it was still unstable and dangerous, through an RPAS flight with no specific pattern. A video and a series of photos of the slope were produced.

3. Methods and Data

The first step consisted of the calculation of the mean size of the block. From the images obtained with RPAS flights over the rockfall event that occurred on 6 April 2015, a 3D cloud point was generated for the detached wall through the application of SfM/MVS techniques (Figure 5). The point cloud was obtained with the Agisoft Photoscan Pro [47] software. Application of SfM techniques requires the insertion of a scale, and orientation of data with respect to the north and the vertical, to enable the measurements of geometric features and orientations. This was accomplished through the introduction of the coordinates in a global reference system of ground control points (GCP) from the georeferenced cloud obtained with aerial laser scanning (ALS), downloaded from the National Geographic Institute of Spain (CNIG) [48]. Therefore, GCP were identified on the 3D point cloud generated from the photos captured during the RPAS flight over the rockfall event and then compared to the cloud obtained with ALS for the acquisition of coordinates.
Once the 3D point cloud was acquired for the detached zone, a sector of the source area was identified, with the objective of extracting the plane discontinuities that were exposed by the detachment. The analysis of the visible discontinuities was carried out with the open-source software discontinuity set extractor (DSE) [49]. This software applies the methodology proposed by Riquelme et al. [34], which calculates the normal associated vector for each point and its k closest neighbor points, representing its pole in stereographic projection. Then, statistical analysis was carried out for these poles, providing the stereogram and enabling the extraction of the principal discontinuity sets. Consequently, a discontinuity set was assigned to each point of the point cloud analyzed. This enabled the isolation of the points that belonged to a specific set, followed by cluster analysis with the density-based spatial clustering of applications with noise (DBSCAN) algorithm [50]. The results were the clusters of points that, belonging to the same set, formed plane continuous surfaces in space and, therefore, could be considered as planes. With this result, the normal set spacings were calculated [43]. This calculation can be accomplished by adopting one of the following hypotheses: (i) persistent planes, adequate for bedding planes or when the exposed planes present continuity with the unrepresented part (within the slope or free zone); or (ii) non-persistent planes, adequate for the remaining cases, generally [51].
The mean volume was estimated using the mean discontinuity spacing value for each discontinuity set, according to the expression proposed by Palmström [52]:
Vb = S1 × S2 × S3 × (sinγ1 × sinγ2 × sinγ3),
where S is the normal spacing, and γ is the angle between the discontinuity sets.
The DEM utilized herein is an aerial LiDAR-derived georeferenced 3D point cloud from an official repository [48]. The density of points of this dataset is approximately 0.4 points per m2. This 3D point cloud provided rough GPC coordinates for step 1, and the generation of a rasterized DEM, which was used as a model for the rockfall simulation. The 3D point cloud was already classified; thus, vegetation and constructions were extracted from the model to consider terrain only. Generation of a valid DEM for posterior insertion into the simulation required the point cloud to be rasterized using a grid size of 1 m, with software CloudCompare (Figure 5).
Finally, RocPro3D software [53] was employed to carry out the rockfall simulation in a nearby urban area (cultural heritage site). The rockfall simulation area is located 500 m from the rockfall event and it also presents the same geological context. In fact, the stratigraphic sequence in both sites is identical: a rhythmical series of dolostone and calcarenite, and marls. The hard levels corresponding to dolostone and calcarenite (source areas) present continuity along the valley. RocPro3D is a software that enables 3D simulation of rockfall trajectories, using a probabilistic approximation that considers the variations of block forms, characteristics of the soil, and irregularities of the terrain. The three-dimensional digital terrain model (DTM) is developed from importing the mesh file. The block parameters can be defined by the following probabilistic variables: position, the source of starting blocks, mass (and size), and initial conditions. The beginning of each trajectory is randomly selected along the previously delimited source areas. Soil parameters are defined by the dynamic friction coefficient, normal and tangential restitution coefficients, lateral (horizontal) deviation, and by the flattening (vertical) of the rebound angle. For the calculation of trajectories, rasterized DEM and the mean volume of the block (obtained previously) were utilized.
Input data for the simulation included (a) the digital elevation model (DEM) of the zone in a high raster format resolution of 1 × 1 m cell size; (b) location of the source of detachments; (c) geometric characteristics of the rock blocks; and (d) the properties of each lithological unit (tangential and normal resolution parameters and friction coefficient, mainly).
DEM was obtained from the 3D point cloud of the new study zone, acquired with aerial LiDAR by the National Geographic Institute of Spain (IGN-CNIG). Each LiDAR point of the cloud presented an assigned classification that defined the type of object that reflected the laser pulse (vegetation, soil, buildings, etc.). Only those points characterized as “ground” were utilized to generate the model. With these points, a georeferenced high-resolution digital elevation model (HRDEM) was elaborated, with 1 × 1 resolution.
According to the geological information, available DEM, and analysis of aerial orthophotos and photos of the study zone, the locations of the source areas were determined on three layers of limestone/dolomite that stand out clearly in the landscape (Figure 6a). Firstly, DEM was carried out from the 3D point cloud of the simulation area, acquired with aerial LiDAR. Hard levels corresponding to dolostone and calcarenite were investigated, aiming to establish areas with differential erosion. There is preferential erosion in the loamy levels, leaving the hardest levels of limestone and dolomite exposed and, therefore, more vulnerable to rock detachment. In addition, photointerpretation of aerial images used 1:25,000 aerial photography to detect and delimit the most prominent geomorphological attributes such as scarps, rockfall masses, and related features.
The geological map generated by the Geological Survey of Spain [54] at 1:25000 scale was utilized to define the lithological units for the simulation (Figure 6b). The map was improved with the interpretation of the available orthophotos and fieldwork. Six lithological units were identified: (1) dolomite, (2) calcarenite and sandstone, (3) calcarenite and limestone, (4) green marl, (5) debris, and (6) alluvial deposit. For the characterization of each lithology, five groups of parameters were established (Figure 6b), represented by probabilistic variables (uniform or Gaussian): (1) restitution coefficient, (2) dynamic friction coefficient, (3) lateral deviation during rebound, (4) flattening trend of the rebound angle, and (5) transition angles between the free-fall phase and rotation or sliding, characteristic of this type of movement [55,56]. Parameters of lithological unit 6 were not included in Table 1 because unit 6 was not part of the rockfall simulation. RocPro3D software includes a probabilistic component that influences the restitution coefficients. Probabilistic functions were utilized within the software to introduce uncertainties and variability in the selection of the restitution parameters. Calibration of parameters followed the existing scientific literature [57,58,59,60] and works previously carried out in similar geological zones [61]. Table 1 details the parameters utilized in the modeling, according to the lithological units identified in the study zone. Two possible choices are available in Rocpro3D for the initial conditions of the blocks: specification of the initial velocity or placement of the block at a specific height and then releasing it. Herein, all velocity components along the X-, Y-, and Z-axes were defined as equal to 0.

4. Results

4.1. Definition of the Size of the Block

This step was carried out during the state of emergency. The 3D point cloud of the detached area was generated using the SfM/MVS technique (Figure 7). Analysis of the study area shows four statistically relevant discontinuity sets (Figure 8): J1 (320°/72°), J2 (356°/86°), J3 (220°/88°), and J4 (145°/16°). Set J2 was rejected posteriorly because it was the slope plane. The analysis of the patches of each discontinuity set provided the mean values of the normal spacing: J1 (2.6 m), J3 (2.3 m), and J4 (2.9 m).
Characterization of the rock mass followed the observation of its state and spatial disposition, considering the discontinuity sets and weakness planes, and enabled the determination of the volumes of the blocks that were utilized a posteriori in the simulation. Figure 7 shows how sets J1, J3, and J4 constitute a wedge (colors blue, yellow, and purple), which was formed with much greater dimensions at the detached area, where a pronounced zone of differential erosion was produced at the base of the limestone layers. Considering that the three discontinuity sets are almost orthogonal in pairs (i.e., γ1 = γ2 = γ3 = 90° in Equation (1)), it was assumed that the detached blocks were hexahedrons with sides equal to the average normal spacing of each discontinuity set. This way, the volume was calculated as the product of the three average spacings. The average resulting volume was 17.6 m3, with an equivalent diameter of 3.2 m.

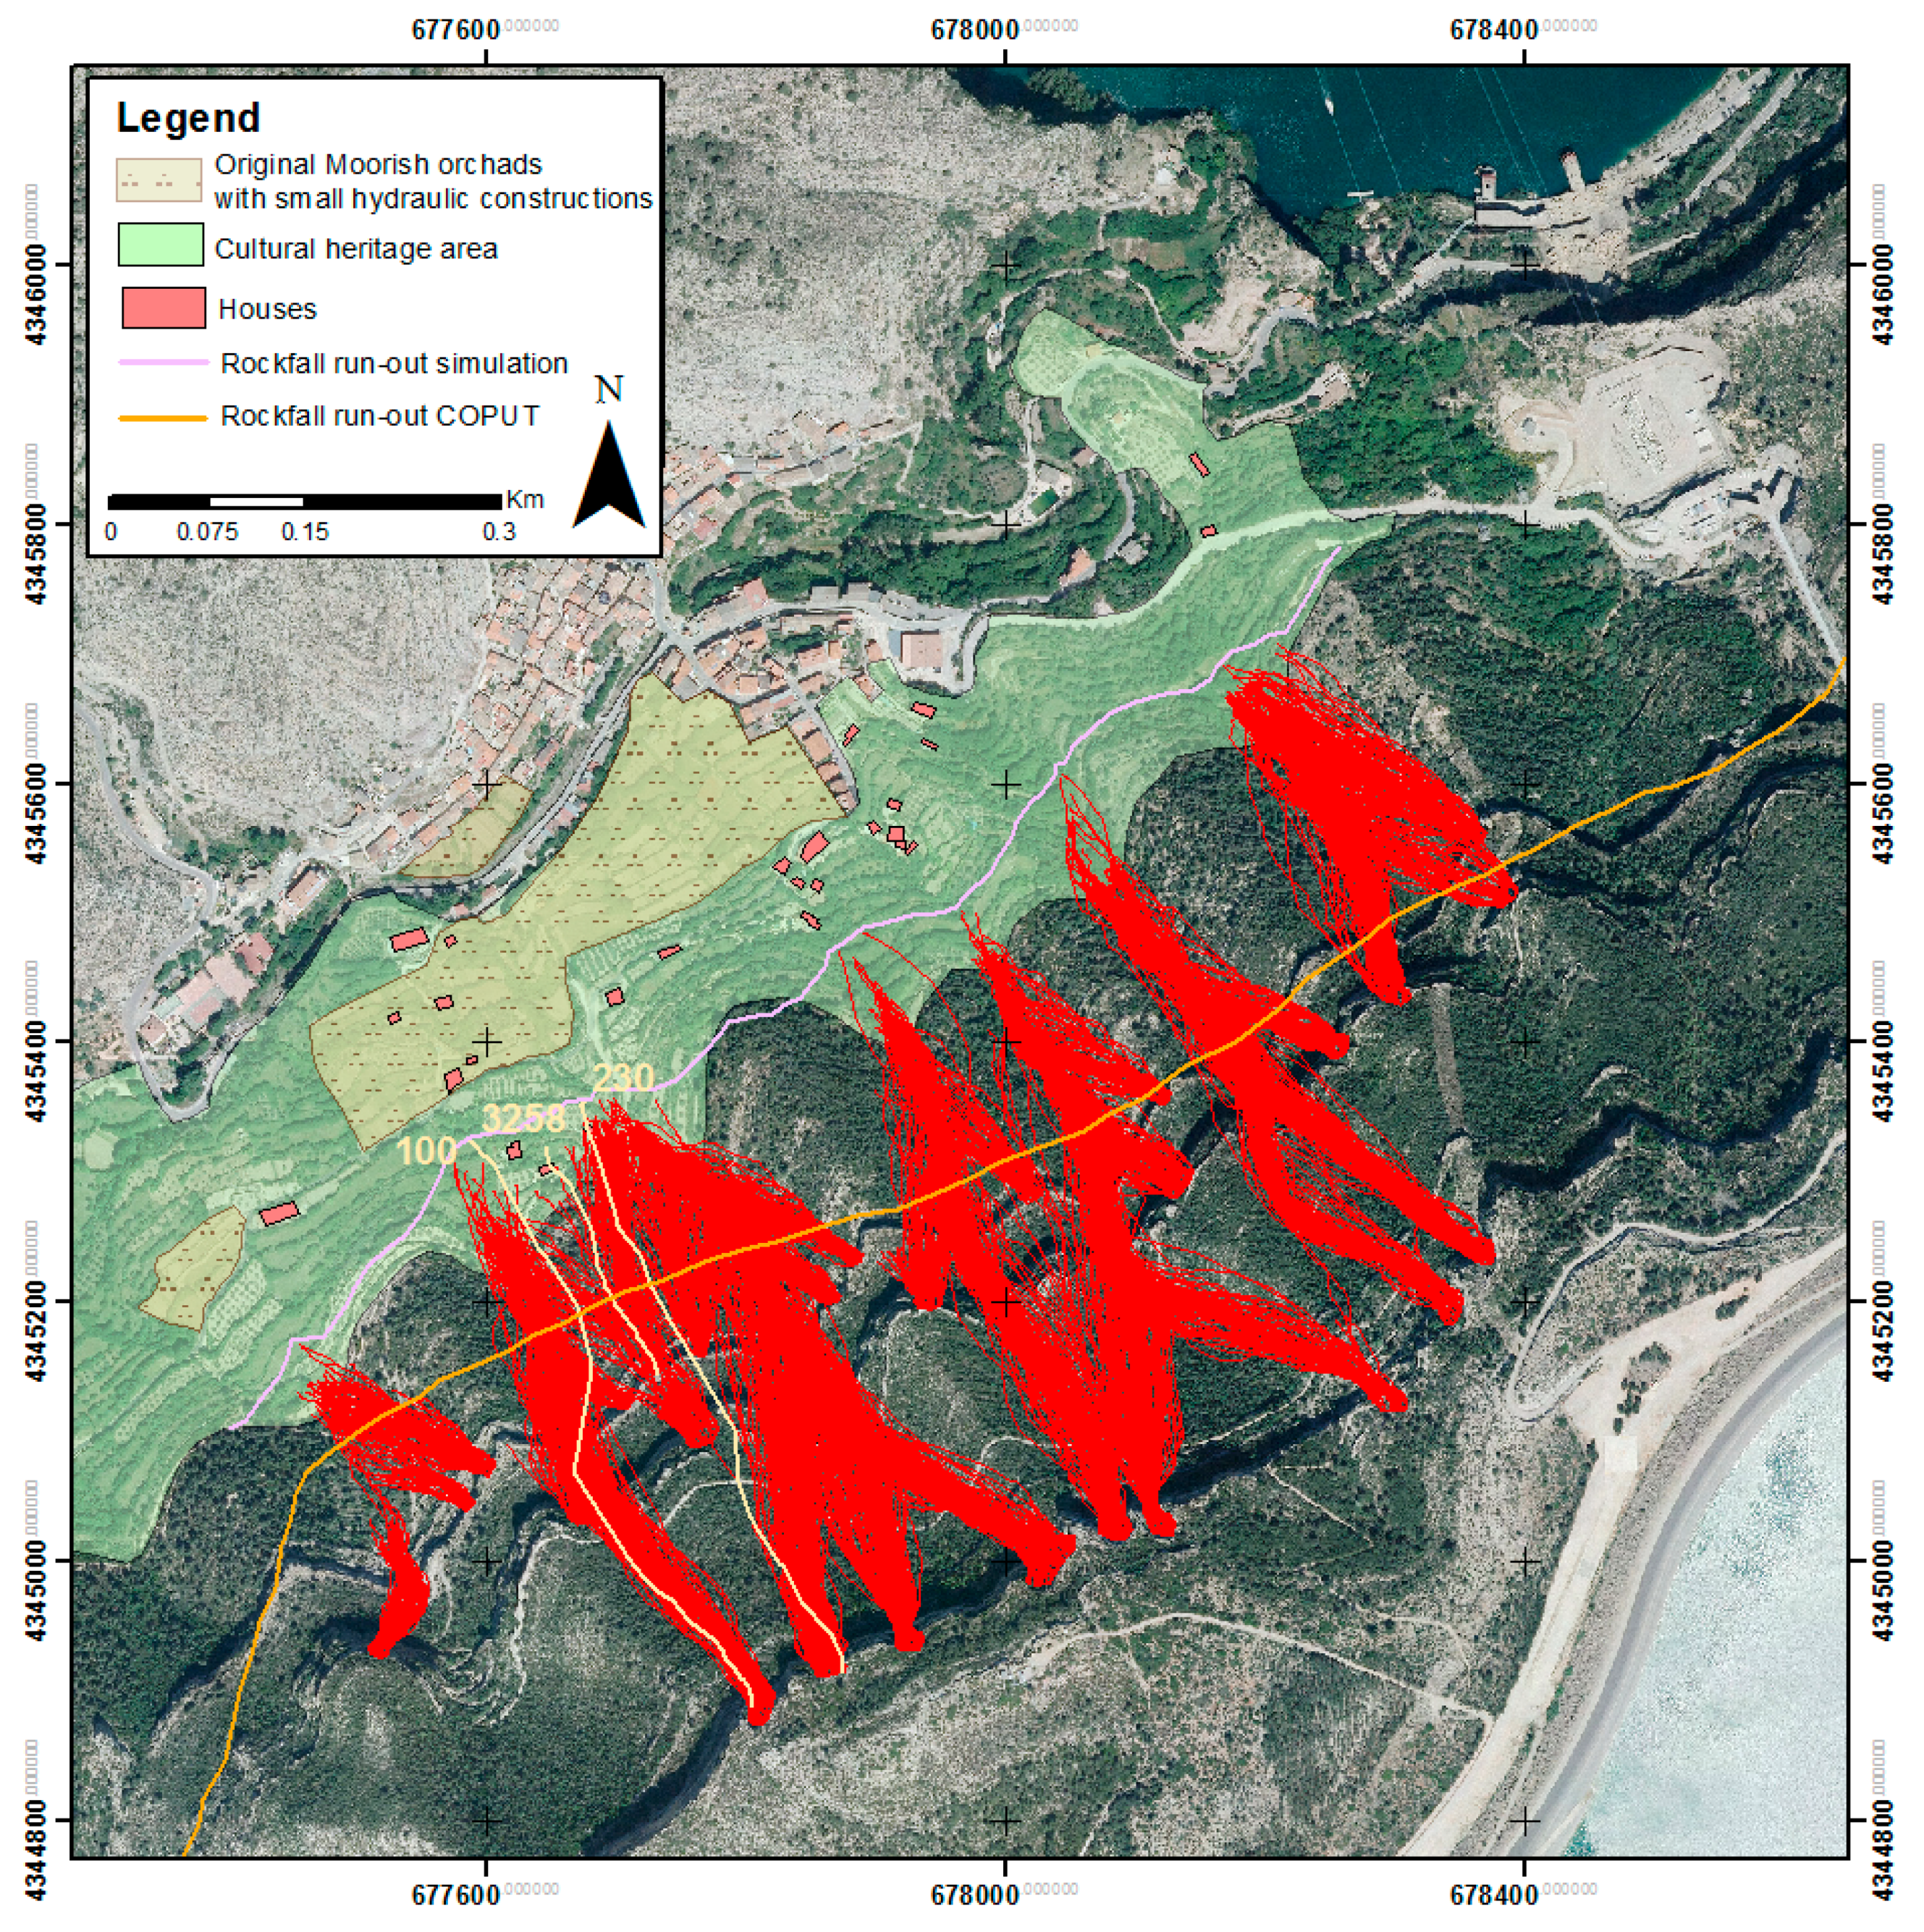
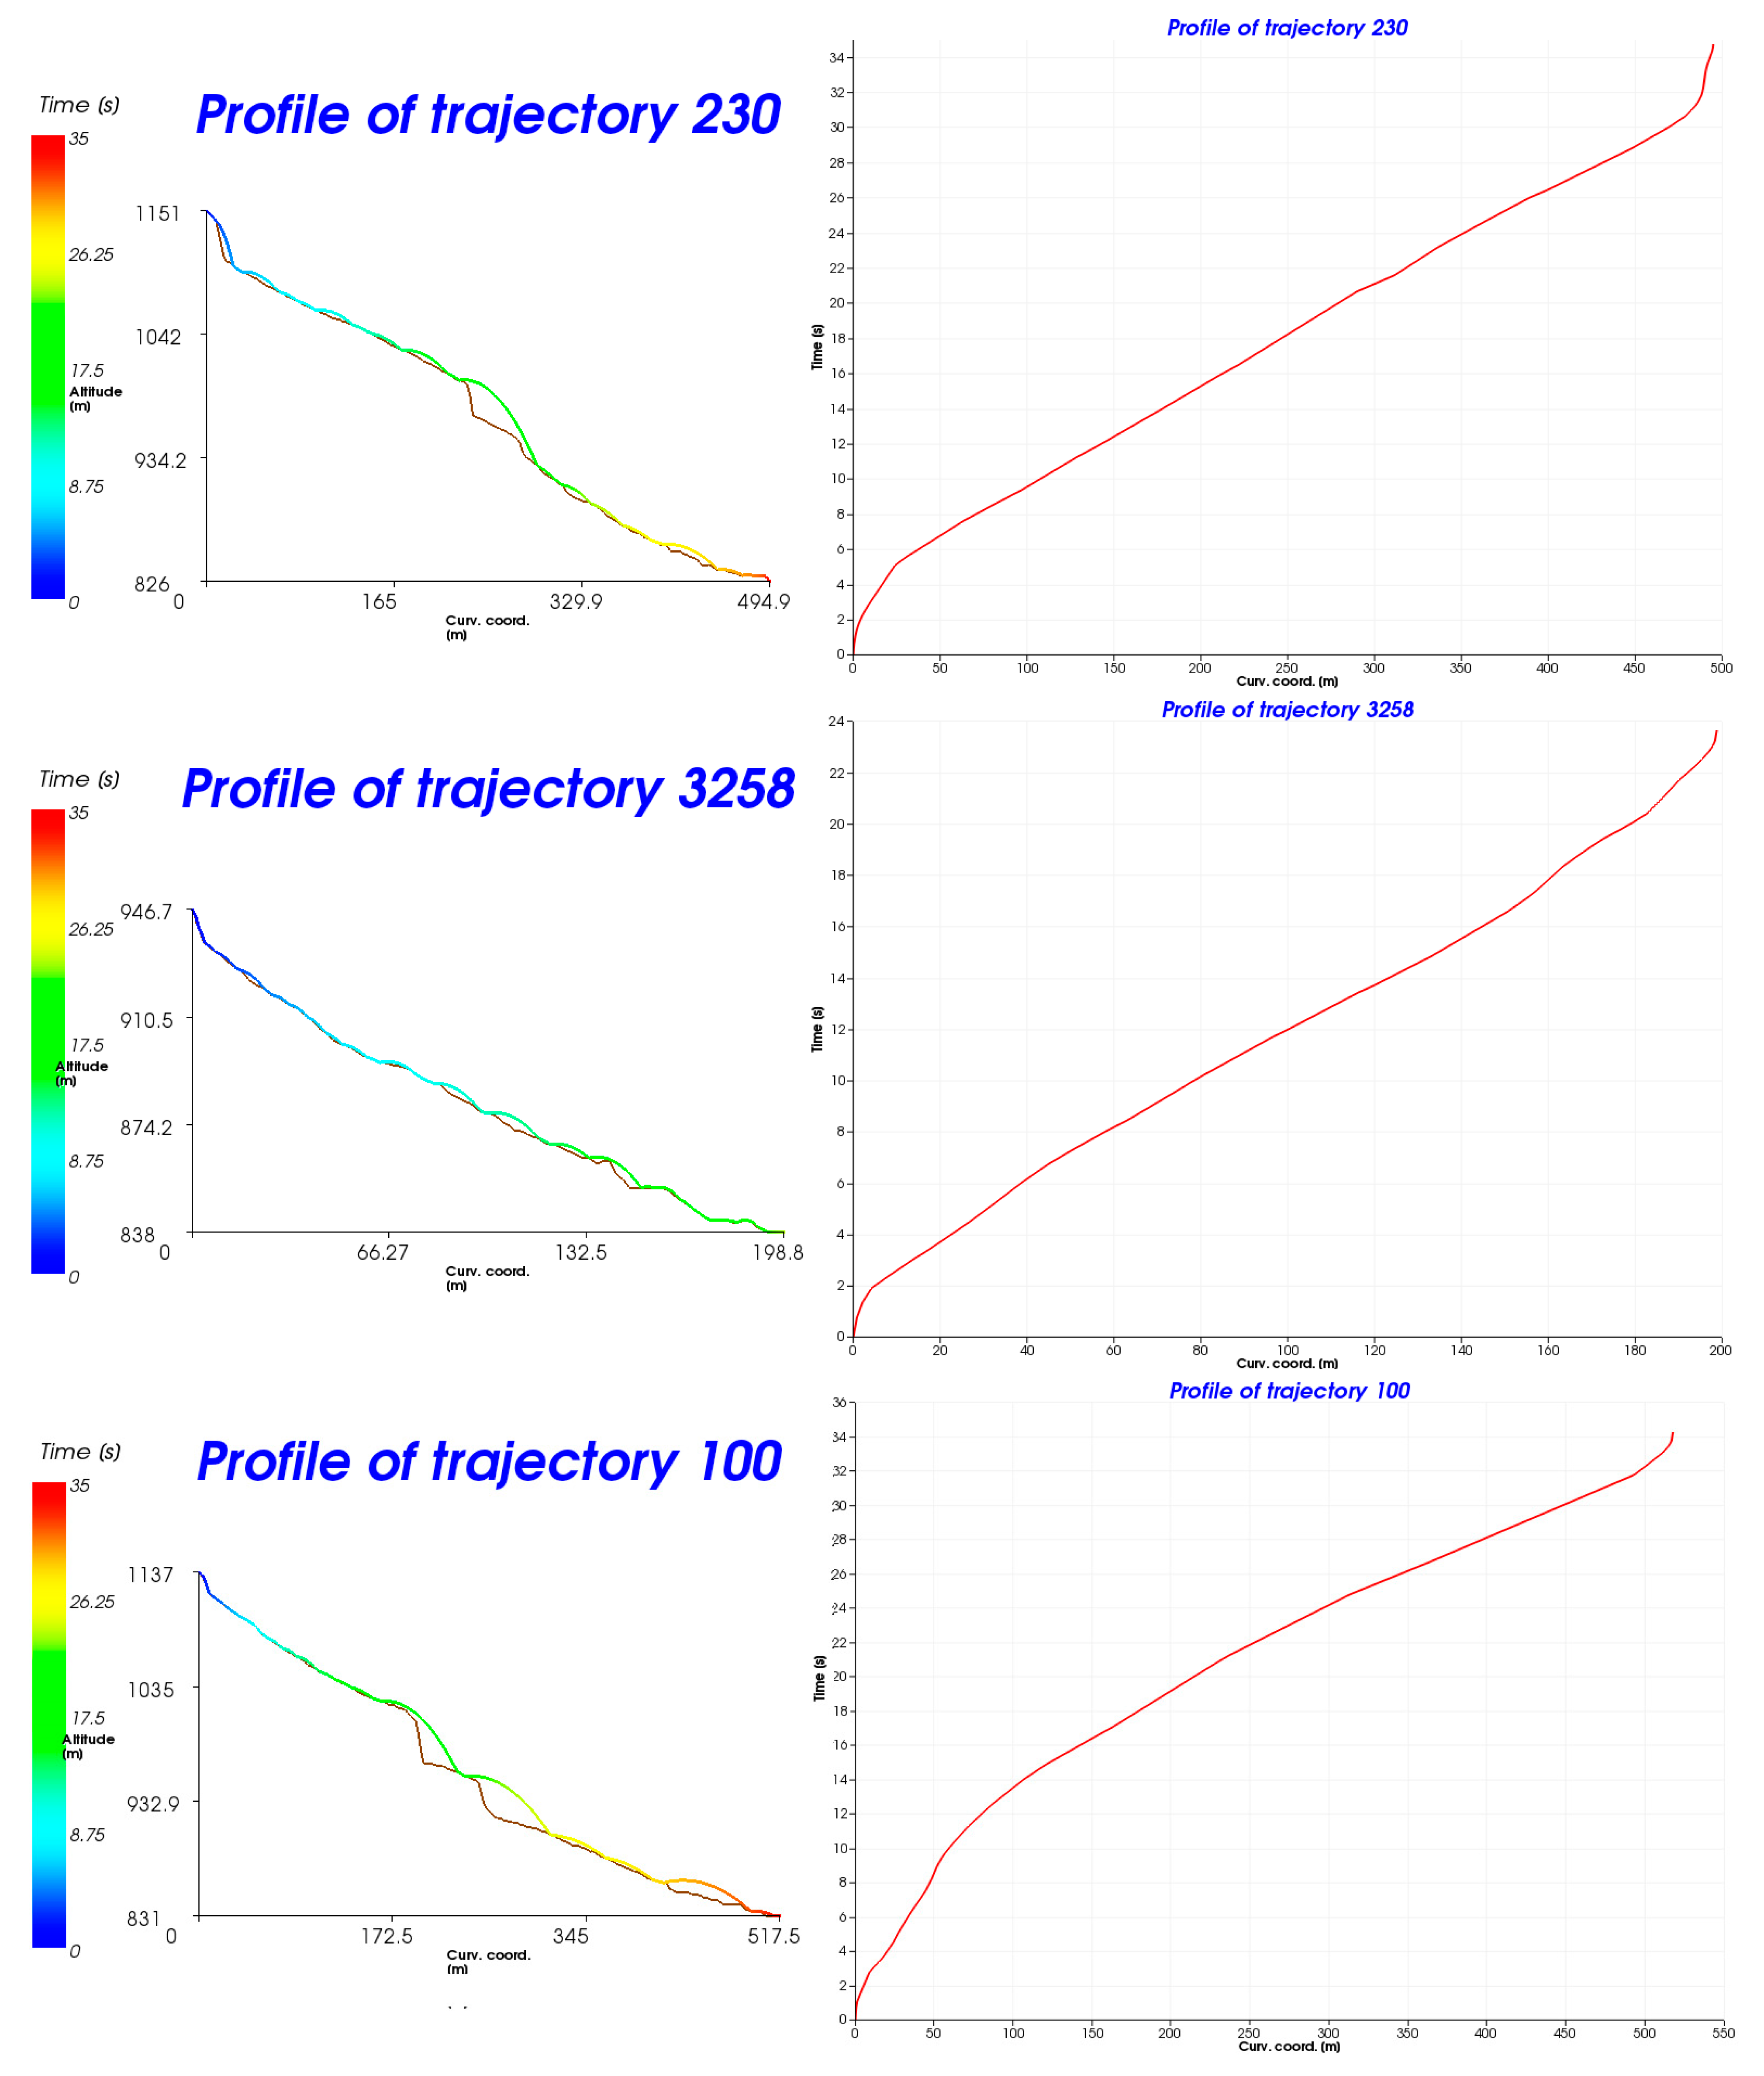
4.2. Simulation at the Urban Area

RocPro3D carries out a three-dimensional simulation of the trajectories produced by rockfalls, utilizing a probabilistic approach that considers surface irregularities, a block-related parameter, and the characteristics of the soil. From each of the source areas determined, detachments were simulated by launching 150 rock blocks, with calculations of the energy, speed, height, density, and impact information for each trajectory.
As observed in the 3D trajectory model (Figure 9), the blocks present preferential directions following the paths created by surface run-off, where higher trajectory densities are concentrated. The highest energy values were obtained when the source area was the highest part of the slope, reaching energy values over 86,000 kJ and maximum speeds above 78 m/s (Figure 9). The highest energy values were concentrated at the central zone of the trajectories. When the source areas were located at the intermediate layer of limestone/dolostone, lower values were obtained, with a maximum energy of 59,000 kJ, speed of 62 m/s, and heights between 1.00 m and 50 m (Figure 10). Lastly, the blocks detached from the lowest layer presented maximum energies of 36,000 kJ, maximum speeds of 43.5 m/s, and heights over 25 m (Figure 11).
Three out of the 4500 simulated trajectories were selected (trajectories #100, 3258, and 230) to study the risk for buildings located on the intermediate part of the slope, considering the distance reached by the blocks and the proximity to the buildings (Figure 12). The impact time profiles were analyzed, determining that blocks with 17.16-m3 volume would take less than 35 s to travel the distance comprehended between the source area (limestone layer located at upper levels) and the buildings (Figure 13).
Finally, a previous map (COPUT, 1991) from the Valencia Regional Government [44] was compared with the results obtained herein (Figure 12 and Figure 13). In the 1991 map, the maximum potential reach of the blocks was calculated to be around 600 m asl (yellow line in Figure 12). In the simulation carried out herein, the rockfall reach is longer (purple line in Figure 12), and the blocks can reach lower levels that are closer to the urban area, representing a more dangerous reality.

5. Discussion

One of the key features influencing the final results of a 3D rockfall simulation is the size of the block. The trajectories and the energy loss of individual blocks traveling along slopes depend, among other parameters, on the block size [62]. Obtaining the average size of the rock mass from previous rockfall deposits in the area can be a challenge due to the high number of blocks to be measured [16]. This value could be completely wrong, as the blocks in the deposit could have been fragmented during the rockfall process. Herein, a methodology was proposed to obtain this parameter based on previous data acquired during an emergency declaration, in a very close area to where the simulation was developed. The rockfall event occurred on 6 April 2015, on the meridional slope of the dam of one of the most important hydroelectric plants in Europe. After the rockfall, the hydroelectric company performed an RPAS flight that enabled the elaboration of a high-resolution DEM in the rockfall area, through the application of the SfM technique. The exposed discontinuities of the rock mass were analyzed in detail: discontinuity sets, their orientations, normal spacings, persistence, failure mode, etc. In many occasions, data obtained during an emergency declaration are not reutilized later for any other analyses. The case herein reutilized data from an RPAS flight, applied to a site with similar geological context, with clear economic advantages, offering a new perspective for the reutilization of data collected previously.
The discontinuity sets obtained and their corresponding orientations showed good correlation with the measurements made in situ by geologists. However, the normal spacing could not be characterized because the rock wall was not accessible. The use of the 3D point cloud plus available methodologies provided an objective estimation of the normal spacing of discontinuities and, consequently, the mean volume of the detached block. The distances traveled and the energies obtained are more realistic taking this size into consideration because the fallen block will be fragmented according to the existing discontinuities. RocPro3D software was demonstrated to be a very robust tool to reproduce rockfall events; however, it does not present the possibility of modeling rock fragmentation. As a consequence, rockfall simulation of a larger boulder with its subsequent fragmentation is not possible. Obtainment of the block size based on the discontinuities, through employing unmanned aerial vehicle (UAV) photogrammetry data obtained during an emergency declaration, yields more accurate results (energy, velocities, etc.) that can be used to delimit rockfall-prone areas.
The DEM generated using a public domain aerial LiDAR was used to simulate rockfalls in a terraced slope over the urban area of Cortes de Pallás. This area is a cultural heritage site with Moorish orchards and small hydraulic constructions from the 16th century. Along the slope, three rockfall source levels were identified at different heights.
The simulation of rockfall trajectories is difficult due to the uncertainties associated with the rockfall process and the numerical modeling. The rockfall uncertainties can be solved by probabilistically modeling the location of source areas, soil properties, starting conditions, and topography, while the uncertainties related to numerical modeling can be solved by probabilistically modeling the dynamics of rockfalls. Most rockfall simulation software do not enable the introduction of uncertainties, nor consider variability in the parameters using probabilistic functions [63] RocPro3D software includes a probabilistic component that considers most parameters, but does not feature rock fragmentation modeling. This methodology uses a probabilistic approach and provides a reasonable alternative for emergency scenarios in which data are limited.
The results indicated that the simulated trajectories for the upper level presented the highest energy and longest runout distance, and the blocks could potentially reach the huts and sheds built at the intermediate part of the slope. However, all simulated blocks would be stopped by the terraces before reaching the original elements of the cultural heritage, as well as the urban area of Cortes de Pallás. Nevertheless, despite the protective role that the old terraces play, the rockfall simulation developed in the present work shows a hazardous situation in the cultural heritage area, in comparison with that displayed in previous official studies (1991).

6. Conclusions

This manuscript presented an improved rockfall hazard evaluation for the Cortes de Pallás urban area, using accurate input data in a 3D rockfall simulation. Data obtained during an emergency declaration (a rockfall event that affected a hydroelectric power plant) in 2015 were utilized. A numerical simulation was then carried out for the historical set of Moorish orchards of the Barranco de la Barbulla, a hillside that overlooks the urban area of Cortes de Pallás.
According to the existing literature on the variability of conditioning factors for rockfall simulations, the size of the detached block was considered to be a key factor in the improvement of 3D rockfall simulation.
The geometric analysis of a 3D point cloud obtained from the processing of a set of photos taken with the RPAS (SfM technique) identified the exposed discontinuities, from which the size of a representative average block was determined. The size of this block was used within the RocPro3D software to establish the maximum distances reached, as well as the distribution of velocities and energies, for the rock detachments that could potentially affect the urban area of Cortes de Pallás.
Analysis of results showed that the simulated trajectories with longest distances traveled do not endanger the village of Cortes de Pallás. Only three buildings located at the higher part of the terraced hillslope could be reached in the case of future rockfall events.
This study demonstrated the utility of a fast and effective method for the (i) estimation of the rock volumes susceptible to detachment, and (ii) delimitation, through simulations, of the endangered elements in the area of interest. The works developed herein combined remote acquisition techniques, such as SfM, and the application of a probabilistic simulation model, which reproduces the trajectories of rock blocks, determining the velocities and energies.

Author Contributions

R.S. (IGME) wrote the paper and was involved in the 3D rockfall simulation and analysis of the results; A.R. (UA) collaborated in writing the paper and was involved in the application of SfM/MVS techniques. J.C.G.-D. (IGME) helped in collecting and analyzing data. R.M.M. (IGME) collaborated in writing the paper, and was involved in the geological interpretation and analysis of results. R.T., J.L.P., and M.C. (UA), and G.H. (IGME) critically revised the manuscript.

Funding

This work was funded by the European Commission, Directorate General Humanitarian Aid and Civil Protection (ECHO), through the project “SAFETY (Sentinel-1 for geohazard prevention and forecasting)” (Ref. ECHO/SUB/2015/718679/Prev02). This work was partially funded by the University of Alicante (vigrob-157 Project, GRE14-04 and GRE15-19 Project), the Spanish Ministry of Economy, Industry and Competitiveness (MINECO), the State Agency of Research (AEI), and the European Funds for Regional Development (FEDER) under projects TEC2017-85244-C2-1-P and TIN2014-55413-C2-2-P.

Acknowledgments

We thank the anonymous reviewers and Editor for their valuable comments and suggestions. The views, opinions, and findings contained in this report are those of the author(s).

Conflicts of Interest

The authors declare no conflicts of interest.

References

  1. Erisman, T.H.; Abele, G. Dynamics of Rockslides and Rockfalls; Springer: Berlin/Heidelberg, Germany, 2002; Volume 66, ISBN 978-3-642-08653-3. [Google Scholar]
  2. Emmer, A. Geographies and Scientometrics of Research on Natural Hazards. Geosciences 2018, 8, 382. [Google Scholar] [CrossRef]
  3. Hungr, O.; Leroueil, S.; Picarelli, L. The Varnes classification of landslide types, an update. Landslides 2014, 11, 167–194. [Google Scholar] [CrossRef]
  4. Volkwein, A.; Schellenberg, K.; Labiouse, V.; Agliardi, F.; Berger, F.; Bourrier, F.; Dorren, L.K.A.; Gerber, W.; Jaboyedoff, M. Rockfall characterisation and structural protection—A review. Nat. Hazards Earth Syst. Sci. 2011, 11, 2617–2651. [Google Scholar] [CrossRef] [Green Version]
  5. Dorren, L.K.A. A review of rockfall mechanics and modelling approaches. Prog. Phys. Geogr. 2003, 27, 69–87. [Google Scholar] [CrossRef] [Green Version]
  6. Crosta, G.B.; Agliardi, F.; Frattini, P.; Lari, S. Key issues in rock fall modeling, hazard and risk assessment for rockfall protection. In Engineering Geology for Society and Territory—Volume 2: Landslide Processes; Springer International Publishing: Cham, Switzerland, 2015; pp. 43–58. ISBN 9783319090573. [Google Scholar]
  7. Hernández Gutiérrez, L.E.; Santamarta Cerezal, J.C.; Olalla Marañón, C.; Rodríguez Losada, J.A.; Muñiz Menéndez, M.; González-Gallego, F.J.; Rodríguez Martín, J.; Pomares Rodríguez, M.; López Felipe, M.; Lomoschitz Mora-Figueroa, A.; et al. Ingeniería Geológica en Terrenos Volcánicos. Métodos, Técnicas y Experiencias en las Islas Canarias; Hernández Gutiérrez, L.E., Santamarta Cerezal, J.C., Eds.; Ilustre Colegio Oficial de Geólogos: Madrid, Spain, 2016; ISBN 978-84-608-5072-4. [Google Scholar]
  8. Sturzenegger, M.; Sartori, M.; Jaboyedoff, M.; Stead, D. Regional deterministic characterization of fracture networks and its application to GIS-based rock fall risk assessment. Eng. Geol. 2007, 94, 201–214. [Google Scholar] [CrossRef]
  9. Lambert, C.; Thoeni, K.; Giacomini, A.; Casagrande, D.; Sloan, S. Rockfall hazard analysis from discrete fracture network modelling with finite persistence discontinuities. Rock Mech. Rock Eng. 2012, 45, 871–884. [Google Scholar] [CrossRef]
  10. Paredes, C.; Sarro, R.; Ramos, M. Estimación preliminar de los alcances por caída de bloques en la sierra de La Cabrera, Madrid, España. Rev. Mex. Cienc. Geol. 2015, 32, 475–491. [Google Scholar]
  11. Abellán, A.; Calvet, J.; Vilaplana, J.; Blanchard, J. Detection and spatial prediction of rockfalls by means of terrestrial laser scanner monitoring. Geomorphology 2010, 119, 162–171. [Google Scholar] [CrossRef]
  12. Kromer, R.A.; Hutchinson, D.J.; Lato, M.J.; Gauthier, D.; Edwards, T. Identifying rock slope failure precursors using LiDAR for transportation corridor hazard management. Eng. Geol. 2015, 195, 93–103. [Google Scholar] [CrossRef]
  13. Royán Cordero, M.J. Caracterización y Predicción de Desprendimientos de Rocas Mediante LiDAR Terrestre. Ph.D. Thesis, Universitat de Barcelona, Barcelona, Spain, 2015. [Google Scholar]
  14. Walter, M.; Schwaderer, U.; Joswig, M. Seismic monitoring of precursory fracture signals from a destructive rockfall in the Vorarlberg Alps, Austria. Nat. Hazards Earth Syst. Sci. 2012, 12, 3545–3555. [Google Scholar] [CrossRef] [Green Version]
  15. Bourrier, F.; Hungr, O. Rockfall Dynamics: A Critical Review of Collision and Rebound Models. In Rockfall Engineering; Nicot, S., Lambert, F., Eds.; John Wiley & Sons, Inc.: Hoboken, NJ, USA, 2013; pp. 175–209. ISBN 9781848212565. [Google Scholar]
  16. Ruiz-Carulla, R.; Corominas, J.; Mavrouli, O. A methodology to obtain the block size distribution of fragmental rockfall deposits. Landslides 2015, 12, 815–825. [Google Scholar] [CrossRef] [Green Version]
  17. Corominas, J.; Mavrouli, O.; Santana, D.; Moya, J. Simplified approach for obtaining the block volume distribution of fragmental rockfalls. In Landslides and Engineered Slopes; CRC Press: Boca Raton, FL, USA, 2013; pp. 1159–1164. [Google Scholar]
  18. Ruiz-Carulla, R.; Corominas, J.; Mavrouli, O. A fractal fragmentation model for rockfalls. Landslides 2017, 14, 875–889. [Google Scholar] [CrossRef]
  19. Jaboyedoff, M.; Oppikofer, T.; Abellán, A.; Derron, M.-H.; Loye, A.; Metzger, R.; Pedrazzini, A. Use of LIDAR in landslide investigations: A review. Nat. Hazards 2012, 61, 5–28. [Google Scholar] [CrossRef]
  20. Ullman, S. The Interpretation of Visual Motion; Massachusetts Institute of Technology Press: Oxford, UK, 1979; ISBN 026221007X. [Google Scholar]
  21. Abellán, A.; Derron, M.-H.; Jaboyedoff, M. “Use of 3D Point Clouds in Geohazards” Special Issue: Current Challenges and Future Trends. Remote Sens. 2016, 8, 130. [Google Scholar] [CrossRef]
  22. James, M.R.; Robson, S. Straightforward reconstruction of 3D surfaces and topography with a camera: Accuracy and geoscience application. J. Geophys. Res. Earth Surf. 2012, 117. [Google Scholar] [CrossRef] [Green Version]
  23. James, M.R.; Robson, S. Mitigating systematic error in topographic models derived from UAV and ground-based image networks. Earth Surf. Process. Landf. 2014, 39, 1413–1420. [Google Scholar] [CrossRef] [Green Version]
  24. Wu, H.; Zhang, Y.; Jiang, D.; Kang, Y. DEM generation in cloudy-rainy mountainous area with multi-baseline SAR interferometry. In Society of Photo-Optical Instrumentation Engineers (SPIE) Conference Series; SPIE: Washington, DC, USA, 2018; Volume 10611. [Google Scholar]
  25. Crosetto, M.; Pérez Aragues, F. Radargrammetry and SAR interferometry for DEM generation: Validation and data fusion. In Proceedings of the SAR Workshop: CEOS Committee on Earth Observation Satellites, Toulouse, France, 26–29 October 1999; Harris, R.A., Ouwehand, L., Eds.; European Space Agency: Paris, France, 2000; Volume 450, p. 367. [Google Scholar]
  26. Dong, Y.; Zhang, L.; Balz, T.; Luo, H.; Liao, M. Radargrammetric DSM generation in mountainous areas through adaptive-window least squares matching constrained by enhanced epipolar geometry. ISPRS J. Photogramm. Remote Sens. 2018, 137, 61–72. [Google Scholar] [CrossRef]
  27. White, J.C.; Wulder, M.A.; Vastaranta, M.; Coops, N.C.; Pitt, D.; Woods, M. The Utility of Image-Based Point Clouds for Forest Inventory: A Comparison with Airborne Laser Scanning. Forests 2013, 4, 518–536. [Google Scholar] [CrossRef] [Green Version]
  28. James, M.R.; Robson, S.; d’Oleire-Oltmanns, S.; Niethammer, U. Optimising UAV topographic surveys processed with structure-from-motion: Ground control quality, quantity and bundle adjustment. Geomorphology 2017, 280, 51–66. [Google Scholar] [CrossRef]
  29. Brodu, N.; Lague, D. 3D point cloud classification of complex natural scenes using a multi-scale dimensionality criterion: Applications in geomorphology. In Proceedings of the EGU General Assembly Conference Abstracts, Vienna, Austria, 22–27 April 2012; Volume 14, p. 4368. [Google Scholar]
  30. Lucieer, A.; de Jong, S.M.; Turner, D. Mapping landslide displacements using Structure from Motion (SfM) and image correlation of multi-temporal UAV photography. Prog. Phys. Geogr. 2014, 38, 97–116. [Google Scholar] [CrossRef]
  31. Tomás, R.; Abellán, A.; Cano, M.; Riquelme, A.; Tenza-Abril, A.J.; Baeza-Brotons, F.; Saval, J.M.M.; Jaboyedoff, M. A multidisciplinary approach for the investigation of a rock spreading on an urban slope. Landslides 2017, 15, 199–217. [Google Scholar] [CrossRef] [Green Version]
  32. Riquelme, A.; Tomás, R.; Abellán, A. Characterization of rock slopes through slope mass rating using 3D point clouds. Int. J. Rock Mech. Min. Sci. 2016, 84, 165–176. [Google Scholar] [CrossRef] [Green Version]
  33. Jordá Bordehore, L.; Riquelme, A.; Cano, M.; Tomás, R. Comparing manual and remote sensing field discontinuity collection used in kinematic stability assessment of failed rock slopes. Int. J. Rock Mech. Min. Sci. 2017, 97, 24–32. [Google Scholar] [CrossRef]
  34. Riquelme, A.; Abellán, A.; Tomás, R.; Jaboyedoff, M. A new approach for semi-automatic rock mass joints recognition from 3D point clouds. Comput. Geosci. 2014, 68, 38–52. [Google Scholar] [CrossRef] [Green Version]
  35. Slob, S.; van Knapen, B.; Hack, H.R.G.K.; Turner, K.; Kemeny, J. Method for Automated Discontinuity Analysis of Rock Slopes with Three-Dimensional Laser Scanning. Transp. Res. Rec. 2005, 1913, 187–194. [Google Scholar] [CrossRef]
  36. Ferrero, A.M.; Forlani, G.; Roncella, R.; Voyat, H.I. Advanced geostructural survey methods applied to rock mass characterization. Rock Mech. Rock Eng. 2009, 42, 631–665. [Google Scholar] [CrossRef]
  37. Sturzenegger, M.; Stead, D.; Elmo, D. Terrestrial remote sensing-based estimation of mean trace length, trace intensity and block size/shape. Eng. Geol. 2011, 119, 96–111. [Google Scholar] [CrossRef]
  38. Jaboyedoff, M.; Metzger, R.; Oppikofer, T.; Couture, R.; Derron, M.-H.; Locat, J.; Turmel, D. New insight techniques to analyze rock-slope relief using DEM and 3D-imaging cloud points: COLTOP-3D software. In Rock Mechanics: Meeting Society’s Challenges and Demands, Proceedings of the 1st Canada–U.S. Rock Mechanics Symposium, Vancouver, Canada, 27–31 May 2007; Taylor & Francis Group: London, UK, 2007; Volume 1, pp. 61–68. [Google Scholar]
  39. Lato, M.J.; Vöge, M. Automated mapping of rock discontinuities in 3D lidar and photogrammetry models. Int. J. Rock Mech. Min. Sci. 2012, 54, 150–158. [Google Scholar] [CrossRef]
  40. Li, X.; Chen, J.; Zhu, H. A new method for automated discontinuity trace mapping on rock mass 3D surface model. Comput. Geosci. 2016, 89, 118–131. [Google Scholar] [CrossRef]
  41. Wang, X.; Zou, L.; Shen, X.; Ren, Y.; Qin, Y. A region-growing approach for automatic outcrop fracture extraction from a three-dimensional point cloud. Comput. Geosci. 2017, 99, 100–106. [Google Scholar] [CrossRef] [Green Version]
  42. Chen, N.; Kemeny, J.; Jiang, Q.; Pan, Z. Automatic extraction of blocks from 3D point clouds of fractured rock. Comput. Geosci. 2017, 109, 149–161. [Google Scholar] [CrossRef]
  43. Riquelme, A.; Abellán, A.; Tomás, R. Discontinuity spacing analysis in rock masses using 3D point clouds. Eng. Geol. 2015, 195, 185–195. [Google Scholar] [CrossRef] [Green Version]
  44. Generalitat Valenciana Riesgo de deslizamientos y desprendimientos (Polígonos) (COPUT-1991). 1991. Available online: http://www.habitatge.gva.es/es/web/sistema-de-informacion-territorial/serie-tematica-de-la-antigua-coput (accessed on 29 November 2018).
  45. Dupuy de Lome y Marín de la Bárcena (1960). Mapa geológico de España 1:50.000. Hoja de Jalance, Num. 745. Available online: http://info.igme.es/cartografiadigital/geologica/Geo50.aspx (accessed on 29 November 2018).
  46. Instituto Geológico y Minero de España BDMoves. 2016. Available online: http://datos.gob.es/en/catalogo/ea0010987-base-de-datos-de-movimientos-del-terreno-bdmoves (accessed on 29 November 2018).
  47. AgiSoft PhotoScan Professional (Version 1.2.6) (Software). 2016. Available online: http://www.agisoft.com/downloads/installer/ (accessed on 29 November 2018).
  48. Instituto Geográfico Nacional Centro de Descargas del CNIG (IGN). Available online: http://centrodedescargas.cnig.es/CentroDescargas/locale?request_locale=en (accessed on 29 November 2018).
  49. Riquelme, A.; Abellán, A.; Tomás, R.; Jaboyedoff, M. Discontinuity Set Extractor 2014. Available online: https://github.com/adririquelme/DSE (accessed on 29 November 2018).
  50. Ester, M.; Kriegel, H.; Sander, J.; Xu, X. A density-based algorithm for discovering clusters in large spatial databases with noise. In Proceedings of the Second International Conference on Knowledge Discovery and Data Mining, Portland, OR, USA, 2–4 August 1996; pp. 226–231. [Google Scholar]
  51. Riquelme, A.; Tomás, R.; Cano, M.; Pastor, J.L.; Abellán, A. Automatic Mapping of Discontinuity Persistence on Rock Masses Using 3D Point Clouds. Rock Mech. Rock Eng. 2018, 51, 3005–3028. [Google Scholar] [CrossRef]
  52. Palmström, A. Measurement and characterizations of rock mass jointing. In In-Situ Characterization of Rocks—Chapter 2; Palmström, A., Sharma, V.I., Saxena, K., Eds.; A.A. Balkema Publishers: Rotterdam, The Netherlands, 2001; pp. 1–40. ISBN 9789058092373. [Google Scholar]
  53. RocPro3D 2014. Available online: http://www.rocpro3d.com/rocpro3d_en.php (accessed on 29 November 2018).
  54. Lendínez González, A.; de Tena-Dávila Ruiz, M. Mapa geológico de la hoja 745 (Jalance). Mapa geológico de España. E 1:50000. 2° serie (MAGNA). 2010. Available online: http://info.igme.es/cartografiadigital/geologica/Magna50Hoja.aspx?Id=745 (accessed on 29 November 2018).
  55. Varnes, D.J. Slope Movement Types and Processes. In TRB Special Report 176, Landslides: Analysis and Control; Transportation Research Board: Washington, DC, USA, 1978; pp. 11–33. [Google Scholar]
  56. Hutchinson, J.N. General Report: Morphological and geotechnical parameters of landslides in relation to geology and hydrogeology. In Proceedings of the 5th International Symposium on Landslides, Lausanne, Switzerland, 10–15 July 1988; Volume 2, pp. 3–35. [Google Scholar]
  57. Pfeiffer, T.J.; Higgins, J.D. Rockfall hazard analysis using the Colorado Rockfall Simulation Program. Transp. Res. Rec. 1990, 1288, 117–126. [Google Scholar]
  58. Budetta, P.; Santo, A. Morphostructural evolution and related kinematics of rockfalls in Campania (southern Italy): A case study. Eng. Geol. 1994, 36, 197–210. [Google Scholar] [CrossRef]
  59. Guzzetti, F.; Reichenbach, P.; Wieczorek, G.F. Rockfall hazard and risk assessment in the Yosemite Valley, California, USA. Nat. Hazards Earth Syst. Sci. 2003, 3, 491–503. [Google Scholar] [CrossRef] [Green Version]
  60. Mateos, R.M.; García-Moreno, I.; Reichenbach, P.; Herrera, G.; Sarro, R.; Rius, J.; Aguiló, R.; Fiorucci, F. Calibration and validation of rockfall modelling at regional scale: Application along a roadway in Mallorca (Spain) and organization of its management. Landslides 2016, 13, 751–763. [Google Scholar] [CrossRef]
  61. Sarro, R.; Mateos, R.M.; García-Moreno, I.; Herrera, G.; Reichenbach, P.; Laín, L.; Paredes, C. The Son Poc rockfall (Mallorca, Spain) on the 6th of March 2013: 3D simulation. Landslides 2014, 11, 493–503. [Google Scholar] [CrossRef]
  62. Hungr, O.; Evans, S.G.; Hazzard, J. Magnitude and frequency of rock falls and rock slides along the main transportation corridors of southwestern British Columbia. Can. Geotech. J. 1999, 36, 224–238. [Google Scholar] [CrossRef]
  63. Li, L.; Lan, H. Probabilistic modeling of rockfall trajectories: A review. Bull. Eng. Geol. Environ. 2015, 74, 1163–1176. [Google Scholar] [CrossRef]
Figure 1. The municipality of Cortes de Pallás. Location of the April 2015 rockfall and of the urban area of Cortes de Pallás, where the cultural heritage site of Barranco de la Barbulla is located.
Remotesensing 10 01923 g001
Figure 2. Panoramic view of the urban area of Cortes de Pallás (Valencia, Spain) and the terraced cultural heritage area over the village. Pictures courtesy of Nacho Lambíes.
Remotesensing 10 01923 g002
Figure 3. Rockfall at the Cortes de Pallás reservoir on 6 April 2015. The photo was taken two days after the event.
Remotesensing 10 01923 g003
Figure 4. Daily rainfall and accumulated rainfall recorded by the gauging station located 300 m from the rockfall event.
Remotesensing 10 01923 g004
Figure 5. Flowchart of the methodology.
Remotesensing 10 01923 g005
Figure 6. (a) Identification of source areas in the three layers of limestone; (b) lithological units in the study zone based on Table 1.
Remotesensing 10 01923 g006
Figure 7. (a) Location of the 2015 rockfall event; (b) study area; (c) extraction of the discontinuity sets and classification of the three-dimensional point cloud (3DPC); (d) view of the points belonging to sets 1 to 4, respectively classified according to the clusters that formed plane surfaces.
Remotesensing 10 01923 g007
Figure 8. Stereogram showing the density of the calculated poles, where four local discontinuities were identified (left); 3D visualization of the density of the poles (right).
Remotesensing 10 01923 g008
Figure 9. Energy distribution for the blocks detached from the upper layer of limestone/dolostone.
Remotesensing 10 01923 g009
Figure 10. Energy distribution for the blocks detached from the intermediate layer.
Remotesensing 10 01923 g010
Figure 11. Energy distribution for the blocks detached from the lowest layer.
Remotesensing 10 01923 g011
Figure 12. Rockfall potential reach obtained with the simulation and from the existing thematic cartography series (Generalitat Valenciana 1991).
Remotesensing 10 01923 g012
Figure 13. Trajectories with longest distances traveled and that affected the buildings located at the intermediate part of the slope, with details on the time elapsed for the block to follow the trajectory.
Remotesensing 10 01923 g013
Table 1. Parameters utilized in the modeling, according to the lithological units identified at the study zone.
PARAMETERS Lithological Units1 Dolostone2 Calcarenite and Sandstone3 Calcarenite and Limestone4 Green Marl5 Debris
RESTITUTION COEFFICIENT
Mean normal value μ_Rn (-)0.670.650.670.580.42
Mean tangential value μ_Rt (-)0.880.860.790.720.69
Standard.-Deviation σ_R (-)0.0110.0120.01350.0140.012
Limit velocity V_R(lim) (m/s)1010101010
Limit Std.-Deviation σ_R(lim) (-)0.0050.0060.010.0110.006
LATERAL DEVIATION
Standard.-Deviation σ_ θh (°)910885.5
Limit velocity V_θ h(lim) (m/s)1010101010
Limit Std.-Deviation σ_ θ h(lim) (°)4.54.54.1542.75
REBOUND FLATTENING
Standard.-Deviation σ_ θv (°)11111
Limit velocity V_θ v(lim) (m/s)1010101010
Limit Std.-Deviation σ_ θ v(lim) (°)22222
FRICTION COEFFICIENT
Mean value μ_k (-)0.40.450.520.60.72
Standard.-Deviation σ_k (-)0.040.0450.0450.0450.042
Limit velocity V_k(lim) (m/s)1010101010
Limit Std.-Deviation σ_k(lim) (-)0.030.030.030.030.03
TRANSITION PARAMETERS
Angle β _lim (acute case) (°)43446
Angle β _lim’ (obtuse case) (°)3025353545

