Article

Suitability of Satellite-Based Precipitation Products for Water Balance Simulations Using Multiple Observations in a Humid Catchment

1
Key Laboratory of Watershed Geographic Sciences, Nanjing Institute of Geography and Limnology, Chinese Academy of Sciences, Nanjing 210008, China
2
Key Laboratory of Water Cycle and Related Land Surface Processes, Institute of Geographic Sciences and Natural Resources Research, Chinese Academy of Sciences, Beijing 100101, China
*
Author to whom correspondence should be addressed.
Submission received: 12 December 2018 / Revised: 6 January 2019 / Accepted: 11 January 2019 / Published: 15 January 2019
(This article belongs to the Special Issue Remote Sensing for Streamflow Simulation)

Abstract

:
This study assesses the suitability of five popular satellite-based precipitation products in modeling water balance in a humid region of China during the period 1998–2012. The satellite-based precipitation products show similar spatial patterns with varying degrees of overestimation or underestimation, compared with the gauged precipitation. A distributed hydrological model is used to evaluate the suitability of satellite-based precipitation products in simulating streamflow, evapotranspiration and soil moisture. The simulations of streamflow and evapotranspiration forced by the MSWEP precipitation perform best among the five satellite-based precipitation products, where the Kling-Gupta efficiency (KGE) between the simulated and observed streamflow ranges from 0.75 to 0.91, and the KGE between the simulated and observed evapotranspiration ranges from 0.46 to 0.61. However, the KGE between the simulated and observed soil moisture is negative, indicating that the performance of soil moisture simulation forced by satellite-based precipitation is poor. In addition, this study finds the spatial pattern of simulated streamflow is dominated by the distribution of precipitation, whereas the distribution of evapotranspiration and soil moisture is controlled by the parameters of the hydrological model. This study is useful for the improvement of hydrological modeling based on remote sensing and the monitoring of regional water resources.

1. Introduction

Precipitation is a critical variable in the water cycle, and accurate measurements of precipitation are important for hydrological modeling, extremes prediction and water resources management [1,2,3]. It is reported that global precipitation is expected to increase under the impact of global warming. The increase in precipitation may lead to changes in evapotranspiration and streamflow, and then result in the variation in hydrological extremes [4,5,6,7]. Therefore, accurate quantification of precipitation has an important scientific and practical significance in the present and future hydro-climatological researches.
However, the traditional precipitation observations from rain gauges suffer from several limitations, including sparse gauge networks, data gaps, reporting time delays, and limited access to available data [8,9]. The satellite-based precipitation can overcome the shortcomings of gauge-based observations by providing the continuous and near-real-time precipitation estimates at a global or quasi-global scale [10,11]. Although the accuracy of satellite-based precipitation has improved continuously over the past several decades, they always suffer from significant error sources associated with indirect measurements, retrieval algorithms and sampling frequency [12,13,14]. Therefore, most satellite-based products not only utilized the satellite-based precipitation, but also included gauge-based observations to correct the bias of precipitation estimates, and some of them also employed the reanalysis data during the process of product generation [15,16,17].
Numerous investigations of the performance of satellite-based precipitation products have been examined on regional and global scales [15,16,18]. For example, Sun et al. [15] presented a comprehensive review of the data sources and retrieval algorithms for 30 currently available global precipitation datasets and found that the reliability of precipitation datasets is mainly limited by the number and spatial coverage of surface stations, the satellite retrieval algorithms and the data assimilation schemes. Generally, the suitability of satellite-based precipitation products varies under different climatic conditions. In addition to the direct comparison of the satellite-based precipitation products against the gauged observations, the evaluation of satellite-based precipitation products is also conducted based on their performance of streamflow simulations in a framework of hydrological modeling, which is commonly called a hydrological evaluation of precipitation datasets. The underlying hypothesis of this evaluation is that the error in satellite-based precipitation products can be propagated into the accuracy of streamflow simulations. For example, Ciabatta et al. [19] used the state-of-the-art satellite-based precipitation products as the inputs of a rainfall-runoff model in Italy and found the soil moisture-derived rainfall products provide promising results for hydrological applications. Liu et al. [20] employed Precipitation Estimation from Remotely Sensed Information Using Artificial Neural Networks–Climate Data Record as the input for a hydrologic model to simulate streamflow on the data scarce Tibetan Plateau and found that this rainfall product has good potential to be a reliable dataset and an alternative information source of a limited gauge network on the Tibetan Plateau.
However, previous studies on hydrological evaluation of precipitation datasets often focus on the performance of streamflow simulations, with less scrutiny on the accuracy of other hydrological variables, e.g., evapotranspiration and soil moisture [21,22,23,24]. Although some studies have attempted to evaluate the precipitation products by cross-comparing the outputs of hydrological simulation forced by different satellite-based precipitation products [25,26,27,28,29], comprehensive studies of the performance of satellite-based precipitation products in water balance simulations are still not available due to the limitation of the observations of hydrological components [30]. Bai et al. [31] indicated that evaluation of precipitation datasets regarding only on the accuracy of runoff simulations is less meaningful; the hydrological models have the ability to offset the impact of different precipitation inputs on streamflow simulations by parameter calibration. It would be better to include other hydrological components (e.g., evapotranspiration and/or soil moisture) in addition to streamflow observations to evaluate the hydrological modeling performance of satellite-based precipitation products [32,33,34].
In this study, we evaluate the error characteristics and hydrological suitability for five popular satellite-based precipitation products in a humid catchment with multiple observations of hydrological components. The precipitation estimates from five satellite-based products are first compared against the gauged observations. Next, we compare the simulated hydrological fluxes and states (including streamflow, evapotranspiration and soil moisture) driven by the five satellite-based precipitation products against gauged precipitation based on a distributed hydrological model. We also set up six types of parameter calibration scenarios to analyze the influence of parameter estimation schemes on evaluation results. Finally, we discuss the potential uncertainty in evaluation results. The results of this study are helpful for product users to select the appropriate product(s) for their applications on hydrological modeling and are useful for the improvement of hydrological modeling based on remote sensing.

2. Materials and Methods
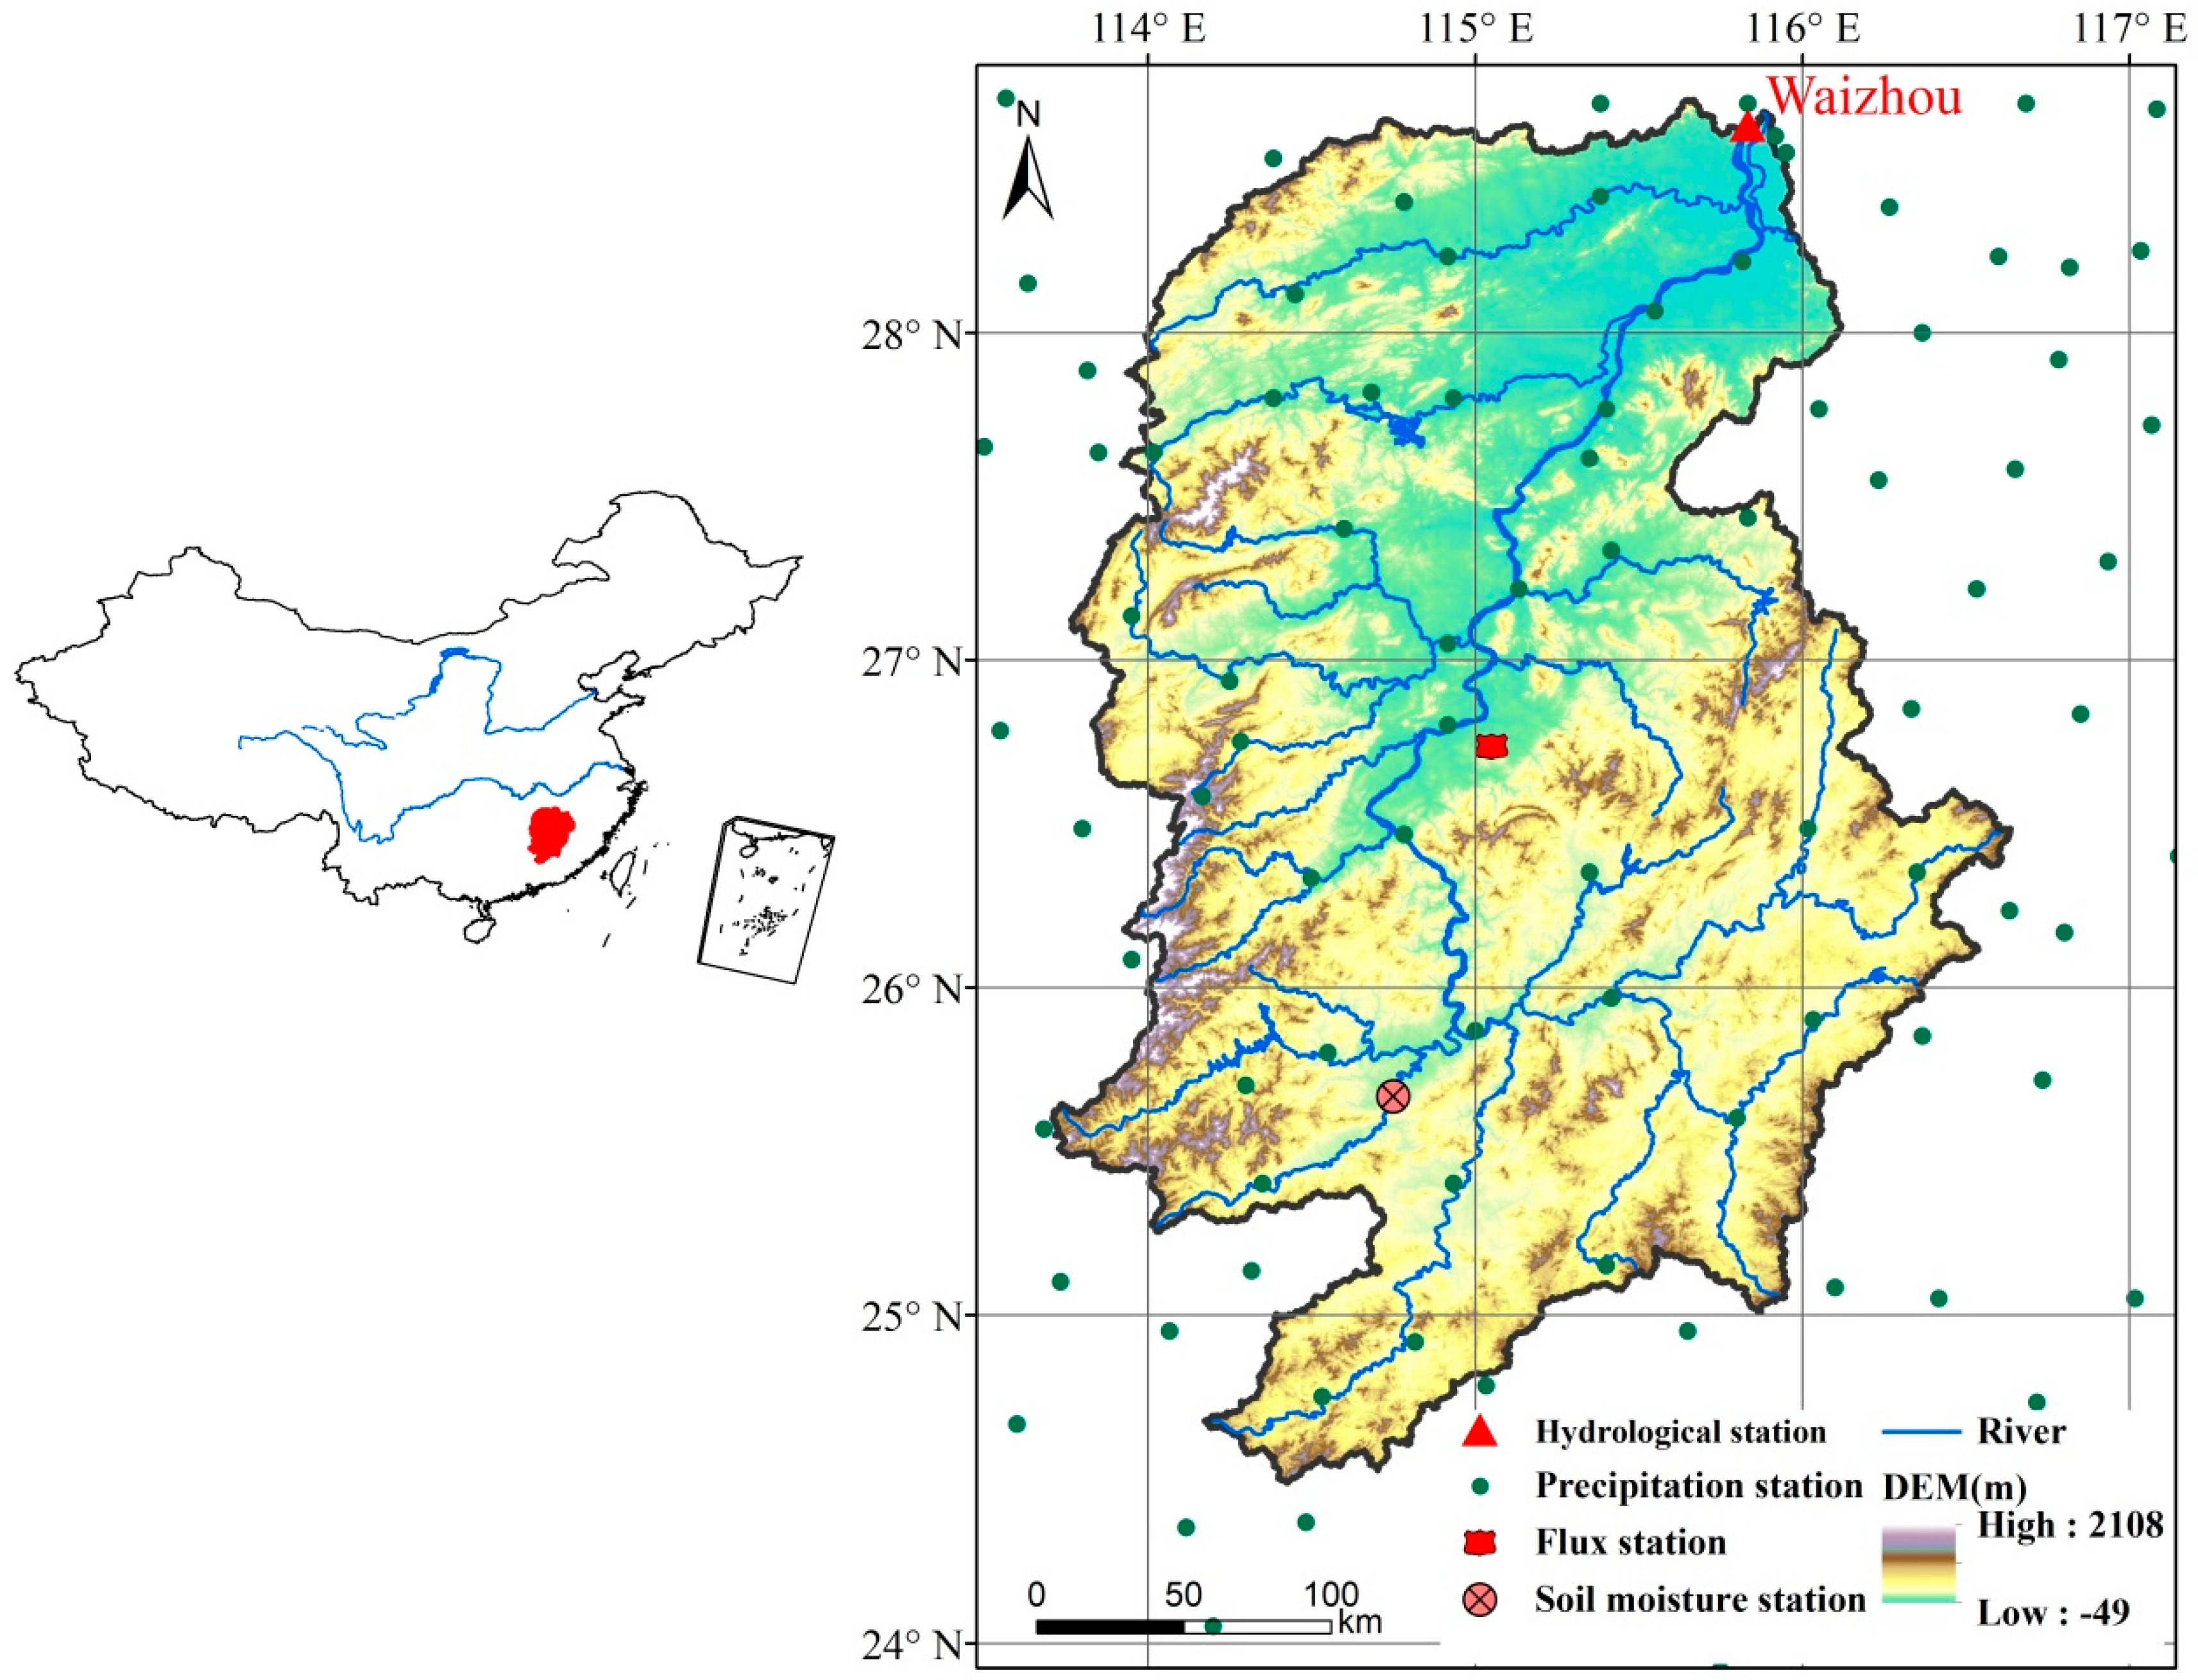
2.1. Study Area

The Ganjiang Basin is located in the middle reaches of the Yangtze River and has a drainage area of 80,948 km2 (Figure 1). The landscape of the Ganjiang Basin is dominated by stony mountains and the topography is complex, with the elevation varying from about −50 m to 2100 m above sea level. Low hills lie in the central part of the basin while alluvial plains govern the downstream of the major watercourse. This basin belongs to the subtropical wet climate. The air temperature is about 19 °C and the annual precipitation is about 1560 mm averaged from 1998–2012. The intra-annual precipitation varies obviously, and the rainy season occurs from April and June. Additionally, the spatial distribution of precipitation is also uneven, with high values in the upper reach and low values in the middle and the lower reaches of the Ganjiang Basin [35].

2.2. Datasets

2.2.1. Satellite-Based Products

Five popular satellite-based precipitation products are used in the current study, including the version 2.0 of the Climate Hazards Group InfraRed Precipitation with Station data (CHIRPS, ftp://ftp.chg.ucsb.edu/pub/org/chg/products/CHIRPS-2.0), the version 1.0 of the Climate Prediction Center morphing technique (CMORPH, ftp://ftp.cpc.ncep.noaa.gov/precip/global_CMORPH/daily_025deg), the version 2.0 of the Multi-Source Weighted-Ensemble Precipitation (MSWEP, http://gloh2o.org/), the Precipitation Estimation from Remotely Sensed Information using Artificial Neural Networks-Climate Data Record (PERSIANN, http://chrsdata.eng.uci.edu/) and the version 7 of the Multi-satellite Precipitation Analysis products of the Tropical Rainfall Measuring Mission (TRMM, https://pmm.nasa.gov/data-access/downloads/trmm). The five satellite-based precipitation products have high temporal resolutions, which have been widely used in hydrological and meteorological researches [36,37,38]. The detailed information on the five satellite-based precipitation products can be found in Table 1. It should be noted that all the five products utilized the gauged observations to correct the bias of raw precipitation estimates, and some of them, i.e., MSWEP and CHIRPS, also merged the reanalysis data in the process of data generation [15,19] The five products have the same spatial resolution, i.e., 0.25° × 0.25°. In addition, the MOD16 global evapotranspiration from the Moderate Resolution Imaging Spectroradiometer (MODIS) during the period 2000–2012 was employed to validate the accuracy of simulated evapotranspiration from hydrological modeling (https://modis.gsfc.nasa.gov/) [39].

2.2.2. Ground-Based Datasets

The gauged precipitation at 92 rainfall stations during the period 1998-2012 in and around the Ganjiang Basin was obtained from the China Meteorological Administration (CMA, http://data.cma.cn/data/), which was interpolated to the same spatial resolution (i.e., 0.25° × 0.25°) as the selected satellite-based precipitation products using an inverse distance weighted (IDW) technique in ArcGIS 10.2. The observed daily streamflow records at Waizhou station (28.63°N, 115.83°E), i.e., the outlet of Ganjiang Basin, were obtained from the Yangtze River Hydrological Bureau of China. Evapotranspiration is measured by a flux station using the eddy covariance method (26.73°N, 115.05°E), which locates in the southwest of the Ganjiang Basin. Consecutive daily evapotranspiration observations are available during the period 2003–2005. Soil moisture is obtained from an agricultural observatory (25.67°N, 114.75°E) of CMA located in the south of the study area, which is measured every ten days on the 8th, 18th and 28th day of each month. The soil moisture is recorded at five layers below ground, i.e., 10 cm, 20 cm, 50 cm, 70 cm and 100 cm, which is employed to evaluate the accuracy of the simulated soil moisture by hydrological model. Soil moisture change (SMC) is calculated as the differences between soil moisture in a certain month and its previous month.

2.3. Methodology

2.3.1. Hydrological Model and Calibration Method

The grid-based Hydro-Informatic Modeling System (HIMS) model is used in this study, which integrates most important hydrological processes and considers water exchange between canopy, soil moisture, and groundwater storages, which was originally developed by Liu et al. [45] and later modified by Bai et al. [46] by replacing the empirical evapotranspiration equation with a physically-based one. The model structures of the HIMS model are distributed in vertical hydrological processes (e.g., infiltration, soil moisture balance, and evapotranspiration), but lumped in horizontal hydrological processes (e.g., runoff routing). The HIMS model runs at a daily time step and includes eight free parameters (see Table 2). The parameters associated with runoff generation and routing processes (e.g., Rmax, Rmin, and MAXBAS) have a higher sensitivity than the other parameters [46,47]. The mode parameters were automatically calibrated using the genetic algorithm by maximizing the error metric (i.e., Kling-Gupta efficiency) between observed and simulated runoff. The spatial resolution of the model is variable and can be flexibly set according to the needs of the research. Here, the model runs at a resolution of 0.25° × 0.25°. The HIMS model has been implemented successfully in a number of river basins in China with a variety of climate and landscape conditions [20,46,47,48]. The meteorological inputs of the model include the precipitation and the variables to calculate evapotranspiration, including air temperature, wind speed, relative humidity, and sunshine hours.
In this study, the performance of the simulated water balance components forced by five satellite-based precipitation products are evaluated under six scenarios. In scenario 0 (S0), the parameters of the hydrological model are calibrated using the gauged precipitation as the forcing, and then the calibrated model parameters are used to simulate water balance components using the five satellite-based precipitation products as forcing. In scenarios 1–5 (S1–S5), each satellite-based precipitation product is used to calibrate the model parameters and then the product-specific parameter sets are separately used to simulate the water balance components by the other precipitation datasets. The aim of S0 is to assess the performance of hydrological simulations of the selected satellite-based precipitation products with the static parameters calibrated by the gauged precipitation, whereas S1–S5 is designed to investigate the hydrological utility of the satellite-based precipitation products, particularly in ungauged basins where only satellite-based precipitation products are available. More information about the six scenarios can be found in Table 3.

2.3.2. Statistical Method

The false alarm ratio (FAR) and the probability of detection (POD) are used to assess the accuracy of satellite-based precipitation products, which can be written as [26,49]:
F A R = b a + b
P O D = a a + c
where a is the number of observed precipitation events correctly detected, b is the number of precipitation events detected but not observed, and c is the number of observed precipitation events not detected. FAR measures the fraction of precipitation detections that are false alarms, whereas POD measures the fraction of precipitation occurrences that were correctly detected.
Four indicators are employed to evaluate the performance of hydrological modeling, which are Pearson’s correlation coefficient (r), relative bias (RB), root-mean-square deviation (RMSD) and the Kling-Gupta efficiency (KGE) [50]:
r = i = 1 N ( y o b s , i y o b s ¯ ) ( y s i m , i y s i m ¯ ) i = 1 N ( y s i m , i y s i m ¯ ) 2 i = 1 N ( y o b s , i y o b s ¯ ) 2
R B = i = 1 N ( y o b s , i y s i m , i ) i = 1 N ( y o b s , i ) × 100 %
R M S D = 1 N i = 1 N [ ( y s i m , i y s i m ¯ ) ( y o b s , i y o b s ¯ ) ] 2
K G E = 1 ( 1 r ) 2 + ( 1 α ) 2 + ( 1 β ) 2
where
α = σ s σ o   and   β = μ s μ o
where μs and σs are the mean and standard deviation of the simulations (ysim); μo and σo are the mean and standard deviation of the observations (yobs), respectively; N is the total number of days in the data time series. The r measures whether a statistically significant linear relationship exists between the simulations and observations, where the optimal value is r = 1. The RB and RMSD measure whether the simulations are overestimated or underestimated compared with the observations, where the optimal values are RB = 0% and RMSD = 0. The KGE measures the overall fitness between observations and simulations, where the optimal value is KGE = 1.

3. Results

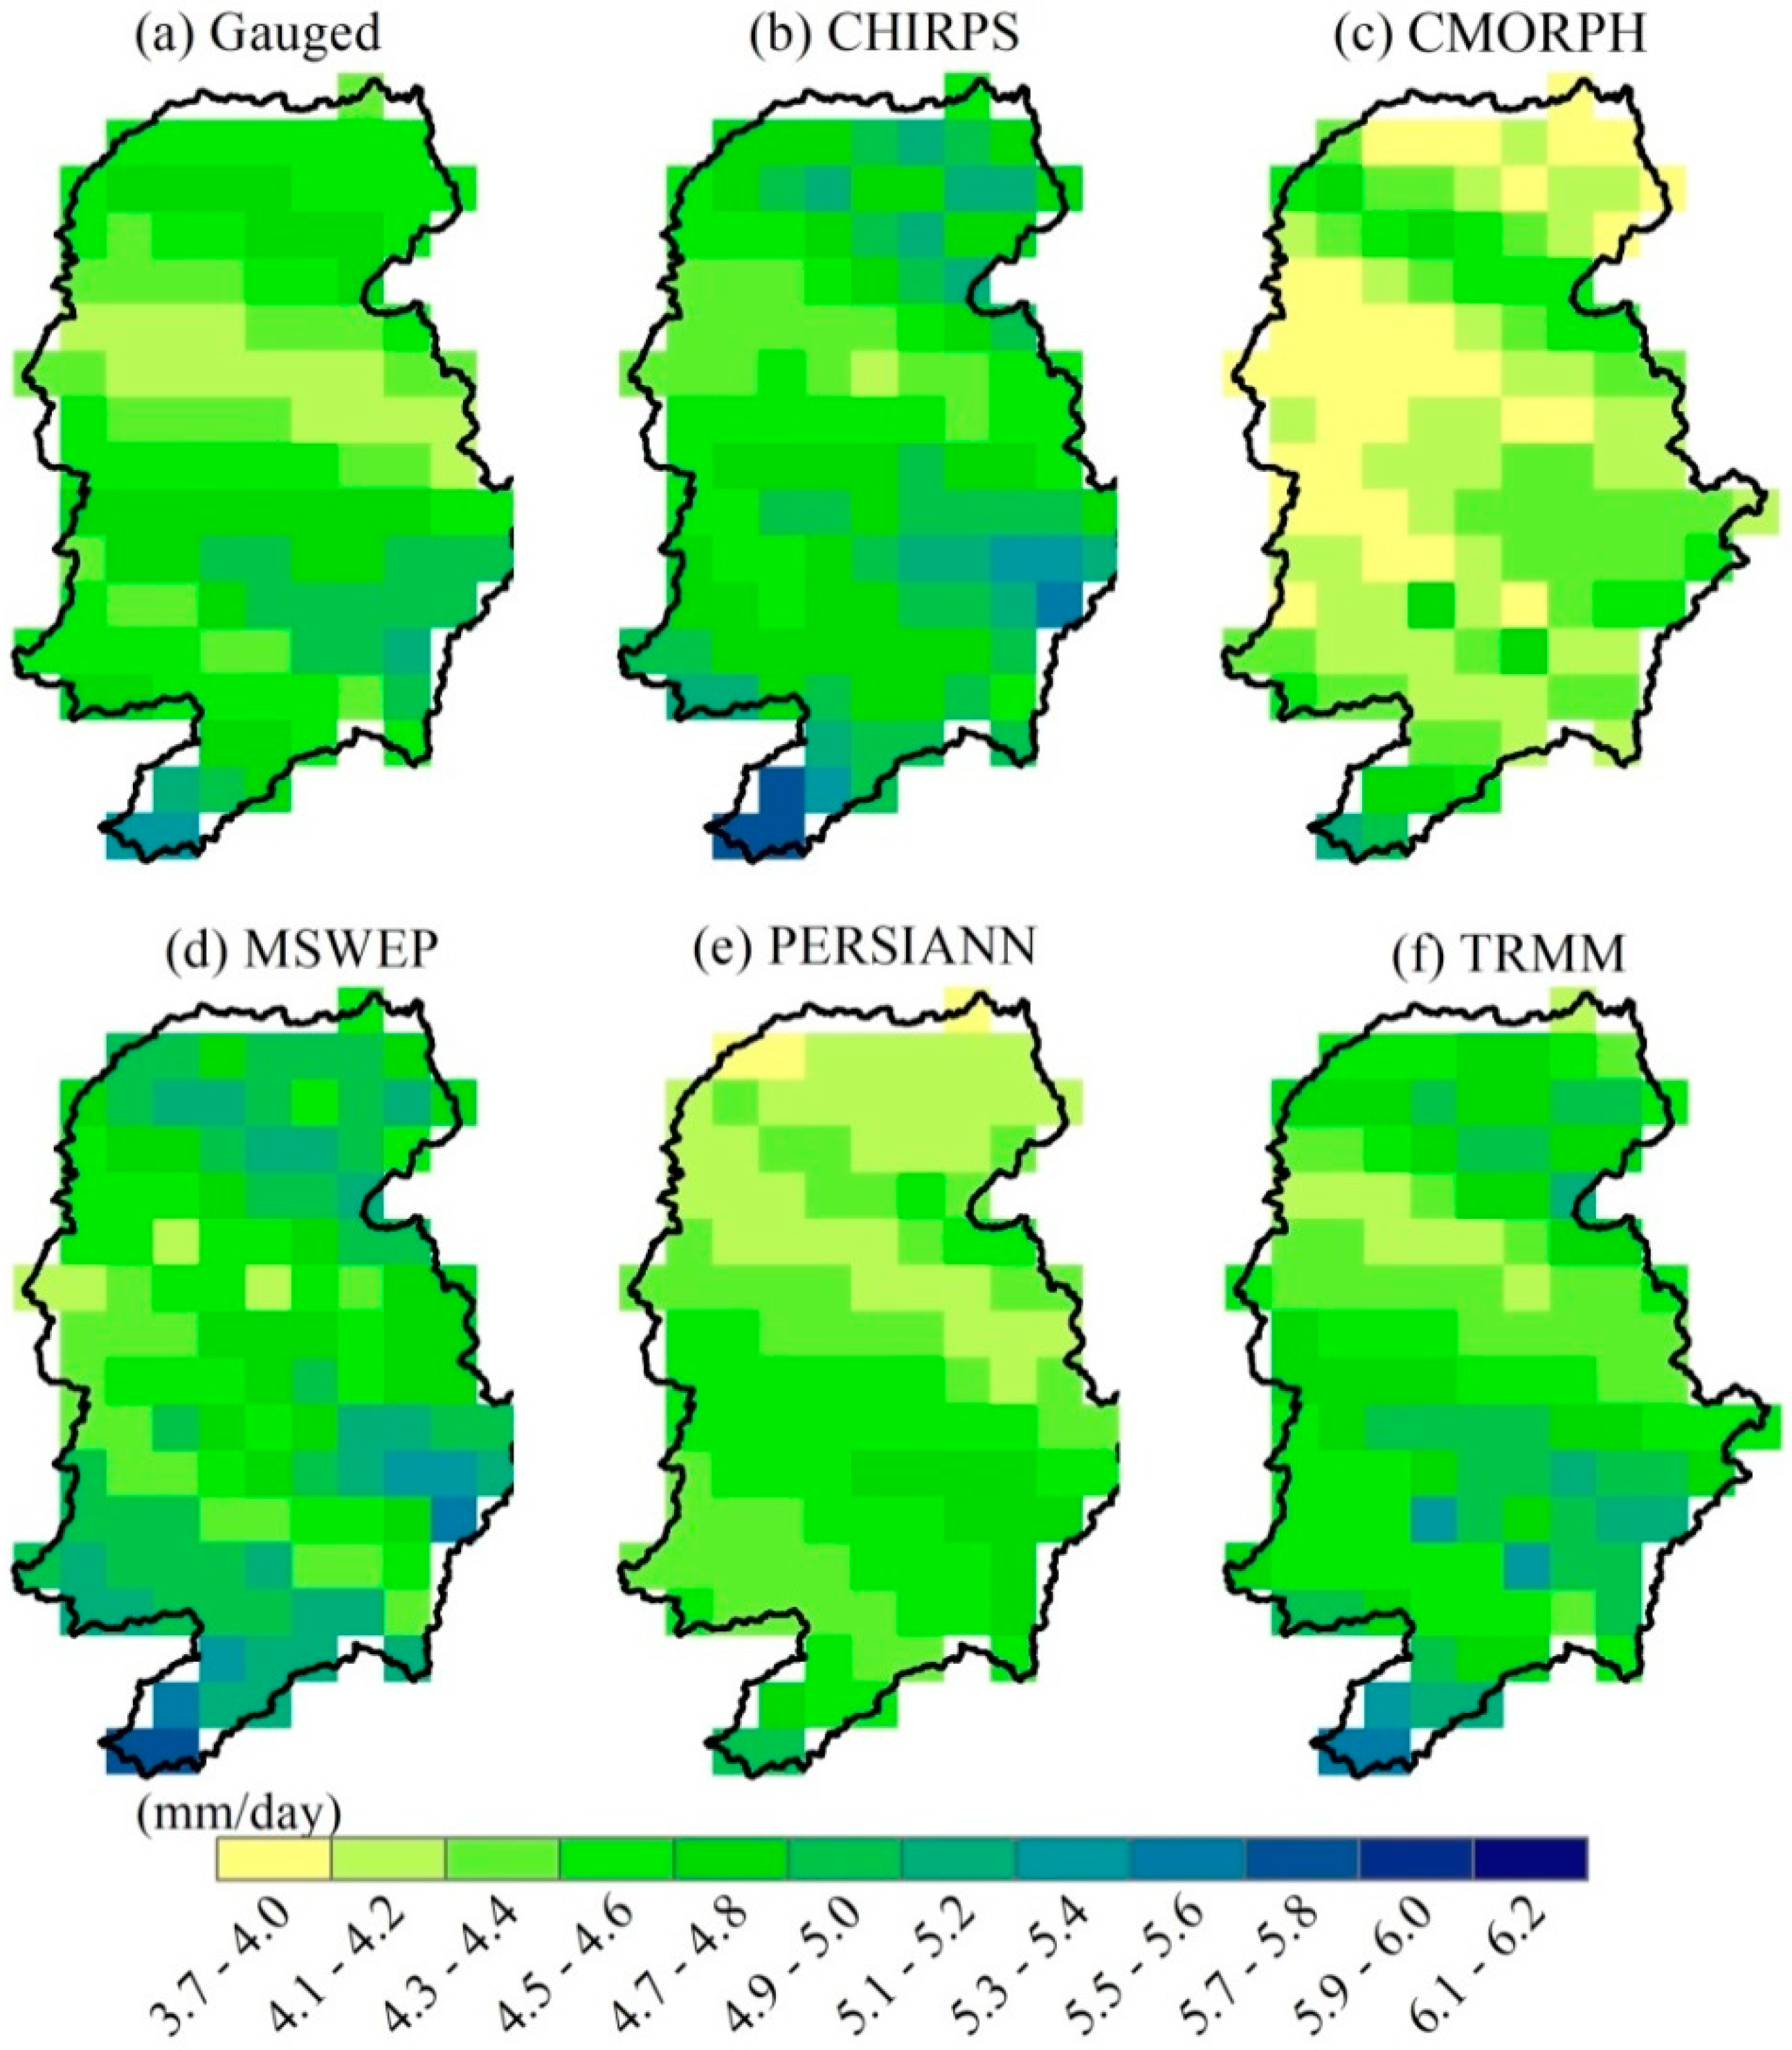
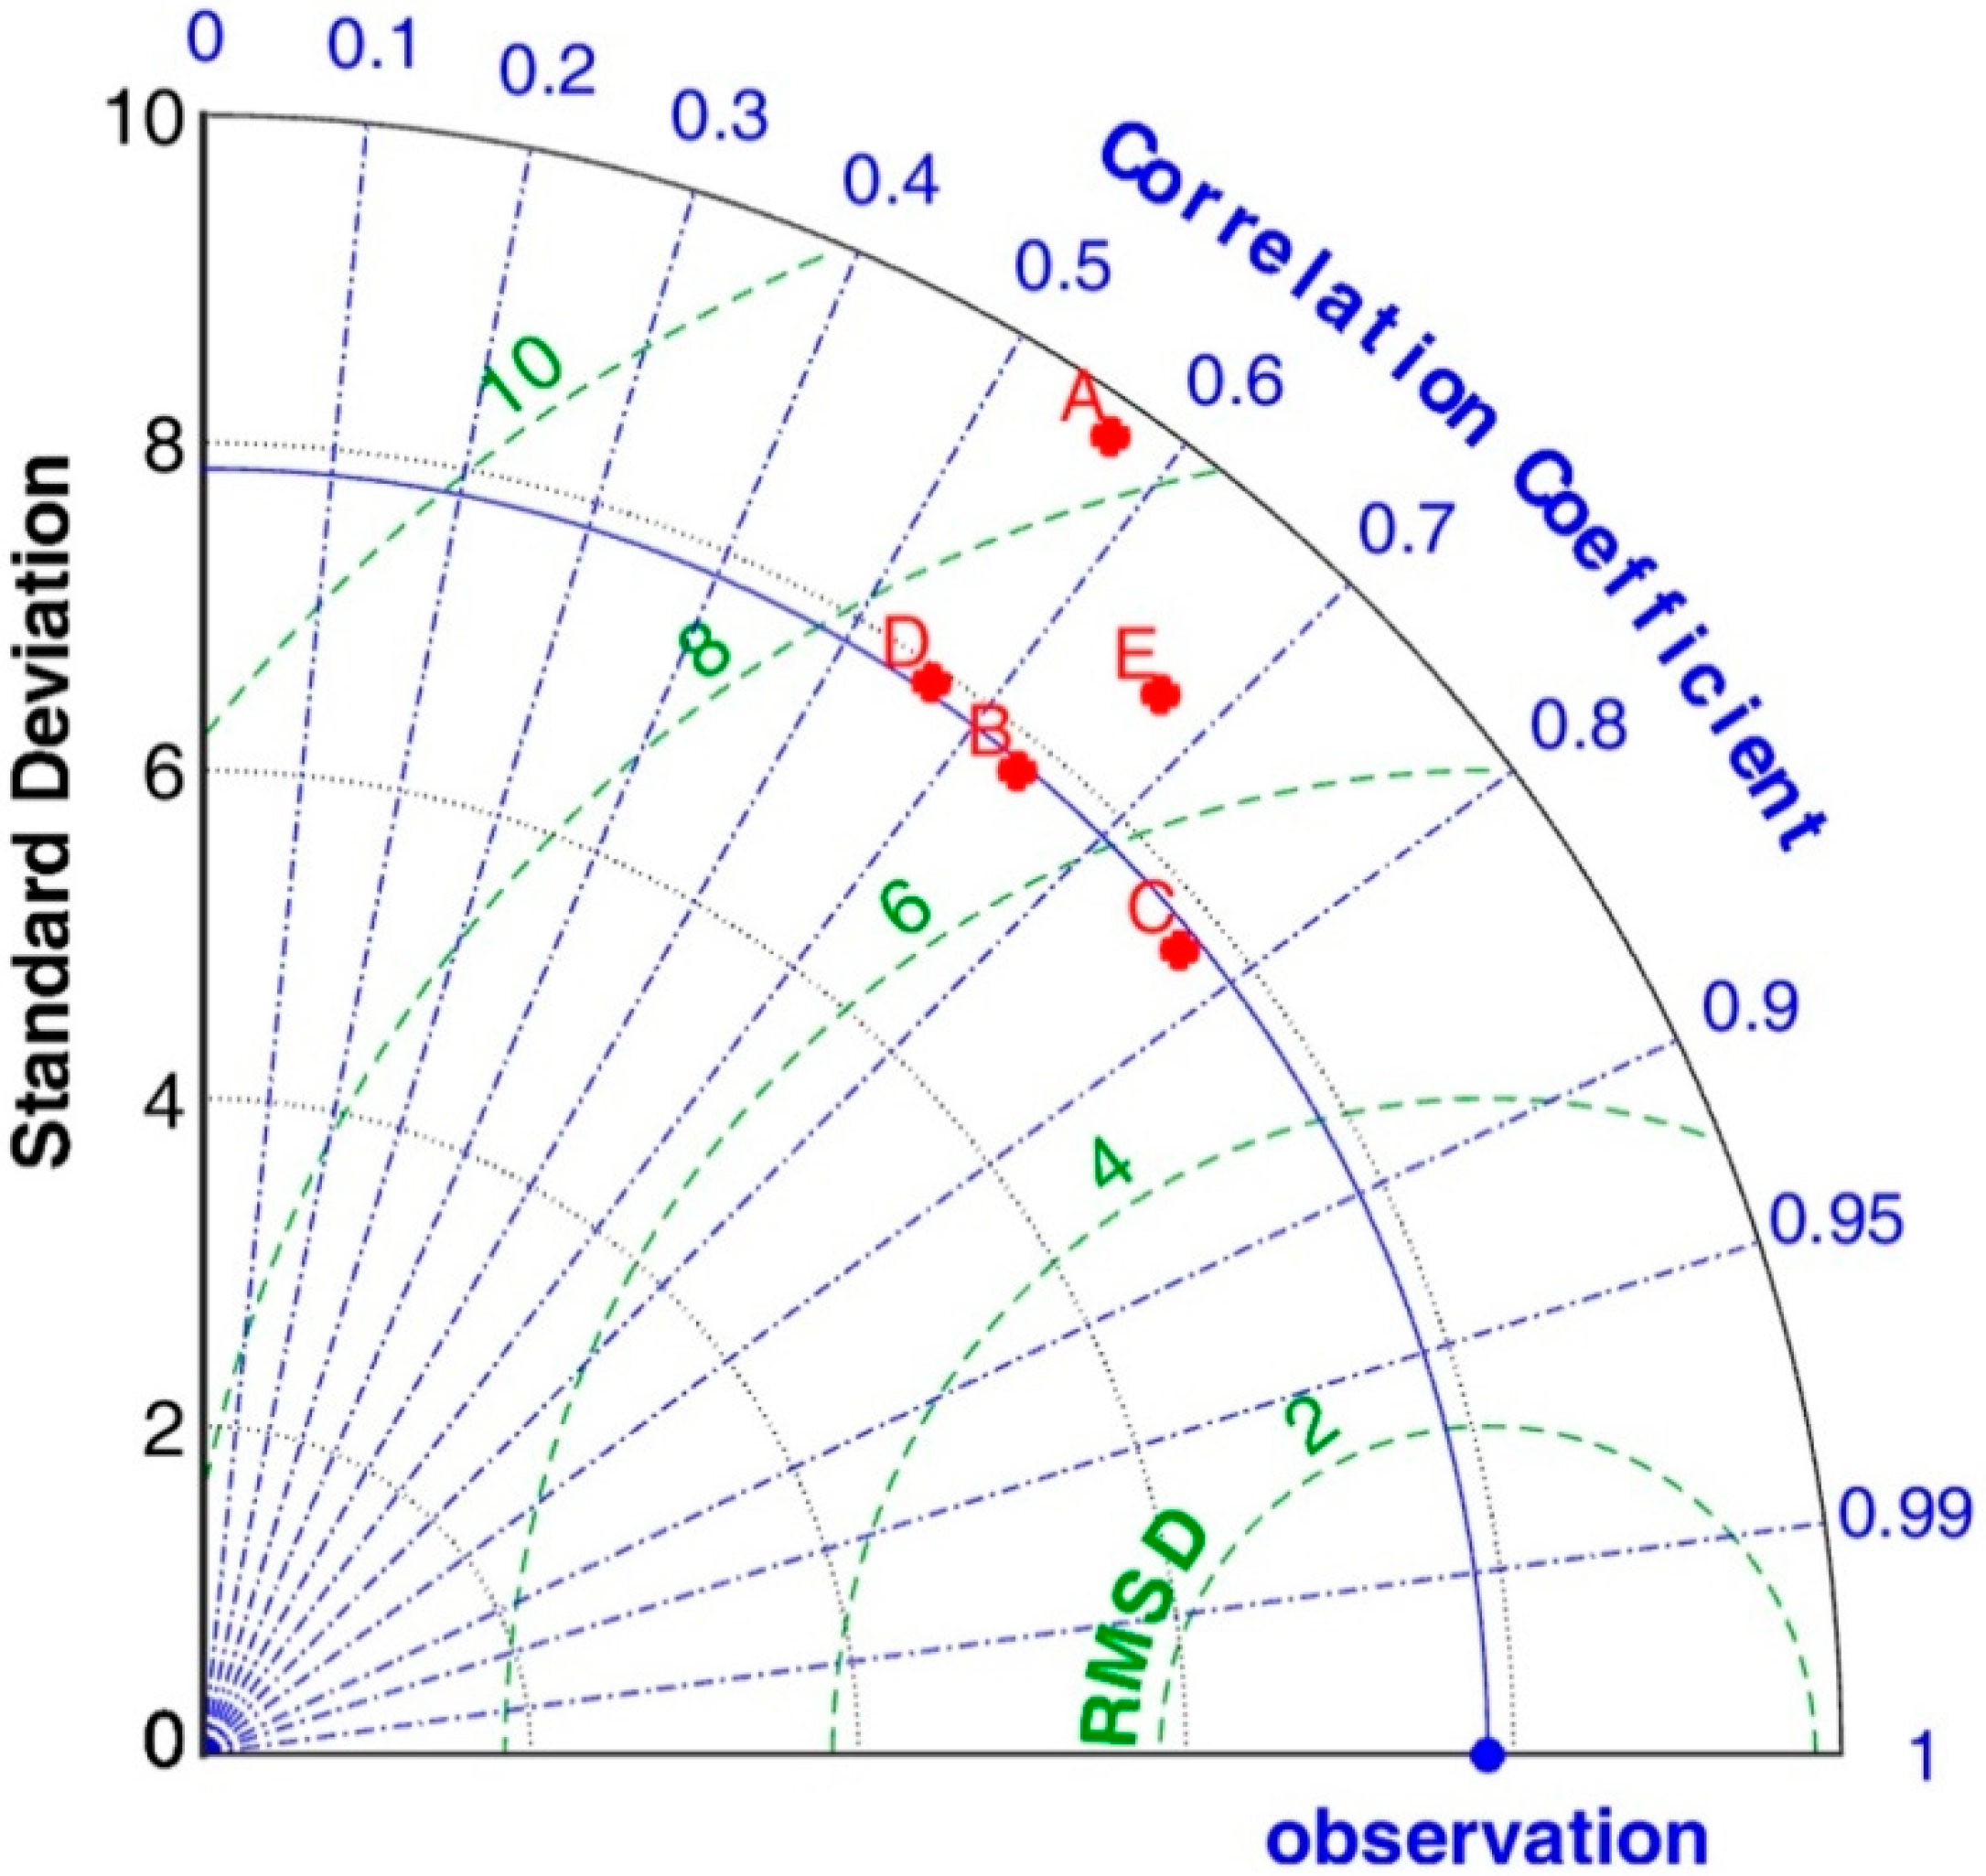
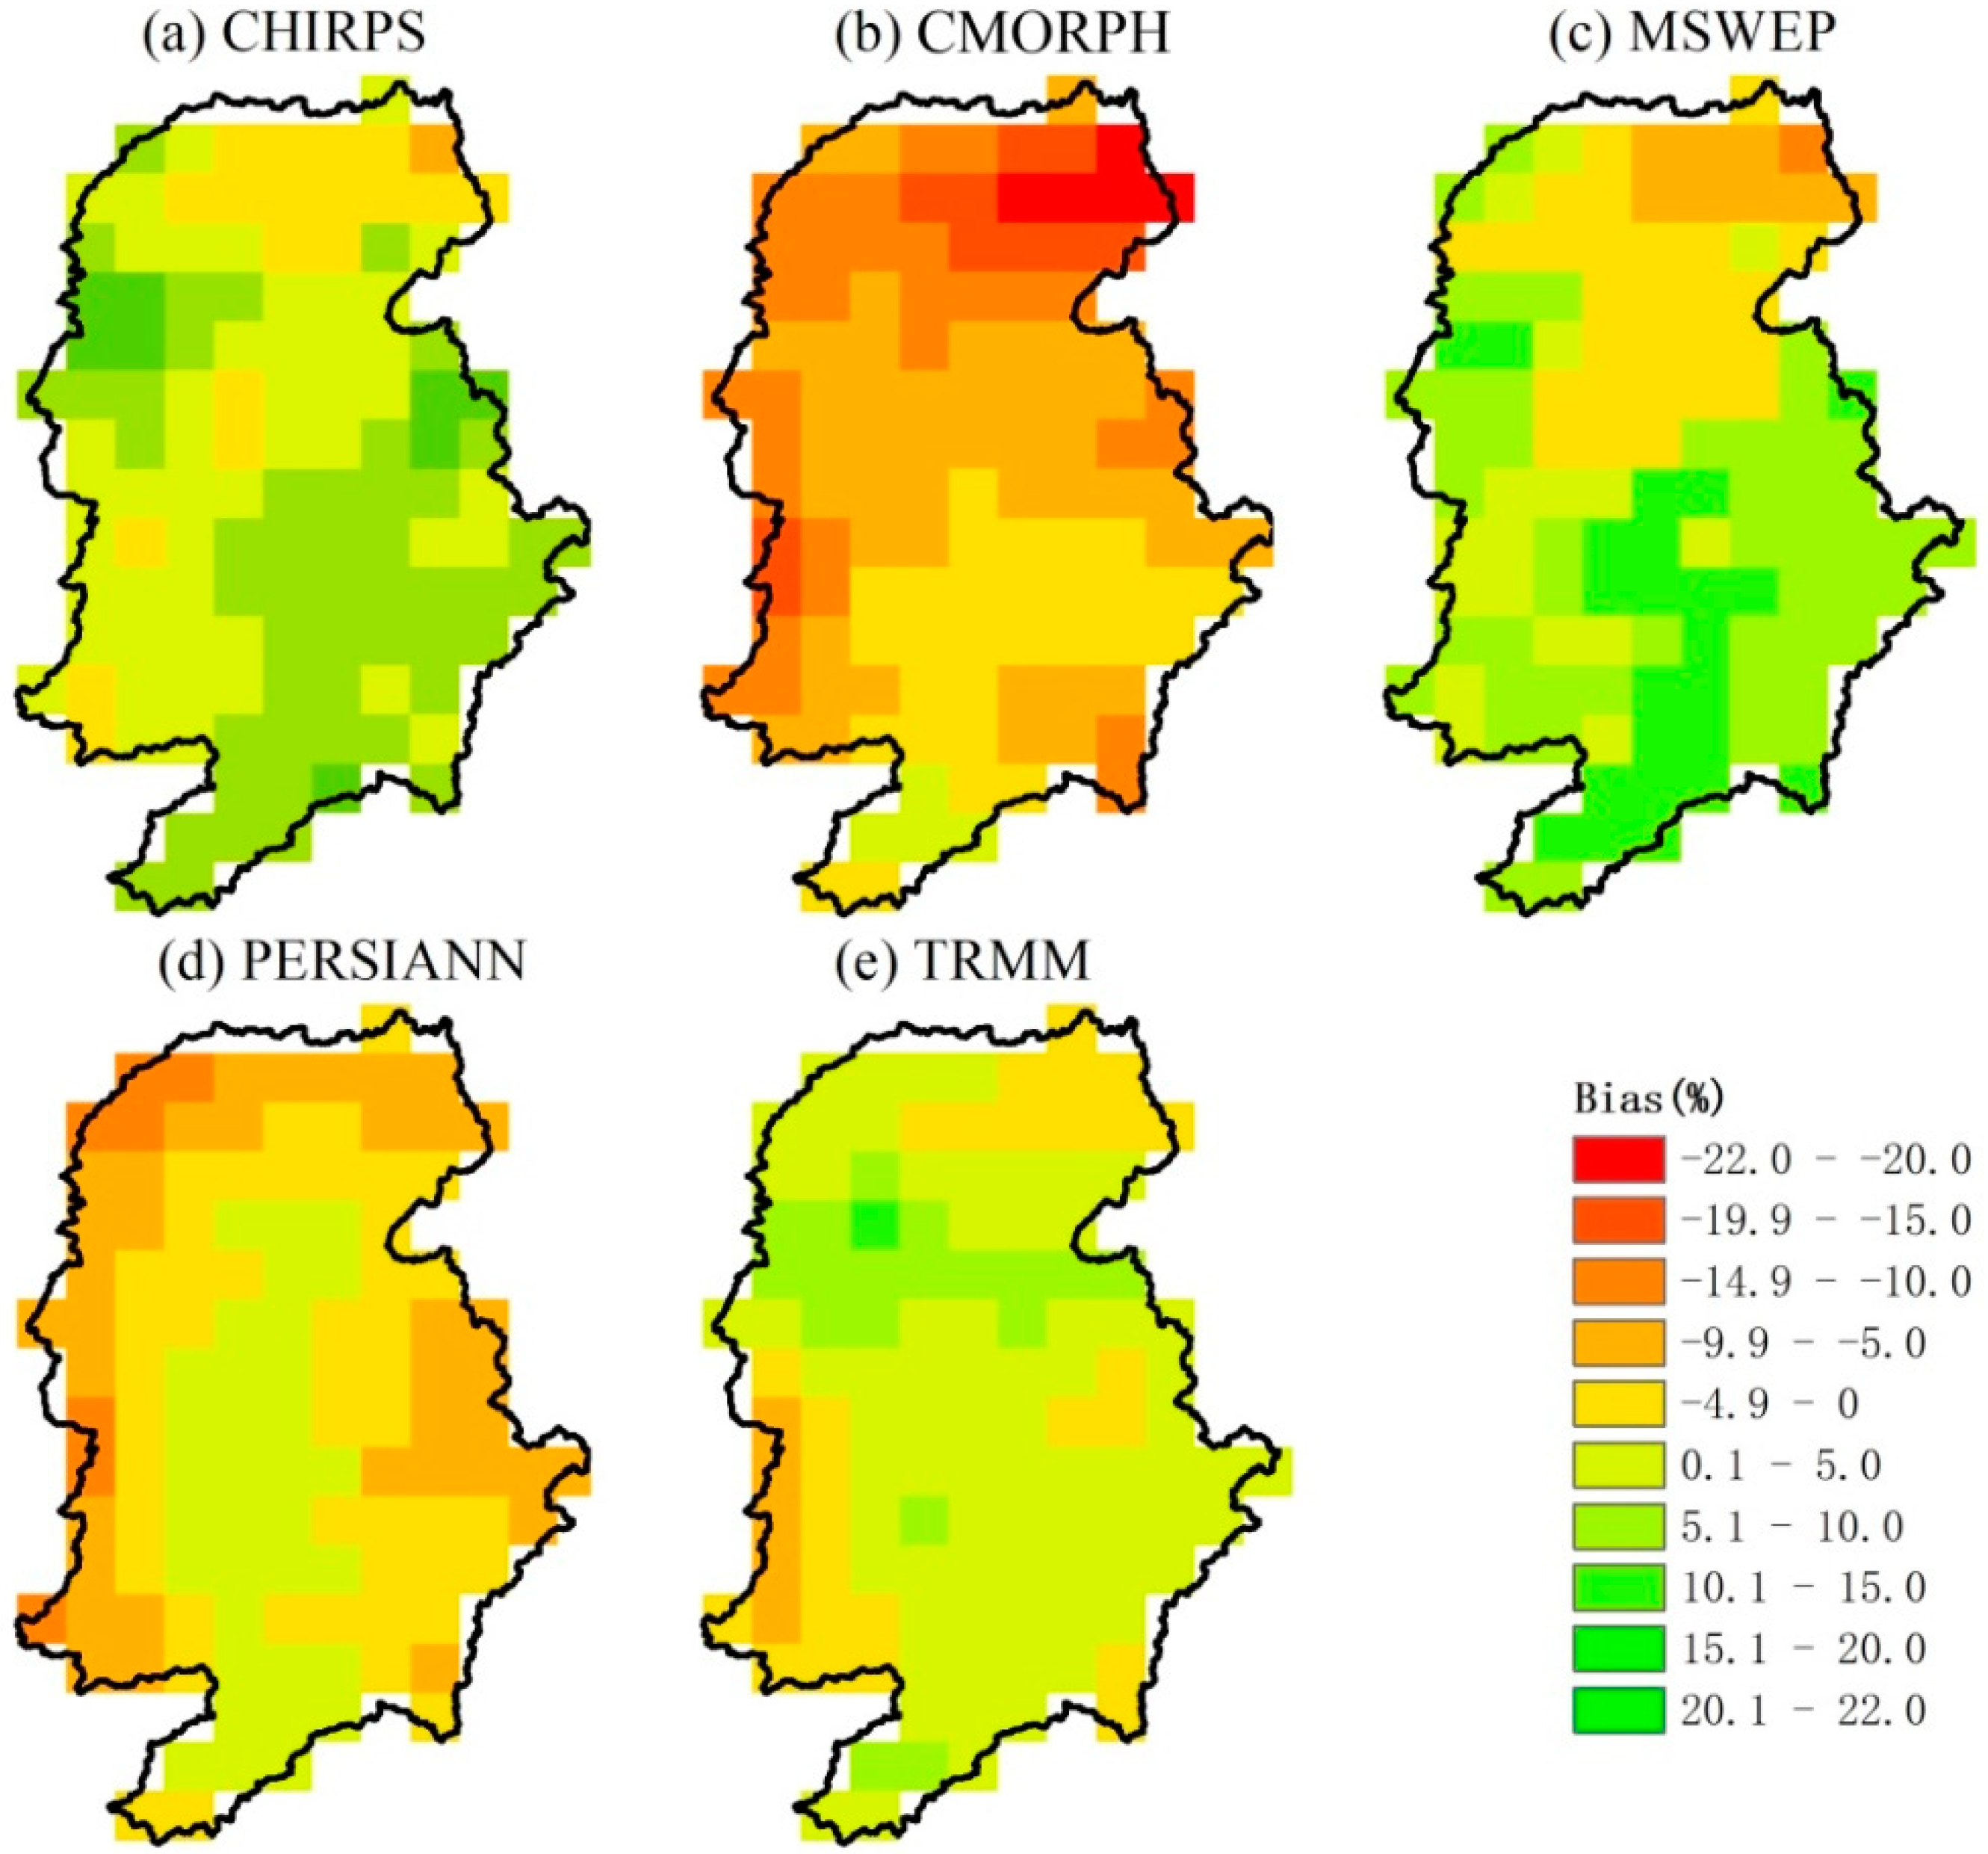
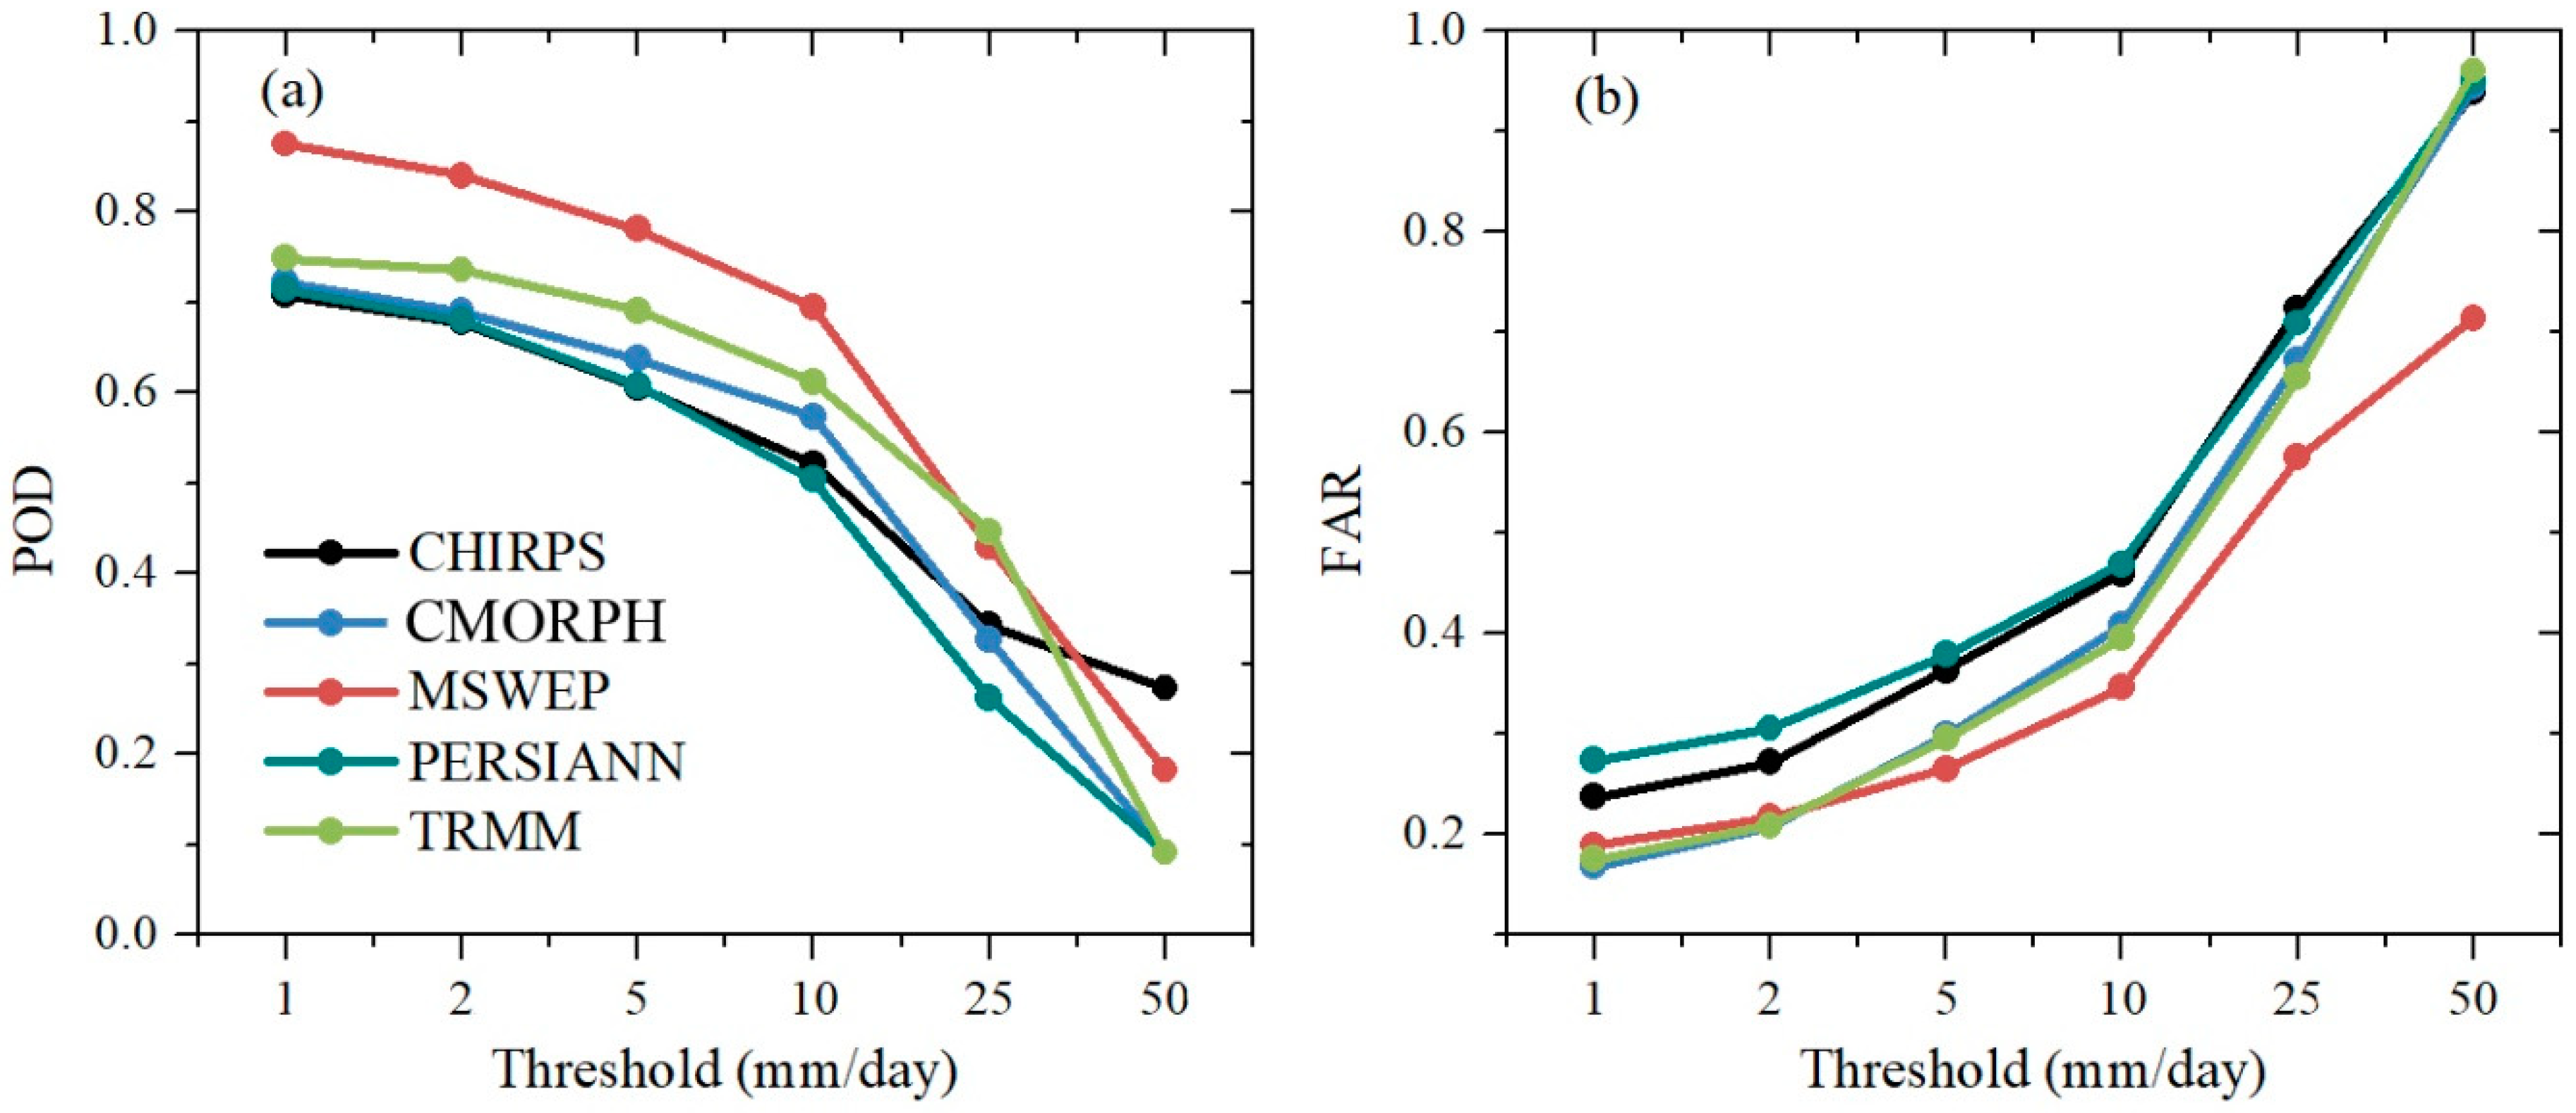
3.1. Comparisons of Satellite-Based Precipitation Products

Given that the study area has a dense network of rain gauges, the gauged precipitation data are used as the reference to evaluate the five satellite-based precipitation products. Figure 2 shows the spatial distributions of the mean daily precipitation estimates from the five satellite-based precipitation products and gauged values averaged from 1998 to 2012. Overall, the spatial distributions of the six precipitation datasets are consistent with each other: the high values appear in the south of the basin and the low values appear in the north of the basin. The basin-average daily precipitation estimates are 4.58, 4.80, 4.19, 4.82, 4.35 and 4.66 mm/day for the gauged observation, CHIRPS, CMORPH, MSWEP, PERSIANN and TRMM products, respectively. The correlation coefficient between the gauged precipitation and satellite-based products ranges from 0.58 to 0.82, the standard deviation ranges from 7.8 to 9.9, and the RMSD ranges from 0.52 to 0.83 mm/day (Figure 3). Overall, MSWEP product performs best among the five satellite-based products, which achieves the largest correlation coefficient and the lowest RMSD.
Furthermore, compared with the gauged precipitation, CHIRPS, MSWEP and TRMM products tend to overestimate precipitation, while CMORPH and PERSIANN products show a systematically underestimate (Figure 4). To evaluate the ability of the five satellite-based precipitation products in depicting light and heavy precipitation events, FAR and POD are calculated at precipitation thresholds of 1, 2, 5, 10, 25 and 50 mm/day, respectively. As shown in Figure 5, the estimates of the light precipitation events perform better than the heavy precipitation events. MSWEP product performs best in the prediction of light and heavy precipitation events among the five satellite-based precipitation products.

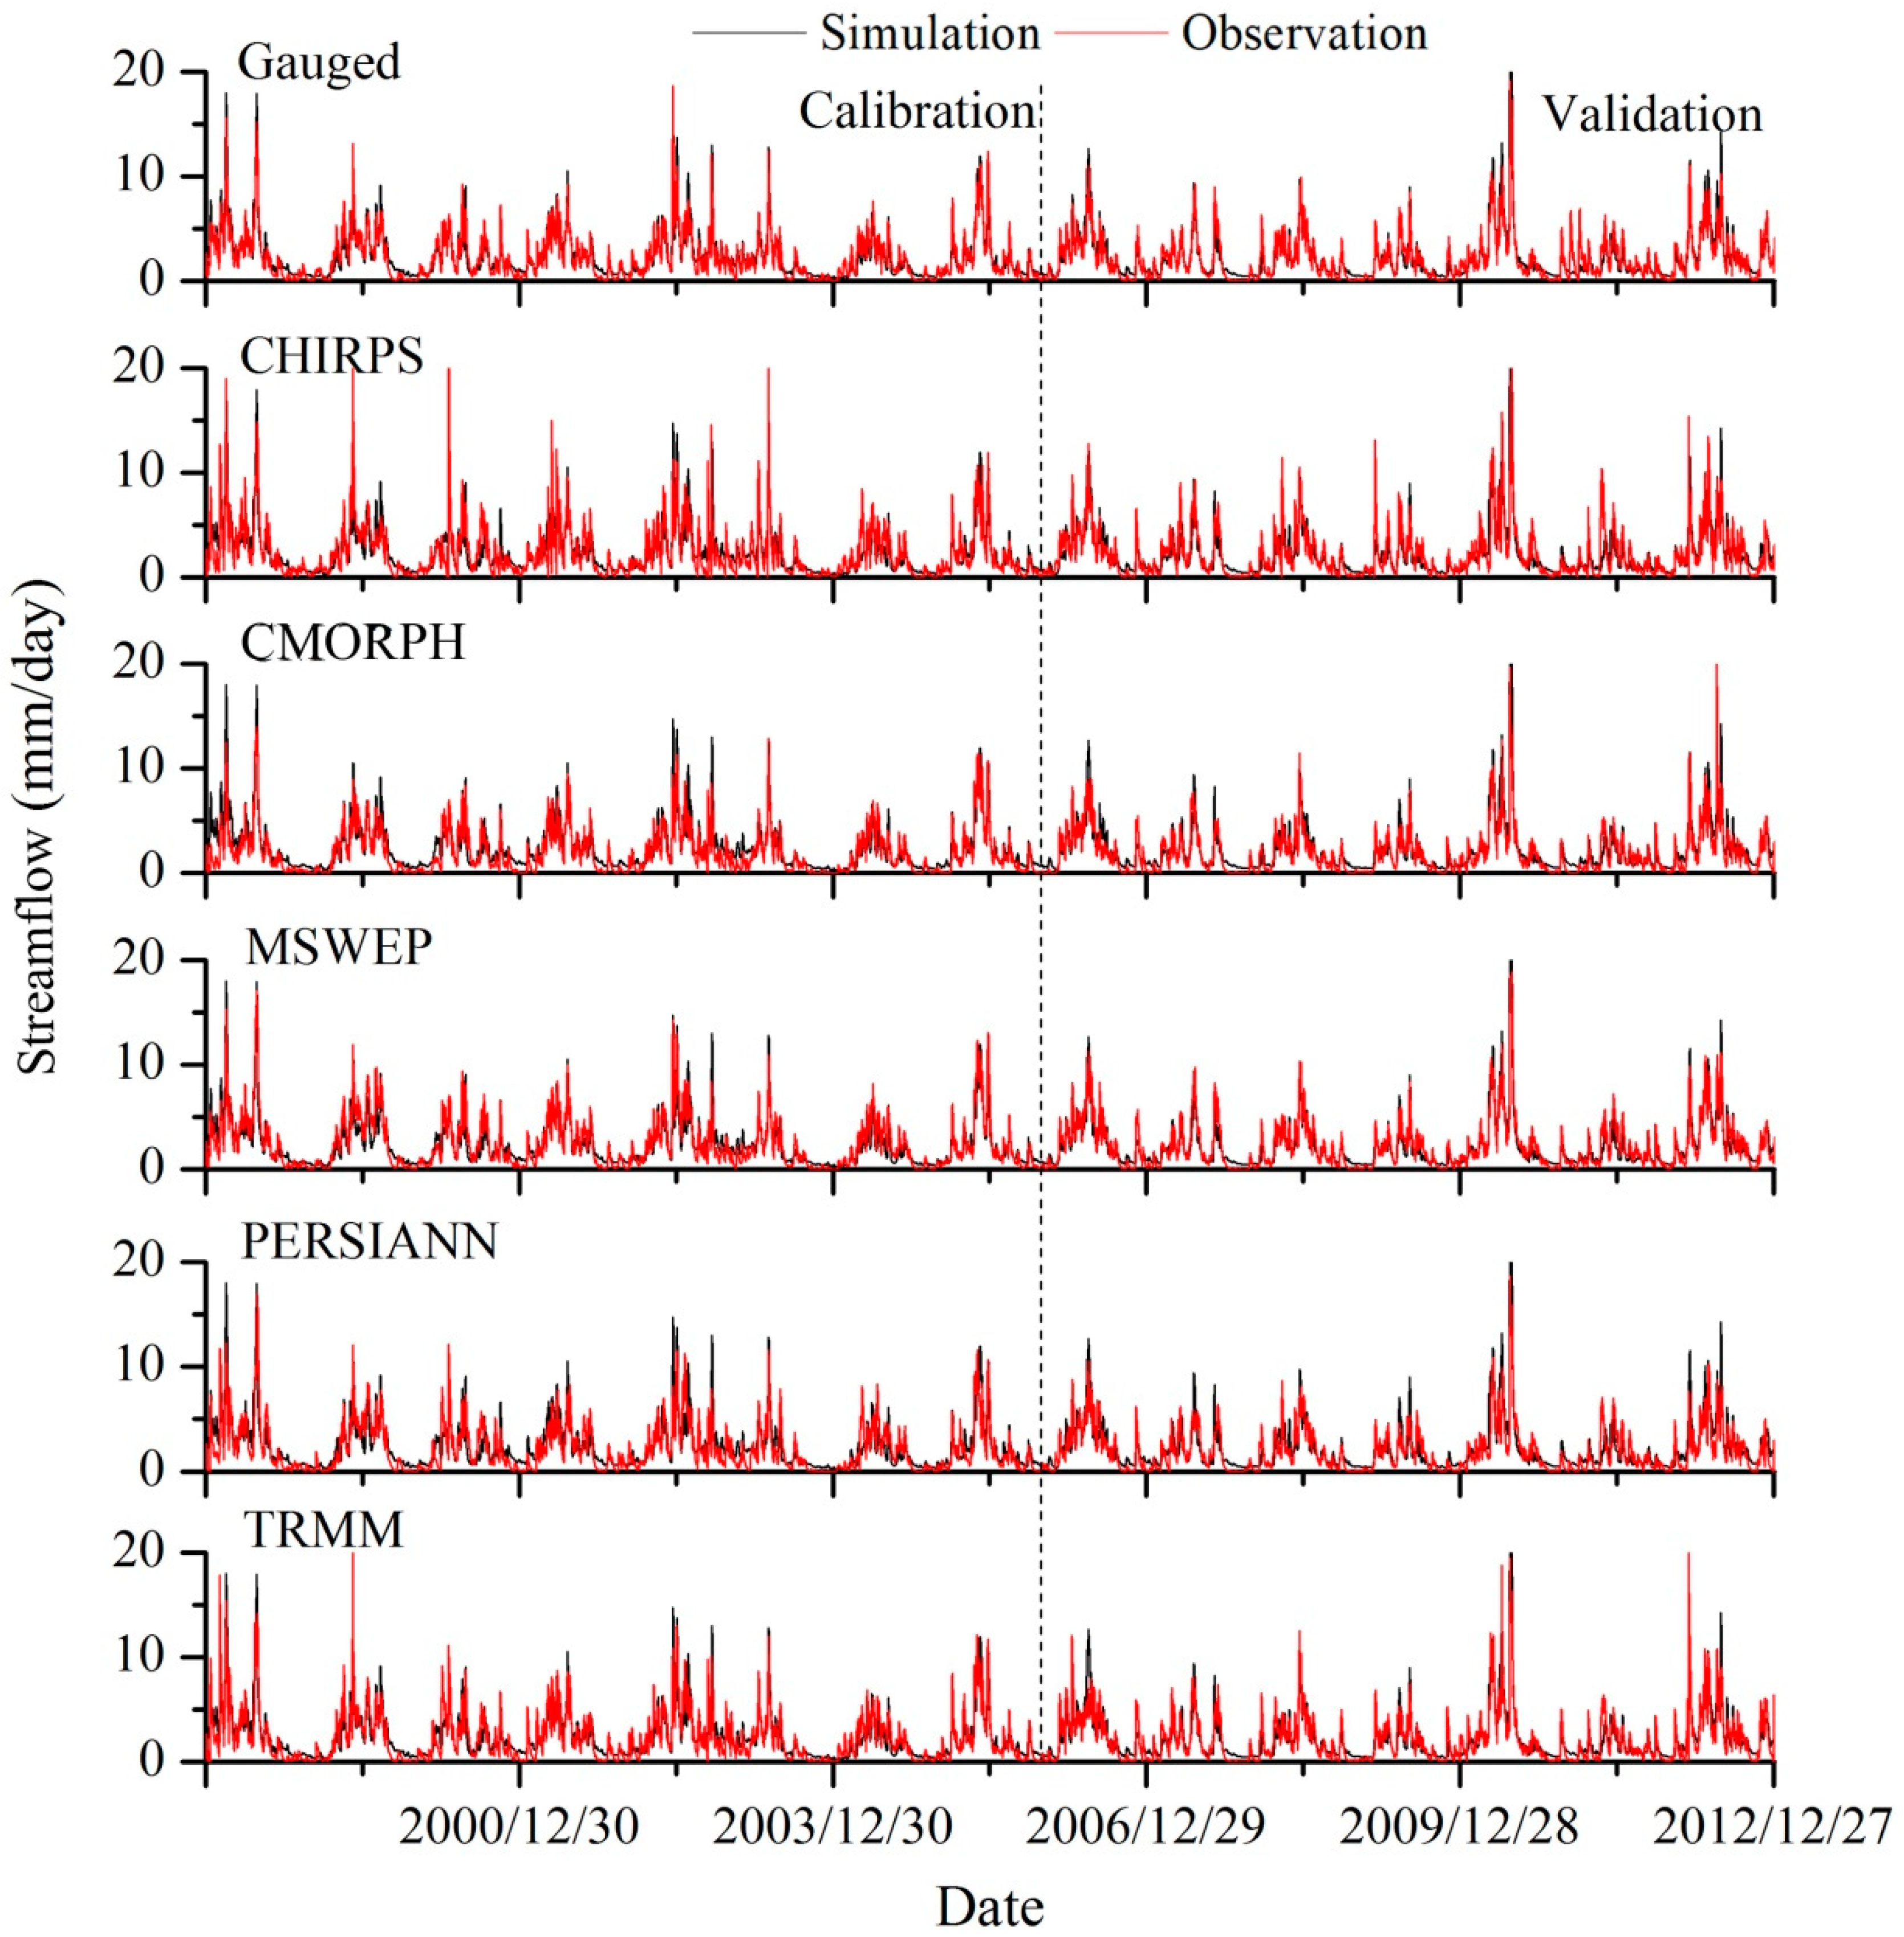
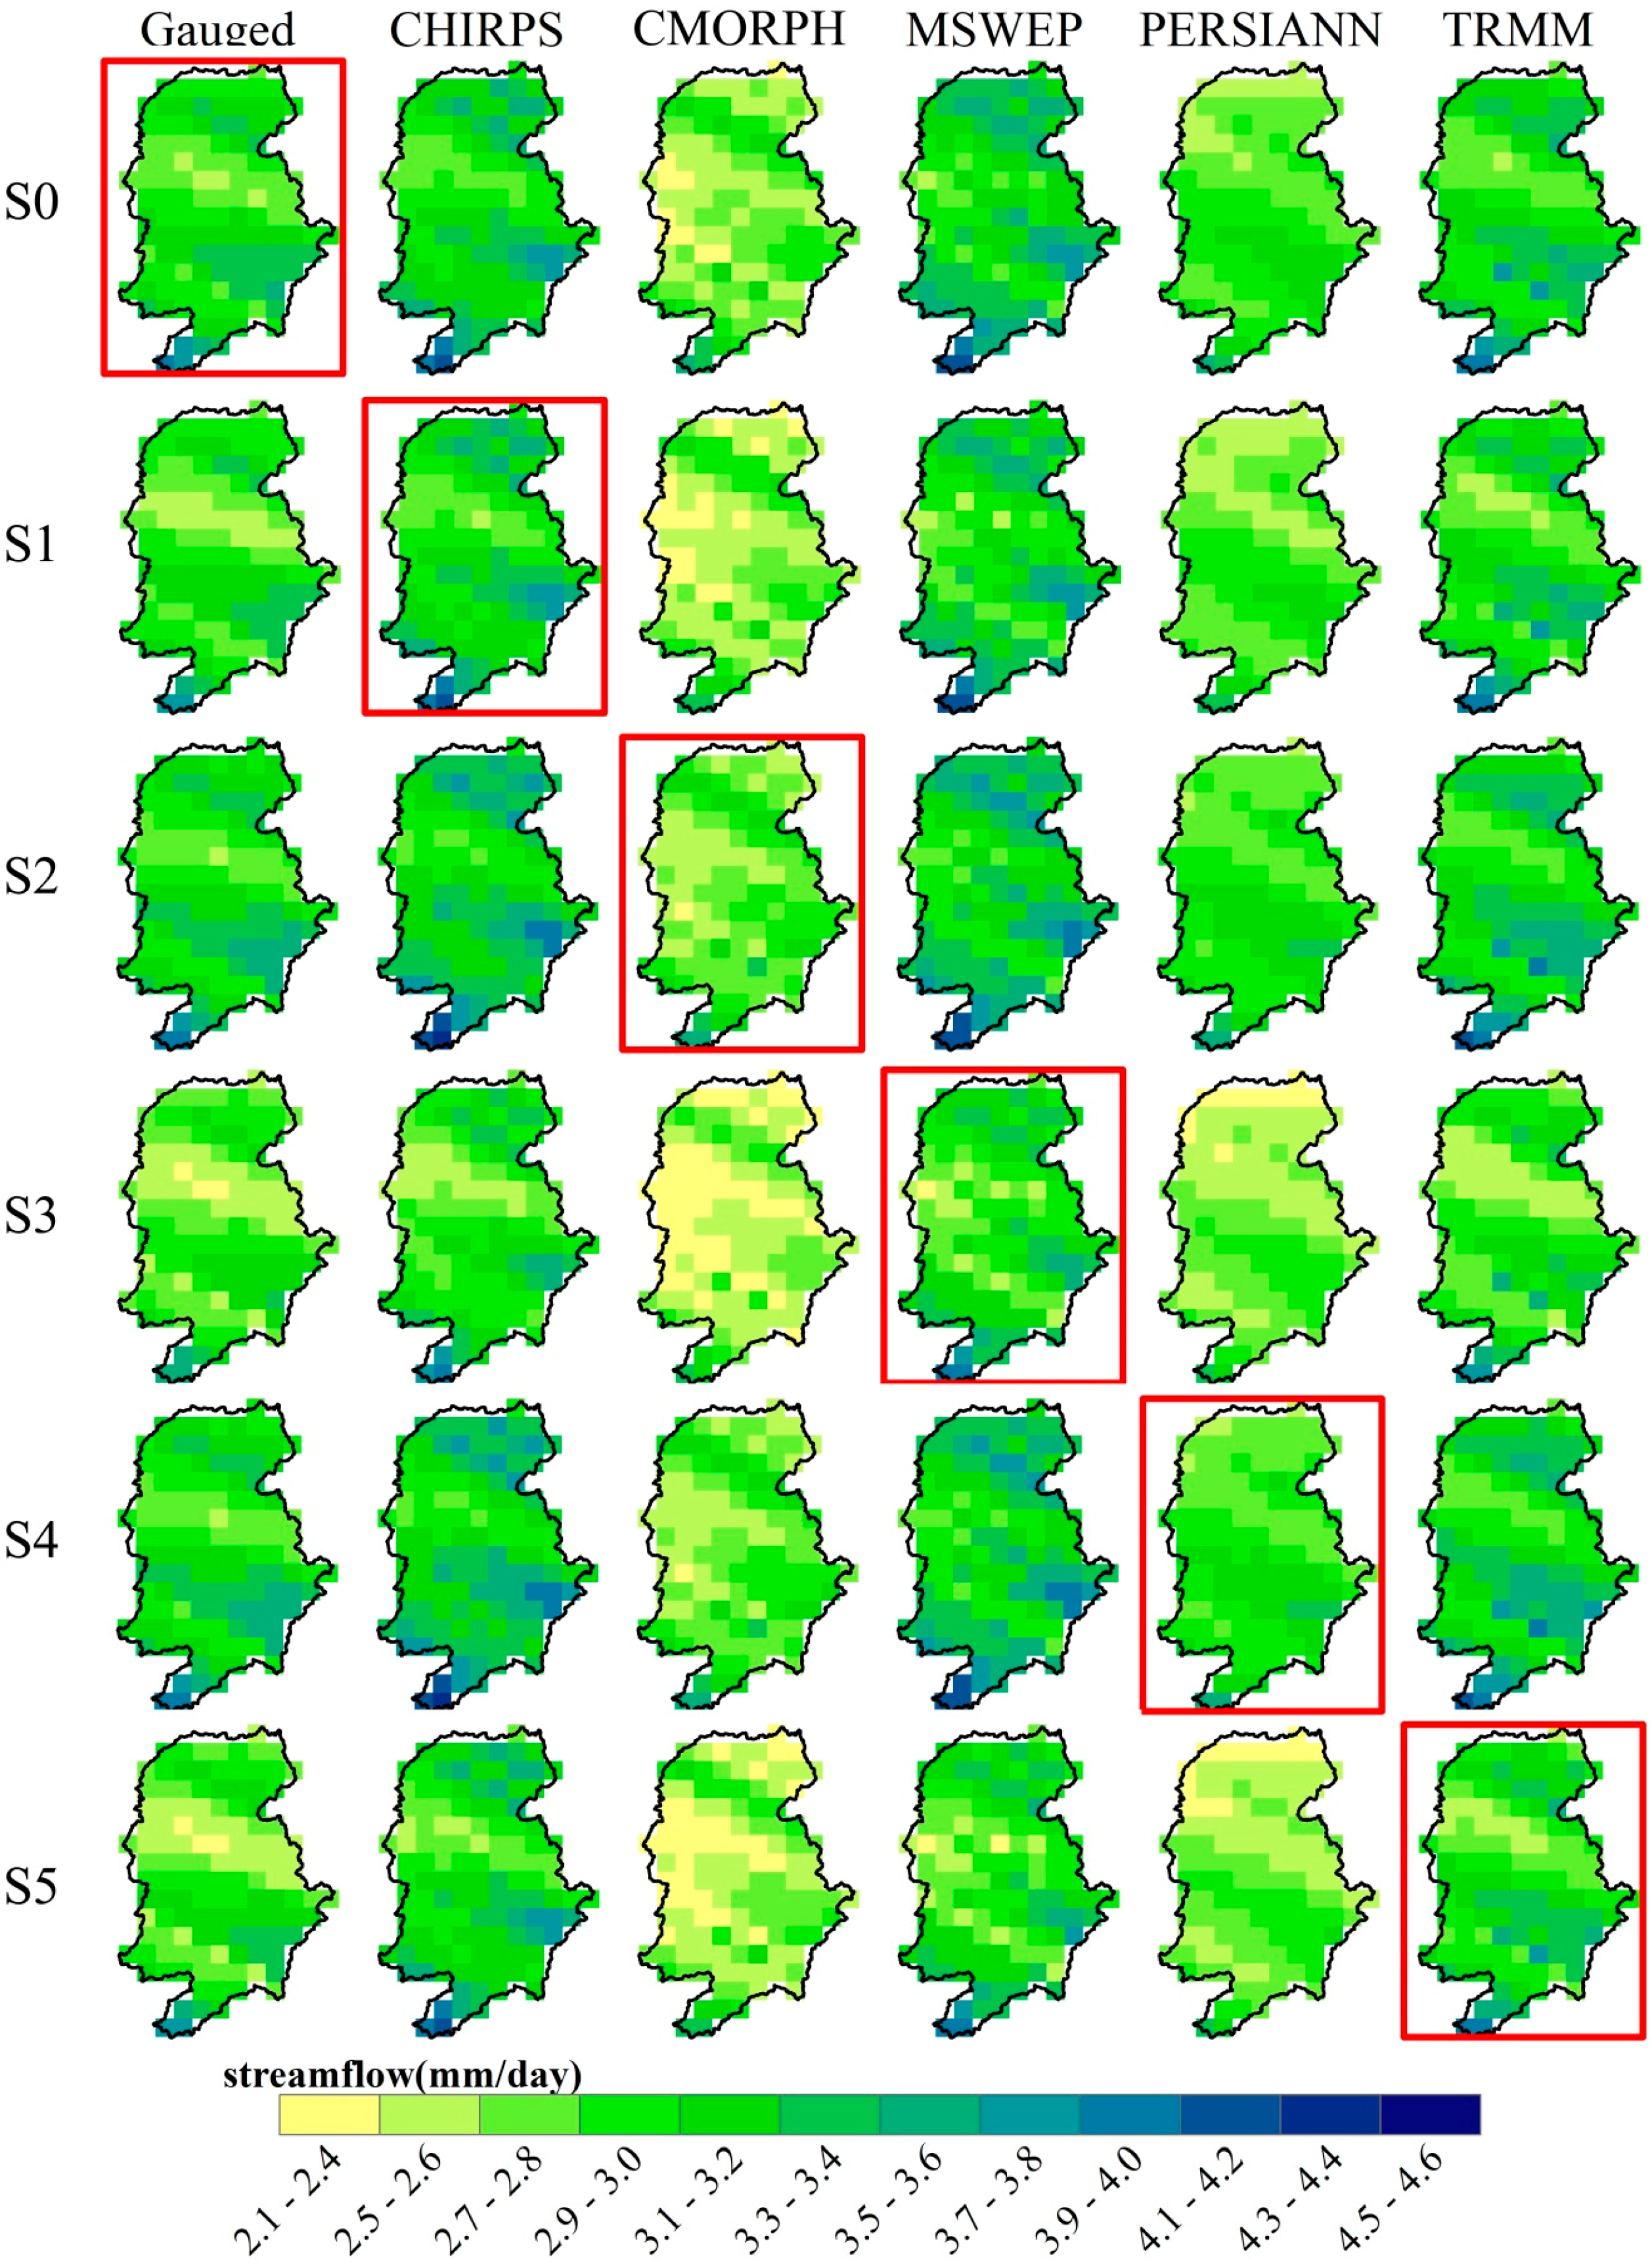
3.2. Assessment of Streamflow Simulation Forced by Satellite-Based Products

Figure 6 shows streamflow simulations forced by the five satellite-based precipitation products and gauged precipitation under S0, where the gauged precipitation is used to calibrate the model parameters. The RB and KGE values are 5% and 0.92 for the calibration period, and the values are 1% and 0.90 for the validation period (Table 4). The results indicate the HIMS model performs well in streamflow simulations using the gauged precipitation as forcing. Keeping the model parameters unchanged, the hydrological model is driven by the five satellite-based products individually. During the calibration period, the KGE driving by the five satellite-based precipitation ranges from 0.79 to 0.86, and the RB ranges from −2% to 16%. During the validation period, the KGE driving by the five satellite-based precipitation ranges from 0.80 to 0.91, and the RB ranges from −4% to 11%. Generally, the streamflow simulations driving by the MSWEP product performs best among the five satellite-based precipitation products. Figure 7 shows that the spatial pattern of streamflow simulation is consistent with its corresponding precipitation pattern, which indicates that the streamflow simulation is dominated by the corresponding precipitation in the study area.
To better test the hydrological utility of the satellite-based precipitation products in streamflow simulations, Table 4 and Figure 5 also shows the performance of simulated streamflow under S1–S5. Similar to S0, the MSWEP performs best in streamflow simulations among the satellite-based precipitation products under S1. In the validation period, the KGE values using the parameter sets calibrated by each of the five satellite products are 0.81 (CHIRPS), 0.82 (CMORPH), 0.91 (MSWEP), 0.80 (PERSIANN) and 0.86 (TRMM), respectively. Therefore, we recommend the MSWEP as the preferred choice for streamflow simulation among the five satellite-based precipitation products in the study area.

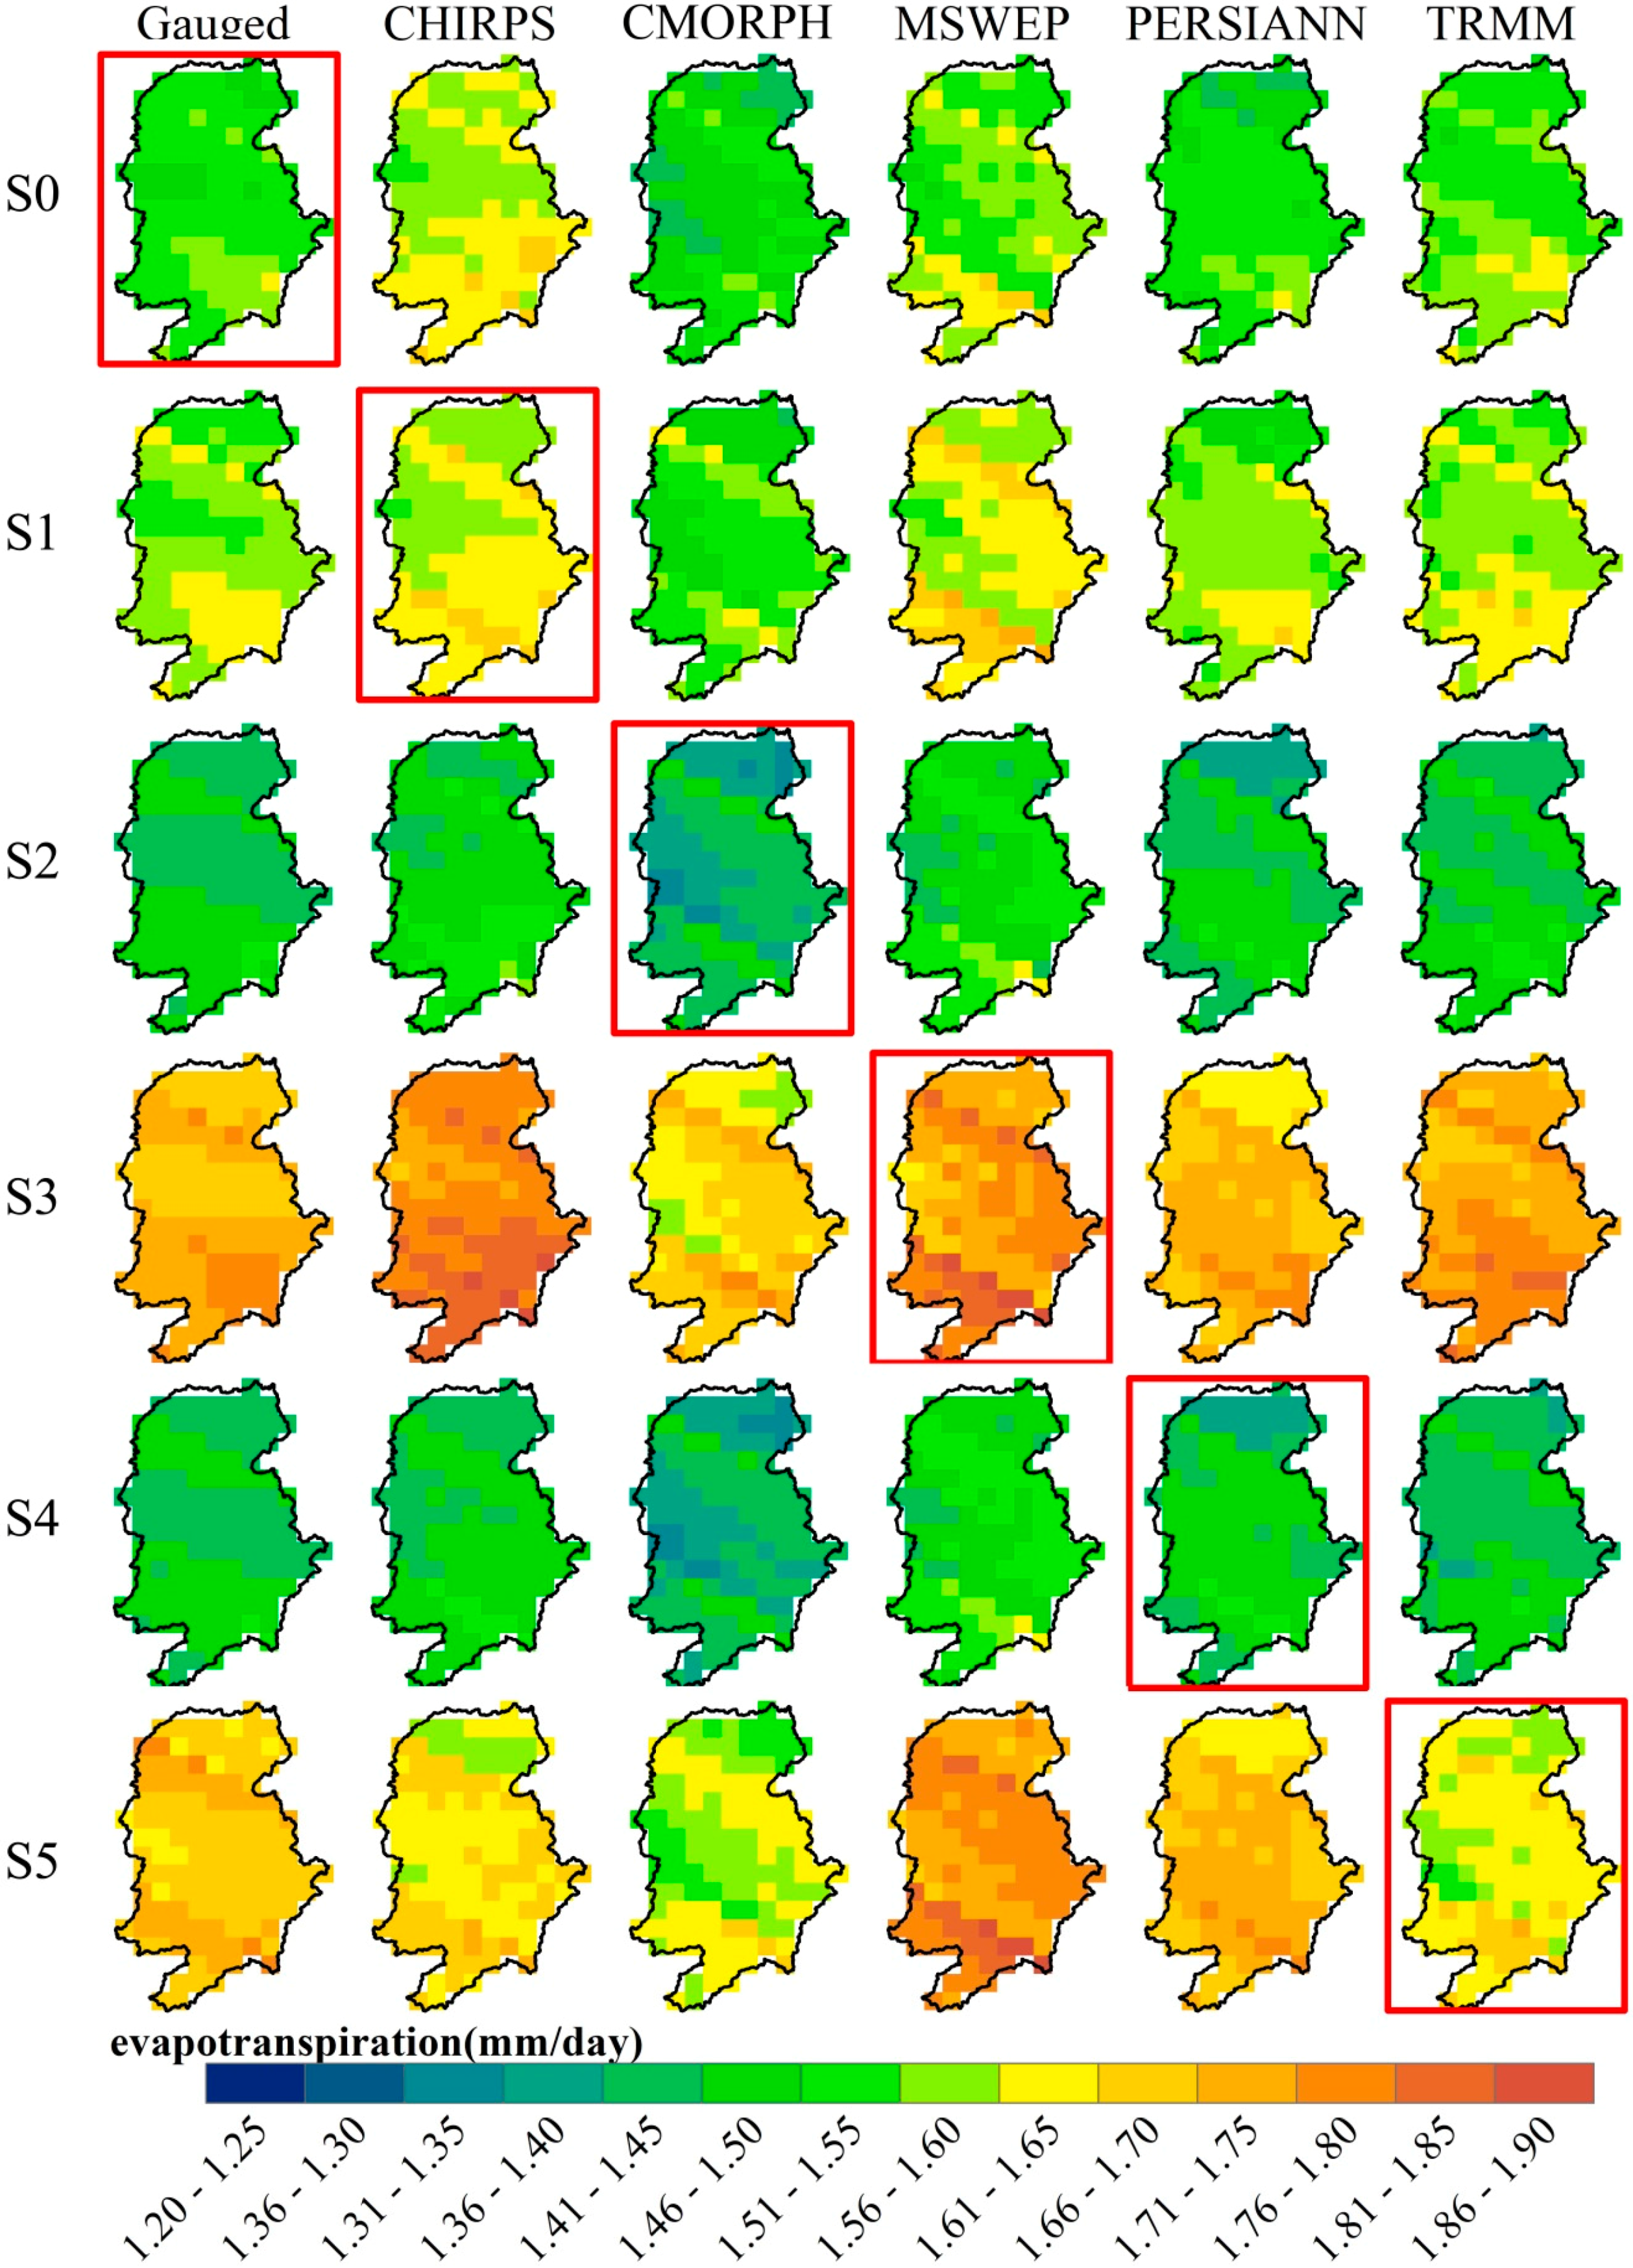
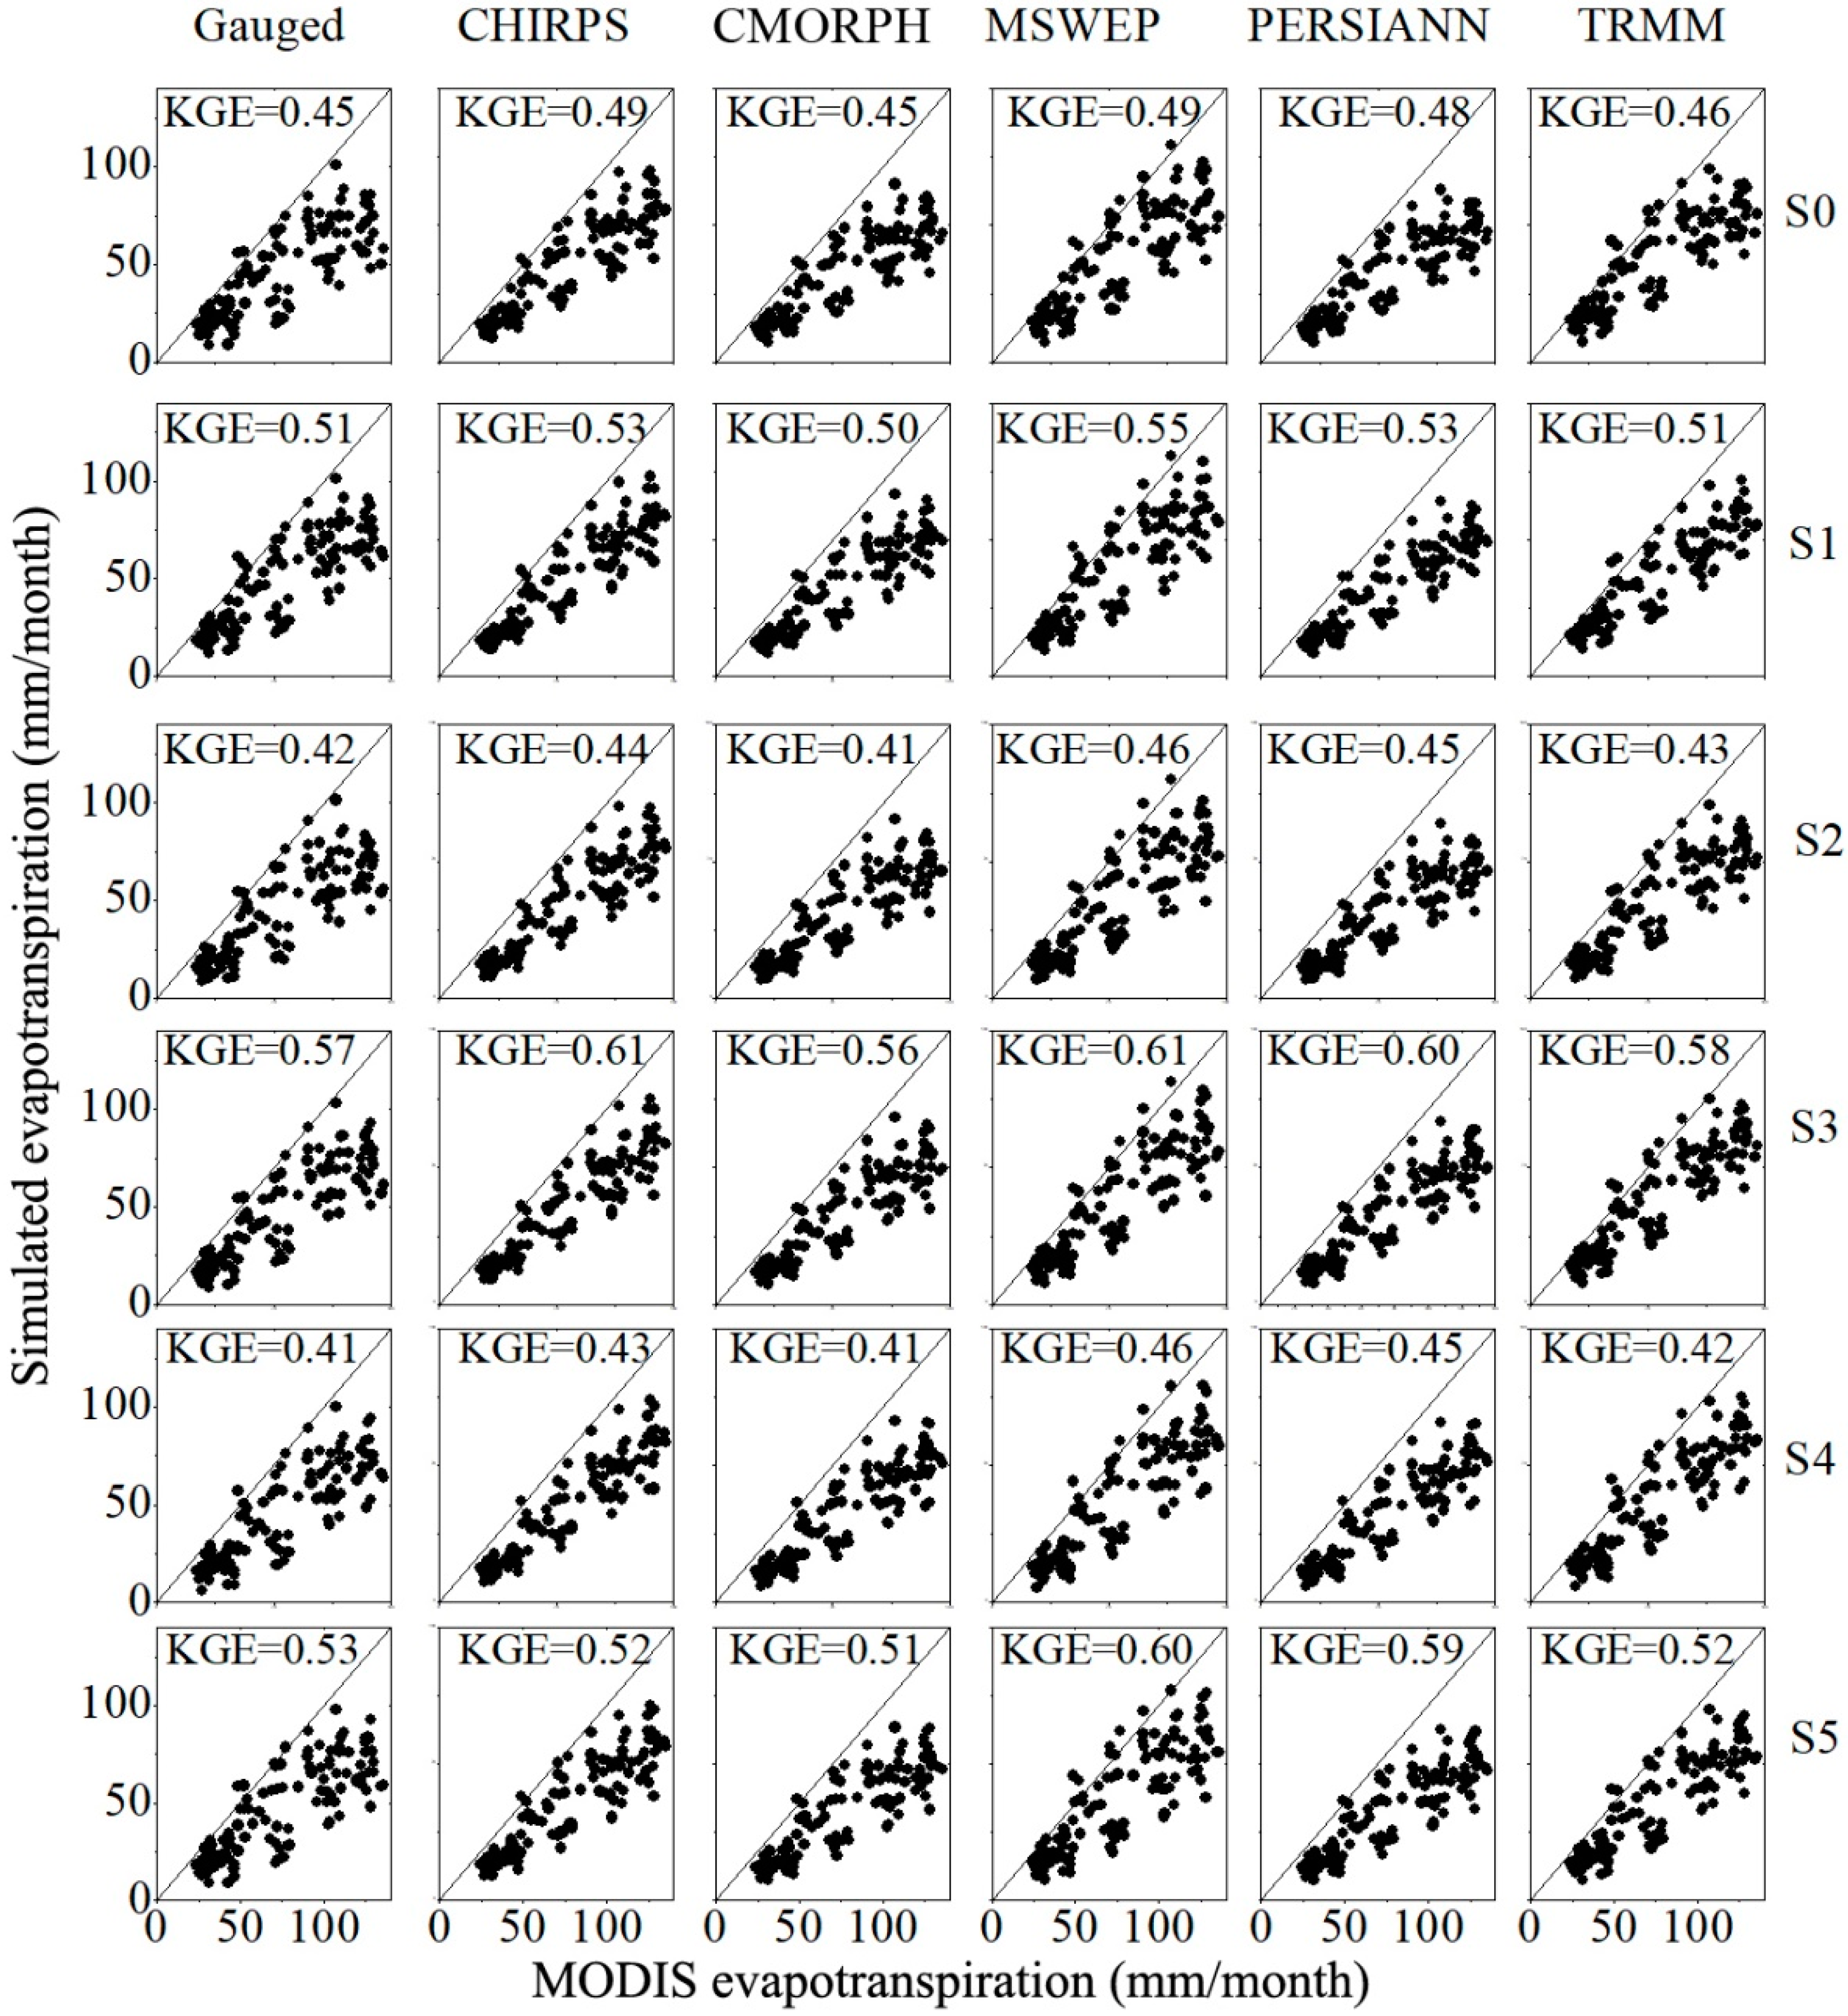
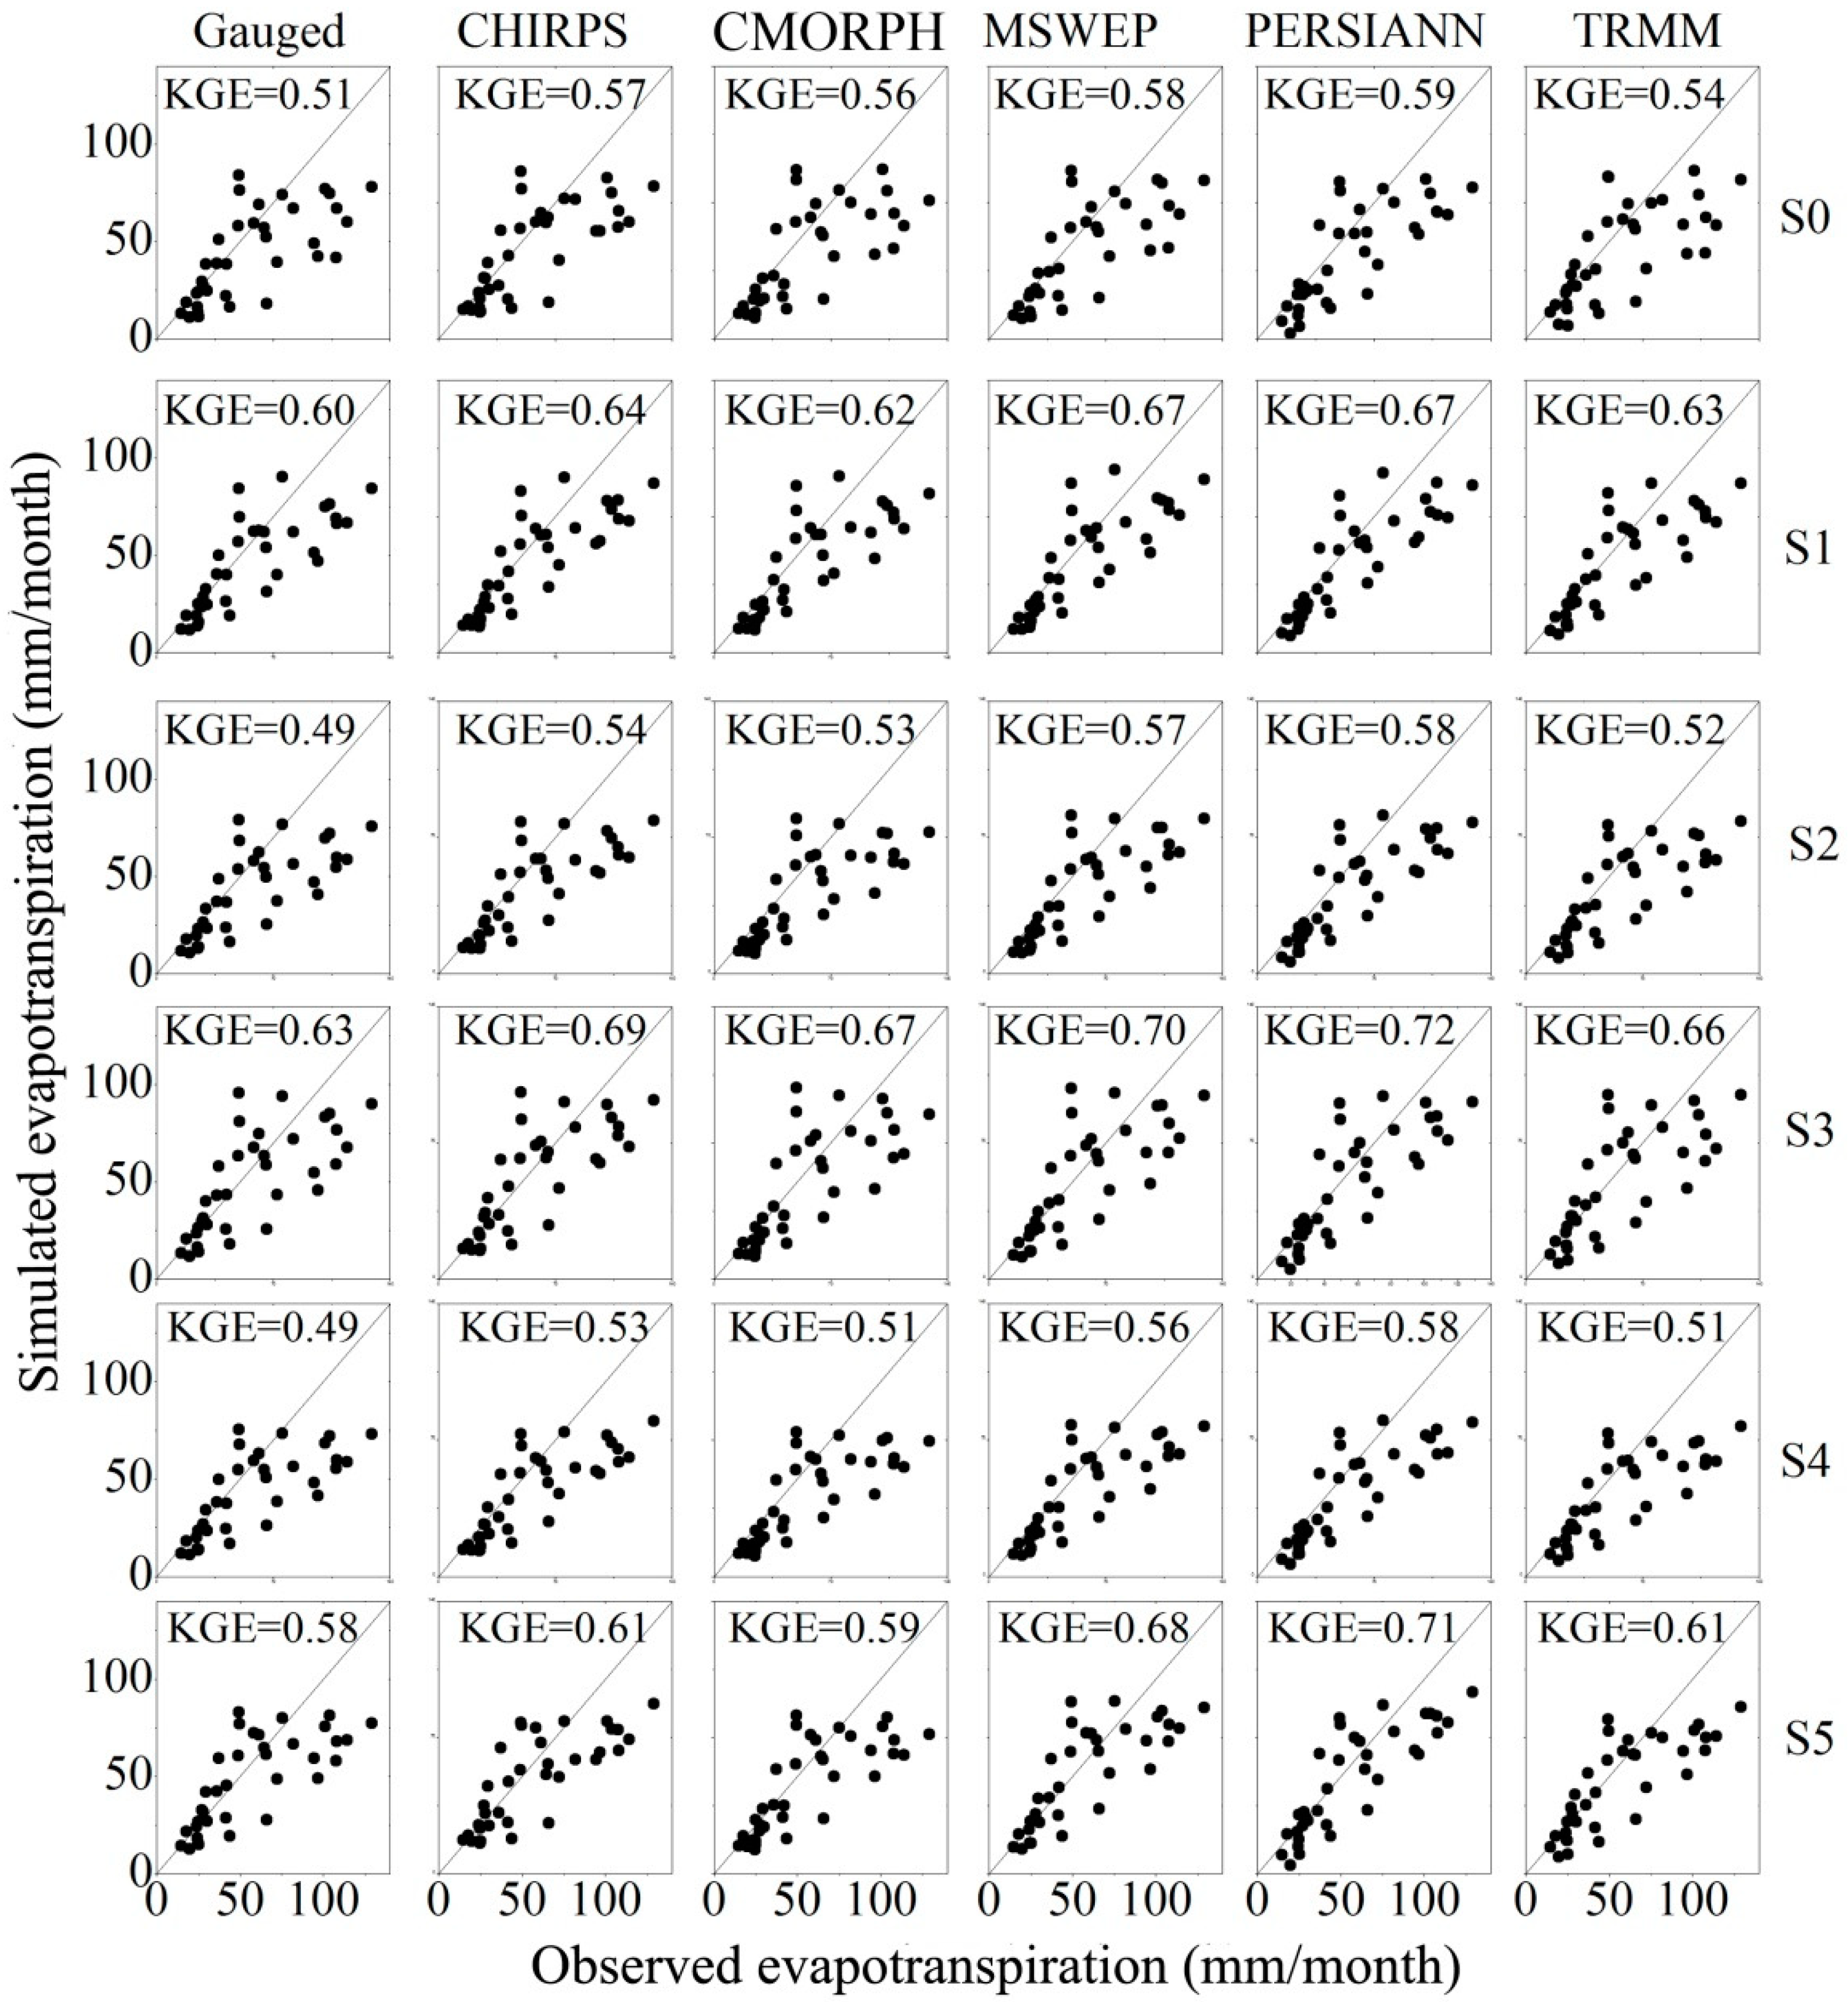
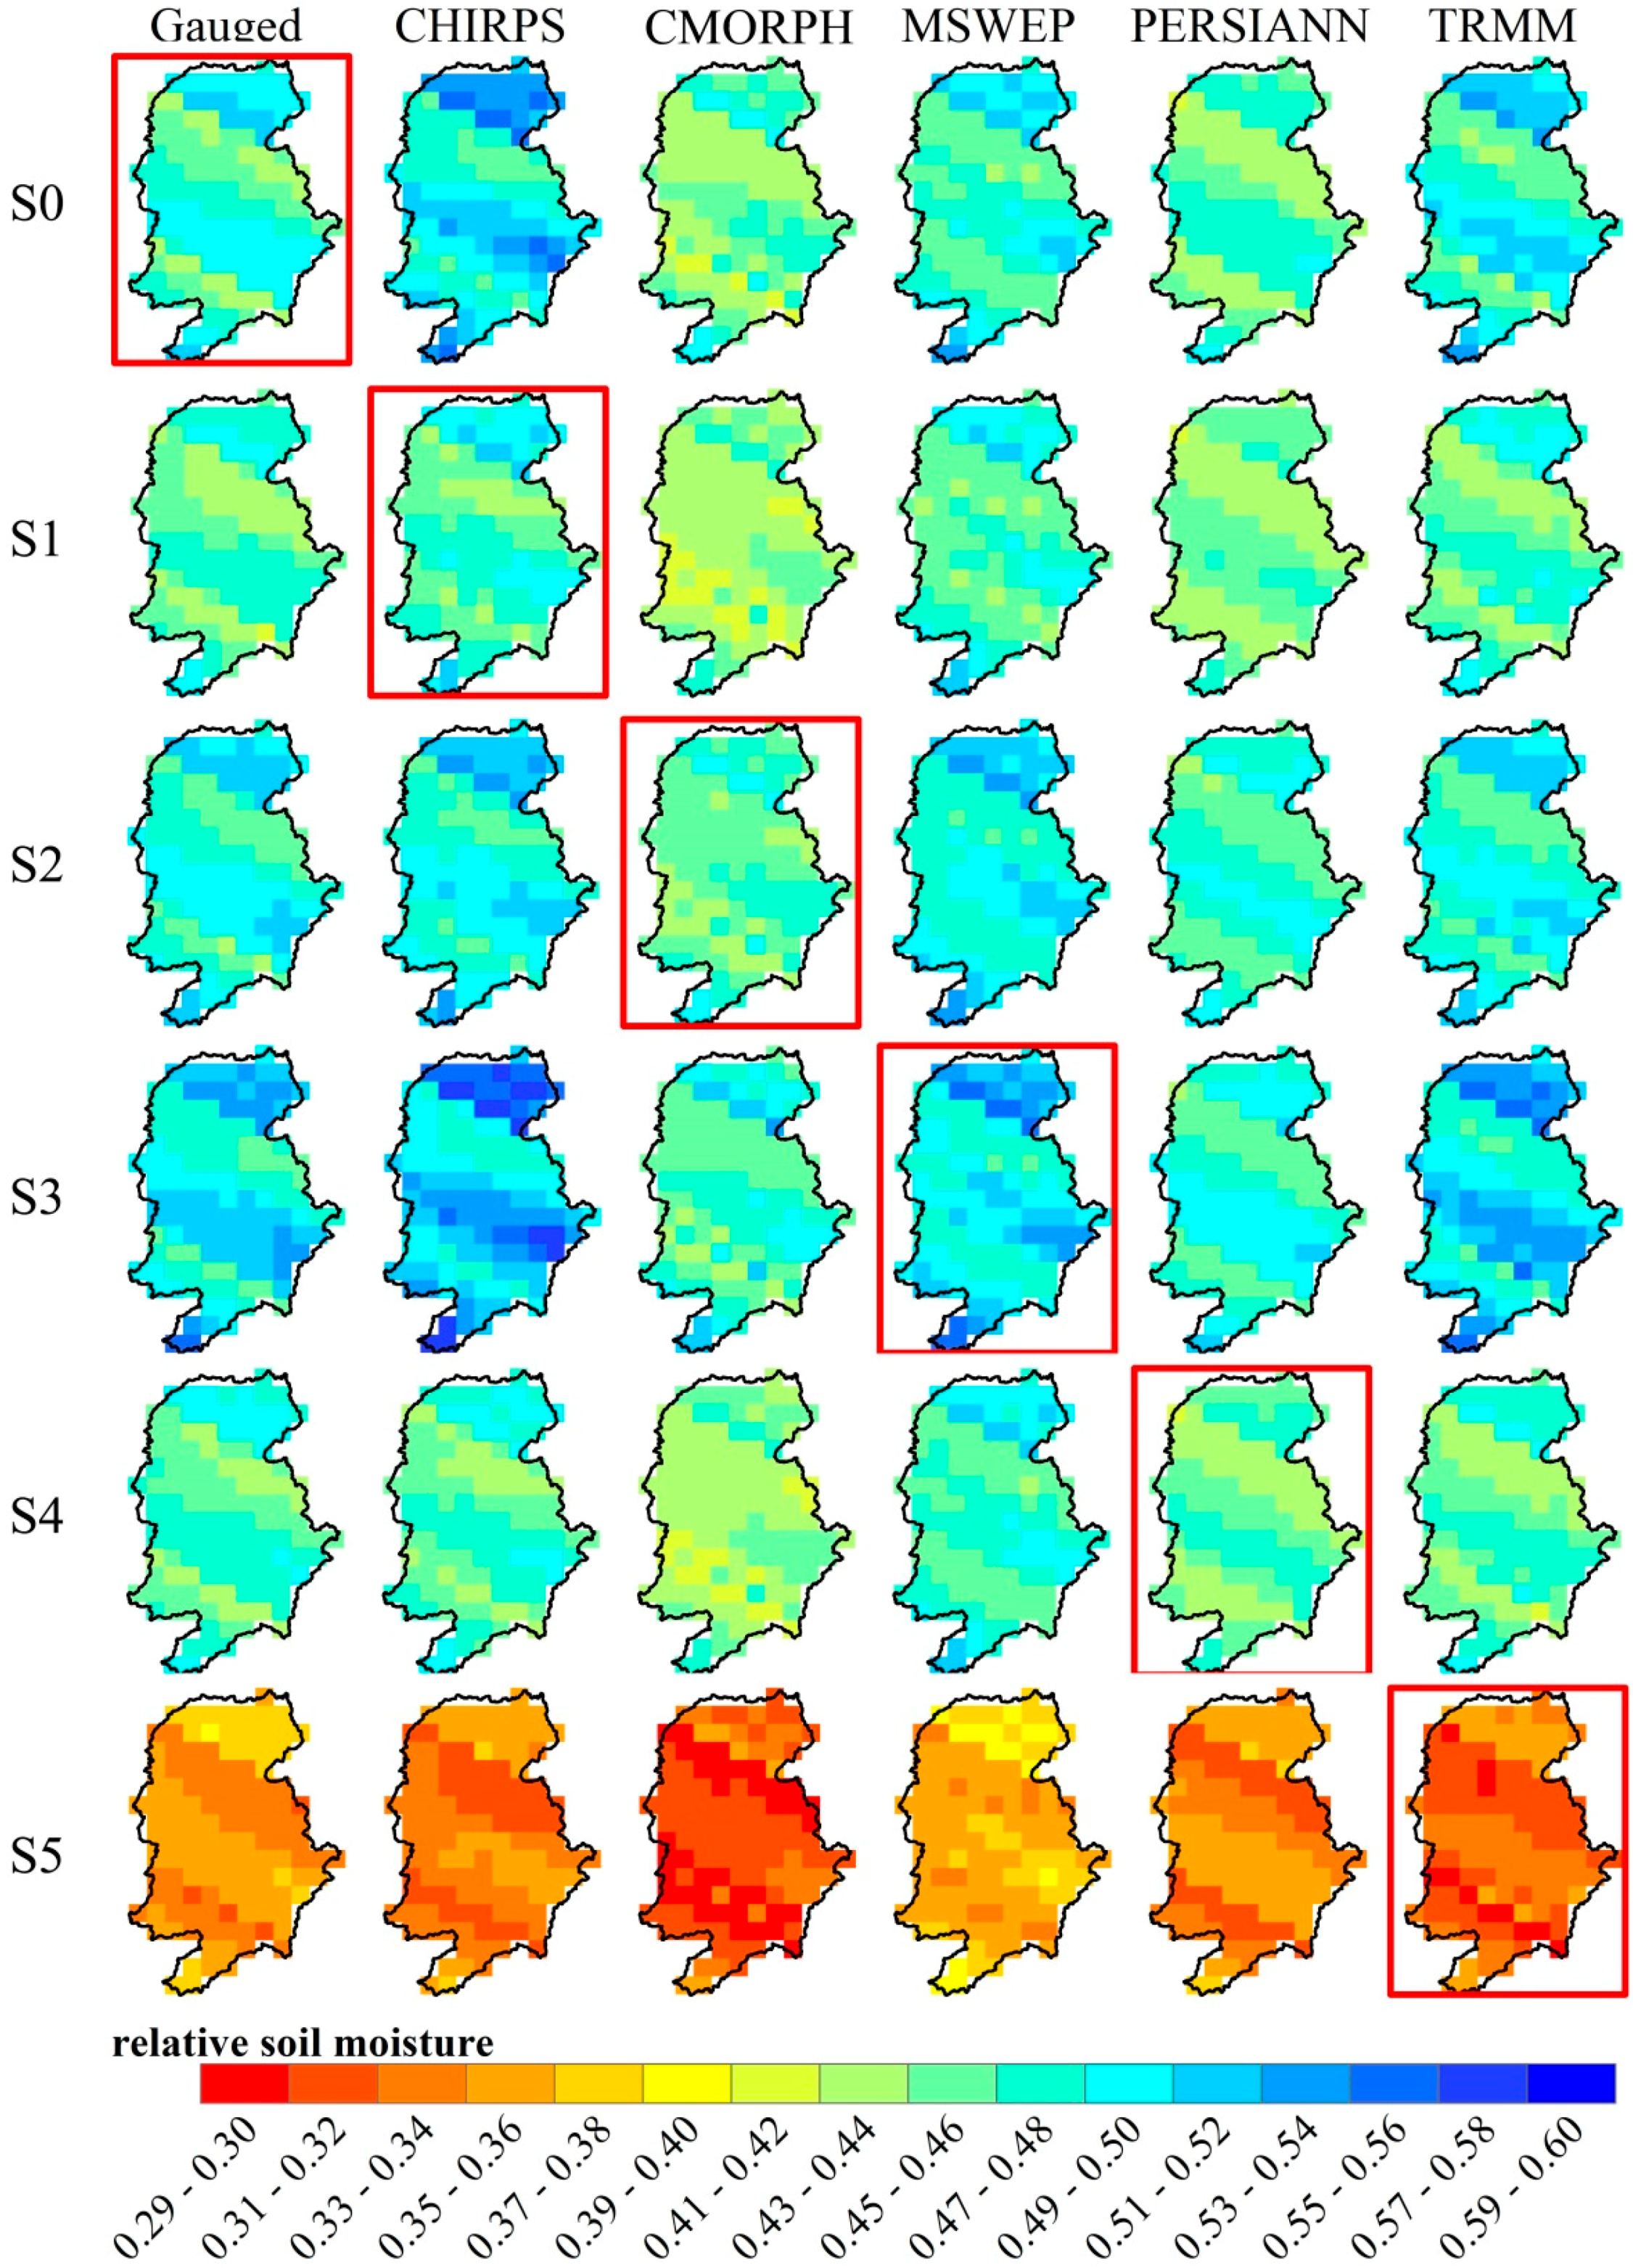
3.3. Evaluation of Evapotranspiration and Soil Moisture Simulations Driving by Satellite-Based Products

Figure 8 shows the spatial distributions of the simulated evapotranspiration by the five satellite-based products and gauged precipitation under S0–S5. The spatial patterns of evapotranspiration simulations are dominated by calibration scenarios rather than the input of precipitation. This means that the parameters of the hydrological model exert the larger influence than precipitation on the spatial distribution of evapotranspiration. To validate the accuracy of the simulations, the simulated evapotranspiration is compared with the MODIS evapotranspiration at the basin scale and observed evapotranspiration at the point scale. Figure 9 shows the relationship between the simulated evapotranspiration and the MODIS evapotranspiration averaged from the whole basin. The KGE under the six scenarios ranges from 0.41 to 0.61, and the evapotranspiration simulation under S3 performs best (driving by MSWEP precipitation). Furthermore, the KGE ranges from 0.49 to 0.72 between the simulated evapotranspiration and the observed values at the point scale (Figure 10). These results indicate the performance of simulated evapotranspiration forced by satellite-based precipitation products are acceptable.
Figure 11 shows the spatial distributions of the relative soil moisture (the ratio of soil moisture content to saturated soil moisture content) in the Ganjiang Basin derived by different precipitation inputs. Noting that the simulations of the relative soil moisture under all scenarios derived by different precipitation inputs are similar, except under S5. Similar to the evapotranspiration simulations, the calibration scenario seems to have a larger influence on the spatial pattern of soil moisture than precipitation. Figure 12 shows the relationships between the observed SMC and simulated SMC under the six scenarios, which manifests that all precipitation products are unable to efficiently reproduce the soil moisture observations via hydrological modeling, with the KGE values less than zero for all cases (Figure 12).

4. Discussion

This study investigates five popular satellite-based precipitation products and their performance in simulating hydrological components in the Ganjiang Basin. The results indicate that the MSWEP product performs best in precipitation depicting among the employed satellite-based precipitation products. Beck et al. [16] undertook a comprehensive evaluation of 22 gridded (quasi-) global (sub-) daily precipitation datasets and found that the MSWEP product emphasizing careful data merging can exploit the complementary strengths of gauge-, satellite-, and reanalysis-based precipitation estimates. It should be noted the satellite-based precipitation and gauged precipitation are not totally independent, because the gauged precipitation has been employed for the generation of MSWEP [42] and/or CHIRPS [40]. In addition, the simulation of streamflow forced by satellite-based products performs better than the simulations of evapotranspiration and soil moisture. This is because that: (1) The streamflow is used to calibrate the parameters of the hydrological model, and (2) the relationship between precipitation and streamflow is good in humid regions. It should be noted that although the precipitation inputs of the hydrological model are different, the patterns of simulated streamflow are similar. This is because the differences in precipitation inputs are offset by the parameter calibration of the hydrological model [31].
The simulation of soil moisture is not satisfied in the Ganjiang Basin, which is probably because the hydrological model unrealistically represents the complex interactions between soil moisture and land-atmosphere processes. The improvement of soil moisture simulation requires the model including a more solid algorithm of soil water dynamics as employed by some state-of-the-art land surface models [51,52,53]. Moreover, the observed soil moisture is the soil water within a certain depth of the land surface, whereas the simulated soil moisture reflects the soil water in the entire soil layer. The two variables are not totally identical. In addition, the soil moisture reflects water storage at a certain point, but the spatial resolution of the simulation is 0.25° × 0.25°. The mismatch of spatial scales should also be considered in the application of satellite-based precipitation products [54,55,56].
Some studies have investigated the suitability of satellite-based precipitation products in hydrological modeling in the Ganjiang Basin in recent years [26,36,57,58,59]. For example, Li et al. [26] compared TRMM and PERSIANN products in the Ganjiang Basin, and found that TRMM and PERSIANN underestimated the precipitation amount. Tang et al. [57] quantitatively inter-compared the TRMM and Global Precipitation Measurement (GPM) level-3 products, and found that the GPM product can adequately substitute TRMM product in streamflow simulation in the Ganjiang Basin, even with its limited data available to date. The results of this study are generally consistent with the finding of previous investigations. Nevertheless, this study emphasizes the performance of water balance simulation forced by satellite-based precipitation products using multiple observations, which is an improvement of previous studies. In remote sensing-based hydrological modeling, we should not only concern on the satellite-based precipitation, but also should pay attention to the selection of the hydrological model [60]. Even if a satellite-based precipitation product doesn’t have high-accuracy, the hydrological simulation might be acceptable through the model parameters calibration. In contrary, the hydrological simulation might be poor through model parameters calibration forced by satellite-based precipitation when an improper model is chosen. The results of this study are beneficial for users to select the appropriate product(s) for their applications on water balance simulations.

5. Conclusions

This study investigated the suitability of five popular satellite-based precipitation products in water balance simulations in Ganjiang Basin during the period 1998-2012. The main results are concluded as follows:
  • The five satellite-based precipitation products have similar spatial patterns. Compared with the gauged precipitation, the CHIRPS, MSWEP and TRMM precipitation tend to overestimate precipitation, whereas CMORPH and PERSIANN show systematical underestimates.
  • The performance of the MSWEP precipitation in streamflow simulations is the best among the five satellite-based products based on a distributed hydrological model, in which the KGE ranges from 0.75 to 0.90 in the calibration period and from 0.82 to 0.91 in the validation period. The spatial patterns of simulated streamflow are dominated by the distribution of precipitation.
  • The evapotranspiration simulations forced by the satellite-based precipitation products are acceptable, whereas the soil moisture simulations forced by the five products are poor. In addition, the spatial patterns of simulated evapotranspiration and soil moisture are controlled by the hydrological model via parameters calibration.
This study provides a comprehensive evaluation of five popular global satellite-based precipitation products in water balance simulations over a humid region. The finding of this study is helpful for the developers of precipitation products to improve their products and also useful for the users of satellite-based precipitation products to select the optimal product to perform their applications in hydrological modeling.

Author Contributions

D.Z. performed the research design, analyzed the data and wrote the manuscript; X.L. and P.B. provided constructive suggestions towards the whole structure and edited the manuscript; X.-H.L. provided useful comments on the hydrological modeling based on remote sensing products.

Funding

This research was funded by the Natural Science Foundation of China grant number [41771039], [41330529] and [41571023], and the Key Research Program of the Chinese Academy of Sciences [KFZD-SW-318-2].

Conflicts of Interest

The authors declare no conflict of interest.

References

  1. Campoy, A.; Ducharne, A.; Cheruy, F.; Hourdin, F.; Polcher, J.; Dupont, J.C. Response of land surface fluxes and precipitation to different soil bottom hydrological conditions in a general circulation model. J. Geophys. Res. Atmosp. 2013, 118, 725–739. [Google Scholar] [CrossRef]
  2. Kucera, P.A.; Ebert, E.E.; Turk, F.J.; Levizzani, V.; Kirschbaum, D.; Tapiador, F.J.; Loew, A.; Borsche, M. Precipitation from Space: Advancing Earth System Science. Bull. Am. Meteorol. Soc. 2013, 94, 365–375. [Google Scholar] [CrossRef] [Green Version]
  3. Michaelides, S. Advances in Precipitation Science. Atmosp. Res. 2013, 119, 1–2. [Google Scholar] [CrossRef]
  4. Frei, C.; Schöll, R.; Fukutome, S.; Schmidli, J.; Vidale, P.L. Future change of precipitation extremes in Europe: Intercomparison of scenarios from regional climate models. J. Geophys. Res. Atmosp. 2006, 111. [Google Scholar] [CrossRef] [Green Version]
  5. Prein, A.F.; Rasmussen, R.M.; Ikeda, K.; Liu, C.; Clark, M.P.; Holland, G.J. The future intensification of hourly precipitation extremes. Nat. Clim. Chang. 2016, 7, 48–52. [Google Scholar] [CrossRef]
  6. Pfahl, S.; O’Gorman, P.A.; Fischer, E.M. Understanding the regional pattern of projected future changes in extreme precipitation. Nat. Clim. Chang. 2017, 7, 423–427. [Google Scholar] [CrossRef]
  7. Miao, C.; Sun, Q.; Borthwick, A.G.; Duan, Q. Linkage between hourly precipitation events and atmospheric temperature changes over China during the warm season. Sci. Rep. 2016, 6, 22543. [Google Scholar] [CrossRef] [PubMed]
  8. Stephens, G.L. The Remote Sens. of Clouds and Precipitation from Space: A Review. J. Atmos. Sci. 2007, 64, 3742–3765. [Google Scholar] [CrossRef]
  9. Forootan, E.; Khandu; Awange, J.L.; Schumacher, M.; Anyah, R.O.; Dijk, A.I.J.M.V.; Kusche, J. Quantifying the impacts of ENSO and IOD on rain gauge and remotely sensed precipitation products over Australia. Remote Sens. Environ. 2016, 172, 50–66. [Google Scholar] [CrossRef] [Green Version]
  10. Illingworth, A.J.; Barker, H.W.; Beljaars, A.; Ceccaldi, M.; Chepfer, H.; Clerbaux, N.; Cole, J.; Delanoë, J.; Domenech, C.; Donovan, D.P. The EarthCARE Satellite: The Next Step Forward in Global Measurements of Clouds, Aerosols, Precipitation, and Radiation. Bull. Am. Meteorol. Soc. 2014, 31, 197–210. [Google Scholar] [CrossRef]
  11. Tuttle, S.E.; Salvucci, G.D. A new approach for validating satellite estimates of soil moisture using large-scale precipitation: Comparing AMSR-E products. Remote Sens. Environ. 2014, 142, 207–222. [Google Scholar] [CrossRef]
  12. Margulis, S.A.; Entekhabi, D. Temporal disaggregation of satellite-derived monthly precipitation estimates and the resulting propagation of error in partitioning of water at the land surface. Hydrol. Earth Syst. Sci. 2001, 5, 688–709. [Google Scholar] [CrossRef]
  13. Gebregiorgis, A.S.; Hossain, F. How well can we estimate error variance of satellite precipitation data around the world? Atmos. Res. 2015, 154, 39–59. [Google Scholar] [CrossRef]
  14. Mei, Y.; Anagnostou, E.N.; Nikolopoulos, E.I.; Borga, M. Error Analysis of Satellite Precipitation Products in Mountainous Basins. J. Hydrometeorol. 2014, 15, 1778–1793. [Google Scholar] [CrossRef]
  15. Sun, Q.; Miao, C.; Duan, Q.; Ashouri, H.; Sorooshian, S.; Hsu, K.L. A review of global precipitation datasets: Data sources, estimation, and intercomparisons. Rev. Geophys. 2017, 56, 79–107. [Google Scholar] [CrossRef]
  16. Beck, H.; Vergopolan, N.; Pan, M.; Levizzani, V.; Van Dijk, A.; Weedon, G.P.; Brocca, L.; Huffman, G.J.; Wood, E.F.; William, L. Global-scale evaluation of 22 precipitation datasets using gauge observations and hydrological modeling. Hydrol. Earth Syst. Sci. Discuss. 2017, 21, 1–23. [Google Scholar] [CrossRef]
  17. Sapiano, M.R.P.; Smith, T.M.; Arkin, P.A. A new merged analysis of precipitation utilizing satellite and reanalysis data. J. Geophys. Res. Atmosp. 2008, 113. [Google Scholar] [CrossRef] [Green Version]
  18. Derin, Y.; Anagnostou, E.; Berne, A.; Borga, M.; Boudevillain, B.; Buytaert, W.; Chang, C.H.; Delrieu, G.; Hong, Y.; Hsu, Y.C. Multiregional Satellite Precipitation Products Evaluation over Complex Terrain. J. Hydrometeorol. 2016, 17, 1817–1836. [Google Scholar] [CrossRef]
  19. Ciabatta, L.; Brocca, L.; Massari, C.; Moramarco, T.; Gabellani, S.; Puca, S.; Wagner, W. Rainfall-runoff modelling by using SM2RAIN-derived and state-of-the-art satellite rainfall products over Italy. Int. J. Appl. Earth Obs. Geoinf. 2016, 48, 163–173. [Google Scholar] [CrossRef]
  20. Liu, X.; Yang, T.; Hsu, K.; Liu, C.; Sorooshian, S. Evaluating the streamflow simulation capability of PERSIANN-CDR daily rainfall products in two river basins on the Tibetan Plateau. Hydrol. Earth Syst. Sci. Discuss. 2017, 21, 1–31. [Google Scholar] [CrossRef]
  21. Behrangi, A.; Andreadis, K.; Fisher, J.B.; Turk, F.J.; Granger, S.; Painter, T.; Das, N. Satellite-Based Precipitation Estimation and Its Application for Streamflow Prediction over Mountainous Western U.S. Basins. J. Appl. Meteorol. Climatol. 2014, 53, 2823–2842. [Google Scholar] [CrossRef]
  22. Shrestha, M.S.; Artan, G.A.; Bajracharya, S.R.; Sharma, R.R. Using satellite-based rainfall estimates for streamflow modelling: Bagmati Basin. J. Flood Risk Manag. 2010, 1, 89–99. [Google Scholar] [CrossRef]
  23. Ashouri, H.; Nguyen, P.; Thorstensen, A.; Hsu, K.L.; Sorooshian, S.; Dan, B. Assessing the efficacy of High-Resolution Satellite-based PERSIANN-CDR Precipitation Product in Simulating Streamflow. J. Hydrometeorol. 2016, 17, 2061–2076. [Google Scholar] [CrossRef]
  24. Long, D.; Longuevergne, L.; Scanlon, B.R. Global analysis of approaches for deriving total water storage changes from GRACE satellites. Water Resour. Res. 2015, 51, 2574–2594. [Google Scholar] [CrossRef] [Green Version]
  25. Li, D.; Christakos, G.; Ding, X.; Wu, J. Adequacy of TRMM satellite rainfall data in driving the SWAT modelling of Tiaoxi catchment (Taihu lake basin, China). J. Hydrol. 2018, 556, 1139–1152. [Google Scholar] [CrossRef]
  26. Li, X.; Zhang, Q.; Xu, C.Y. Assessing the performance of satellite-based precipitation products and its dependence on topography over Poyang Lake basin. Theor. Appl. Climatol. 2014, 115, 713–729. [Google Scholar] [CrossRef]
  27. Getirana, A.C.V.; Espinoza, J.C.V.; Ronchail, J.; Filho, O.C.R. Assessment of different precipitation datasets and their impacts on the water balance of the Negro River basin. J. Hydrol. 2011, 404, 304–322. [Google Scholar] [CrossRef]
  28. Liu, X.; Luo, Y.; Zhang, D.; Zhang, M.; Liu, C. Recent changes in pan-evaporation dynamics in China. Geophys. Res. Lett. 2011, 38, 142–154. [Google Scholar] [CrossRef]
  29. Liu, X.; Liu, C.; Brutsaert, W. Investigation of a generalized nonlinear form of the complementary principle for evaporation estimation. J. Geophys. Res. Atmosp. 2018, 128, 3933–3942. [Google Scholar] [CrossRef]
  30. Long, D.; Yang, Y.; Wada, Y.; Yang, H.; Wei, L.; Chen, Y.; Yong, B.; Hou, A.; Wei, J.; Lu, C. Deriving scaling factors using a global hydrological model to restore GRACE total water storage changes for China’s Yangtze River Basin. Remote Sens. Environ. 2015, 168, 177–193. [Google Scholar] [CrossRef]
  31. Bai, P.; Liu, X. Evaluation of Five Satellite-Based Precipitation Products in Two Gauge-Scarce Basins on the Tibetan Plateau. Remote Sens. 2018, 10, 1316. [Google Scholar] [CrossRef]
  32. Bitew, M.M.; Gebremichael, M. Assessment of satellite rainfall products for streamflow simulation in medium watersheds of the Ethiopian highlands. Hydrol. Earth Syst. Sci. 2011, 15, 1147–1155. [Google Scholar] [CrossRef] [Green Version]
  33. Falck, A.S.; Maggioni, V.; Tomasella, J.; Vila, D.A.; Diniz, F.L.R. Propagation of satellite precipitation uncertainties through a distributed hydrologic model: A case study in the Tocantins–Araguaia basin in Brazil. J. Hydrol. 2015, 527, 943–957. [Google Scholar] [CrossRef]
  34. Pinnington, E.; Quaife, T.; Black, E. Impact of remotely sensed soil moisture and precipitation on soil moisture prediction in a data assimilation system with the JULES land surface model. Hydrol. Earth Syst. Sci. 2018, 22, 2575–2588. [Google Scholar] [CrossRef] [Green Version]
  35. Li, X.; Zhang, Q.; Xu, C.-Y.; Ye, X. The changing patterns of floods in Poyang Lake, China: Characteristics and explanations. Nat. Hazards 2015, 76, 651–666. [Google Scholar] [CrossRef]
  36. Li, X.; Zhang, Q.; Ye, X. Capabilities of Satellite-Based Precipitation to Estimate the Spatiotemporal Variation of Flood/Drought Class in Poyang Lake Basin. Adv. Meteorol. 2013, 2013, 1–9. [Google Scholar] [CrossRef]
  37. Miao, C.; Ashouri, H.; Hsu, K.-L.; Sorooshian, S.; Duan, Q. Evaluation of the PERSIANN-CDR daily rainfall estimates in capturing the behavior of extreme precipitation events over China. J. Hydrometeorol. 2015, 16, 1387–1396. [Google Scholar] [CrossRef]
  38. Sahoo, A.K.; Sheffield, J.; Pan, M.; Wood, E.F. Evaluation of the tropical rainfall measuring mission multi-satellite precipitation analysis (TMPA) for assessment of large-scale meteorological drought. Remote Sens. Environ. 2015, 159, 181–193. [Google Scholar] [CrossRef]
  39. Mu, Q.; Zhao, M.; Running, S.W. Improvements to a MODIS global terrestrial evapotranspiration algorithm. Remote Sens. Environ. 2011, 115, 1781–1800. [Google Scholar] [CrossRef]
  40. Funk, C.; Peterson, P.; Landsfeld, M.; Pedreros, D.; Verdin, J.; Shukla, S.; Husak, G.; Rowland, J.; Harrison, L.; Hoell, A. The climate hazards infrared precipitation with stations—A new environmental record for monitoring extremes. Sci. Data 2015, 2, 150066. [Google Scholar] [CrossRef]
  41. Joyce, R.J.; Janowiak, J.E.; Arkin, P.A.; Xie, P. CMORPH: A Method That Produces Global Precipitation Estimates from Passive Microwave and Infrared Data at High Spatial and Temporal Resolution. J. Hydrometeorol. 2004, 5, 287–296. [Google Scholar] [CrossRef]
  42. Beck, H.E.; Van Dijk, A.I.J.M.; Levizzani, V.; Schellekens, J.; Miralles, D.G.; Martens, B.; De Roo, A. MSWEP: 3-hourly 0.25° global gridded precipitation (1979-2015) by merging gauge, satellite, and reanalysis data. Hydrol. Earth Syst. Sci. 2017, 21, 1–38. [Google Scholar] [CrossRef]
  43. Ashouri, H.; Hsu, K.L.; Sorooshian, S.; Braithwaite, D.K.; Knapp, K.R.; Cecil, L.D.; Nelson, B.R.; Prat, O.P. PERSIANN-CDR: Daily Precipitation Climate Data Record from Multisatellite Observations for Hydrological and Climate Studies. Bull. Am. Meteorol. Soc. 2014, 96, 197–210. [Google Scholar] [CrossRef]
  44. Huffman, G.J.; Bolvin, D.T.; Nelkin, E.J.; Wolff, D.B.; Adler, R.F.; Gu, G.; Erich, S. The TRMM Multisatellite Precipitation Analysis (TMPA): Quasi-global, multiyear, combined-sensor precipitation estimates at fine scale. J. Hydrometeorol. 2007, 8, 38–55. [Google Scholar] [CrossRef]
  45. Liu, C.; Wang, Z.; Zheng, H.; Zhang, L.; Wu, X. Development of hydro-informatic modelling system and its application. Sci. China Ser. E Technol. Sci. 2008, 51, 456–466. [Google Scholar] [CrossRef]
  46. Bai, P.; Liu, X.; Zhang, Y.; Liu, C. Incorporating vegetation dynamics noticeably improved performance of hydrological model under vegetation greening. Sci. Total Environ. 2018, 643, 610–622. [Google Scholar] [CrossRef] [PubMed]
  47. Jiang, Y.; Liu, C.; Li, X.; Liu, L.; Wang, H. Rainfall-runoff modeling, parameter estimation and sensitivity analysis in a semiarid catchment. Environ. Model. Softw. 2015, 67, 72–88. [Google Scholar] [CrossRef] [Green Version]
  48. Liu, W.; Zhang, A.; Wang, L.; Fu, G.; Chen, D.; Liu, C.; Cai, T. Projecting streamflow in the Tangwang River basin (China) using a rainfall generator and two hydrological models. Clim. Res. 2015, 62, 79–97. [Google Scholar] [CrossRef]
  49. Ebert, E.E. Ability of a Poor Man’s Ensemble to Predict the Probability and Distribution of Precipitation. Mon. Weather Rev. 2000, 129, 2461. [Google Scholar] [CrossRef]
  50. Gupta, H.V.; Kling, H.; Yilmaz, K.K.; Martinez, G.F. Decomposition of the mean squared error and NSE performance criteria: Implications for improving hydrological modelling. J. Hydrol. 2009, 377, 80–91. [Google Scholar] [CrossRef] [Green Version]
  51. Liu, J.G.; Xie, Z.H. Improving simulation of soil moisture in China using a multiple meteorological forcing ensemble approach. Hydrol. Earth Syst. Sci. 2013, 17, 3355–3369. [Google Scholar] [CrossRef] [Green Version]
  52. Sawada, Y.; Koike, T.; Walker, J.P. A land data assimilation system for simultaneous simulation of soil moisture and vegetation dynamics. J. Geophys. Res. Atmosp. 2015, 120, 5910–5930. [Google Scholar] [CrossRef] [Green Version]
  53. Martinez, J.A.; Dominguez, F.; Miguez-Macho, G. Effects of a Groundwater Scheme on the Simulation of Soil Moisture and Evapotranspiration over Southern South America. J. Hydrometeorol. 2016, 17, 2941–2957. [Google Scholar] [CrossRef] [Green Version]
  54. Kidd, C.; Levizzani, V. Status of satellite precipitation retrievals. Hydrol. Earth Syst. Sci. 2011, 15, 1109–1116. [Google Scholar] [CrossRef] [Green Version]
  55. Sapiano, M.R.P.; Arkin, P.A. An intercomparison and validation of high-resolution satellite precipitation estimates with 3-hourly gauge data. J. Hydrometeorol. 2009, 10, 149–166. [Google Scholar] [CrossRef]
  56. Guilloteau, C.; Roca, R.; Gosset, M. A Multiscale Evaluation of the Detection Capabilities of High-Resolution Satellite Precipitation Products in West Africa. J. Hydrometeorol. 2016, 17, 2041–2059. [Google Scholar] [CrossRef]
  57. Tang, G.; Zeng, Z.; Long, D.; Guo, X.; Yong, B.; Zhang, W.; Hong, Y. Statistical and Hydrological Comparisons between TRMM and GPM Level-3 Products over a Midlatitude Basin: Is Day-1 IMERG a Good Successor for TMPA 3B42V7? J. Hydrometeorol. 2015, 17, 121–137. [Google Scholar] [CrossRef]
  58. Fu, Q.; Ruan, R.; Liu, Y. Accuracy Assessment of Global Satellite Mapping of Precipitation (GSMaP) Product over Poyang Lake Basin, China. Procedia Environ. Sci. 2011, 10, 2265–2271. [Google Scholar] [CrossRef] [Green Version]
  59. Long, D.; Pan, Y.; Zhou, J.; Chen, Y.; Hou, X.; Hong, Y.; Scanlon, B.R.; Longuevergne, L. Global analysis of spatiotemporal variability in merged total water storage changes using multiple GRACE products and global hydrological models. Remote Sens. Environ. 2017, 192, 198–216. [Google Scholar] [CrossRef]
  60. Bai, P.; Liu, X.; Liu, C. Improving hydrological simulations by incorporating GRACE data for model calibration. J. Hydrol. 2018, 557, 291–304. [Google Scholar] [CrossRef]
Figure 1. Sketch map of the study area.
Remotesensing 11 00151 g001
Figure 2. Spatial distribution of mean daily precipitation estimates at 0.25° × 0.25° resolution in the Ganjiang Basin derived from (a) gauged data and five satellite-based precipitation products (b): CHIRPS; (c): CMORPH; (d): MSWEP; (e): PERSIANN; (f): TRMM.
Remotesensing 11 00151 g002
Figure 3. Comprehensive and qualitative evaluation of five satellite-based precipitation products (A to E are represented for CHIRPS, CMORPH, MSWEP, PERSIANN and TRMM, respectively) against gauge observations.
Remotesensing 11 00151 g003
Figure 4. Spatial distribution of relative bias values for five satellite-based precipitation products (a): CHIRPS; (b): CMORPH; (c): MSWEP; (d): PERSIANN; (e): TRMM, compared to gauged precipitation data.
Remotesensing 11 00151 g004
Figure 5. (a) POD and (b) FAR of satellite-based precipitation products versus gauged precipitation at different thresholds.
Remotesensing 11 00151 g005
Figure 6. Streamflow simulations derived by the gauged precipitation and satellite-based precipitation products under S0.
Remotesensing 11 00151 g006
Figure 7. Spatial distributions of simulated streamflow in the Ganjiang Basin derived by different precipitation inputs under six sets of scenarios. Under each scenario, the model parameters are calibrated based on the precipitation data with a red rectangle.
Remotesensing 11 00151 g007
Figure 8. Same as Figure 7, but for evapotranspiration simulations.
Remotesensing 11 00151 g008
Figure 9. Performances of evapotranspiration simulations for the six simulation scenarios versus the MODIS evapotranspiration.
Remotesensing 11 00151 g009
Figure 10. Performance of evapotranspiration simulations for the six simulation scenarios versus the observed evapotranspiration.
Remotesensing 11 00151 g010
Figure 11. Same as Figure 7, but for relative soil moisture.
Remotesensing 11 00151 g011
Figure 12. Performance of soil moisture change (SMC) simulations versus the observed SMC under the six scenarios.
Remotesensing 11 00151 g012
Table 1. Information on the water balance components used in this study.
DataShort Name/VariableFull NamePeriodReference/Source
Satellite-based precipitation productsCHIRPSVersion 2.0 of the Climate Hazards Group InfraRed Precipitation with Station data1998–2012Funk et al. [40]
CMORPHVersion 1.0 of the Climate Prediction Center morphing technique1998–2012Joyce et al. [41]
MSWEPVersion 2.0 of the Multi-Source Weighted-Ensemble Precipitation1998–2012Beck et al. [42]
PERSIANNPrecipitation Estimation from Remotely Sensed Information using Artificial Neural Networks-Climate Data Record1998–2012Ashouri et al. [43]
TRMMVersion 7 of the Multi-satellite Precipitation Analysis products of the Tropical Rainfall Measuring Mission 1998–2012Huffman et al. [44]
Satellite-based evapotranspirationMODISMOD16 global evapotranspiration of the Moderate Resolution Imaging Spectroradiometer2000–2012Mu et al. [39]
Ground-based datasetsPrecipitation\1998–2012Meteorological station
Evapotranspiration\2003–2005Flux station
soil moisture\1998–2010Agricultural observatory
Streamflow\1998–2012Hydrological station
Table 2. Free parameters of the HIMS model.
ParameterDescriptionRangeUnit
RmaxMaximum infiltration control parameter1~2.5
RminMinimum infiltration control parameter0~1
DSmaxWater storage capacity in sub-root soil layer0~300mm
BetaCoefficient of water exchange between two root-zone soil layers1~2
KiInterflow linear recession parameter0~1
drecDelay time for groundwater recharge0~500day
KbBase flow linear recession parameter0~0.1
MAXBASMaximum routing time1~7 day
Table 3. Scenarios for parameter determination of hydrological modeling.
ScenarioDescription
S0Parameters calibrated by gauge-based precipitation
S1Parameters calibrated with CHIRPS product
S2Parameters calibrated with CMORPH product
S3Parameters calibrated with MSWEP product
S4Parameters calibrated with PERSIANN product
S5Parameters calibrated with TRMM product
Table 4. Performance of hydrological modeling using different precipitation inputs under six scenarios.
ScenarioPrecipitationCalibration (1998–2005)Validation (2006–2012)
KGERBKGERB
S0Gauged0.925%0.901%
CHIRPS0.791%0.82−3%
CMORPH0.8016%0.8211%
MSWEP0.86−2%0.91−4%
PERSIANN0.808%0.809%
TRMM0.843%0.85−1%
S1Gauged0.817%0.803%
CHIRPS0.821%0.81−3%
CMORPH0.7218%0.7513%
MSWEP0.880%0.86−2%
PERSIANN0.7510%0.7211%
TRMM0.844%0.841%
S2Gauged0.80−2%0.81−7%
CHIRPS0.38−20%0.47−22%
CMORPH0.789%0.822%
MSWEP0.75−7%0.82−9%
PERSIANN0.68−1%0.792%
TRMM0.60−11%0.67−12%
S3Gauged0.8211%0.817%
CHIRPS0.836%0.833%
CMORPH0.7122%0.7317%
MSWEP0.904%0.913%
PERSIANN0.7614%0.7215%
TRMM0.848%0.856%
S4Gauged0.922%0.89−1%
CHIRPS0.84−4%0.83−8%
CMORPH0.8014%0.839%
MSWEP0.88−4%0.89−6%
PERSIANN0.826%0.807%
TRMM0.88−1%0.88−4%
S5Gauged0.859%0.847%
CHIRPS0.842%0.84−2%
CMORPH0.7419%0.7515%
MSWEP0.894%0.903%
PERSIANN0.7713%0.7316%
TRMM0.864%0.862%

