Impact of Insolation Data Source on Remote Sensing Retrievals of Evapotranspiration over the California Delta

 , , , , and
Abstract
:1. Introduction
2. Materials and Methods
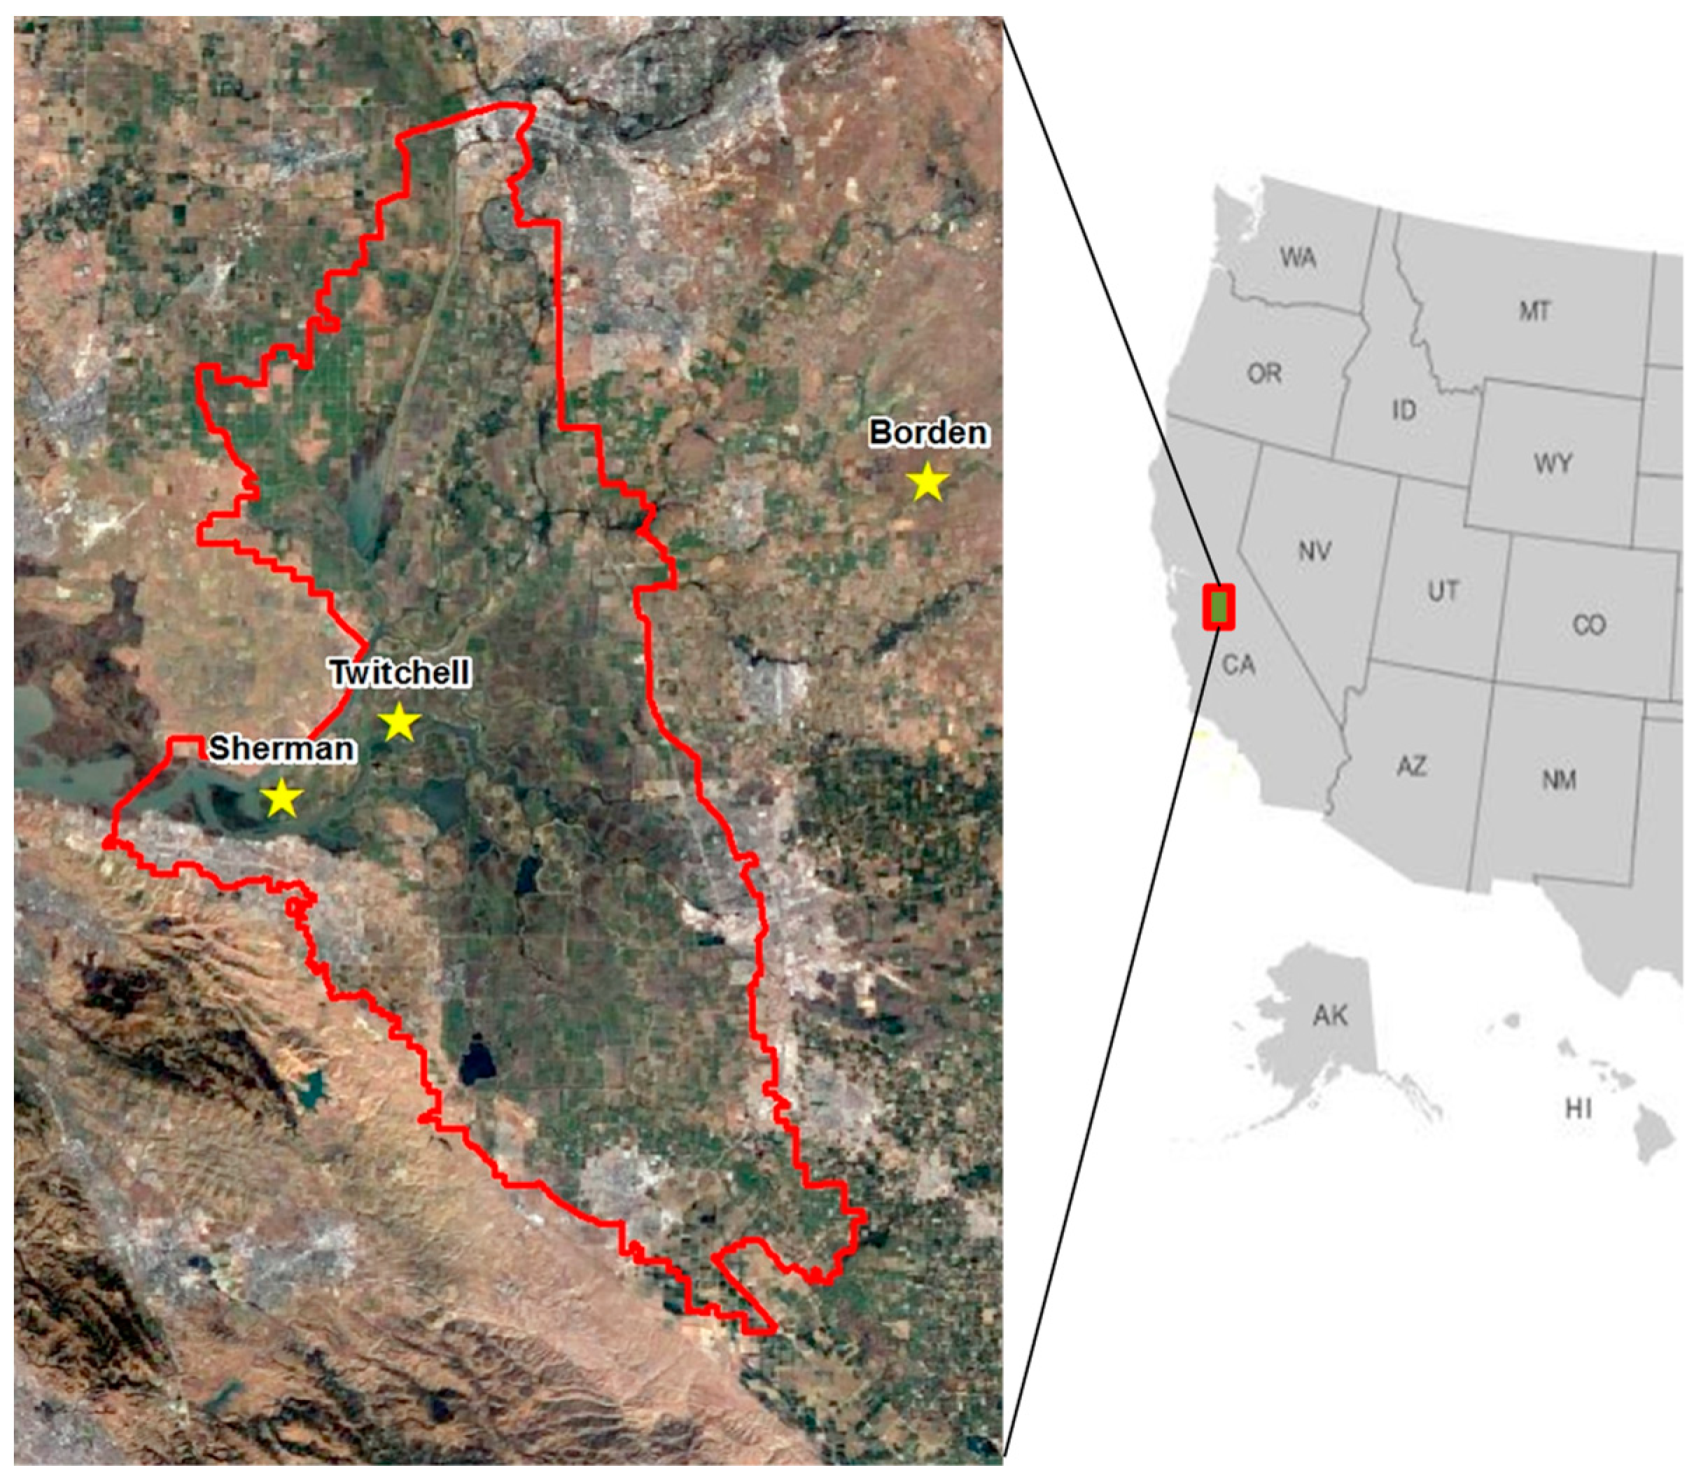
2.1. Study Domain
2.2. ET Remote Sensing Framework
2.2.1. ALEXI/DisALEXI
RNS = HS + λES + G
RN = H + λE + G
2.2.2. Upscaling to Daily ET Using Insolation
2.2.3. Data Fusion
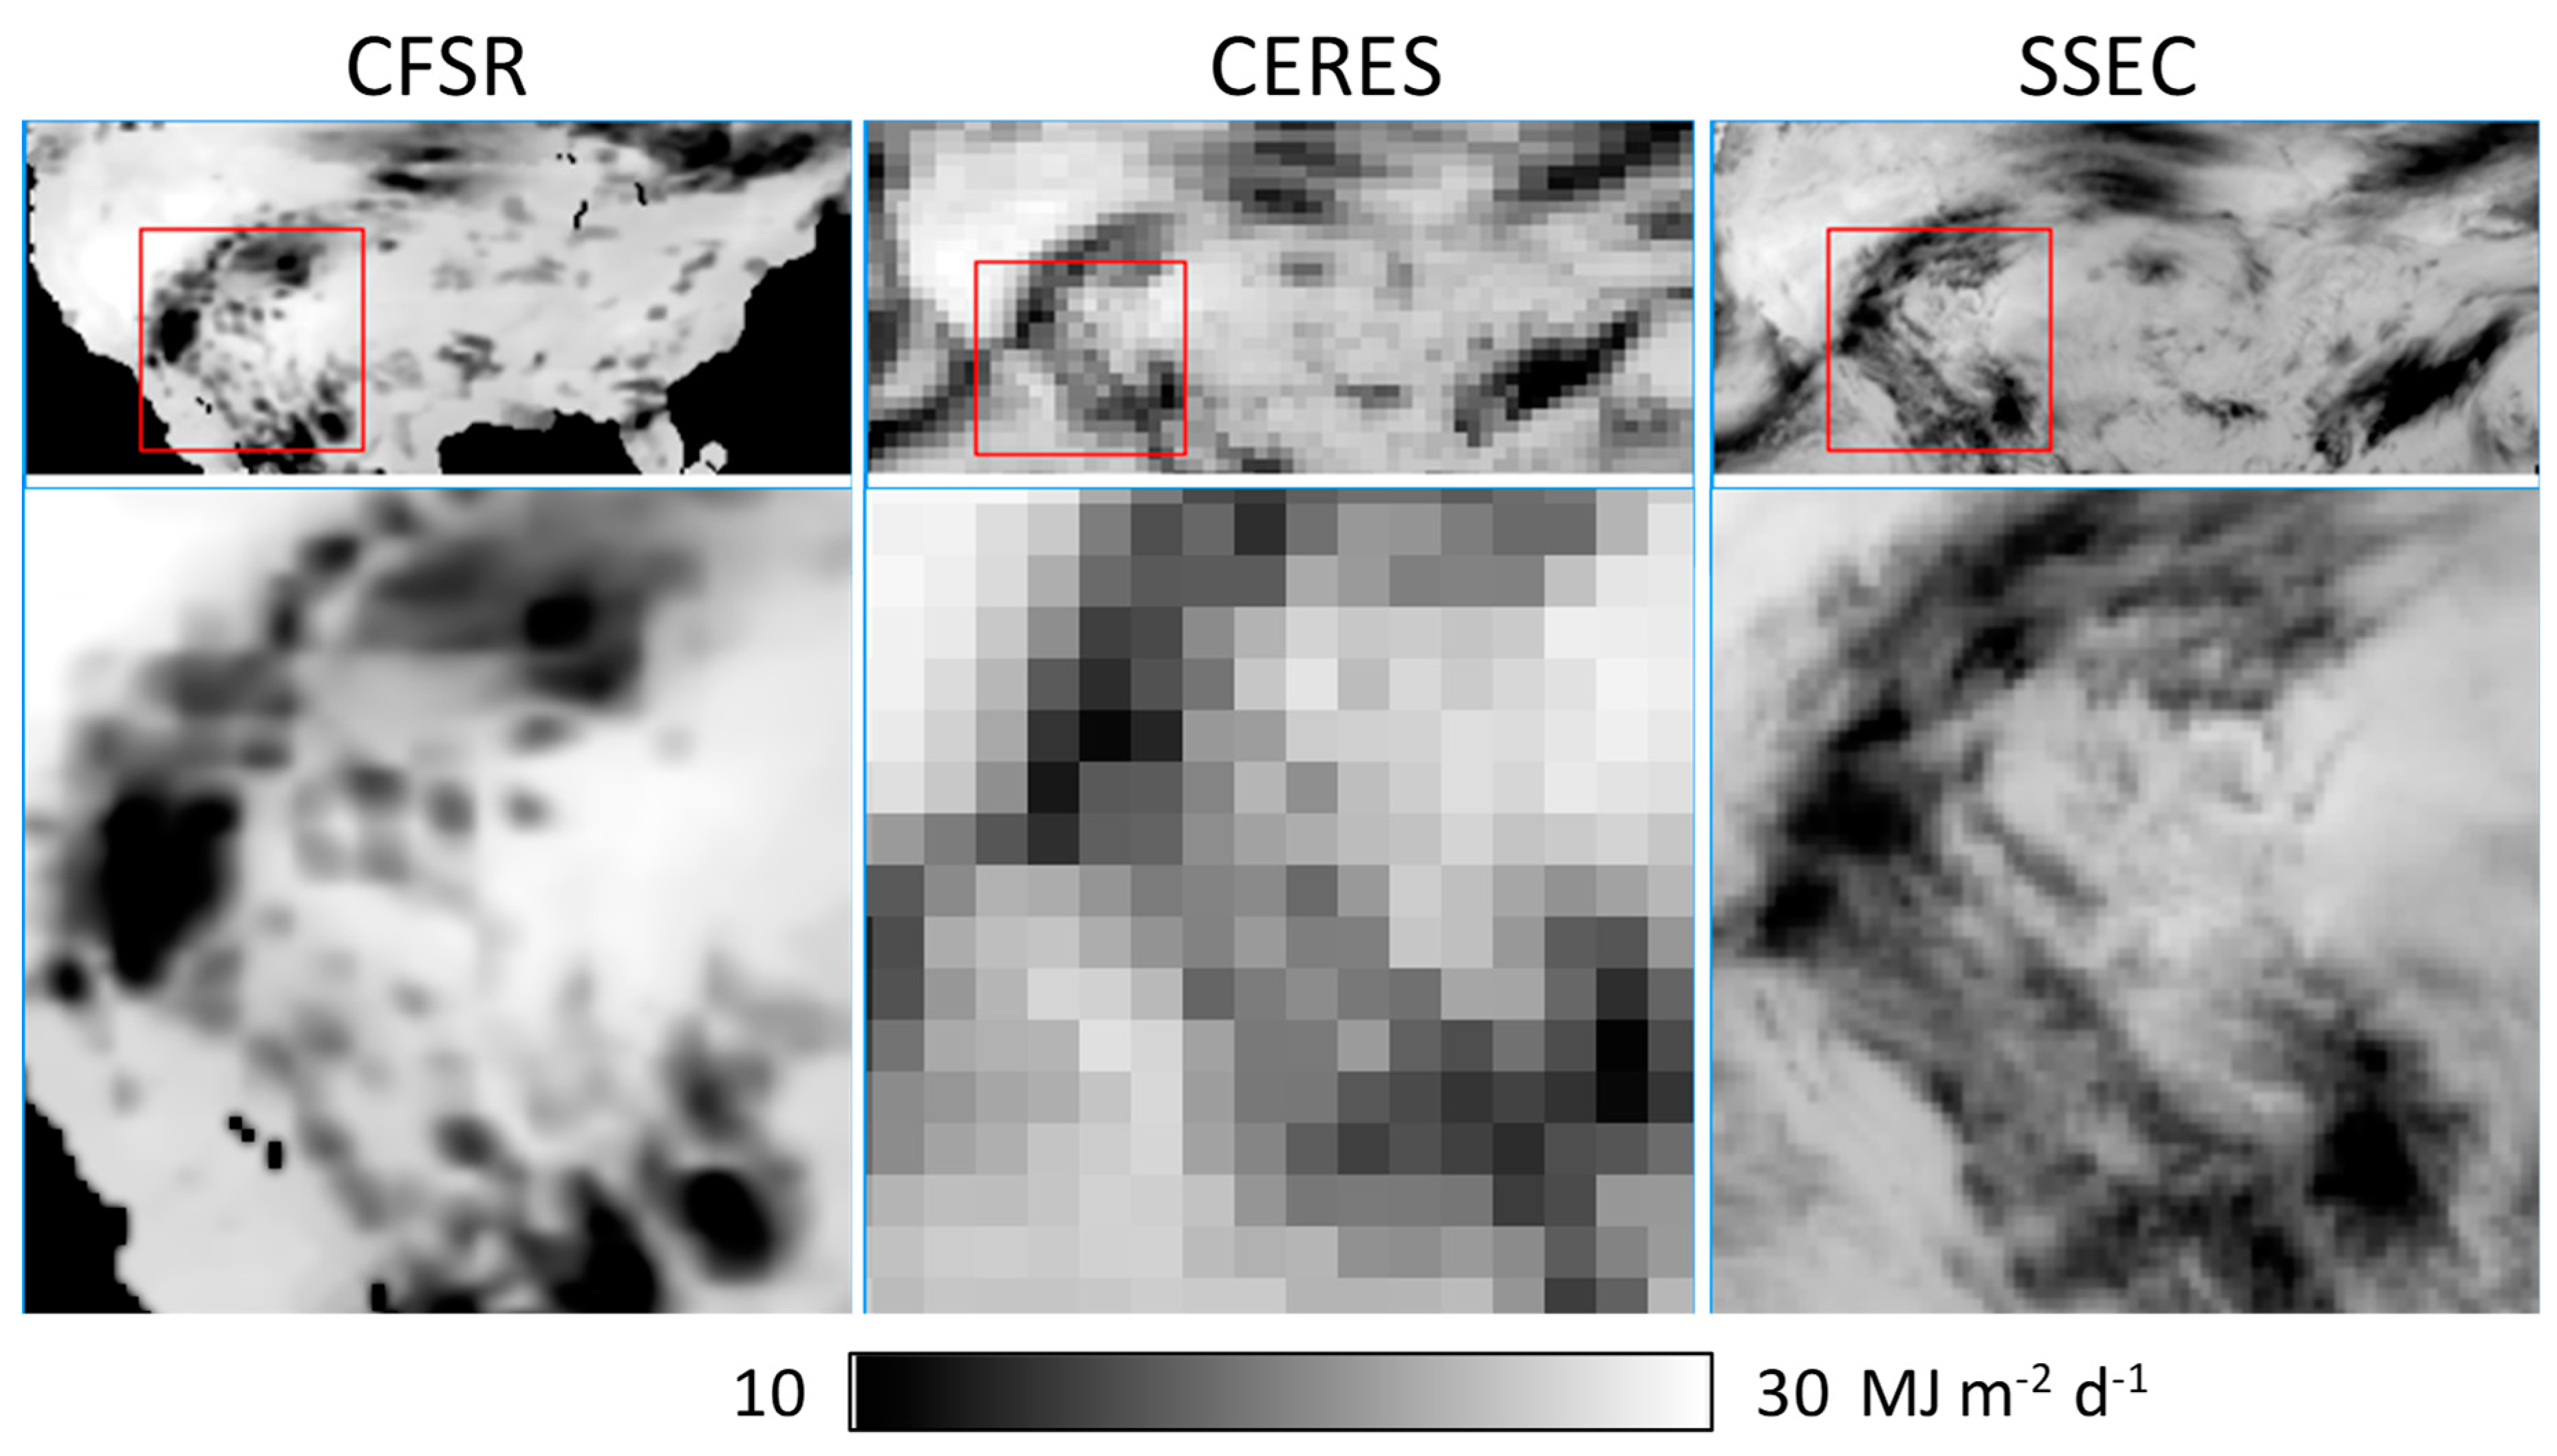
2.3. Insolation Datasets
2.3.1. CFSR
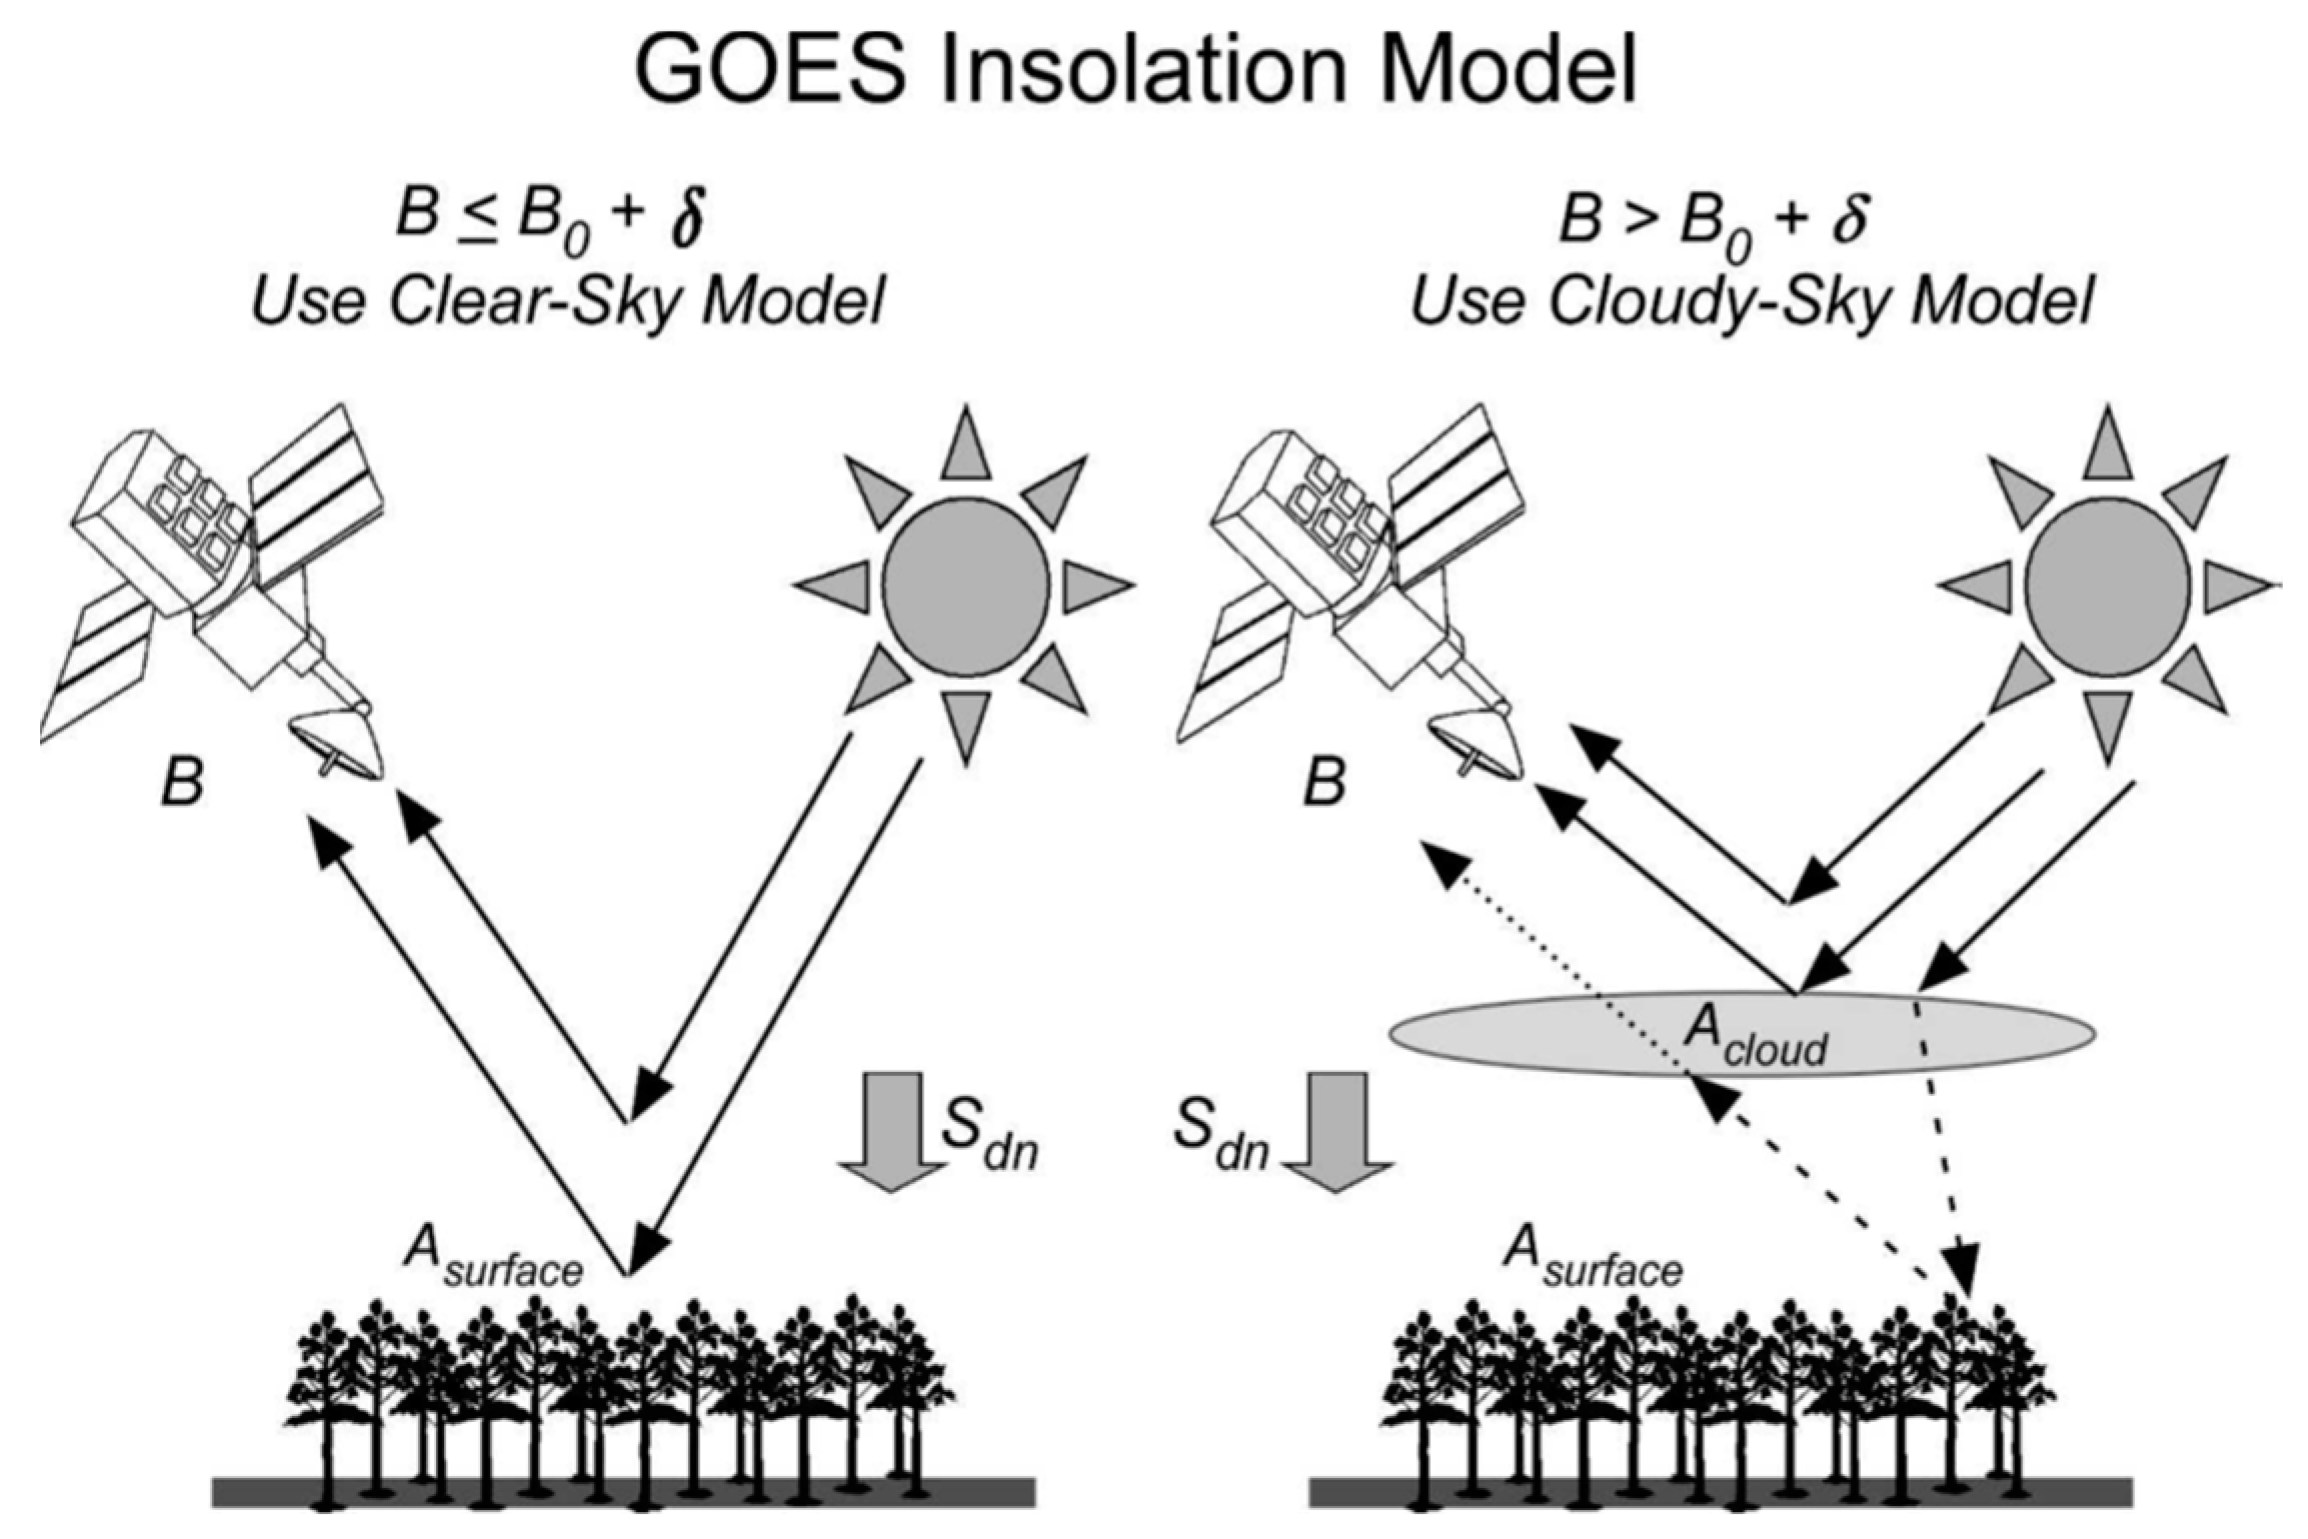
2.3.2. SSEC
2.3.3. CERES
2.4. Flux Datasets
3. Results
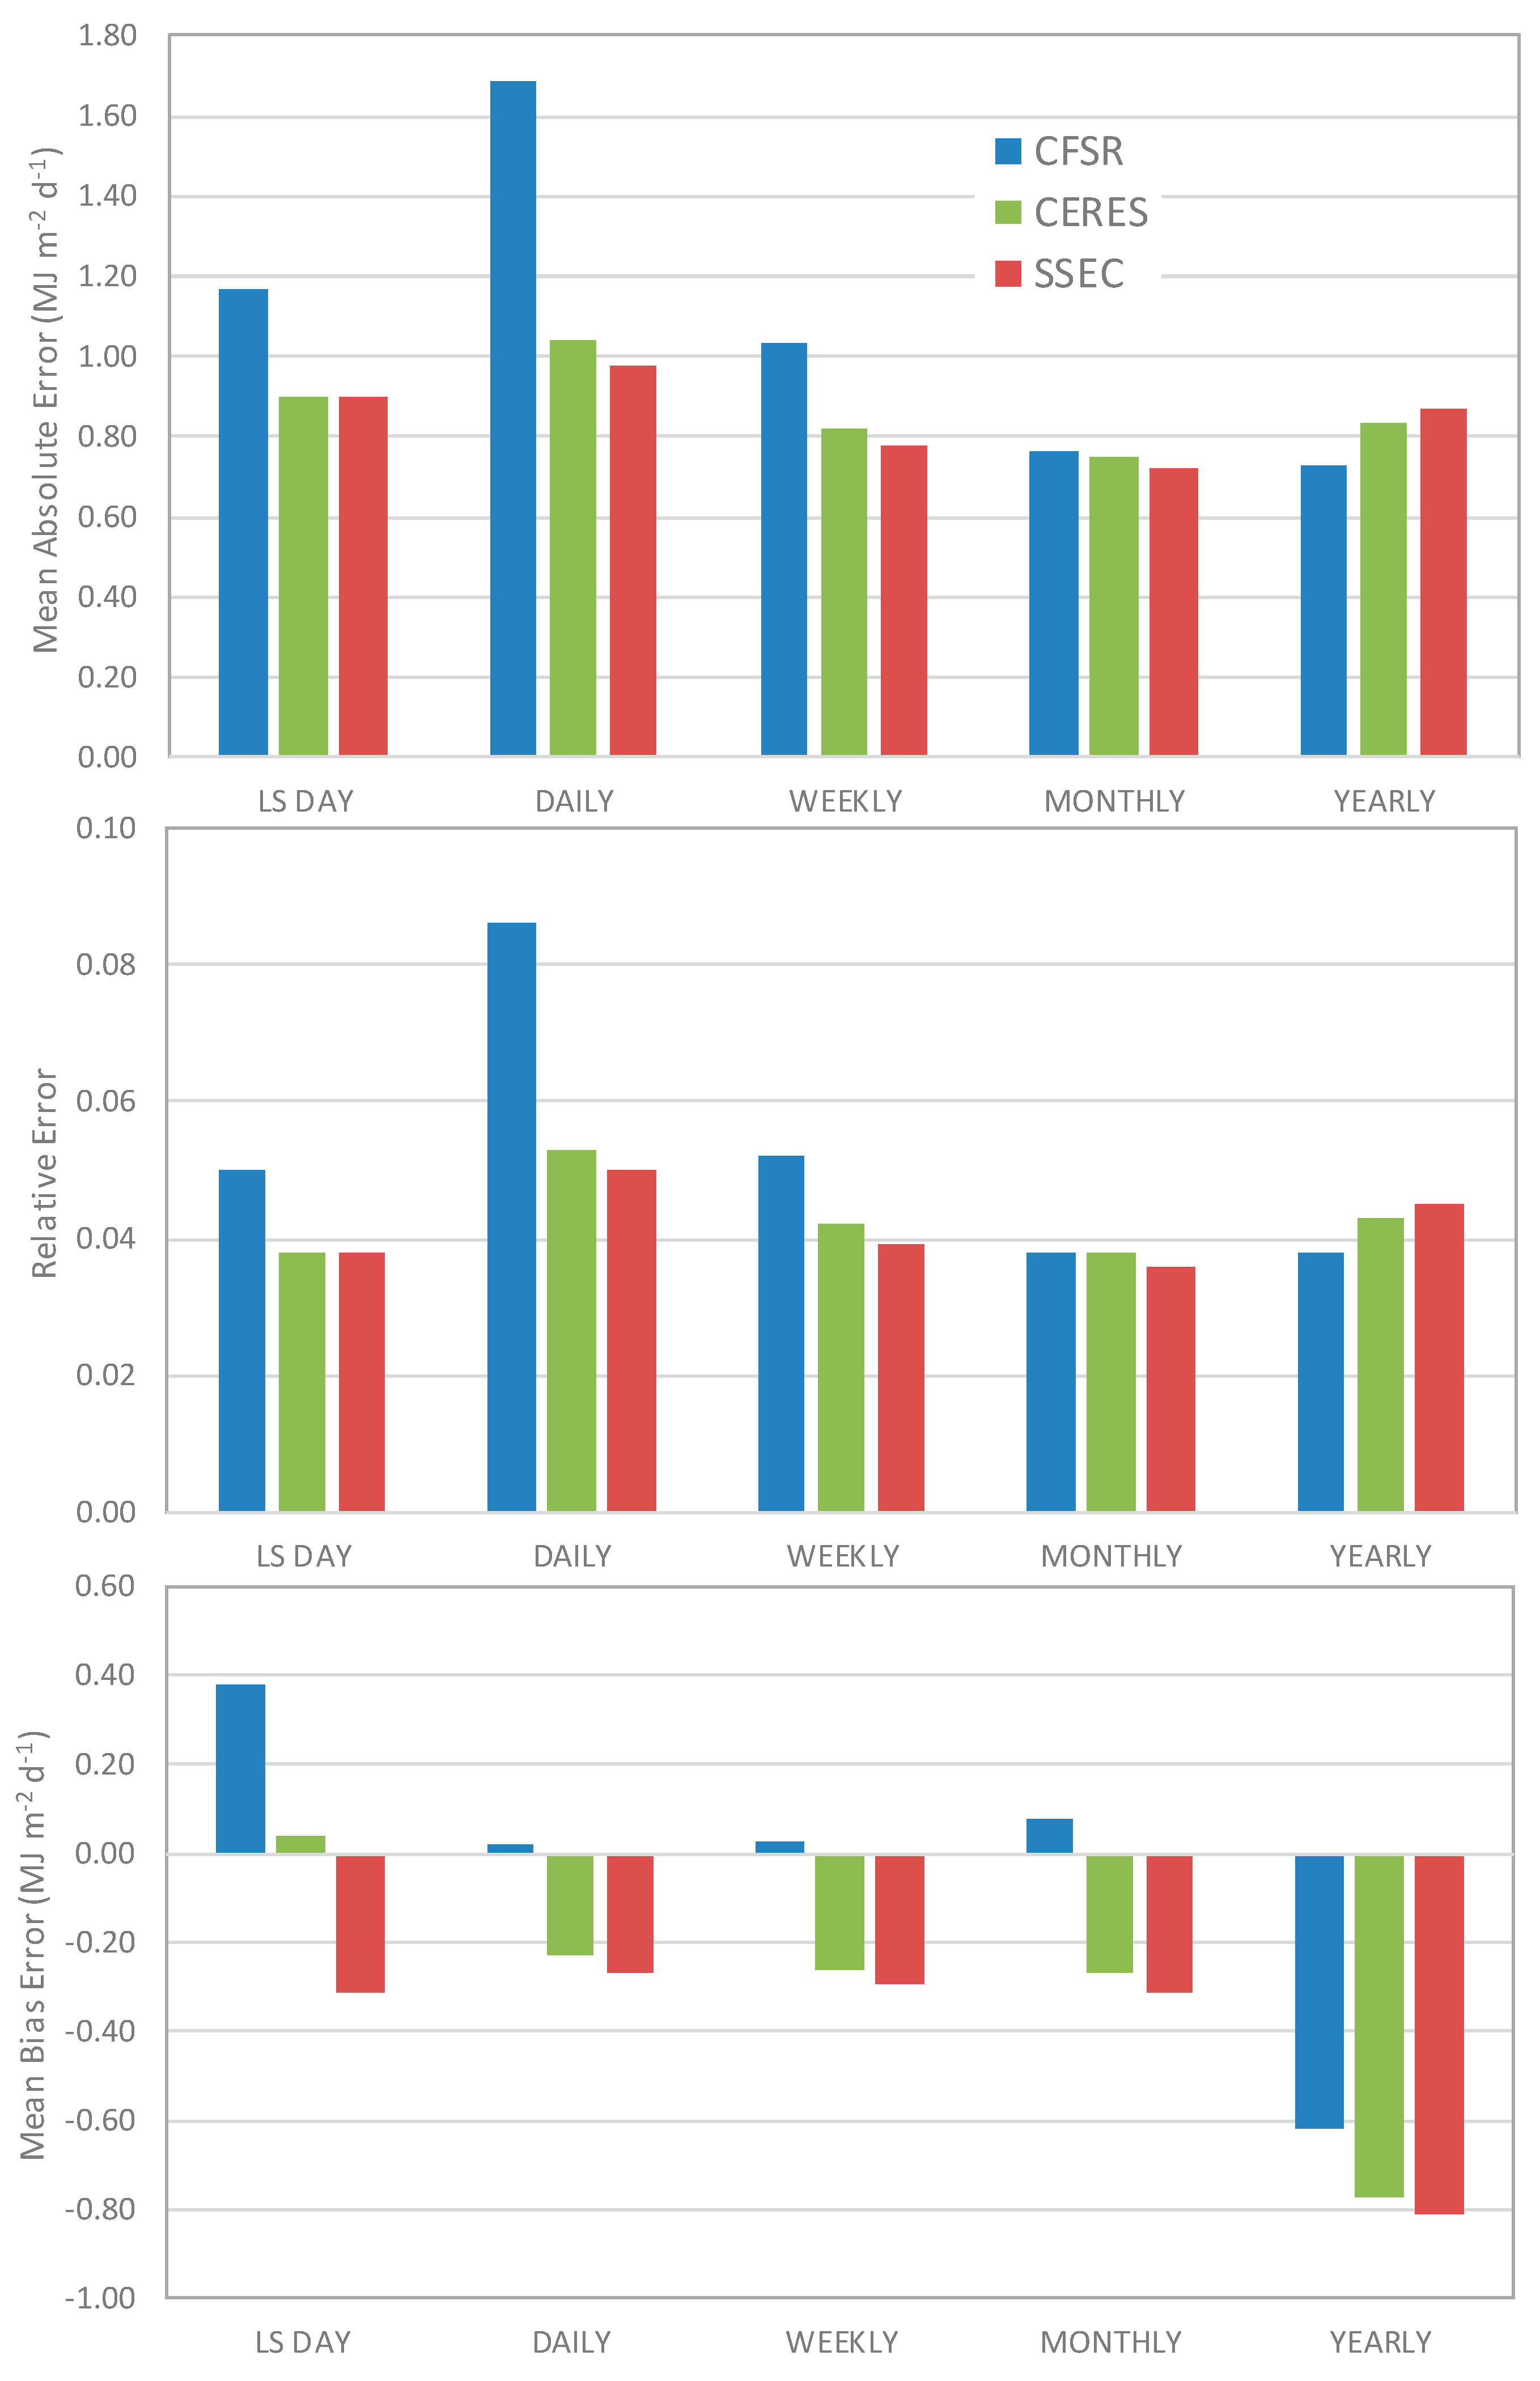
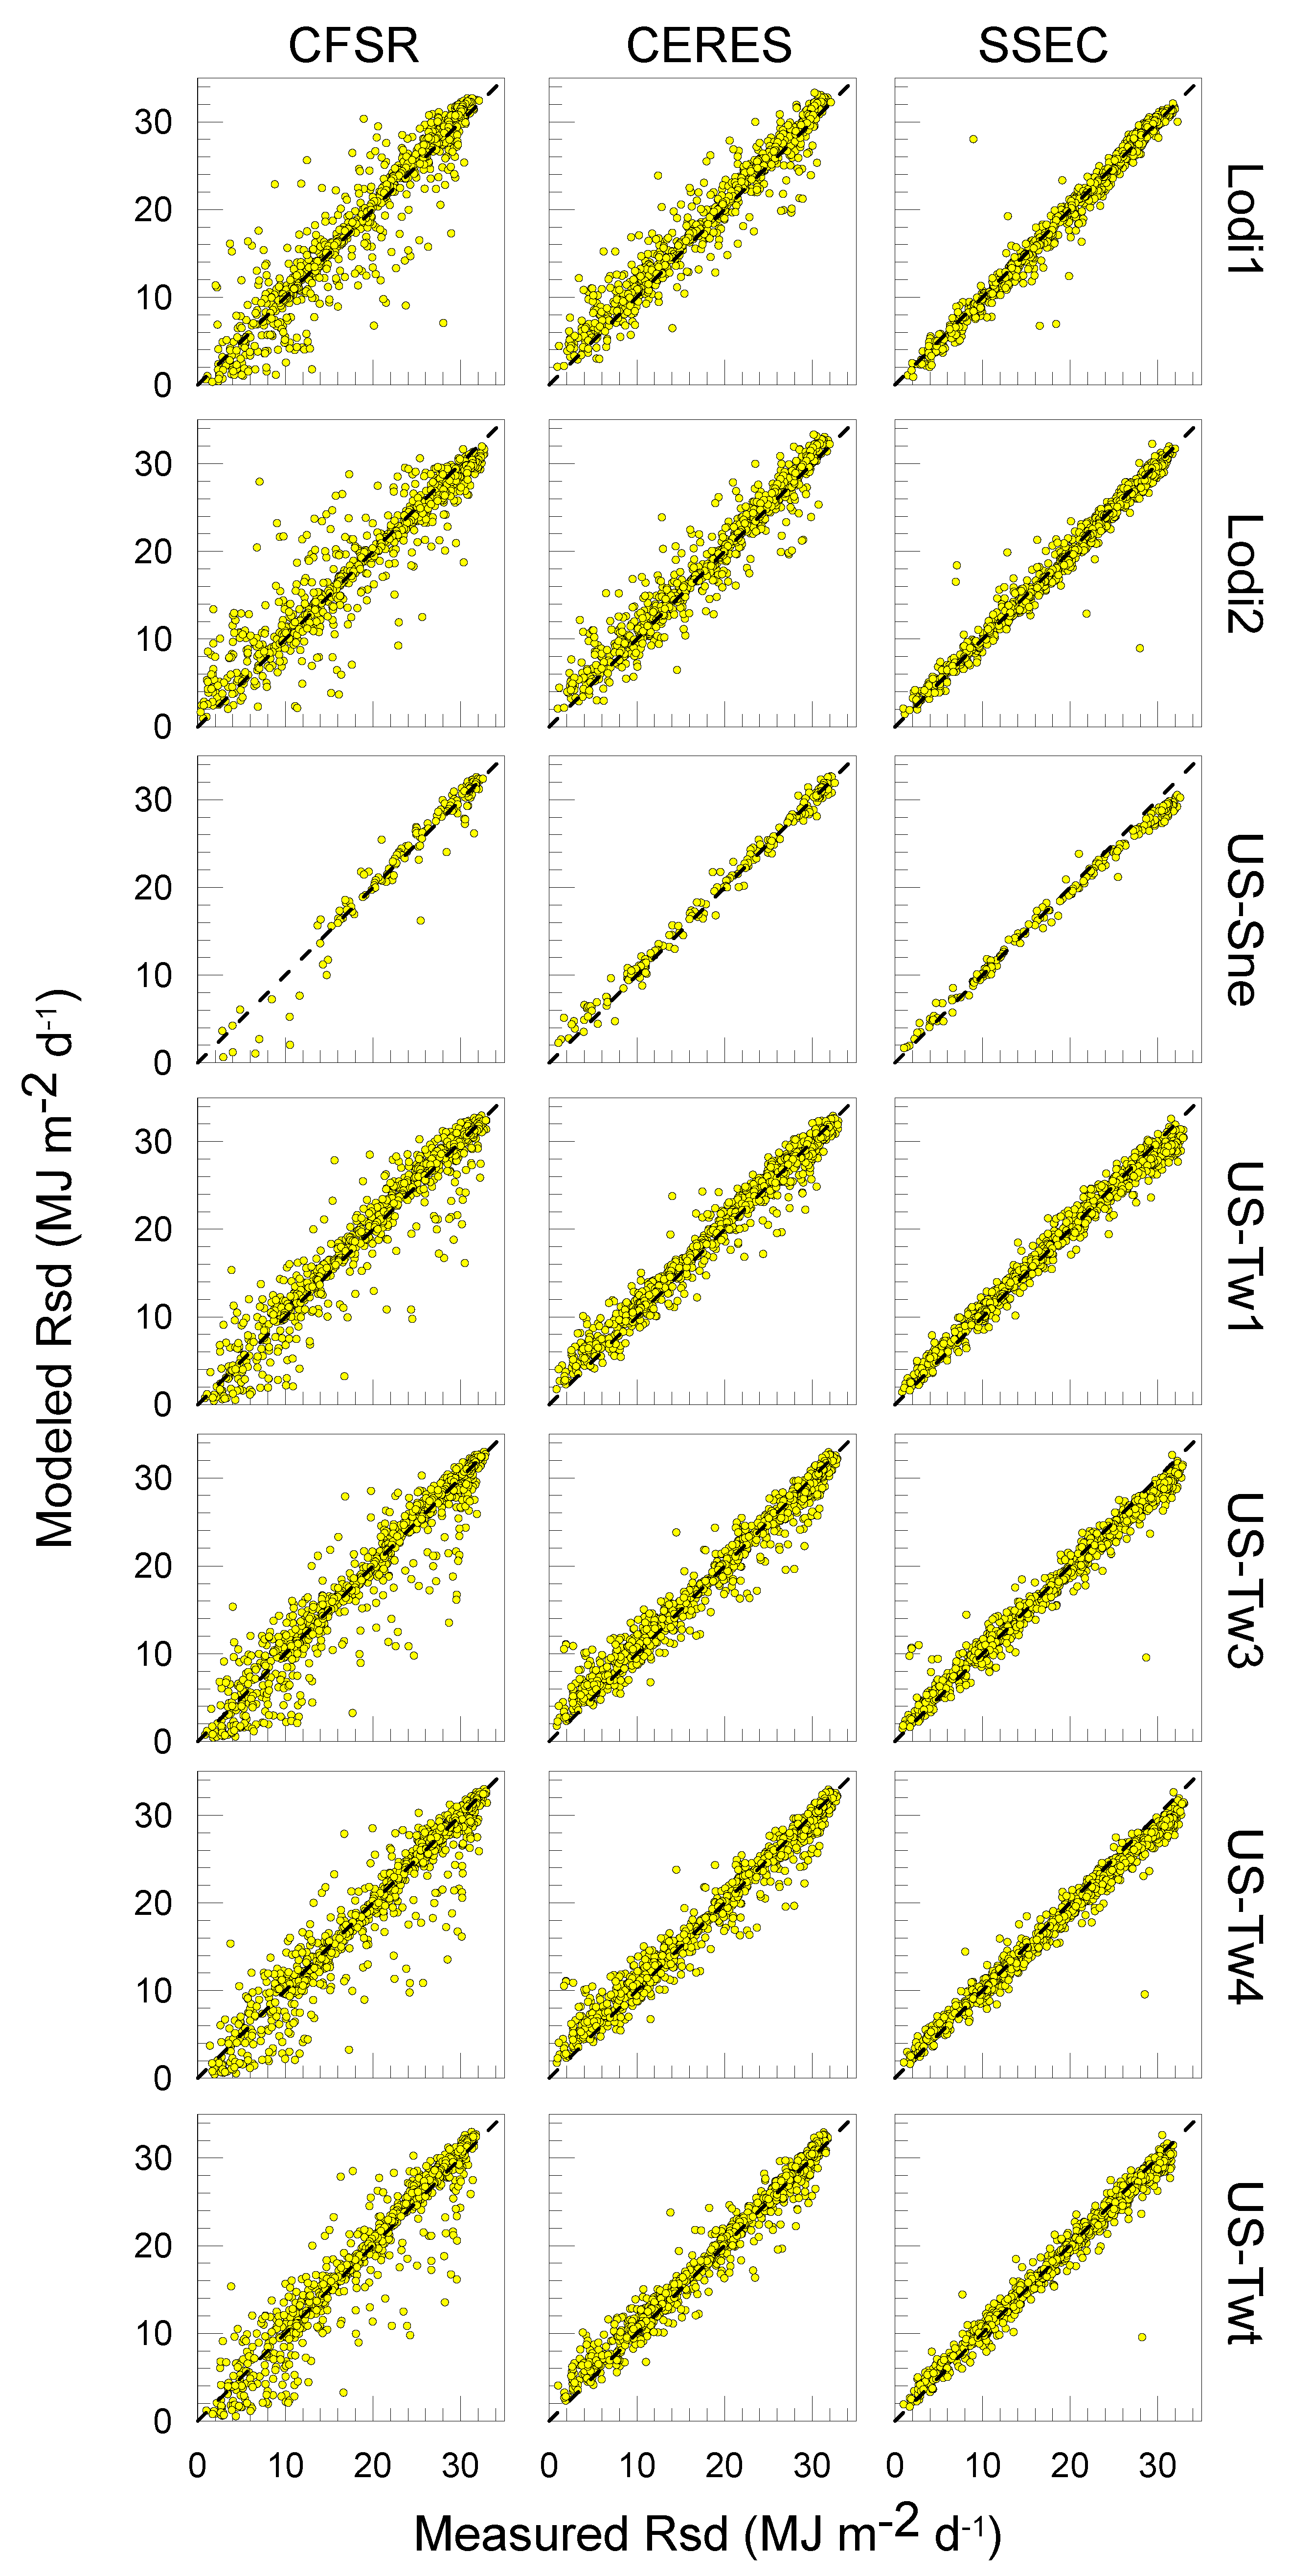
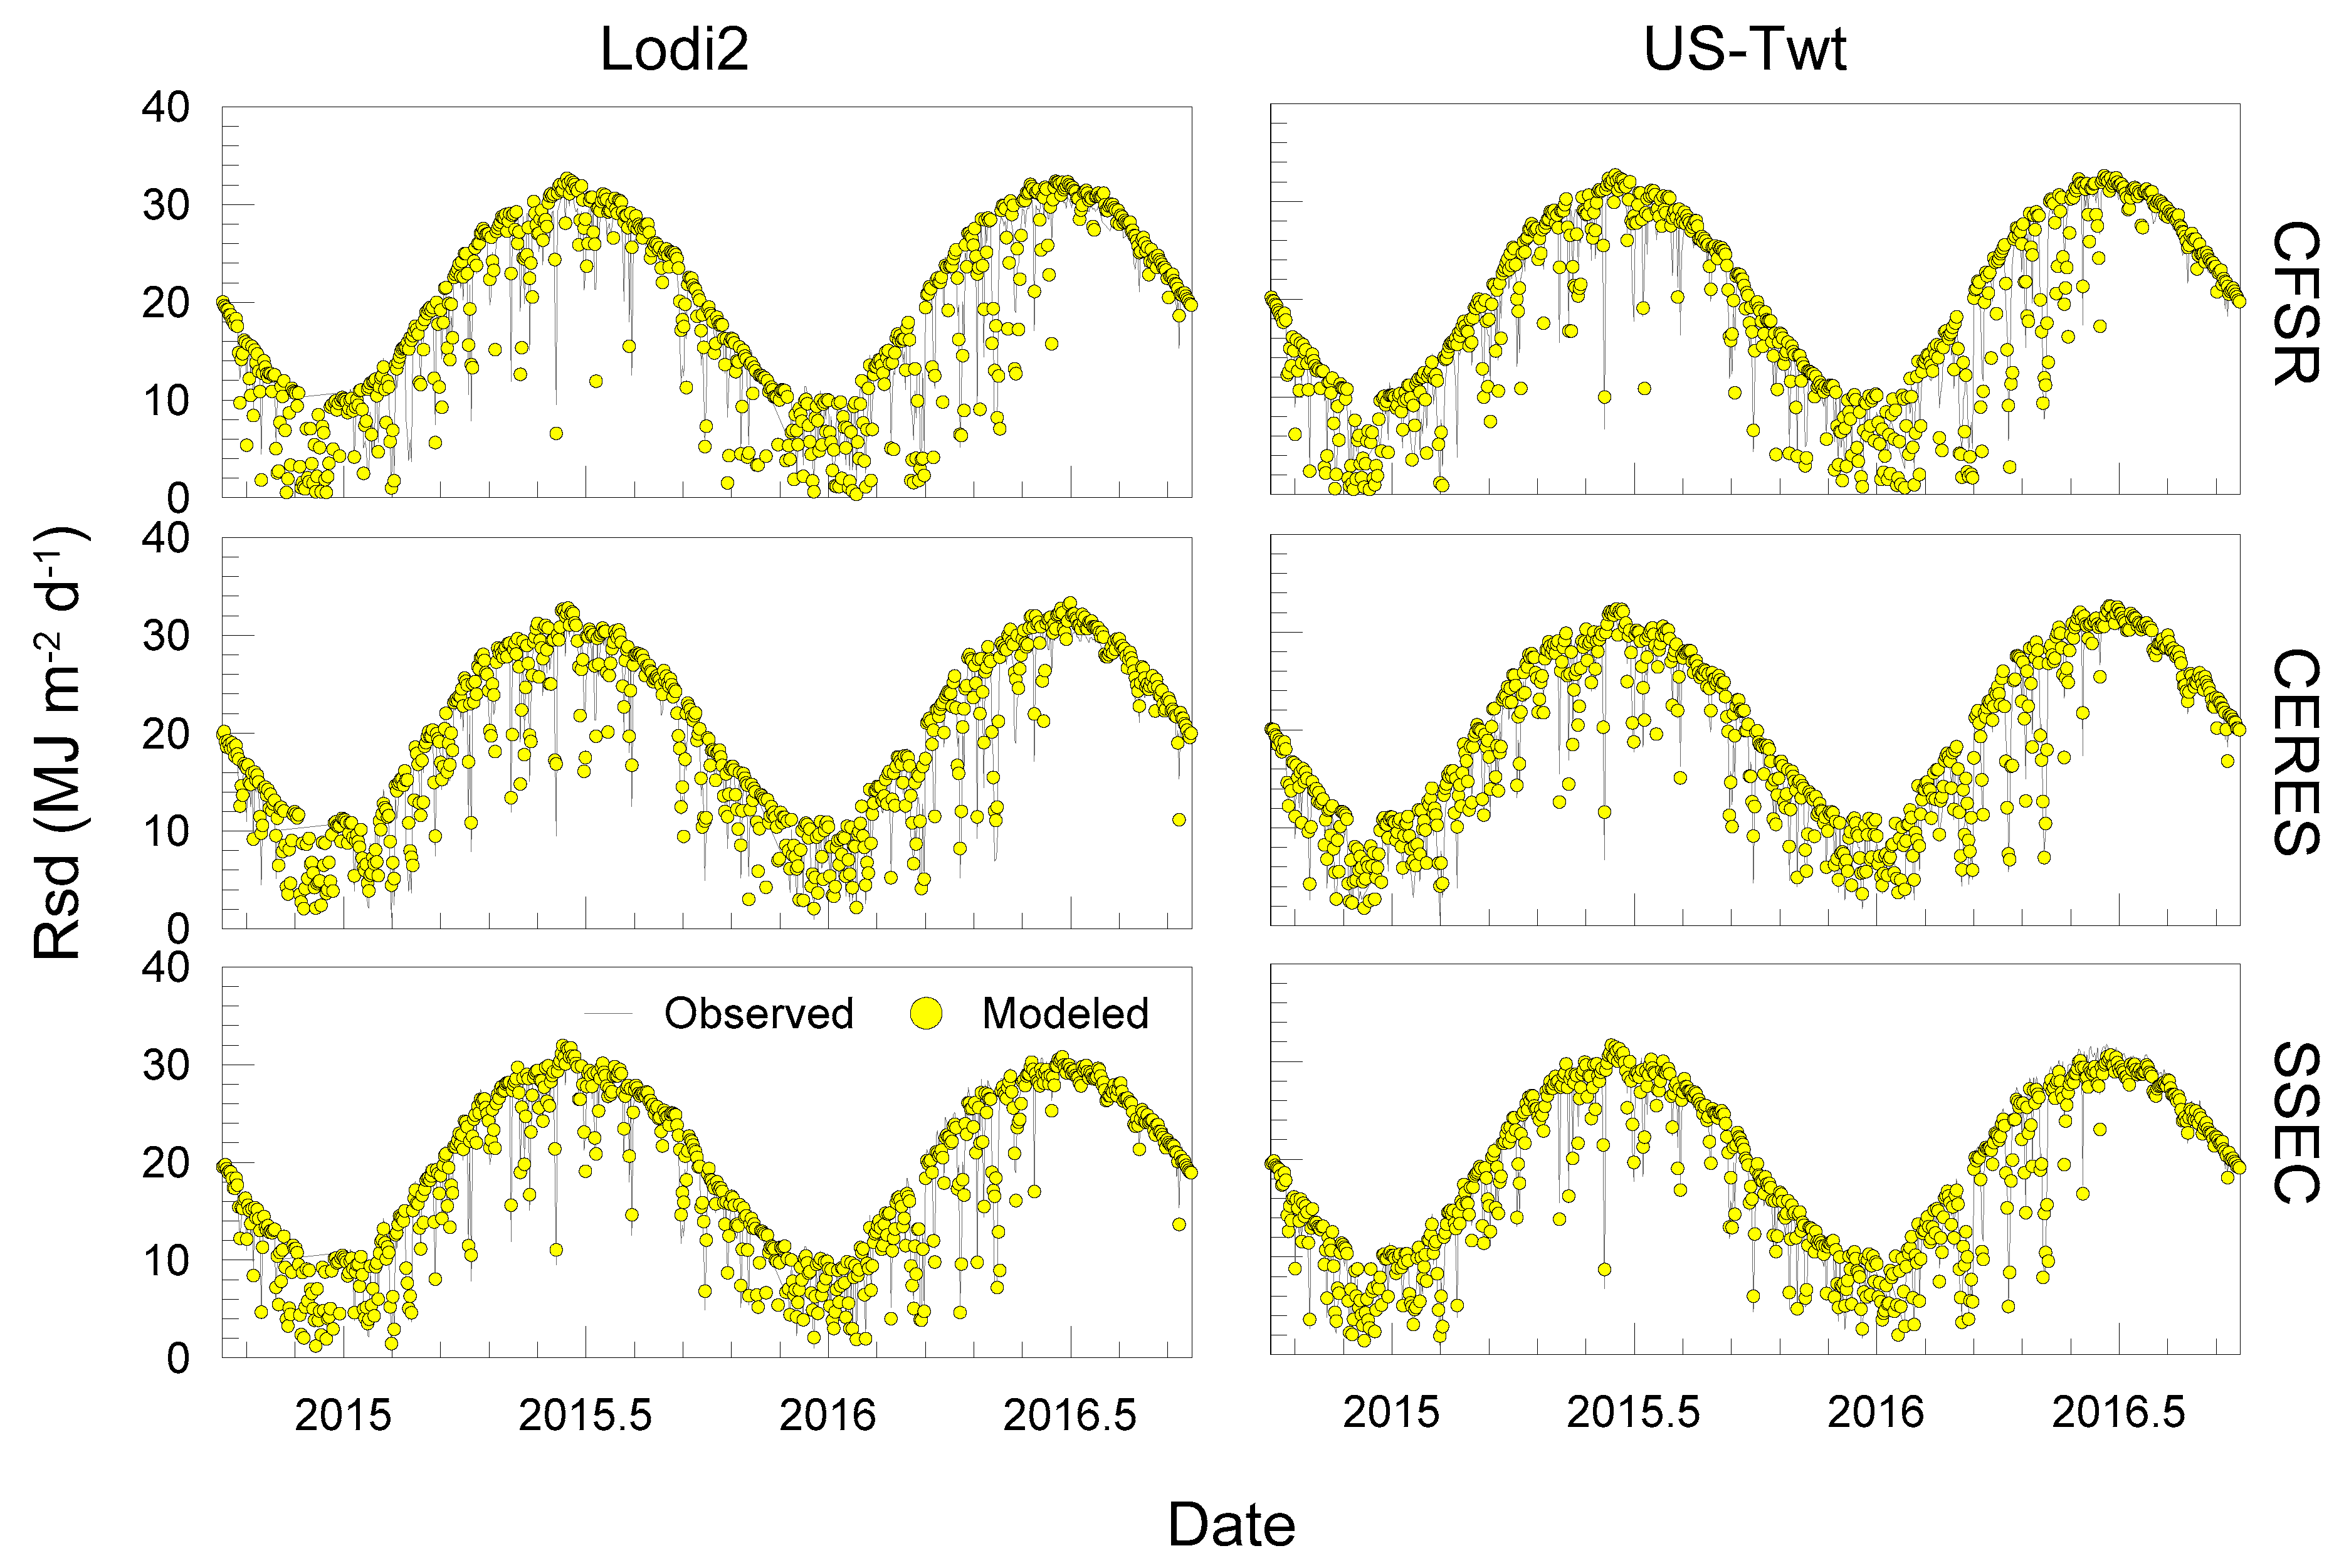
3.1. Insolation Product Evaluation at the Flux Tower Sites
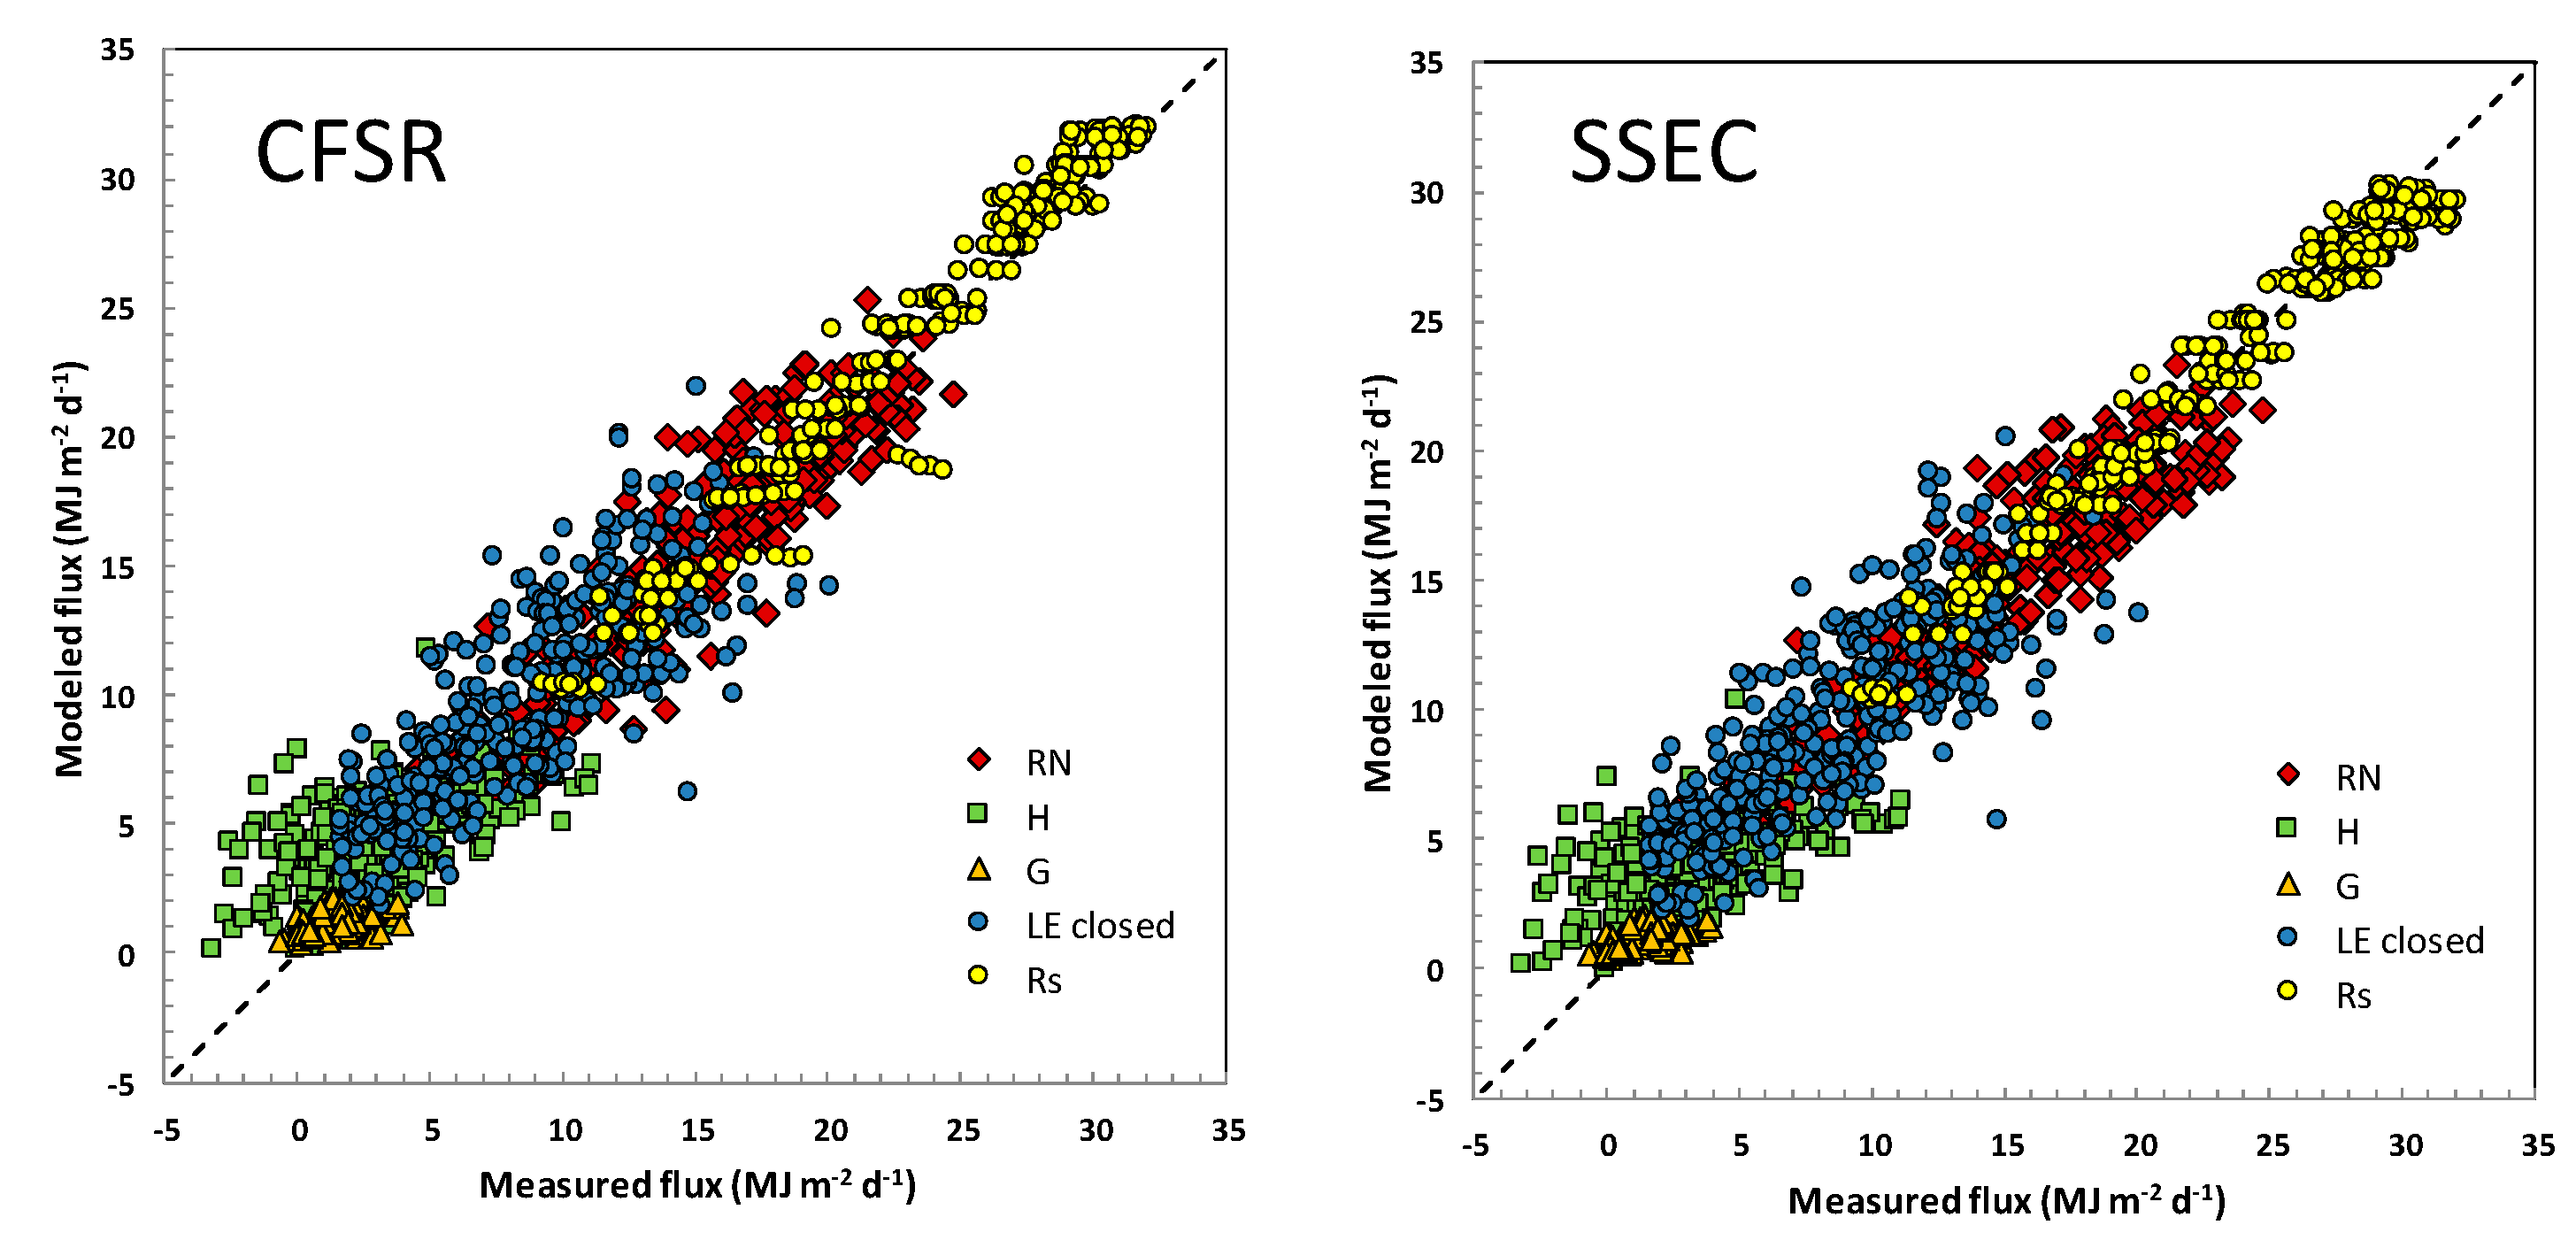
3.2. Energy Balance on Landsat Dates
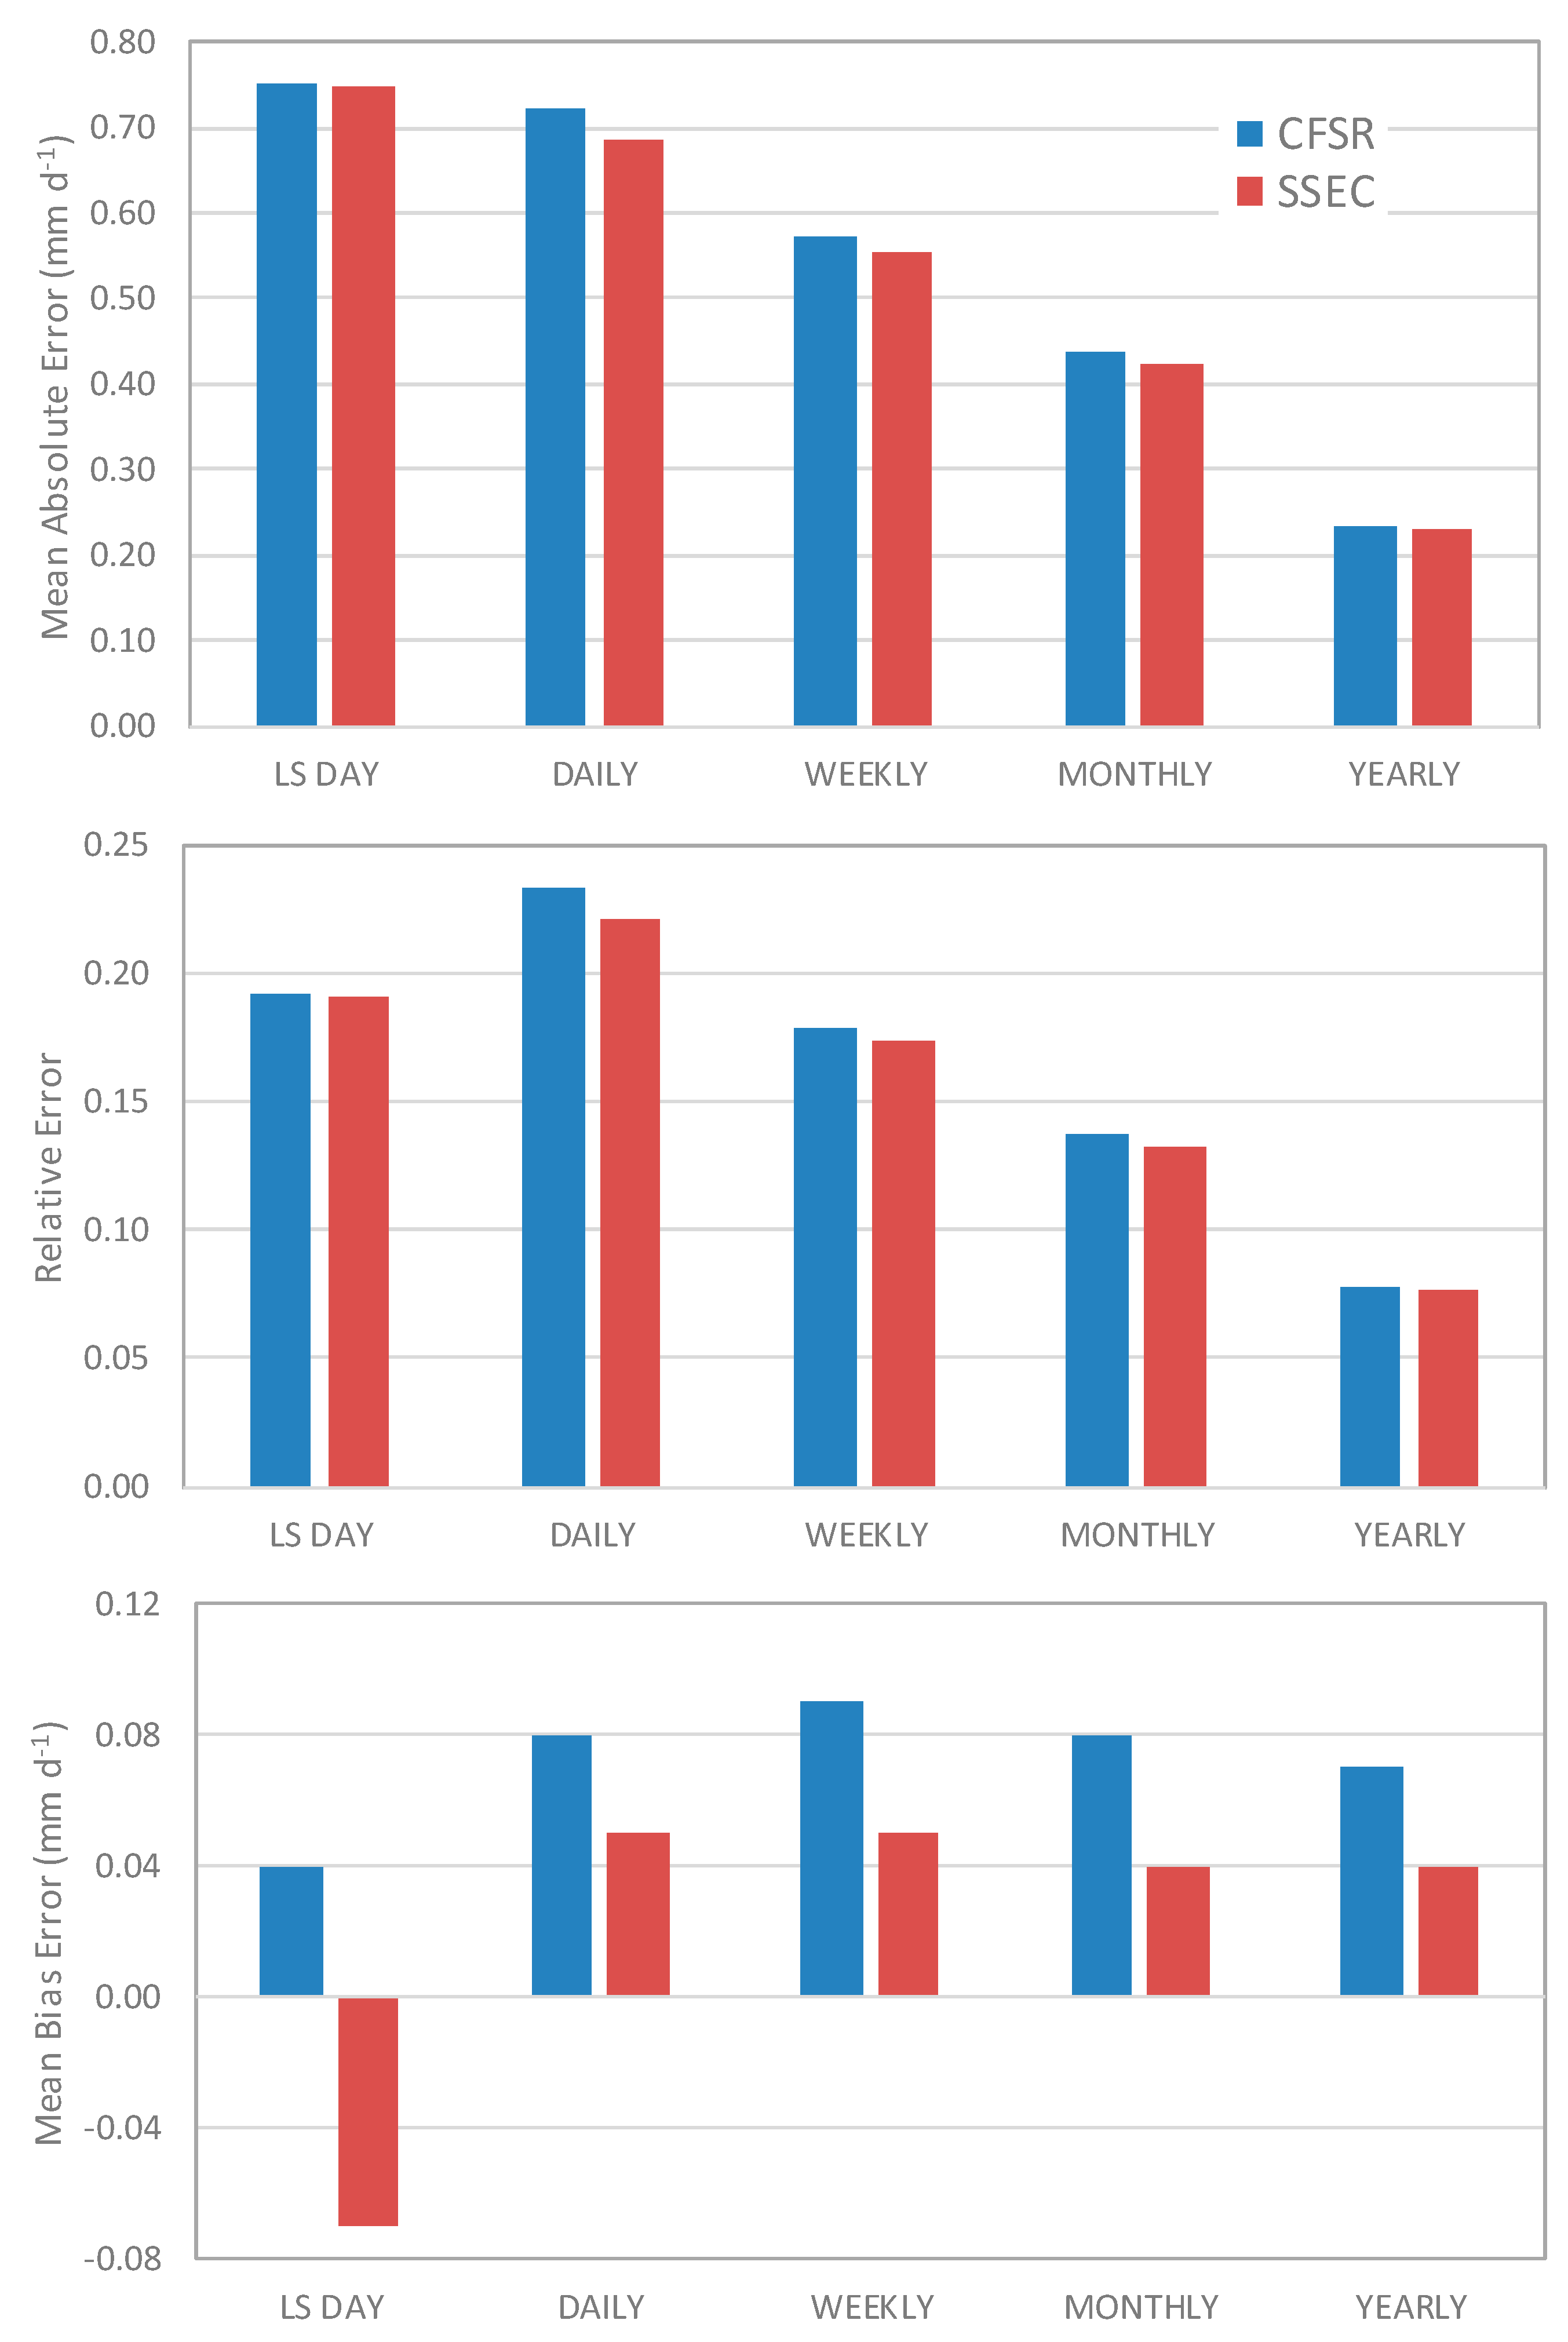
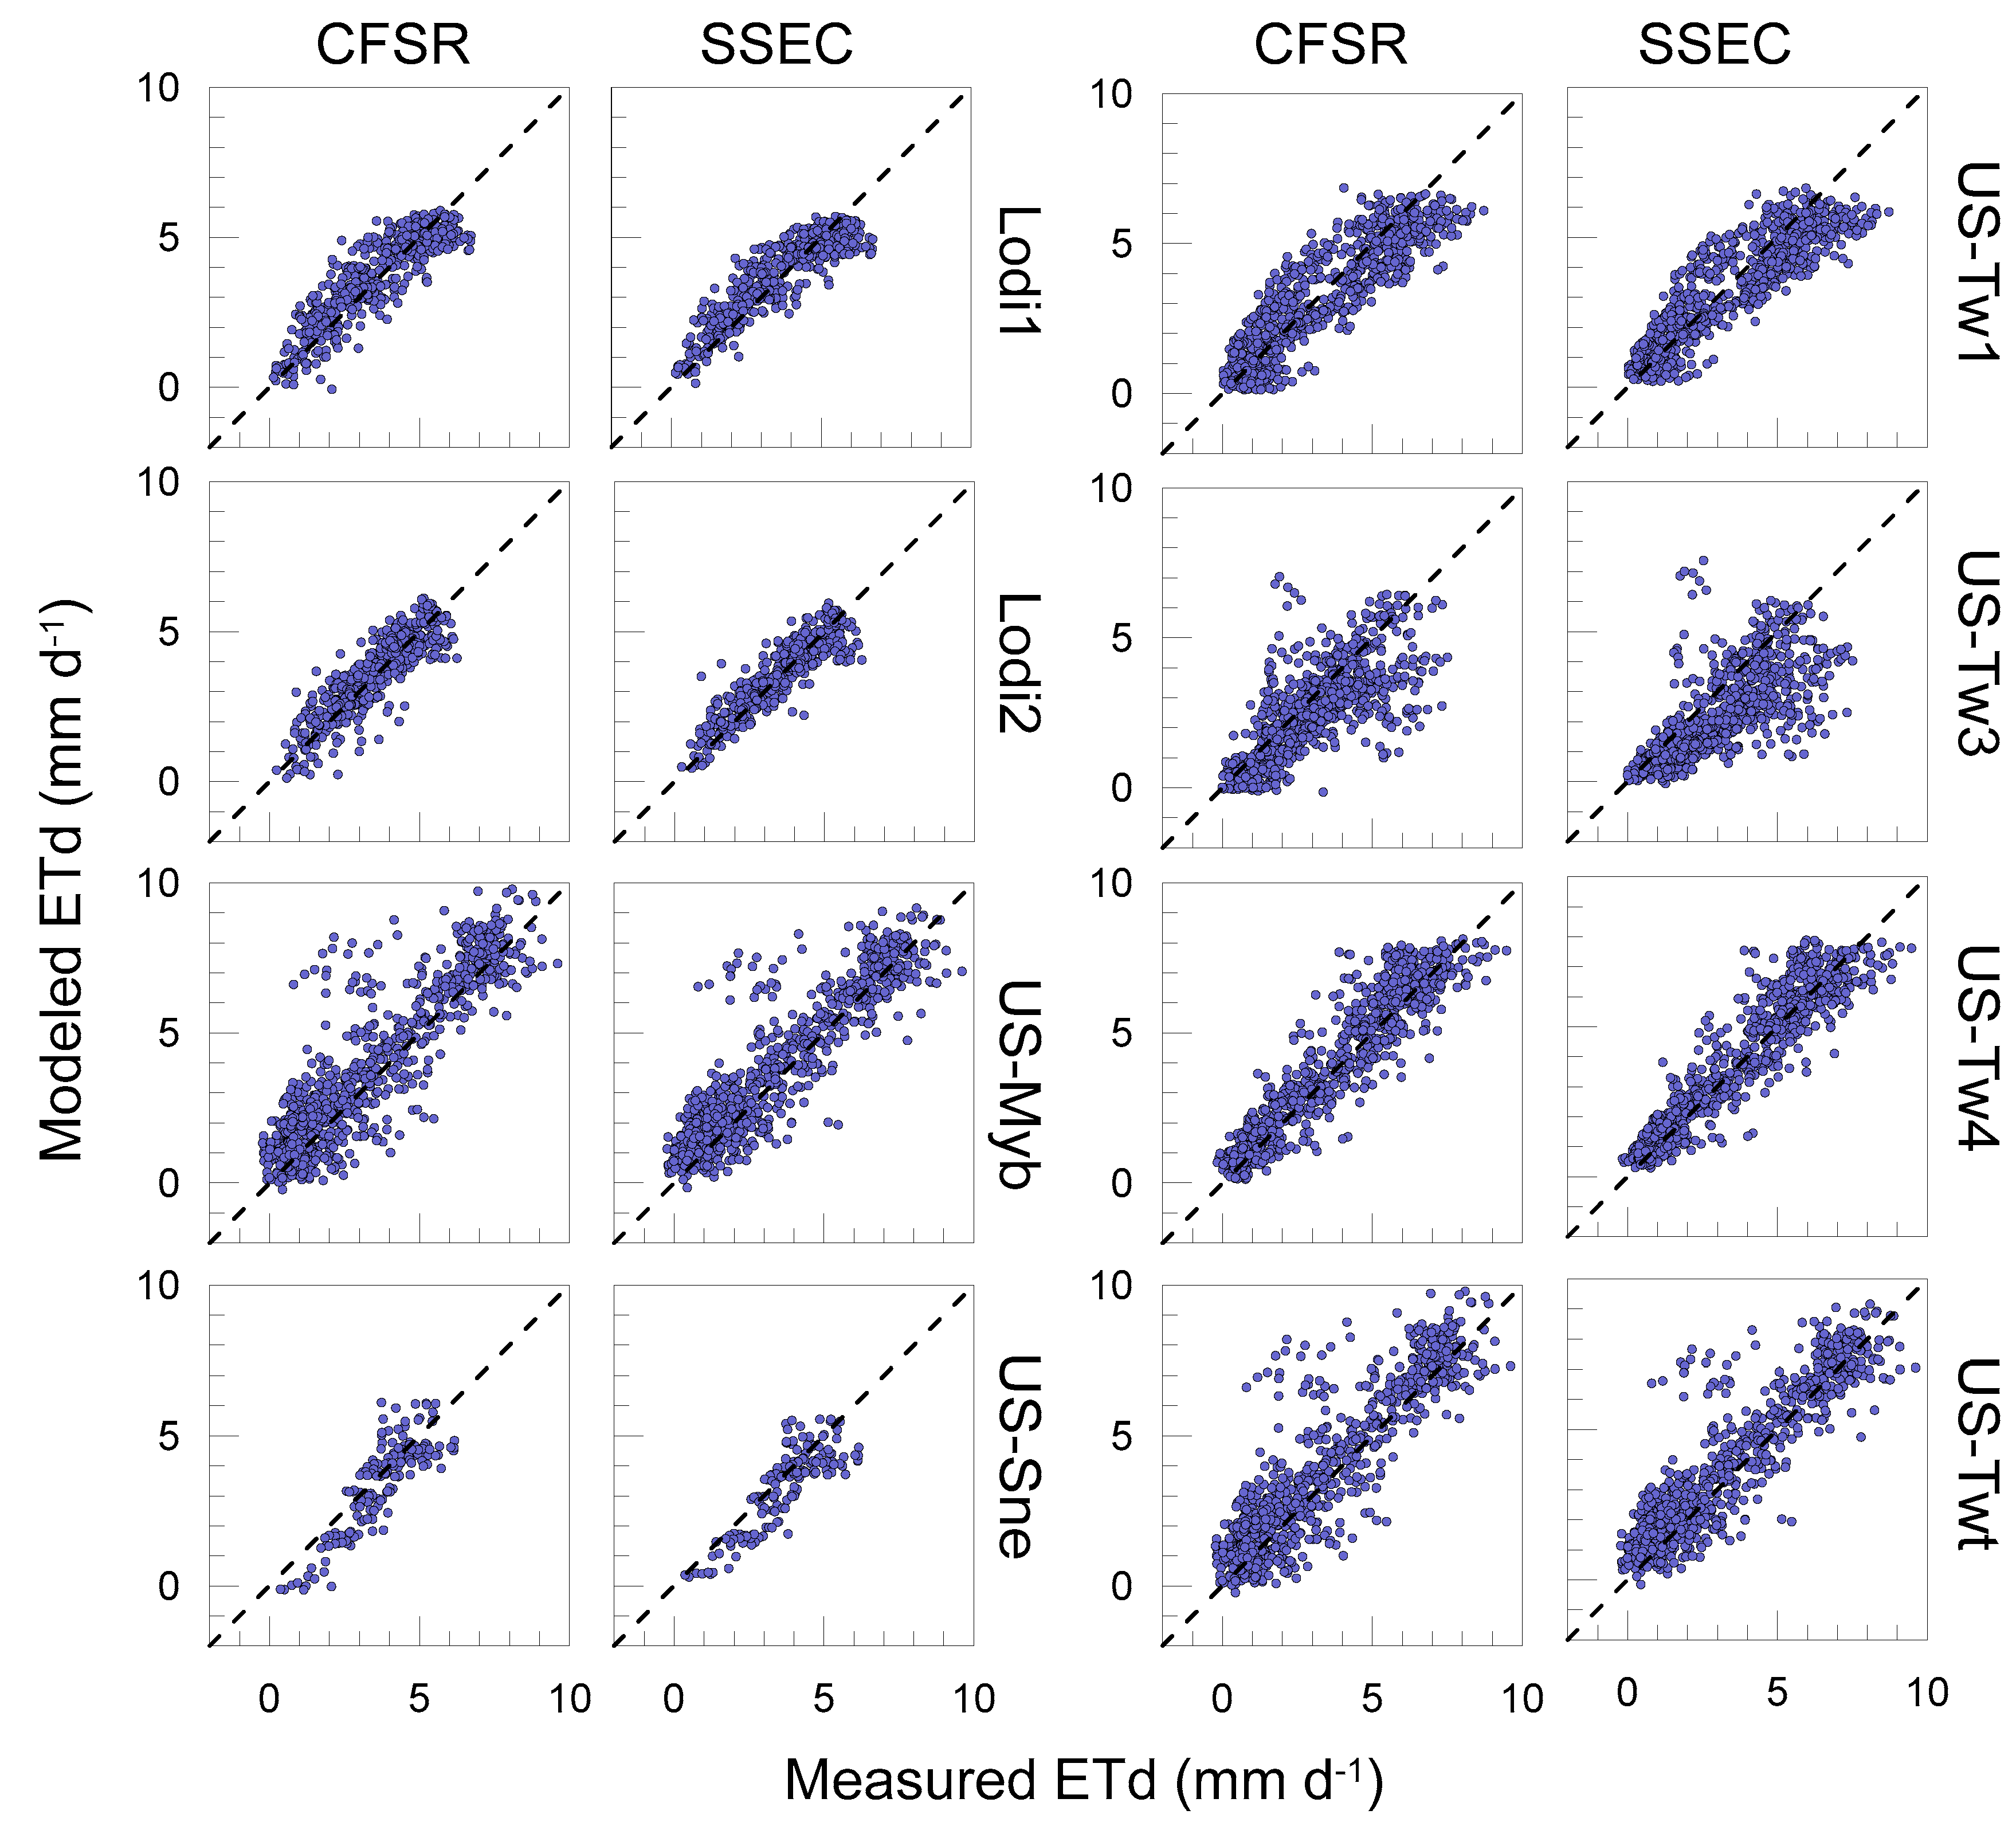
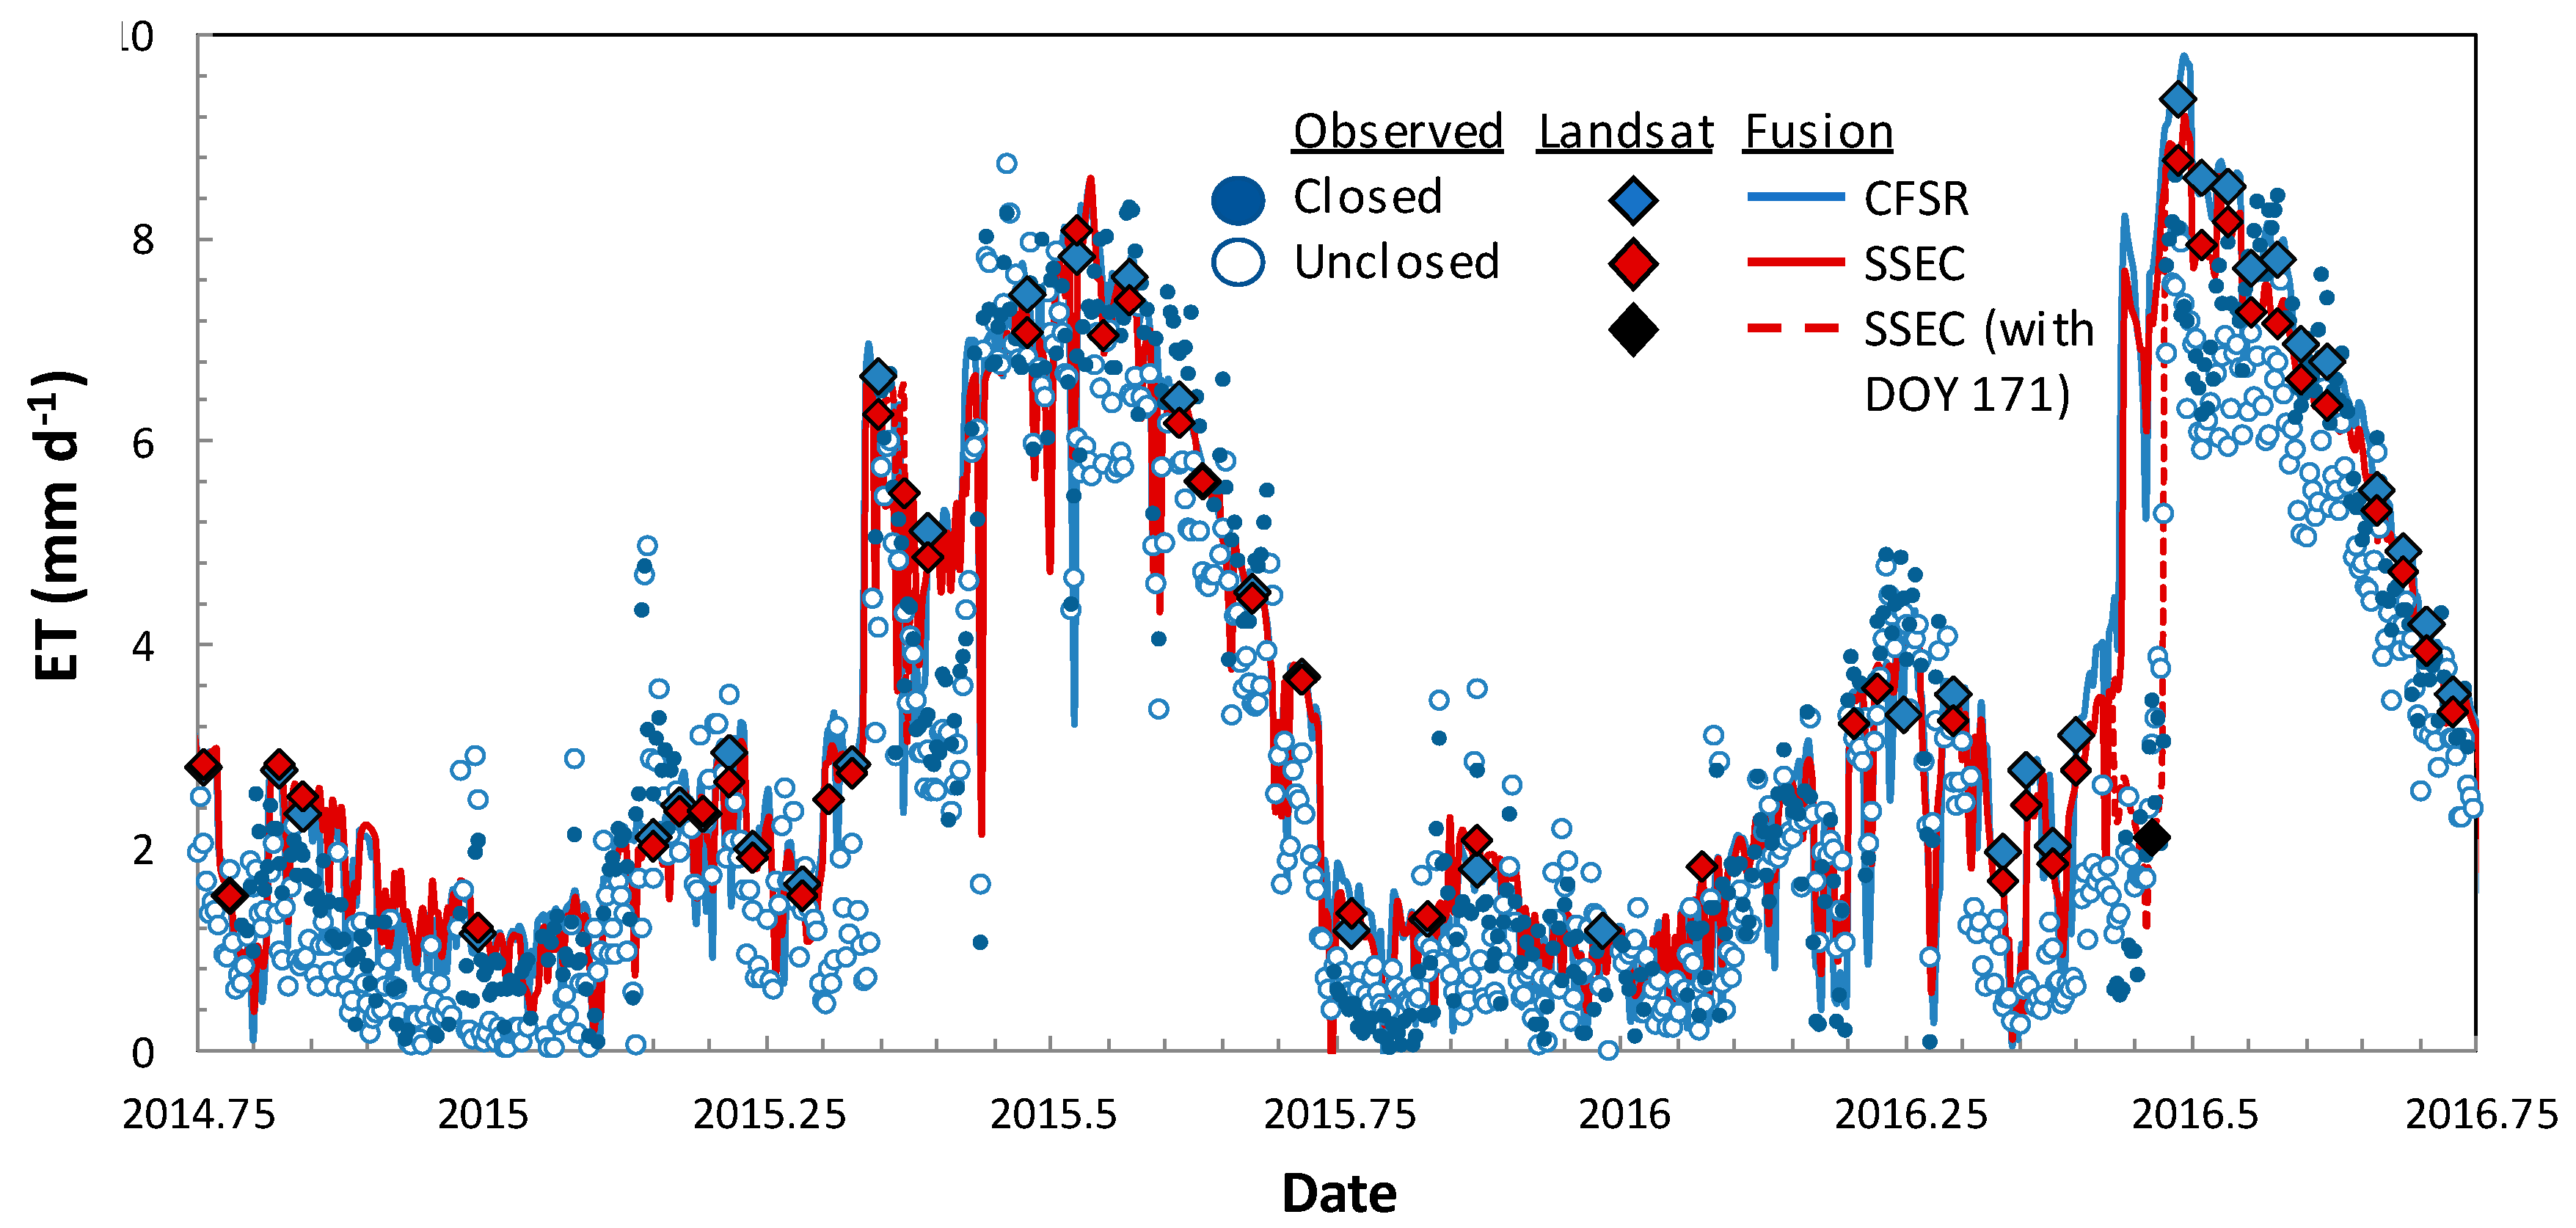
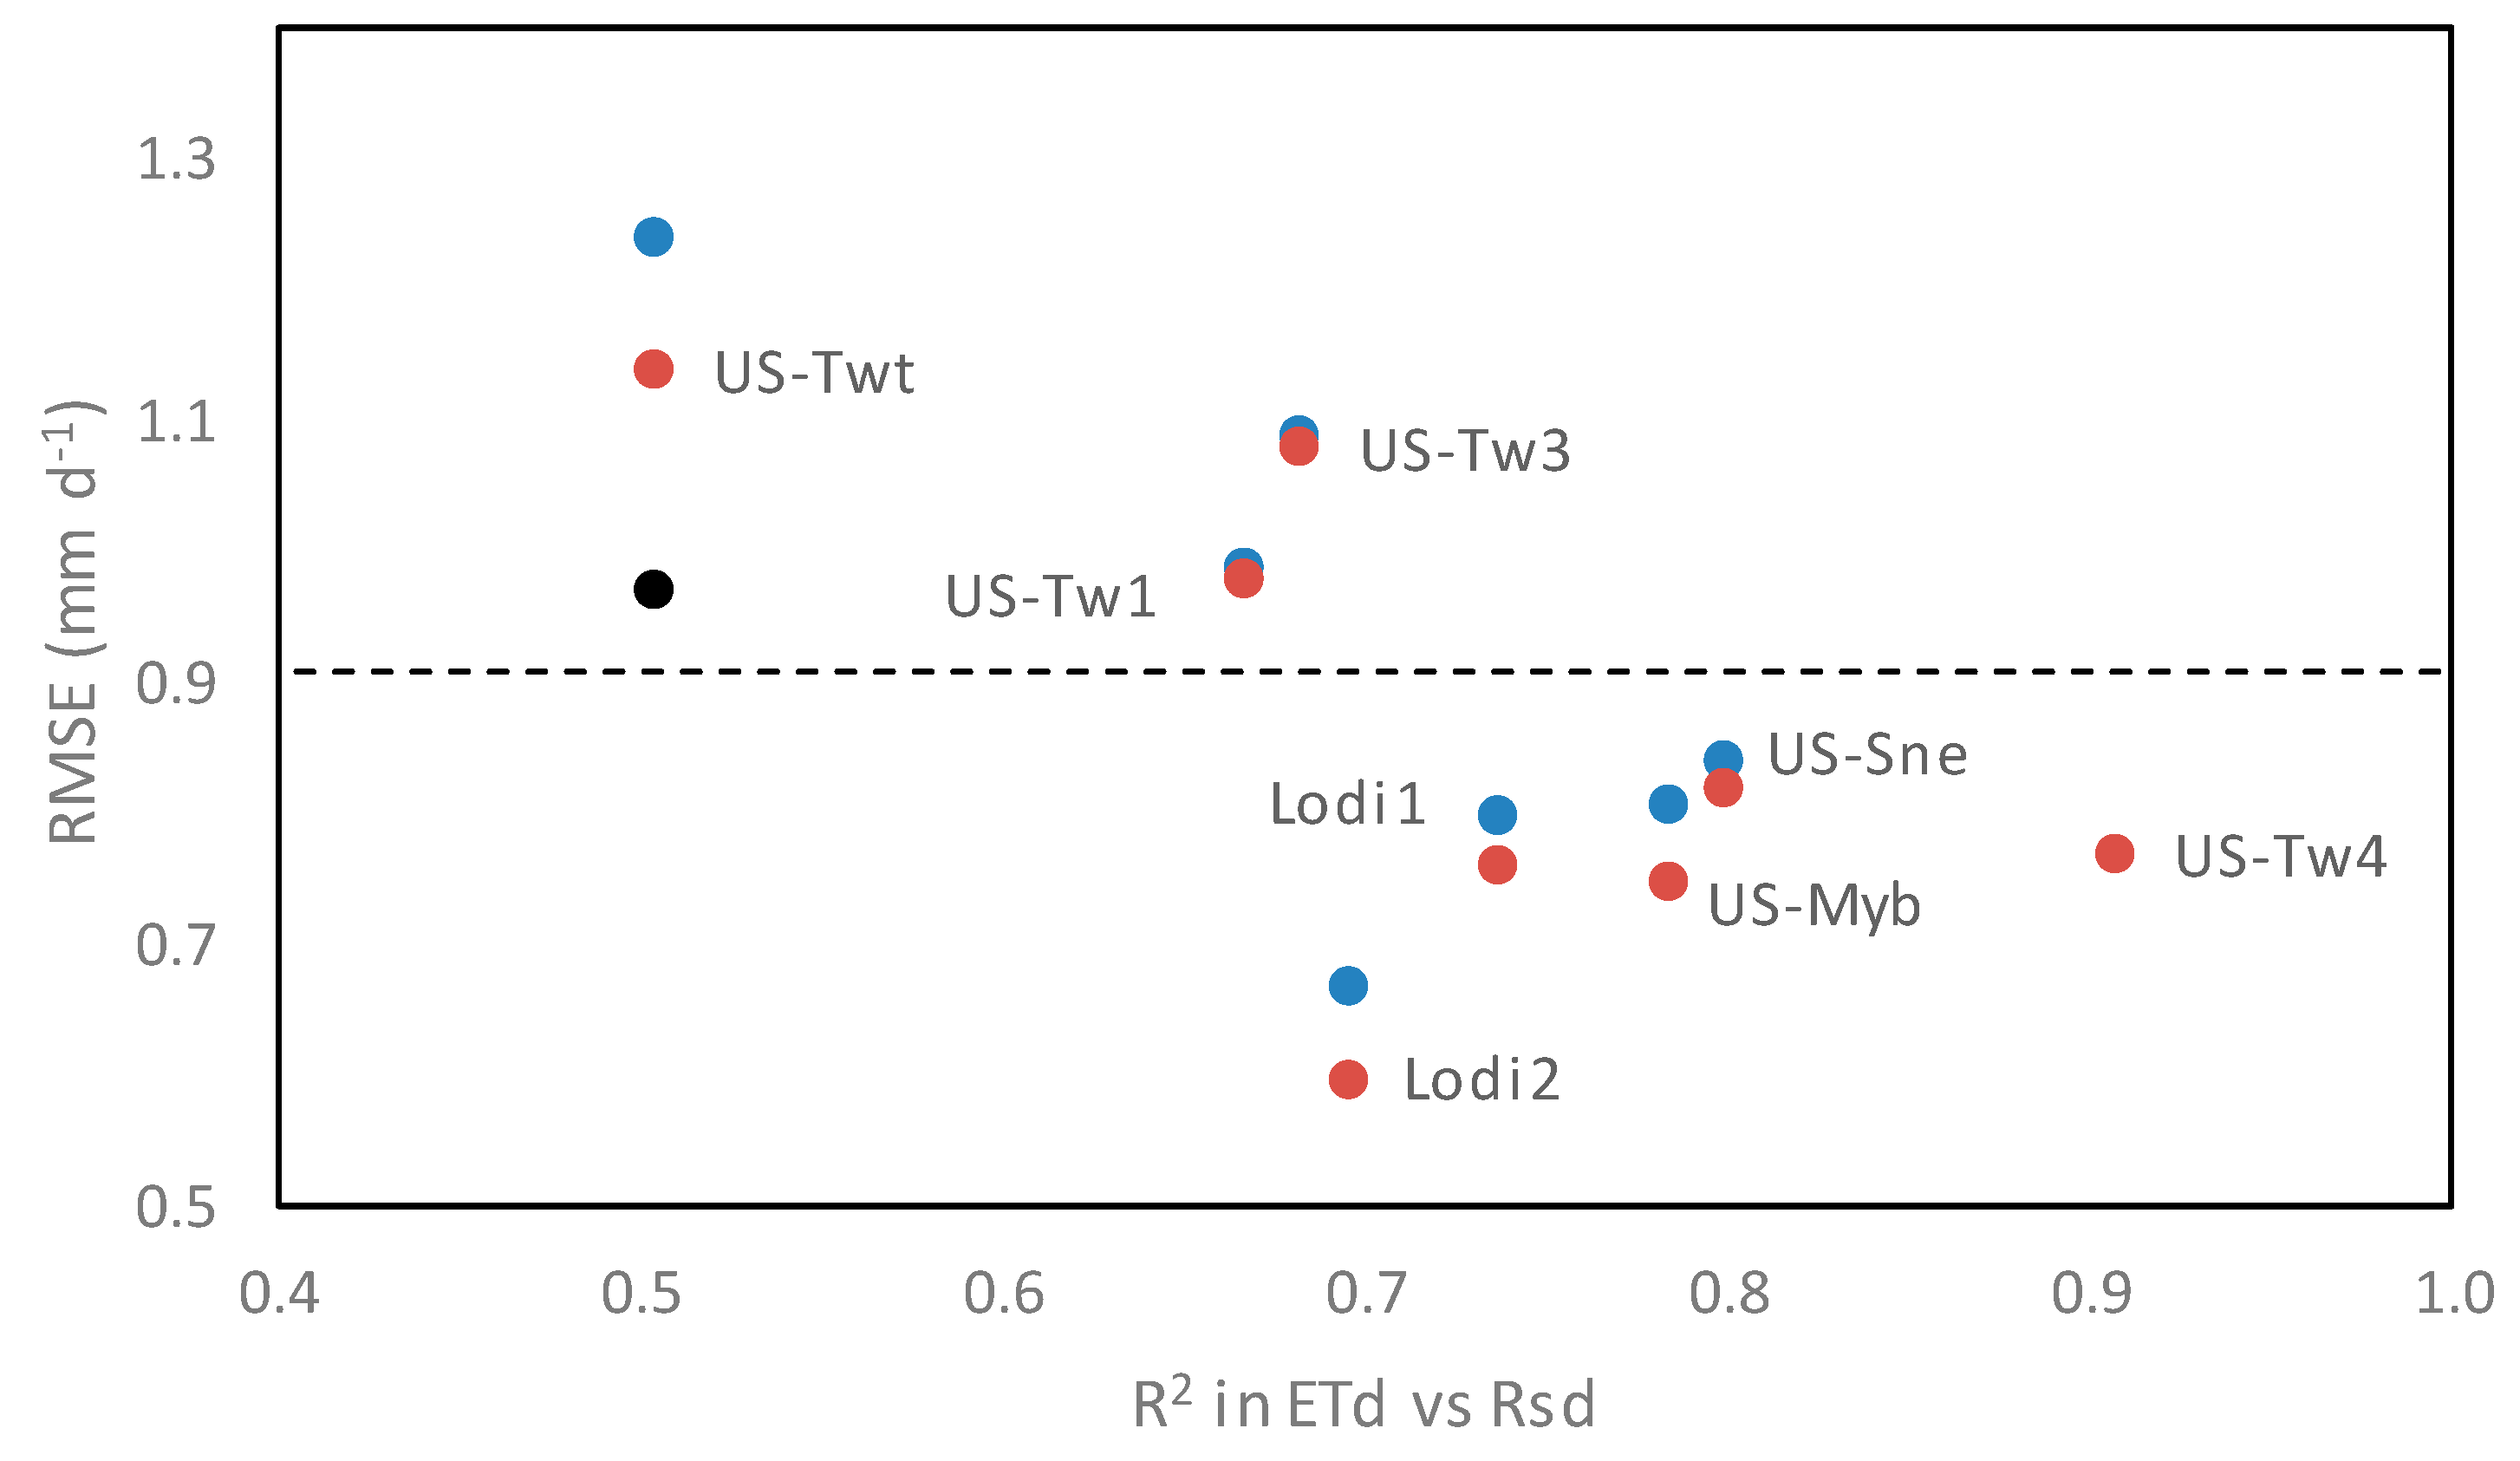
3.3. Daily ET from Data Fusion
4. Discussion
4.1. How Representative Are These Results?
4.2. Which Is the Optimal Insolation Datasource?
5. Conclusions
Author Contributions
Funding
Acknowledgments
Conflicts of Interest
References
- Fisher, J.B.; Melton, F.S.; Middleton, E.M.; Hain, C.R.; Anderson, M.C.; Allen, R.G.; McCabe, M.F.; Hook, S.; Baldocchi, D.D.; Townsend, P.A.; et al. The future of evapotranspiration: Global requirements for ecosystem functioning, carbon and climate feedbacks, agricultural management, and water resources. Water Resour. Res. 2017, 53, 2618–2626. [Google Scholar] [CrossRef] [Green Version]
- Garcia Garcia, L.E.; Rodriguez, D.J.; Wijnen, M.M.P.; Pakulski, I.; Serrat Capdevila, A.; Garcia Ramirez, D.A.; Tayebi, N.; Guerschman, J.P.; Donohue, R.J.; Niel, T.G.V.; et al. Earth Observation for Water Resources Management: Current Use and Future Opportunities for the Water Sector; The World Bank: Washington, DC, USA, 2016; pp. 33–38. [Google Scholar]
- Monteith, J.L. Evaporation and Environment. Symp. Soc. Exp. Biol. 1965, 19, 205–234. [Google Scholar]
- Priestley, C.H.B.; Taylor, R.J. On the assessment of surface heat flux and evaporation using large-scale parameters. Mon. Weather Rev. 1972, 100, 81–92. [Google Scholar] [CrossRef]
- Anderson, M.C.; Kustas, W.P.; Norman, J.M.; Hain, C.R.; Mecikalski, J.R.; Schultz, L.; Gonzalez-Dugo, M.P.; Cammalleri, C.; d’Urso, G.; Pimstein, A.; et al. Mapping daily evapotranspiration at field to continental scales using geostationary and polar orbiting satellite imagery. Hydrol. Earth Syst. Sci. 2011, 15, 223–239. [Google Scholar] [CrossRef] [Green Version]
- Yang, Y.; Anderson, M.C.; Gao, F.; Hain, C.; Kustas, W.P.; Meyers, T.; Crow, W.; Finocchiaro, R.G.; Otkin, J.A.; Sun, L.; et al. Impact of tile drainage on evapotranspiration (ET) in South Dakota, USA based on high spatiotemporal resolution et timeseries from a multi-satellite data fusion system. J. Sel. Top. Appl. Earth Obs. Remote Sens. 2017, 10, 2550–2564. [Google Scholar] [CrossRef]
- Yang, Y.; Anderson, M.C.; Gao, F.; Hain, C.R.; Semmens, K.A.; Kustas, W.P.; Normeets, A.; Wynne, R.H.; Thomas, V.A.; Sun, G. Daily Landsat-scale evapotranspiration estimation over a managed pine plantation in North Carolina, USA using multi-satellite data fusion. Hydrol. Earth Syst. Sci. 2017, 21, 1017–1037. [Google Scholar] [CrossRef]
- Yang, Y.; Anderson, M.C.; Gao, F.; Wardlow, B.; Hain, C.R.; Otkin, J.A.; Yang, Y.; Sun, L.; Dulaney, W. Field-scale mapping of evaporative stress indicators of crop yield: An application over Mead, NE. Remote Sens. Environ. 2018, 210, 387–402. [Google Scholar] [CrossRef]
- Knipper, K.R.; Kustas, W.P.; Anderson, M.C.; Alfieri, J.G.; Prueger, J.H.; Hain, C.R.; Gao, F.; Yang, Y.; McKee, L.G.; Nieto, H.; et al. Evapotranspiration estimates derived using thermal-based satellite remote sensing and data fusion for irrigation management in California vineyards. Irrig. Sci. 2018, in press. [Google Scholar] [CrossRef]
- Medellín-Azuara, J.; Paw U, K.T.; Jin, Y.; Kent, E.; Clay, J.; Wong, A.; Bell, A.; Anderson, M.; Howes, D.; Melton, F.S.; et al. A comparative study for estimating crop evapotranspiration in the Sacramento-San Joaquin Delta. 2018. Available online: https://watershed.ucdavis.edu/project/delta-et (accessed on 21 December 2018).
- Kustas, W.P.; Anderson, M.C.; Alfieri, J.G.; Knipper, K.; Torres-Rua, A.; Parry, C.K.; Nieto, H.; Agam, N.; White, A.; Gao, F.; et al. The Grape Remote sensing Atmospheric Profile and Evapotranspiration eXperiment. Bull. Am. Meteorol. Soc. 2018, 99, 1791–1812. [Google Scholar] [CrossRef]
- Anderson, M.C.; Gao, F.; Knipper, K.; Hain, C.; Dulaney, W.; Baldocchi, D.D.; Eichelmann, E.; Hemes, K.S.; Yang, Y.; Medellín-Azuara, J.; et al. Field-scale assessment of land and water use change over the California Delta using remote sensing. Remote Sens. 2018, 10, 889. [Google Scholar] [CrossRef]
- Eichelmann, E.; Hemes, K.S.; Knox, S.H.; Oikawa, P.; Chamberlain, S.D.; Sturtevant, C.; Verfaillie, J.; Baldocchi, D.D. The effect of land cover type and structure on evapotranspiration from agricultural and wetland sites in the Sacramento/San Joaquin River Delta, California. Agric. For. Meteorol. 2018, 256–257, 179–195. [Google Scholar] [CrossRef]
- Anderson, M.C.; Kustas, W.P.; Alfieri, J.G.; Hain, C.R.; Prueger, J.H.; Evett, S.R.; Colaizzi, P.D.; Howell, T.A.; Chavez, J.L. Mapping daily evapotranspiration at landsat spatial scales during the BEAREX’08 field campaign. Adv. Water Resour. 2012, 50, 162–177. [Google Scholar] [CrossRef]
- Cammalleri, C.; Anderson, M.C.; Gao, F.; Hain, C.R.; Kustas, W.P. A data fusion approach for mapping daily evapotranspiration at field scale. Water Resour. Res. 2013, 49, 1–15. [Google Scholar] [CrossRef]
- Cammalleri, C.; Anderson, M.C.; Gao, F.; Hain, C.R.; Kustas, W.P. Mapping daily evapotranspiration at field scales over rainfed and irrigated agricultural areas using remote sensing data fusion. Agric. For. Meteorol. 2014, 186, 1–11. [Google Scholar] [CrossRef] [Green Version]
- Norman, J.M.; Kustas, W.P.; Humes, K.S. A two-source approach for estimating soil and vegetation energy fluxes from observations of directional radiometric surface temperature. Agric. For. Meteorol. 1995, 77, 263–293. [Google Scholar] [CrossRef]
- Kustas, W.P.; Norman, J.M. Use of remote sensing for evapotranspiration monitoring over land surfaces. Hydrol. Sci. J. 1996, 41, 495–516. [Google Scholar] [CrossRef] [Green Version]
- Kustas, W.P.; Norman, J.M. Evaluation of soil and vegetation heat flux predictions using a simple two-source model with radiometric temperatures for partial canopy cover. Agric. For. Meteorol. 1999, 94, 13–29. [Google Scholar] [CrossRef]
- Campbell, G.S.; Norman, J.M. An Introduction to Environmental Biophysics; Springer: New York, NY, USA, 1998. [Google Scholar]
- Anderson, M.C.; Norman, J.M.; Meyers, T.P.; Diak, G.R. An analytical model for estimating canopy transpiration and carbon assimilation fluxes based on canopy light-use efficiency. Agric. For. Meteorol. 2000, 101, 265–289. [Google Scholar] [CrossRef]
- Weiss, A.; Norman, J.M. Partitioning solar radiation into direct and diffuse, visible and near-infrared components. Agric. For. Meteorol. 1985, 34, 205–213. [Google Scholar] [CrossRef]
- Anderson, M.C.; Norman, J.M.; Diak, G.R.; Kustas, W.P.; Mecikalski, J.R. A two-source time-integrated model for estimating surface fluxes using thermal infrared remote sensing. Remote Sens. Environ. 1997, 60, 195–216. [Google Scholar] [CrossRef]
- Diak, G.R.; Whipple, M.S. Improvements to models and methods for evaluating the land-surface energy balance and ‘effective’ roughness using radiosonde reports and satellite-measured skin temperature data. Agric. For. Meteor. 1993, 63, 189–218. [Google Scholar] [CrossRef]
- Norman, J.M.; Anderson, M.C.; Kustas, W.P.; French, A.N.; Mecikalski, J.R.; Torn, R.D.; Diak, G.R.; Schmugge, T.J.; Tanner, B.C.W. Remote sensing of surface energy fluxes at 101-m pixel resolutions. Water Resour. Res. 2003, 39. [Google Scholar] [CrossRef]
- Anderson, M.C.; Norman, J.M.; Mecikalski, J.R.; Torn, R.D.; Kustas, W.P.; Basara, J.B. A multi-scale remote sensing model for disaggregating regional fluxes to micrometeorological scales. J. Hydrometeor. 2004, 5, 343–363. [Google Scholar] [CrossRef]
- Cammalleri, C.; Anderson, M.C.; Kustas, W.P. Upscaling of evapotranspiration fluxes from instantaneous to daytime scales for thermal remote sensing applications. Hydrol. Earth Syst. Sci. 2014, 18, 1885–1894. [Google Scholar] [CrossRef] [Green Version]
- Ryu, Y.; Baldocchi, D.D.; Black, T.A.; Detto, M.; Law, B.E.; Leuning, R.; Miyata, A.; Reichstein, M.; Vargas, R.; Amman, C.; et al. On the temporal upscaling of evapotranspiration from instantaneous remote sensing measurements to 8-day mean daily-sums. Agric. For. Meteorol. 2012, 152, 212–222. [Google Scholar] [CrossRef] [Green Version]
- Holmes, T.; Hain, C.; Crow, W.; Anderson, M.C.; Kustas, W.P. Microwave implementation of two-source energy balance approach for estimating evapotranspiration. Hydrol. Earth Syst. Sci. 2018, 22, 1351–1369. [Google Scholar] [CrossRef]
- Gao, F.; Masek, J.; Schwaller, M.; Hall, F.G. On the blending of the Landsat and MODIS surface reflectance: Predicting daily Landsat surface reflectance. IEE Trans. Geosci. Remote. Sens. 2006, 44, 2207–2218. [Google Scholar]
- Semmens, K.A.; Anderson, M.C.; Kustas, W.P.; Gao, F.; Alfieri, J.G.; McKee, L.; Prueger, J.H.; Hain, C.R.; Cammalleri, C.; Yang, Y.; et al. Monitoring daily evapotranspiration over two California vineyards using Landsat 8 in a multi-sensor data fusion approach. Remote Sens. Environ. 2015. [Google Scholar] [CrossRef]
- Sun, L.; Anderson, M.C.; Gao, F.; Hain, C.R.; Alfieri, J.G.; Sharifi, A.; McCarty, G.; Yang, Y.; Yang, Y. Investigating water use over the Choptank River watershed using a multi-satellite data fusion approach. Water Resour. Res. 2017, 53, 5298–5319. [Google Scholar] [CrossRef]
- Carpintero, E.; González-Dugo, M.P.; Hain, C.; Gao, F.; Andreu, A.; Kustas, W.P.; Anderson, M.C. Continuous evapotranspiration monitoring and water stress at watershed scale in a mediterranean oak savanna. Proc. SPIE 2016, 9998, 99980N. [Google Scholar] [CrossRef]
- Saha, S.; Moorthi, S.; Pan, H.-L.; Wu, X.; Coauthors. The NCEP Climate Forecast System Reanalysis. Bull. Am. Meteorol. Soc. 2010, 91, 1015–1057. [Google Scholar] [CrossRef]
- Dee, D.P.; Balmaseda, M.; Engelen, R.; Simmons, A.J.; Thépaut, J.M. Toward a consistent reanalysis of the climate system. Bull. Am. Meteorol. Soc. 2013, 95, 1235–1248. [Google Scholar] [CrossRef]
- Chou, M.D.; Suarez, M.J.; Ho, C.H.; Yan, M.M.H.; Lee, K.T. Parameterizations for cloud overlapping and shortwave single-scattering properties for use in general circulation and cloud ensemble models. J. Clim. 1998, 11, 202–214. [Google Scholar] [CrossRef]
- Hou, Y.; Moorthi, S.; Campana, K. Parameterization of Solar Radiation Transfer in the NCEP Models; NCEP Office Note 441; NCEP: Camp Spring, MD, USA, 2002; 46p.
- Diak, G.R. Investigations of improvements to an operational GOES-satellite-data-based insolation system using pyranometer data from the U.S. Climate Reference Network (USCRN). Remote Sens. Environ. 2017, 195, 79–95. [Google Scholar] [CrossRef]
- Lazzara, M.A.; Benson, J.M.; Fox, R.J.; Laitsch, D.J.; Rueden, J.P.; Santek, D.A.; Wade, D.M.; Whittaker, T.M.; Young, J.T. The man computer interactive data access system: 25 years of interactive processing. Bull. Am. Meteorol. Soc. 1999, 80, 271–284. [Google Scholar] [CrossRef]
- Mecikalski, J.M.; Diak, G.R.; Anderson, M.C.; Norman, J.M. Estimating fluxes on continental scales using remotely-sensed data in an atmosphere-land exchange model. J. Appl. Meteorol. 1999, 38, 1352–1369. [Google Scholar] [CrossRef]
- Mecikalski, J.R.; Sumner, D.M.; Jacobs, J.M.; Pathak, C.S.; Paech, S.; Douglas, E.M. Use of visible geostationary operational meteorological satellite imagery in mapping reference and potential evapotranspiration over Florida. In Evapotranspiration; Labedzki, L., Ed.; IntechOpen: London, UK, 2011; pp. 229–254. [Google Scholar]
- Anderson, M.C.; Norman, J.M.; Mecikalski, J.R.; Otkin, J.A.; Kustas, W.P. A climatological study of evapotranspiration and moisture stress across the continental U.S. based on thermal remote sensing: I. Model formulation. J. Geophys. Res. 2007, 112, D10117. [Google Scholar] [CrossRef]
- Teegavarapu, R.S.V.; Pathak, C.S.; Mecikalski, J.R.; Srikishen, J. Optimal solar radiation sensor network design using spatial and geostatistical analyses. J. Spat. Sci. 2016, 61, 69–97. [Google Scholar] [CrossRef]
- Diak, G.R.; Anderson, M.C.; Bland, W.L.; Norman, J.M.; Mecikalski, J.M.; Aune, R.M. Agricultural management decision aids driven by real-time satellite data. Bull. Am. Meteorol. Soc. 1998, 79, 1345–1355. [Google Scholar] [CrossRef]
- Diak, G.R.; Gautier, C. Improvements to a simple physical model for estimating insolation from GOES data. J. Clim. Appl. Meteorol. 1983, 22, 505–508. [Google Scholar] [CrossRef]
- Gautier, C.; Landsfeld, M. Surface solar radiation flux and cloud radiative forcing for the Atmospheric Radiation Measurement (ARM) Southern Great Plains (SGP): A satellite, surface observations, and radiative transfer model study. J. Atmos. Sci. 1997, 54, 1289–1307. [Google Scholar] [CrossRef]
- Paech, S.J.; Mecikalski, J.R.; Sumner, D.M.; Pathak, C.S.; Wu, Q.; Islam, S.; Sangoyomi, T. A calibrated, high-resolution GOES satellite solar insolation product for a climatology of Florida evapotranspiration. J. Am. Water Resour. Assoc. 2009, 45, 1328–1342. [Google Scholar] [CrossRef]
- Wonsick, M.M.; Pinker, R.T.; Meng, W.; Nguyen, L. Evaluation of surface shortwave flux estimates from GOES: Sensitivity to sensor calibration. J. Atmos. Ocean. Technol. 2006, 23, 927–935. [Google Scholar] [CrossRef]
- Young, D.F.; Minnis, P.; Doelling, D.R.; Gibson, G.G.; Wong, T. Temporal interpolation methods for the Clouds and the Earth’s Radiant Energy System (CERES) experiment. J. Appl. Meteorol. 1998, 37, 572–590. [Google Scholar] [CrossRef]
- Smith, G.L.; Priestley, K.J.; Loeb, N.G.; Wielicki, B.A.; Charlock, T.P.; Minnis, P.; Doelling, D.R.; Rutan, D.A. Clouds and Earth Radiant Energy System (CERES), a review: Past, present and future. Adv. Space Res. 2011, 48, 254–263. [Google Scholar] [CrossRef]
- Twine, T.E.; Kustas, W.P.; Norman, J.M.; Cook, D.R.; Houser, P.R.; Meyers, T.P.; Prueger, J.H.; Starks, P.J.; Wesely, M.L. Correcting eddy-covariance flux underestimates over a grassland. Agric. For. Meteorol. 2000, 103, 279–300. [Google Scholar] [CrossRef] [Green Version]
- Wilson, K.; Goldstein, A.; Falge, E.; Aubinet, M.; Baldocchi, D.; Berbigier, P.; Bernhofer, C.; Ceulemans, R.; Dolman, H.; Field, C.; et al. Energy balance closure at Fluxnet sites. Agric. For. Meteorol. 2002, 113, 223–243. [Google Scholar] [CrossRef]
- Kochendorfer, J.; Meyers, T.P.; Frank, J.M.; Massman, W.J.; Heuer, M.W. How well can we measure the vertical wind speed? Implications for fluxes of energy and mass. Bound.-Layer Meteor. 2012, 145, 383–398. [Google Scholar] [CrossRef]
- Frank, J.M.; Massman, W.J.; Ewers, B.E. Underestimates of sensible heat flux due to vertical velocity measurement errors in non-orthogonal sonic anemometers. Agric. For. Meteorol. 2013, 171–172, 72–81. [Google Scholar] [CrossRef]
- Horst, T.W.; Semmer, S.R.; Maclean, G. Correction of a non-orthogonal, three-component sonic anemometer for flow distortion by transducer shadowing. Bound.-Layer Meteor. 2015, 155, 371–395. [Google Scholar] [CrossRef]
- Frank, J.M.; Massman, W.J.; Ewers, B.E. A bayesian model to correct underestimated 3-D wind speeds from sonic anemometers increases turbulent components of the surface energy balance. Atmos. Meas. Tech. 2016, 9, 5933–5953. [Google Scholar] [CrossRef]
- Nash, L.E.; Sutcliffe, J.V. River flow forecasting through conceptual models—Part 1: A discussion of principles. J. Hydrol. 1970, 10, 282–290. [Google Scholar] [CrossRef]
- Zhang, X.; Liang, S.; Wang, G.; Yao, Y.; Jiang, B.; Cheng, J. Evaluation of the reanalysis surface incident shortwave radiation products from NCEP, ECMWF, GSFC, and JMA using satellite and surface observations. Remote Sens. 2016, 8, 225. [Google Scholar] [CrossRef]
- Sheffield, J.; Goteti, G.; Wood, E.F. Development of a 50-year high-resolution global dataset of meteorological forcings for land surface modeling. J. Clim. 2006, 19, 3088–3111. [Google Scholar] [CrossRef]


| Site | Tower | Name | Cover | Latitude | Longitude |
|---|---|---|---|---|---|
| Borden Ranch | Lodi1 | vineyard | 38.2894 | −121.1178 | |
| Borden Ranch | Lodi2 | vineyard | 38.2805 | −121.1176 | |
| Twitchell Island | US-Tw1 | West Pond | old wetland | 38.1073 | −121.6468 |
| Twitchell Island | US-Tw4 | East End | young wetland | 38.1028 | −121.6413 |
| Twitchell Island | US-Twt | rice | 38.1087 | −121.6530 | |
| Twitchell Island | US-Tw3 | alfalfa | 38.1151 | −121.6468 | |
| Sherman Island | US-Myb | Mayberry | intermediate wetland | 38.0498 | −121.7650 |
| Sherman Island | US-Sne | Sherman | new wetland | 38.0369 | −121.7547 |
| CFSR | CERES | SSEC | |||||||||||||||||||
|---|---|---|---|---|---|---|---|---|---|---|---|---|---|---|---|---|---|---|---|---|---|
| Timescale | Tower | N | <O> | MBE | RMSE | NSE | R2 | MAE | RE | MBE | RMSE | NSE | R2 | MAE | RE | MBE | RMSE | NSE | R2 | MAD | RE |
| DAILY | Lodi1 | 761 | 19.05 | 0.34 | 2.92 | 0.87 | 0.89 | 1.84 | 0.097 | 0.37 | 1.86 | 0.95 | 0.95 | 1.13 | 0.059 | 0.16 | 1.33 | 0.97 | 0.97 | 0.76 | 0.040 |
| Lodi2 | 740 | 19.54 | 0.09 | 2.99 | 0.86 | 0.88 | 1.86 | 0.095 | −0.10 | 1.35 | 0.97 | 0.97 | 0.79 | 0.040 | −0.10 | 1.35 | 0.97 | 0.97 | 0.79 | 0.040 | |
| US-Sne | 162 | 24.72 | −0.08 | 1.78 | 0.94 | 0.95 | 1.07 | 0.043 | −1.18 | 1.60 | 0.95 | 0.99 | 1.37 | 0.056 | −1.18 | 1.60 | 0.95 | 0.99 | 1.37 | 0.056 | |
| US-Tw1 | 687 | 19.49 | 0.40 | 2.57 | 0.91 | 0.92 | 1.68 | 0.086 | 0.03 | 1.41 | 0.97 | 0.98 | 1.13 | 0.058 | 0.03 | 1.41 | 0.97 | 0.98 | 1.13 | 0.058 | |
| US-Tw3 | 797 | 18.99 | −0.21 | 2.68 | 0.91 | 0.92 | 1.60 | 0.084 | −0.46 | 1.48 | 0.97 | 0.98 | 1.07 | 0.056 | −0.46 | 1.48 | 0.97 | 0.98 | 1.07 | 0.056 | |
| US-Tw4 | 762 | 20.24 | −0.53 | 2.74 | 0.90 | 0.91 | 1.63 | 0.080 | −0.82 | 1.63 | 0.96 | 0.98 | 1.23 | 0.061 | −0.82 | 1.63 | 0.96 | 0.98 | 1.23 | 0.061 | |
| US-Twt | 792 | 19.26 | 0.12 | 2.66 | 0.90 | 0.91 | 1.65 | 0.086 | −0.18 | 1.29 | 0.98 | 0.98 | 0.83 | 0.043 | −0.18 | 1.29 | 0.98 | 0.98 | 0.83 | 0.043 | |
| LS DAY | ALL | 365 | 23.39 | 0.38 | 1.98 | 0.90 | 0.91 | 1.17 | 0.050 | 0.04 | 1.40 | 0.95 | 0.95 | 0.90 | 0.038 | −0.31 | 1.15 | 0.97 | 0.97 | 0.90 | 0.038 |
| DAILY | ALL | 4701 | 19.61 | 0.02 | 2.74 | 0.90 | 0.91 | 1.69 | 0.086 | −0.23 | 1.52 | 0.97 | 0.97 | 1.04 | 0.053 | −0.27 | 1.43 | 0.97 | 0.98 | 0.98 | 0.050 |
| WEEKLY | ALL | 661 | 19.76 | 0.03 | 1.41 | 0.97 | 0.97 | 1.04 | 0.052 | −0.26 | 1.08 | 0.98 | 0.99 | 0.82 | 0.042 | −0.29 | 1.03 | 0.98 | 0.99 | 0.78 | 0.039 |
| MONTHLY | ALL | 151 | 20.03 | 0.08 | 0.94 | 0.99 | 0.99 | 0.77 | 0.038 | −0.27 | 0.97 | 0.98 | 0.99 | 0.75 | 0.038 | −0.31 | 0.95 | 0.98 | 0.99 | 0.72 | 0.036 |
| YEARLY | ALL | 11 | 19.26 | −0.62 | 0.89 | −0.58 | 0.20 | 0.73 | 0.038 | −0.77 | 1.00 | −1.01 | 0.16 | 0.83 | 0.043 | −0.81 | 1.05 | −1.18 | 0.13 | 0.87 | 0.045 |
| CFSR | SSEC | ||||||||||||||
|---|---|---|---|---|---|---|---|---|---|---|---|---|---|---|---|
| Timescale | Tower | N | <O> | MBE | RMSE | NSE | R2 | MAE | RE | MBE | RMSE | NSE | R2 | MAE | RE |
| DAILY | Lodi1 | 450 | 3.44 | 0.11 | 0.80 | 0.76 | 0.77 | 0.63 | 0.184 | 0.10 | 0.76 | 0.78 | 0.79 | 0.60 | 0.175 |
| Lodi2 | 438 | 3.35 | 0.10 | 0.67 | 0.75 | 0.77 | 0.52 | 0.156 | 0.07 | 0.60 | 0.80 | 0.80 | 0.45 | 0.135 | |
| US-Myb | 818 | 3.11 | 0.10 | 0.81 | 0.84 | 0.85 | 0.63 | 0.203 | 0.07 | 0.75 | 0.86 | 0.86 | 0.58 | 0.188 | |
| US-Sne | 161 | 3.70 | −0.31 | 0.84 | 0.53 | 0.74 | 0.70 | 0.190 | −0.40 | 0.82 | 0.56 | 0.71 | 0.65 | 0.176 | |
| US-Tw1 | 818 | 3.03 | −0.11 | 0.99 | 0.79 | 0.79 | 0.80 | 0.265 | −0.13 | 0.98 | 0.79 | 0.80 | 0.78 | 0.258 | |
| US-Tw3 | 817 | 2.77 | −0.39 | 1.09 | 0.56 | 0.64 | 0.81 | 0.291 | −0.42 | 1.08 | 0.57 | 0.65 | 0.78 | 0.281 | |
| US-Tw4 | 818 | 3.57 | 0.16 | 0.77 | 0.90 | 0.90 | 0.60 | 0.169 | 0.12 | 0.77 | 0.90 | 0.90 | 0.60 | 0.167 | |
| US-Twt | 817 | 2.96 | 0.48 | 1.24 | 0.74 | 0.80 | 0.91 | 0.306 | 0.44 | 1.14 | 0.78 | 0.82 | 0.83 | 0.281 | |
| LS DAY | ALL | 330 | 3.90 | 0.04 | 0.96 | 0.74 | 0.75 | 0.75 | 0.192 | −0.07 | 0.94 | 0.75 | 0.75 | 0.75 | 0.191 |
| DAILY | ALL | 5241 | 3.10 | 0.08 | 0.95 | 0.78 | 0.79 | 0.72 | 0.233 | 0.05 | 0.91 | 0.80 | 0.80 | 0.69 | 0.221 |
| WEEKLY | ALL | 720 | 3.18 | 0.09 | 0.76 | 0.84 | 0.85 | 0.57 | 0.179 | 0.05 | 0.75 | 0.85 | 0.85 | 0.56 | 0.174 |
| MONTHLY | ALL | 169 | 3.19 | 0.08 | 0.58 | 0.90 | 0.91 | 0.44 | 0.137 | 0.04 | 0.57 | 0.90 | 0.91 | 0.42 | 0.132 |
| YEARLY | ALL | 10 | 3.02 | 0.07 | 0.28 | 0.02 | 0.64 | 0.24 | 0.078 | 0.04 | 0.28 | 0.02 | 0.63 | 0.23 | 0.076 |
© 2019 by the authors. Licensee MDPI, Basel, Switzerland. This article is an open access article distributed under the terms and conditions of the Creative Commons Attribution (CC BY) license (http://creativecommons.org/licenses/by/4.0/).
Share and Cite
Anderson, M.; Diak, G.; Gao, F.; Knipper, K.; Hain, C.; Eichelmann, E.; Hemes, K.S.; Baldocchi, D.; Kustas, W.; Yang, Y. Impact of Insolation Data Source on Remote Sensing Retrievals of Evapotranspiration over the California Delta. Remote Sens. 2019, 11, 216. https://0-doi-org.brum.beds.ac.uk/10.3390/rs11030216
Anderson M, Diak G, Gao F, Knipper K, Hain C, Eichelmann E, Hemes KS, Baldocchi D, Kustas W, Yang Y. Impact of Insolation Data Source on Remote Sensing Retrievals of Evapotranspiration over the California Delta. Remote Sensing. 2019; 11(3):216. https://0-doi-org.brum.beds.ac.uk/10.3390/rs11030216
Chicago/Turabian StyleAnderson, Martha, George Diak, Feng Gao, Kyle Knipper, Christopher Hain, Elke Eichelmann, Kyle S. Hemes, Dennis Baldocchi, William Kustas, and Yun Yang. 2019. "Impact of Insolation Data Source on Remote Sensing Retrievals of Evapotranspiration over the California Delta" Remote Sensing 11, no. 3: 216. https://0-doi-org.brum.beds.ac.uk/10.3390/rs11030216