Improving Estimation of Gross Primary Production in Dryland Ecosystems by a Model-Data Fusion Approach


1
Key Laboratory of Remote Sensing of Gansu Province, Heihe Remote Sensing Experimental Research Station, Northwest Institute of Eco-Environment and Resources, Chinese Academy of Sciences, 320 Donggang West Road, Lanzhou 730000, China
2
Institute of Tibetan Plateau Research, Chinese Academy of Sciences, Beijing 100101, China
3
CAS Center for Excellence in Tibetan Plateau Earth Sciences, Chinese Academy of Sciences, Beijing 100101, China
4
Chongqing Engineering Research Center for Remote Sensing Big Data Application, School of Geographical Sciences, Southwest University, Beibei, Chongqing 400715, China
*
Author to whom correspondence should be addressed.
Remote Sens. 2019, 11(3), 225; https://0-doi-org.brum.beds.ac.uk/10.3390/rs11030225
Submission received: 18 December 2018
/
Revised: 16 January 2019
/
Accepted: 21 January 2019
/
Published: 22 January 2019
(This article belongs to the Special Issue Earth Observations for Addressing Global Challenges)
Abstract
:Accurate and continuous monitoring of the production of arid ecosystems is of great importance for global and regional carbon cycle estimation. However, the magnitude of carbon sequestration in arid regions and its contribution to the global carbon cycle is poorly understood due to the worldwide paucity of measurements of carbon exchange in arid ecosystems. The Moderate Resolution Imaging Spectroradiometer (MODIS) gross primary productivity (GPP) product provides worldwide high-frequency monitoring of terrestrial GPP. While there have been a large number of studies to validate the MODIS GPP product with ground-based measurements over a range of biome types. Few studies have comprehensively validated the performance of MODIS estimates in arid and semi-arid ecosystems, especially for the newly released Collection 6 GPP products, whose resolution have been improved from 1000 m to 500 m. Thus, this study examined the performance of MODIS-derived GPP by compared with eddy covariance (EC)-observed GPP at different timescales for the main ecosystems in arid and semi-arid regions of China. Meanwhile, we also improved the estimation of MODIS GPP by using in situ meteorological forcing data and optimization of biome-specific parameters with the Bayesian approach. Our results revealed that the current MOD17A2H GPP algorithm could, on the whole, capture the broad trends of GPP at eight-day time scales for the most investigated sites. However, GPP was underestimated in some ecosystems in the arid region, especially for the irrigated cropland and forest ecosystems (with R2 = 0.80, RMSE = 2.66 gC/m2/day and R2 = 0.53, RMSE = 2.12 gC/m2/day, respectively). At the eight-day time scale, the slope of the original MOD17A2H GPP relative to the EC-based GPP was only 0.49, which showed significant underestimation compared with tower-based GPP. However, after using in situ meteorological data to optimize the biome-based parameters of MODIS GPP algorithm, the model could explain 91% of the EC-observed GPP of the sites. Our study revealed that the current MODIS GPP model works well after improving the maximum light-use efficiency (εmax or LUEmax), as well as the temperature and water-constrained parameters of the main ecosystems in the arid region. Nevertheless, there are still large uncertainties surrounding GPP modelling in dryland ecosystems, especially for desert ecosystems. Further improvements in GPP simulation in dryland ecosystems are needed in future studies, for example, improvements of remote sensing products and the GPP estimation algorithm, implementation of data-driven methods, or physiology models.
1. Introduction
Drylands, including arid and semi-arid ecosystems, cover 30%–45% of the Earth’s land surface [1,2], and play an important role in the global carbon cycle and future carbon sequestration [3,4]. Accurate and continuous monitoring of terrestrial ecosystem production in arid and semi-arid regions is of great importance to improve the understanding of the role of arid terrestrial ecosystems in the global carbon cycle. However, the worldwide paucity of measurement of carbon exchange in arid ecosystems has hindered the full understanding of the magnitude of carbon sequestration and the accurate prediction of the carbon cycle [5,6].
Terrestrial gross primary production (GPP) is the largest component of the global carbon cycle and is essential to understand and quantify the contribution of terrestrial ecosystems to the global carbon cycle [7]. Satellite remote sensing provides continuous and temporally repetitive observation of land surfaces and has advanced tremendously over the past few decades that has become a useful tool in estimating the terrestrial ecosystem production across broad temporal and spatial scales. Production efficiency models (PEMs), developed for predicting global GPP with remote sensing, have been widely used to quantify the spatial and temporal variation of terrestrial ecosystem productivity [8,9,10]. In the absence of widespread ground observations, remote sensing models are also commonly used to estimate dryland CO2 exchange [4,11]. Previous data and remote sensing models comparisons have only included a few dryland sites [12]. Thus, there is a need to understand how well commonly used remote sensing models capture the magnitude and inter-annual variability of measured CO2 exchange [13].
Since 2000, satellite-based GPP estimation have increasingly used data from the Moderate Resolution Imaging Spectroradiometer (MODIS) due to its continuous worldwide availability [8]. The MODIS GPP algorithm (i.e., MOD17) is a type of PEM, which provides high frequency worldwide observations of GPP [14,15]. To date, MODIS has issued multiple versions of GPP [14,16]. Currently, the MOD17 product has been updated to Collection 6 (C6), which has improved the algorithm parameters and forcing data of previous collections [15,17], as the spatial resolution has increased from 1000 m to 500 m. A large number of studies have validated the capacity of MODIS GPP products with eddy covariance (EC) measurements across multiple biomes, such as forests [18,19], shrublands [20], grasslands [21,22], savanna [23], croplands [24], and across biomes [12,25,26,27]. However, most of these studies validated previous versions of MODIS GPP products (i.e., Collection 4 and 5). Comprehensive evaluation of the performance of MODIS GPP C6 products in arid regions of China remains limited to this date [1].
Previous studies showed no consistent results in the validation of Collection 4 and 5 of MODIS GPP products. MODIS GPP may underestimate at some sites, such as at cropland sites [24], overestimate at some low productivity sites [25,28], or agree well [26] with tower-based GPP. Meanwhile, the MODIS GPP Collection 6 products (i.e., MOD17A2H) also tend to overestimate GPP in alpine meadows of the Tibetan Plateau [22] and underestimate flux-derived GPP at most sites across the globe [27]. However, because of inadequate observations in arid regions compared with other regions, it remains uncertain whether these biases also exist in other ecosystems in arid regions for the improved Collection 6 GPP products. Therefore, it is necessary to validate the performance of the latest version of MODIS products in arid regions.
The overall uncertainty of carbon flux modelling includes uncertainty of input variables, model structure, and model parameters [29], which can significantly impact carbon flux at regional scales. Several attempts have been made to address the uncertainties of the PEM algorithm [26,27,30,31]. For the MOD17 products, inaccuracies in the parameterization of model parameters (such as maximum light-use efficiency (εmax or LUEmax)) were found to be one of the most important factors attributed to the bias of MODIS GPP [12,20]. The current MOD17 algorithm uses the constant maximum LUE and other parameters for one ecosystem [18], which is not suitable for variability of climate conditions and ecosystems. Previous studies found that the LUE parameter in the MOD17 algorithm was underestimated [26]. Several attempts have been made to calibrate the maximum LUE parameters and to improve the performance of MODIS GPP estimation [24,26,32]. However, most of these studies overlooked the potential impacts of other model parameters’ uncertainty on the estimation of GPP, e.g., water-limited factors, which are important factors for GPP estimation, especially for ecosystems in the arid region.
Research community have established that by adjusting the key parameters of the model can improve GPP estimation using MODIS GPP algorithm, which can compensate for the errors introduced by the model structures [23]. A model–data fusion approach provides powerful tools for optimizing the model parameters and quantifying the influence of uncertainties, and is being increasingly used to estimate the parameters of ecological models [33,34,35,36,37,38]. Model–data fusion approaches include Bayesian and non-Bayesian approaches. Non-Bayesian approaches, such as global optimization algorithms, can efficiently determine the optimal parameter solutions by minimizing (or maximizing) objective functions [36], but cannot quantify uncertainty. In contrast, the Bayesian approach can be employed to update the parameter distributions when new information becomes available [37], and produce reliable estimates of parameter and predictive uncertainty [38]. Some past studies have strengthened the importance of parameters estimation in carbon cycle models [32,39], but have mainly focused on single site to constrain the parameters of a given plant functional type (PFT), in addition, few studies have assessed the variability of parameters within a PFT [40]. For MODIS GPP validation, since the PFT parameters in the MOD17 algorithm are obtained from flux towers worldwide, they are not appropriate for specific regions such as the arid regions of China.
Thus, this study aims to examine the performance of newly released MODIS GPP C6 products and MOD17 algorithms in predicting GPP in a typical arid region of China. The overall goals of this study are to: (1) Evaluate the model performance of the MODIS GPP Collection 6 products at eight-day to annual time scale across various ecosystem types in a typical arid region of China; (2) analyze the uncertainty of remote sensing models in simulating GPP in typical arid regions; and (3) quantify the parameter uncertainties in GPP estimation for the main ecosystem types in arid regions of China by using a Bayesian approach with calibration of maximum LUE and water and temperature-limited factors. This research will contribute to the development and improvement of GPP estimates in arid regions.
2. Materials and Methods
2.1. In Situ Meteorological Observations and Carbon Flux Data
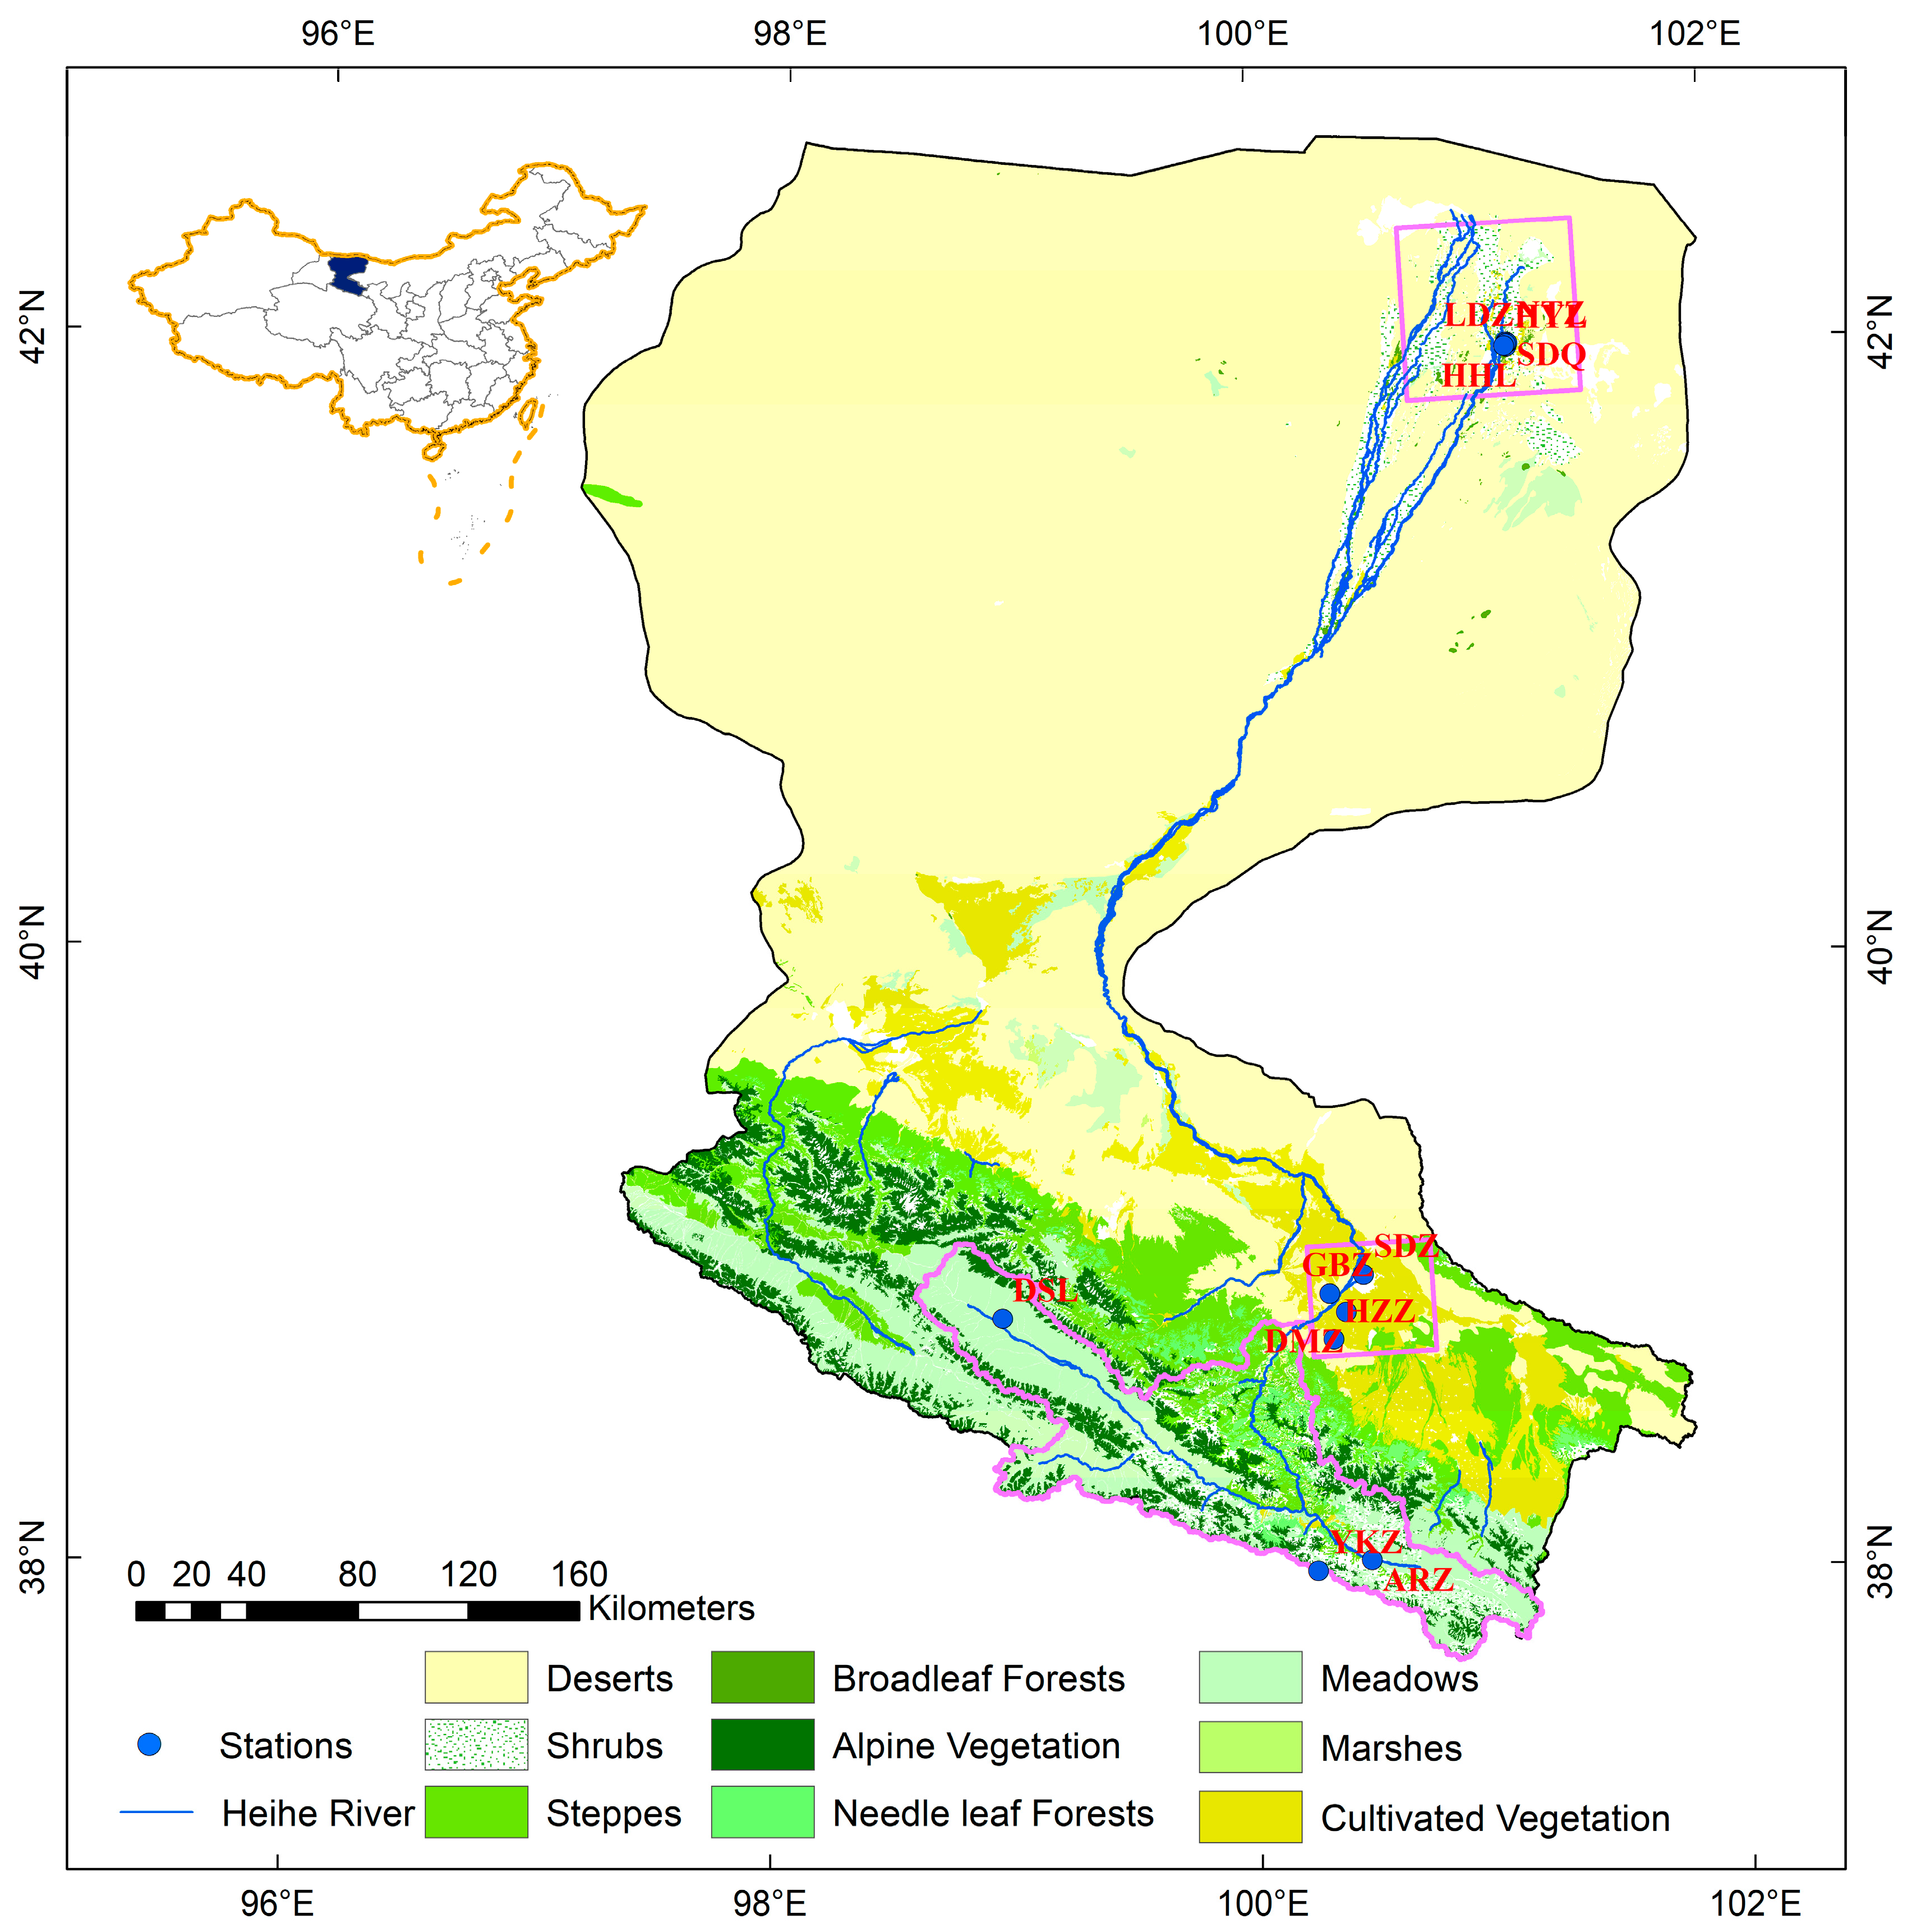
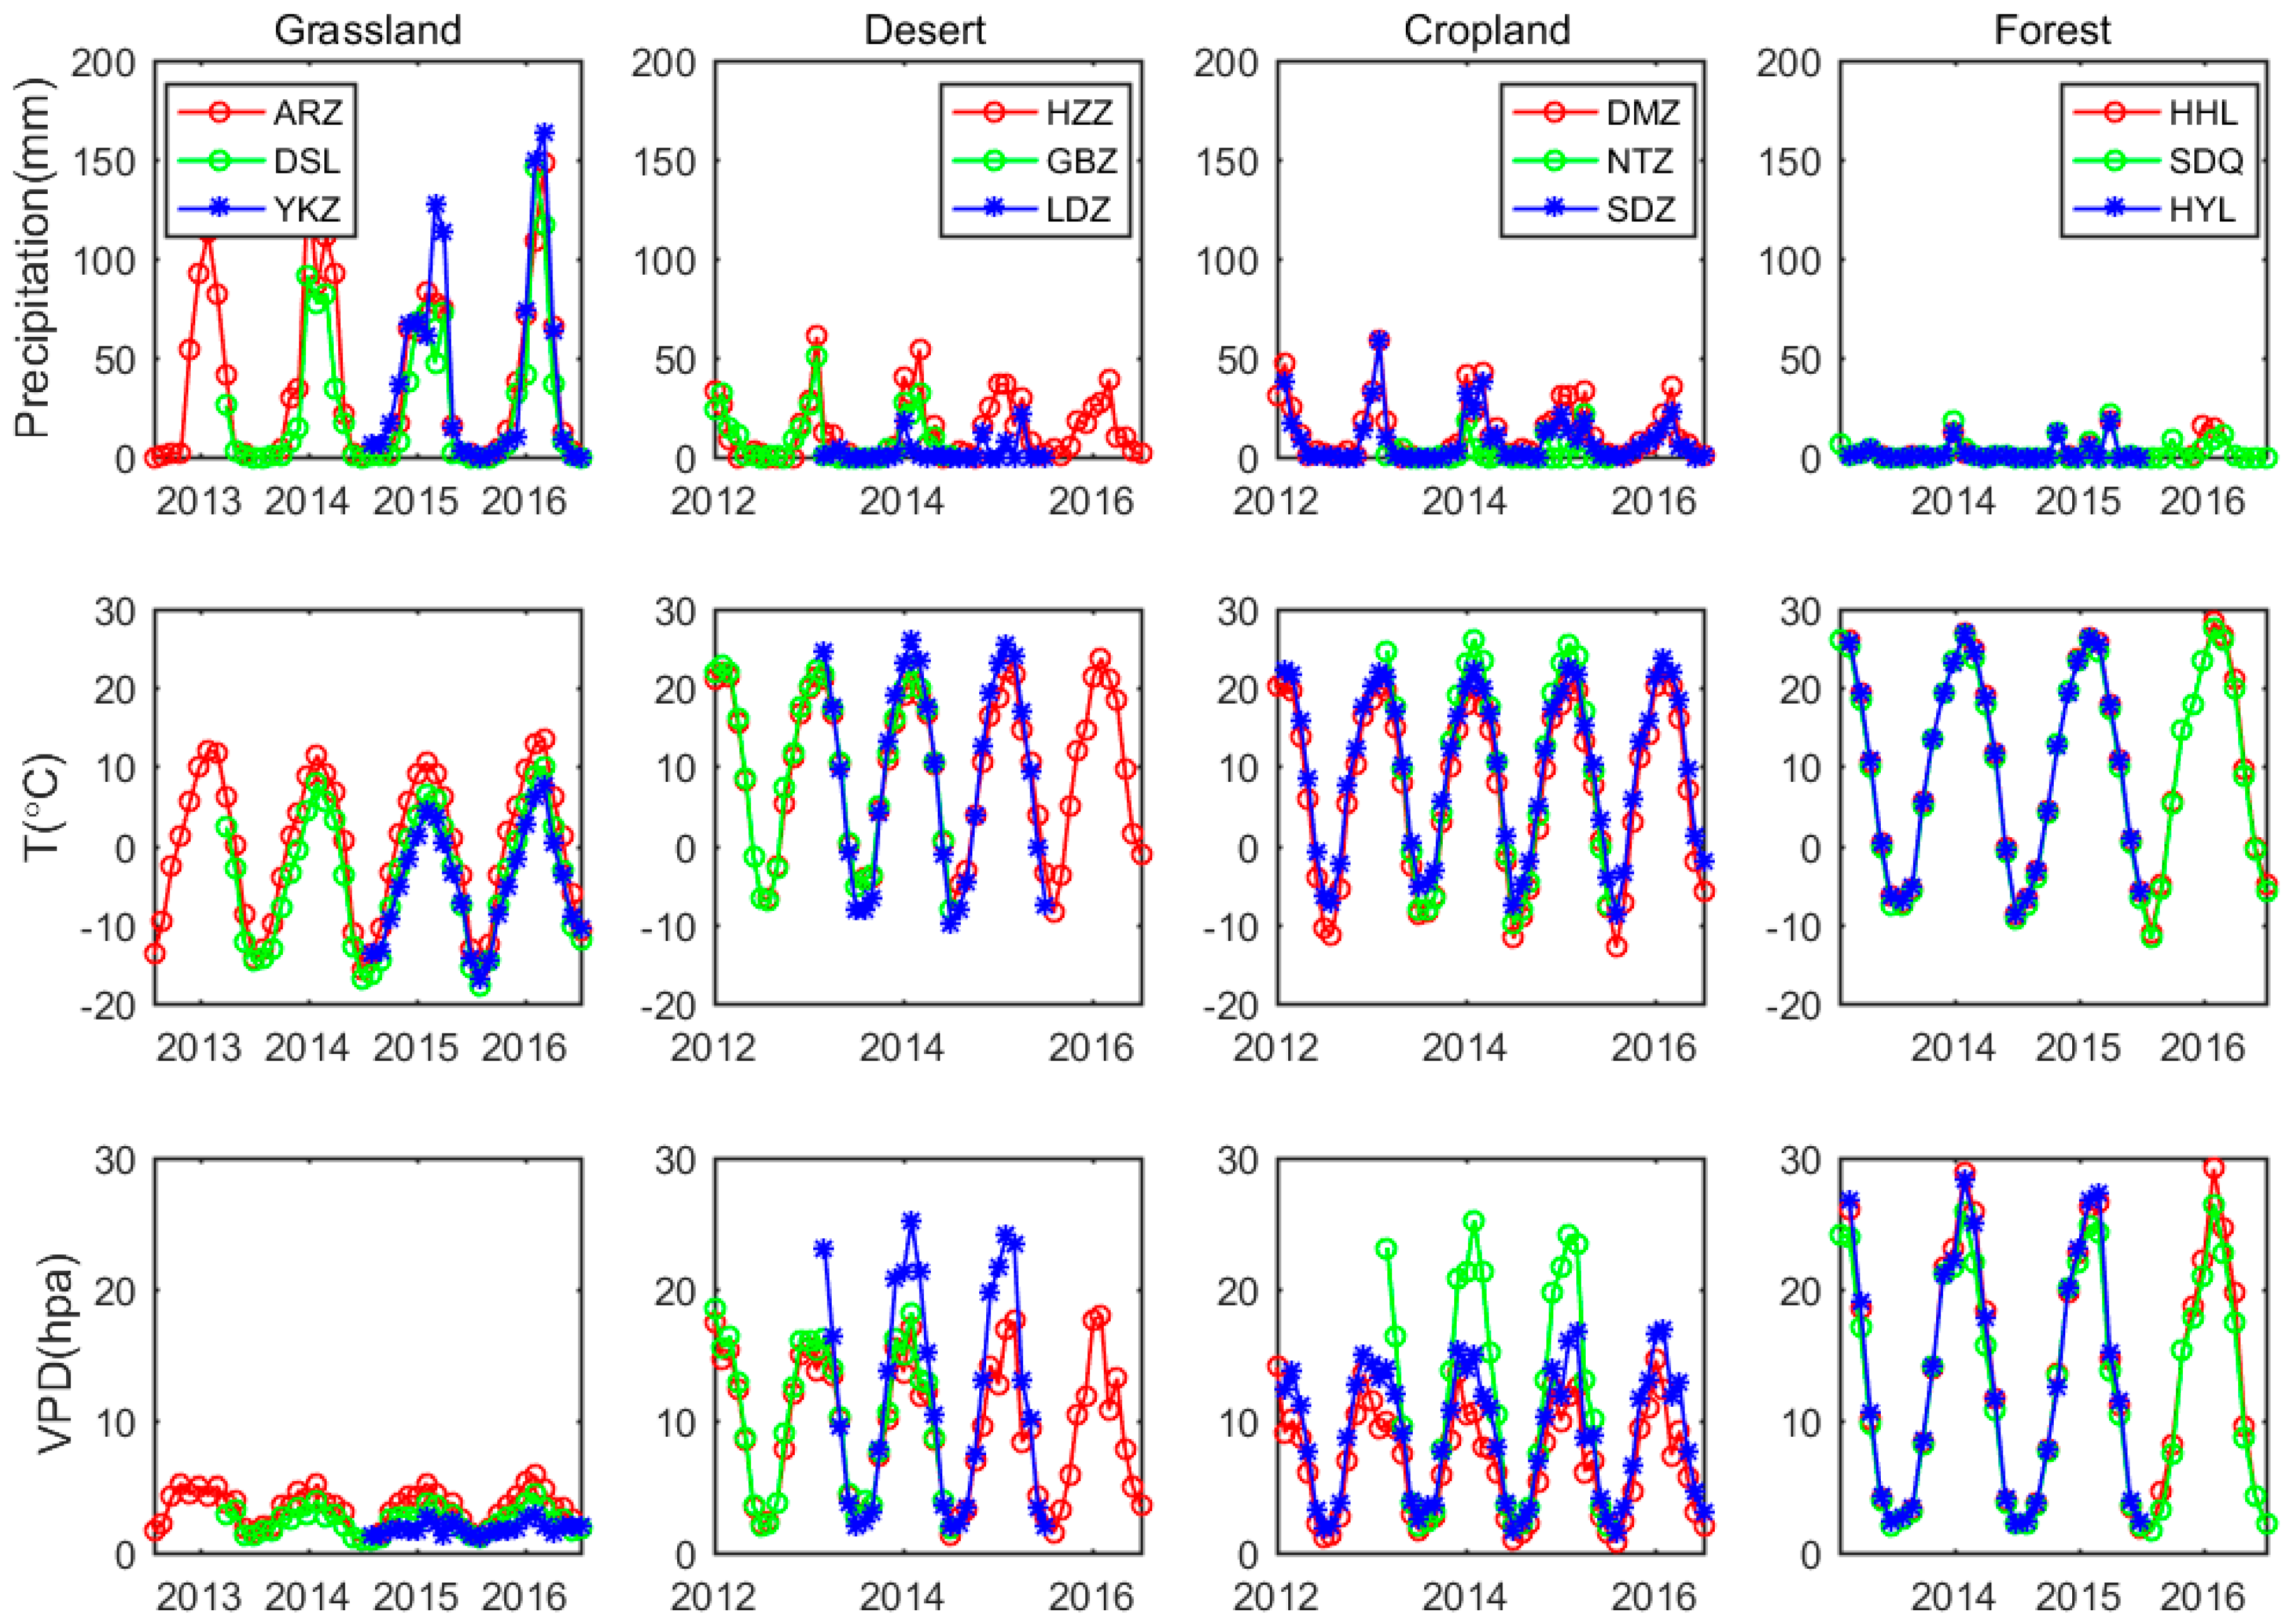
The fluxes and meteorological data used in this study are mainly based on a flux observation network located in a typical inland river basin: The Heihe River Basin (HRB) in the arid region of Northwest China. The HRB (37.7°–42.7° N, 97.1°–102.0° E), second largest inland river basin in China, is located in the middle part of the Hexi corridor and covers an area of approximately 1,432,000 km2 [41]. The HRB is a unique region in China and can be viewed as an epitome of the arid region of western China for its varied distributed landscapes of alpine meadow, wetland–oasis–desert and natural oasis–desert ecosystems from upstream to downstream [42,43]. We constructed a comprehensive flux observation network in the whole river basin to investigate the complexity of hydrological and ecological processes in the arid region (Figure 1). In this study, we compiled 12 EC flux sites covering 3 grassland sites, 3 desert grassland sites, 3 cropland sites (including a wetland site), and 3 forest sites, which almost covered the major plant function types (PFTs) and typical ecosystem types in the arid region of an inland river basin. Figure 2 shows the meteorological observations of all the flux tower sites over HRB including precipitation, air temperature (T), and vapor pressure deficit (VPD). A large variability of climate conditions exist within and across the species. The specific locations and related information of the sites are shown in Table 1.
The open-path eddy covariance (OPEC) system was used to measure carbon and water vapor fluxes in the flux observation network. The OPEC system at each site consists of a 3D sonic anemometer (CSAT-3/Gill, Campbell Scientific Instruments Inc., USA/Gill, UK) and an open path infrared gas analyzer (Li-7500/7500A, Licor Inc., USA). The meteorological variables were measured simultaneously at each site including air temperature, rainfall, solar radiation, photosynthetically active radiation (PAR), relative humidity and soil moisture. VPD was calculated using measured relative humidity and actual vapor pressure. The meteorological data were measured at automatic weather stations at every 10 min interval, which were carefully checked for quality and summed into 30 mins and daily timescales. The raw EC measurements of 10 Hz data were processed into half-hourly flux data using the flux processing software Eddypro (http://www.licor.com/env/products/eddy_covariance/software.html) developed by LI-COR Biosciences (Lincoln, NE, USA). The flux data processing steps included spike detection, coordinate rotation, time-lag correction, coordinate rotation, sonic virtual temperature correction, frequency-response correction, and density correction [44,45]. Then, the flux data were gap-filled using the marginal distribution sampling (MDS) method and partitioned into GPP and ecosystem respiration (Reco) following the flux partitioning algorithms from the REddyProc package [46].
2.2. MODIS Datasets
The MODIS data used in this study include MODIS GPP data (MOD17A2H products), FPAR data (MOD15A2H products), and Surface Reflectance data (MOD09A1 products) with Collection 6 at 500 m spatial resolution were downloaded directly from the Oak Ridge National Laboratory Distributed Active Center (ORNL DAAC) website. FPAR is the fraction of photosynthetically active radiation (400–700 nm) absorbed by green vegetation, which is a critical component of the MODIS GPP algorithm. To correct inferior values caused by the effects of clouds and aerosols, we reconstructed the MODIS FPAR time series data with Savizky–Golay filter algorithm [47]. Meanwhile, to validate the performance of the MODIS FPAR data in the study area, we observed the actual FPAR data of cropland and desert grassland sites in HRB using AccuPAR (METER Group, Inc., Pullman, USA) during the growing seasons of vegetation in 2012 [43], and then compared the observations with the MOD15A2H FPAR data at corresponding sites. In addition, we also used the MODIS surface reflectance data to derive vegetation indices, such as the normalized difference vegetation index (NDVI). For the site of NTZ, due to the growing season of cropland (i.e., cantaloupe) is short, the desert or low vegetation land cover was identified in the MOD15A2H product, and thus we calculated the FPAR from NDVI data following the empirical formula of: FPAR = 1.24 × NDVI − 0.168 [48].
2.3. Description of MOD17A2H Algorithm
The MOD17A2H algorithm is based on light-use efficiency (LUE) approach [49,50], which provides global GPP estimates of 8 day temporal and 500 m spatial resolution [15]. The MODIS GPP product is calculated from the following equation:
where εmax is the maximum LUE obtained from the Biome-specified Parameters Look Up Table (BPLUT) on the basis of vegetation type. The BPLUT contains values specifying minimum temperature and VPD limits, specific leaf area and respiration coefficients for the standard land cover classes [48]. SWrad is shortwave solar radiation of which 45% is photosynthetically active radiation (PAR), FPAR is the fraction of PAR absorbed by vegetation and the scale factors f(Tmin) and f(VPD) reduce εmax under unfavorable conditions of low temperature and high VPD. The forcing data such as SWrad, Tmin and VPD in the MOD17A2H GPP product were implemented by the Global Modeling and Assimilation Office (GMAO) Reanalysis data. The MODIS GPP algorithm is described in detail in previous literature [12,15,18].
2.4. Parameter Optimization and Uncertainty Analysis
The current MOD17 BPLUT is too general for local regional application [20]. The same set of parameters was applied indiscriminately to diverse types of the same ecosystems, introducing large uncertainties for the simulation of GPP in the arid region. To improve the accuracy of the GPP estimation in desert–oasis–alpine ecosystems in the arid region, we calibrated the parameters of the MOD17 model based on in situ flux tower observations using Bayesian model-data fusion approach. The model parameters were calibrated against GPP time series from the flux tower measurement network through a Bayesian data model synthesis [33,38]. According to Bayesian theory, posterior probability density functions (PDFs) of model parameters (θ) given the existing data (D), denoted P(θ|D), can be obtained from prior knowledge of the parameters and information generated by comparison of simulated and observed variables, and can be described as:
where P(D) is the probability of observed GPP and P(D|θ) is the conditional probability density of observed GPP with prior knowledge, also called the likelihood function for parameter θ.
Given a collection of N measurements, the likelihood function (L) can be expressed as:
where represents the standard deviation of the data-model error, represents the ith of measurements, and is the model-derived estimates of a measurement.
In our study, we assumed the parameter priors are uniform, and the posterior PDFs for the model parameters were generated from prior PDFs P(θ) with observation data by a Markov chain Monte Carlo (MCMC) sampling technique [33]. Herein, the Metropolis–Hasting algorithm [51,52] was adopted to generate a representative sample of parameter vectors from the posterior distribution. We ran the MCMC chains with 50,000 iterations each, and regarded the first 15,000 iterations as the burn-in period for each MCMC run. All accepted samples from the runs after burn-in periods were used to compute the posterior parameter statistics of the models.
In this study, the MOD17A2H GPP algorithm contains 5 parameters: Maximum light-use efficiency (εmax or LUEmax), temperature-constrained factors (Tmin_min, Tmin_max,) and the water-constrained factors (VPDmin, VPDmax). The lower and upper bounds of εmax (0.3–3.0 gC/m2/day/MJ APAR) were determined from the range of εmax used in PEMs [9,15,53]. Following the related References [8,15,50,54], we specified the initial bounds of these parameters: Tmin_min (°C), Tmin_max (°C), VPDmin (Pa) and VPDmax (Pa) as [−35,−2], [6,30], [60,1000], and [1500,6500], respectively.
2.5. Experiment Configuration and Validation
The original MOD17A2H GPP products used the GMAO Reanalysis data as the driving metrological database, and calculated the GPP with the biome based parameters look up table on a global scale. To validate and improve the performances of the MODIS GPP estimations and quantify the uncertainty of the MODIS GPP simulation algorithm (MOD17 model), we replaced the satellite-derived and meteorological inputs in the MOD17 model and compared the modeled GPP estimates with flux tower observations with the following experiment configurations: (1) We firstly assessed the performance of original MOD 17A2H GPP product at spatial resolution of 500m with the tower based GPP. The results of the model validation, in this study, is called GPP_MODIS; (2) we used in situ meteorological data to run the MOD17 algorithm to understand the influence of meteorological inputs (i.e., incoming solar radiation, minimum temperature and vapor pressure deficit) on GPP modelling rather than the GMAO Reanalysis dataset, we called this GPP_Insitu; and (3) we compared the performances between the calibration of one parameter only (εmax) and calibration of all parameters of the MOD17 model to examine the sensitivity of the water and temperature-limited parameters on GPP estimation. The results are called GPP_LUEopt and GPP_Fiveopt, respectively. To understand the effects of parameter uncertainty on GPP simulation, we compared the calibrated MOD17 model algorithm with in situ meteorological inputs from the flux tower network. Similar to GPP_Insitu, GPP_LUEopt, and GPP_Fiveopt were also calculated using the in situ meteorology data. However, for GPP_LUEopt, we only optimized the parameter of εmax by Bayesian approach and other parameters used the default BPLUT parameters in the MOD17 algorithm. Whereas, for GPP_Fiveopt we optimized all the five parameters using the Bayesian approach.
2.6. Statistical Analyses and Model Evaluation
We firstly calculated the daily values of EC-based GPP and then aggregated to the eight-day and annually values for seasonal and yearly GPP validation. To evaluate the performance of the MOD17A2H GPP model, we compared the modeled GPP with the flux tower-estimated GPP both in 8-day and annual time steps. We extracted the eight-day composite MODIS C6 GPP product (MOD17A2H) and the other MODIS products (e.g., MOD15A2H and MOD09A1 products) from the pixels centered on the flux towers, and compared the MODIS GPP product with the EC-based GPP observations.
The model performance (i.e., differences between simulated and tower-based GPP) were quantified by using the coefficient of determination (R2), root mean squared error (RMSE), and relative RMSE (rRMSE):
where, Ysim and Yobs represent the simulated and observed GPP data, respectively, and n is the total number of samples. All the statistical analyses and results presentation are performed in Matlab R2016b software (Mathworks, Natick, MA, USA).
3. Results
3.1. Evaluation of MODIS GPP Products and MOD17 Algorithm in the Arid Region
3.1.1. Site-Specific Evaluation of MODIS GPP Products and MOD17 Algorithm
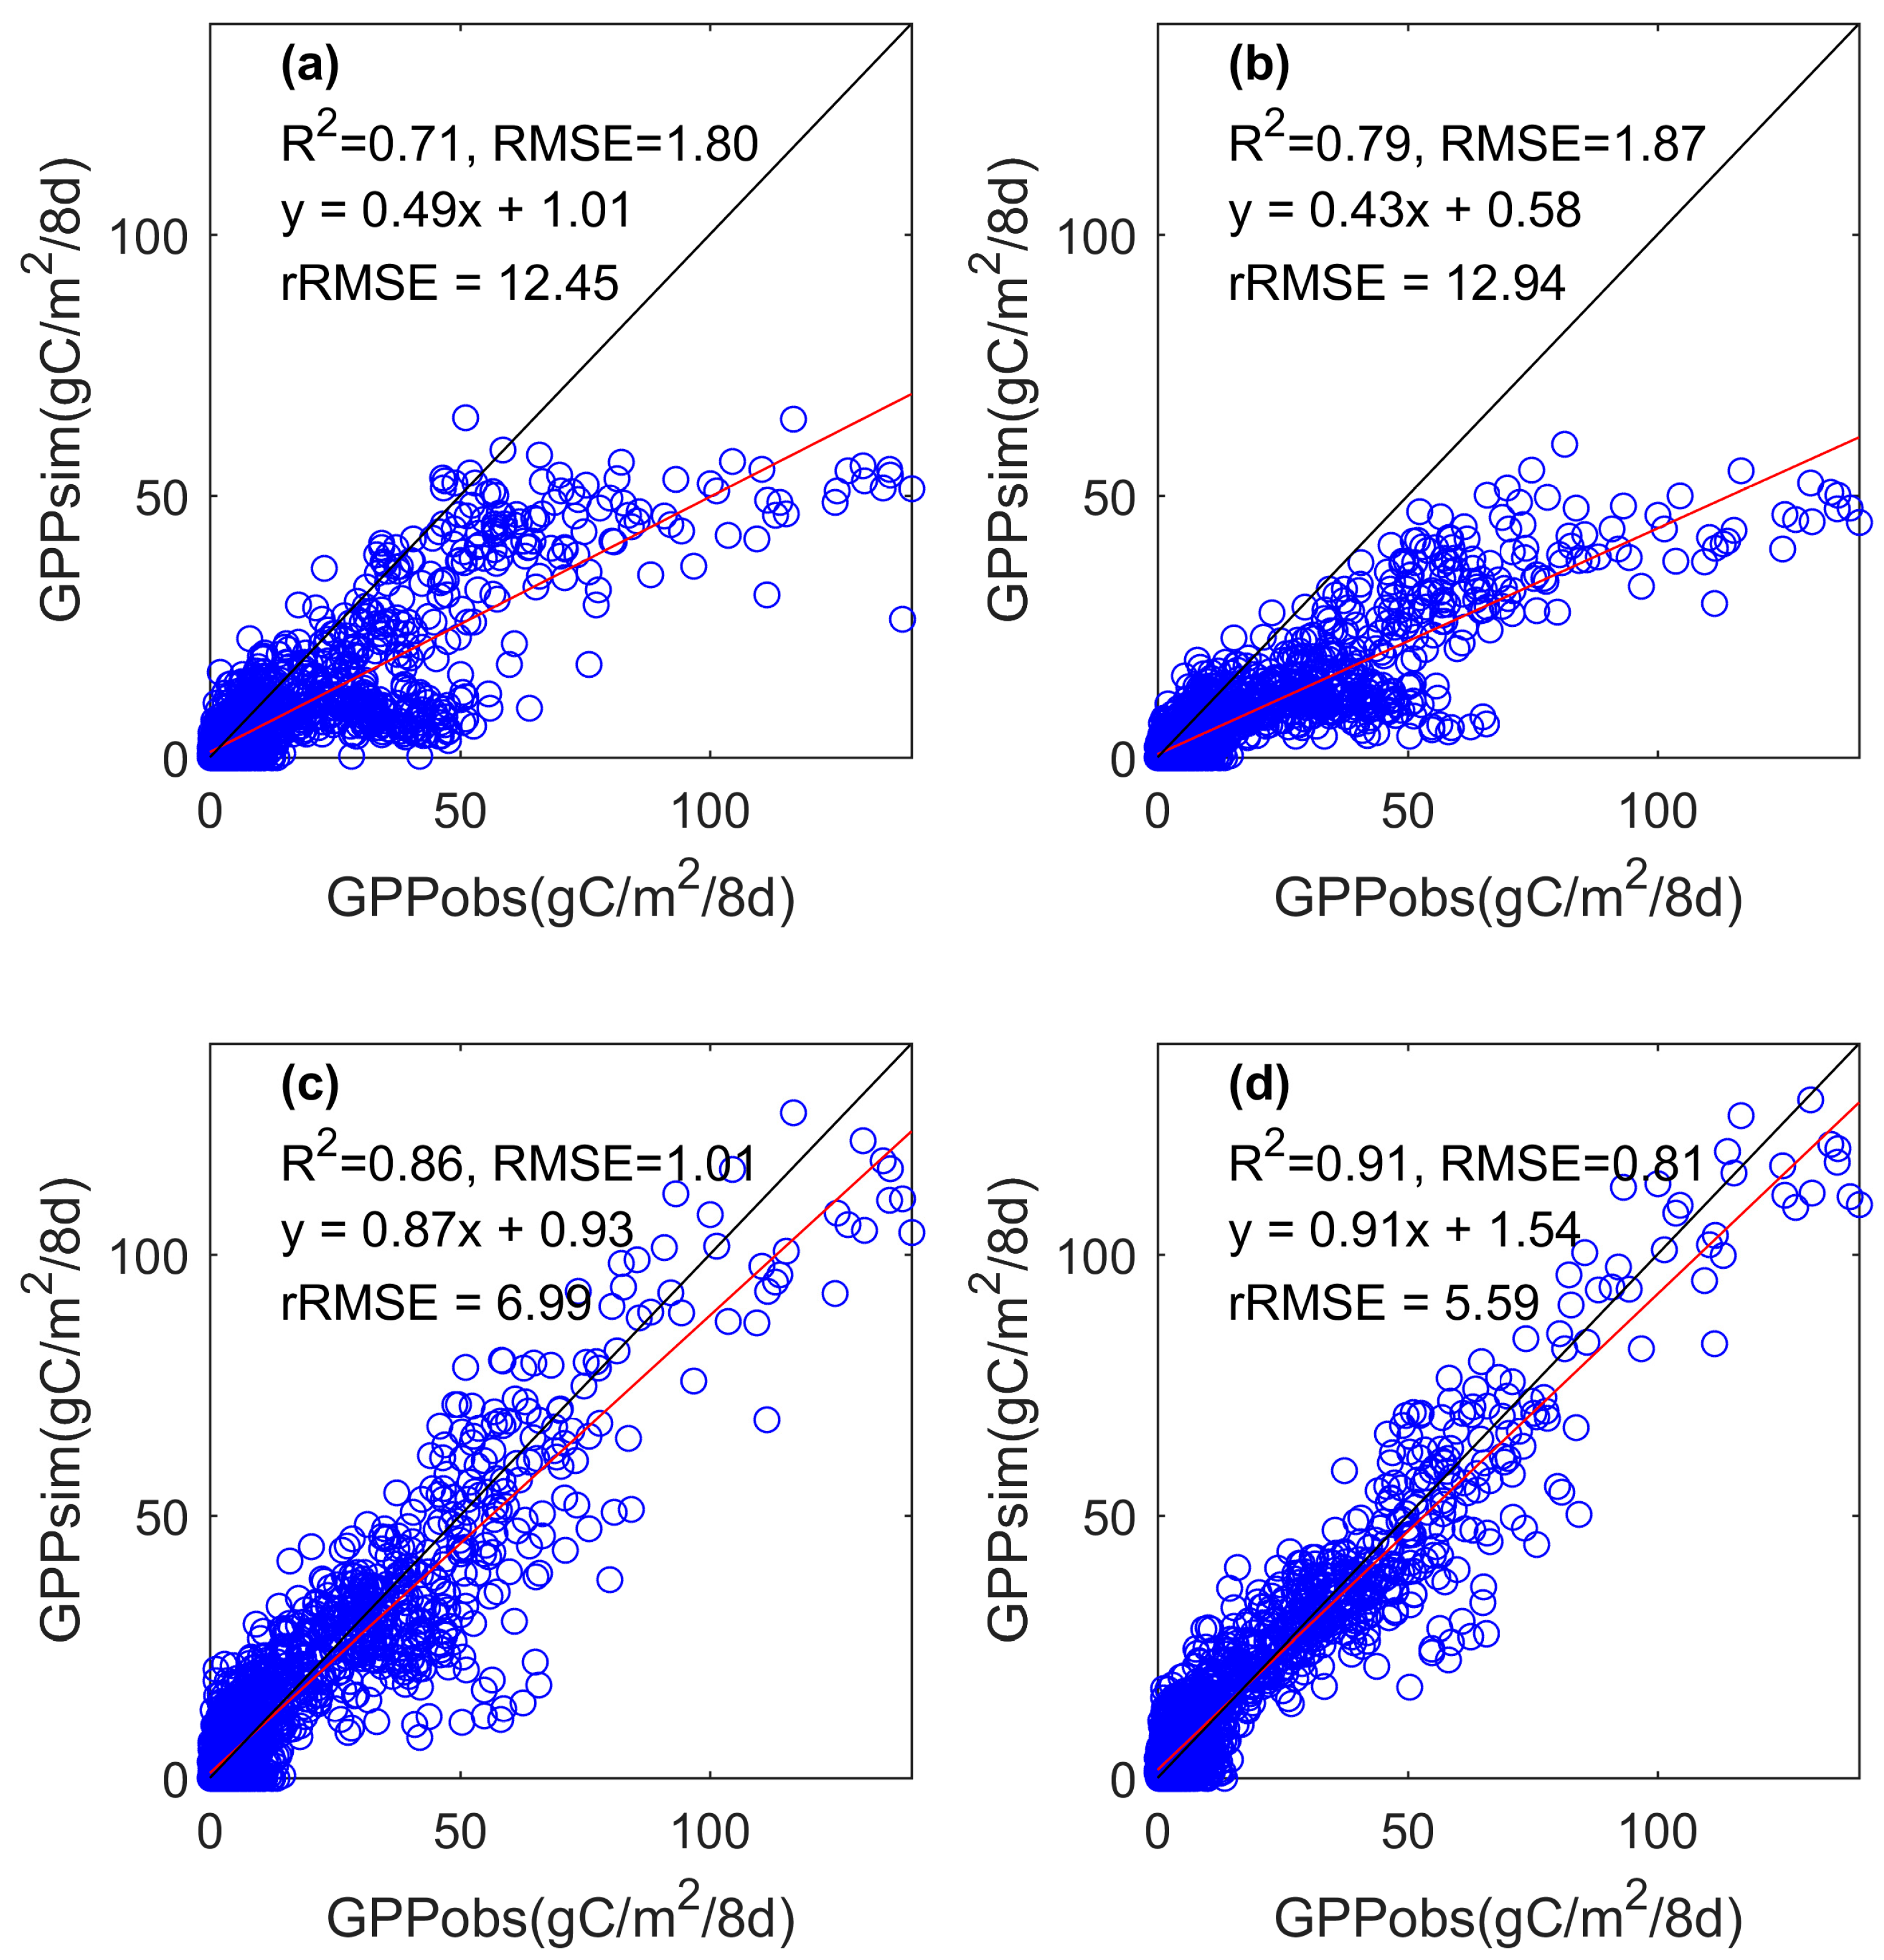
The eight-day EC flux tower GPP (GPP_obs) was compared with the results of MOD17A2H GPP (GPP_MODIS), GPP simulated with the in situ meteorology forcing data (GPP_Insitu), and GPP simulated with optimized maximum LUE parameter (GPP_LUEopt) and with optimized all five parameters (GPP_Fiveopt). As illustrated in Figure 3a, the overall eight-day MOD17A2H GPP products were significantly underestimated when compared with the EC-observed GPP. The RMSE between MOD17 products and in situ flux observations of all sites was 1.80 gC/m2/day, while R2 was 0.71 and the slope of the model was 0.49, which means the model could only contribute 71% of the tower-observed GPP. As shown in Figure 3b, when we used the in situ meteorology data to simulate the MOD17 model, a better correlation between simulation and observation was found. The model could explain 79% of the observation (the slope was 0.43, R2 was 0.79), with a large biases close to that of MOD17A2H products. However, the modeled GPP still underestimate as compared to the observed GPP, which means that the meteorology forcing data were not the main reasons for the underestimation of GPP. By contrast, when we optimized the maximum LUE parameter (Figure 3c), a significant improvement of model performance for all sites was seen, with R2 = 0.86, RMSE = 1.01 gC/m2/day, rRMSE = 6.99%, and the slope of the regression lines was closer to the 1:1 line, which signifies the importance of the LUE parameter in GPP modelling. Furthermore, as we optimized all parameters, a better performance of the model occurred. Almost all the points were close to the 1:1 line (Figure 3d), with R2 = 0.91, RMSE = 0.81 gC/m2/day, and rRMSE = 5.59%, which indicates the best performance in these simulations.
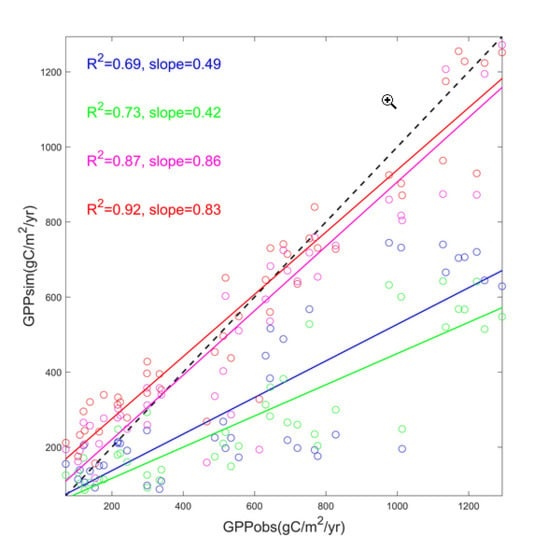
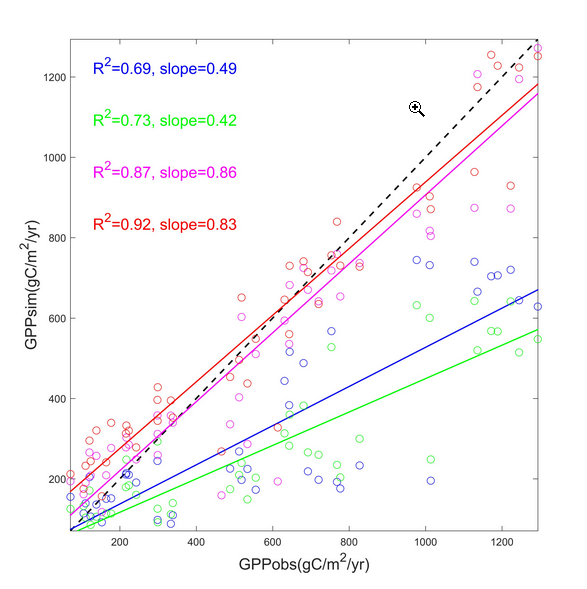
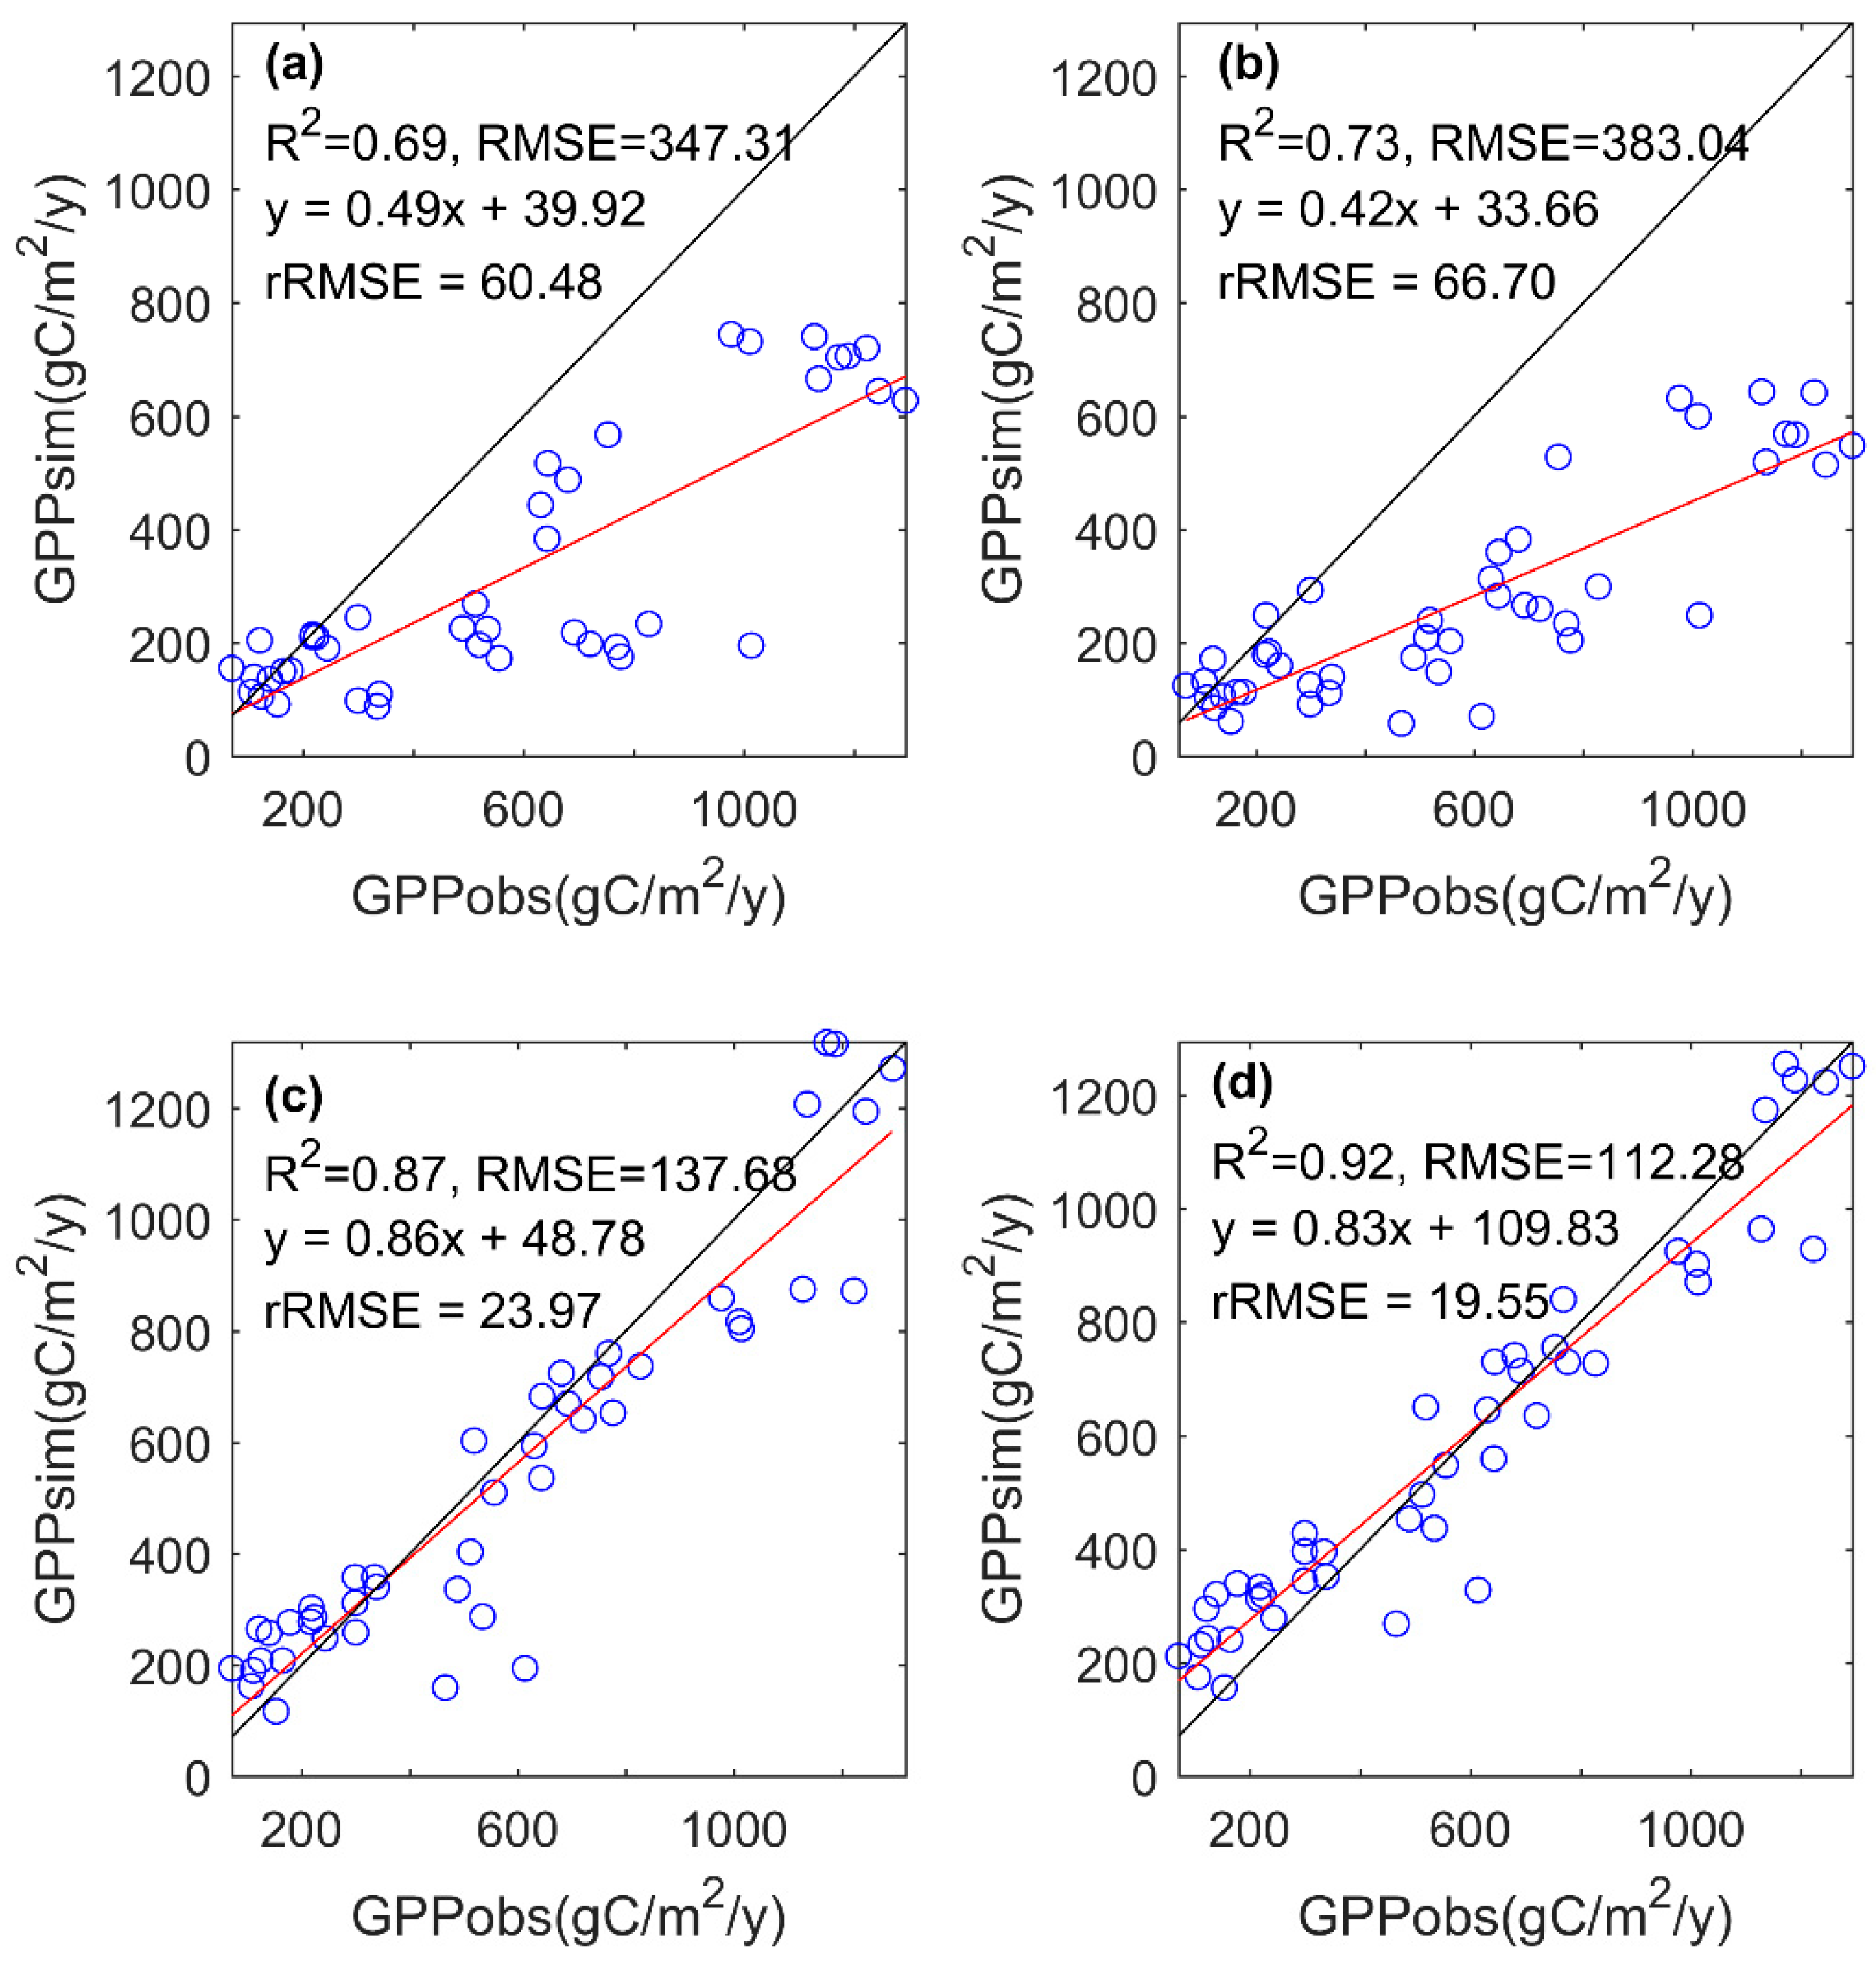
As we accumulated the observed and simulated GPP at a yearly timescale for every site, a significant underestimation of MOD17A2H GPP products also existed (Figure 4), which were similar to the results of the eight-day time scale. On an annual time scale, the simulated GPP showed a generally good agreement with the tower-observed GPP across all sites with R2 = 0.69, RMSE = 347.31 gC/m2/y and rRMSE = 60.48% (Figure 4a) A better relationship was found between the modeled GPP and tower-observed GPP (R2 = 0.73). The model was improved by using in situ climate forcing data. However, the modeled GPP was still underestimated as compared with observation. Moreover, the modeled GPP was significantly improved as we optimized the model parameters (Figure 4c,d). The modeled GPP was closer to the observed GPP (almost all points close to the 1:1 line), and all five parameters optimization results were better than for LUEmax parameter optimized only with R2 of 0.87 and 0.92, respectively. The rRMSE was 23.93% and 19.55%, respectively, which signifies the importance of optimizing the temperature and water-constrained factors in arid regions.
3.1.2. Biome-Specific Evaluation of MODIS GPP Product and MOD17 Algorithm
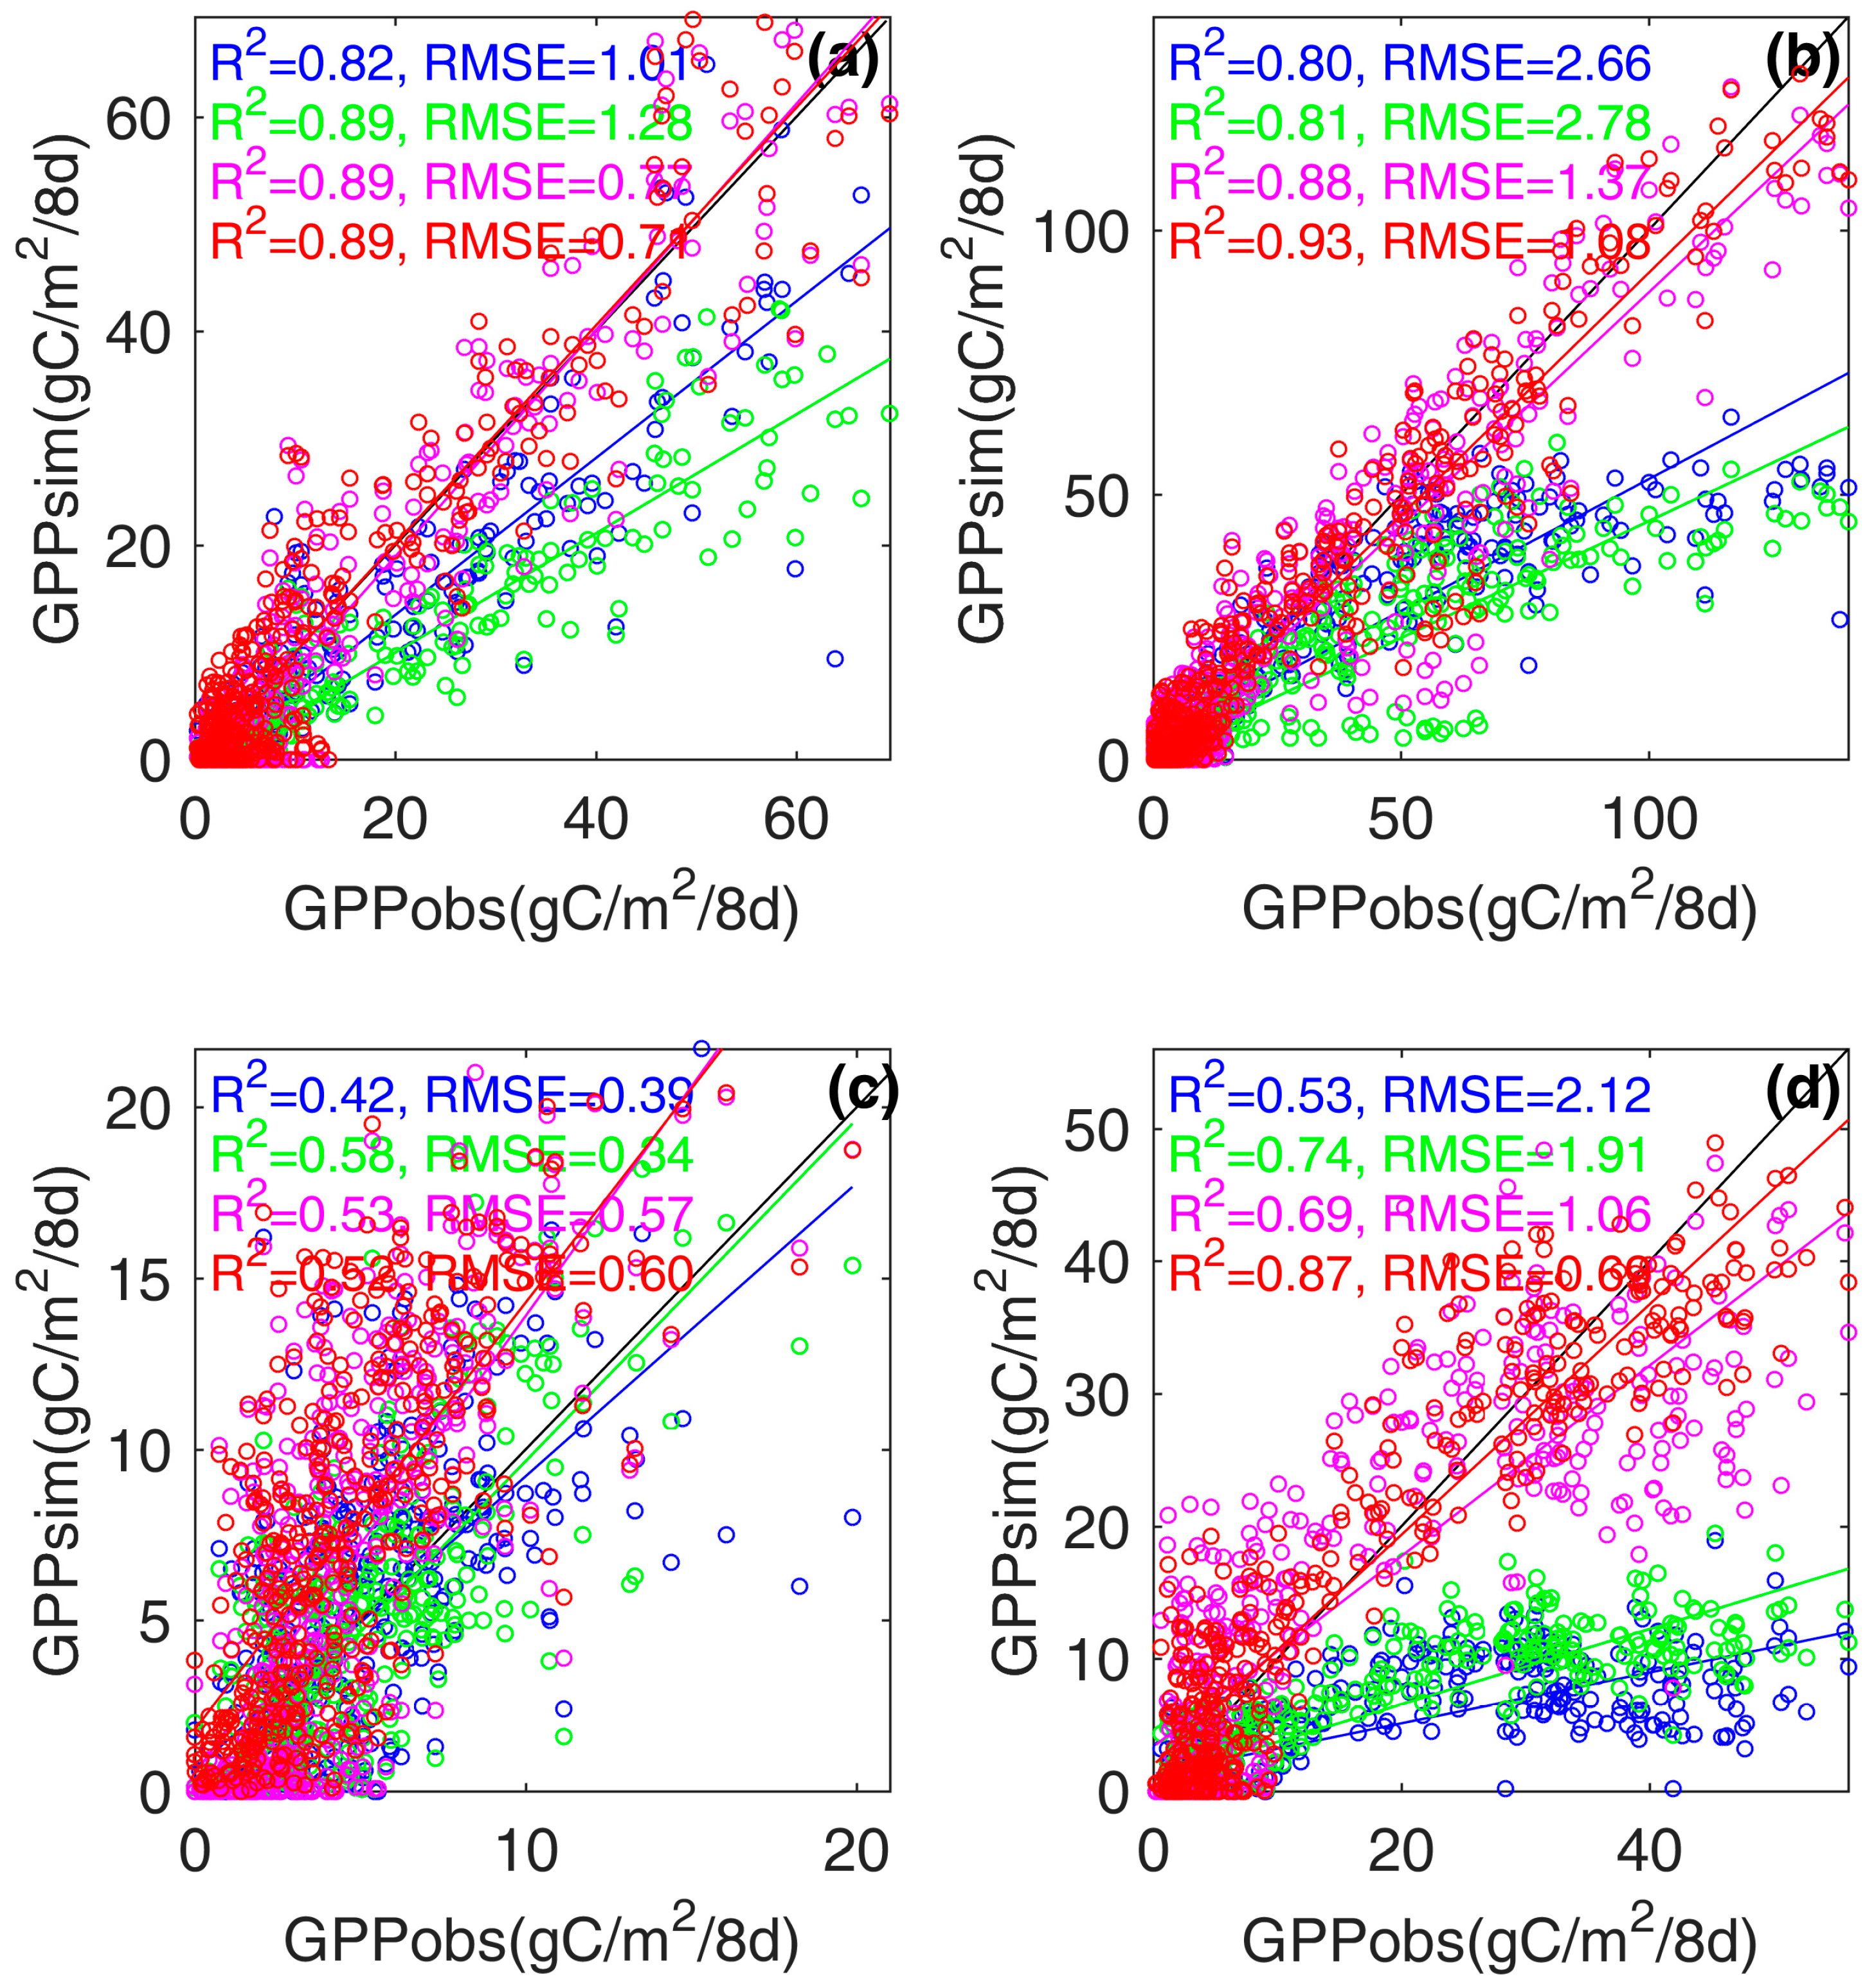
The MOD17A2H GPP products and the other three model estimated GPP based on MOD17 algorithm were compared with the flux-derived eight-day time scale of GPP values for various biome types (Figure 5). We divided the original grassland into two types, grasslands, and desert grasslands, because of the large diversities in species and climate conditions in these sites. As shown in Figure 5, the original MOD17A2H GPP products were significantly underestimated in grassland, cropland and forest ecosystems, but not in the desert ecosystems. A good correlation between MOD17A2H GPP products and EC-observed GPP is illustrated in grassland ecosystems (R2 = 0.82), followed by the cropland ecosystems (R2 = 0.80) and forest ecosystems (R2 = 0.53), while the weakest was in desert ecosystems (R2 = 0.42). In addition, the slope of the linear regression for the scatter plot can also revealed the biases between MOD17A2H GPP and tower-observed GPP. We can see the slope of linear regression at the forest ecosystems is far from the 1:1 line, which demonstrates the largest biases between MOD17A2H GPP and the tower based GPP, followed by those of the cropland ecosystems, then the grassland and desert ecosystems. Therefore, it indicates that larger biases existed in most ecosystems in the arid regions of China, especially for the forest and cropland ecosystems. As we used the in situ forcing data, we did not find significant improvement for all biome types, and the simulations of GPP forced with in situ data in most ecosystems were still underestimated. However, as we optimized the parameters of the MOD17 model, the GPP simulation results were improved significantly in most ecosystems. The scatter points of modeled GPP and EC-measured GPP were distributed closely around the 1:1 line, indicating that the GPP simulation results can be improved after the parameter optimization of LUEmax and other parameters in most ecosystems in the arid region. However, a larger bias still existed even after parameter optimization. The impacts of parameter optimization on GPP simulation of desert ecosystems were less, indicating that it is difficult to effectively simulate the GPP in desert ecosystems in the current MOD17 model.
3.1.3. Site-Specific Evaluation of MODIS GPP Products and MOD17 Algorithms
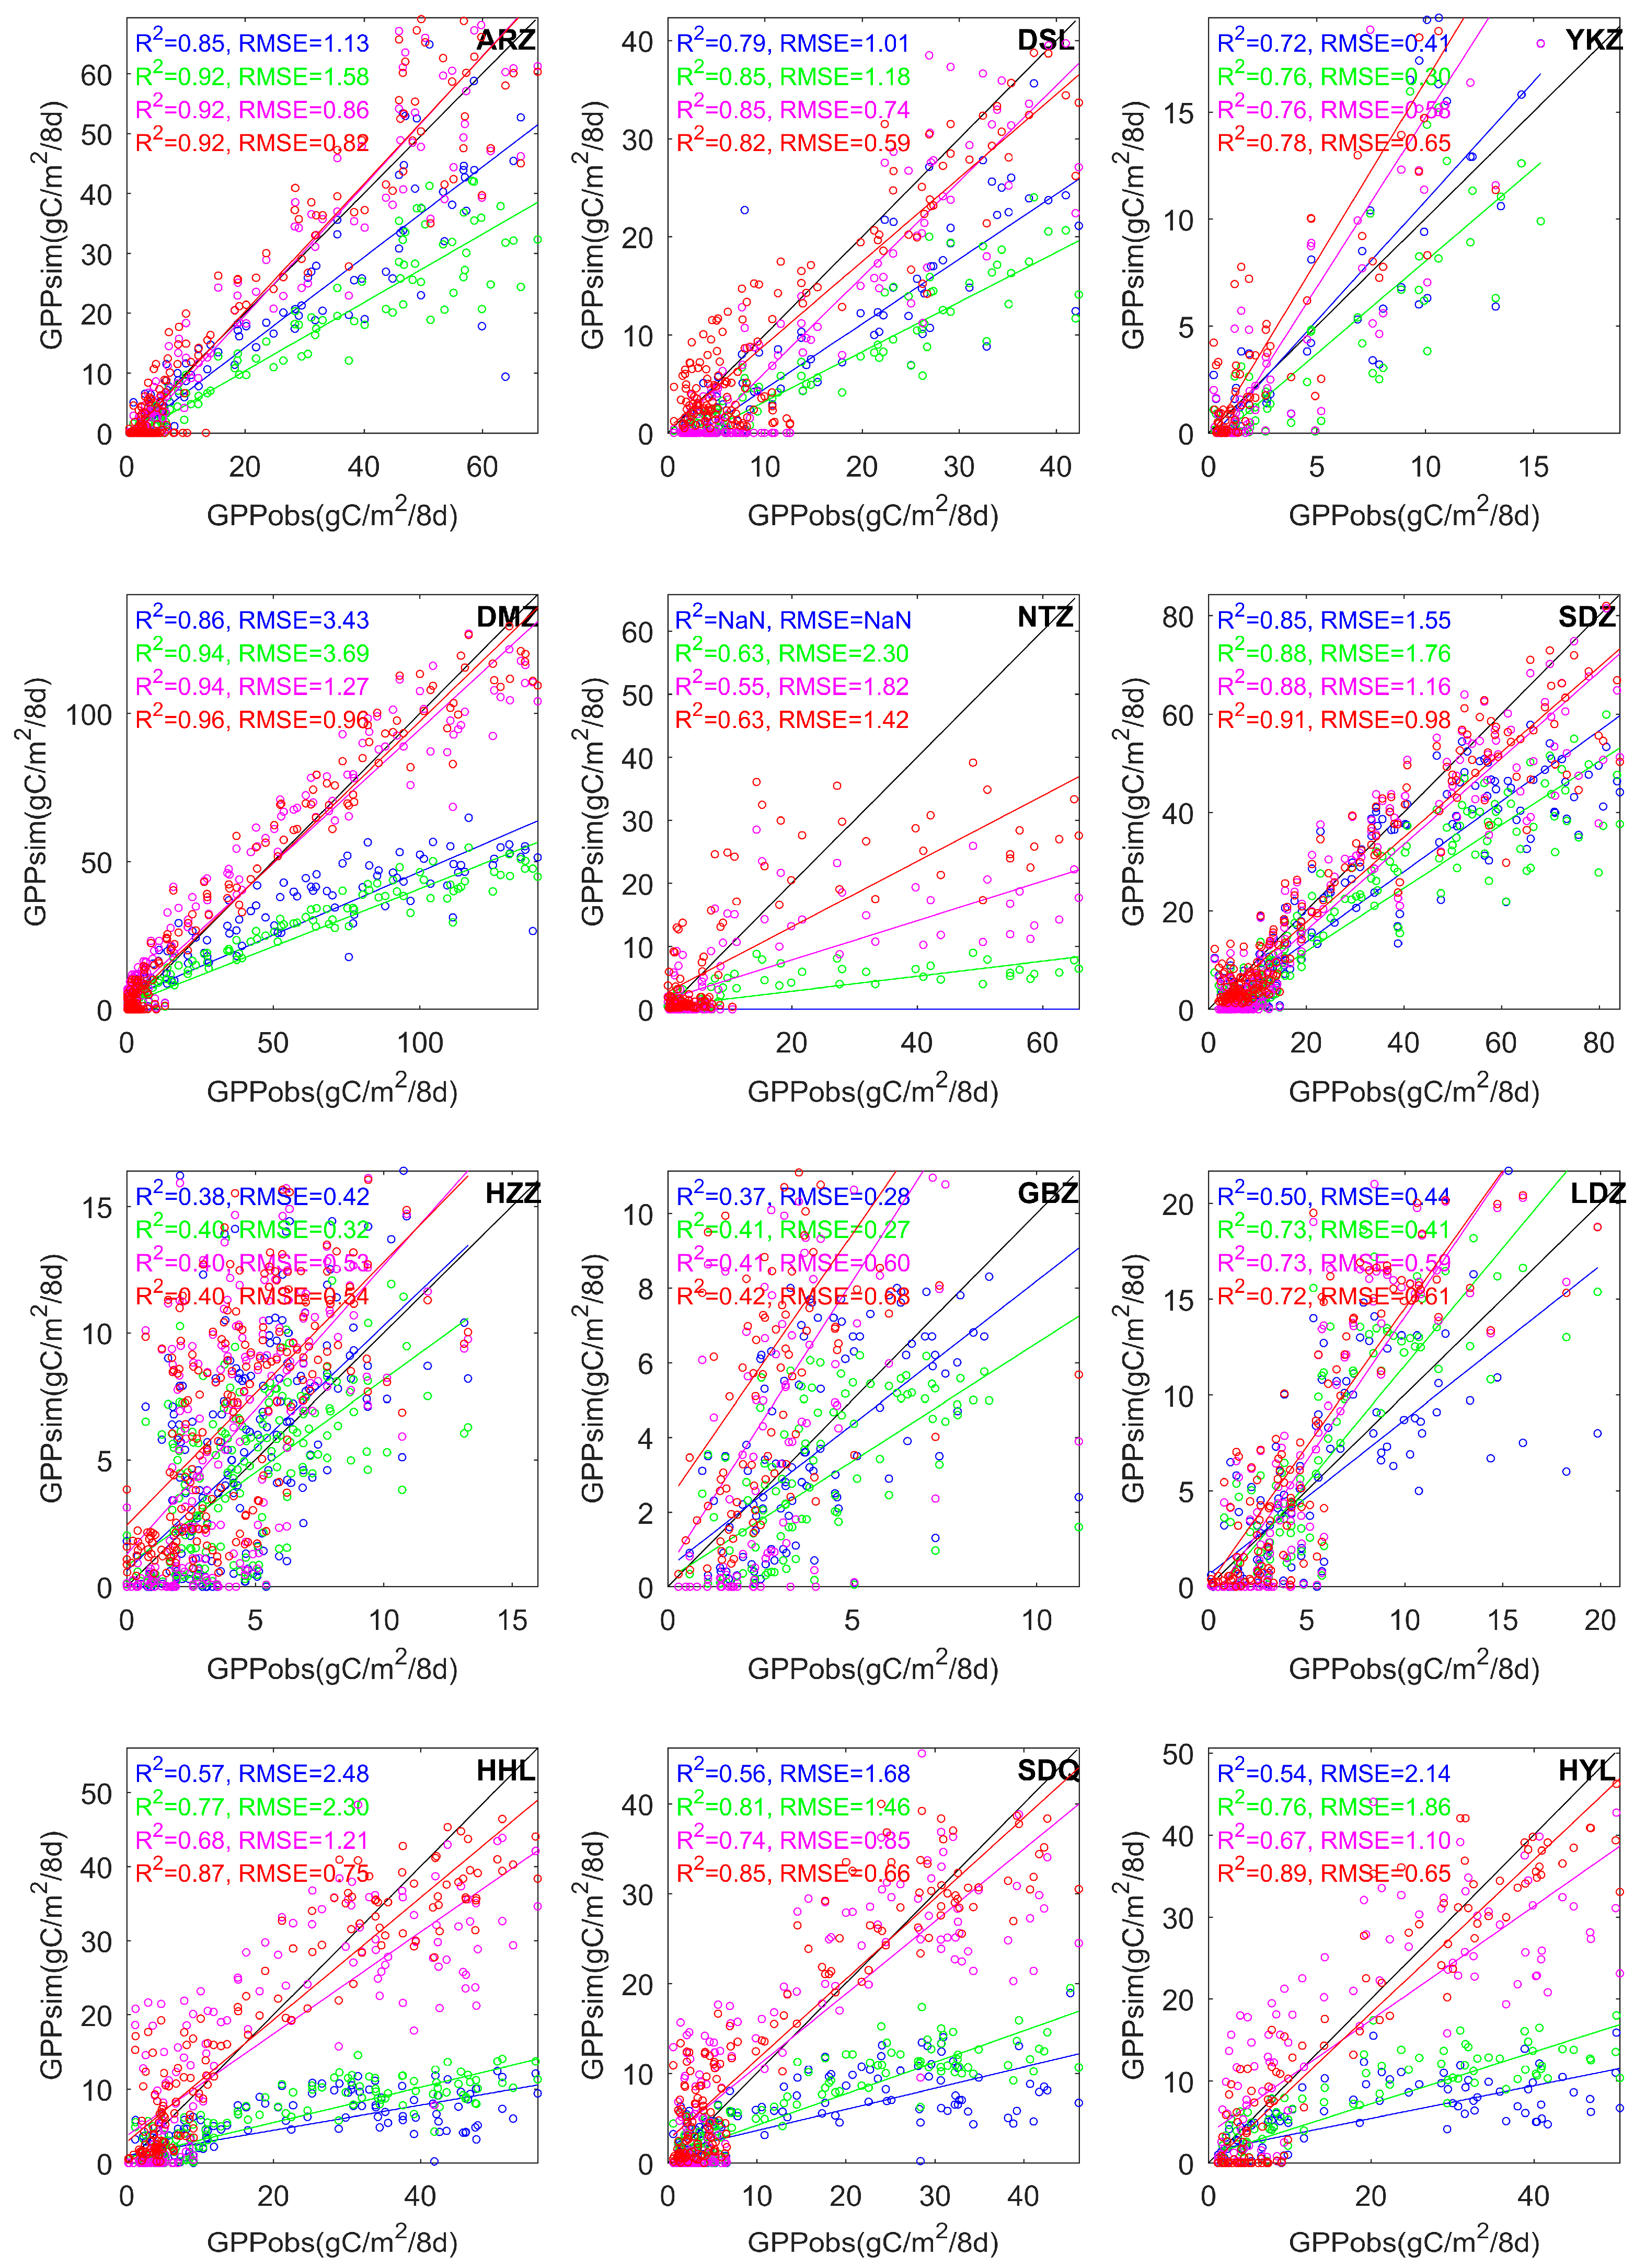
The flux tower-observed GPP were compared with the original MOD17A2H GPP and GPP estimated from the MOD17 model with in situ meteorology forcing data (GPP_Insitu), LUE optimized (GPP_LUEopt) and five optimized parameters (GPP_Fiveopt) (Figure 7 and Table 2). Figure 6 illustrates the scatter plots between EC GPP and simulated GPP at the eight-day time scale at all sites. From the slope of linear regression for the scatter plot in Figure 6, most of the slope values were less than 1.0, which revealed the MOD17A2H GPP in most of the sites were obviously underestimated, as compared with the flux tower-observed GPP (Figure 6), except for the three desert grassland sites, where MODIS GPP was close to the observed GPP in most cases. However, relatively large biases existed in the desert sites. While all sites of MODIS GPP were underestimated except the desert sites, a good correlation between MOD17A2H GPP and tower-observed GPP was shown in grassland and cropland sites (coefficients of determination were greater than 0.7), followed by forest and desert ecosystems. After modelling GPP using in situ climate data, a better correlation between modeled GPP and observed GPP occurred in most sites. However, there were still apparently underestimations in most sites, which means the forcing data were not the main reason of the underestimation of GPP. Instead of the forcing data, the inappropriate BPLUT parameters were the main source of the uncertainty of GPP simulation. After the optimization of LUE and other parameters in the MOD17 model, GPP in most sites was improved significantly. Meanwhile, the performance of optimization of five parameters was better than that of only optimization of the LUE parameter. As shown in Table 2 and Figure 6, good performance of GPP simulation was observed in DMZ, ARZ, and SDZ (R2 were greater than 0.9). However, the MODIS GPP showed a moderate performance in capturing the corresponding GPP simulation of desert ecosystems. Overall, the current MODIS GPP model correctly simulated the dynamics of GPP at most sites in the arid region. After the parameter optimization, the coefficients of determination were improved apparently, and the RMSE of most sites was less than 1 gC/m2/day.
3.2. Uncertainty of Satellite Data in MODIS GPP Simulation over Ecosystems in the Arid Region
3.2.1. Impacts of the Accuracy of the Land Cover Classification on MODIS GPP Simulation
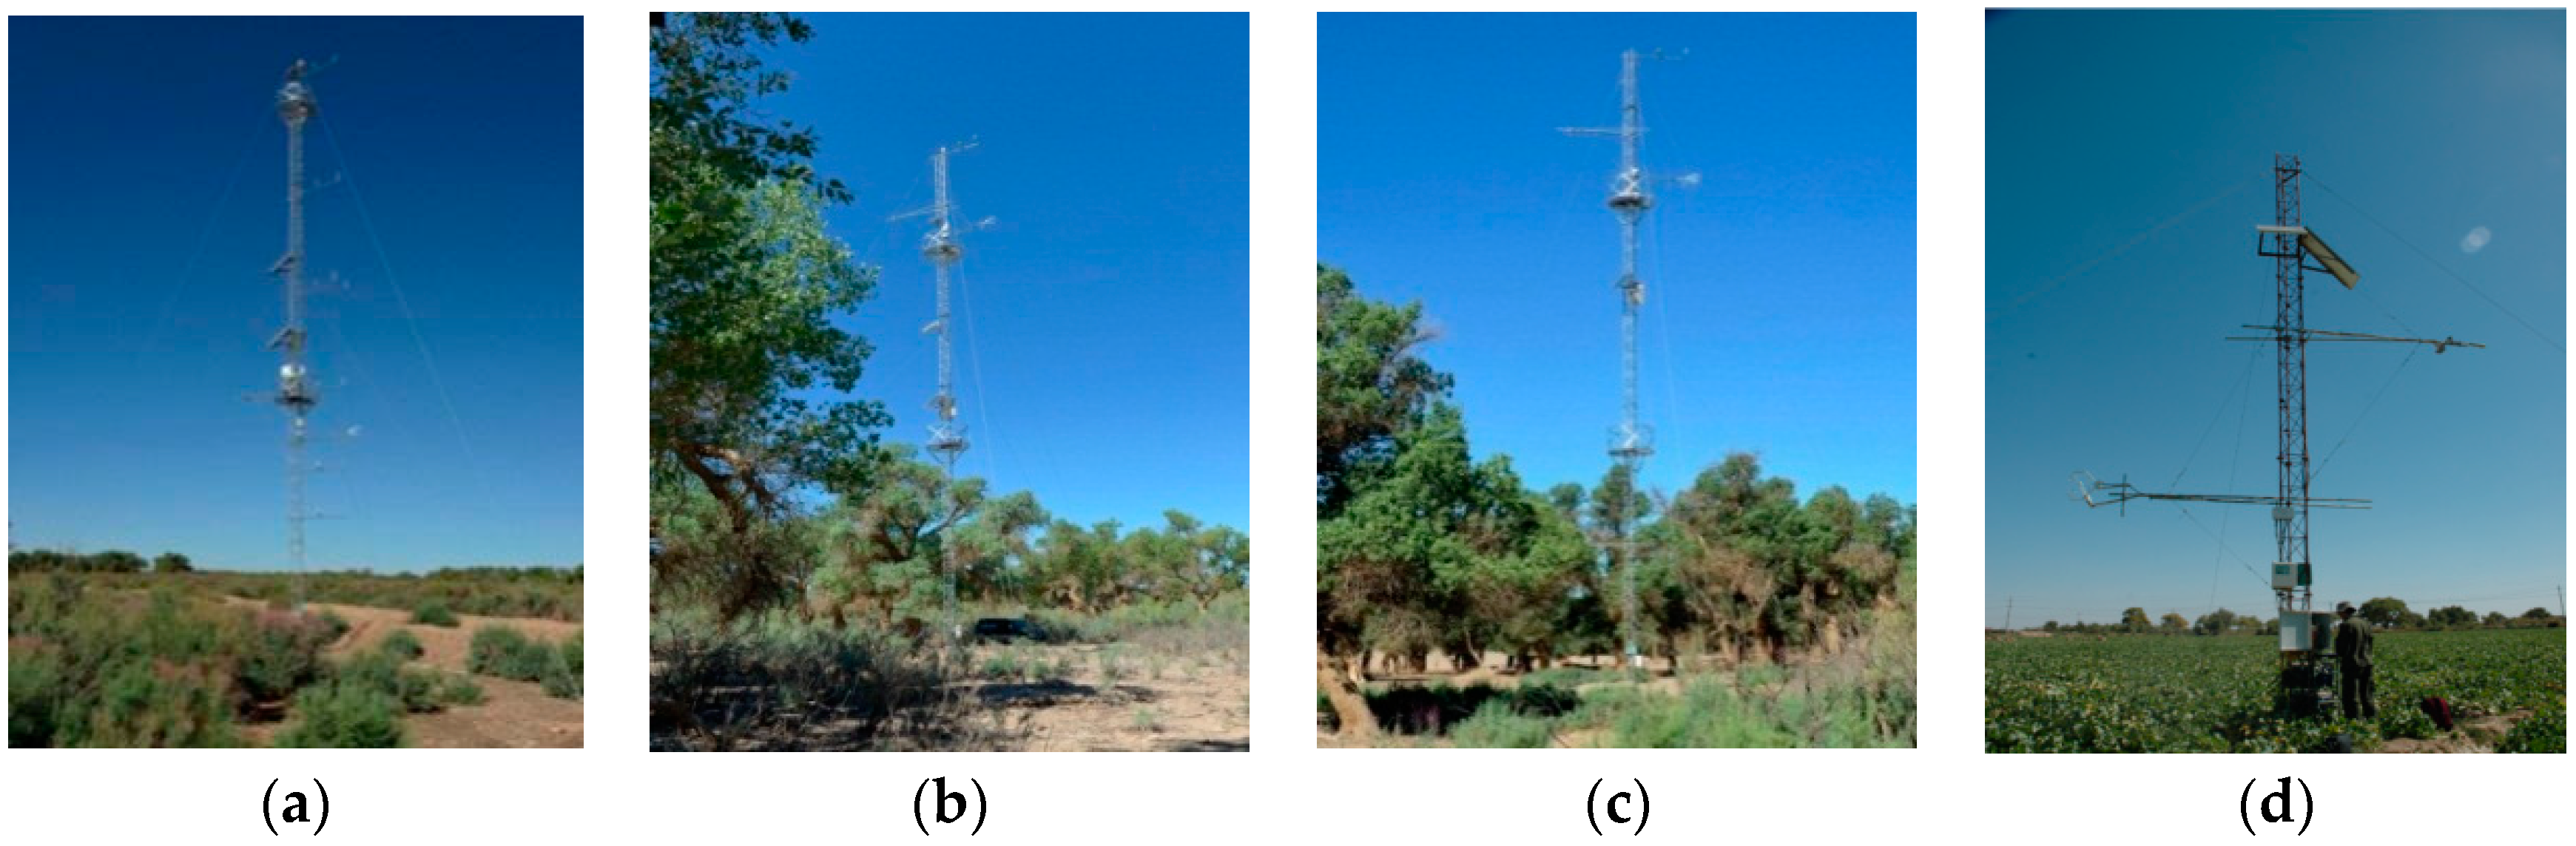
One of the first MODIS products used in the MOD17 algorithm is the Land Cover Product, MOD12Q1. The importance of this product cannot be overstated as the MOD17 algorithm relies heavily on land cover type through use of the BPLUT [15]. Based on the locations of the flux tower sites, we obtained the land cover type of each site from the MCD12Q1 results, and compared them with the actual land cover types. We found that MCD12Q1 misclassified most of the sites downstream of the HRB (Figure 7), which is an artificial oasis ecotone with sparse vegetation in the extremely arid region of China. For example, in our study, the land cover type of the NTZ site is a cropland ecosystem; however, it was classified as grassland in the MCD12Q1 land cover data (Figure 7). In addition, MCD12Q1 also misclassified the forest types at the sites of HHL, SDQ, and HYL as grassland.
3.2.2. Impacts of Uncertainty of FPAR Data on MODIS GPP Simulation
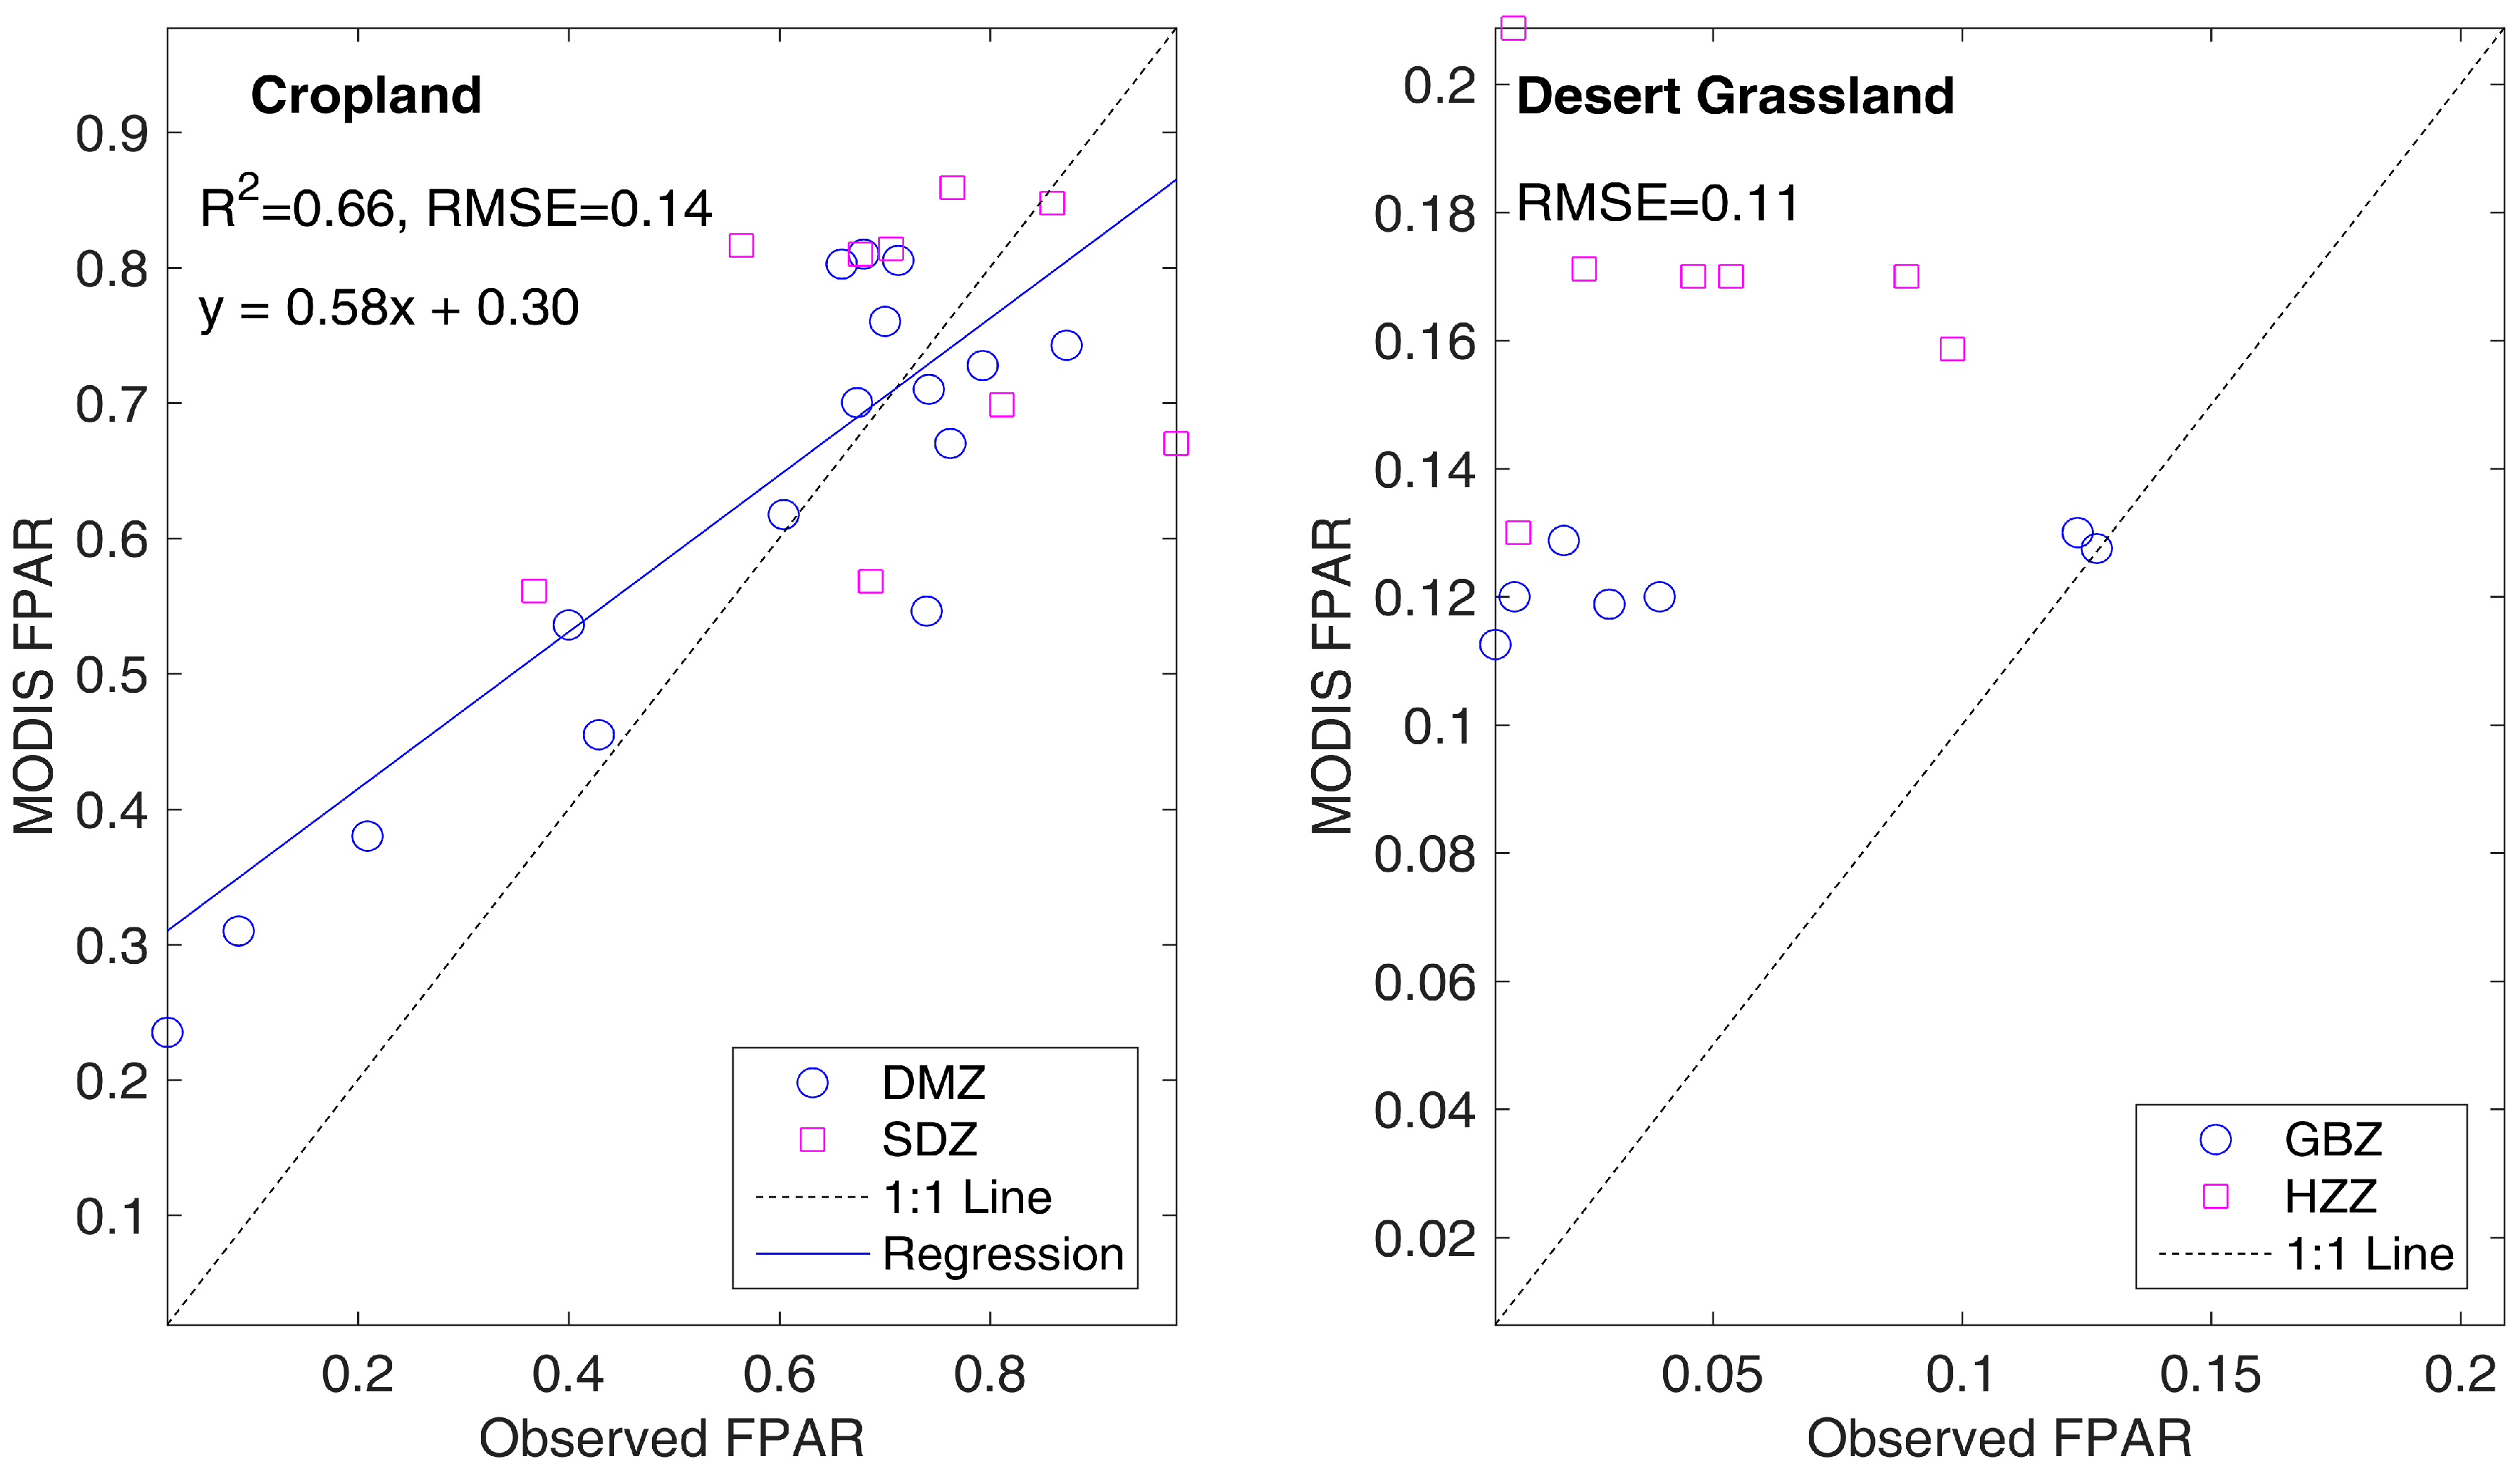
Figure 8 showed the comparisons of AccuPAR observed FPAR data with the MOD15A2H FPAR data in the corresponding sites in HRB. We found the MODIS FPAR data was overestimated compared to the observations in the growing season of desert grassland sites, as well as the low values of FPAR in the cropland sites, and underestimated in some stages of the high values of FPAR in the cropland sites. The overestimated FPAR impacted the APAR, thus leading to an overestimated GPP. In contrast, the underestimated FPAR would underestimate the GPP. Meanwhile, a good correlation between MODIS FPAR and observed FPAR occurred in cropland sites, while in the desert grassland sites, no significant relationship was found. This revealed that the accuracy of the current MOD15A2H FPAR data in the arid region needs to be further improved, and could also be an important source of uncertainty for the estimation of GPP in desert ecosystems.
3.3. Uncertainty and Variability of Biophysical Parameters for Diversity Ecosystems in Arid Regions
Since the performance after calibration of all five parameters of the MOD17 model was better than after the calibration of only the parameter εmax, indicating the important role of temperature and water-constrained factors in the estimation of GPP in the arid region. We thus calibrated all the parameters of MOD17 algorithms (Table 3). Our study illustrated that variability of biophysical parameters not only exist across different ecosystems, but also within the same ecosystems, such as the diverse biophysical parameters of grassland ecosystems and the desert grassland ecosystems. The current version of MOD17 BPLUT does not consider the differentials of these two types—they shared the same BPLUT parameters of grassland. However, there are different climate conditions and species in these two ecosystems in the study region. Meanwhile, there are different photosynthesis paths between C3 cropland and C4 cropland, which have many differences in their biophysical properties. However, these two types are also shared in the current version of MOD17 BPLUT.
The value of εmax is biome specific, representing the maximum LUE of the corresponding vegetation in the process of photosynthesis. For a given biome type, the value of εmax is constant and assigned by the MOD17 BPLUT. While the newly released version of BPLUT has corrected and updated the εmax values, the εmax value were still significantly underestimated in the main ecosystems in arid regions (Table 3). The mis-estimation of their values inherently further reduced the accuracy of GPP estimations.
Meanwhile, the large variations in the temperature and water-constrained stress factors also existed due to the diversity of climate conditions in different parts of HRB (Table 3). For example, the climate is cold and humid in the upstream HRB, therefore, the temperature stress factor has a great impact on GPP estimation in the grassland ecosystems in the upstream HRB. However, as Table 3 reveals, the original MOD17 BPLUT overestimated the parameters of the minimum temperature stress factors and the VPDmax values. In comparison, the climate is extremely arid in the downstream HRB, however, the original MOD17 BPLUT underestimated the parameters of the maximum temperature stress factors and the VPDmax values.
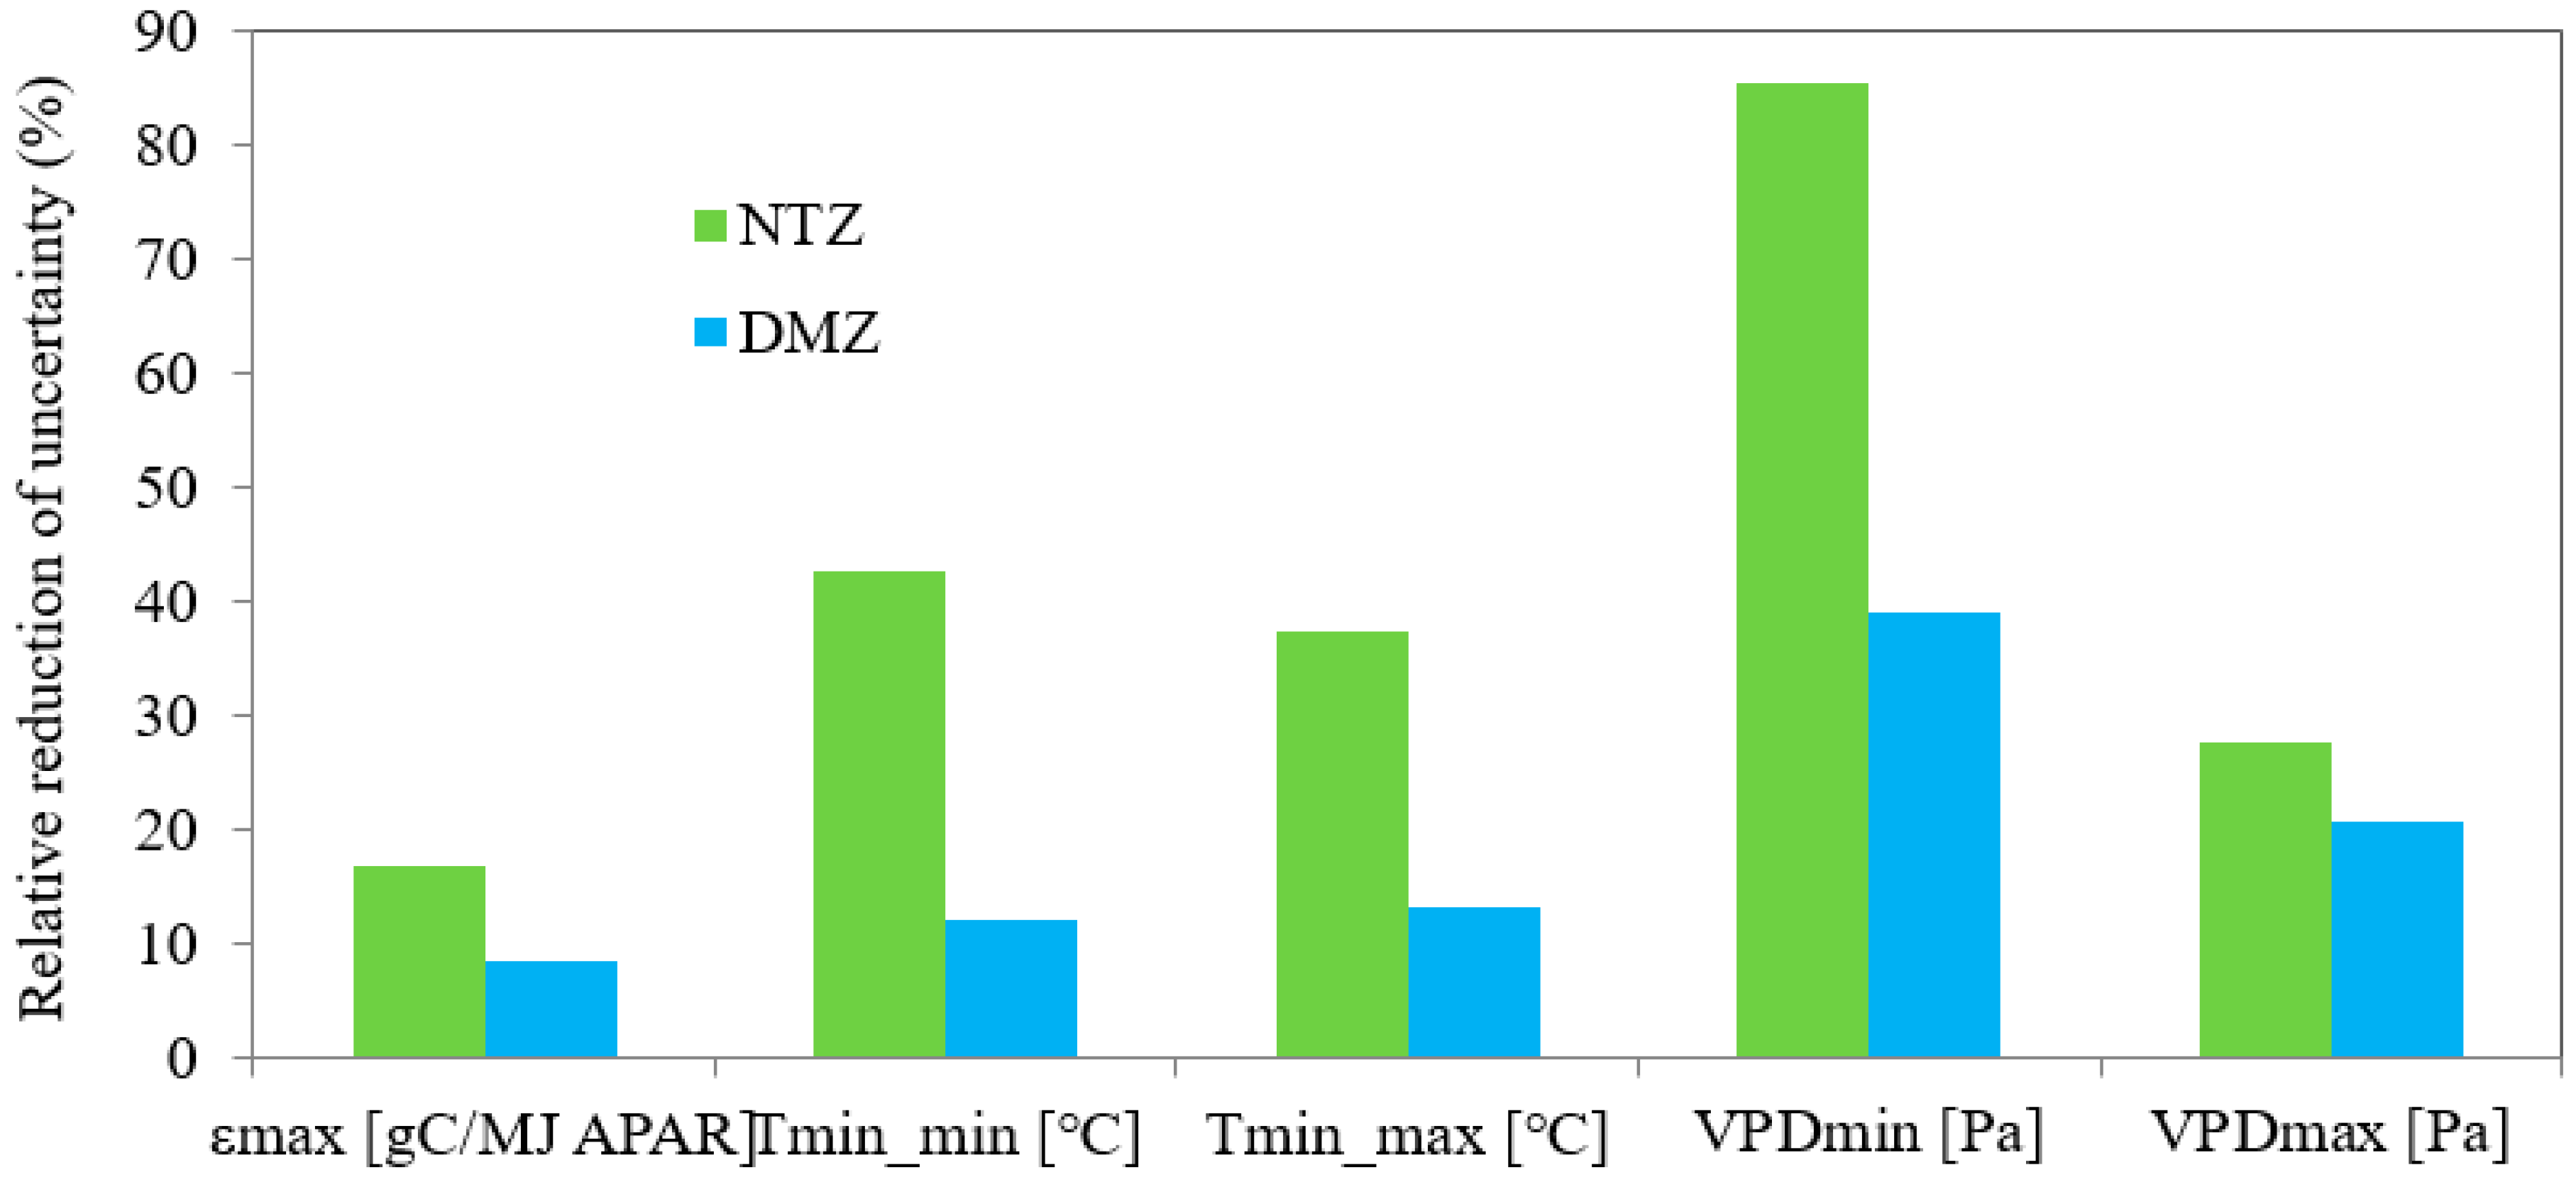
In addition, the Bayesian approach can estimate the posterior distribution of model parameters, which is a useful tool to reduce model uncertainty. Using the Bayesian approach, the uncertainty of model parameters was reduced significantly for some sites (e.g., the NTZ site) located in the extremely arid region (Figure 9).
4. Discussion
4.1. Evaluations of the MOD17A2H Products over Diversity Ecosystems in the Arid Region
The MODIS Collection 6 GPP products improved the spatial resolution of GPP estimation, which means the estimated GPP is more comparable with the footprint in the areas with heterogeneous landscapes in the desert–oasis–alpine ecosystems in the arid region. Meanwhile, the MOD17A2H products updated the meteorological forcing data, FPAR data and land cover data, which highlight the better spatial resolution of 500 m. However, compared to the flux tower-based GPP data, the MOD17A2H GPP products still illustrate some limitations in the simulations of magnitude and spatial-temporal variation of GPP in the desert–oasis–alpine ecosystems in the arid region. From the slope of linear regression for the scatter plot in Figure 3a and Figure 4a, the slope values were only 0.49, which revealed significant underestimation of the GPP in the study region. When compared to the site level of flux tower-based GPP (Figure 6), the slope values in most sites of the study regions were also less than 1.0, except for some desert ecosystem sites. This showed that the MOD17 product underestimated GPP in most high productivity sites of cropland, grassland, and forest ecosystems in the arid region, but overestimated GPP at some low productivity sites of desert ecosystems compared with tower-based GPP, consistent with the results of Reference [12] and Reference [27].
4.2. Uncertainty of Input Data in MODIS GPP Estimation in Diversity Ecosystems in the Arid Region
The accuracy of GPP estimation highly depends on the precision of all input data of the MOD17A2H GPP algorithm. Therefore, uncertainties of GPP products arise mainly from the climate drivers, parameter variability, and land cover classification [20]. There are three meteorological data types (PAR, Tmin and VPD), as well as FPAR and land cover classification data involved in the MOD17A2H GPP algorithm, which could be the main source of error in the GPP estimates. The MOD17A2H products used GMAO Reanalysis data for direct meteorological inputs, which is an hourly time-step data set with about a half-degree spatial resolution (0.5 latitude degree by 0.67 longitude degree) generated by the Goddard Earth Observing System Model, Version 5 (GEOS-5) data assimilation system [15]. In this study, we replaced the GMAO dataset with in situ meteorological data and recalculated the MOD17 algorithm with default parameters in comparison (GPP_Insitu). Our study revealed that using the in situ forcing data can improve the relationship between modeled GPP and tower-observed GPP compared to the original MOD17A2H products both at eight-day and annual timescales (Figure 3 and Figure 4); the determination coefficients (R2) of these sites were slightly higher than that of the original MOD17 products (R2 ranging from 0.71 to 0.79 for eight-day step and 0.69 to 0.73 for annual step). However, larger biases still exist between GPP_Insitu and GPP_tower. Using in situ meteorological data did not result in obvious improvements of the GPP estimation performances; on the contrary, some sites were not even as accurate as those calculated with the GMAO datasets (ARZ, DSL, DMZ, and SDZ in Table 2), which is similar to the other results from validation of the MOD17 GPP products [21,27,32]. This is caused by some missing values in the original MOD17A2H GPP products making a shorter length of model evaluations, thus reducing the model errors of the GPP_MODIS. The other implication of the results is that an improvement in meteorological data did not have a significant effect on the MODIS GPP estimation, which means the meteorological data is not the main source of uncertainty in GPP simulation in the arid region.
An accurate land cover classification map is vital to MOD17 GPP simulation [18]. Misclassification of the land cover directly determines the value of maximum light use efficiency and the other MOD17 BPLUT parameters, thus further influencing the inaccuracies of GPP calculation [20]. We validated the MOD12Q1 vegetation maps with our site observations and found the MODIS data misclassified almost all sites of forest and cropland types in the downstream HRB (Figure 7). Study suggested that the accuracies of MOD12Q1 vegetation maps are within 65–80%, and most inaccuracies are in between similar classes [55]. Since large desert–natural oasis ecosystems are distributed in the downstream HRB and most of the vegetation cover was less than 30%, the 500 m unit of MODIS land cover classification could pose a risk at such a coarse resolution. Mixed pixels, composed of varied ecosystem types, may occur in the sparsely vegetated region, thus making it difficult to describe the biophysical parameters properly. This incorrect classification of land cover types will therefore lead to an inaccurate GPP calculation.
In addition, FPAR is also an important input physiology variable in the MOD17 model, which directly modulates the essential energy input to photosynthetic processes [8,9]. In our study, we compared the MOD15A2H FPAR products with the observations in the study area, and found it significantly overestimated the ecosystems with low productivity (such as the desert ecosystems) and underestimated the ecosystems with high productivity (such as the crop ecosystems) in MODIS FPAR products in the HRB (Figure 8). This will greatly impact the energy redistribution in photosynthetic systems, and thus the GPP estimations in arid regions. Research revealed that FPAR often produces misleading signals in GPP estimations due to contamination by atmospheric characteristics [19]. The overestimation of FPAR data is caused by sparse vegetation cover and the effects of large desert cover that impacts the signals of vegetation detection in arid regions. To improve the FPAR estimation in the arid region, we can use the improved FPAR retrieval products with the multi-angle vegetation index information in the future [56].
4.3. Uncertainty and Variability of Biophysical Parameters in Modelling GPP over Diversity Ecosystems in Arid Regions
To estimate GPP across varied worldwide ecosystems, MOD17 algorithms use the biophysical variability of parameters generated from look up tables, which include five biome-specific physiological parameters in the model, i.e., εmax, Tmin_min, Tmin_max, VPDmin, and VPDmax [56]. In this study, we optimized the maximum LUE, one of the most important parameters for GPP estimation, with the tower-based GPP. An obvious improved performance of GPP simulation can be found in Figure 3c and Figure 4c, which show good agreements between the observed GPP and the simulated GPP with the parameter optimized (GPP_LUE). The R2 increased from 0.71 to 0.86, and rRMSE decreased from 12.45% to 6.99%, at an eight-day timescale. Those improved performances were also seen at an annual timescale, with R2 increasing from 0.69 to 0.87, and rRMSE decreasing from 60.48% to 23.97%. Table 2 reveals the performance of the GPP_LUE model and flux GPP observation were better than the results of only using the ground forcing data; the determination coefficients increased significantly when using optimized εmax parameter, with smaller RMSE, which revealed greater improvements after performing LUE optimization.
Calibration of the maximum LUE parameter improved the performance of MODIS GPP estimation was in accordance with other studies [24,27,32]. In addition, we also investigated the potential impacts of uncertainty of the other model parameters (e.g., VPD-limited factors) on GPP monitoring, which has been overlooked by other researchers. In fact, water stress is one of the most important limiting factors controlling terrestrial primary production, especially in arid regions. Previous studies showed that the MOD17 products underestimate water stress, and thus overestimate GPP in some extremely arid regions lacking in water [57]. In our study, we found that optimizing the VPD-limited factors can further improve the performance of the GPP estimations. From the eight-day time step of the overall performances, the R2 increased from 0.86 for the results of only optimizing the LUE parameter to 0.91 for the results of optimizing all parameters, and rRMSE decreased from 6.99% to 5.59% (Figure 3). These results were mainly distributed in some sites in the extremely arid region (i.e., SDQ, HHL, HYL etc.), which revealed the important role of the parameters of water-constrained factors in GPP simulation in arid regions.
4.4. Uncertainty of GPP Modelling of the Desert Ecosystems and Its Implications for GPP Simulation in Arid Regions
The current MOD17 model can effectively simulate GPP of main ecosystems in the arid region, however, there are still some difficulties in simulating GPP more accurately in the desert ecosystems. Model analyses indicate the importance of arid regions in the global carbon cycle, while the models suffer from a lack of data in water-limited regions [3,4]. The large errors of GPP simulation in desert ecosystems is caused by the uncertainty of remote sensing vegetation products in regions with large heterogeneity of landscape and low vegetation cover. Moreover, the uncertainty of flux tower observation in desert ecosystems makes it is difficult to estimate a relative ‘true’ value of GPP [58]. To improve GPP estimation in arid regions, several directions can be explored further in the future. For example, improving the estimation of MODIS FPAR and land cover classification products in arid regions using data-driven approaches [59] and improving model structures [60] could be better choices for improving GPP simulation in arid regions.
Meanwhile, since the biome-specific look up tables (BPLUT) are constant for a given biome at any time. Since the current BPLUT of the MOD17 cannot meet the needs of accurate definition of the parameters for all ecosystems [19,61], especially for the diverse and complex ecosystems in arid regions, further research needs to be done to update these BLUPT of the model. In addition to update the parameter of εmax, the water and temperature-limited parameters are also of great importance in GPP estimation, especially for the ecosystems in arid regions. As the development of eddy covariance technique, there are more than 900 EC flux sites in the world currently [62]. With the availability of these large number of flux datasets, it provided us the opportunity to retrieve the biome specific parameters for each vegetation type more reasonable, which may improve the accuracy of the current GPP simulation in the arid region.
5. Conclusions
This study validated and optimized the performance of MODIS-derived GPP compared with EC-observed GPP at seasonal and annual time scales for the main arid ecosystems relying on flux networks constructed in arid and semi-arid ecosystems in China. Our study revealed that the current MODIS GPP products were significantly underestimated, as compared with the tower-observed GPP for most types of ecosystems in the arid region of China, especially the irrigated cropland and forest ecosystems, due to uncertainty of meteorological data and model parameters. Using ground-based meteorological data and updated land use data can improve GPP estimation. In addition to the light-use efficiency parameters, the temperature-limited stress factors and the VPD-limited factors also need to be recalibrated for ecosystems in arid regions. After using the proper model parameters, great improvements to the GPP model can be performed through a Bayesian approach. However, it is difficult to estimate GPP accurately in desert ecosystems because of the uncertainty of remote sensing vegetation products in arid regions. Hence, improvements in modelling GPP in desert ecosystems are needed in future studies. Moreover, this study implies that the current MODIS-derived GPP product requires further improvements to provide accurate monitoring of terrestrial ecosystem productivity in arid regions worldwide.
Author Contributions
H.W. and X.L. designed the research, analyzed data and prepared the manuscript. M.M. and L.G. provided suggestions to data analyses. All of the authors thoroughly reviewed and edited this paper.
Funding
This research was funded by the Strategic Priority Research Program of the Chinese Academy of Sciences (Grant No. XDA20100104), the National Natural Science Foundation of China (grant numbers: 91425303, 41871250, 41601482, 41471448), and the China Postdoctoral Science Foundation funded project (Grant No. 2016T90960).
Acknowledgments
We thank the two reviewers’ insightful and helpful comments and suggestions to our manuscript. We are grateful to Kashif Jamal for the help of English editing of our revised manuscript and appreciate the availability of the MODIS data from the Oak Ridge National Laboratory Distributed Active Center (ORNL DAAC) website.
Conflicts of Interest
The authors declare no conflict of interest.
References
- Asner, G.P.; Archer, S.; Hughes, R.F. Net changes in regional woody vegetation cover and carbon storage in Texas dry-lands, 1937–1999. Glob. Chang. Biol. 2003, 9, 316–335. [Google Scholar] [CrossRef]
- Bastin, J.F.; Berrahmouni, N.; Grainger, A.; Maniatis, D.; Mollicone, D.; Moore, R.; Patriarca, C.; Picard, N.; Sparrow, B.; Abraham, E.M.; et al. The extent of forest in dryland biomes. Science 2017, 356, 635–638. [Google Scholar] [CrossRef] [PubMed] [Green Version]
- Ahlström, A.; Raupach, M.R.; Schurgers, G.; Smith, B.; Arneth, A.; Jung, M.; Reichstein, M.; Canadell, J.G.; Friedlingstein, P.; Jain, A.K.; et al. The dominant role of semi-arid ecosystems in the trend and variability of the land CO2 sink. Science 2015, 348, 895–899. [Google Scholar] [CrossRef] [PubMed]
- Poulter, B.; Frank, D.; Ciais, P.; Myneni, R.B.; Andela, N.; Bi, J.; Broquet, G.; Canadell, J.G.; Chevallier, F.; Liu, Y.Y.; et al. Contribution of semi-arid ecosystems to interannual variability of the global carbon cycle. Nature 2014, 509, 600–603. [Google Scholar] [CrossRef] [PubMed]
- Lal, R. Carbon sequestration in dryland ecosystems. Environ. Manag. 2004, 33, 528–544. [Google Scholar] [CrossRef] [PubMed]
- Reynolds, J.F.; Smith, D.M.; Lambin, E.F.; Turner, B.L.; Mortimore, M.; Batterbury, S.P.; Downing, T.E.; Dowlatabadi, H.; Fernández, R.J.; Herrick, J.E.; et al. Global desertification: Building a science for dryland development. Science 2007, 316, 847–851. [Google Scholar] [CrossRef] [PubMed]
- Beer, C.; Reichstein, M.; Tomelleri, E.; Ciais, P.; Jung, M.; Carvalhais, N.; Rödenbeck, C.; Arain, M.A.; Baldocchi, D.; Bonan, G.B.; et al. Terrestrial gross carbon dioxide uptake: Global distribution and covariation with climate. Science 2010, 329, 834–838. [Google Scholar] [CrossRef] [PubMed]
- Running, S.W.; Nemani, R.R.; Heinsch, F.A.; Zhao, M.; Reeves, M.; Hashimoto, H. A continuous satellite-derived measure of global terrestrial primary production. Bioscience 2004, 54, 547–560. [Google Scholar] [CrossRef]
- Xiao, X.M.; Zhang, Q.Y.; Braswell, B.; Urbanski, S.; Boles, S.; Wofsy, S.; Berrien, M.; Ojima, D. Modeling gross primary production of temperate deciduous broadleaf forest using satellite images and climate data. Remote Sens. Environ. 2004, 91, 256–270. [Google Scholar] [CrossRef]
- Yuan, W.P.; Liu, S.G.; Zhou, G.S.; Zhou, G.Y.; Tieszen, L.L.; Baldocchi, D.; Bernhofer, C.; Gholz, H.; Goldstein, A.H.; Goulden, M.L.; et al. Deriving a light use efficiency model from eddy covariance flux data for predicting daily gross primary production across biomes. Agric. Forest Meteorol. 2007, 143, 189207. [Google Scholar] [CrossRef]
- Ma, X.; Huete, A.; Moran, S.; Ponce-Campos, G.; Eamus, D. Abrupt shifts in phenology and vegetation productivity under climate extremes. J. Geophys. Res. Biogeosci. 2015, 120, 2036–2052. [Google Scholar] [CrossRef]
- Turner, D.P.; Ritts, W.D.; Cohen, W.B.; Gower, S.T.; Running, S.W.; Zhao, M.S.; Costa, M.H.; Kirschbaum, A.A.; Ham, J.M.; Saleska, S.R.; et al. Evaluation of MODIS NPP and GPP products across multiple biomes. Remote Sens. Environ. 2006, 102, 282–292. [Google Scholar] [CrossRef]
- Biederman, J.A.; Scott, R.L.; Bell, T.W.; Bowling, D.R.; Dore, S.; Garatuza-Payan, J.; Kolb, T.E.; Krishnan, P.; Krofcheck, D.J.; Litvak, M.E.; et al. CO2 exchange and evapotranspiration across dryland ecosystems of southwestern North America. Glob. Chang. Biol. 2017, 23, 4204–4221. [Google Scholar] [CrossRef] [PubMed]
- Zhao, M.; Running, S.W.; Nemani, R.R. Sensitivity of Moderate Resolution Imaging Spectroradiometer (MODIS) terrestrial primary production to the accuracy of meteorological reanalyses. J. Geophys. Res. 2006, 111, G01002. [Google Scholar] [CrossRef]
- Running, S.W.; Zhao, M. Daily GPP and Annual NPP (MOD17A2/A3) Products NASA Earth Observing System MODIS Land Algorithm; MOD17 User’s Guide; University of Montana: Missoula, MT, USA, 2015; pp. 1–28. [Google Scholar]
- Chasmer, L.; Barr, A.; Hopkinson, C.; McCaughey, H.; Treitz, P.; Black, A.; Shashkov, A. Scaling and assessment of GPP from MODIS using a combination of airborne lidar and eddy covariance measurements over jack pine forests. Remote Sens. Environ. 2009, 113, 82–93. [Google Scholar] [CrossRef]
- Running, S.W.; Zhao, M. MOD17A2H MODIS/Terra Gross Primary Productivity 8-Day L4 Global 500 m SIN Grid V006; USGS: Reston, VA, USA, 2015.
- Heinsch, F.A.; Zhao, M.; Running, S.W.; Kimball, J.S.; Nemani, R.R.; Davis, K.J.; Bolstad, P.V.; Cook, B.D.; Desai, A.R.; Ricciuto, D.M.; et al. Evaluation of remote sensing based terrestrial productivity from MODIS using regional tower eddy flux network observations. IEEE Trans. Geosci. Remote Sens. 2006, 7, 1908–1925. [Google Scholar] [CrossRef]
- Tang, X.; Li, H.; Huang, N.; Li, X.; Xu, X.; Ding, Z.; Xie, J. A comprehensive assessment of MODIS-derived GPP for forest ecosystems using the site-level FLUXNET database. Environ. Earth Sci. 2015, 74, 5907–5918. [Google Scholar] [CrossRef] [Green Version]
- Zhao, M.; Heinsch, F.A.; Nemani, R.R.; Running, S.W. Improvements of the MODIS terrestrial gross and net primary production global data set. Remote Sens. Environ. 2005, 95, 164–176. [Google Scholar] [CrossRef]
- Niu, B.; He, Y.T.; Zhang, X.Z.; Fu, G.; Shi, P.L.; Du, M.Y.; Zhang, Y.J.; Zong, N. Tower-Based Validation and Improvement of MODIS Gross Primary Production in an Alpine Swamp Meadow on the Tibetan Plateau. Remote Sens. 2016, 8, 592. [Google Scholar] [CrossRef]
- Fu, G.; Zhang, J.; Shen, Z.X.; Shi, P.L.; He, Y.T.; Zhang, X.Z. Validation of collection of 6 MODIS/Terra and MODIS/Aqua gross primary production in an alpine meadow of the Northern Tibetan Plateau. Int. J. Remote Sens. 2017, 38, 4517–4534. [Google Scholar] [CrossRef]
- Kanniah, K.D.; Beringer, J.; Hutley, L.B.; Tapper, N.J.; Zhu, X. Evaluation of Collections 4 and 5 of the MODIS Gross Primary Productivity Product and Algorithm Improvement at a Tropical Savanna Site in Northern Australia. Remote Sens. Environ. 2009, 113, 1808–1822. [Google Scholar] [CrossRef]
- Zhang, Y.Q.; Yu, Q.; Jiang, J.; Tang, Y.H. Calibration of Terra/MODIS gross primary production over an irrigated cropland on the North China Plain and an alpine meadow on the Tibetan Plateau. Glob. Chang. Biol. 2008, 14, 757–767. [Google Scholar] [CrossRef] [Green Version]
- Liu, Z.; Shao, Q.; Liu, J. The performances of MODIS-GPP and-ET products in China and their sensitivity to input data (FPAR/LAI). Remote Sens. 2014, 7, 135–152. [Google Scholar] [CrossRef]
- Zhu, H.; Lin, A.; Wang, L.; Xia, Y.; Zou, L. Evaluation of MODIS gross primary production across multiple biomes in China using eddy covariance flux data. Remote Sens. 2016, 8, 395. [Google Scholar] [CrossRef]
- Wang, L.; Zhu, H.; Lin, A.; Zou, L.; Qin, W.; Du, Q. Evaluation of the Latest MODIS GPP Products across Multiple Biomes Using Global Eddy Covariance Flux Data. Remote Sens. 2017, 9, 418. [Google Scholar] [CrossRef]
- Gilabert, M.A.; Moreno, A.; Maselli, F.; Martinez, B.; Chiesi, M.; Sanchez-Ruiz, S.; Garcia-Haro, F.J.; Pérez-Hoyos, A.; Campos-Taberner, M.; Pérez-Priego, O.; et al. Daily GPP Estimates in Mediterranean Ecosystems by Combining Remote Sensing and Meteorological Data. ISPRS J. Photogramm. 2015, 102, 184–197. [Google Scholar] [CrossRef]
- Verbeeck, H.; Samson, R.; Verdonck, F.; Lemeur, R. Parameter sensitivity and uncertainty of the forest carbon flux model FORUG: A Monte Carlo analysis. Tree Physiol. 2006, 26, 807–817. [Google Scholar] [CrossRef]
- Kang, X.; Liang, Y.; Zhang, X.; Li, Y.; Tian, D.; Peng, C.; Wu, H.; Wang, J.; Zhong, L. Modeling gross primary production of a typical coastal wetland in china using MODIS time series and CO2 eddy flux tower data. Remote Sens. 2018, 10, 708. [Google Scholar] [CrossRef]
- Jin, C.; Xiao, X.; Wagle, P.; Griffis, T.; Dong, J.; Wu, C.; Qin, Y.; Cook, D.R. Effects of in-situ and reanalysis climate data on estimation of cropland gross primary production using the Vegetation Photosynthesis Model. Agric. Forest Meteorol. 2015, 213, 240–250. [Google Scholar] [CrossRef] [Green Version]
- Wang, X.F.; Ma, M.G.; Li, X.; Song, Y.; Tan, J.L.; Huang, G.H.; Zhang, Z.H.; Zhao, T.B.; Feng, J.M.; Ma, Z.G.; et al. Validation of MODIS-GPP product at 10 flux sites in northern China. Int. J. Remote Sens. 2013, 34, 587–599. [Google Scholar] [CrossRef]
- Braswell, B.H.; Sacks, W.J.; Linder, E.; Schimel, D.S. Estimating diurnal to annual ecosystem parameters by synthesis of a carbon flux model with eddy covariance net ecosystem exchange observations. Glob. Chang. Biol. 2005, 11, 335–355. [Google Scholar] [CrossRef]
- Ricciuto, D.M.; Davis, K.J.; Keller, K. A Bayesian calibration of a simple carbon cycle model: The role of observations in estimating and reducing uncertainty. Glob. Biogeochem. Cycles 2008, 22, GB2030. [Google Scholar] [CrossRef]
- Li, X. Characterization, controlling, and reduction of uncertainties in the modeling and observation of land-surface systems. Sci. China Earth Sci. 2014, 57, 80–87. [Google Scholar] [CrossRef]
- Wang, H.B.; Ma, M.G.; Xie, Y.M.; Wang, X.F.; Wang, J. Parameter inversion estimation in photosynthetic models: Impact of different simulation methods. Photosynthetica 2014, 52, 233–246. [Google Scholar] [CrossRef]
- van Oijen, M.; Rougier, J.; Smith, R. Bayesian calibration of process-based forest models: Bridging the gap between models and data. Tree Physiol. 2005, 25, 915–927. [Google Scholar] [CrossRef]
- Wang, H.B.; Ma, M.G. Comparing the seasonal variation of parameter estimation of ecosystem carbon exchange between alpine meadow and cropland in Heihe River Basin, northwestern China. Sci. Cold Arid Reg. 2015, 7, 216–228. [Google Scholar]
- Knorr, W.; Kattge, J. Inversion of terrestrial biosphere model parameter values against eddy covariance measurements using Monte Carlo sampling. Glob. Chang. Biol. 2005, 11, 1333–1351. [Google Scholar] [CrossRef]
- Groenendijk, M.; Dolman, A.J.; Van der Molen, M.K.; Leuning, R.; Arneth, A.; Delpierre, N.; Gash, J.H.C.; Richardson, A.D.; Verbeeck, H.; Wohlfahrt, G. Assessing parameter variability in a photosynthesis model within and between plant functional types using global Fluxnet eddy covariance data. Agric. Forest Meteorol. 2011, 151, 22–38. [Google Scholar] [CrossRef]
- Cheng, G.; Li, X.; Zhao, W.; Xu, Z.; Feng, Q.; Xiao, S.; Xiao, H. Integrated study of the water–ecosystem–economy in the Heihe River Basin. Natl. Sci. Rev. 2014, 1, 413–428. [Google Scholar] [CrossRef] [Green Version]
- Li, X.; Cheng, G.D.; Liu, S.M.; Xiao, Q.; Ma, M.G.; Jin, R.; Che, T.; Liu, Q.H.; Wang, W.Z.; Qi, Y.; et al. Heihe Watershed Allied Telemetry Experimental Research (HiWATER): Scientific objectives and experimental design. Bull. Am. Meteorol. Soc. 2013, 94, 1145–1160. [Google Scholar] [CrossRef]
- Li, X.; Liu, S.M.; Xiao, Q.; Ma, M.G.; Jin, R.; Che, T.; Wang, W.Z.; Hu, X.L.; Xu, Z.W.; Wen, J.G.; et al. A multiscale dataset for understanding complex eco-hydrological processes in a heterogeneous oasis system. Sci. Data 2017, 4, 170083. [Google Scholar] [CrossRef] [PubMed] [Green Version]
- Xu, Z.W.; Liu, S.M.; Li, X.; Shi, S.J.; Wang, J.M.; Zhu, Z.L.; Xu, T.R.; Wang, W.Z.; Ma, M.G. Intercomparison of surface energy flux measurement systems used during the HiWATER-MUSOEXE. J. Geophys. Res. Atmos. 2013, 118, 13140–13157. [Google Scholar] [CrossRef]
- Wang, X.F.; Wang, H.B.; Li, X.; Ran, Y.H. Photosynthesis (NPP, NEP, Respiration). In Observation and Measurement of Ecohydrological Processes; Li, X., Vereecken, H., Eds.; Springer: Berlin/Heidelberg, Germany, 2018; pp. 1–30. [Google Scholar]
- Reichstein, M.; Falge, E.; Baldocchi, D.; Papale, D.; Aubinet, M.; Berbigier, P.; Bernhofer, C.; Buchmann, N.; Gilmanov, T.; Granier, A.; et al. On the separation of net ecosystem exchange into assimilation and ecosystem respiration: Review and improved algorithm. Glob. Chang. Biol. 2005, 11, 1424–1439. [Google Scholar] [CrossRef]
- Ma, M.G.; Veroustraete, F. Reconstructing Pathfinder AVHRR Land NDVI Time-Series Data for the Northwest of China. Adv. Space Res. 2006, 37, 835–840. [Google Scholar] [CrossRef]
- Sims, D.A.; Rahman, A.F.; Cordova, V.D.; El-Masri, B.Z.; Baldocchi, D.D.; Flanagan, L.B.; Goldstein, A.H.; Hollinger, D.Y.; Misson, L.; Monson, R.K.; et al. On the use of MODIS EVI to assess gross primary productivity of North American ecosystems. J. Geophys. Res 2006, 111. [Google Scholar] [CrossRef] [Green Version]
- Monteith, J. Solar radiation and productivity in tropical ecosystems. J. Appl. Ecol. 1972, 9, 747–766. [Google Scholar] [CrossRef]
- Heinsch, F.A.; Reeves, M.; Votava, P.; Kang, S.; Milesi, C.; Zhao, M.; Glassy, J.; Jolly, W.M.; Loehman, R.; Bowker, C.F.; et al. User’s Guide: GPP and NPP (MOD17A2/A3) Products NASA MODIS Land Algorithm; University of Montana: Missoula, MT, USA, 2003; pp. 1–57. [Google Scholar]
- Metropolis, N.; Rosenbluth, A.W.; Rosenbluth, M.N.; Teller, A.H.; Teller, E. Equations of state calculations by fast computing machines. J. Chem. Phys. 1953, 21, 1087–1092. [Google Scholar] [CrossRef]
- Hastings, W.K. Monte Carlo sampling methods using Markov chain and their applications. Biometrika 1970, 57, 97–109. [Google Scholar] [CrossRef]
- Yuan, W.; Cai, W.; Liu, S.; Dong, W.; Chen, J.; Arain, M.A.; Blanken, P.D.; Cescatti, A.; Wohlfahrt, G.; Georgiadis, T.; et al. Vegetation-specific model parameters are not required for estimating gross primary production. Ecol. Model. 2014, 292, 1–10. [Google Scholar] [CrossRef]
- Turner, D.P.; Ritts, W.D.; Cohen, W.B.; Gower, S.T.; Zhao, M.; Running, S.W.; Wofsy, S.C.; Urbanski, S.; Dunn, A.L.; Munger, J.W. Scaling Gross Primary Production (GPP) over boreal and deciduous forest landscapes in support of MODIS GPP product validation. Remote Sens. Environ. 2003, 88, 256–270. [Google Scholar] [CrossRef] [Green Version]
- Friedl, M.A.; Sulla-Menashe, D.; Tan, B.; Schneider, A.; Ramankutty, N.; Sibley, A.; Huang, X. MODIS Collection 5 global land cover: Algorithm refinements and characterization of new datasets. Remote Sens. Environ. 2010, 114, 168–182. [Google Scholar] [CrossRef]
- Mu, X.; Song, W.; Gao, Z.; McVicar, T.R.; Donohue, R.J.; Yan, G. Fractional vegetation cover estimation by using multi-angle vegetation index. Remote Sens. Environ. 2018, 216, 44–56. [Google Scholar] [CrossRef]
- Mu, Q.; Zhao, M.; Heinsch, F.A.; Liu, M.; Tian, H.; Running, S.W. Evaluating water stress controls on primary production in biogeochemical and remote sensing based models. J. Geophys. Res. 2007, 112, G01012. [Google Scholar] [CrossRef]
- Li, Y.; Wang, Y.G.; Houghton, R.A.; Tang, L.S. Hidden carbon sink beneath desert. Geophys. Res. Lett. 2015, 42, 5880–5887. [Google Scholar] [CrossRef] [Green Version]
- Jung, M.; Reichstein, M.; Margolis, H.A.; Cescatti, A.; Richardson, A.D.; Arain, M.A.; Arneth, A.; Bernhofer, C.; Bonal, D.; Chen, J.; et al. Global patterns of land-atmosphere fluxes of carbon dioxide, latent heat, and sensible heat derived from eddy covariance, satellite, and meteorological observations. J. Geophys. Res. 2011, 116. [Google Scholar] [CrossRef] [Green Version]
- He, M.; Ju, W.; Zhou, Y.; Chen, J.; He, H.; Wang, S.; Wang, H.; Guan, D.; Yan, J.; Li, Y.; et al. Development of a two-leaf light use efficiency model for improving the calculation of terrestrial gross primary productivity. Agric. Forest Meteorol. 2013, 173, 28–39. [Google Scholar] [CrossRef]
- Propastin, P.; Ibrom, A.; Knohl, A.; Erasmi, S. Effects of canopy photosynthesis saturation on the estimation of gross primary productivity from MODIS data in a tropical forest. Remote Sens. Environ. 2012, 121, 252–260. [Google Scholar] [CrossRef]
- Chu, H.; Baldocchi, D.D.; John, R.; Wolf, S.; Reichstein, M. Fluxes all of the time? A primer on the temporal representativeness of FLUXNET. J. Geophys. Res. 2017, 122, 289–307. [Google Scholar] [CrossRef]
Figure 1.
Locations of the flux observation sites over Heihe River Basin (HRB).

Figure 2.
Plots of monthly accumulated precipitation, monthly averaged air temperature (T) and monthly averaged vapor pressure deficit (VPD) over HRB.
Figure 2.
Plots of monthly accumulated precipitation, monthly averaged air temperature (T) and monthly averaged vapor pressure deficit (VPD) over HRB.

Figure 3.
Comparisons of eight-day gross primary productivity (GPP) of MOD17A2H products and GPP simulations by MOD17 model with the flux tower GPP for all sites. Eight-day GPP scatter plots of the EC-observed GPP and (a) the original MOD17A2H products; (b) in situ meteorology forcing data; (c) only LUE optimized results; and (d) all parameters optimized results. The units of RMSE and rRMSE are gC/m2/day and %, respectively.

Figure 4.
Comparisons of annual GPP of MOD17A2H products and GPP simulations by MOD17 model with the flux tower GPP for all sites: (a) Original MOD17A2H products; (b) in situ meteorology forcing data; (c) only LUE optimized results; and (d) all parameters optimized results. The units of RMSE and rRMSE are gC/m2/y and %, respectively.

Figure 5.
Comparison between eight-day GPP of MOD17A2H products and GPP simulations by MOD17 model with the flux tower GPP for the major ecosystems including: (a) Grassland; (b) cropland; (c) desert steppe; and (d) forest. The unit of RMSE is gC/m2/day. The blue points represent original MOD17A2H products; green points represent in situ meteorology forcing data; pink points represent only LUE optimized results; and red points represent all parameters optimized results.

Figure 6.
Time series of eight-day MODIS GPP and GPP simulations derived from the MOD17 model with the tower-estimated GPP. The full name for each site is listed in Table 1. The blue points represent original MOD17A2H products; green points represent in situ meteorology forcing data; pink points represent only maximum LUE optimized results; and red points represent all parameters optimized results.

Figure 7.
Misclassification of land cover in the MOD12Q1 products at the downstream HRB, which classified the land cover of forest (i.e., SDQ, HHL, HYL) and cropland (NTZ) as the grassland type in MOD12Q1 data. (a) SDQ, (b) HHL, (c) HYL, and (d) NTZ.
Figure 7.
Misclassification of land cover in the MOD12Q1 products at the downstream HRB, which classified the land cover of forest (i.e., SDQ, HHL, HYL) and cropland (NTZ) as the grassland type in MOD12Q1 data. (a) SDQ, (b) HHL, (c) HYL, and (d) NTZ.

Figure 8.
Validation of MODIS FPAR compared with FPAR measured by AccuPAR. The left plot is the validation at DMZ and SDZ, the right plot is the validation at GBZ and HZZ.
Figure 8.
Validation of MODIS FPAR compared with FPAR measured by AccuPAR. The left plot is the validation at DMZ and SDZ, the right plot is the validation at GBZ and HZZ.

Figure 9.
Relative reduction of parameter uncertainty (95% confidence interval) from prior to posterior distribution. The green bar and blue bar represent the reduction of uncertainty in model parameters for the MOD17A2H model at the NTZ and DMZ sites.
Figure 9.
Relative reduction of parameter uncertainty (95% confidence interval) from prior to posterior distribution. The green bar and blue bar represent the reduction of uncertainty in model parameters for the MOD17A2H model at the NTZ and DMZ sites.


Table 1.
Characteristics of the flux observation network sites used in this study. MAT (°C) represented mean annual air temperature, MAP (mm) represented mean annual accumulated precipitation, and PET (mm) represented mean annual potential evapotranspiration.
Table 1.
Characteristics of the flux observation network sites used in this study. MAT (°C) represented mean annual air temperature, MAP (mm) represented mean annual accumulated precipitation, and PET (mm) represented mean annual potential evapotranspiration.
| Site Code | PFTs | Year Used | Vegetation Cover | Longitude | Latitude | MAT (°C) | MAP (mm) | PET (mm) |
|---|---|---|---|---|---|---|---|---|
| A’rou(ARZ) | Grassland | 2013–2016 | alpine grassland | 38.0473 | 100.4643 | −0.29 | 444.70 | 636.18 |
| Dashalong(DSL) | Grassland | 2013–2016 | alpine meadow | 38.8399 | 98.9406 | −3.91 | 314.43 | 698.07 |
| Yakou(YKZ) | Grassland | 2015–2016 | alpine meadow | 38.0142 | 100.2421 | −4.68 | 500.79 | 653.16 |
| Huazhaizi(HZZ) | Desert steppe | 2012–2016 | desert steppe | 38.76519 | 100.3186 | 8.89 | 139.68 | 590.93 |
| Gobi(GBZ) | Desert steppe | 2012–2015 | desert steppe | 38.91496 | 100.3042 | 9.07 | 102.25 | 575.72 |
| Luodi(LDZ) | Desert steppe | 2013–2015 | desert steppe | 41.9993 | 101.1326 | 12.32 | 24.80 | 727.68 |
| Daman(DMZ) | Cropland | 2012–2016 | maize | 38.85551 | 100.3722 | 6.93 | 135.70 | 828.04 |
| Nongtian(NTZ) | Cropland | 2012–2016 | cantaloupe | 42.0048 | 101.1338 | 9.39 | 35.55 | 727.68 |
| Shidi(SDZ) | Cropland | 2012–2016 | reed | 38.97514 | 100.4464 | 9.19 | 119.9 | 1249.35 |
| Huyanglin(HYL) | Forest | 2013–2015 | populus euphratica | 41.9928 | 101.1236 | 10.33 | 26.00 | 922.91 |
| Hunhelin(HHL) | Forest | 2013–2016 | mixed forest | 41.9903 | 101.1335 | 10.04 | 35.53 | 1043.34 |
| Sidaoqiao(SDQ) | Forest | 2013–2016 | tamarix forest | 42.0012 | 101.1374 | 10.06 | 37.13 | 977.95 |
Table 2.
A summary of the performances of the MOD17 algorithm (GPP_MODIS) and the in situ metrological data forced GPP, LUEmax parameter optimized GPP (GPP_LUE), and five parameters optimized GPP (GPP_Fiveopt). GPP_LUE and GPP_Fiveopt were estimated from the in situ climate data. In the GPP_Insitu and GPP_LUE algorithms, the default values for model parameters were used in MOD17 for the original land cover types and optimal parameter values for the optimization approach.
| GPP_MODIS | GPP_Insitu | GPP_LUE | GPP_Fiveopt | |||||
|---|---|---|---|---|---|---|---|---|
| R2 | RMSE | R2 | RMSE | R2 | RMSE | R2 | RMSE | |
| ARZ | 0.85 | 1.13 | 0.92 | 1.58 | 0.92 | 1.58 | 0.92 | 0.82 |
| DSL | 0.79 | 1.01 | 0.86 | 1.18 | 0.85 | 0.74 | 0.82 | 0.59 |
| YKZ | 0.72 | 0.41 | 0.76 | 0.30 | 0.76 | 0.58 | 0.78 | 0.65 |
| HZZ | 0.38 | 0.42 | 0.40 | 0.32 | 0.40 | 0.53 | 0.40 | 0.54 |
| GBZ | 0.37 | 0.28 | 0.41 | 0.27 | 0.41 | 0.60 | 0.42 | 0.68 |
| LDZ | 0.50 | 0.44 | 0.73 | 0.41 | 0.73 | 0.59 | 0.72 | 0.61 |
| DMZ | 0.86 | 3.43 | 0.94 | 3.69 | 0.94 | 1.27 | 0.96 | 0.96 |
| NTZ | - | - | 0.63 | 2.30 | 0.55 | 1.82 | 0.63 | 1.42 |
| SDZ | 0.85 | 1.55 | 0.88 | 1.76 | 0.88 | 1.16 | 0.91 | 0.98 |
| HHL | 0.57 | 2.48 | 0.77 | 2.30 | 0.68 | 1.21 | 0.87 | 0.75 |
| SDQ | 0.56 | 1.68 | 0.81 | 1.46 | 0.74 | 0.85 | 0.85 | 0.66 |
| HYL | 0.54 | 2.14 | 0.76 | 1.86 | 0.67 | 1.10 | 0.89 | 0.65 |
Table 3.
Prior distribution (initial value and range) and posterior distribution (mean value and 95% confidence interval) of the parameters of the MOD17 model for all sites. For the parameters εmax (gC/MJ APAR), Tmin_min (°C), Tmin_max (°C), VPDmin (Pa), and VPDmax (Pa), we set the original values of MOD17 BPLUT as the initial values (with bold font).
| Sites | εmax | Tmin_min | Tmin_max | VPDmin | VPDmax |
|---|---|---|---|---|---|
| Prior range | (0.3,3) | (−35,−2) | (6,30) | (60,1000) | (1500,6500) |
| ARZ | 1.044, 2.10(1.62,2.94) | −8, −10.29(−11.33,−9.29) | 12.02, 15.52(10.16, 26.63) | 650, 151.37(64.48,296.64) | 4300, 3252.21(2801.68, 4009.33) |
| DSL | 1.044, 1.24(0.90,1.75) | −8, −30.28(−34.79,−22.79) | 12.02, 18.84(6.78, 29.44) | 650, 430.98(81.46,961.71) | 4300, 3960.64(1732.84, 6361.79) |
| YKZ | 1.044, 1.80(0.97, 2.53) | −8, −15.30(−32.13,−3.62) | 12.02, 20.49(6.94, 29.58) | 650, 567.33(96.08,978.23) | 4300, 4136.91(1760.66, 6397.26) |
| HZZ | 1.044, 1.68(1.21, 2.42) | −8, −20.76(−34.33,−3.14) | 12.02, 22.62(7.30, 29.53) | 650, 608.86(81.31,977.20) | 4300, 4936.72(3135.86, 6400.44) |
| GBZ | 1.044, 2.46(1.87, 2.95) | −8, −18.93(−34.14, −2.95) | 12.02, 13.71(6.47, 27.14) | 650, 592.37(92.14,982.30) | 4300, 4654.96(3150.60, 6424.90) |
| LDZ | 1.044, 1.16(0.89, 2.04) | −8, −17.23(−34.07, −2.79) | 12.02, 13.83(6.39, 28.65) | 650, 568.79(98.05,977.54) | 4300, 5006.36(3050.36, 6436.59) |
| DMZ | 0.860, 2.89(2.73, 2.99) | −8, −3.91(−4.82,−3.08) | 12.02, 16.37(15.66, 17.58) | 650, 176.02(66.63,377.42) | 5300, 6089.55(5664.46, 6457.04) |
| NTZ | 0.860, 3.0(2.98, 3.0) | −8, −28.59 (−34.78, −11.21) | 12.02, 8.27(6.14, 11.13) | 650, 991.88(961.92,999.73) | 5300, 6486.19(6432.50, 6499.42) |
| SDZ | 0.860, 1.59(1.41, 1.74) | −8, −32.82(−34.91,−27.88) | 12.02, 25.76(19.61, 29.68) | 650, 237.30(66.65,519.04) | 5300, 6329.98(5928.29, 6492.67) |
| HHL | 1.051, 2.89(2.63, 3.0) | −8, −18.54(−26.41, −10.64) | 8.61, 22.26(19.30, 26.62) | 650, 771.23(229.59,992.57) | 4800, 6435.17(6233.17, 6497.78) |
| SDQ | 1.268, 2.33(1.80, 2.94) | −8, −18.07(−33.83, −2.82) | 9.09, 20.25(11.59, 29.25) | 800, 523.27(82.79,972.83) | 3100, 5947.81(5274.70, 6461.10) |
| HYL | 1.165, 2.71(2.28, 2.98) | −6, −6.20(−13.10,−2.44) | 9.94, 25.11(21.11, 29.50) | 650, 619.61(108.53,980.37) | 1650, 6410.51(6143.55, 6496.60) |
© 2019 by the authors. Licensee MDPI, Basel, Switzerland. This article is an open access article distributed under the terms and conditions of the Creative Commons Attribution (CC BY) license (http://creativecommons.org/licenses/by/4.0/).
Share and Cite
MDPI and ACS Style
Wang, H.; Li, X.; Ma, M.; Geng, L. Improving Estimation of Gross Primary Production in Dryland Ecosystems by a Model-Data Fusion Approach. Remote Sens. 2019, 11, 225. https://0-doi-org.brum.beds.ac.uk/10.3390/rs11030225
AMA Style
Wang H, Li X, Ma M, Geng L. Improving Estimation of Gross Primary Production in Dryland Ecosystems by a Model-Data Fusion Approach. Remote Sensing. 2019; 11(3):225. https://0-doi-org.brum.beds.ac.uk/10.3390/rs11030225
Chicago/Turabian StyleWang, Haibo, Xin Li, Mingguo Ma, and Liying Geng. 2019. "Improving Estimation of Gross Primary Production in Dryland Ecosystems by a Model-Data Fusion Approach" Remote Sensing 11, no. 3: 225. https://0-doi-org.brum.beds.ac.uk/10.3390/rs11030225
Note that from the first issue of 2016, this journal uses article numbers instead of page numbers. See further details here.