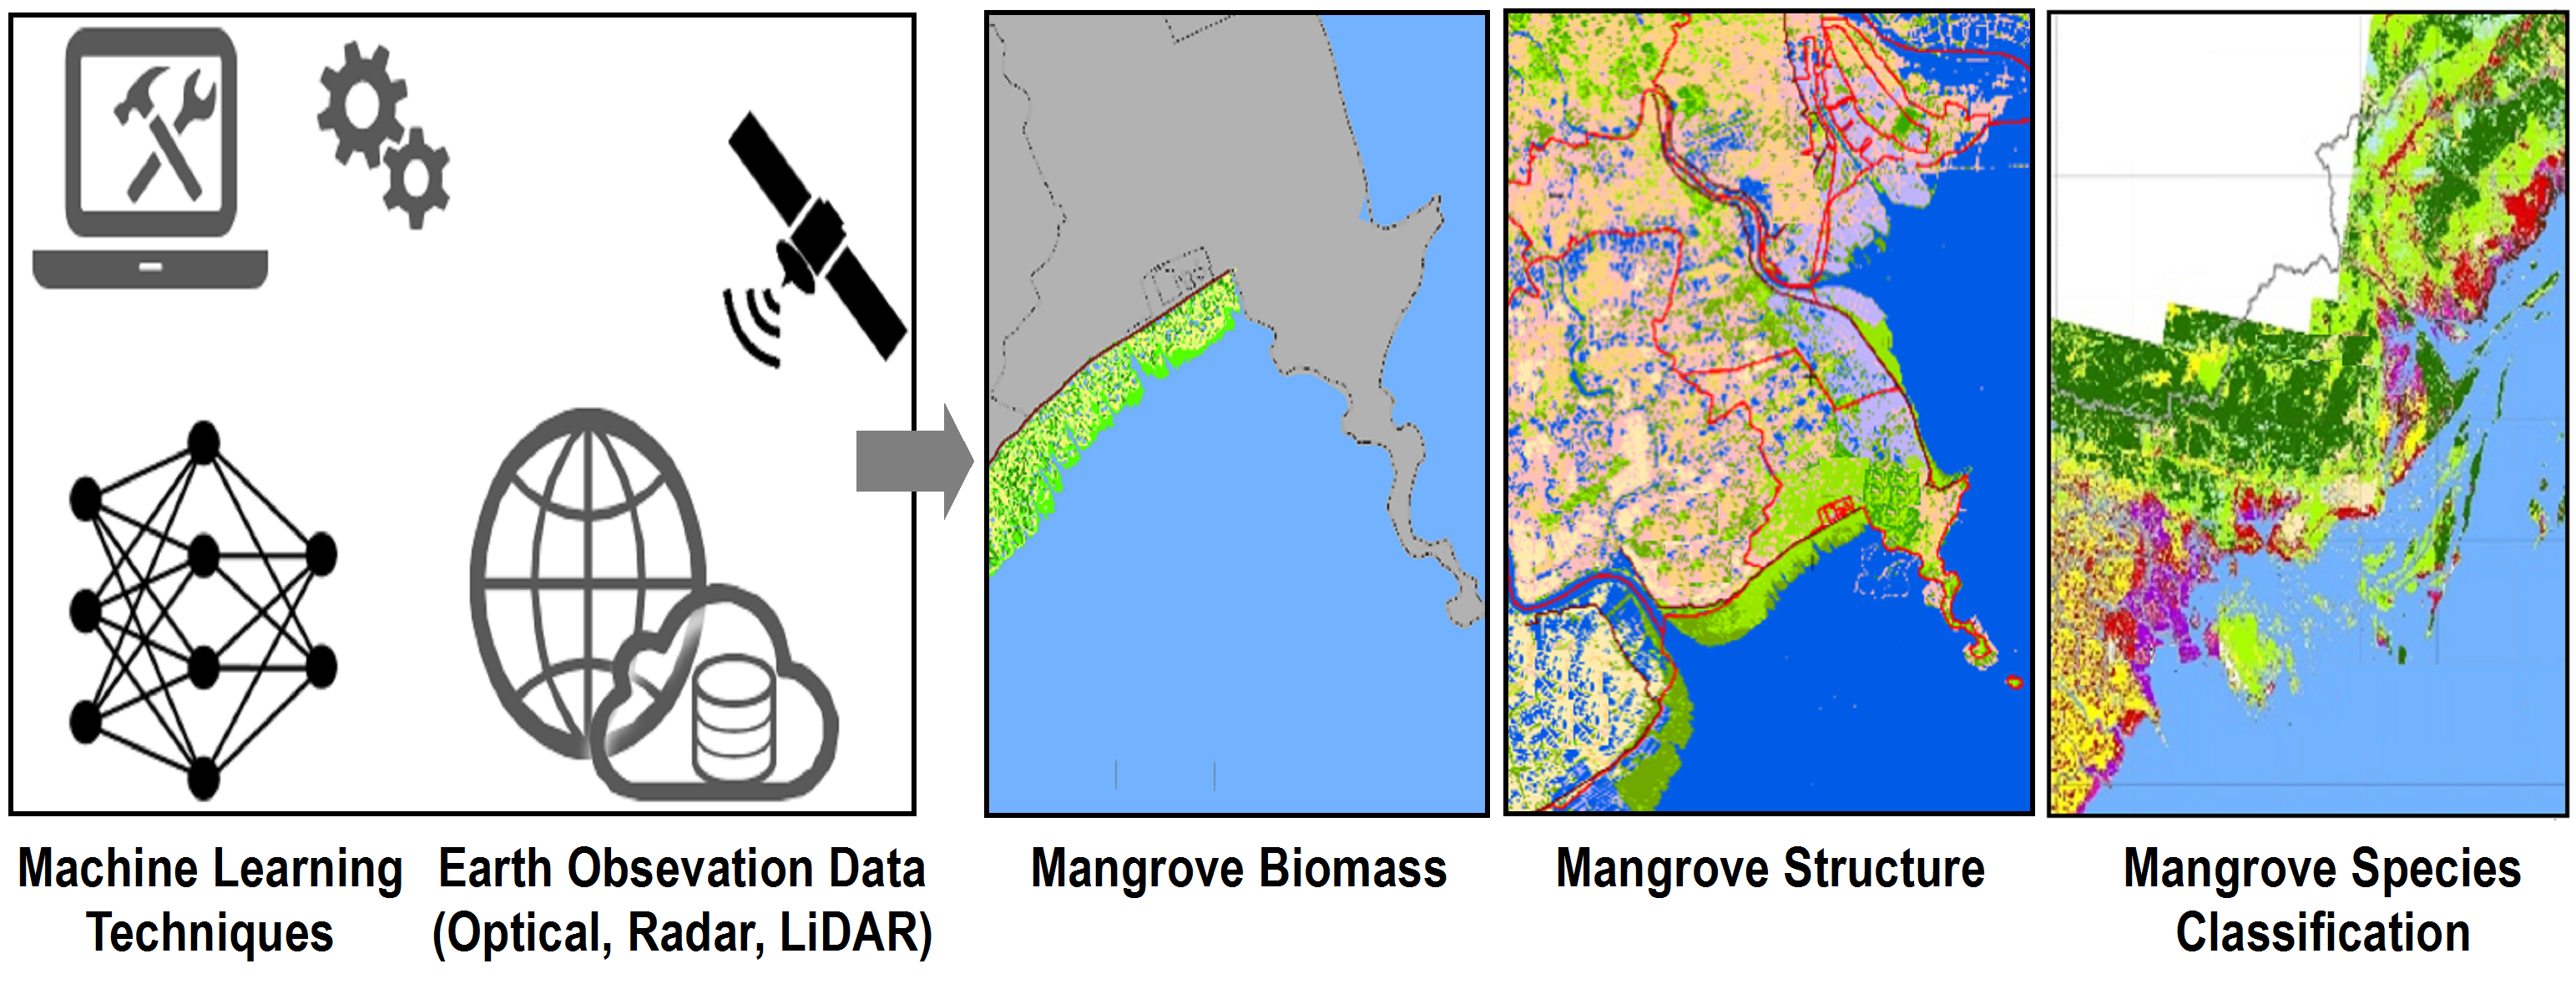
Remote Sensing Approaches for Monitoring Mangrove Species, Structure, and Biomass: Opportunities and Challenges


Abstract
:
1. Introduction
2. Remote Sensing of Mangrove Species
2.1. Traditional Approaches to Discriminate Mangrove Species
2.2. Machine Learning Approaches for Mapping Mangrove Species
3. Modeling Mangrove Characteristics and Structure
3.1. Relationships between Biophysical Parameters of Mangroves and Spectral Remotely Sensed Data
3.2. Relationships between Biophysical Parameters of Mangroves and SAR and LiDAR Data
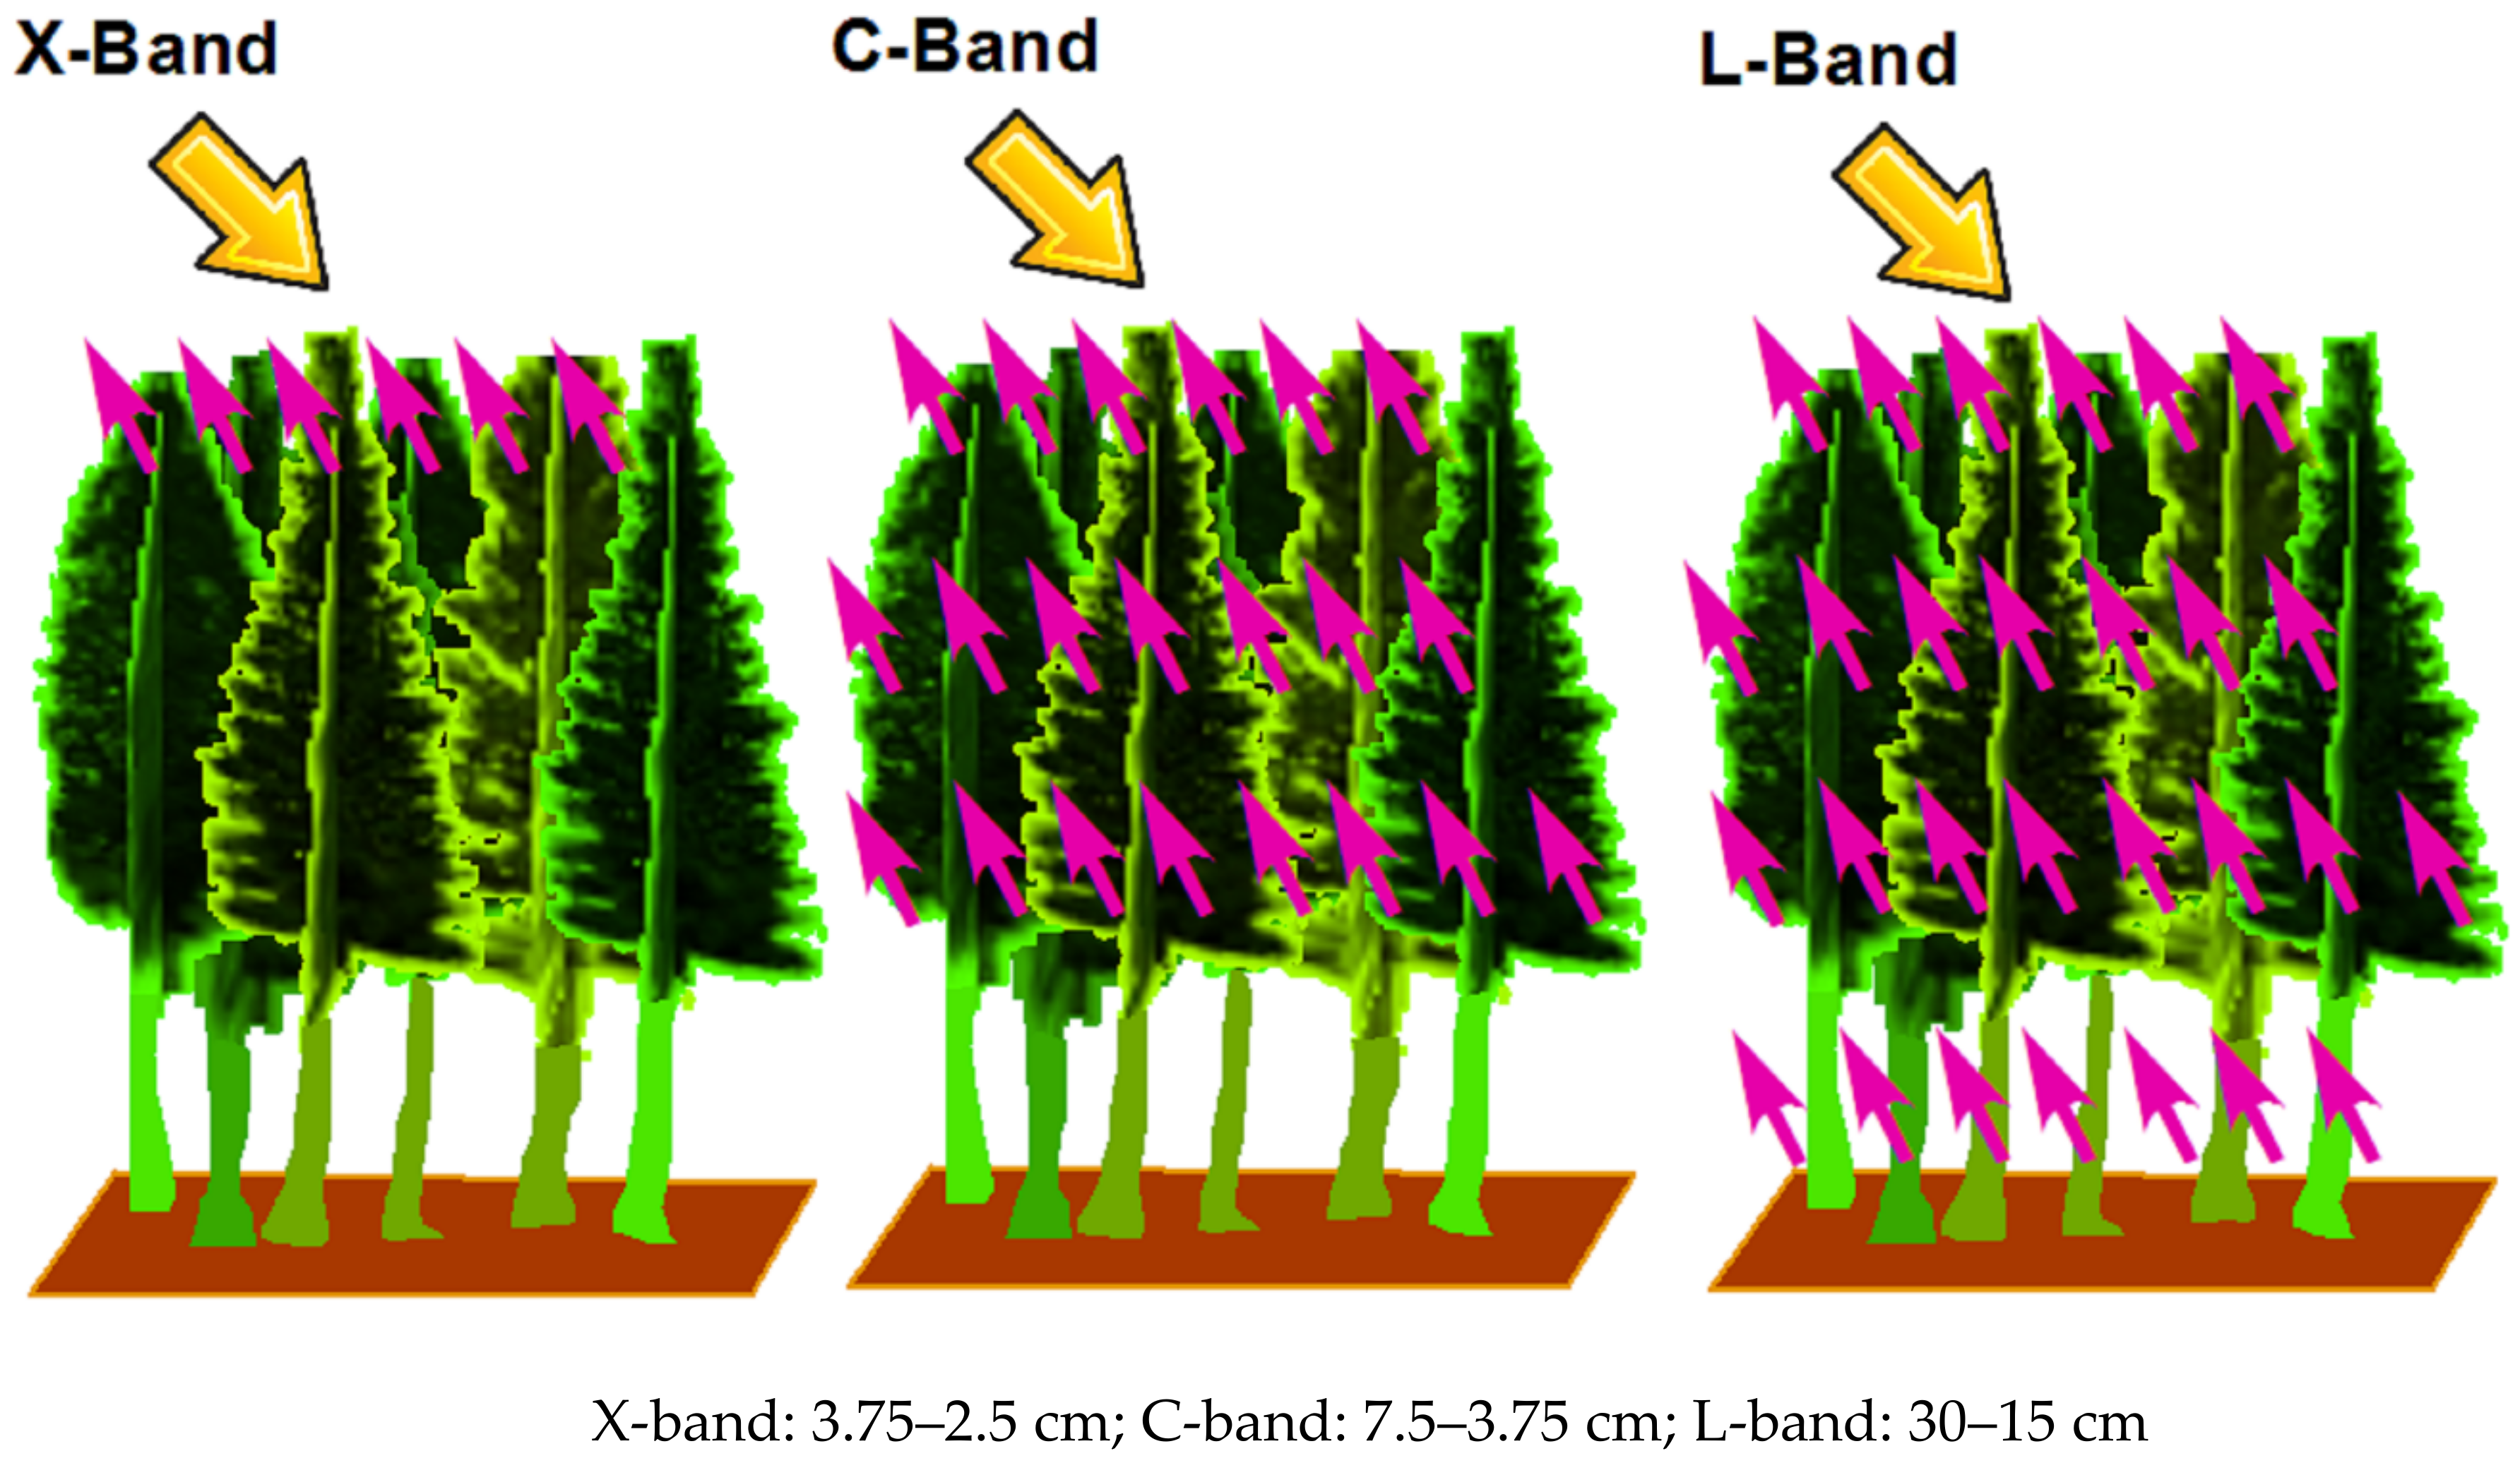
Wavelength and Polarization of SAR Data
4. Estimating Mangrove Biomass Using Remote Sensing
4.1. Mangrove Biomass Estimation Using Optical Data
4.2. Biomass Estimation for Mangrove Forests Using SAR Data
4.2.1. Backscatter Coefficient Extraction for Mangrove Biomass Estimation
4.2.2. Biomass Estimation using Interferometry (InSAR) and Pol-InSAR Techniques
4.3. Mangrove Biomass Estimation Using LiDAR and Data Fusion
4.4. Biomass Estimation Using Hyperspectral Data
5. Limitations and Uncertainties in Mangrove Remote Sensing
6. Conclusions
Author Contributions
Funding
Conflicts of Interest
References
- Brander, L.M.; Wagtendonk, A.J.; Hussain, S.S.; McVittie, A.; Verburg, P.H.; de Groot, R.S.; van der Ploeg, S. Ecosystem service values for mangroves in southeast asia: A meta-analysis and value transfer application. Ecosyst. Serv. 2012, 1, 62–69. [Google Scholar] [CrossRef]
- Alongi, D.M. Present state and future of the world’s mangrove forests. Environ. Conserv. 2002, 29, 331–349. [Google Scholar] [CrossRef]
- Barbier, E.B.; Cox, M. An economic analysis of shrimp farm expansion and mangrove conversion in thailand. Land Econ. 2004, 80, 391–407. [Google Scholar] [CrossRef]
- Donato, D.C.; Kauffman, J.B.; Murdiyarso, D.; Kurnianto, S.; Stidham, M.; Kanninen, M. Mangroves among the most carbon-rich forests in the tropics. Nat. Geosci. 2011, 4, 293–297. [Google Scholar] [CrossRef]
- Pham, T.D.; Yoshino, K. Aboveground biomass estimation of mangrove species using alos-2 palsar imagery in hai phong city, vietnam. J. Appl. Remote Sens. 2017, 11, 026010. [Google Scholar] [CrossRef]
- Pham, T.D.; Yoshino, K.; Le, N.; Bui, D. Estimating aboveground biomass of a mangrove plantation on the northern coast of vietnam using machine learning techniques with an integration of alos-2 palsar-2 and sentinel-2a data. Int. J. Remote Sens. 2018, 39, 7761–7788. [Google Scholar] [CrossRef]
- Kauffman, J.B.; Heider, C.; Norfolk, J.; Payton, F. Carbon stocks of intact mangroves and carbon emissions arising from their conversion in the dominican republic. Ecol. Appl. 2013, 24, 518–527. [Google Scholar] [CrossRef]
- Hong, P.N.; San, H.T. Mangroves of Vietnam; IUCN: Bangkok, Thailand, 1993; p. 173. [Google Scholar]
- Tuan, L.D.; Oanh, T.T.K.; Thanh, C.V.; Quy, N.D. Can Gio Mangrove Biosphere Reserve; Agricultural Publishing House: Ho Chi Minh City, Vietnam, 2002; 311p. [Google Scholar]
- FAO. The World’s Mangroves 1980–2005. A Thematic Study Prepared in the Framework of the Global Forest Resources Assessment 2005; ISSN 0258-6150. Food and Agriculture Organization of the United Nations: Rome, Italy, 2007; p. 89. [Google Scholar]
- Hamilton, S.E.; Casey, D. Creation of a high spatio-temporal resolution global database of continuous mangrove forest cover for the 21st century (cgmfc-21). Glob. Ecol. Biogeogr. 2016, 25, 729–738. [Google Scholar] [CrossRef]
- Richards, D.R.; Friess, D.A. Rates and drivers of mangrove deforestation in southeast asia, 2000–2012. Proc. Natl. Acad. Sci. USA 2016, 113, 344–349. [Google Scholar] [CrossRef]
- Feller, I.C.; Friess, D.A.; Krauss, K.W.; Lewis, R.R. The state of the world’s mangroves in the 21st century under climate change. Hydrobiologia 2017, 803, 1–12. [Google Scholar] [CrossRef] [Green Version]
- Murdiyarso, D.; Purbopuspito, J.; Kauffman, J.B.; Warren, M.W.; Sasmito, S.D.; Donato, D.C.; Manuri, S.; Krisnawati, H.; Taberima, S.; Kurnianto, S. The potential of indonesian mangrove forests for global climate change mitigation. Nat. Clim. Chang. 2015, 5, 1089. [Google Scholar] [CrossRef]
- Hamilton, S.E.; Friess, D.A. Global carbon stocks and potential emissions due to mangrove deforestation from 2000 to 2012. Nat. Clim. Chang. 2018, 8, 240–244. [Google Scholar] [CrossRef] [Green Version]
- Duke, N.; Nagelkerken, I.; Agardy, T.; Wells, S.; Van Lavieren, H. The Importance of Mangroves to People: A Call to Action; United Nations Environment Programme World Conservation Monitoring Centre (UNEP-WCMC): Cambridge, UK, 2014. [Google Scholar]
- Pham, T.D.; Yoshino, K. Impacts of mangrove management systems on mangrove changes in the northern coast of vietnam. Tropics 2016, 24, 141–151. [Google Scholar] [CrossRef]
- Friess, D.A.; Webb, E.L. Variability in mangrove change estimates and implications for the assessment of ecosystem service provision. Glob. Ecol. Biogeogr. 2014, 23, 715–725. [Google Scholar] [CrossRef]
- Maxwell, A.E.; Warner, T.A.; Fang, F. Implementation of machine-learning classification in remote sensing: An applied review. Int. J. Remote Sens. 2018, 39, 2784–2817. [Google Scholar] [CrossRef]
- Heumann, B.W. Satellite remote sensing of mangrove forests: Recent advances and future opportunities. Prog. Phys. Geogr. 2011, 35, 87–108. [Google Scholar] [CrossRef]
- Kuenzer, C.; Bluemel, A.; Gebhardt, S.; Quoc, T.V.; Dech, S. Remote sensing of mangrove ecosystems: A review. Remote Sens. 2011, 3, 878–928. [Google Scholar] [CrossRef]
- Lucas, R.; Lule, A.V.; Rodríguez, M.T.; Kamal, M.; Thomas, N.; Asbridge, E.; Kuenzer, C. Spatial ecology of mangrove forests: A remote sensing perspective. In Mangrove Ecosystems: A Global Biogeographic Perspective: Structure, Function, and Services; Rivera-Monroy, V.H., Lee, S.Y., Kristensen, E., Twilley, R.R., Eds.; Springer International Publishing: Cham, Switzerland, 2017; pp. 87–112. [Google Scholar]
- Lewis, R.R. Ecological engineering for successful management and restoration of mangrove forests. Ecol. Eng. 2005, 24, 403–418. [Google Scholar] [CrossRef]
- Heenkenda, M.; Joyce, K.; Maier, S.; Bartolo, R. Mangrove species identification: Comparing worldview-2 with aerial photographs. Remote Sens. 2014, 6, 6064–6088. [Google Scholar] [CrossRef]
- Viennois, G.; Proisy, C.; Féret, J.B.; Prosperi, J.; Sidik, F.; Suhardjono; Rahmania, R.; Longépé, N.; Germain, O.; Gaspar, P. Multitemporal analysis of high-spatial-resolution optical satellite imagery for mangrove species mapping in Bali, Indonesia. IEEE J. Sel. Top. Appl. Earth Obs. Remote Sens. 2016, 9, 3680–3686. [Google Scholar] [CrossRef]
- Kamal, M.; Phinn, S. Hyperspectral data for mangrove species mapping: A comparison of pixel-based and object-based approach. Remote Sens. 2011, 3, 2222–2242. [Google Scholar] [CrossRef]
- Jia, M.; Zhang, Y.; Wang, Z.; Song, K.; Ren, C. Mapping the distribution of mangrove species in the core zone of mai po marshes nature reserve, hong kong, using hyperspectral data and high-resolution data. Int. J. Appl. Earth Obs. Geoinf. 2014, 33, 226–231. [Google Scholar] [CrossRef]
- Kamal, M.; Phinn, S.; Johansen, K. Object-based approach for multi-scale mangrove composition mapping using multi-resolution image datasets. Remote Sens. 2015, 7, 4753–4783. [Google Scholar] [CrossRef]
- Chakravortty, S.; Ghosh, D.; Sinha, D. A Dynamic Model to Recognize Changes in Mangrove Species in Sunderban Delta Using Hyperspectral Image Analysis; Springer: Singapore, 2018; pp. 59–67. [Google Scholar]
- Wang, D.; Wan, B.; Qiu, P.; Su, Y.; Guo, Q.; Wu, X. Artificial mangrove species mapping using pléiades-1: An evaluation of pixel-based and object-based classifications with selected machine learning algorithms. Remote Sens. 2018, 10, 294. [Google Scholar] [CrossRef]
- Pham, T.D.; Bui, D.T.; Yoshino, K.; Le, N.N. Optimized rule-based logistic model tree algorithm for mapping mangrove species using alos palsar imagery and gis in the tropical region. Environ. Earth Sci. 2018, 77, 159. [Google Scholar] [CrossRef]
- Valderrama-Landeros, L.; Flores-de-Santiago, F.; Kovacs, J.M.; Flores-Verdugo, F. An assessment of commonly employed satellite-based remote sensors for mapping mangrove species in mexico using an ndvi-based classification scheme. Environ. Monit. Assess. 2017, 190, 23. [Google Scholar] [CrossRef] [PubMed]
- Kovacs, J.; de Santiago, F.; Bastien, J.; Lafrance, P. An assessment of mangroves in guinea, west africa, using a field and remote sensing based approach. Wetlands 2010, 30, 773–782. [Google Scholar] [CrossRef]
- Manjunath, K.R.; Kumar, T.; Kundu, N.; Panigrahy, S. Discrimination of mangrove species and mudflat classes using in situ hyperspectral data: A case study of Indian Sundarbans. Gisci. Remote Sens. 2013, 50, 400–417. [Google Scholar] [CrossRef]
- Chakravortty, S. Analysis of end member detection and subpixel classification algorithms on hyperspectral imagery for tropical mangrove species discrimination in the Sunderbans Delta, India. J. Appl. Remote Sens. 2013, 7, 073523. [Google Scholar] [CrossRef]
- Maeda, Y.; Fukushima, A.; Imai, Y.; Tanahashi, Y.; Nakama, E.; Ohta, S.; Kawazoe, K.; Akune, N. Estimating carbon stock changes of mangrove forests using satellite imagery and airborne lidar data. Int. Arch. Photogramm. Remote Sens. Spat. Inf. Sci. 2016, 41, 705–709. [Google Scholar] [CrossRef]
- Giardino, C.; Bresciani, M.; Fava, F.; Matta, E.; Brando, V.; Colombo, R. Mapping submerged habitats and mangroves of lampi island marine national park (myanmar) from in situ and satellite observations. Remote Sens. 2016, 8, 2. [Google Scholar] [CrossRef]
- Satyanarayana, B.; Muslim, A.M.; Izzaty Horsali, N.A.; Mat Zauki, N.A.; Otero, V.; Nadzri, M.I.; Ibrahim, S.; Husain, M.-L.; Dahdouh-Guebas, F. Status of the undisturbed mangroves at Brunei bay, east Malaysia: A preliminary assessment based on remote sensing and ground-truth observations. PeerJ 2018, 6, e4397. [Google Scholar] [CrossRef] [PubMed]
- Zhang, H.; Wang, T.; Liu, M.; Jia, M.; Lin, H.; Chu, L.; Devlin, A. Potential of combining optical and dual polarimetric sar data for improving mangrove species discrimination using rotation forest. Remote Sens. 2018, 10, 467. [Google Scholar] [CrossRef]
- Liu, M.; Zhang, H.; Lin, G.; Lin, H.; Tang, D. Zonation and directional dynamics of mangrove forests derived from time-series satellite imagery in Mai Po, Hong Kong. Sustainability 2018, 10, 1913. [Google Scholar] [CrossRef]
- Koedsin, W.; Vaiphasa, C. Discrimination of tropical mangroves at the species level with eo-1 hyperion data. Remote Sens. 2013, 5, 3562–3582. [Google Scholar] [CrossRef]
- Wong, F.K.K.; Fung, T. Combining eo-1 hyperion and envisat asar data for mangrove species classification in Mai Po Ramsar Site, Hong Kong. Int. J. Remote Sens. 2014, 35, 7828–7856. [Google Scholar] [CrossRef]
- Rogers, K.; Lymburner, L.; Salum, R.; Brooke, B.P.; Woodroffe, C.D. Mapping of mangrove extent and zonation using high and low tide composites of landsat data. Hydrobiologia 2017, 803, 49–68. [Google Scholar] [CrossRef]
- Wang, D.; Wan, B.; Qiu, P.; Su, Y.; Guo, Q.; Wang, R.; Sun, F.; Wu, X. Evaluating the performance of sentinel-2, landsat 8 and pléiades-1 in mapping mangrove extent and species. Remote Sens. 2018, 10, 1468. [Google Scholar] [CrossRef]
- Wang, T.; Zhang, H.; Lin, H.; Fang, C. Textural–spectral feature-based species classification of mangroves in mai po nature reserve from worldview-3 imagery. Remote Sens. 2016, 8, 24. [Google Scholar] [CrossRef]
- Cao, J.; Leng, W.; Liu, K.; Liu, L.; He, Z.; Zhu, Y. Object-based mangrove species classification using unmanned aerial vehicle hyperspectral images and digital surface models. Remote Sens. 2018, 10, 89. [Google Scholar] [CrossRef]
- Ruwaimana, M.; Satyanarayana, B.; Otero, V.; Muslim, A.M.; Syafiq, A.M.; Ibrahim, S.; Raymaekers, D.; Koedam, N.; Dahdouh-Guebas, F. The advantages of using drones over space-borne imagery in the mapping of mangrove forests. PLoS ONE 2018, 13, e0200288. [Google Scholar] [CrossRef] [PubMed]
- Kovacs, J.M.; Liu, Y.; Zhang, C.; Flores-Verdugo, F.; de Santiago, F.F. A field based statistical approach for validating a remotely sensed mangrove forest classification scheme. Wetl. Ecol. Manag. 2011, 19, 409. [Google Scholar] [CrossRef]
- Zhang, C.; Chen, K.; Liu, Y.; Kovacs, J.M.; Flores-Verdugo, F.; Santiago, F.J.F. Spectral response to varying levels of leaf pigments collected from a degraded mangrove forest. J. Appl. Remote Sens. 2012, 6, 063501. [Google Scholar]
- Flores-de-Santiago, F.; Kovacs, J.M.; Flores-Verdugo, F. The influence of seasonality in estimating mangrove leaf chlorophyll-a content from hyperspectral data. Wetl. Ecol. Manag. 2013, 21, 193–207. [Google Scholar] [CrossRef]
- Zhang, C.; Kovacs, J.; Wachowiak, M.; Flores-Verdugo, F. Relationship between hyperspectral measurements and mangrove leaf nitrogen concentrations. Remote Sens. 2013, 5, 891–908. [Google Scholar] [CrossRef]
- Fauzi, A.; Skidmore, A.K.; Gils, H.V.; Schlerf, M.; Heitkönig, I.M.A. Shrimp pond effluent dominates foliar nitrogen in disturbed mangroves as mapped using hyperspectral imagery. Mar. Pollut. Bull. 2013, 76, 42–51. [Google Scholar] [CrossRef]
- Axelsson, C.; Skidmore, A.K.; Schlerf, M.; Fauzi, A.; Verhoef, W. Hyperspectral analysis of mangrove foliar chemistry using plsr and support vector regression. Int. J. Remote Sens. 2013, 34, 1724–1743. [Google Scholar] [CrossRef]
- Kamal, M.; Phinn, S.; Johansen, K. Characterizing the spatial structure of mangrove features for optimizing image-based mangrove mapping. Remote Sens. 2014, 6, 984–1006. [Google Scholar] [CrossRef]
- Pastor-Guzman, J.; Atkinson, P.; Dash, J.; Rioja-Nieto, R. Spatiotemporal variation in mangrove chlorophyll concentration using landsat 8. Remote Sens. 2015, 7, 14530–14558. [Google Scholar] [CrossRef]
- Heenkenda, M.K.; Joyce, K.E.; Maier, S.W.; de Bruin, S. Quantifying mangrove chlorophyll from high spatial resolution imagery. ISPRS J. Photogramm. Remote Sens. 2015, 108, 234–244. [Google Scholar] [CrossRef]
- Pu, R.; Cheng, J. Mapping forest leaf area index using reflectance and textural information derived from worldview-2 imagery in a mixed natural forest area in Florida, US. Int. J. Appl. Earth Obs. Geoinf. 2015, 42, 11–23. [Google Scholar] [CrossRef]
- Lagomasino, D.; Fatoyinbo, T.; Lee, S.-K.; Simard, M. High-resolution forest canopy height estimation in an African blue carbon ecosystem. Remote Sens. Ecol. Conserv. 2015, 1, 51–60. [Google Scholar] [CrossRef] [PubMed] [Green Version]
- Kamal, M.; Phinn, S.; Johansen, K. Assessment of multi-resolution image data for mangrove leaf area index mapping. Remote Sens. Environ. 2016, 176, 242–254. [Google Scholar] [CrossRef]
- Heenkenda, M.; Maier, S.; Joyce, K. Estimating mangrove biophysical variables using worldview-2 satellite data: Rapid creek, northern territory, Australia. J. Imaging 2016, 2, 24. [Google Scholar] [CrossRef]
- Lagomasino, D.; Fatoyinbo, T.; Lee, S.; Feliciano, E.; Trettin, C.; Simard, M. A comparison of mangrove canopy height using multiple independent measurements from land, air, and space. Remote Sens. 2016, 8, 327. [Google Scholar] [CrossRef] [PubMed]
- Kumar, A.; Stupp, P.; Dahal, S.; Remillard, C.; Bledsoe, R.; Stone, A.; Cameron, C.; Rastogi, G.; Samal, R.; Mishra, D.R. A multi-sensor approach for assessing mangrove biophysical characteristics in coastal Odisha, India. Proc. Natl. Acad. Sci. India Sect. A Phys. Sci. 2017, 87, 679–700. [Google Scholar] [CrossRef]
- Zhu, Y.; Liu, K.; Liu, L.; Myint, S.; Wang, S.; Liu, H.; He, Z. Exploring the potential of worldview-2 red-edge band-based vegetation indices for estimation of mangrove leaf area index with machine learning algorithms. Remote Sens. 2017, 9, 1060. [Google Scholar] [CrossRef]
- Tian, J.; Wang, L.; Li, X.; Gong, H.; Shi, C.; Zhong, R.; Liu, X. Comparison of uav and worldview-2 imagery for mapping leaf area index of mangrove forest. Int. J. Appl. Earth Obs. Geoinf. 2017, 61, 22–31. [Google Scholar] [CrossRef]
- Castillo, J.A.A.; Apan, A.A.; Maraseni, T.N.; Salmo, S.G. Estimation and mapping of above-ground biomass of mangrove forests and their replacement land uses in the Philippines using sentinel imagery. ISPRS J. Photogramm. Remote Sens. 2017, 134, 70–85. [Google Scholar] [CrossRef]
- Baloloy, A.B.; Blanco, A.C.; Candido, C.G.; Argamosa, R.J.L.; Dumalag, J.B.L.C.; Dimapilis, L.L.C.; Paringit, E.C. Estimation of mangrove forest aboveground biomass using multispectral bands, vegetation indices and biophysical variables derived from optical satellite imageries: Rapideye, planetscope and sentinel-2. ISPRS Ann. Photogramm. Remote Sens. Spat. Inf. Sci. 2018, IV-3, 29–36. [Google Scholar] [CrossRef]
- Dou, Z.; Cui, L.; Li, J.; Zhu, Y.; Gao, C.; Pan, X.; Lei, Y.; Zhang, M.; Zhao, X.; Li, W. Hyperspectral estimation of the chlorophyll content in short-term and long-term restorations of mangrove in Quanzhou bay estuary, China. Sustainability 2018, 10, 1127. [Google Scholar] [CrossRef]
- Pastor-Guzman, J.; Dash, J.; Atkinson, P.M. Remote sensing of mangrove forest phenology and its environmental drivers. Remote Sens. Environ. 2018, 205, 71–84. [Google Scholar] [CrossRef]
- Fatoyinbo, T.E.; Simard, M. Height and biomass of mangroves in africa from icesat/glas and srtm. Int. J. Remote Sens. 2013, 34, 668–681. [Google Scholar] [CrossRef]
- Kovacs, J.M.; Lu, X.X.; Flores-Verdugo, F.; Zhang, C.; Flores de Santiago, F.; Jiao, X. Applications of alos palsar for monitoring biophysical parameters of a degraded black mangrove (avicennia germinans) forest. ISPRS J. Photogramm. Remote Sens. 2013, 82, 102–111. [Google Scholar] [CrossRef]
- Kovacs, J.M.; Jiao, X.; Flores-de-Santiago, F.; Zhang, C.; Flores-Verdugo, F. Assessing relationships between radarsat-2 c-band and structural parameters of a degraded mangrove forest. Int. J. Remote Sens. 2013, 34, 7002–7019. [Google Scholar] [CrossRef]
- Wong, F.K.K.; Fung, T. Combining hyperspectral and radar imagery for mangrove leaf area index modeling. Photogramm. Eng. Remote Sens. 2013, 79, 479–490. [Google Scholar] [CrossRef]
- Wannasiri, W.; Nagai, M.; Honda, K.; Santitamnont, P.; Miphokasap, P. Extraction of mangrove biophysical parameters using airborne lidar. Remote Sens. 2013, 5, 1787–1808. [Google Scholar] [CrossRef]
- Lee, S.K.; Fatoyinbo, T.E. Tandem-x pol-insar inversion for mangrove canopy height estimation. IEEE J. Sel. Top. Appl. Earth Obs. Remote Sens. 2015, 8, 3608–3618. [Google Scholar] [CrossRef]
- Cougo, M.; Souza-Filho, P.; Silva, A.; Fernandes, M.; Santos, J.; Abreu, M.; Nascimento, W.; Simard, M. Radarsat-2 backscattering for the modeling of biophysical parameters of regenerating mangrove forests. Remote Sens. 2015, 7, 17097–17112. [Google Scholar] [CrossRef]
- Pereira, F.R.D.S.; Kampel, M.; Cunha-Lignon, M. Mangrove vegetation structure in southeast brazil from phased array l-band synthetic aperture radar data. J. Appl. Remote Sens. 2016, 10, 036021. [Google Scholar] [CrossRef]
- Aslan, A.; Rahman, A.F.; Warren, M.W.; Robeson, S.M. Mapping spatial distribution and biomass of coastal wetland vegetation in Indonesian Papua by combining active and passive remotely sensed data. Remote Sens. Environ. 2016, 183, 65–81. [Google Scholar] [CrossRef]
- Guo, Q.; Su, Y.; Hu, T.; Zhao, X.; Wu, F.; Li, Y.; Liu, J.; Chen, L.; Xu, G.; Lin, G.; et al. An integrated uav-borne lidar system for 3d habitat mapping in three forest ecosystems across china. Int. J. Remote Sens. 2017, 38, 2954–2972. [Google Scholar] [CrossRef]
- Feliciano, E.A.; Wdowinski, S.; Potts, M.D.; Lee, S.-K.; Fatoyinbo, T.E. Estimating mangrove canopy height and above-ground biomass in the everglades national park with airborne lidar and tandem-x data. Remote Sens. 2017, 9, 702. [Google Scholar] [CrossRef]
- Tien Dat, P.; Kunihiko, Y. Characterization of mangrove species using alos-2 palsar in Hai Phong city, Vietnam. IOP Conf. Ser. Earth Environ. Sci. 2016, 37, 012036. [Google Scholar]
- Lee, S.K.; Fatoyinbo, T.E.; Lagomasino, D.; Feliciano, E.; Trettin, C. Multibaseline tandem-x mangrove height estimation: The selection of the vertical wavenumber. IEEE J. Sel. Top. Appl. Earth Obs. Remote Sens. 2018, 99, 1–9. [Google Scholar] [CrossRef]
- Aslan, A.; Rahman, A.F.; Robeson, S.M. Investigating the use of alos prism data in detecting mangrove succession through canopy height estimation. Ecol. Indic. 2018, 87, 136–143. [Google Scholar] [CrossRef]
- Simard, M.; Fatoyinbo, L.; Smetanka, C.; Rivera-Monroy, V.H.; Castañeda-Moya, E.; Thomas, N.; Van der Stocken, T. Mangrove canopy height globally related to precipitation, temperature and cyclone frequency. Nat. Geosci. 2019, 12, 40–45. [Google Scholar] [CrossRef]
- Muhsoni, F.F.; Sambah34, A.; Mahmudi, M.; Wiadnya, D. Comparison of different vegetation indices for assessing mangrove density using sentinel-2 imagery. Int. J. Geomate 2018, 14, 42–51. [Google Scholar]
- Siegmann, B.; Jarmer, T. Comparison of different regression models and validation techniques for the assessment of wheat leaf area index from hyperspectral data. Int. J. Remote Sens. 2015, 36, 4519–4534. [Google Scholar] [CrossRef]
- Schlerf, M.; Atzberger, C. Inversion of a forest reflectance model to estimate structural canopy variables from hyperspectral remote sensing data. Remote Sens. Environ. 2006, 100, 281–294. [Google Scholar] [CrossRef]
- Houborg, R.; Boegh, E. Mapping leaf chlorophyll and leaf area index using inverse and forward canopy reflectance modeling and spot reflectance data. Remote Sens. Environ. 2008, 112, 186–202. [Google Scholar] [CrossRef]
- Henderson, F.M.; Lewis, A.J. Principles and Applications of Imaging Radar. Manual of Remote Sensing, 3rd ed.; Wiley: Hoboken, NJ, USA, 1998; Volume 2, p. 896. [Google Scholar]
- Le Toan, T.; Quegan, S.; Woodward, I.; Lomas, M.; Delbart, N.; Picard, G. Relating radar remote sensing of biomass to modelling of forest carbon budgets. Clim. Chang. 2004, 67, 379–402. [Google Scholar] [CrossRef]
- Englhart, S.; Keuck, V.; Siegert, F. Aboveground biomass retrieval in tropical forests—The potential of combined x- and l-band sar data use. Remote Sens. Environ. 2011, 115, 1260–1271. [Google Scholar] [CrossRef]
- Sarker, L.; Nichol, J.; Mubin, A. Potential of multiscale texture polarization ratio of c-band sar for forest biomass estimation. In Developments in Multidimensional Spatial Data Models; Abdul Rahman, A., Boguslawski, P., Gold, C., Said, M.N., Eds.; Springer: Berlin/Heidelberg, Germany, 2013; pp. 69–83. [Google Scholar]
- Thumaty, K.; Fararoda, R.; Middinti, S.; Gopalakrishnan, R.; Jha, C.S.; Dadhwal, V.K. Estimation of above ground biomass for central indian deciduous forests using alos palsar l-band data. J. Indian Soc. Remote Sens. 2016, 44, 31–39. [Google Scholar] [CrossRef]
- Sandberg, G.; Ulander, L.M.H.; Fransson, J.E.S.; Holmgren, J.; Le Toan, T. L- and p-band backscatter intensity for biomass retrieval in hemiboreal forest. Remote Sens. Environ. 2011, 115, 2874–2886. [Google Scholar] [CrossRef]
- Kubota, V.R.; Yoneda, T.; Okuda, T.; Kadir, W.R. Suitability of interferometric synthetic aperture radar (ifsar) for biomass estimation in a selectively logged tropical rainforest in peninsular malaysia. Tropics 2015, 24, 101–111. [Google Scholar] [CrossRef]
- Sinha, S.; Jeganathan, C.; Sharma, L.K.; Nathawat, M.S. A review of radar remote sensing for biomass estimation. Int. J. Environ. Sci. Technol. 2015, 12, 1779–1792. [Google Scholar] [CrossRef] [Green Version]
- Ghasemi, N.; Sahebi, M.R.; Mohammadzadeh, A. A review on biomass estimation methods using synthetic aperture radar data. Int. J. Geomat. Geosci. 2011, 1, 776–788. [Google Scholar]
- Lee, S.; Kugler, F.; Papathanassiou, K.P.; Hajnsek, I. Quantification of temporal decorrelation effects at l-band for polarimetric sar interferometry applications. IEEE J. Sel. Top. Appl. Earth Obs. Remote Sens. 2013, 6, 1351–1367. [Google Scholar] [CrossRef]
- Feliciano, E.A.; Wdowinski, S.; Potts, M.D. Assessing mangrove above-ground biomass and structure using terrestrial laser scanning: A case study in the Everglades National Park. Wetlands 2014, 34, 955–968. [Google Scholar] [CrossRef]
- Hickey, S.M.; Callow, N.J.; Phinn, S.; Lovelock, C.E.; Duarte, C.M. Spatial complexities in aboveground carbon stocks of a semi-arid mangrove community: A remote sensing height-biomass-carbon approach. Estuar. Coast. Shelf Sci. 2018, 200, 194–201. [Google Scholar] [CrossRef]
- Simard, M.; Zhang, K.; Rivera-Monroy, V.H.; Ross, M.S.; Ruiz, P.L.; Castañeda-Moya, E.; Twilley, R.R.; Rodriguez, E. Mapping height and biomass of mangrove forests in everglades national park with srtm elevation data. Photogramm. Eng. Remote Sens. 2006, 72, 299–311. [Google Scholar] [CrossRef]
- Fatoyinbo, T.E.; Simard, M.; Washington-Allen, R.A.; Shugart, H.H. Landscape-scale extent, height, biomass, and carbon estimation of mozambique’s mangrove forests with landsat etm+ and shuttle radar topography mission elevation data. J. Geophys. Res. Biogeosci. 2008, 113. [Google Scholar] [CrossRef]
- Clark, D.B.; Clark, D.A. Landscape-scale variation in forest structure and biomass in a tropical rain forest. For. Ecol. Manag. 2000, 137, 185–198. [Google Scholar] [CrossRef]
- Grimsditch, G.; Alder, J.; Nakamura, T.; Kenchington, R.; Tamelander, J. The blue carbon special edition—Introduction and overview. Ocean Coast. Manag. 2013, 83, 1–4. [Google Scholar] [CrossRef]
- Howard, J.; Hoyt, S.; Isensee, K.; Pidgeon, E.; Telszewski, M. Coastal Blue Carbon: Methods for Assessing Carbon Stocks and Emissions Factors in Mangroves, Tidal Salt Marshes, and Seagrass Meadows; Conservation International, Intergovernmental Oceanographic Commission of UNESCO, International Union for Conservation of Nature: Arlington, VA, USA, 2014. [Google Scholar]
- Locatelli, T.; Binet, T.; Kairo, J.G.; King, L.; Madden, S.; Patenaude, G.; Upton, C.; Huxham, M. Turning the tide: How blue carbon and payments for ecosystem services (pes) might help save mangrove forests. AMBIO 2014, 43, 981–995. [Google Scholar] [CrossRef]
- Hirata, Y.; Tabuchi, R.; Patanaponpaiboon, P.; Poungparn, S.; Yoneda, R.; Fujioka, Y. Estimation of aboveground biomass in mangrove forests using high-resolution satellite data. J. Res. 2014, 19, 34–41. [Google Scholar] [CrossRef]
- Hamdan, O.; Khali Aziz, H.; Mohd Hasmadi, I. L-band alos palsar for biomass estimation of matang mangroves, malaysia. Remote Sens. Environ. 2014, 155, 69–78. [Google Scholar] [CrossRef]
- Latifi, H.; Fassnacht, F.E.; Hartig, F.; Berger, C.; Hernández, J.; Corvalán, P.; Koch, B. Stratified aboveground forest biomass estimation by remote sensing data. Int. J. Appl. Earth Obs. Geoinf. 2015, 38, 229–241. [Google Scholar] [CrossRef]
- Jin-Eong, O.; Khoon, G.W.; Clough, B.F. Structure and productivity of a 20-year-old stand of rhizophora apiculata bl. Mangrove forest. J. Biogeogr. 1995, 22, 417–424. [Google Scholar] [CrossRef]
- Clough, B.F.; Dixon, P.; Dalhaus, O. Allometric relationships for estimating biomass in multi-stemmed mangrove trees. Aust. J. Bot. 1997, 45, 1023–1031. [Google Scholar] [CrossRef]
- Komiyama, A.; Jintana, V.; Sangtiean, T.; Kato, S. A common allometric equation for predicting stem weight of mangroves growing in secondary forests. Ecol. Res. 2002, 17, 415–418. [Google Scholar] [CrossRef]
- Komiyama, A.; Ong, J.E.; Poungparn, S. Allometry, biomass, and productivity of mangrove forests: A review. Aquat. Bot. 2008, 89, 128–137. [Google Scholar] [CrossRef]
- Chave, J.; Andalo, C.; Brown, S.; Cairns, M.A.; Chambers, J.Q.; Eamus, D.; Fölster, H.; Fromard, F.; Higuchi, N.; Kira, T.; et al. Tree allometry and improved estimation of carbon stocks and balance in tropical forests. Oecologia 2005, 145, 87–99. [Google Scholar] [CrossRef] [PubMed]
- Komiyama, A.; Poungparn, S.; Kato, S. Common allometric equations for estimating the tree weight of mangroves. J. Trop. Ecol. 2005, 21, 471–477. [Google Scholar] [CrossRef]
- Ellison, A. Macroecology of mangroves: Large-scale patterns and processes in tropical coastal forests. Trees 2002, 16, 181–194. [Google Scholar] [CrossRef]
- Rosillo-Calle, F.; Groot, P.; Hemstock, S.L.; Woods, J. The Biomass Assessment Handbook: Bioenergy for a Sustainable Environment; Earthscan: London, UK, 2007; p. 294. [Google Scholar]
- Avtar, R.; Kumar, P.; Oono, A.; Saraswat, C.; Dorji, S.; Hlaing, Z. Potential application of remote sensing in monitoring ecosystem services of forests, mangroves and urban areas. Geocarto Int. 2017, 32, 874–885. [Google Scholar] [CrossRef]
- Pham, T.D.; Yoshino, K.; Kaida, N. Monitoring mangrove forest changes in cat ba biosphere reserve using alos palsar imagery and a gis-based support vector machine algorithm. In Advances and Applications in Geospatial Technology and Earth Resources: Proceedings of the International Conference on Geo-Spatial Technologies and Earth Resources 2017; Tien Bui, D., Ngoc Do, A., Bui, H.-B., Hoang, N.-D., Eds.; Springer International Publishing: Cham, Switzerland, 2018; pp. 103–118. [Google Scholar]
- Lu, D. The potential and challenge of remote sensing-based biomass estimation. Int. J. Remote Sens. 2006, 27, 1297–1328. [Google Scholar] [CrossRef]
- Ross, M.; Ruiz, P.; Telesnicki, G.; Meeder, J. Estimating above-ground biomass and production in mangrove communities of Biscayne National park, Florida (U.S.A.). Wetl. Ecol. Manag. 2001, 9, 27–37. [Google Scholar] [CrossRef]
- Jachowski, N.R.A.; Quak, M.S.Y.; Friess, D.A.; Duangnamon, D.; Webb, E.L.; Ziegler, A.D. Mangrove biomass estimation in southwest Thailand using machine learning. Appl. Geogr. 2013, 45, 311–321. [Google Scholar] [CrossRef]
- Pham, T.D.; Yoshino, K.; Bui, D.T. Biomass estimation of sonneratia caseolaris (l.) engler at a coastal area of Hai Phong City (Vietnam) using alos-2 palsar imagery and gis-based multi-layer perceptron neural networks. GISci. Remote Sens. 2017, 54, 329–353. [Google Scholar] [CrossRef]
- Pham, L.T.H.; Brabyn, L. Monitoring mangrove biomass change in Vietnam using spot images and an object-based approach combined with machine learning algorithms. ISPRS J. Photogramm. Remote Sens. 2017, 128, 86–97. [Google Scholar] [CrossRef]
- Manna, S.; Nandy, S.; Chanda, A.; Akhand, A.; Hazra, S.; Dadhwal, V.K. Estimating aboveground biomass in Avicennia marina plantation in Indian Sundarbans using high-resolution satellite data. J. Appl. Remote Sens. 2014, 8, 083638. [Google Scholar] [CrossRef]
- Zhu, Y.; Liu, K.; Liu, L.; Wang, S.; Liu, H. Retrieval of mangrove aboveground biomass at the individual species level with worldview-2 images. Remote Sens. 2015, 7, 12192–12214. [Google Scholar] [CrossRef]
- Mutanga, O.; Skidmore, A.K. Narrow band vegetation indices overcome the saturation problem in biomass estimation. Int. J. Remote Sens. 2004, 25, 3999–4014. [Google Scholar] [CrossRef]
- Phua, M.-H.; Saito, H. Estimation of biomass of a mountainous tropical forest using landsat tm data. Can. J. Remote Sens. 2003, 29, 429–440. [Google Scholar] [CrossRef]
- Popescu, S.C.; Wynne, R.H.; Nelson, R.F. Measuring individual tree crown diameter with lidar and assessing its influence on estimating forest volume and biomass. Can. J. Remote Sens. 2003, 29, 564–577. [Google Scholar] [CrossRef]
- Friess, D.A.; Richards, D.R.; Phang, V.X.H. Mangrove forests store high densities of carbon across the tropical urban landscape of singapore. Urban Ecosyst. 2016, 19, 795–810. [Google Scholar] [CrossRef]
- Lu, D.; Chen, Q.; Wang, G.; Liu, L.; Li, G.; Moran, E. A survey of remote sensing-based aboveground biomass estimation methods in forest ecosystems. Int. J. Digit. Earth 2016, 9, 63–105. [Google Scholar] [CrossRef]
- Kumar, L.; Sinha, P.; Taylor, S.; Alqurashi, A.F. Review of the use of remote sensing for biomass estimation to support renewable energy generation. J. Appl. Remote Sens. 2015, 9, 097696. [Google Scholar] [CrossRef]
- Gleason, C.J.; Im, J. A review of remote sensing of forest biomass and biofuel: Options for small-area applications. Gisci. Remote Sens. 2011, 48, 141–170. [Google Scholar] [CrossRef]
- Shugart, H.H.; Saatchi, S.; Hall, F.G. Importance of structure and its measurement in quantifying function of forest ecosystems. J. Geophys. Res. Biogeosci. 2010, 115. [Google Scholar] [CrossRef]
- FAO. Gtos: Biomass Assessment of the Status of the Development of the Standards for the Terrestrial Essential Climate Variables; FAO: Rome, Italy, 2009; p. 18. [Google Scholar]
- Lucas, R.M.; Mitchell, A.L.; Rosenqvist, A.; Proisy, C.; Melius, A.; Ticehurst, C. The potential of l-band sar for quantifying mangrove characteristics and change: Case studies from the tropics. Aquat. Conserv. Mar. Freshw. Ecosyst. 2007, 17, 245–264. [Google Scholar] [CrossRef]
- Carreiras, J.M.B.; Vasconcelos, M.J.; Lucas, R.M. Understanding the relationship between aboveground biomass and alos palsar data in the forests of guinea-bissau (west africa). Remote Sens. Environ. 2012, 121, 426–442. [Google Scholar] [CrossRef]
- Peregon, A.; Yamagata, Y. The use of alos/palsar backscatter to estimate above-ground forest biomass: A case study in western siberia. Remote Sens. Environ. 2013, 137, 139–146. [Google Scholar] [CrossRef]
- Vu, T.D.; Takeuchi, W.; Van, N.A. Carbon stock calculating and forest change assessment toward redd+ activities for the mangrove forest in vietnam. Trans. Jpn. Soc. Aeronaut. Space Sci. Aerosp. Technol. Jpn. 2014, 12, Pn_23–Pn_31. [Google Scholar] [CrossRef]
- Navarro, J.A.; Algeet, N.; Fernández-Landa, A.; Esteban, J.; Rodríguez-Noriega, P.; Guillén-Climent, M.L. Integration of uav, sentinel-1, and sentinel-2 data for mangrove plantation aboveground biomass monitoring in senegal. Remote Sens. 2019, 11, 77. [Google Scholar] [CrossRef]
- Takeuchi, W.; Tien, D.V.; Phuong, V.T.; Van, A.N.; Oo, K.S. Above ground biomass mapping of mangrove forest in vietnam by alos palsar. In Proceedings of the 2011 3rd International Asia-Pacific Conference on Synthetic Aperture Radar (APSAR), Seoul, Korea, 26–30 September 2011; pp. 1–3. [Google Scholar]
- Fransson, J.E.S.; Smith, G.; Askne, J.; Olsson, H. Stem volume estimation in boreal forests using ers-1/2 coherence and spot xs optical data. Int. J. Remote Sens. 2001, 22, 2777–2791. [Google Scholar] [CrossRef]
- Pulliainen, J.; Engdahl, M.; Hallikainen, M. Feasibility of multi-temporal interferometric sar data for stand-level estimation of boreal forest stem volume. Remote Sens. Environ. 2003, 85, 397–409. [Google Scholar] [CrossRef]
- Askne, J.; Fransson, J.; Santoro, M.; Soja, M.; Ulander, L. Model-based biomass estimation of a hemi-boreal forest from multitemporal tandem-x acquisitions. Remote Sens. 2013, 5, 5574–5597. [Google Scholar] [CrossRef]
- Kugler, F.; Schulze, D.; Hajnsek, I.; Pretzsch, H.; Papathanassiou, K.P. Tandem-x pol-insar performance for forest height estimation. Ieee Trans. Geosci. Remote Sens. 2014, 52, 6404–6422. [Google Scholar] [CrossRef]
- Ghasemi, N.; Tolpekin, V.; Stein, A. Assessment of forest above-ground biomass estimation from polinsar in the presence of temporal decorrelation. Remote Sens. 2018, 10, 815. [Google Scholar] [CrossRef]
- Solberg, S.; Astrup, R.; Gobakken, T.; Næsset, E.; Weydahl, D.J. Estimating spruce and pine biomass with interferometric x-band sar. Remote Sens. Environ. 2010, 114, 2353–2360. [Google Scholar] [CrossRef]
- Neumann, M.; Saatchi, S.S.; Ulander, L.M.H.; Fransson, J.E.S. Assessing performance of l- and p-band polarimetric interferometric sar data in estimating boreal forest above-ground biomass. IEEE Trans. Geosci. Remote Sens. 2012, 50, 714–726. [Google Scholar] [CrossRef]
- Lavalle, M.; Hensley, S. Extraction of structural and dynamic properties of forests from polarimetric-interferometric sar data affected by temporal decorrelation. IEEE Trans. Geosci. Remote Sens. 2015, 53, 4752–4767. [Google Scholar] [CrossRef]
- Askne, J.I.H.; Soja, M.J.; Ulander, L.M.H. Biomass estimation in a boreal forest from tandem-x data, lidar dtm, and the interferometric water cloud model. Remote Sens. Environ. 2017, 196, 265–278. [Google Scholar] [CrossRef]
- NOAA. Lidar—Light Detection and Ranging—Is a Remote Sensing Method Used to Examine the Surface of the Earth. Available online: http://oceanservice.noaa.gov/facts/lidar.html (accessed on 4 December 2017).
- Lefsky, M.A.; Cohen, W.B.; Parker, G.G.; Harding, D.J. Lidar remote sensing for ecosystem studies: Lidar, an emerging remote sensing technology that directly measures the three-dimensional distribution of plant canopies, can accurately estimate vegetation structural attributes and should be of particular interest to forest, landscape, and global ecologists. BioScience 2002, 52, 19–30. [Google Scholar]
- Ahmed, R.; Siqueira, P.; Hensley, S. A study of forest biomass estimates from lidar in the northern temperate forests of new england. Remote Sens. Environ. 2013, 130, 121–135. [Google Scholar] [CrossRef]
- Fatoyinbo, T.; Feliciano, A.E.; Lagomasino, D.; Lee, S.K.; Trettin, C. Estimating mangrove aboveground biomass from airborne lidar data: A case study from the zambezi river delta. Environ. Res. Lett. 2018, 13, 025012. [Google Scholar] [CrossRef]
- Lee, S.J.; Kim, J.R.; Choi, Y.S. The extraction of forest co2 storage capacity using high-resolution airborne lidar data. GISci. Remote Sens. 2013, 50, 154–171. [Google Scholar] [CrossRef]
- Unger, D.R.; Hung, I.K.; Brooks, R.; Williams, H. Estimating number of trees, tree height and crown width using lidar data. GISci. Remote Sens. 2014, 51, 227–238. [Google Scholar] [CrossRef]
- Rocha de Souza Pereira, F.; Kampel, M.; Gomes Soares, M.; Estrada, G.; Bentz, C.; Vincent, G. Reducing uncertainty in mapping of mangrove aboveground biomass using airborne discrete return lidar data. Remote Sens. 2018, 10, 637. [Google Scholar] [CrossRef]
- Zolkos, S.G.; Goetz, S.J.; Dubayah, R. A meta-analysis of terrestrial aboveground biomass estimation using lidar remote sensing. Remote Sens. Environ. 2013, 128, 289–298. [Google Scholar] [CrossRef]
- Sibanda, M.; Mutanga, O.; Rouget, M. Comparing the spectral settings of the new generation broad and narrow band sensors in estimating biomass of native grasses grown under different management practices. Giscience Remote Sens. 2016, 53, 614–633. [Google Scholar] [CrossRef]
- Vaglio Laurin, G.; Chen, Q.; Lindsell, J.A.; Coomes, D.A.; Frate, F.D.; Guerriero, L.; Pirotti, F.; Valentini, R. Above ground biomass estimation in an african tropical forest with lidar and hyperspectral data. ISPRS J. Photogramm. Remote Sens. 2014, 89, 49–58. [Google Scholar] [CrossRef]
- Luo, S.; Wang, C.; Xi, X.; Pan, F.; Peng, D.; Zou, J.; Nie, S.; Qin, H. Fusion of airborne lidar data and hyperspectral imagery for aboveground and belowground forest biomass estimation. Ecol. Indic. 2017, 73, 378–387. [Google Scholar] [CrossRef]
- Nguyen, H.; Jung, J.; Lee, J.; Choi, S.-U.; Hong, S.-Y.; Heo, J. Optimal atmospheric correction for above-ground forest biomass estimation with the etm+ remote sensor. Sensors 2015, 15, 18865. [Google Scholar] [CrossRef]
- Lam-Dao, N.; Pham-Bach, V.; Nguyen-Thanh, M.; Pham-Thi, M.-T.; Hoang-Phi, P. Change detection of land use and riverbank in mekong delta, vietnam using time series remotely sensed data. J. Resour. Ecol. 2011, 2, 370–374. [Google Scholar]
- Xu, Q.; Hou, Z.; Tokola, T. Relative radiometric correction of multi-temporal alos avnir-2 data for the estimation of forest attributes. ISPRS J. Photogramm. Remote Sens. 2012, 68, 69–78. [Google Scholar] [CrossRef]
- Pons, X.; Pesquer, L.; Cristóbal, J.; González-Guerrero, O. Automatic and improved radiometric correction of landsat imagery using reference values from modis surface reflectance images. Int. J. Appl. Earth Obs. Geoinf. 2014, 33, 243–254. [Google Scholar] [CrossRef]
- López-Serrano, P.; Corral-Rivas, J.; Díaz-Varela, R.; Álvarez-González, J.; López-Sánchez, C. Evaluation of radiometric and atmospheric correction algorithms for aboveground forest biomass estimation using landsat 5 tm data. Remote Sens. 2016, 8, 369. [Google Scholar]
- Balthazar, V.; Vanacker, V.; Lambin, E.F. Evaluation and parameterization of atcor3 topographic correction method for forest cover mapping in mountain areas. Int. J. Appl. Earth Obs. Geoinf. 2012, 18, 436–450. [Google Scholar] [CrossRef]
- Martins, V.; Barbosa, C.; de Carvalho, L.; Jorge, D.; Lobo, F.; Novo, E. Assessment of atmospheric correction methods for sentinel-2 msi images applied to amazon floodplain lakes. Remote Sens. 2017, 9, 322. [Google Scholar] [CrossRef]
- Qiu, F.; Berglund, J.; Jensen, J.R.; Thakkar, P.; Ren, D. Speckle noise reduction in sar imagery using a local adaptive median filter. GISci. Remote Sens. 2004, 41, 244–266. [Google Scholar] [CrossRef]
- Zhong, H.; Li, Y.; Jiao, L. Sar image despeckling using bayesian nonlocal means filter with sigma preselection. IEEE Geosci. Remote Sens. Lett. 2011, 8, 809–813. [Google Scholar] [CrossRef]
- Zhu, H.M.; Zhong, W.Q.; Jiao, L.C. Combination of target detection and block-matching 3d filter for despeckling sar images. Electron. Lett. 2013, 49, 495–497. [Google Scholar] [CrossRef]
- Baier, G.; Rossi, C.; Lachaise, M.; Zhu, X.X.; Bamler, R. Nonlocal insar filtering for high resolution dem generation from tandem-x interferograms. In Proceedings of the 2017 IEEE International Geoscience and Remote Sensing Symposium (IGARSS), Fort Worth, TX, USA, 23–28 July 2017; pp. 103–106. [Google Scholar]
- Yocky, D.A. Multiresolution wavelet decomposition i me merger of landsat thematic mapper and spot panchromatic data. Photogramm. Eng. Remote Sens. 1996, 62, 1067–1074. [Google Scholar]
- Garguet-Duport, B.; Girel, J.; Chassery, J.-M.; Patou, G. The use of multiresolution analysis and wavelets transform for merging spot panchromatic and multispectral image data. Photogramm. Eng. Remote Sens. 1996, 62, 1057–1066. [Google Scholar]
- Shaban, M.; Dikshit, O. Evaluation of the merging of spot multispectral and panchromatic data for classification of an urban environment. Int. J. Remote Sens. 2002, 23, 249–262. [Google Scholar] [CrossRef]
- Basuki, T.M.; Skidmore, A.K.; Hussin, Y.A.; Van Duren, I. Estimating tropical forest biomass more accurately by integrating alos palsar and landsat-7 etm+ data. Int. J. Remote Sens. 2013, 34, 4871–4888. [Google Scholar] [CrossRef]
- Vafaei, S.; Soosani, J.; Adeli, K.; Fadaei, H.; Naghavi, H.; Pham, T.D.; Tien Bui, D. Improving accuracy estimation of forest aboveground biomass based on incorporation of alos-2 palsar-2 and sentinel-2a imagery and machine learning: A case study of the hyrcanian forest area (iran). Remote Sens. 2018, 10, 172. [Google Scholar] [CrossRef]


| Technique Used | Sensor | Location | Performance | Reference | Year |
|---|---|---|---|---|---|
| Unsupervised ISODATA classifier | IKONOS | Guinea, West Africa | 78% | [33] | 2010 |
| NDVI pixel-based methods | Landsat 8 OLI, SPOT-5, Sentinel-2, WorldView-2 | Mexican Pacific | 64% 75% 78% 93% | [32] | 2017 |
| Pixel-based methods Linear spectral unmixing (LSU) | Hyperspectral CASI-2 | Southeast Queensland, Australia | 56% | [26] | 2011 |
| K-means cluster analysis | Hyperspectral | Surdarbans, Indian | [34] | 2013 | |
| Subpixel classification/ Constrained and unconstrained LSU | Hyperspectral Hyperion | Sundarbans Delta, India | 55–74% | [35] | 2013 |
| Visual interpretation methods | Aerial photographs WorldView-2 | Darwin, Australia | 68% 42–58% | [24] | 2014 |
| Object-based image classifier | Hyperspectral Hyperion Hyperspectral CASI-2 | Mai Po Hong Kong Southeast Queensland, Australia | 88% 69–76% | [27] [26] | 2014 2011 |
| Object-based image classifier | Rapid Eye and LiDAR | South Sumatra Indonesia | N/A | [36] | 2016 |
| Maximum likelihood classifier | Ikonos, Geoeye, QuickBird, and WorldView-2 | Bali, Indonesia | 66–80% | [25] | 2016 |
| Hybrid methods | Landsat Landsat and Pléiades-1 | Lampi Island, Myanmar Guangzhou city, China | 88–92% Over 80% 94.2% | [37] [30] | 2016 2018 |
| Pixel-based methods Maximum likelihood algorithm | ALOS AVNIR-2 | East Malaysia | 80% | [38] | 2018 |
| Object-based logistics model tree (LMT) algorithm | ALOS PALSAR and ALOS-2 PALSAR-2 | Hai Phong city, Vietnam | 80.2–83.8% | [31] | 2018 |
| Technique Used | Sensor | Location | Performance | Reference | Year |
|---|---|---|---|---|---|
| Artificial neural network (ANN) | SPOT and Gaofen-1 EO-1 Hyperion and Envisat ASAR | Mai Po Ramsar Site, Hong Kong Mai Po Ramsar Site, Hong Kong | 63%–92% 72%–74% | [40] [42] | 2018 2014 |
| Rotation forest (RoF) | WorldView-3 and Radarsat-2 | Mai Po Ramsar Site, Hong Kong | 85.2% | [39] | 2018 |
| Random forest (RF) | Landsat Pléiades-1 WorldView-3 and Radarsat-2 | Darwin Australia Guangzhou city, China Mai Po Ramsar Site, Hong Kong | 82% 82.4% 84.1% | [43] [30] [39] | 2017 2018 2018 |
| Sentinel-2, Landsat-8, Pléiades -1 | Hainan island, Dongzhaigang, China | 68.57%–78.57% | [44] | 2018 | |
| k-nearest neighbor (NN) | Landsat TM, ALOS AVNIR-2, WorldView-2 & LiDAR UAV Hyperspectral | Queensland, Australia & Karimunjawa Central Java, Indonesia Zhuhai City, Guangdong, China | 53%–59% 76.1%–82.1% | [28] [46] | 2015 2018 |
| Support Vector Machines (SVM) | Pan-sharpened WorldView-2 WorldView-3 Pléiades-1 SPOT and Gaofen-1 UAV hyperspectral and Pleiades-1B | Darwin, Australia Mai Po Hongkong Guangdong, China Mai Po Ramsar Site, Hong Kong Setiu Wetland, Malaysia | 87%–89% 83.8%–94.4% 79.6% 67%–92% 82.4%–88.7% 77.2%–94% | [24] [45] [30] [40] [47] | 2014 2016 2018 2018 2018 |
| Sequential forward selection (SFS) using spectral angle mapper (SAM) | Hyperspectral EO-1 Hyperion | Thammarat Province, Thailand | 86–92% | [41] | 2013 |
| Decision tree (DT) Pixel-based methods Object-based methods | EO-1 Hyperion and Envisat ASAR Landsat and Pléiades-1 | Mai Po Ramsar Site,Hong Kong Mai Po Ramsar Site, Hong Kong | 46%–71% 65.7% 75.9% | [42] [30] | 2014 2018 |
| Sensor | Task | Location | Performance | Reference | Year |
|---|---|---|---|---|---|
| Passive sensors | |||||
| QuickBird, IKONOS | Tree height, diameter at breast height (DBH), leaf area index (LAI), basal area (BA) | Guinea, West Africa | N/A | [33] | 2010 |
| Landsat TM | Tree height, DBH, LAI | Sinaloa, Mexico | N/A | [48] | 2011 |
| Hyperspectral data | Leaf pigments: chlorophyll a, b, and carotenoid content | Mexican Pacific | R2 = 0.46–0.87 | [49] | 2012 |
| Hyperspectral data | Leaf chlorophyll a | Mexican Pacific | R2 = 0.68–0.80 | [50] | 2013 |
| Hyperspectral data | Leaf nitrogen concentration | Mexican Pacific | R2 = 0. 71–0.91 | [51] | 2013 |
| Hyperspectral data HyMap | Foliar nitrogen concentration | Mahakam delta of East Kalimantan, Indonesia | R2 = 0. 48–0.74 | [52] | 2013 |
| Hyperspectral data HyMap | Foliar nitrogen concentration | Berau Delta, Indonesia | R2 = 0. 67 RMSE = 0.17 | [53] | 2013 |
| Worldview-2 | Tree canopies and crowns | Moreton Bay, Queensland Australia | N/A | [54] | 2014 |
| Landsat-8 OLI | Leaf chlorophyll | Yucatan Peninsula, Mexico | R2 = 0.70 RMSE = 1.5 g m−2 | [55] | 2015 |
| Worldview-2 | Leaf chlorophyll, LAI | Darwin, Australia | R2 = 0.44–0.50 RMSE = 0.6–0.8 g m−2 | [56] | 2015 |
| WorldView-2 and Landsat TM | LAI | Florida, United States (USA) | R2 = 0.60–0.84 RMSE = 0.36–0.67 | [57] | 2015 |
| High-resolution stereo-imagery from WorldView-1 | Canopy height | Southern Mozambique | R2 = 0.81 RMSE = 1.4 m | [58] | 2015 |
| WorldView-2, ALOS AVNIR-2 and Landsat TM | LAI | Moreton Bay, Australia and Karimunjawa Island, Indonesia | R2 = 0.50–0.83 RMSE = 0.54–1.31 | [59] | 2016 |
| WorldView-2 | LAI | Rapid Creek, Northern Territory, Australia | R2 = 0.49–0.64 RMSE = 0.75–0.78 | [60] | 2016 |
| High-resolution stereo-imagery from WorldView-1 | Canopy height | Zambezi Delta, Mozambique | R2 = 0.73 RMSE = 3.9 m | [61] | 2016 |
| MODIS Terra, Landsat and Sentinel-1 | Leaf chlorophyll, LAI | Coastal Odisha, India | R2 = 0.47–0.61 RMSE = 0.76–1.47 | [62] | 2017 |
| WorldView-2 | LAI | Dawei Bay, Guangdong province, China | R2 = N/A RMSE = 0.45–0.51 | [63] | 2017 |
| WorldView-2 | LAI, tree height | Guangxi province, China | R2 = 0.64–0.82 RMSE = 0.42–0.54 | [64] | 2017 |
| Sentinel-2 | LAI | Philippines | R2 = 0.64 | [65] | 2017 |
| RapidEye, PlanetScope, Sentinel-2 | LAI, Leaf chlorophyll | Masinloc, Zambales, Philippines | R2 = 0.80–0.92 | [66] | 2018 |
| Hyperspectral data EO-1 HYPERION | Leaf chlorophyll | Quanzhou, China | R2 = 0.72–0.82 | [67] | 2018 |
| MODIS | Phenological parameters climatic variables, salinity, and litterfall | Yucatan peninsula, southeast Mexico | R2 = 0.49–0.77 | [68] | 2018 |
| Active sensors | |||||
| ICESat/GLAS and SRTM | Canopy height and (3D) structure | Africa | R2 = N/A RMSE = 3.55 m | [69] | 2013 |
| ALOS PALSAR | LAI, tree height, BA, DBH, tree density | Isla La Palma, Pacific coast | R2 = 0.65–0.79 RMSE = 0.34–0.51 | [70] | 2013 |
| Radarsat-2 | LAI, BA, DBH, tree density | Isla La Palma, Pacific coast | R2 = 0.53–0.70 | [71] | 2013 |
| Hyperpectral and SAR data | LAI | Mai Po Ramsar Site of Hong Kong | R2 = 0.68–0.78 RMSE = 0.2 | [72] | 2013 |
| LiDAR | Crown diameter and tree height | Samut-Prakan province, Thailand | R2 = 0.75–0.80 RMSE = 1.4–1.6 m | [73] | 2013 |
| TanDEM-X Pol-InSAR data | Tree canopy height | Campeche, Mexico, and Zambezi Delta, Mozambique | R2 = 0.72– 0.84 RMSE = 1.1–1.7 m | [74] | 2015 |
| Radarsat-2 (C band) | Tree height, DBH, and basal area (BA) | Amazon River, Brazil | R2 = 0.63–0.81 R2 = 0.52–0.79 R2 = 0.46–0.67 | [75] | 2015 |
| ALOS PALSAR | Tree and canopy height, DBH, and BA | Southern coast of São Paulo, Brazi | R2 = 0.67–0.73 | [76] | 2016 |
| Landsat OLI and ALOS PALSAR | Canopy height | Mimika district, Papua, Indonesia | R2 = 0.80 RMSE = 2.7 m | [77] | 2016 |
| TanDEM-X, SRTM and airborne LiDAR | Canopy height | Zambezi Delta, Mozambique | R2 = 0.69–0.71 RMSE = 2.5–5.8 m | [61] | 2016 |
| UAV borne LiDAR | Canopy height, canopy cover, and LAI | Guangdong province, China | R2 = 0.81 RMSE = 1.1 m | [78] | 2017 |
| LiDAR and TanDEM-X | Canopy height | Everglades National Park, USA | R2 = 0.85 RMSE = 1.9 m | [79] | 2017 |
| ALOS-2 PALSAR-2 | Tree height | Hai Phong city, Vietnam | R2 = 0.61 | [80] | 2018 |
| TanDEM-X InSAR data | Tree height | Kanda and Pongara National Parks, Gabon | R2 = 0.98 RMSE = 2.7 m | [81] | 2018 |
| ALOS PRISM | Canopy height | Mimika Papua and Mahakam Delta Indonesia, Sundarbans, Bangladesh | R2 = N/A RMSE = 3.6–4.1 m | [82] | 2018 |
| SRTM and LiDAR | Canopy height | Globally | R2 = 0.73 RMSE < 3 m | [83] | 2019 |
| Year | Research Study | Sensor/SAR Dataset | Study Site | Model | Performance /Range of Value |
|---|---|---|---|---|---|
| 2011 | [90] | ALOS PALSAR, TerraSAR-X band | Central Kalimantan, Borneo, Indonesia | Regression model | R2 = 0.43–0.53 AGB ~ 600 Mg ha−1 |
| 2012 | [136] | ALOS PALSAR | Mozambique, Africa | BagSGB model | R2 = 0.90 AGB = 4.0–91.1 Mg ha−1 |
| 2013 | [137] | ALOS PALSAR | Western Siberia | Backscatter water cloud model | R2 =0.35–0.49 AGB = 30–190 Mg ha−1 |
| 2014 | [107] | ALOS PALSAR | Matang Forest, Malaysia | Regression models | R2 = 0.43–0.62 AGB = 3.0–378.3 Mg ha−1 |
| 2014 | [138] | ALOS PALSAR | Quang Ninh, Ca Mau, Kien Giang of Vietnam | Regression models | R2: N/A AGB ~ 150 Mg ha−1 |
| 2015 | [75] | RADARSAR-2 | Amazon River, Brazil | Regression models | R2 = 0.52–0.79 AGB = 100–400 Mg ha−1 |
| 2017 | [5] | ALOS-2 PALSAR-2 | Hai Phong, Vietnam | Regression models | R2 = 0.51–0.64 AGB = 27.6–209.2 Mg ha−1 |
| 2017 | [79] | TanDEM-X band | Everglades NationalPark, South Florida, USA | Regression models | R2 = 0.85 AGB ~ 250 Mg ha−1 |
| 2017 | [122] | ALOS-2 PALSAR-2 | Coastal area, Hai Phong city, Vietnam | Multilayer perceptron neural networks (MLPNN) | R2 = 0.78 AGB = 2.8–298.9 Mg ha−1 |
| 2018 | [6] | ALOS-2 PALSAR-2 | Mangrove plantation, Vietnam | Support vector regression (SVR) | R2 = 0.60 AGB = 36.2–230.1 Mg ha−1 |
| 2018 | [65] | Sentinel-1 C-band SAR | Honda Bay, Philippines | Support vector regression (SVR) | R2 = 0.67 AGB ~ 180 Mg ha−1 |
| 2019 | [139] | Sentinel-1 C-band | Sine Saloum and Casamance Deltas, Senegal | Support vector regression (SVR) | R2 = 0.90 AGB = 2.51–37.4 Mg ha−1 |
| Year | Research Study | Multisensor | Study Site | Model | Performance /Range of Value |
|---|---|---|---|---|---|
| 2016 | [80] | Landsat 8 OLI and ALOS PALSAR | Papua, Indonesia | Regression models | R2 = 0.46 AGB = 237.52–353.52 Mg ha−1 |
| 2017 | [79] | LiDAR and TanDEM-X | South Florida peninsula, USA | Regression models | R2 = 0.82 AGB ~ 250 Mg ha−1 |
| 2018 | [6] | ALOS-2 PALSAR-2 and Sentinel-2 MSI | Mangrove plantation, North Vietnam | Support vector regression (SVR) | R2 = 0.60 AGB = 36.2–230.1 Mg ha−1 |
| 2018 | [65] | Sentinel-1 C-band SAR and Sentinel-2 MSI | Honda Bay, Philippines | Support vector regression (SVR) | R2 = 0.69 AGB ~ 346 Mg ha−1 |
| 2018 | [99] | Landsat 8 OLI and LiDAR | Northwest Australia | Regression models | R2= 0.78 AGB ~ 70 Mg ha−1 |
| 2019 | [83] | Shuttle Radar Topography Mission (SRTM) and ICESat/GLAS LiDAR | Global scale | Regression models | R2= 0.73 RMSE = 84.2 Mg ha−1 |
| 2019 | [139] | Sentinel-1 C-band and Sentinel-2 MSI | Sine Saloum and Casamance Deltas, Senegal | Support vector regression (SVR) | R2 = 0.89RMSE = 2.35 Mg ha−1 |
| Task | Remote Sensing Data | Method | Recommendation |
|---|---|---|---|
| LAI estimation | Sentinel-2, WorldView-2, Pléiades-1 | Machine learning techniques | Optical high spectral and spatial resolutions |
| Canopy height estimation | WorldView-2, Pléiades-1 | Stereophotogrammetric techniques | Optical high spatial resolutions |
| Tree height, canopy height estimation | COSMO-SkyMed, TerraSAR, TanDEM, LiDAR | InSAR and Pol-InSAR techniques Machine learning techniques | SAR data, data fusion, and integration |
| Leaf pigments | Sentinel-2, WorldView-2, Pléiades-1 | Machine learning techniques | Optical high spectral and spatial resolutions |
| Tree species classification | WorldView-2, RapidEye -1,Pléiades-1 | Deep learning techniques | Very high spatial resolution |
| Sentinel-2, ALOS-2 PALSAR-2 | Machine learning techniques | Data fusion and integration | |
| Biomass and carbon stocks | Sentine-2, ALOS-2 PALSAR-2 LiDAR | Machine learning techniques | Data fusion: optical and SAR fusion |
© 2019 by the authors. Licensee MDPI, Basel, Switzerland. This article is an open access article distributed under the terms and conditions of the Creative Commons Attribution (CC BY) license (http://creativecommons.org/licenses/by/4.0/).
Share and Cite
Pham, T.D.; Yokoya, N.; Bui, D.T.; Yoshino, K.; Friess, D.A. Remote Sensing Approaches for Monitoring Mangrove Species, Structure, and Biomass: Opportunities and Challenges. Remote Sens. 2019, 11, 230. https://0-doi-org.brum.beds.ac.uk/10.3390/rs11030230
Pham TD, Yokoya N, Bui DT, Yoshino K, Friess DA. Remote Sensing Approaches for Monitoring Mangrove Species, Structure, and Biomass: Opportunities and Challenges. Remote Sensing. 2019; 11(3):230. https://0-doi-org.brum.beds.ac.uk/10.3390/rs11030230
Chicago/Turabian StylePham, Tien Dat, Naoto Yokoya, Dieu Tien Bui, Kunihiko Yoshino, and Daniel A. Friess. 2019. "Remote Sensing Approaches for Monitoring Mangrove Species, Structure, and Biomass: Opportunities and Challenges" Remote Sensing 11, no. 3: 230. https://0-doi-org.brum.beds.ac.uk/10.3390/rs11030230