1. Introduction
Today, greenhouses are to a large extent automated [
1]. There is climate control, stepwise movement of the plants from sowing area to the harvesting area, and automated irrigation and fertilisation. Traditionally though, high pressure sodium (HPS) lamps that are only controlled by switching them on or off are used. However, an increasing amount of growers are interested in using light emitting diodes (LEDs) for greenhouse illumination instead. One benefit with such a transition is the enabling of tuning both the light quality (spectrum) and quantity (intensity). The quality and quantity of light affect plant growth in many ways; it affects growth, such as biomass, leaf elongation and chlorophyll concentration, as well as metabolic effects, such as antioxidant potential or vitamin and nitrate concentrations. In general, UV-light (280–400 nm) inhibits cell elongation and can cause sunburn, blue light (400–520 nm) enhances the photosynthesis, green light (520–610 nm) enhances photosynthesis but is to a larger extent (relative to blue and red) transmitted through, and reflected by, the leaves, red light (610–750 nm) enhances the photosynthesis and impacts the photoperiodism while far-red (750–1000 nm) stimulates cell elongation and influences flowering and germination (Table 8.1 in [
2]). For a review of studies on light quality effects on plant growth we refer to Olle and Viršile [
3] and Ouzounis et al. [
4]. However, the question, “what specific spectrum and photon flux density is optimal for maximal productivity?”, is still not easy to answer, since it depends on plant species, the ontogenesis stage, surrounding environment and how “maximal productivity” is defined. As an example, Snowden et al. [
5] measured the sensitivity to blue light for a number of species including cucumber and lettuce. Increasing the amount of blue light did not significantly affect plant growth for lettuce. For cucumber on the other hand, the increased amount of blue light reduced growth (by 22%), but only if the total light intensity was high (500
) and not if it was low (200
).
One possible way of defining optimal light spectrum is the spectrum that increase photosynthesis the most. Already in 1937, Hoover [
6] determined the rate of photosynthesis as a function of wavelength of the light (measured on a wheat plant), called the action spectrum, and concluded that there is a peak in red light wavelengths and a secondary one in blue. In the 1970s two large studies were conducted on leaves from 22 and 33 plant species, respectively, with the conclusion that the action spectra were similar (but not identical) for all species tested [
7,
8]. However, the early action spectra were conducted on cut leaves illuminated with light with a wavelength span of 25 nm at a time. We propose firstly, that it cannot be ruled out that the results would differ if the measurements are made remotely on a canopy level. Secondly, it cannot be taken for granted that the results are identical in presence of background light. One example of the opposite is the “Emerson effect” [
9]. He showed that the photosynthetic rate was higher when illuminating with red and far-red light (wavelengths lower and higher than 680 nm, respectively) in combination, compared to the sum of the photosynthetic rate when illuminate with either red or far-red light. This is due to the two photosystems in plants, which are activated by light of different wavelength.
If the plants have different spectral preferences depending on the current growth environment, one could in theory build a self-optimising controller, to find the optimal light spectrum for the current state, by using feedback control [
10]. For such a scenario one needs a non-destructive biological growth signal that can be measured fast, remotely, and preferably without interacting with the plants. We suggest chlorophyll fluorescence to be such a candidate. The main tools used for measuring and analyzing chlorophyll fluorescence are the pulse amplitude modulation fluorometer (PAM) developed by Schreiber [
11] and the photosynthetic efficiency plant analyzer (PEA) developed by Strasser et al. [
12]. The PAM measures the fluorescence response to short duration (micro second) light pulses and discriminates chlorophyll fluorescence induced by the excitation pulse from chlorophyll fluorescence induced by ambient light through synchronous detection. The actual yields of photochemistry and heat dissipation, respectively, are sorted out from the fluorescence signal by the so-called fluorescence quenching analysis [
11]. The PEA measures the fluorescence rise during the first second of saturating illumination, and analyzes photosynthesis through inflection points on the resulting fluorescence curve [
12]. Both these methods require a precise measurement of the fluorescence from fully dark adapted plants, to compare with the fluorescence at fully saturating light. These requirements limit the use of the methods for remote sensing during day time and imply a restriction of their use to mainly on-leaf measurements.
There are methods developed for remote sensing applications. The best example is the passive solar-induced fluorescence (SIF) methodology, facilitating satellite measurements, based on fluorescence detection within the Fraunhofer lines, the dark lines in the solar spectrum caused by absorption by chemical elements in the Earth’s atmosphere [
13,
14]. There are ongoing efforts in remote sensing research to quantify relationships between steady-state chlorophyll fluorescence (e.g., using SIF) and photosynthesis [
15]. Although promising, the new SIF methodology, as well as other remote sensing methodologies, introduces many scientific questions that remain to be answered. The main questions are related to temporal, spatial and mechanistic up-scaling when going from traditional leaf-level measurements using the PAM-technique [
15] to SIF. For example, how do we handle differences in canopy structure and geometry, and what type of information can be derived from the signal when the quantum yield of photochemistry cannot be directly resolved? We are trying to expand that knowledge base, by employing an active proximal remote sensing system, measuring chlorophyll fluorescence on canopy level. The measure we propose, is a relative quantity of how much the fluorescence (in a wavelength span around 740 nm) increases for a certain intensity change. We define the steady-state chlorophyll a fluorescence gain (dF740/dq) as the difference in fluorescence at 740 nm divided by the difference in incident light quanta caused by (a small) excitation of one LED colour. This work is an expansion of earlier research [
16,
17], where we proposed the use of the fluorescence gain as an measure of the photosynthetic efficiency increase, to be used as a feedback signal in a (future) self-optimising controller to find the optimal light spectrum.
The relations between the amount of absorbed light, the amount of fluorescent light and the photosynthetic rate have been studied on both leaf level [
18] and canopy level [
19], and are dependent on plant health. For example, the fraction of fluorescence and photosynthesis is negatively correlated at low light intensity while it is positively correlated at high light intensity and stress [
20,
21,
22]. However, the absolute quantities of both fluorescence and photosynthesis are expected to increase with an increased incident light intensity, and the absolute values (not to be confused with the fraction) will hence be positively correlated. We have seen that there is indeed a strong correlation between steady-state chlorophyll a fluorescence at 740 nm (F740) and photosynthetic rate (measurements on basil, in absence of background light, [
16]), which indicates that the F740 could be a useful remotely measured signal to estimate the photosynthetic efficiency. The maximum photosynthetic rate for a predefined total power corresponds to the spectrum that maximies F740 [
10]. It also means that the LED colour that has the highest fluorescence gain, is the one that increases photosynthesis the most (per incident quanta) at the current settings.
In previous experiments we compared the fluorescence gains caused by an excitation of six different LED colours (in the absence of background light), for six different plant species [
17], including basil, cucumber, and lettuce. Differences in the mutual relation of the fluorescence gains (caused by the different LED colours) were noticed between different plant species. However, red LEDs caused the highest fluorescence gains per incident quanta for all species tested. Experiments on basil have also been conducted under various background light [
16]. In contrast to the working hypothesis, that the mutual relations of the fluorescence gains would vary with various background light, the variation of individual fluorescence gains were minor for the background lights studied. Red LEDs remained the most efficient per quanta for all investigated background light. In this article we present experiments on cucumber and lettuce, conducted in order to answer the following research questions:
Is there a strong correlation between photosynthetic rate (PN) and steady-state fluorescence (F740) also in the presence of background light?
Do the mutual fluorescence gains, caused by excitation of different LED colours, change as the background light spectrum approaches only red light at different intensity levels?
2. Materials and Methods
Experiments were conducted on cucumber (
Cucumis sativus F1 ‘Max’) and lettuce (
Lactuva sativa ‘Black seeded Simpson’), with all settings summarized in
Table 1. Two experimental sets are presented, set A and set B, as we wanted to repeat the experiments, initially only performed at background light intensity 160
(set A), also for higher background light intensity levels (200, 350, 500 and 1000
, set B). The slightly different settings in the two setups were a consequence of the available resources at the time.
2.1. Conditions during Plant Growth
Five days after seeding, the plants were placed under LED lamps (LX60, Heliospectra, Sweden) in a plant lab with a photoperiod of 16 h and 23/17 C day/night temperatures. The photosynthetic photon flux at plant level was approximately 160/195 (set A/set B), with a spectral distribution of 20% blue, 10% green and 70% red light. Due to the different growth light intensities (which were a result of the available resources at the time), the experiments were conducted seven and five weeks after seeding for sets A and B, respectively, to have plants at approximately the same size.
2.2. Experimental Setup
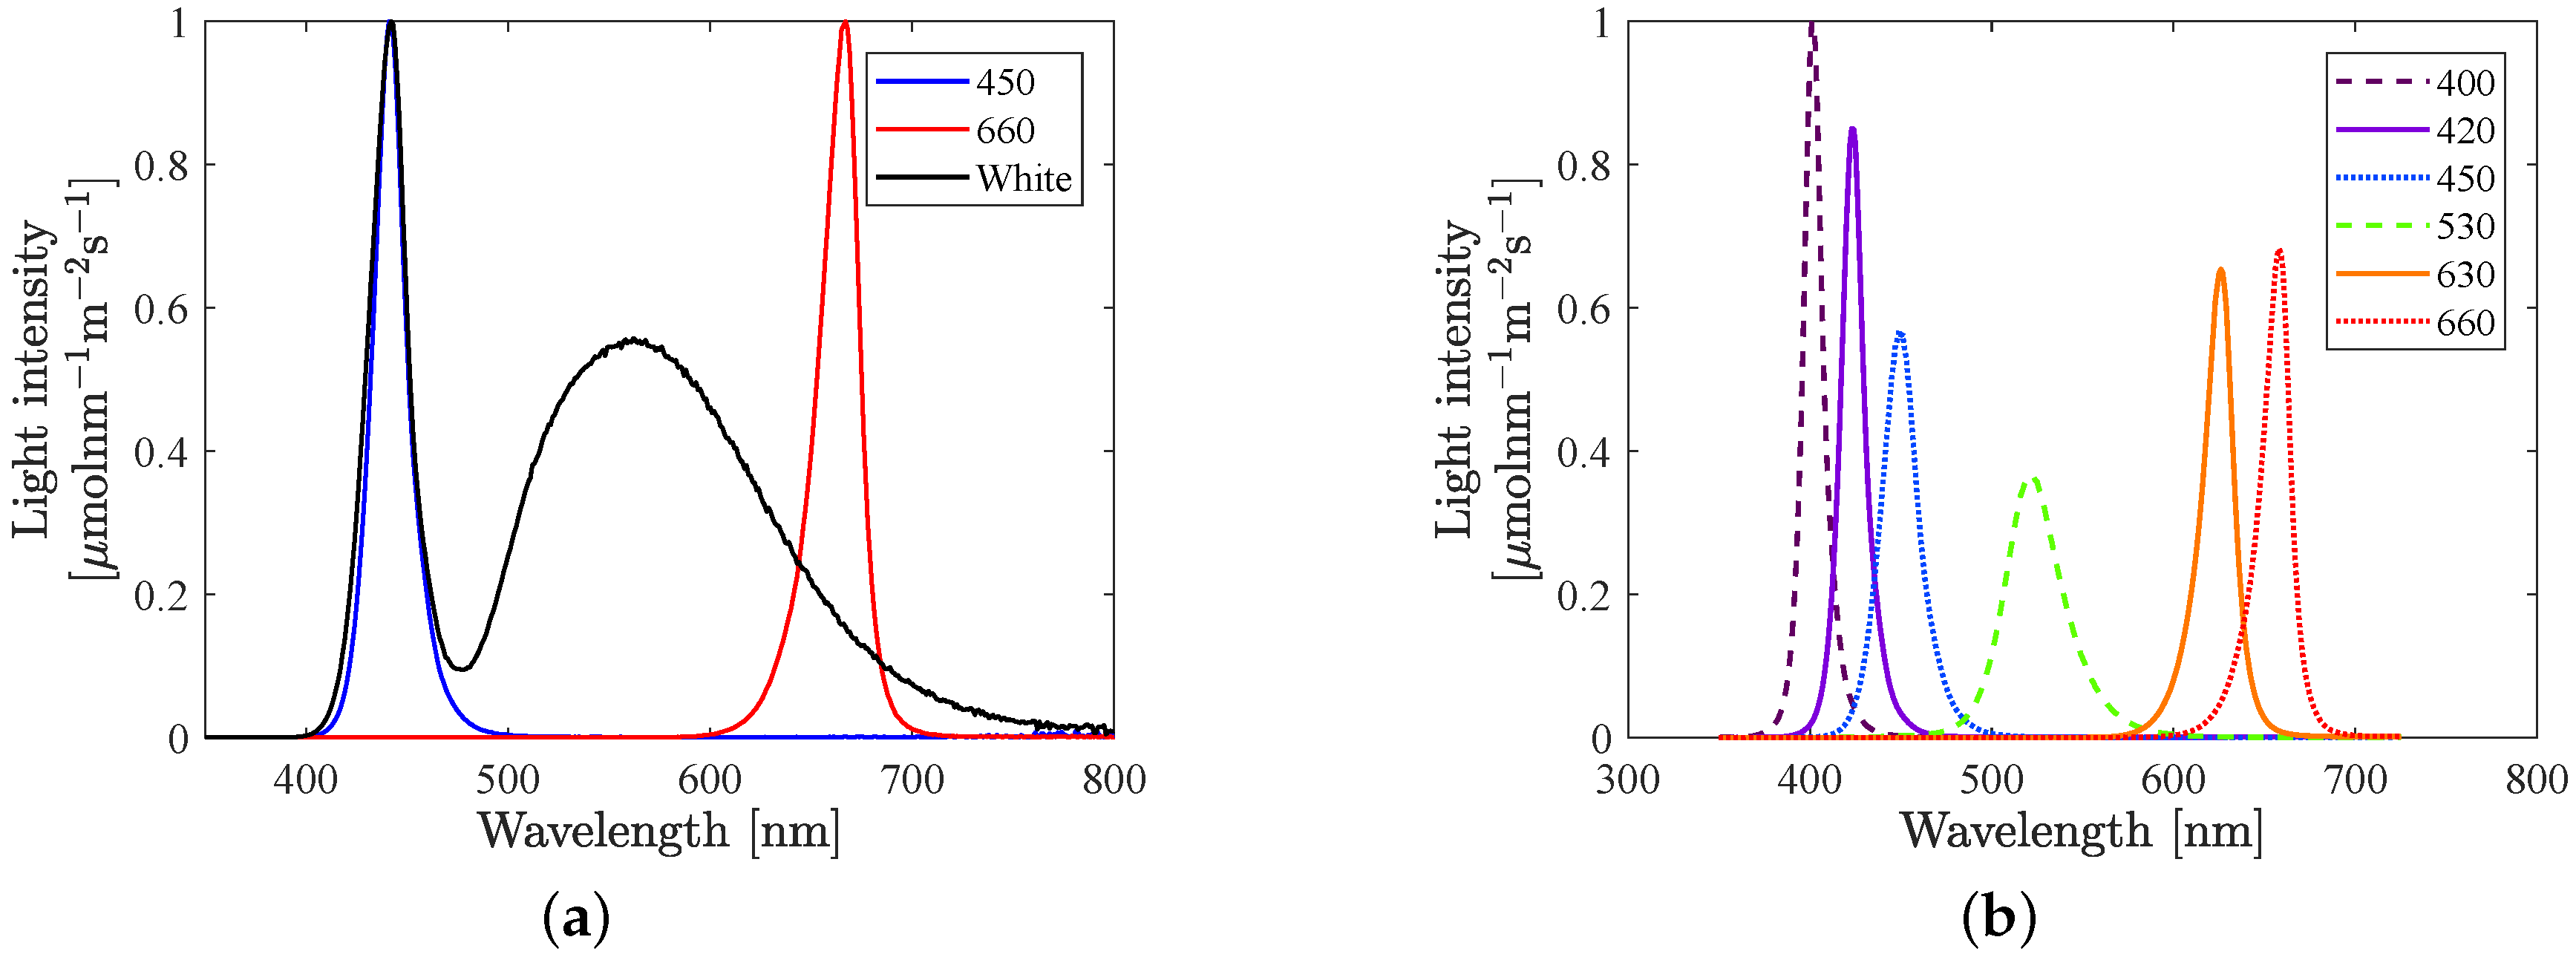
The experiments were performed in a plant lab, in an experimental unit, delimited with reflective curtains (silver/white Diamond Diffusion Foil, Easy Grow, UK) giving a closed, controlled environment. In set A, two RX30 lamps (Heliospectra, Sweden) generated both background light and excitation light. Six different LED colours with peak wavelengths at 400, 420, 450, 530, 630 and 660 nm were used. These were all the available LEDs in the lamp that where assumed not to have any significant overlap with the spectrum of the fluorescence signal in the span 735–745 nm. In set B, the same type of lamp was used for the excitation light, but the background light was generated by two LX (Heliospectra, Sweden) lamps. Three LED groups in the LX60 lamps were used; blue, white, and red. The white LED produce light also in the fluorescence region. However, as the intensity of the white LED remained constant at each background light level and the experiments study variations in fluorescence, this overlap should have no effect.
Figure 1 shows the spectrum for each LED colour in the LX lamp and RX lamp, respectively.
2.3. Spectrometer Measurements
To detect the incident light and the reflected/fluorescent light two spectrometers were used, one facing the plants and one facing the lamps. In set A we used two Maya2000 Pro spectrometers (Ocean Optics, USA), each equipped with a 600 optical fibre, and in set B one Maya2000 Pro (equipped with a 600 optical fibre) and one STS-VIS (Ocean Optics, USA; no fiber needed). The incident light detector (Maya/STS, in set A/B) was placed at the canopy level with a cosine diffuser providing a field of view of 180. The distance from the canopy level to the lamp was 40–50 cm (depending on plant height). The spectrometer detecting the reflected/fluorescent light (Maya in both sets) was placed on the side of the lamps with a field of view limited to 20 to only measure green area.
The input signal in this system is the light intensity reaching the canopy level. The wavelength span for photons that is normally considered important for photosynthesis is 400–700 nm, which is commonly referred to as photosynthetically active radiation (PAR). However, the cutoff wavelength is slightly different for different species [
7]. Throughout this article, the photon flux in the range 350–700 nm has been included in the input light intensity, in order to capture all light, including the light from the LEDs having peak wavelength at 400 nm. Furthermore, blue light is defined as photons in the range 350–500 nm, green light in the range 500–600 nm and red light in the range 600–700 nm.
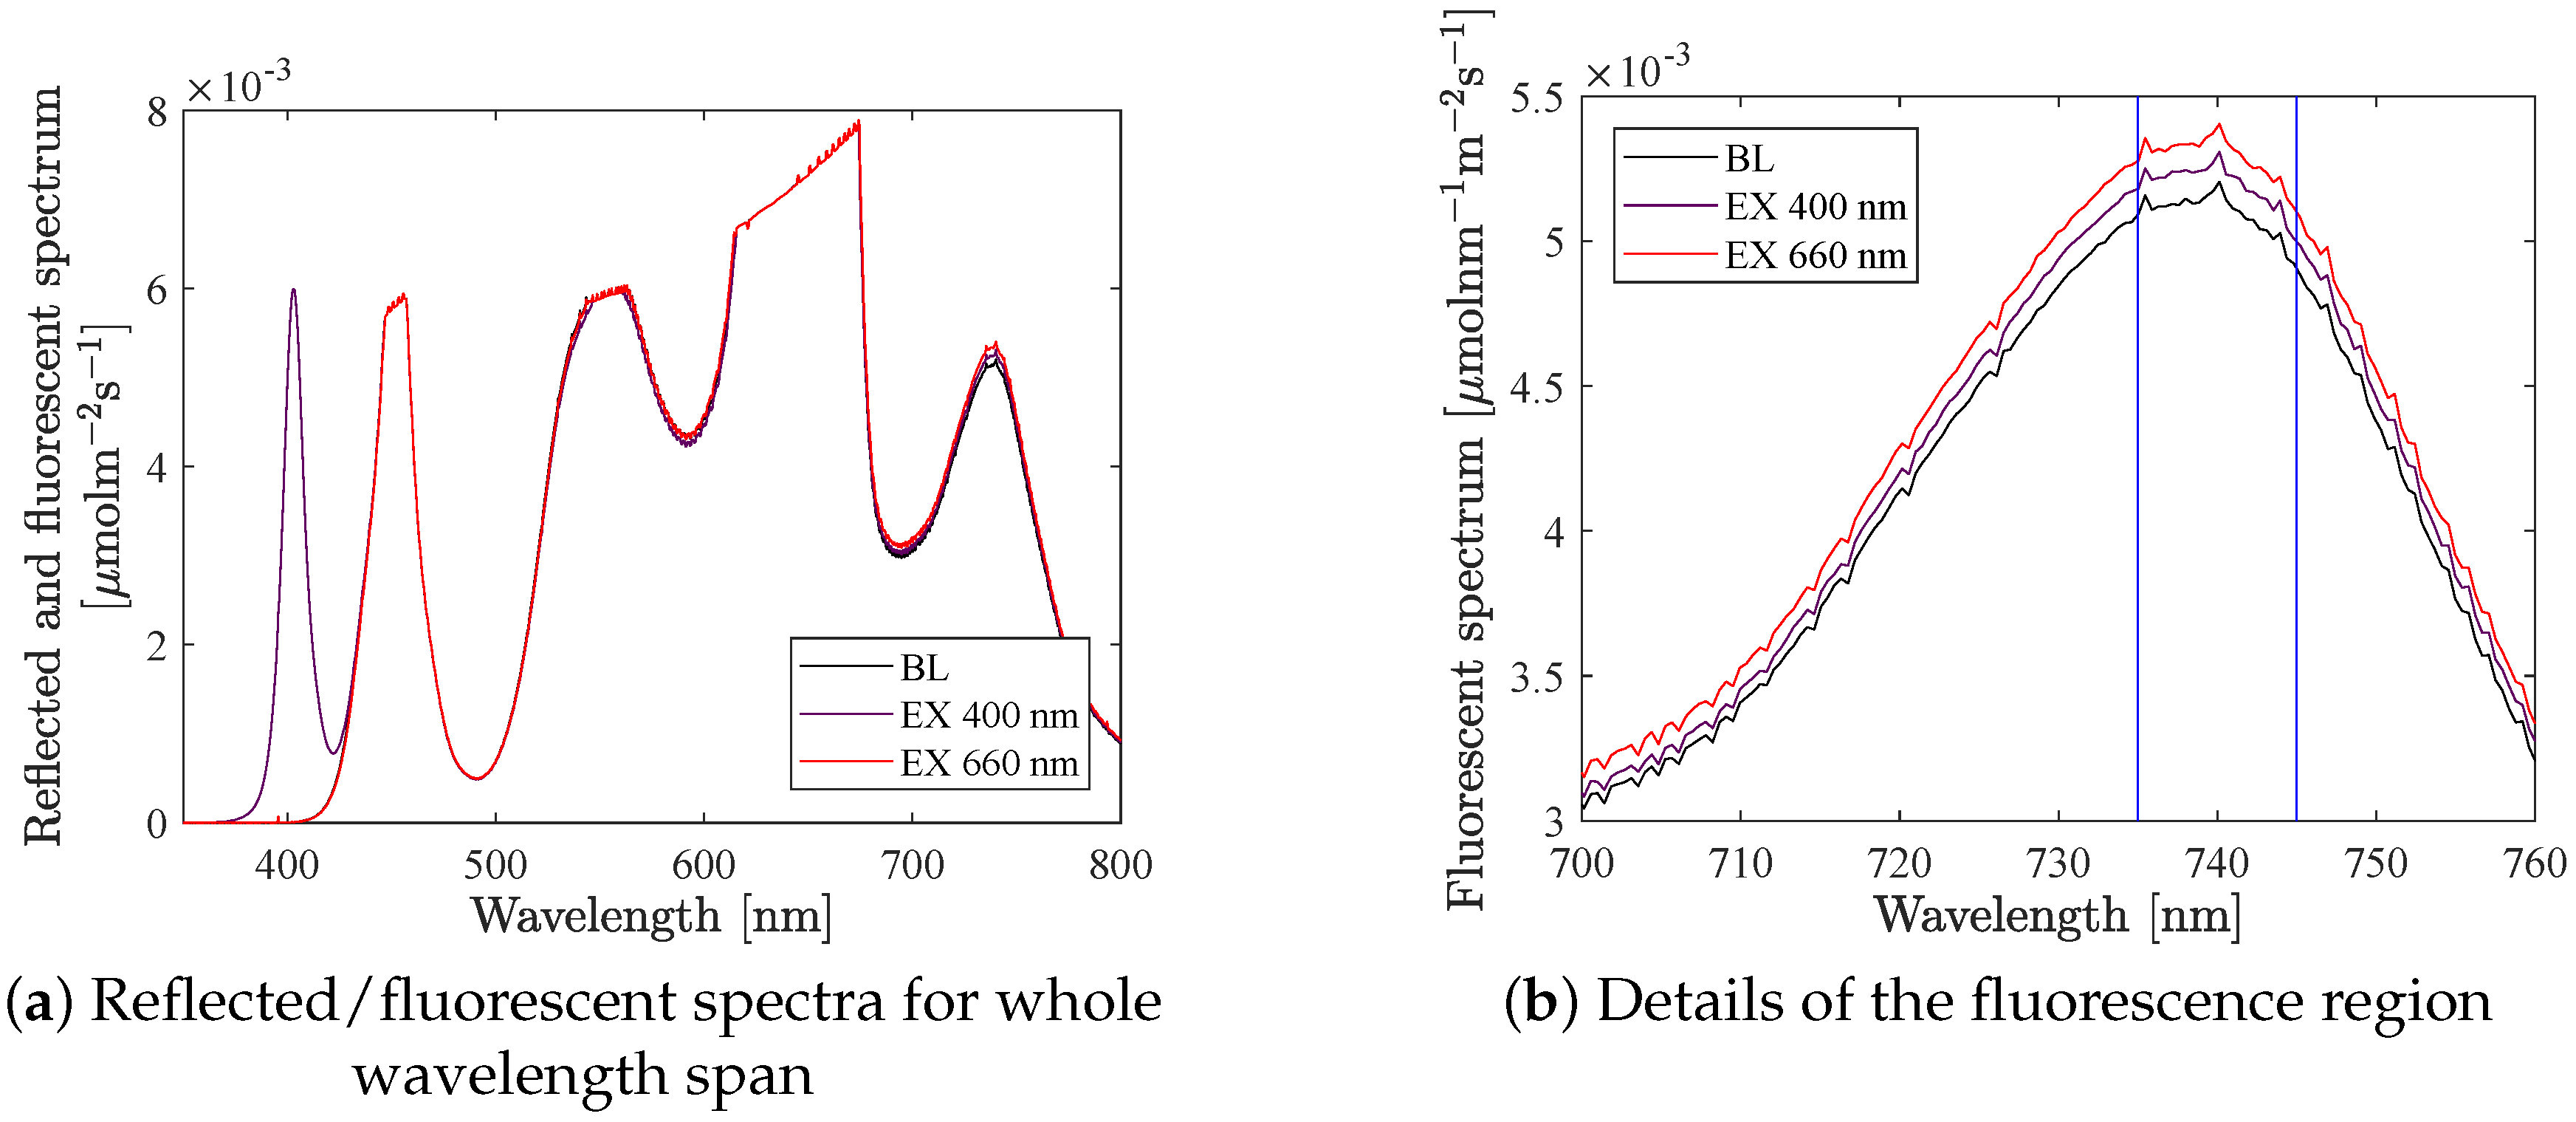
The primary output signal of the system is the fluorescence. The reflected and fluorescent light were measured with a spectrometer covering the whole wavelength span (see
Figure 2a). Earlier work did not show satisfactory results when analysing reflected light, and therefore we have focused on analysing the data in the fluorescence band (having a first peak at 685 nm and a second at 740 nm). Furthermore, previous research [
16] found a better correlation between photosynthetic rate and the fluorescence at 740 nm, compared to the peak at 685 nm. In addition, LED 660 significantly overlaps with the fluorescence spectrum at 685 nm though it was assumed not to overlap at 740 nm at the time of the experiments (later it was, however, found to have a small overlap affecting the results to some extent, see
Section 3.2.3). However, this motivates our choice of only presenting the fluorescence at 740 nm.
Figure 2b shows the fluorescence spectra for lettuce at background light 500
, and when an excitation step is added with LED 400 and with LED 660. The vertical lines points out the wavelength span 735–745 nm, which is were we have integrated the intensity to get the fluorescence signal, i.e.,
The absolute value of the fluorescence was affected by the chlorophyll content in the canopy but also by the background light level (intensity and spectrum) and the distance between the spectrometer and the plants. Notice that in
Figure 2a, the white LED (having one peak at 450 nm and a second one at 560 nm) have a tail in the red and far-red region and hence overlaps with the fluorescence signal. To cope with this, we studied the relative increase in fluorescence, more precisely the increase in fluorescence, caused by one specific LED colour at a time, divided by the increase in incident light caused by that LED. This is referred to as the fluorescence gain, i.e.,
where F740 is the fluorescence signal according to Equation (
1) at background light (BL) and when additional excitation light (EX) is added, and
q is the quantum flux (
) of the incident light in the wavelength span 350–700 nm.
2.4. Reference Measurements
As a reference measurement an infrared gas analyzer (IRGA, Li-Cor 6400XT, USA) was used (in set A, two IRGA systems were used in parallel) to determine the photosynthetic rate as
uptake per leaf area and time. The calculations were based on measurements of the carbon dioxide and water content of a controlled air flow over a leaf sealed in a chamber, called the leaf cuvette. The cuvette had a transparent window, allowing measurements to be made under the desired light quality and quantity. The air flow, carbon dioxide content and the leaf temperature were automatically controlled, details are found in
Table 1. The plants have been illuminated with the light settings similar to the first light level prior to the experiment in order for the photosynthesis to reach a steady value. However, no dark adaption was done, since we were primarily interested in changes and not absolute values. Four light curves were also performed, one with the same settings as in set A, and three with the same settings as in set B.
Differences in photosynthetic rate between species may be partly attributed to foliar pigment content and composition. Relative chlorophyll and flavonoid content were therefore estimated using Dualex Scientific
® (Force-A, France), a leaf-clip optical sensor designed to non-destructively evaluate the content of chlorophyll and epidermal flavonoids [
23,
24]. We collected 32 point measurements for the analysis (four measurements on each of four leaves from two plants).
2.5. Data Processing
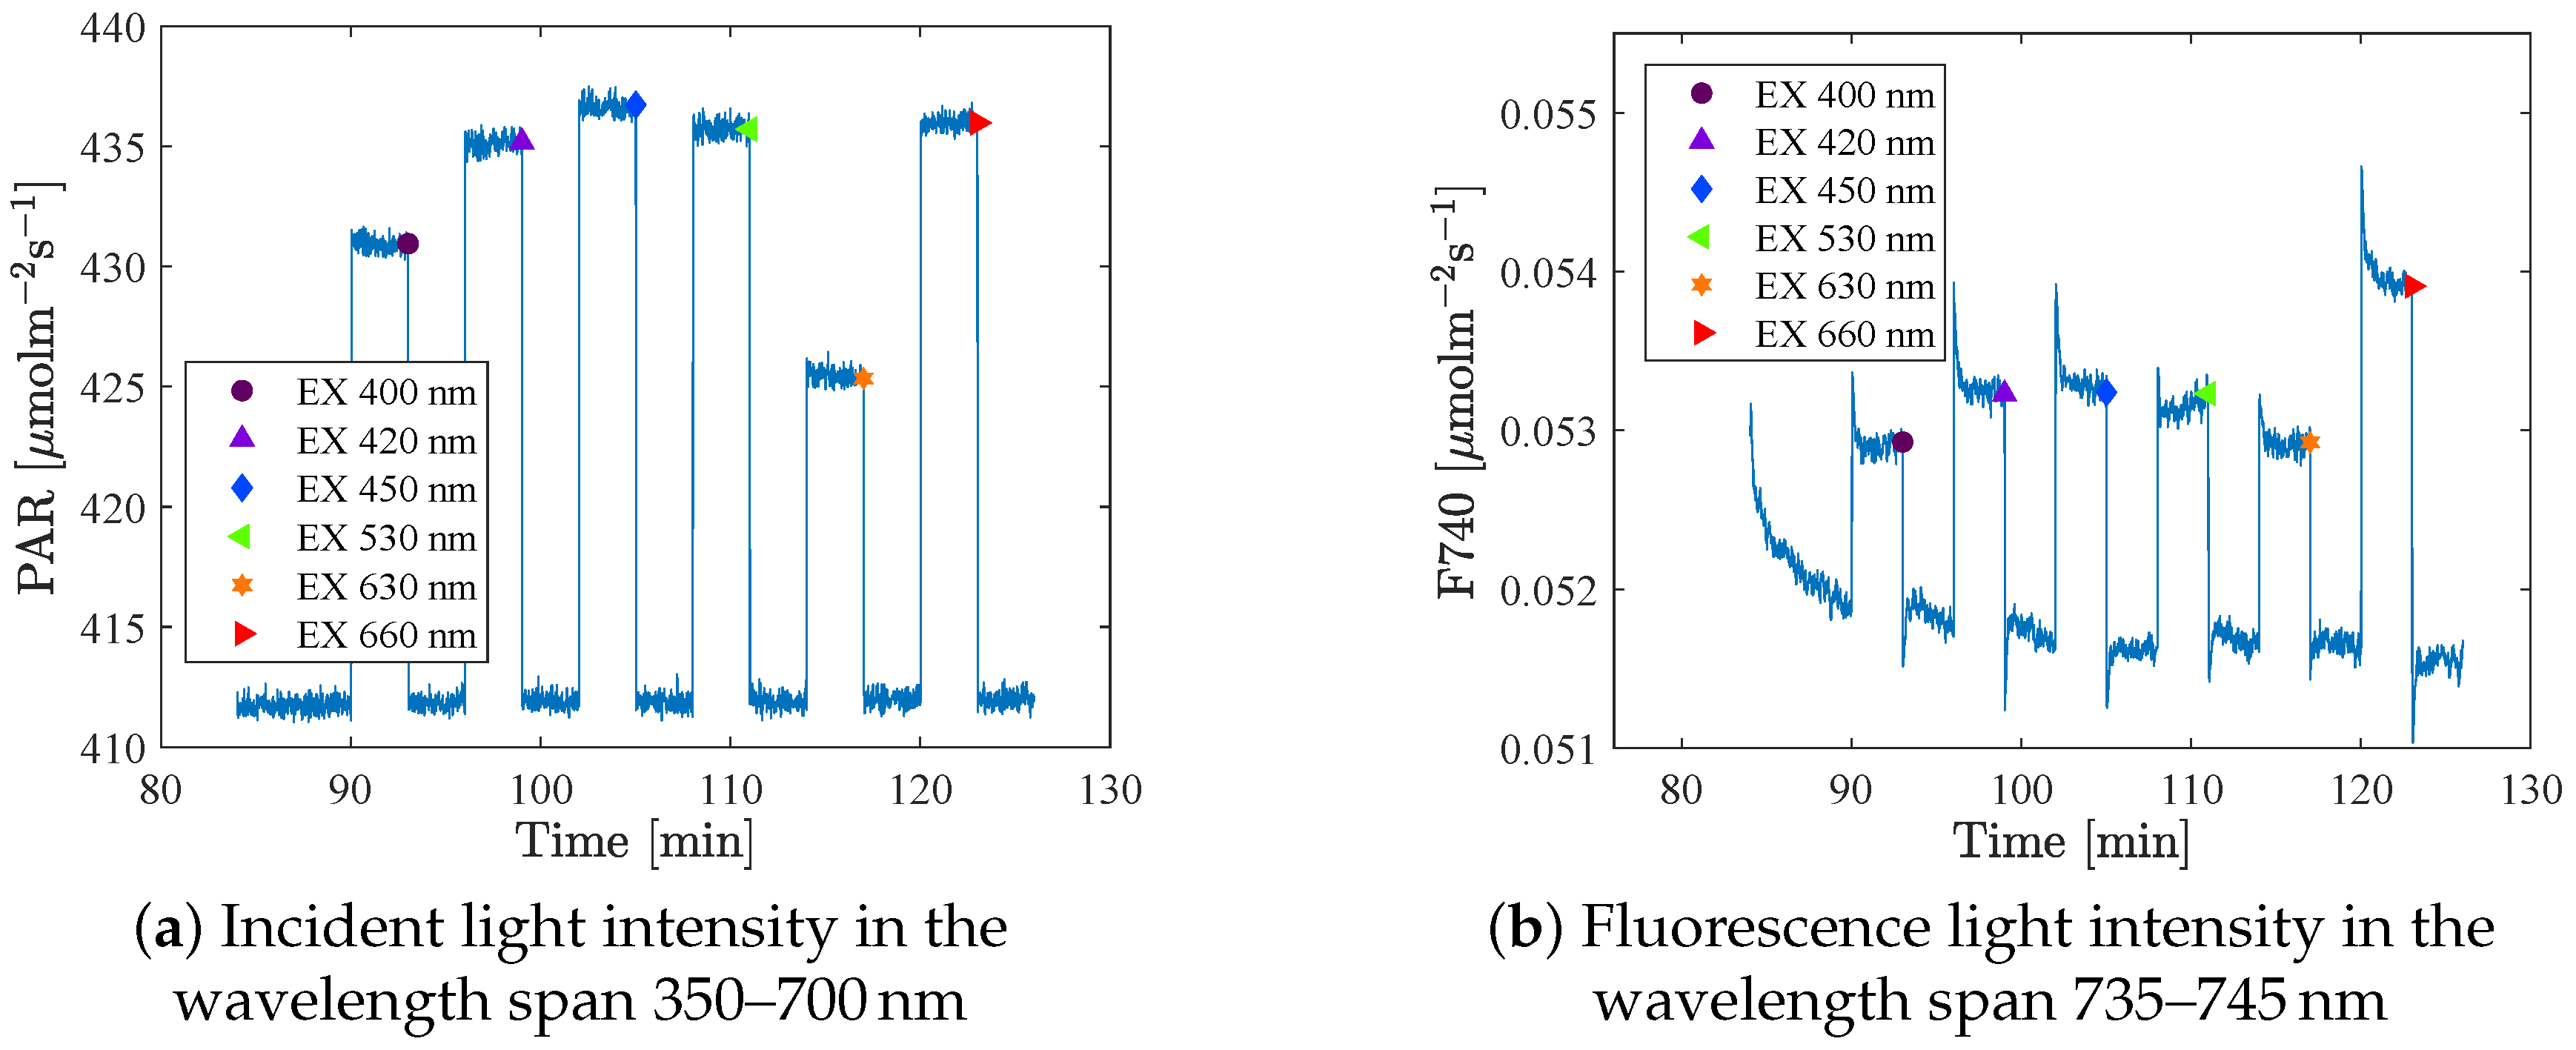
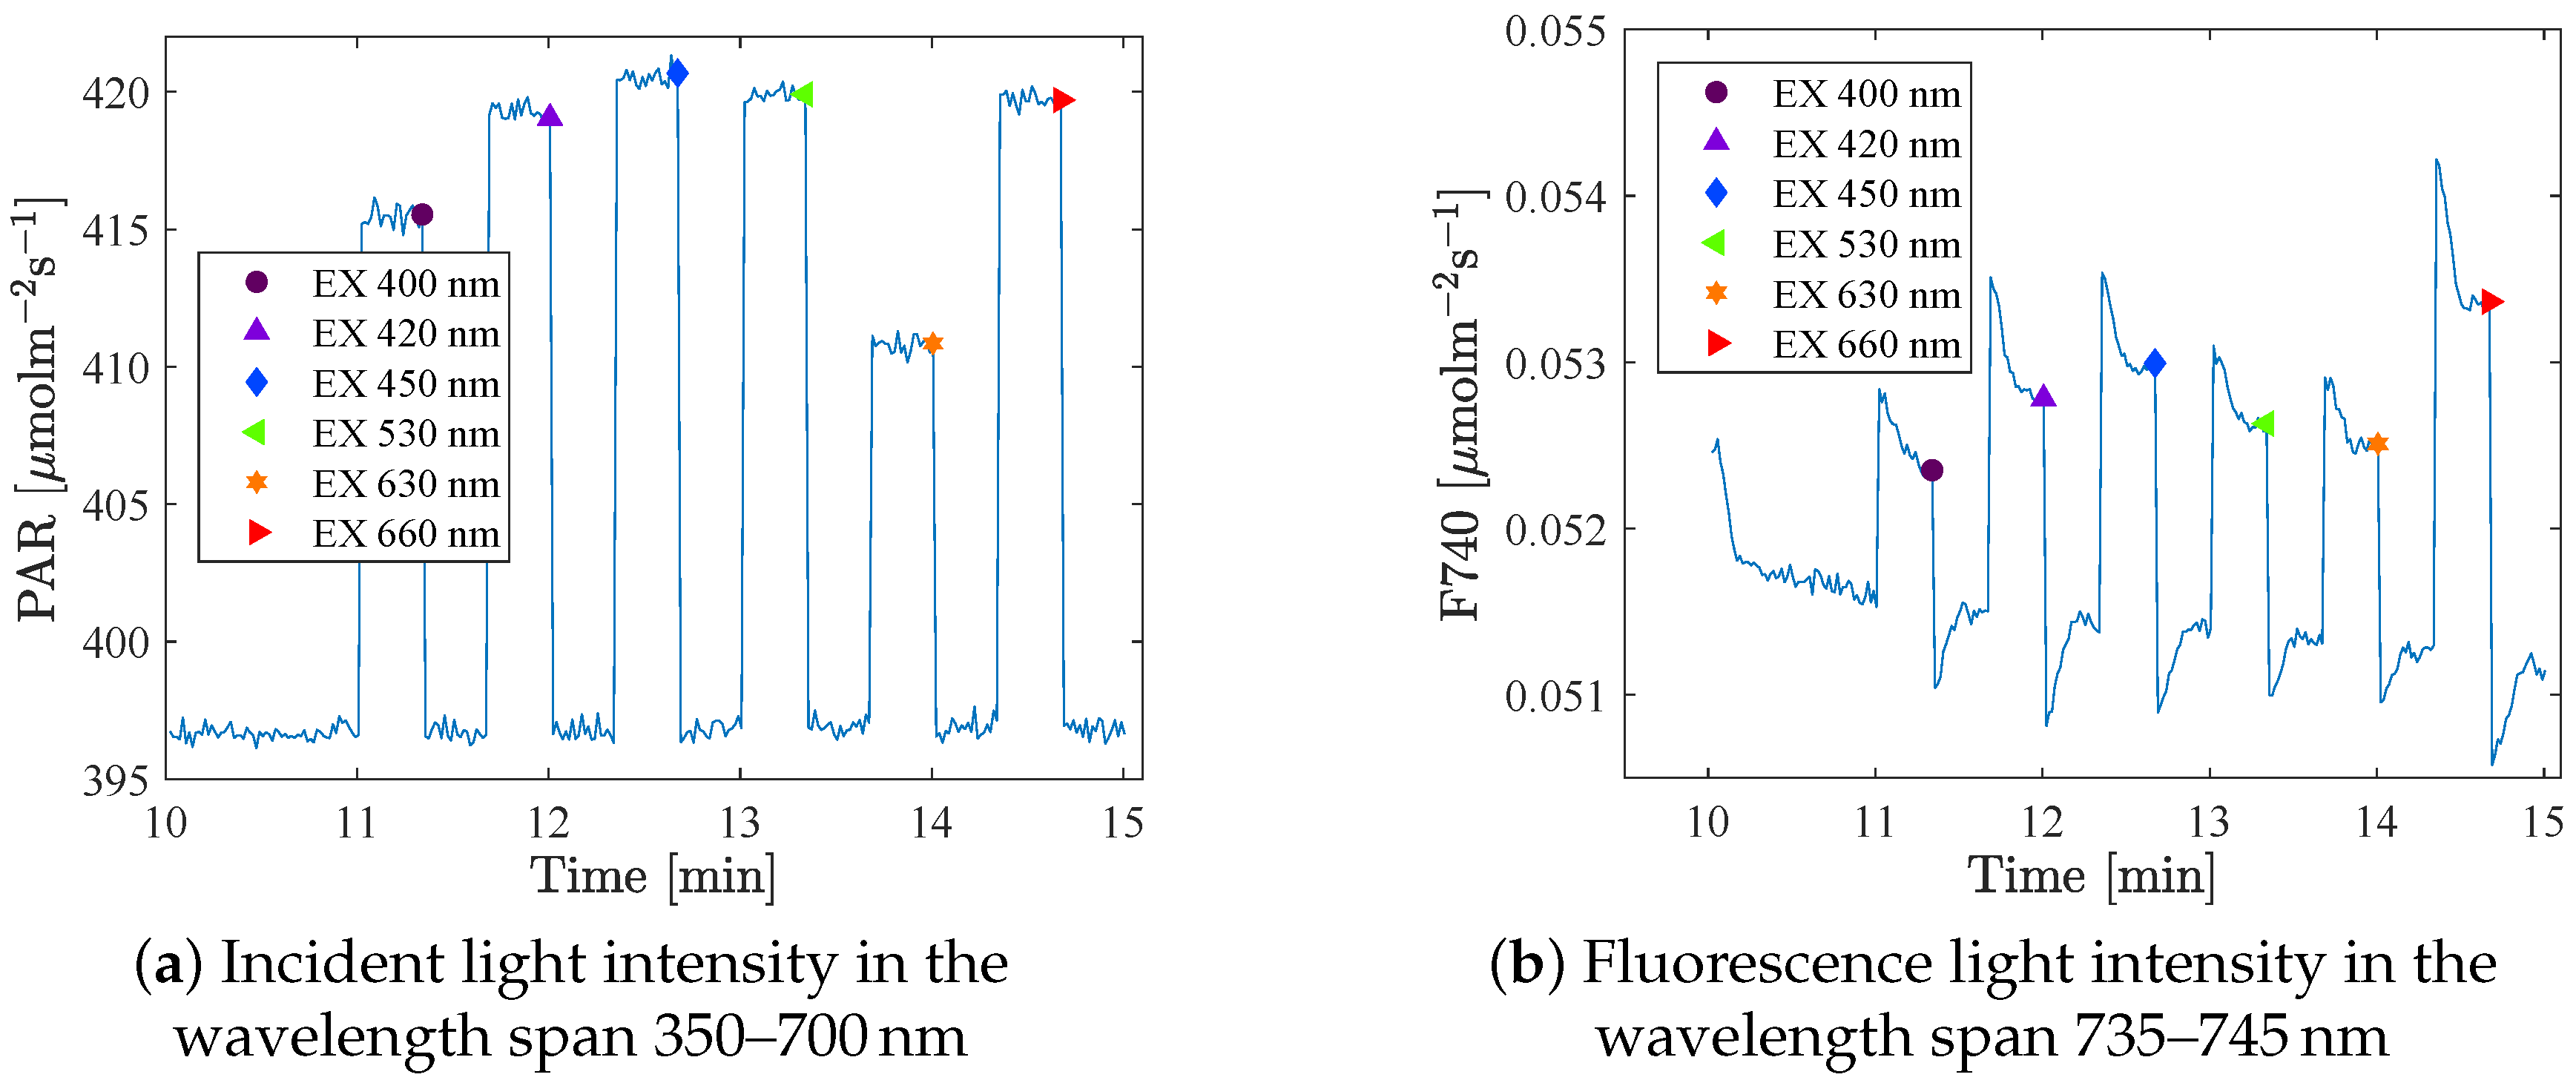
The spectrometers took a sample every second. A mean value of the 4 or 10 last measurements at each intensity step (that was held for 20 s or 3 min respectively) was used as the measure for that setting.
Figure 3 shows the raw data of the incident light and the fluorescence signal as a function of time, and the large dots indicates the mean value of the last points at each step. The fluorescence at background light (BL) level was measured between each excitation (in total 6 or 7 times/BL), and these data were used to identify possible trends in the fluorescence that were not an effect of the excitation light. The integration times (IT) were set in advance. The same IT was used for all excitations at one specific BL level, but were adjusted when changing BL, to get as strong a signal as possible of the relatively weak fluorescence. As a consequence, a large part of the reflection spectrum became saturated, which can be seen in
Figure 2a (in the range 630–670 nm). However, these wavelengths are not included in this analysis.
Under the assumption that the variance is the same for all LEDs used, even though they have different means, the pooled (or combined) variance can be estimated by [
25]
where
is the mean value of the fluorescence gain for each LED colour at each intensity level, and
is the total number of measurements of that state
i (
5 different background spectra times 2–5 repetitions). Further, the standard error of the mean (
), can be estimated by
The IRGA measurements (on leaf level) had a much higher noise to signal ratio, compared to the fluorescence (canopy level) measurements. The measurement frequency is approximately 3 measures/min, and the mean value of the five last measurements at each light level were used to get an estimate of the photosynthetic rate (PN) at the current light level. The mean value of the photosynthetic rate at the BL level before and after an excitation step was used to determine the PN for the background light level. This was a way of compensating for trends in the data (i.e., for not being at a true steady-state). There has been no dark adaption, since only relative values, i.e., increase in PN due to excitation, were of interest.
2.6. Experimental Light Scheme
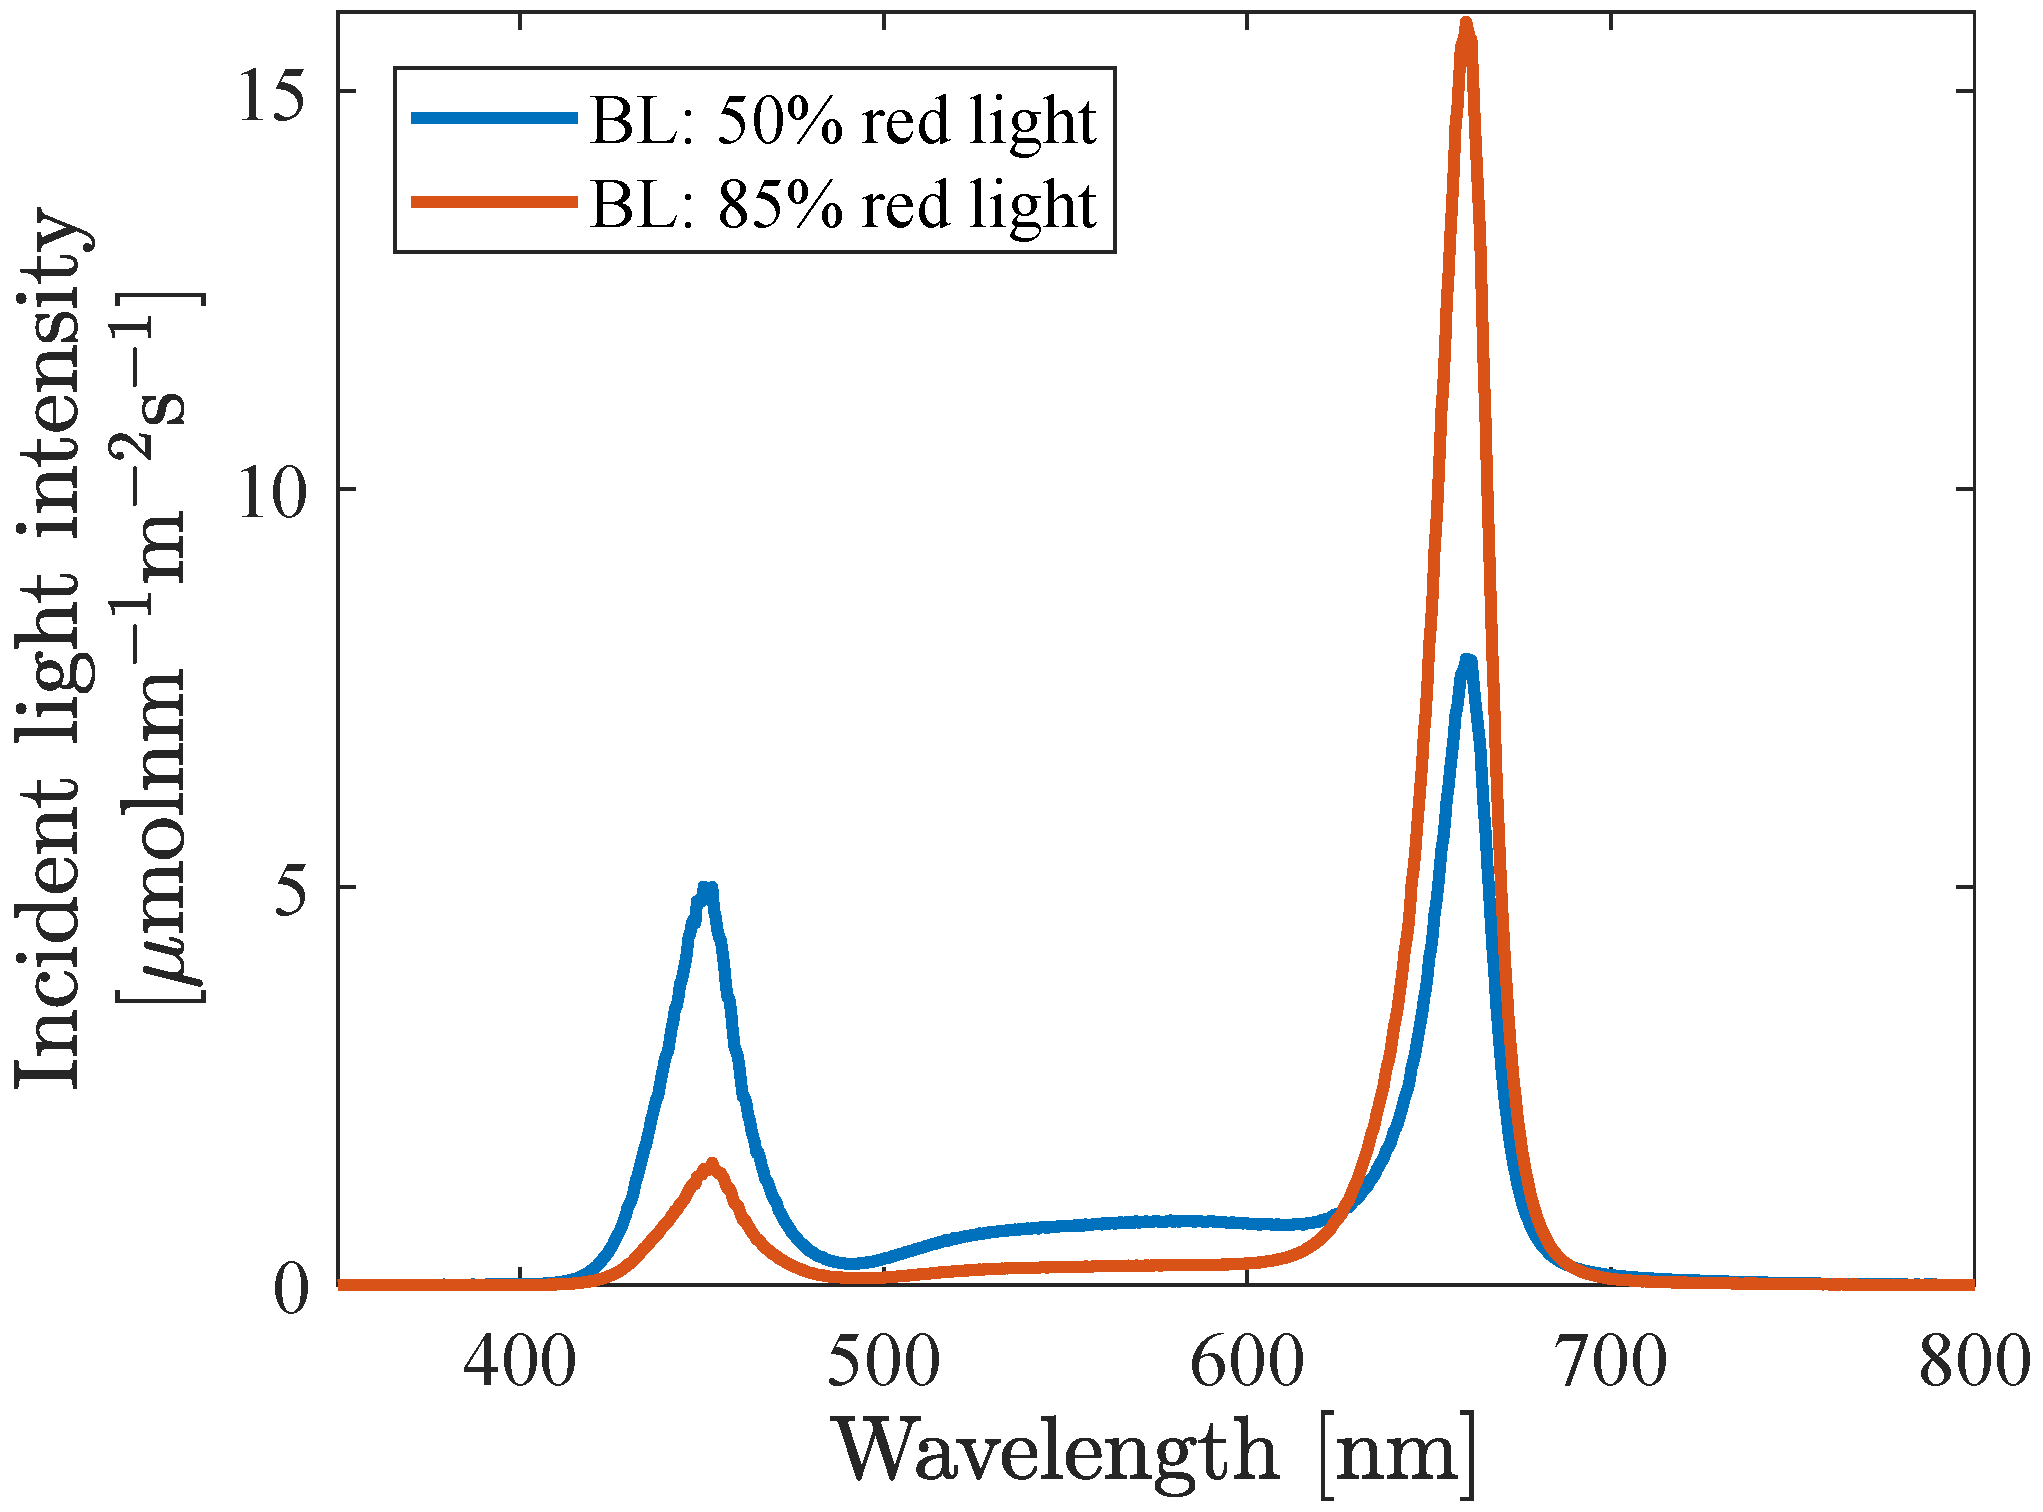
The background light intensities (within the PAR region) that were investigated were 160, 200, 350, 500 and 1000
and for each intensity level five different spectra were investigated, having 50, 70, 85, 95 and 100% red light and a constant blue to green ratio, B:G, of 2:1.
Figure 4 shows the spectral distribution for spectra having 50% and 85% red light respectively.
At each background light (for all combinations of intensity and spectra) an excitation signal (a step of about 20
) was added. This was sequentially done with all six different LEDs that were included in the investigation, i.e., LEDs having peak wavelength at 400, 420, 450, 530, 630 and 660 nm.
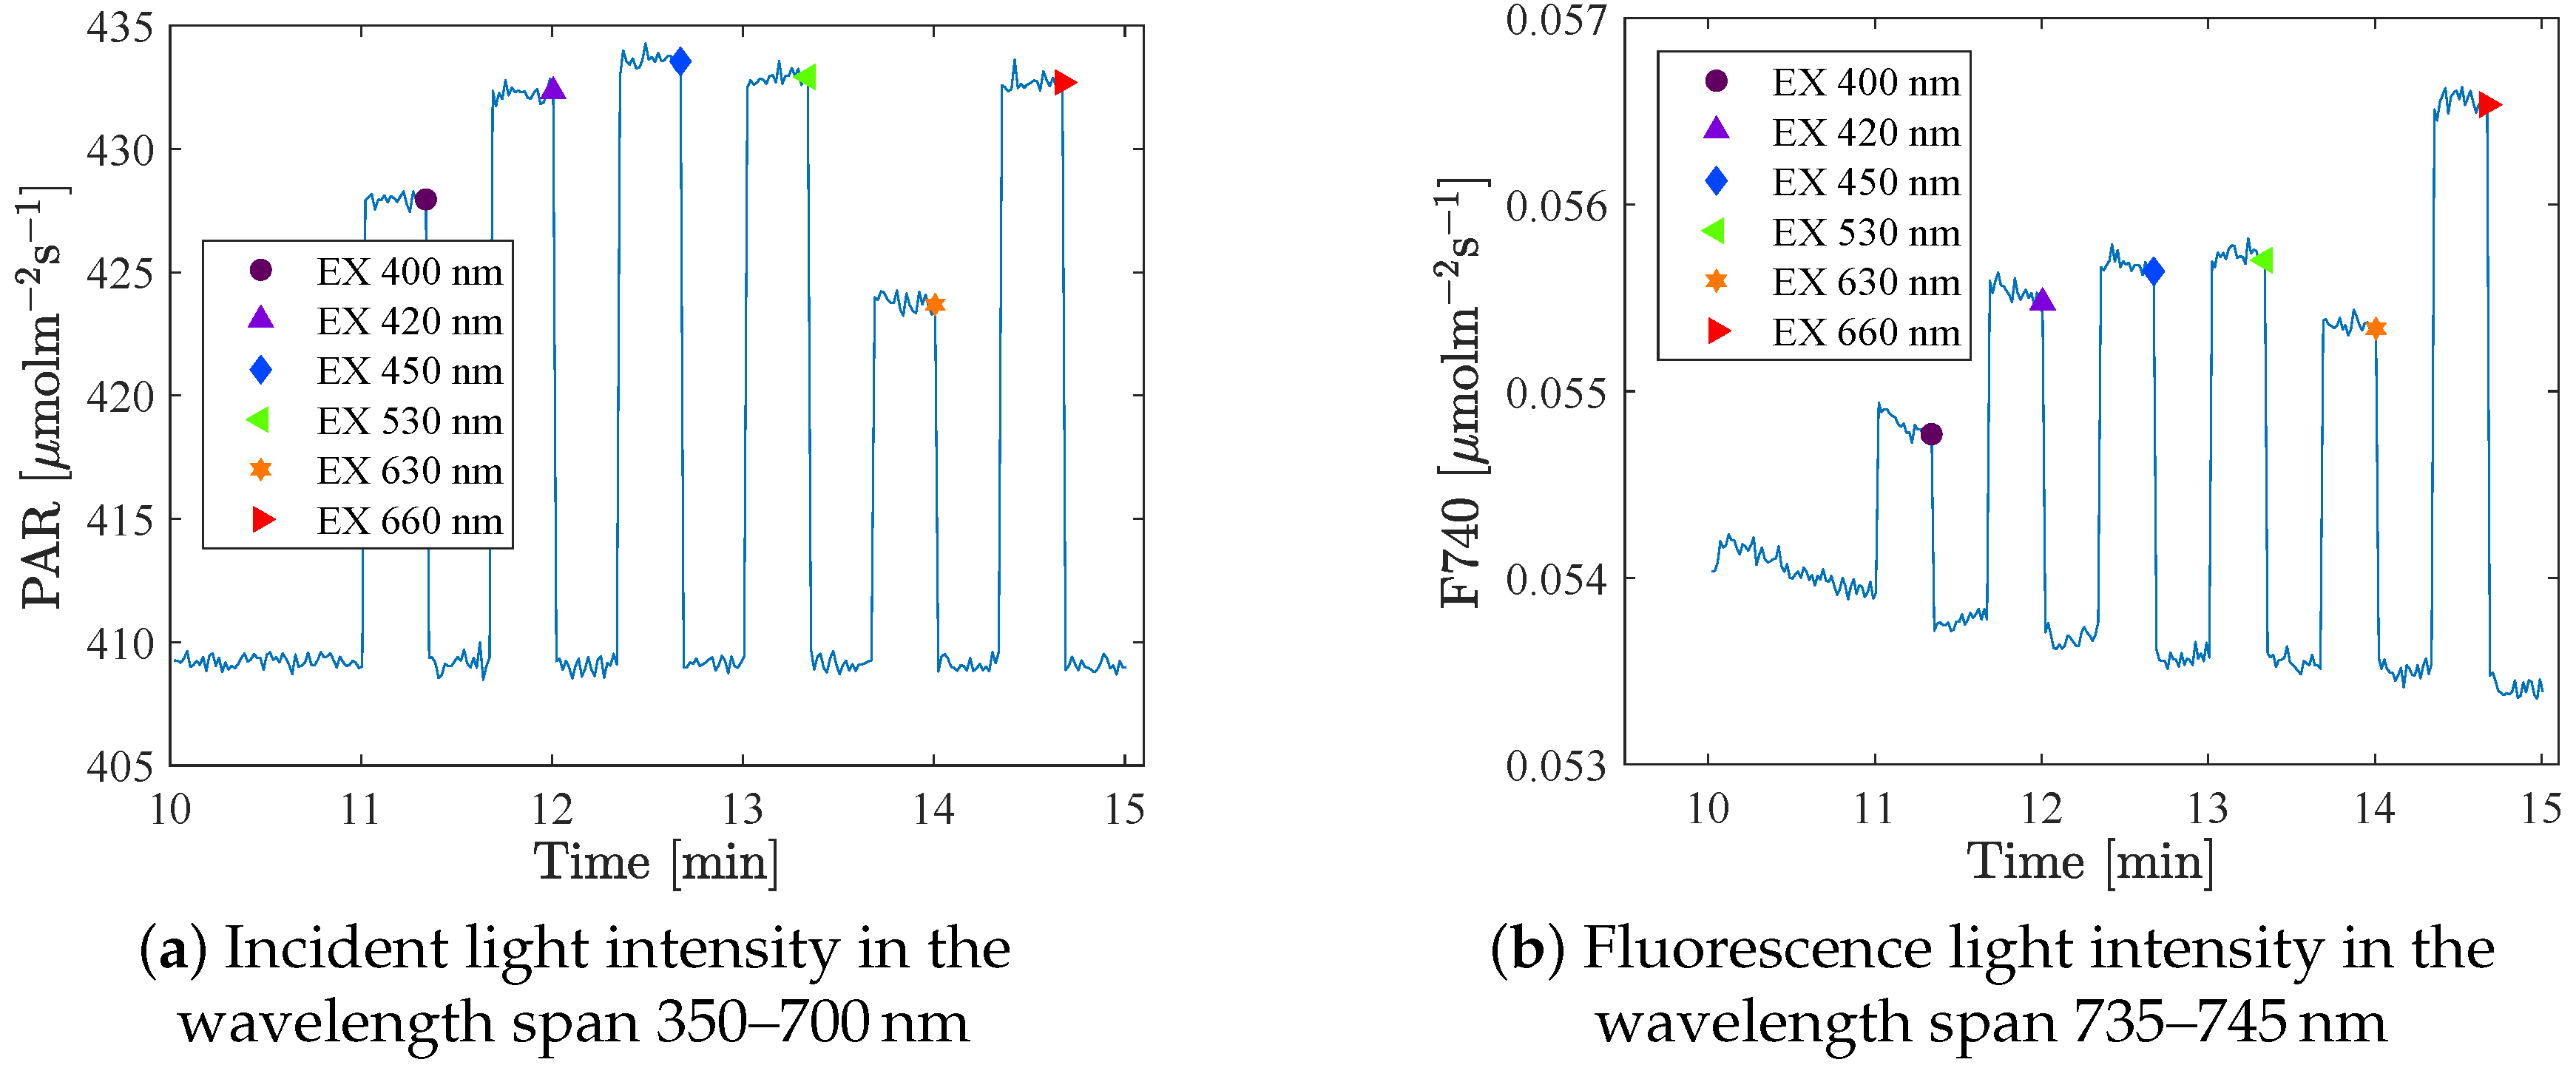
Figure 3 shows the incident light (a) and fluorescence signal (b) for one (out of five) background spectrum at background intensity 500
. Notice that the measured background intensity level shown in the figure is about 412
. The reason is that the background light levels were determined using another spectrometer. In addition, the light was measured in an empty room, but when inserting the plants (for the experiments) the light environment is changed even though the lamp settings are constant. In
Appendix A additional
Figure A1 and
Figure A2 for other setups are presented. In one setup, the scheme in
Figure 3a was repeated five times, once for each background spectrum, starting with 50% red light and finishing with only red light. In some setups the wavelength order was reversed, i.e., starting with background light spectrum with only red light and then decreasing the amount, and also starting the excitation with LEDs of longest wavelengths and continue in shorter wavelength order (that is reading
Figure 3a from right to left). All details of the different settings are summarized in
Table 1. In set A, the light was held constant at each light level for three minutes (six minutes at the first background light step when changing to a new background spectrum), while in set B an additional setup, staying at each light level only 20 s (60 s at the first BL), was also used. Another change from set A to set B was that an additional step of background light was added after the last excitation. This was done in order to more accurately capture any trend in the fluorescence that does not depend on the excitation step.
3. Results and Discussion
This section is divided into four subsections. In the first one,
Section 3.1, the normalized absolute values of fluorescence (F740) and photosynthetic rate (PN) from set A are presented, which demonstrates a clear positive correlation between F740 measured at canopy level and PN measured at leaf level in the presence of various background light. In
Section 3.2 the results of the F740 gains are presented, as a function of background light spectra and as a function of background light intensity. The mutual relation of the F740 gains do not change significantly with background light spectra. However, changes were noticed when light intensity increased up to a certain point. In
Section 3.2.3 we discuss the fact that LED 660 is likely overestimated in our analysis. In
Section 3.3 the results from the infrared gas analyzer are presented. Here we found that the light saturation level in the light curves, coincides with the light intensity where the mutual relation of the F740 gains do not change any more. Furthermore, the PN gains are presented and shown to correlate with the F740 gains. Finally in
Section 3.4, we discuss our results of the F740 gains and PN gains, compared to data from McCree and our dualex measurements.
3.1. Absolute Values of Fluorescence vs. Photosynthetic Rate
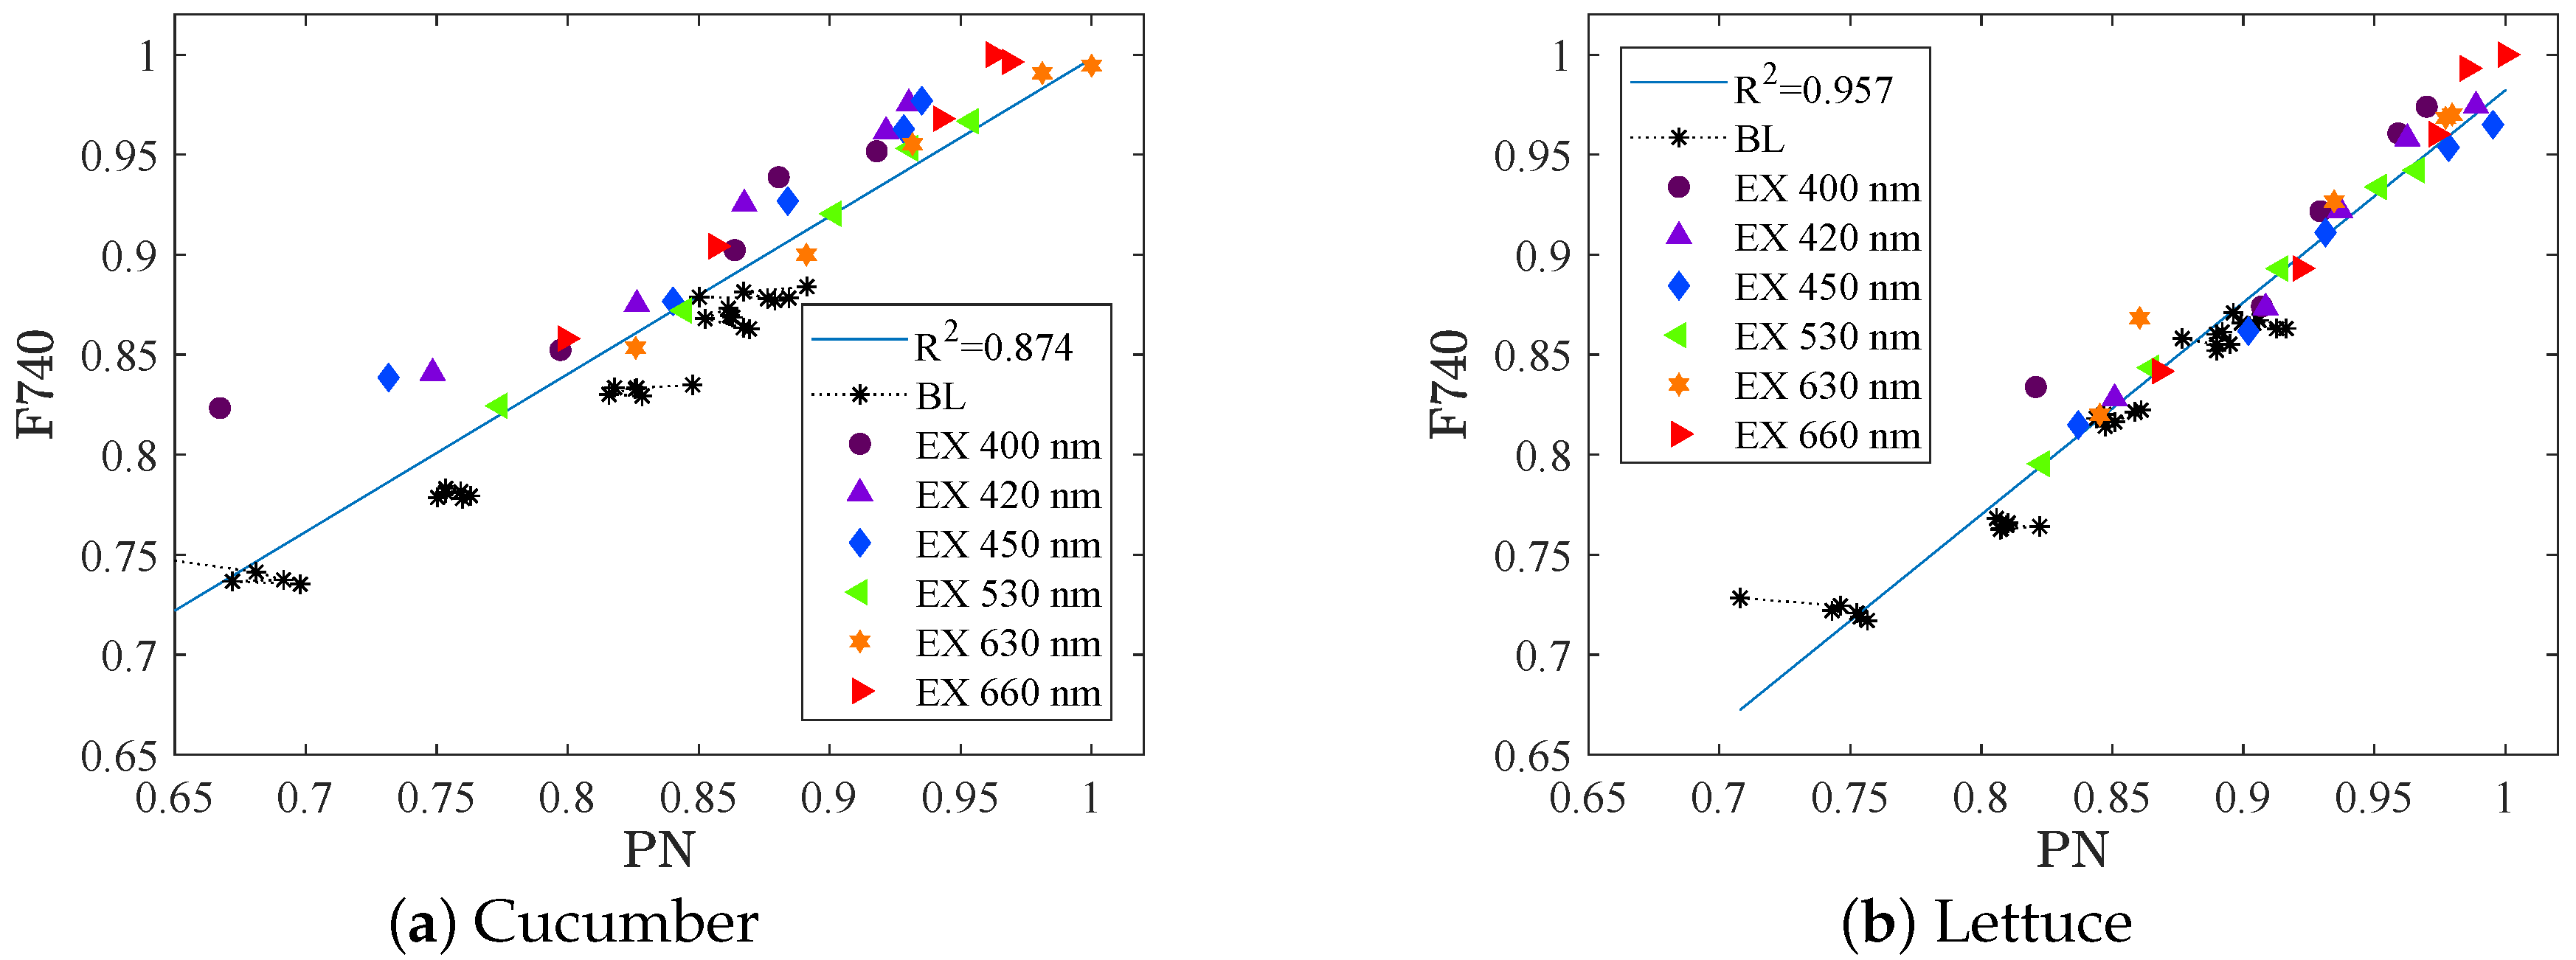
The normalized absolute value of fluorescence as a function of the normalized absolute value of the photosynthetic rate (i.e., all values is divided by the maximum measured value to a normalized value being one or less), is shown in
Figure 5 for (a) cucumber and (b) lettuce. The background light intensity is 160
, and background spectra ranging from 50% to 100% red light (i.e., set A). The black stars in the plot correspond to these background light levels, clustered in five groups. It corresponds to the five different spectral distribution of the background light, with higher amounts of red light resulting in both higher fluorescence and higher photosynthetic rate. The coloured dots correspond to the measurements when an excitation step (of about 20
) is added by one of the six available LED colours.
The measurements clearly show a strong positive correlation between fluorescence (F740) measured at canopy level and photosynthetic rate (PN) measured at leaf level in the presence of various background light. For cucumber (
Figure 5a), one reasonable approximation is to view the relation as two different linear regressions, one for the lower background intensity level (black stars, PAR 160
) and one for the slightly higher (coloured dots, PAR 180
). This indicates that the relation between F740 and PN is close to, but not exactly linear, changing slightly with the intensity. However, for the purpose of optimizing the spectrum for short term photosynthesis only a positive correlation between F740 and PN is required (it does not have to be linear). It should be noted that the time at each light level (three minutes) was enough to get a useful signal of the fluorescence, but hardly enough for the photosynthetic rate signal due to the relatively high noise magnitude. Furthermore, the variation in the strength of the correlation (
and
for cucumber and lettuce respectively) could be attributed to mainly the variation in the photosynthetic rate signal. At this stage no conclusions about differences due to crop species can be drawn.
In set B, the background light consists of light from white LEDs (among others), which produce light also in the region where the fluorescence signal is measured. The white LEDs are held constant at each background light level, but the higher the intensity levels and the less red light in the spectrum, the more light is emitted from the white LEDs. That is why no data of the absolute value of the fluorescence in set B can be presented here.
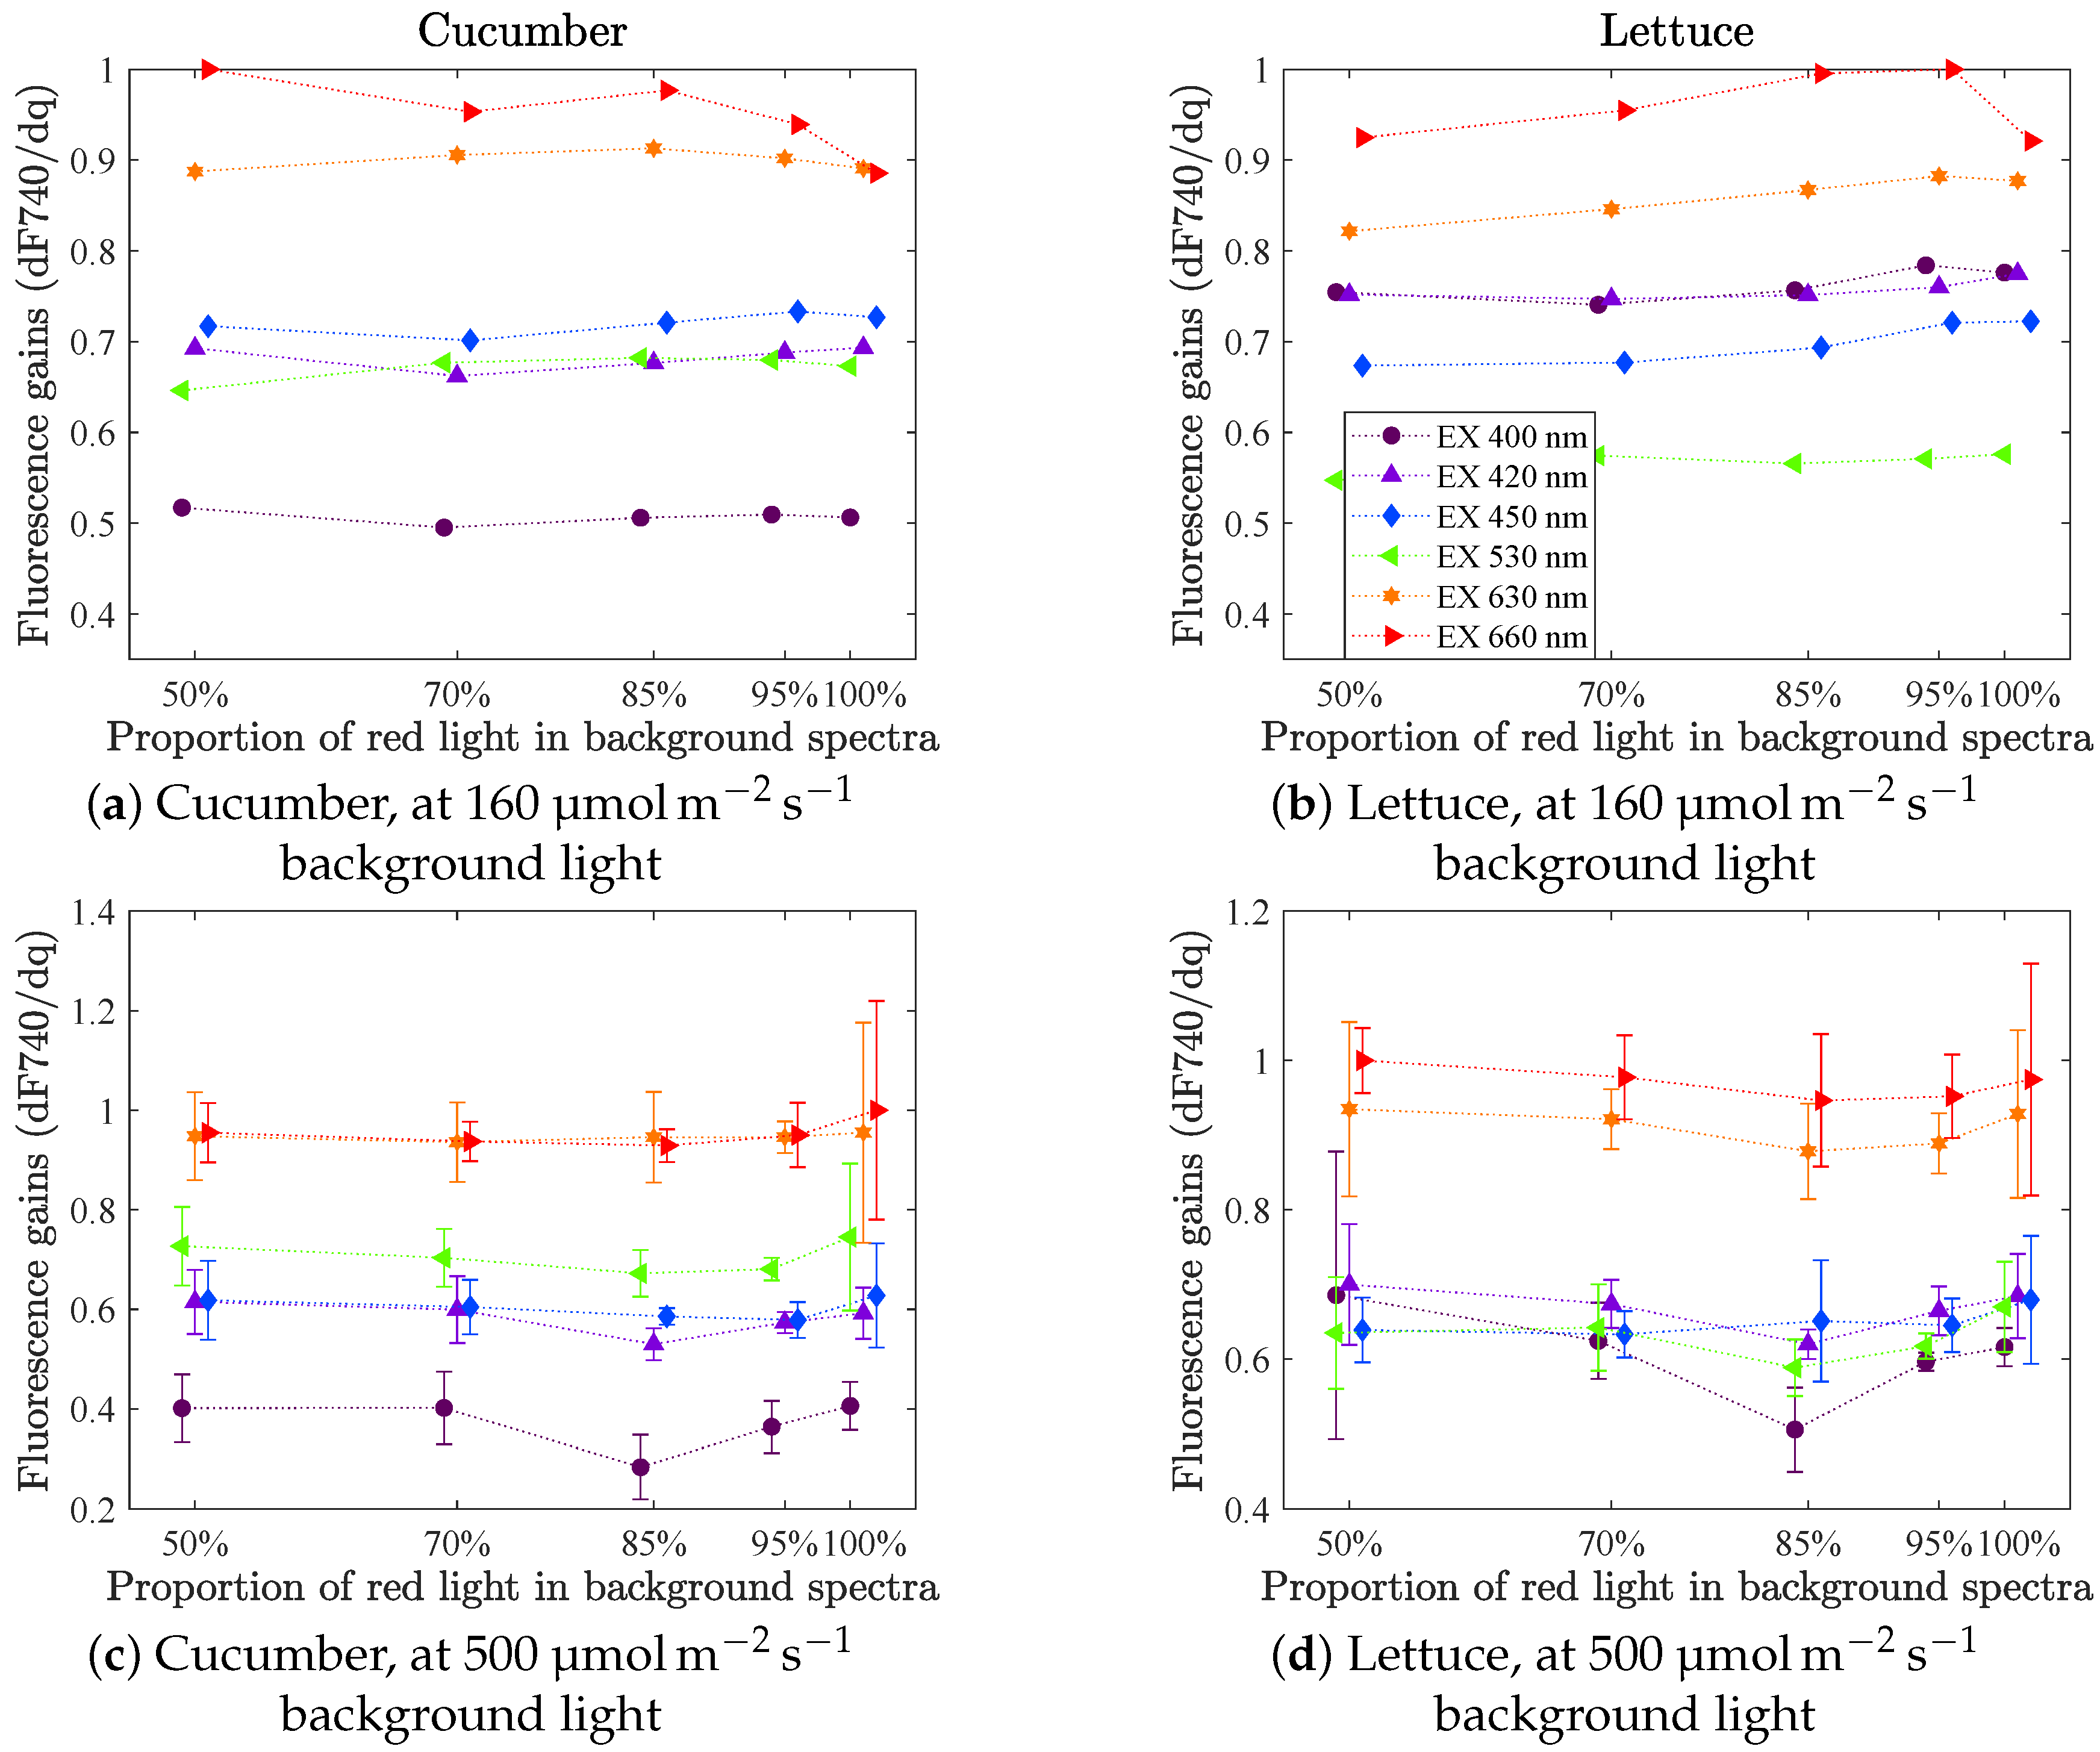
3.2. Fluorescence Gains, dF740/dq
The fluorescence gains (defined by Equation (
2)), i.e., the change in fluorescence (integrated over 735–745 nm) divided by the change in incident light caused by an (small) excitation of one specific LED colour, were studied for excitations of every LED colour at different light qualities (50–100% red light) and quantities (160–1000
).
3.2.1. dF740/dq vs. Incident Light Quality
Figure 6 shows the fluorescence gains vs. the proportion of red light in the background spectra for intensities 160
(first row, from set A) and 500
(second row, from set B). The figures are representative also for the other intensity levels tested. In set A the experiments were only repeated once (giving two measurements per level). The results presented are the mean values of these two measurements. In set B, at 500
, the fluorescence gains were measured three times for lettuce and five times for cucumber. The error bars (in the second row) indicate the spread (one standard deviation) of the measurements at each point. As the background light approaches only red light, a small decrease in fluorescence gain for LED 660 was noticed for both cucumber and lettuce, at background intensity 160
. However, this was not observed for higher light intensities. Considering the one standard deviation error bars, no significant change in fluorescence gain as a function of background spectrum can be concluded.
The fluorescence gain is always highest for an excitation in red light (highest for LED 660 followed by LED 630). For the others it differs slightly depending on species and intensity level. LED 400 gives the lowest gain for cucumber, whereas all three blue LEDs (400, 420 and 450 nm) are about equal for lettuce. LED 530 gives a relatively higher gain for cucumber than for lettuce.
Our experiments do not indicate that the steady-state fluorescence gains (or the short term photosynthetic rate gain, since they correlate) would change significantly with background light quality. That means, for a given incident intensity there is no need for an online controller to work continuously to find the optimal spectrum. On the other hand, due to the strong correlation between photosynthetic rate and fluorescence, and the fact that the relative fluorescence gains are consistent at each incident intensity level, the fluorescence gains could be an interesting signal to monitor, for example daily through the growth cycle, in order to detect if something unpredicted happens. If the input signal is the current to the lamp, instead of the measured incident light quanta, it would be possible to detect if any of the LED colours have degraded more than the others, and in such case reconsider the power distribution over the different LEDs.
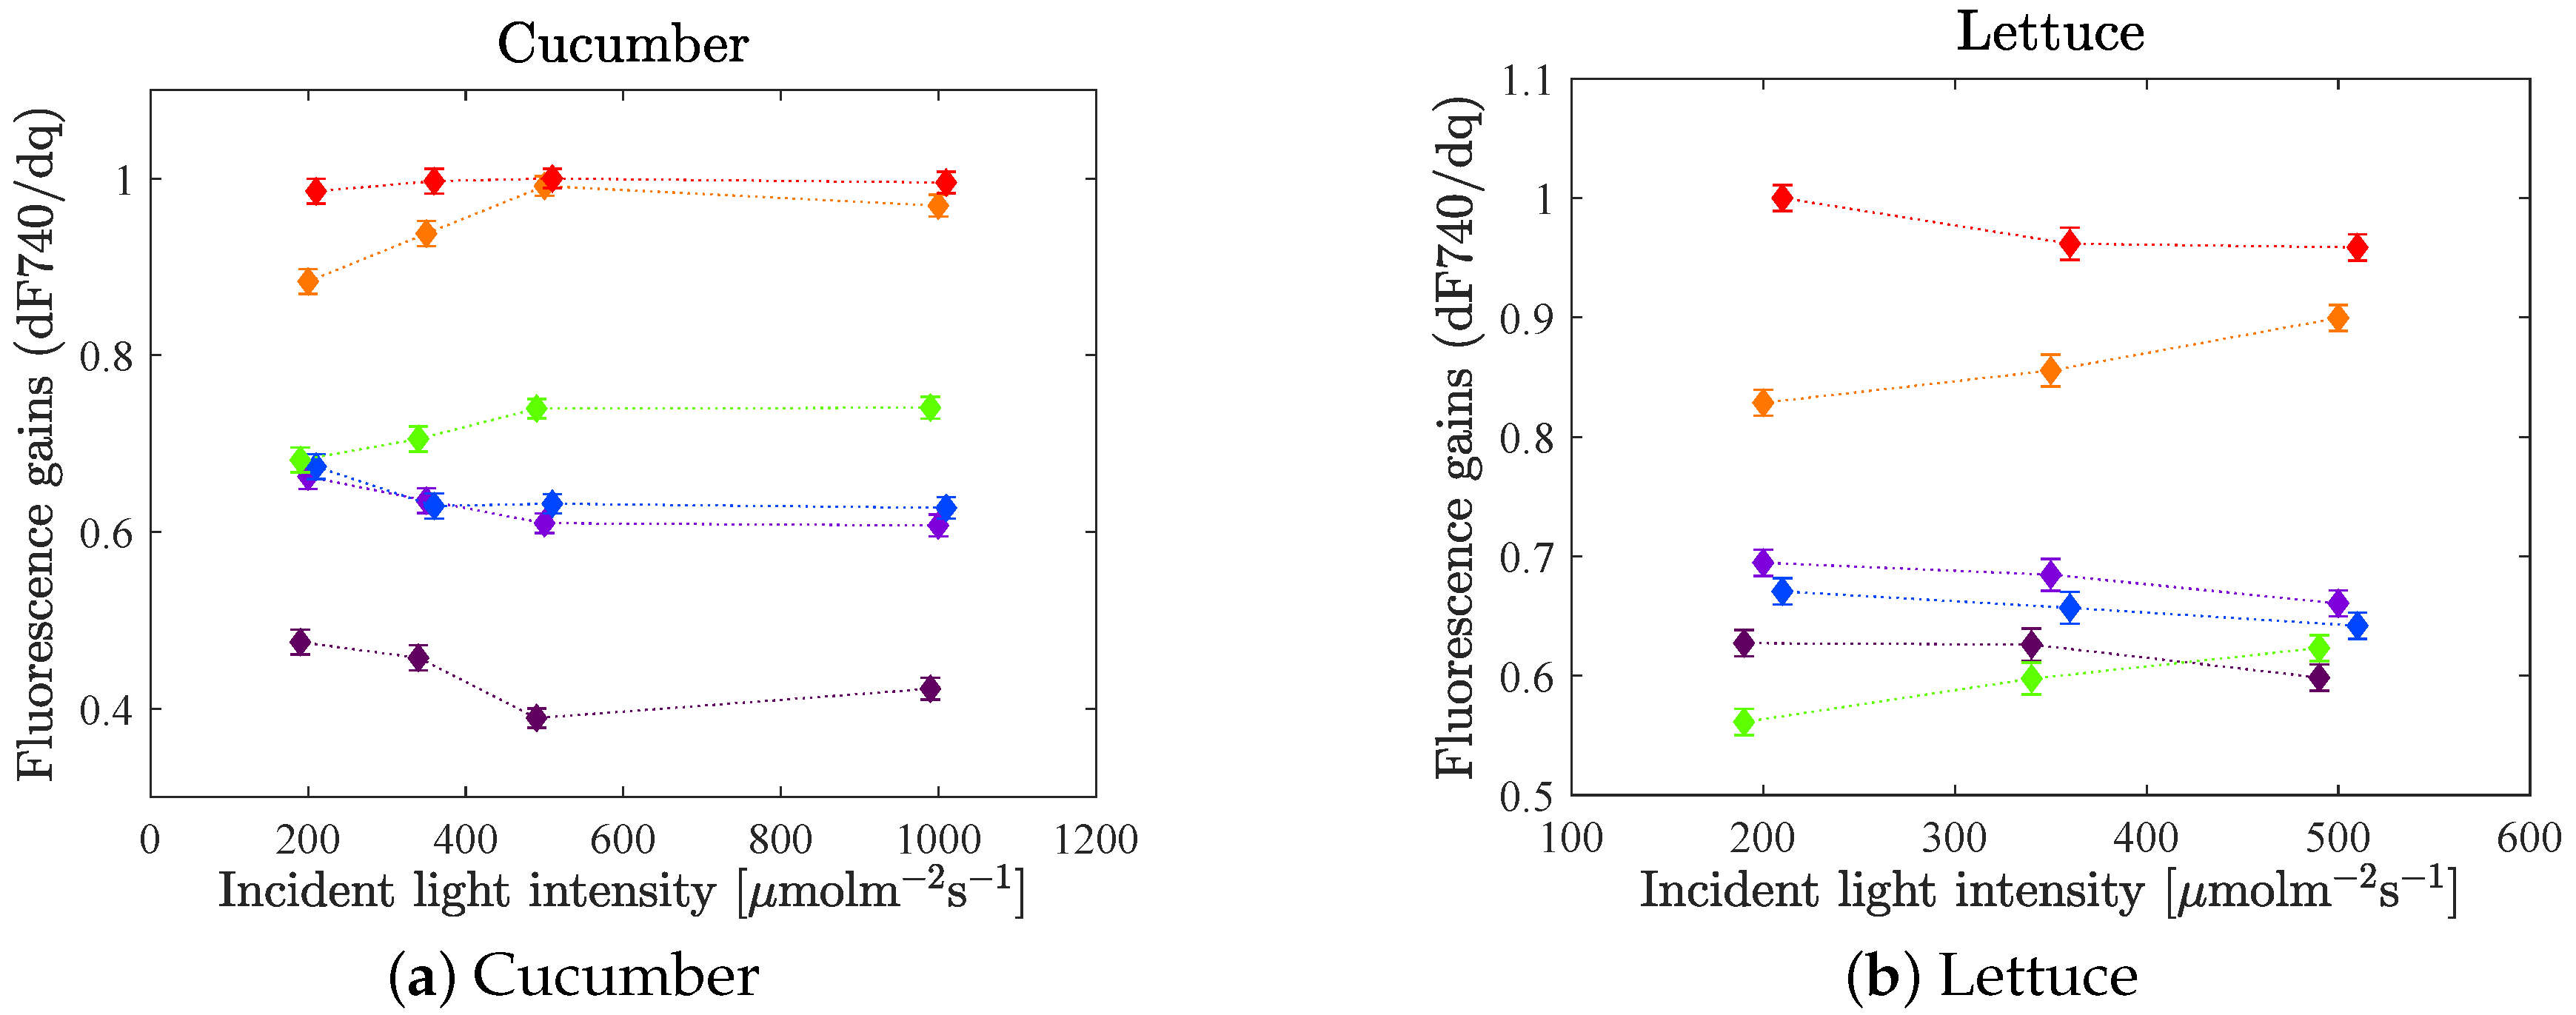
3.2.2. dF740/dq vs. Incident Light Quantity
The difference in relative fluorescence gain as a function of incident light intensity was studied. In
Figure 7 the mean values of the fluorescence gains of each LED colour at each intensity level are plotted with one standard error of the mean (according to Equation (
4)). A couple of statistically significant changes can be noted as the intensity increases. The difference in gain between LED 660 and LED 630 decreases. Also, the gain of LED 530 increases relative to the gains of the blue LEDs. The starting point though, differs for the two species. For cucumber, the gain of LED 530 is about equal to the gain of LED 420 and LED 450 at 200
, while LED 530 has a higher gain than the blue LEDs at higher intensities. For lettuce on the other hand, the gain of the green LED is lower than the blues’ at 200
, while they are in the same region for higher intensities.
For cucumber an additionally high intensity level was included in the experiments, at 1000
. As the intensity increases from 500 to 1000
, no change in relative fluorescence gain could be observed. One possible reason for this is that the light curve has reached saturation (as can be seen in
Figure 8 in the next section), which means that even though more light is added, the photosynthesis rate cannot increase further.
3.2.3. Overestimated Fluorescence Gain from LED 660
The white LED has a significant illumination power in the fluorescence region (i.e., 735–745 nm), which can clearly be seen by observing its spectrum (see
Figure 1a). For all other LEDs, a potential overlap is very hard to detect since it is very small or even zero. At the time when the experiments were conducted it was assumed that none of the LEDs in the excitation lamp had any significant overlap with the fluorescence at 740 nm, based on observations of their spectra (see
Figure 1b). However, even a very small overlap can have a relatively large impact since, (i) a large proportion of the light at 740 nm will be reflected and (ii) the fluorescence signal is weak compared to the incident light.
When integrating the incident light in the range 735–745 nm, and time-averaging the noisy signal, a slight increase can be observed when adding an excitation with LED 660, compared to when only illuminating with the background light or adding an excitation with any other LED colour. This indicates that the signal
(see Equation (
2)) that is measured with the spectrometer facing the plants, contains both fluorescence and reflectance when adding an excitation with LED 660, but not when adding an excitation with LED 400, 420, 450, 530 or 630. Since in all reported results, this signal is assumed to only consist of fluorescence, and no reflectance, the fluorescence gain for LED 660 is likely overestimated.
Several attempts were made to estimate the reflectance to estimate the errors caused by the reflected light from LED 660. However, we have not been able to get an estimate with a reasonable confidence interval, and thereby we are not able to report a reasonable estimate of how much the reflectance affect the measurements. This is partly, or fully, attributed to the low signal to noise ratio in the incident light spectrometer measurements in this waveband (signal level similar to noise level). Measurements with longer integration time to increase the signal level, or a spectrometer with a lower noise level, e.g., with a cooled detector, seems to be necessary for doing this estimation. If indeed LED 660 has a significant overlap with the chlorophyll fluorescence waveband it may be possible to mitigate it by moving the waveband towards longer wavelengths, or compensate for the overlap, or more drastically, using optical filters in the lamp to block light in the fluorescence region.
3.3. Photosynthetic Rate
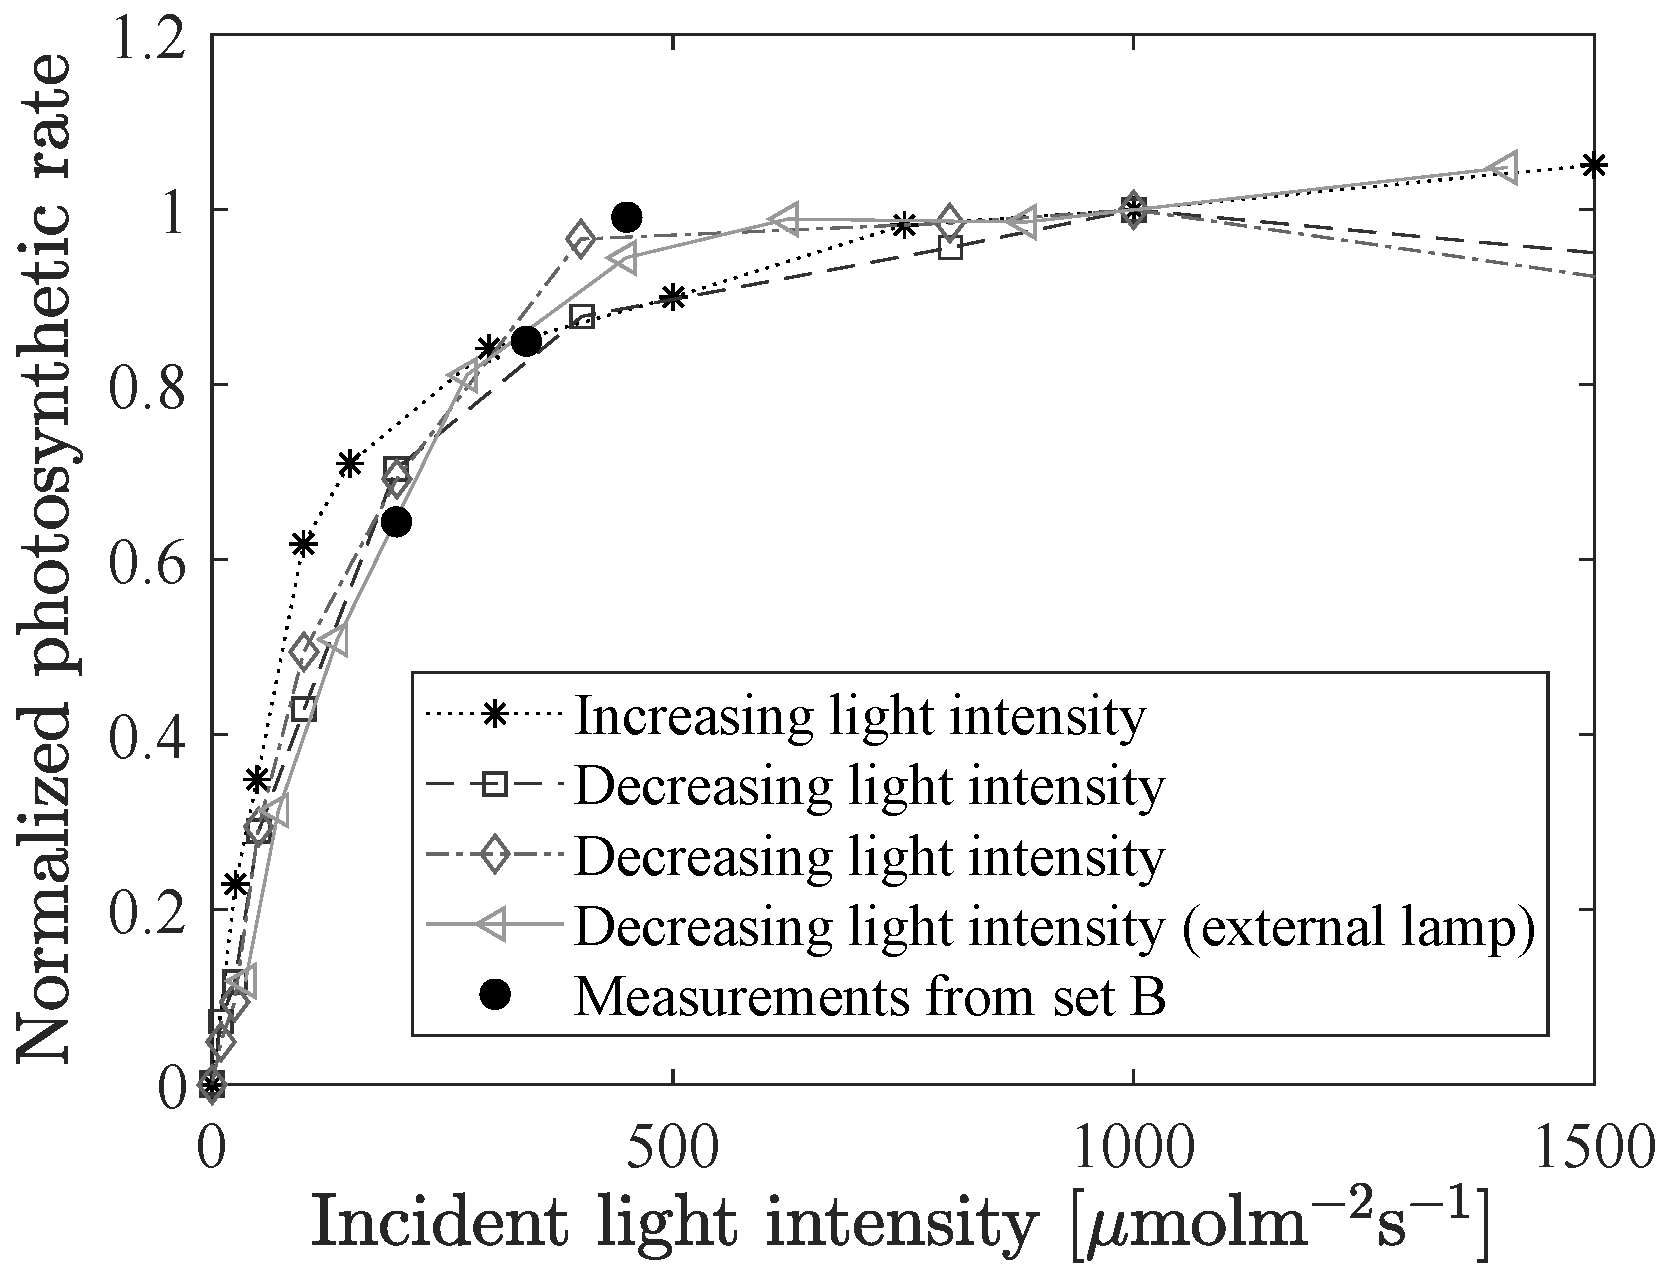
3.3.1. Light Curve
The light curve, i.e., the photosynthetic rate as a function of incident light intensity, was measured for four different cucumber leaves using an infrared gas analyzer (IRGA), see
Figure 8. One time the external LED lamp was used as the light source (starting with high intensity and stepwise decreasing), and the other three times the internal LED lamp in the IRGA-machine was used, once with increasing light intensity and twice with decreasing intensity. The black dots in the figure are from the three different background intensity levels of the experiments in set B.
At low light the relation between incident light and photosynthetic rate is almost linear, but the dependency of the rate on the light intensity decreases, and for intensities higher than about 500
, there is almost no increase in photosynthetic rate. This saturation phenomena is not seen for the absolute value of the steady-state fluorescence, which continues to increase with increasing light intensity (data not shown). On the other hand, the mutual relation of the fluorescence gains seems to be unchanged after reaching light saturation, as was discussed in the previous section (see
Figure 7a). Hence, one possible application of fluorescence gain measurements is to identify where light saturation occurs. This could, for example, be of interest in stress detection due to light inhibition, as an alternative to the method presented in [
26].
3.3.2. Photosynthetic Rate Gains, dPN/dq
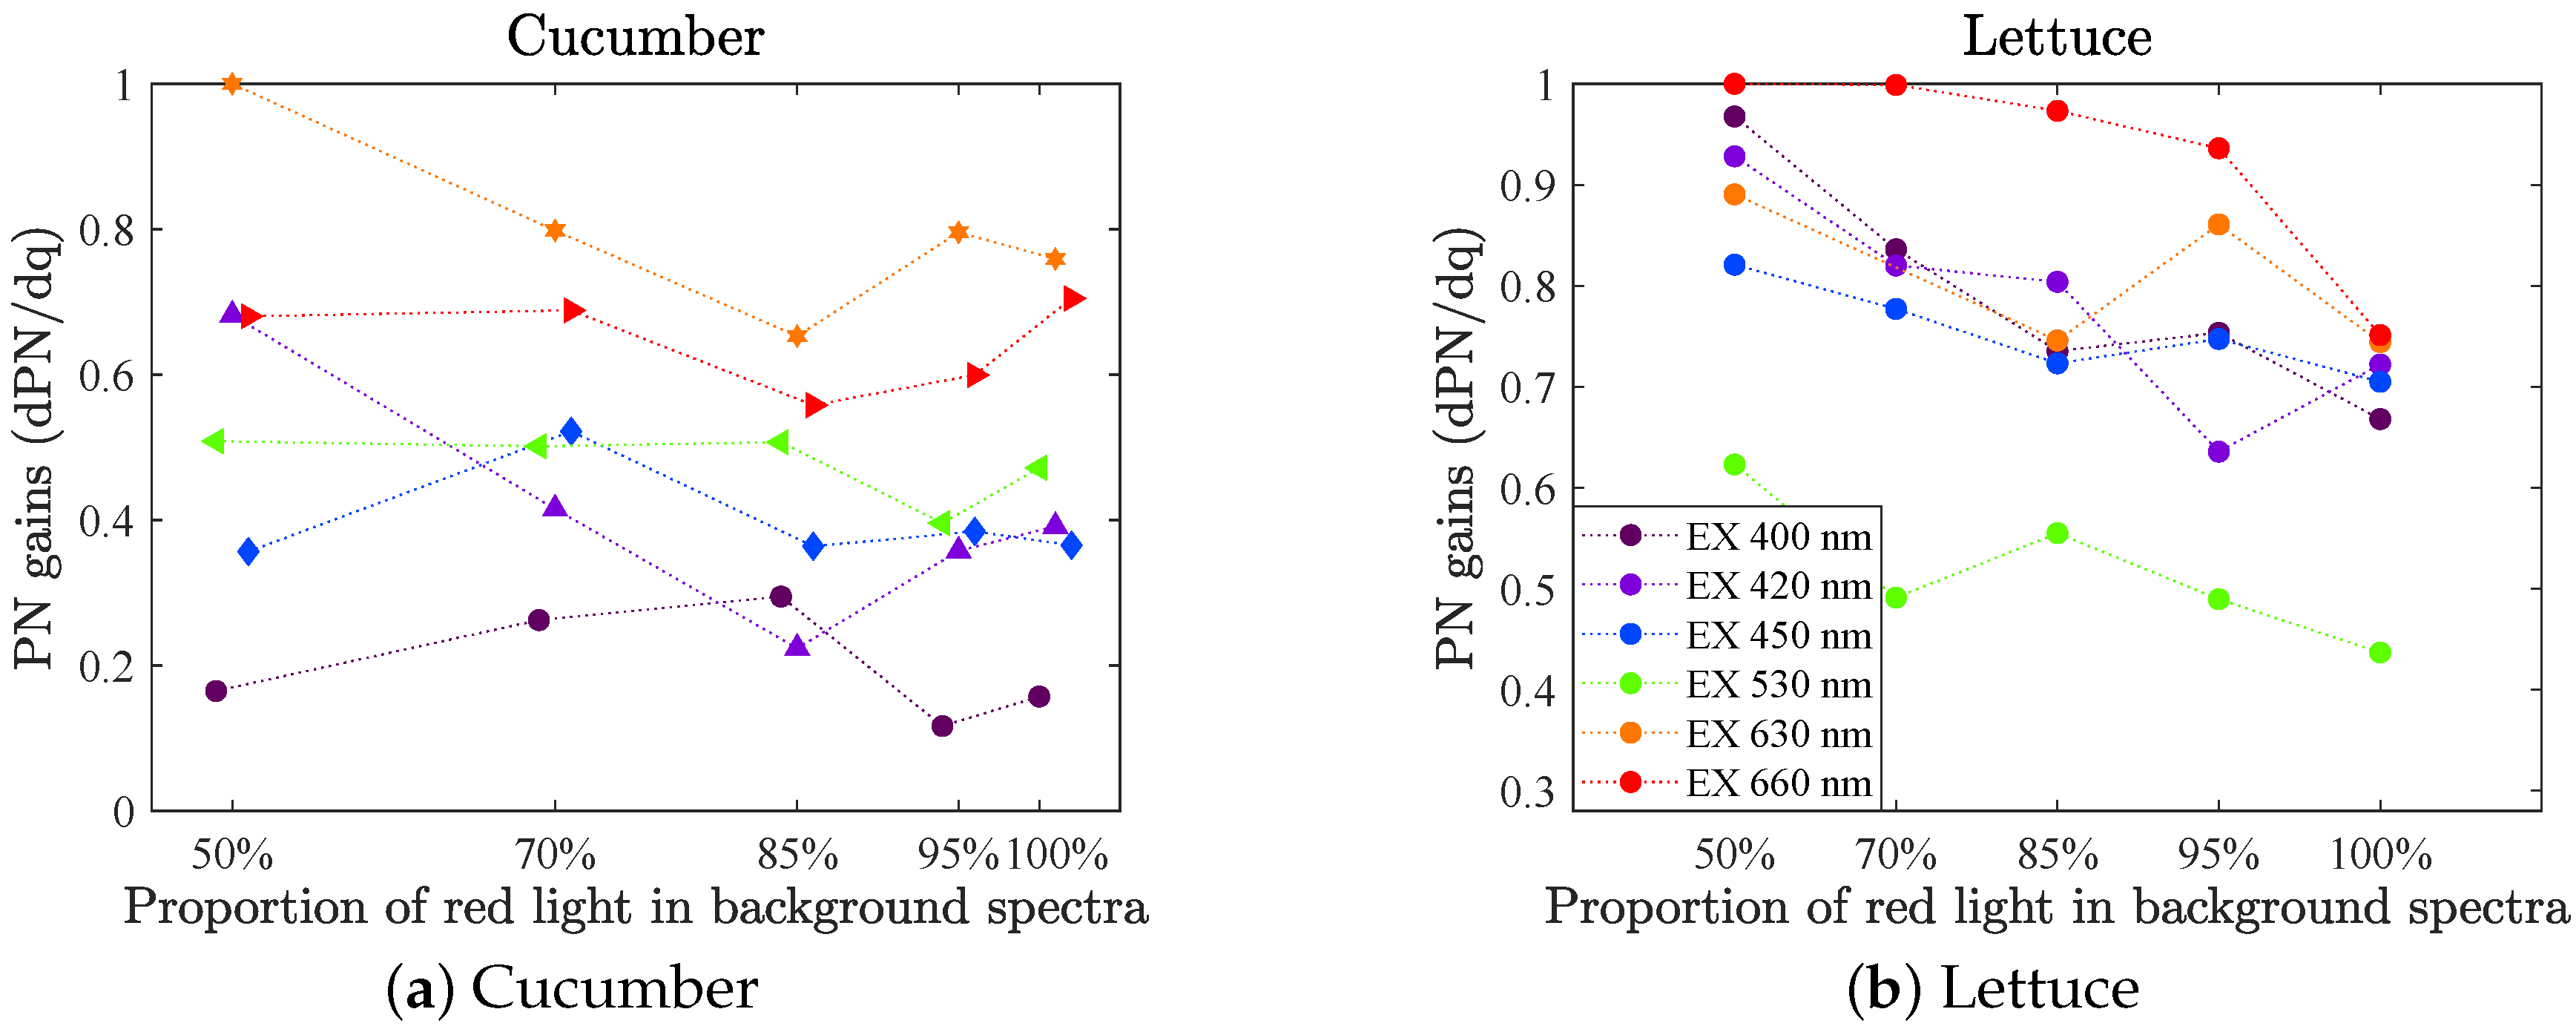
Figure 9 shows the photosynthetic rate gains as a function of incident light quality (50–100% red light) when the incident intensity was 160
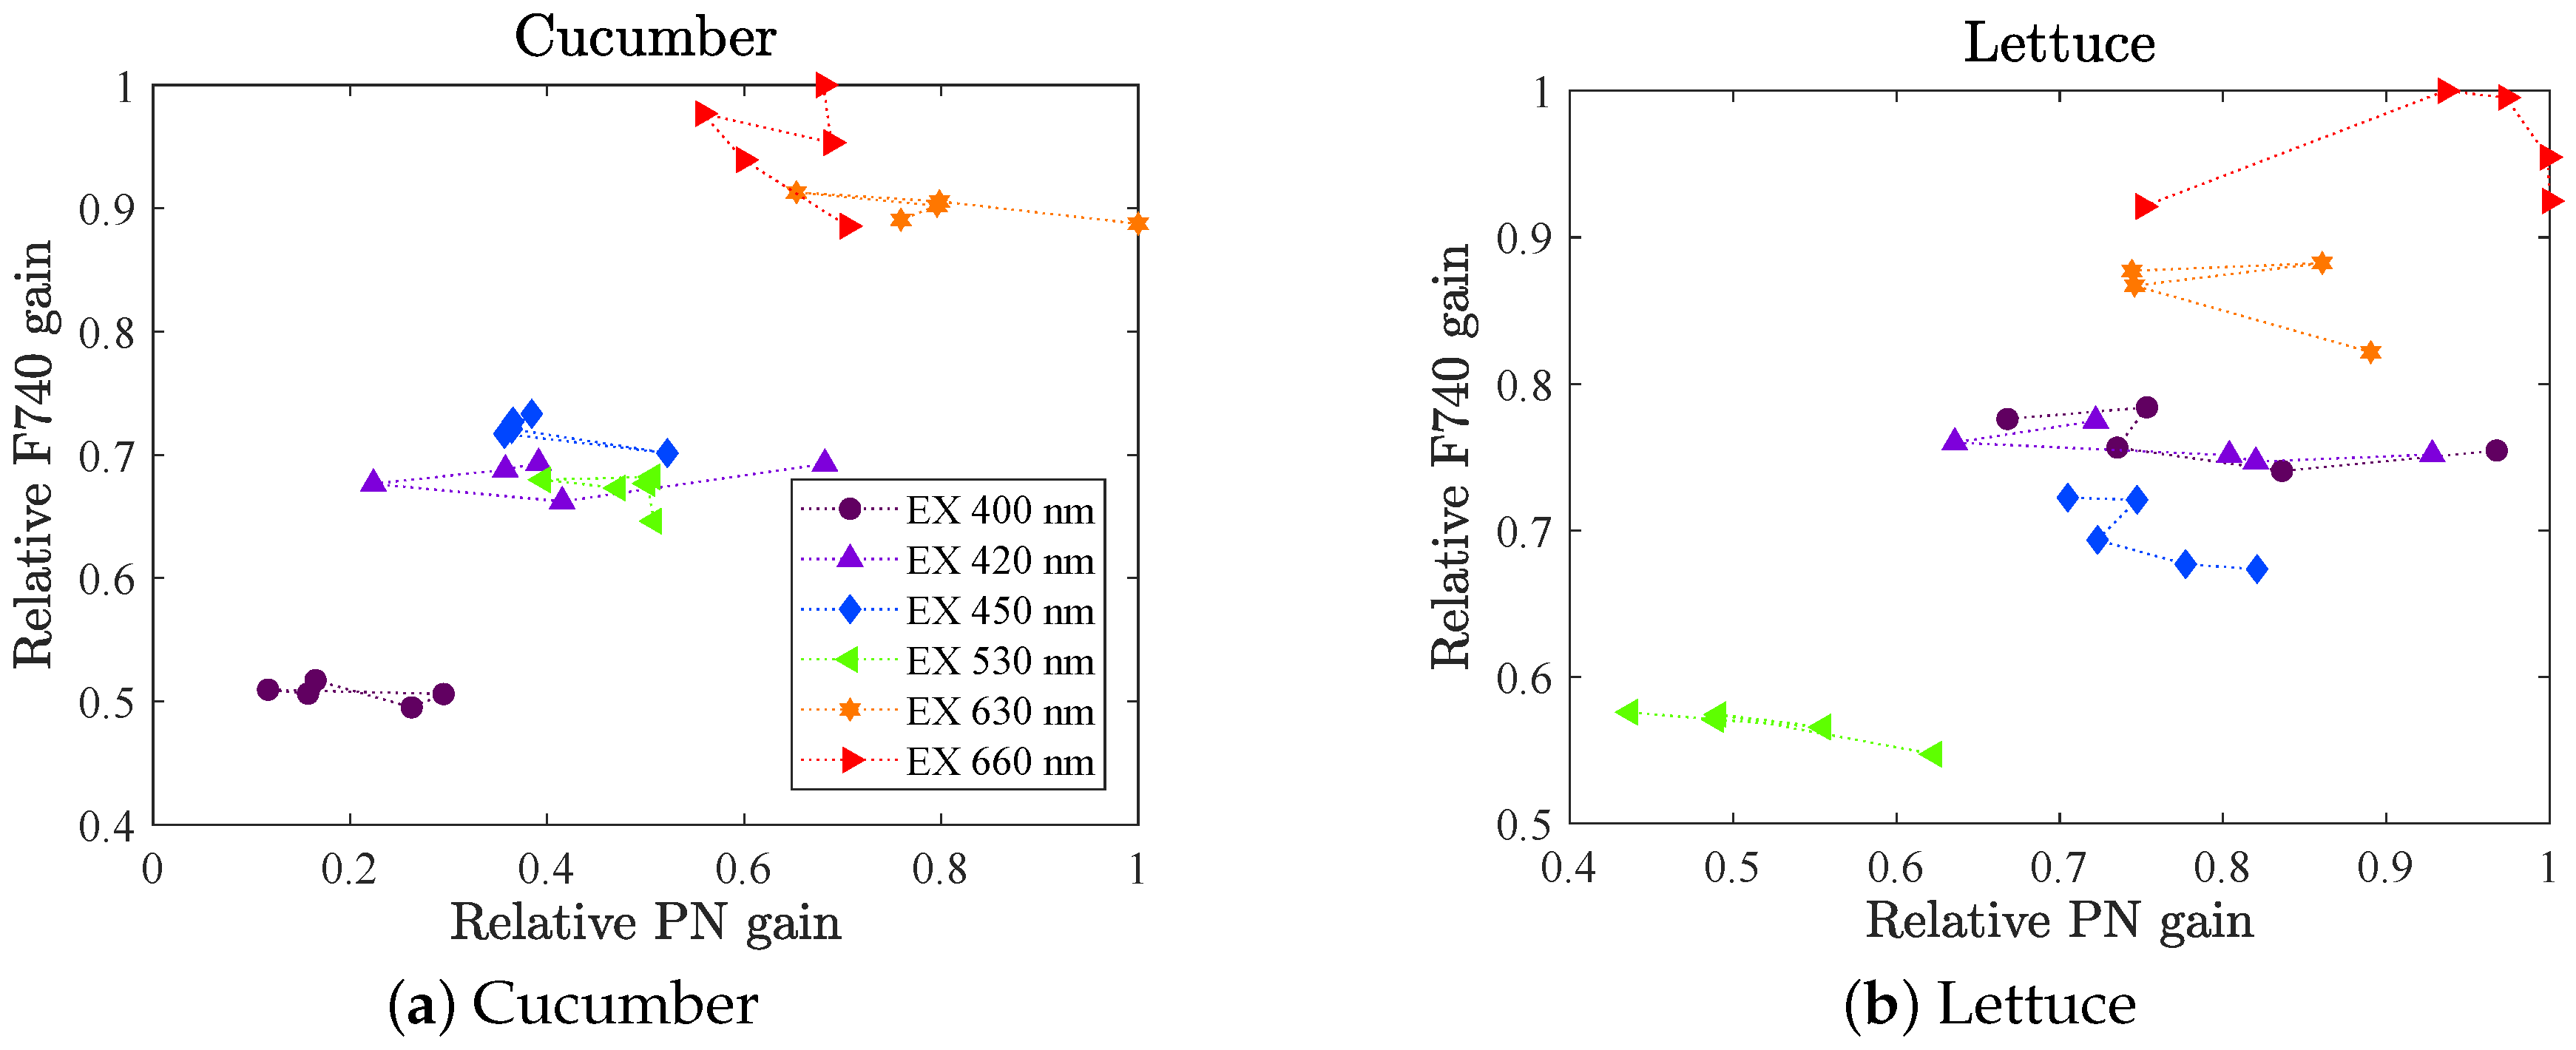
(set A). The measurements were repeated on four different leaves (for each species), of which we show their mean value. The variability was notably larger than in the fluorescence data because of the nature of the method, but shows similar behavior to the fluorescence gains, compare with
Figure 6 upper row (in
Appendix A Figure A3, a scatter plot of PN gain vs. F740 gain are shown). The red light gave the highest gains. For cucumber LED 630 had a slightly higher gain than LED 660, which was not the case for the fluorescence gain. However, the fluorescence gain for LED 660 was most likely overestimated (see
Section 3.2.3). Further, LED 530 gave the lowest gain for lettuce whilst LED 400 gives the lowest gain for cucumber. No significant change in photosynthetic rate gain as a function of background spectrum could be proven.
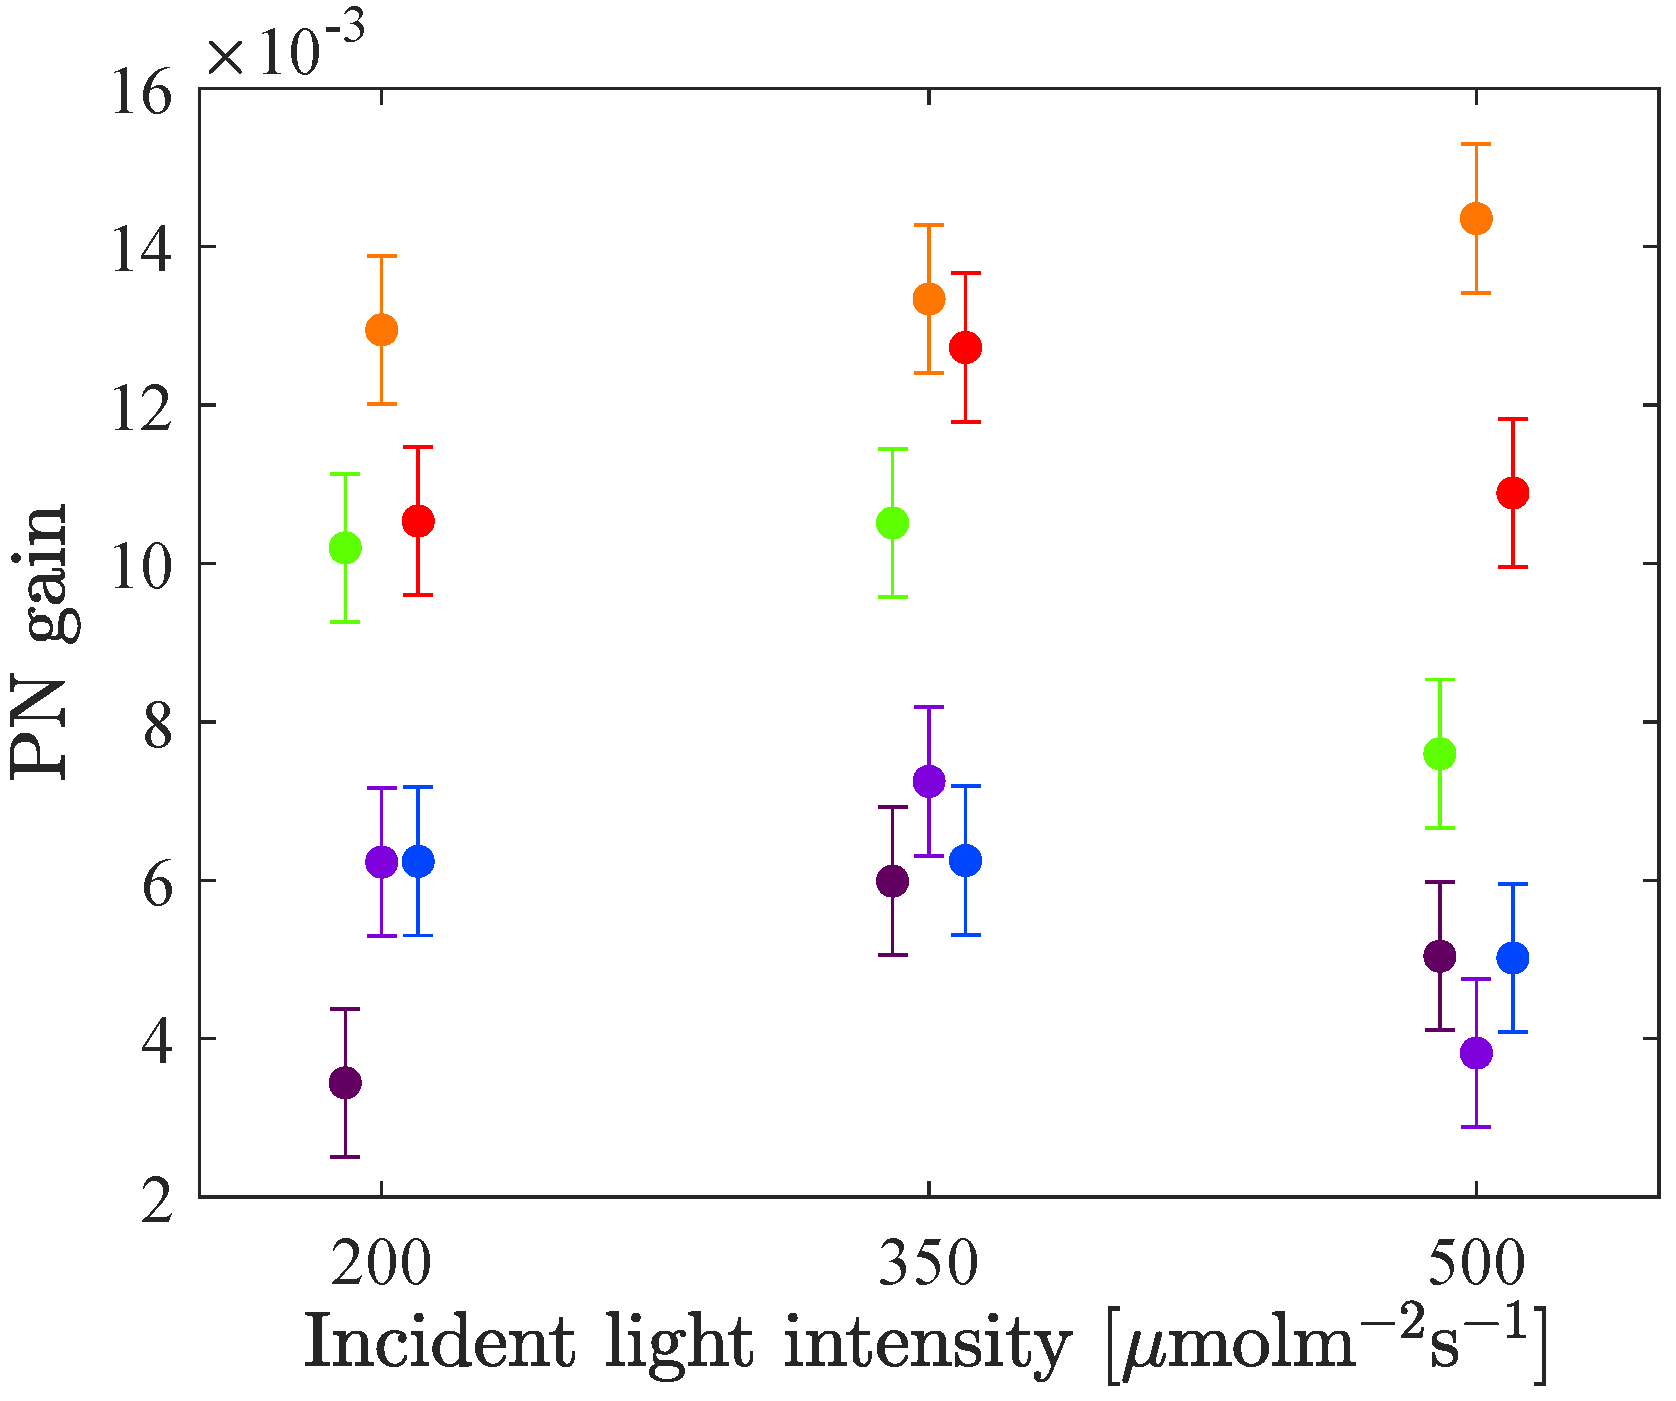
In set B, the IRGA was used in three experiments on cucumber, once at each intensity level: 200, 350 and 500
and with spectra of 50–100% red light. In
Figure 10 the mean values of the PN gains at different intensity levels are plotted with the standard error of the mean (according to Equation (
4)). The general picture is the same as for the cucumber in set A (recall set A had PAR 160
, see
Figure 9a), i.e., the gain was highest for red LEDs, followed by green and lowest for blue LEDs. Only in one out of the three intensity levels the PN gain of LED 400 was significantly lower than the other blue, which was the case for all sets of the fluorescence gains (see
Figure 7a). The PN gain of LED 660 was lower (or equal) to that of LED 630, which is not the case for the fluorescence gains at lower light intensities (recall again though, that the fluorescence gain for LED 660 was most likely overestimated). However in this setup, measurements were only conducted on one leaf per intensity level. To draw any conclusion about differences in relative PN gains as a function of light intensity level, more repetitions would be needed and also on different leaves.
3.4. Comparisons
3.4.1. Comparison with McCree Data
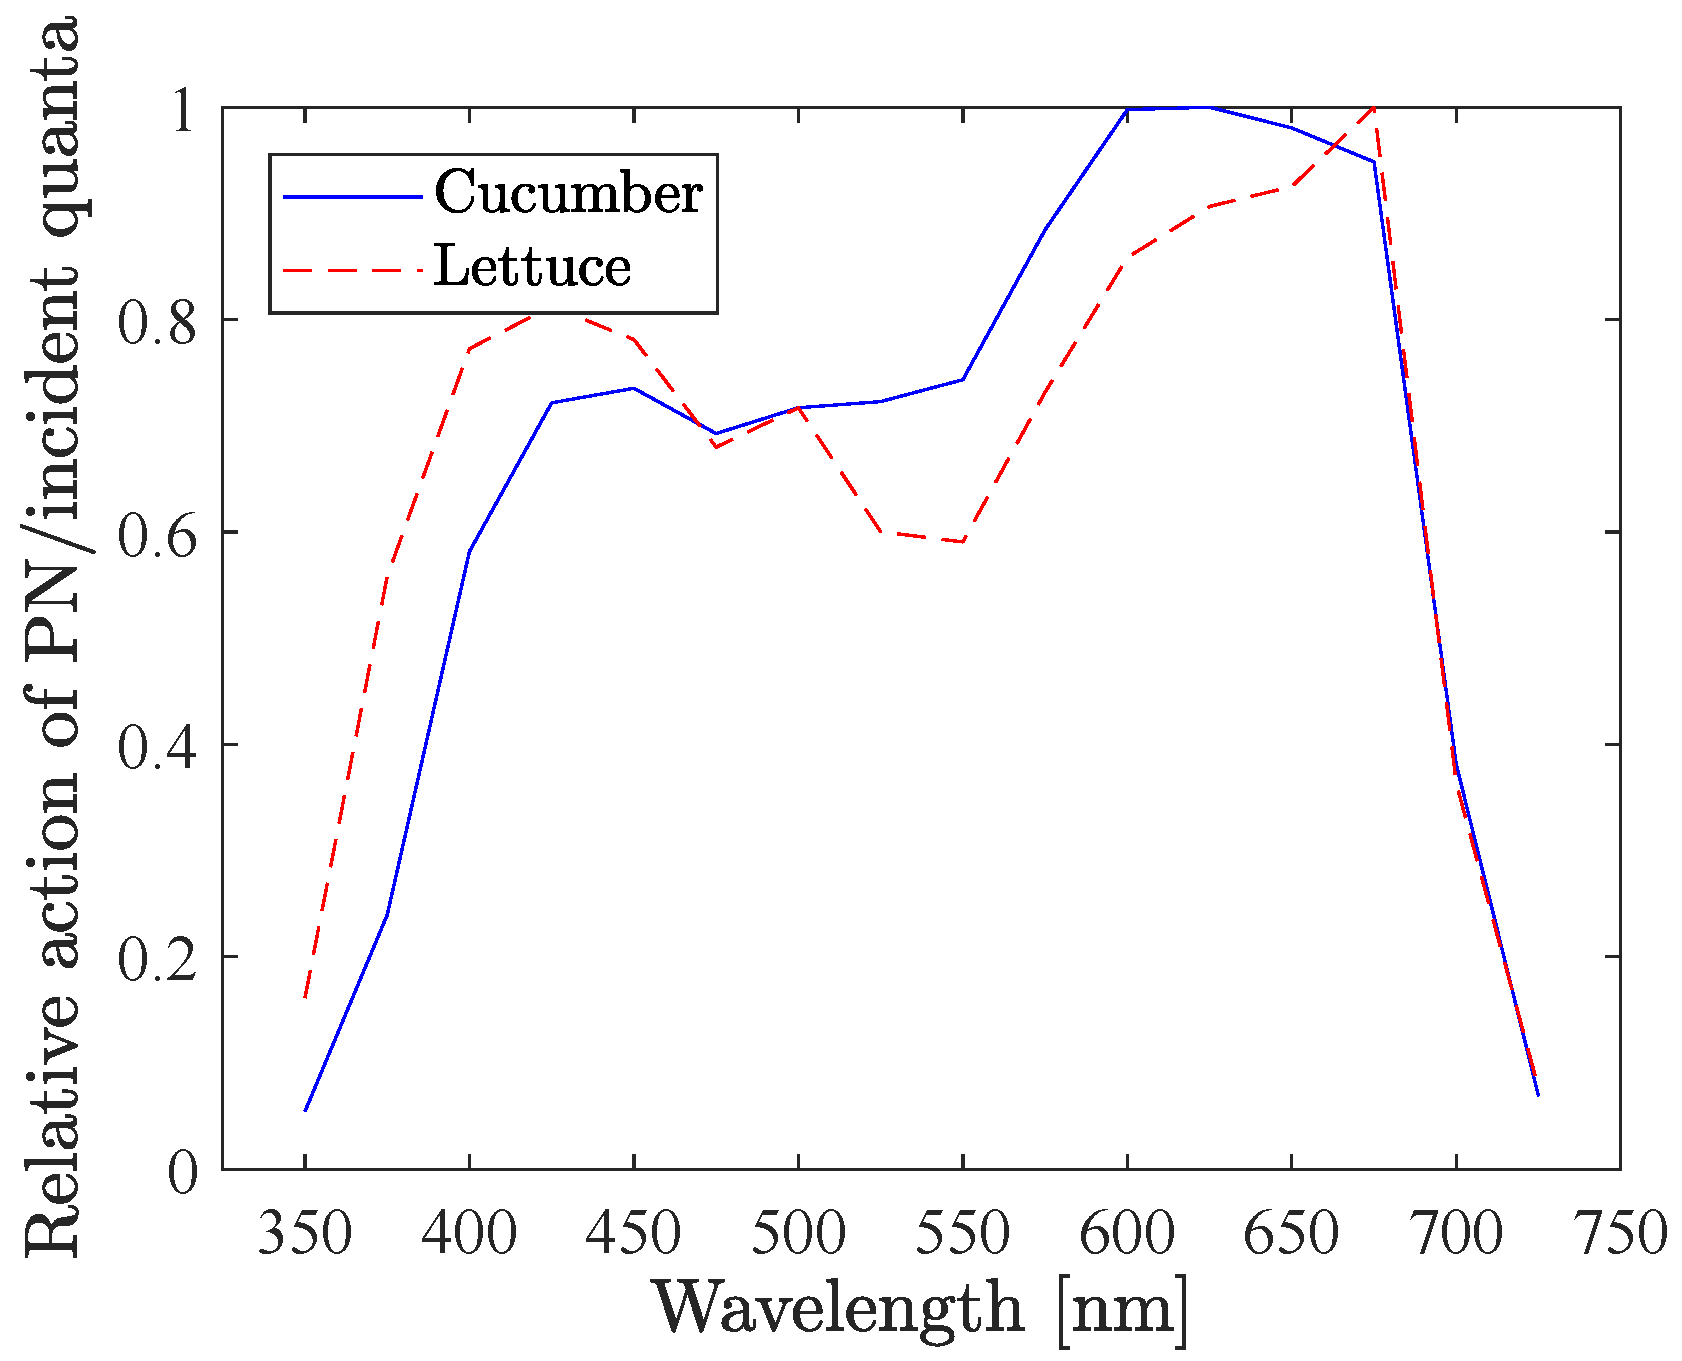
Among many other species, McCree [
7] measured the quantum yield (
uptake per absorbed photon) and absorbance rate for different wavelengths, for both cucumber and lettuce.
Figure 11 shows the relative action spectra for these two (
uptake per incident photon), derived from data from McCree. Multiplying this action spectra and with the spectra of each individual LED colour from the excitation lamp (Heliospectra RX lamp, see spectra in
Figure 1b), and calculating the integral, one gets the PN gain for each LED colour that would have been expected based on McCree1972’s experiments. The outcome is shown in
Figure 12a. Comparing these with the PN gains that we measured (
Figure 9 and
Figure 10), they do match very well, despite of all the different settings. For cucumber, McCree also found a slightly higher gain for LED 630, compared to LED 660, and also the lowest gain for LED 400. For lettuce on the other hand, LED 660 were slightly higher than LED 630, the blue LEDs were all close to each other, and LED 530 had the lowest gain. Also this is in complete agreement with our experimental results of the PN gains.
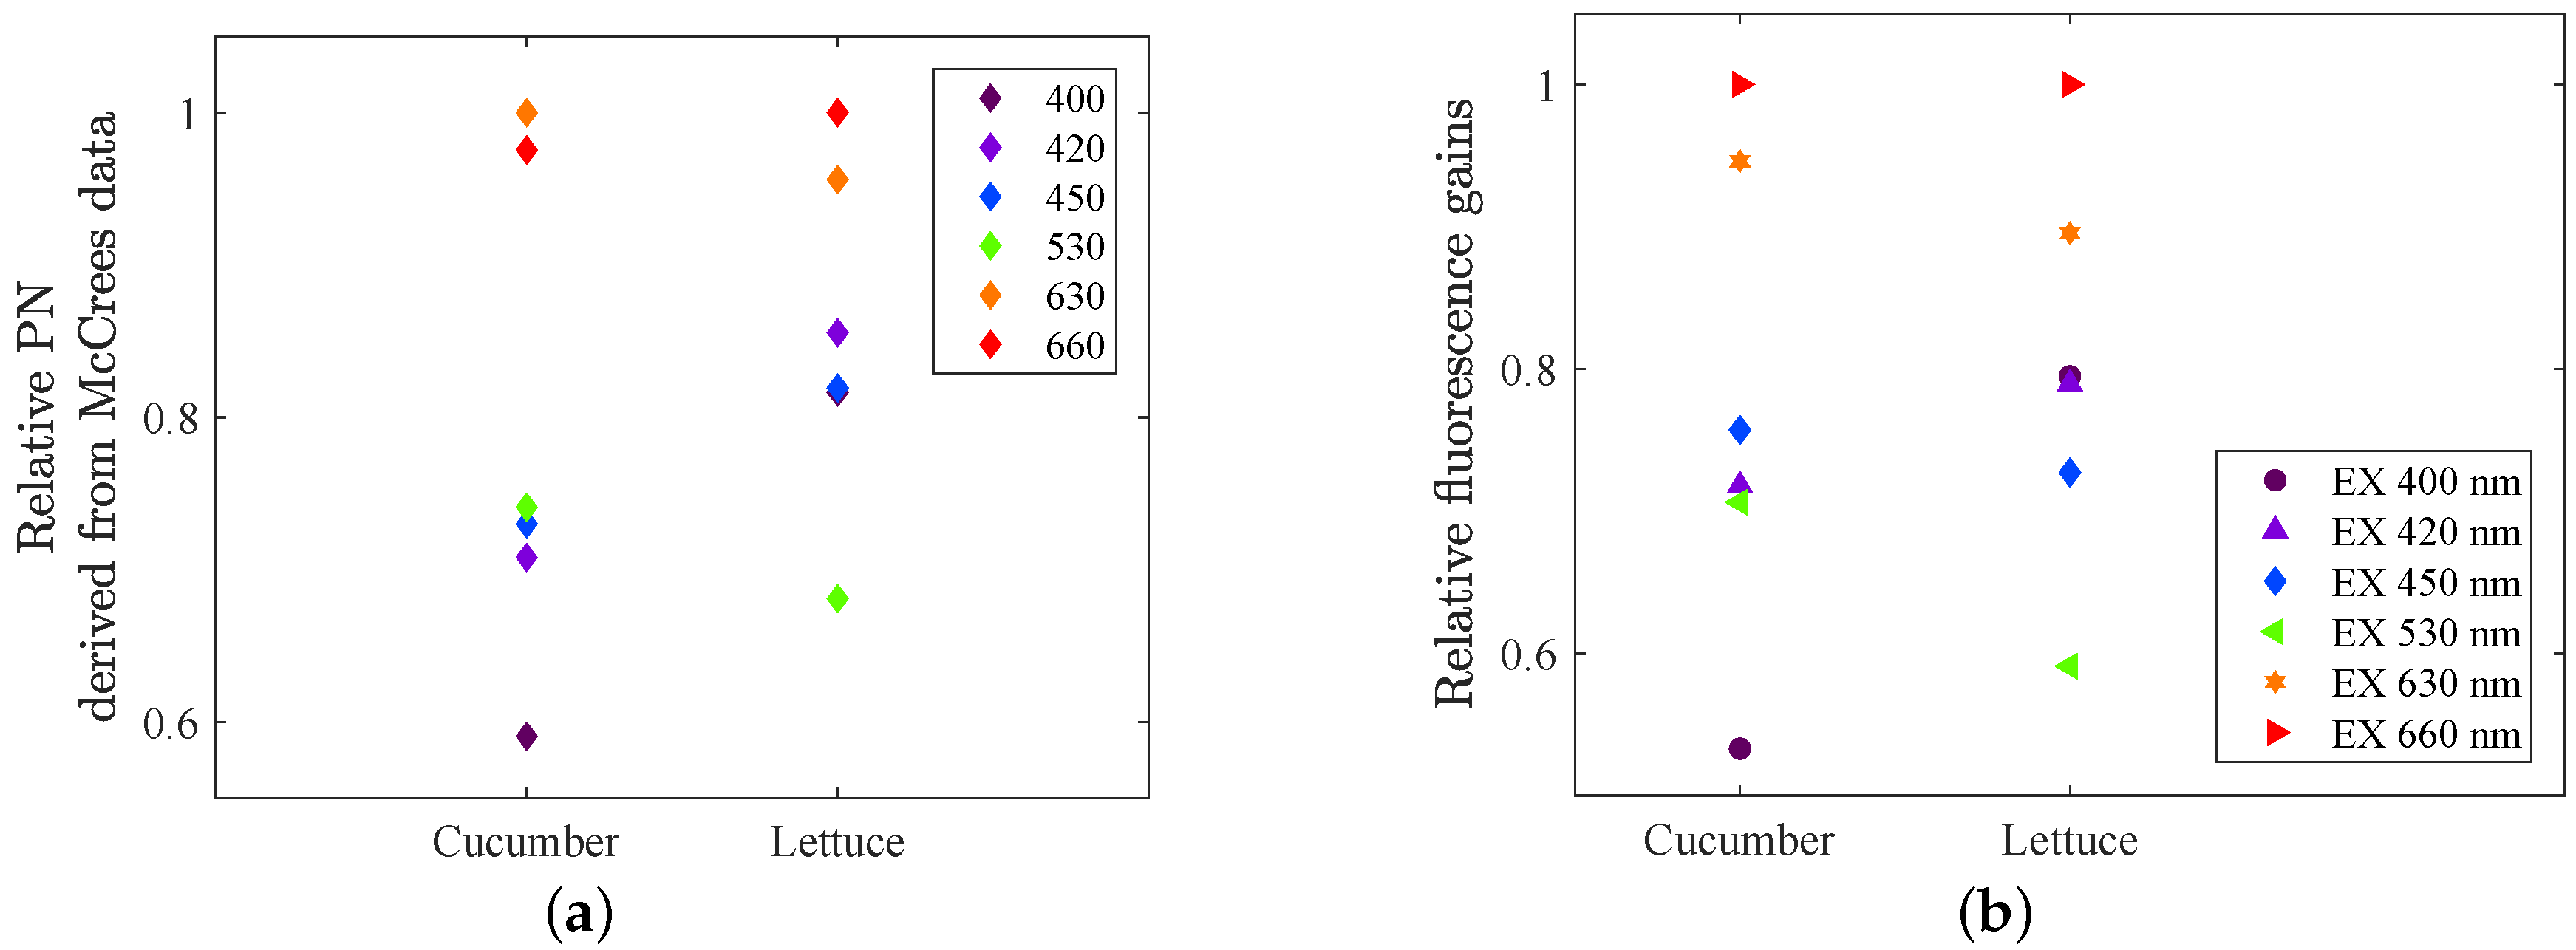
Figure 12b, is our experimentally measured fluorescence gains at the lowest background light that was used in this setup (160
), i.e., the mean values of the gain for each colour in
Figure 6a,b. It is remarkable how well these remotely measured steady-state fluorescence gains, caused by excitation of different colours, fit with the old photosynthetic rate data from McCree. This comparison also supports the assumption that the fluorescence gain for LED 660 is overestimated (see
Section 3.2.3).
3.4.2. Comparison with Dualex Measurements
The estimations of chlorophyll and flavonoid content, using Dualex Scientific’s Chl and Flv indices (relative measurement), showed that cucumber has a significantly higher concentrations of both pigments compared to lettuce; twice higher chlorophyll content (35.0 ± 7.0 vs. 16.5 ± 4.2) and three times higher flavonoid content (1.04 ± 0.24 vs. 0.36 ± 0.08). Notice, the instrument has not been calibrated, hence only relative values are reported.
Flavonoids are concentrated on the surface structures and tissues of plants (cuticle and epidermis) and exerts some of its protection functions by screening incoming light in the UV but also the blue-violet part of the spectrum [
27] the expected effect of a higher flavonoid content is a lower photosynthesis efficiency [
28]. The effect is likely most distinct for the wavelengths where the flavonoids have the highest absorbance [
27], it is expected to be highest for LED 400 and 420 in our experiment. Hence, the higher flavonoid content in cucumber could partly explain the lower fluorescence gains for LED 400 and somewhat also for LED 420, compared to the gains for lettuce.
A high photosynthetic rate for LED 630 and a low for LED 400 for cucumber (
Figure 9a), could be a indicator of the relation between the content of chlorophyll
a and
b, in favor for chlorophyll
b. The absorbtion spectrum for chlorophyll
b in solvent has two peaks, at approximately 450 nm and 640 nm [
29]. The absorbtion peaks for chlorophyll
a on the other hand are slightly shifted, to around 430 nm and 660 nm. The blue peak for chlorophyll
a is also essentially broader towards lower wavelengths, which means that chlorophyll
a absorbs a considerably higher amount of light from LED 400, in comparison to chlorophyll
b. Hence, a low photosynthetic rate gain for LED 400 together with a higher gain for LED 630 compared to LED 660, indicate that cucumber has a high content of chlorophyll
b compared to chlorophyll
a. However, it must be noted that the absorption in vivo and in a solvent differs [
15], partly due to vibrational energy and the fact that the pigments are tightly packed and orbitals of the molecules overlaps.
4. Conclusions
A series of experiments have been conducted in order to evaluate whether fluorescence gains (see Equation (
2)) could be used as feedback signals for energy optimising the spectrum of a LED lamp. The experiments did show a strong correlation between photosynthesis rate and steady state fluorescence even in the presence of background light, which entails the possibility of using the fluorescence gain as an indication of the strength of the photosynthetic rate. The advantage is that the fluorescence is measured remotely, on canopy level, fast and without moving the plants. However, the conducted experiments did not indicate that the mutual relation of the fluorescence gains would change depending on the background light quality. That means, in contrast to our working hypothesis, there is no need for an online controller to work continuously to find the optimal spectrum for a given incident intensity. On the other hand, the experiments showed that for increasing light intensities, the mutual relation of the fluorescence gains do slightly change. However, as the intensity increases from 500 to 1000
for cucumber, no further changes are obtained in the mutual relation of the fluorescence gains.
Due to the strong correlation between photosynthetic rate and fluorescence, and the fact that the mutual relation of the fluorescence gains are consistent at each incident intensity level, the fluorescence gains could be an interesting signal to monitor throughout the growth cycle. One possible application is to identify the light saturation level for photosynthesis, since the changes in the mutual relation of the fluorescence gains saturates at about the same intensity level as where light saturation for photosynthesis occurs. Another application, which is the aim of our further research, is to evaluate if changes in mutual relation of the fluorescence gains might be indication of an induced stress in the plant. Yet another application, is to use the current to the lamp as the input signal (instead of measured incident light quanta), and thereby detect if any specific LED group have degraded more than the others, and in such case reconsider the power distribution over the different LEDs.


