Technical Note

Evaluation of Terra-MODIS C6 and C6.1 Aerosol Products against Beijing, XiangHe, and Xinglong AERONET Sites in China during 2004-2014

1
School of Marine Sciences, Nanjing University of Information Science and Technology, Nanjing 210044, China
2
Key Laboratory of Digital Land and Resources, East China University of Technology, Nanchang 330013, China
3
Earth and Atmospheric Remote Sensing Lab (EARL), Department of Meteorology, COMSATS University Islamabad, Islamabad 45550, Pakistan
4
Department of Geography, School of Global Studies, University of Sussex, Brighton BN19RH, UK
5
Department of Geography, School of Earth Sciences, China University of Geosciences, Wuhan 430074, China
6
Department of Entomology, Plant Pathology and Weed Science, New Mexico State University (NMSU), Las Cruces, NM 88003, USA
7
School of Atmospheric Science at Nanjing University of Information Science and Technology, Nanjing 210044, China
8
Naval Research Laboratory, Monterey, CA 93943, USA
9
Institute of Methodologies for Environmental Analysis, CNR, 85050 Tito Scalo (PZ), Italy
10
Joint Center for Earth Systems Technology, University of Maryland Baltimore County, Baltimore, MD 21221, USA
*
Author to whom correspondence should be addressed.
Submission received: 24 December 2018 / Revised: 29 January 2019 / Accepted: 21 February 2019 / Published: 27 February 2019

Abstract

:
In this study, Terra-MODIS (Moderate Resolution Imaging Spectroradiometer) Collections 6 and 6.1 (C6 & C6.1) aerosol optical depth (AOD) retrievals with the recommended high-quality flag (QF = 3) were retrieved from Dark-Target (DT), Deep-Blue (DB) and merged DT and DB (DTB) level–2 AOD products for verification against Aerosol Robotic Network (AERONET) Version 3 Level 2.0 AOD data obtained from 2004–2014 for three sites located in the Beijing-Tianjin-Hebei (BTH) region. These are: Beijing, located over mixed bright urban surfaces, XiangHe located over suburban surfaces, and Xinglong located over hilly and vegetated surfaces. The AOD retrievals were also validated over different land-cover types defined by static monthly NDVI (Normalized Difference Vegetation Index) values obtained from the Terra-MODIS level-3 product (MOD13A3). These include non-vegetated surfaces (NVS, NDVI < 0.2), partially vegetated surfaces (PVS, 0.2 ≤ NDVI ≤ 0.3), moderately vegetated surfaces (MVS, 0.3 < NDVI < 0.5) and densely vegetated surfaces (DVS, NDVI ≥ 0.5). Results show that the DT, DB, and DTB-collocated retrievals achieve a high correlation coefficient of ~ 0.90–0.97, 0.89–0.95, and 0.86–0.95, respectively, with AERONET AOD. The DT C6 and C6.1 collocated retrievals were comparable at XiangHe and Xinglong, whereas at Beijing, the percentage of collocated retrievals within the expected error (↔EE) increased from 21.4% to 35.5%, the root mean square error (RMSE) decreased from 0.37 to 0.24, and the relative percent mean error (RPME) decreased from 49% to 27%. These results suggest significant relative improvement in the DT C6.1 product. The percentage of DB-collocated AOD retrievals ↔EE was greater than 70% at Beijing and Xinglong, whereas less than 66% was observed at XiangHe. Similar to DT AOD, DTB AOD retrievals performed well at XiangHe and Xinglong compared with Beijing. Regionally, DB C6 and C6.1-collocated retrievals performed better than DT and DTB in terms of good quality retrievals and relatively small errors. For diverse vegetated surfaces, DT-collocated retrievals reported small errors and good quality retrievals only for NVS and DVS, whereas larger errors were reported for PVS. MVS. DB contains good quality AOD retrievals over PVS, MVS, and DVS compared with NVS. DTB C6.1 collocated retrievals were better than C6 over NVS, PVS, and DVS. C6.1 is substantially improved overall, compared with C6 at local and regional scales, and over diverse vegetated surfaces.

Graphical Abstract

1. Introduction

Aerosol optical depth (AOD) is used for understanding the impact of aerosol on the Earth’s climate system [1], human health [2,3,4], atmospheric visibility [5], and air quality [6,7,8,9,10]. In order to perform continuous in-situ measurements of AOD, a large number of sun photometers have been deployed worldwide under the Aerosol Robotic Network (AERONET) [11,12], which provides AOD at relatively high spectral and temporal resolutions, though at specific point-based locations. Therefore, to expand upon this framework, global AOD observations are required for better understanding of aerosol distributions and their impacts on regional and larger scales.
The spatial distribution of AOD can be examined from passive radiometric satellite sensors, but the accuracy of AOD retrievals depends on instrument calibration, cloud screening fidelities, estimates of background surface reflectance, and available spectral aerosol models to support requisite radiance inversions [13]. Specifically, AOD over land can be obtained from space-borne sensors such as the AVHRR (Advanced Very High Resolution Radiometer) [14,15], SeaWiFS (Sea-viewing Wide Field of view Sensor) [16], MISR (Multiangle Imaging Spectroradiometer) [17,18], TOMS (Total Ozone Mapping Spectroradiometer) [19], OMI (Ozone Monitoring Instrument) [20], the MERIS (Medium Resolution Imaging Spectroradiometer) [21], the VIIRS (Visible Infrared Imaging Radiometer Suite) [22,23], and the MODIS (MODerate resolution Imaging Spectroradiometer) [24,25]. The accuracy of available land surface reflectance, however, mostly limits the application of over-land AOD retrievals compared with over water [25,26]. Improvements to over-land retrieval algorithms as a whole, therefore, are important to increase data availability globally.
MODIS, aboard the NASA Terra and Aqua satellites respectively, features over-land AOD retrievals globally based on the Dark-Target (DT) [25] and the Deep-Blue (DB) algorithms [24]. For DT, pixels for dense vegetated surfaces are selected for a top-of-atmosphere (TOA) reflectance between 0.01 and 0.25 and corrected for gaseous absorption at 500 m spatial resolution. The selected pixels are arranged in a retrieval window of 20 × 20 pixels (400 pixels) and screened for clouds, snow/ice, and other bright surfaces. The remaining pixels are separated from land and water surfaces, and the 50% brightest pixels and the 20% darkest pixels are discarded to perform aerosol retrievals. The newly-released Collection 6.1 (C6.1) DT AOD product features the following improvements/changes: (a) the quality of AOD retrievals is degraded to zero for greater than 50% (20%) of coastal pixels (water pixels) within the 20 × 20 pixel window of, and (b) surface reflectance ratios for urban areas are updated using the MOD09 surface reflectance product [26]. Improvements/changes for the DT C6.1 algorithm can be found at [27]. The expected error (EE) of the DT algorithm is ± (0.05 + 0.15 × AOD) [25], which represents about 66% of retrievals within EE on a global scale [28].
For DB, first the pixels are screened for clouds and snow/ice surfaces and the surface reflectance is estimated for the remaining pixels. Unlike DT, the DB algorithm retrieves AOD over dark as well as bright surfaces at a spatial resolution of 1 km and aggregates the retrievals at a spatial resolution of 10 km. The newly-released DB C6.1 AOD product features the following improvements/changes compared to C6: (a) artifact correction for heterogeneous terrain, (b) seasonal and regional aerosol models have been updated, (c) improvements have been made for the estimation of surface reflectance over elevated terrain, (d) metadata for Ångström Exponent have been updated, (e) updated EE, and (f) updated internal smoke detection masks. Improvements/changes for the DB C6.1 algorithm can be found at [27]. DB EE depends on geometry. That is, DB has different error characteristics, and the EE of DT is used in this study [24,29].
The MODIS C6 and C6.1 aerosol products include a merged DT and DB (DTB) AOD product for better spatial coverage of AOD over land (i.e., to include pixels from DT (DB) for areas where DB (DT) fails to retrieve) [25,30]. The DTB AOD product was developed using NDVI (Normalized Difference Vegetation Index ) thresholds (i.e., the DT [DB] AOD is selected for surfaces with NDVI > 0.3 [NDVI < 0.2], and for surfaces with NDVI between 0.2 and 0.3, an average of DB and DT AOD or AOD available either from DB or DT with recommended high-quality flag is selected) [25].
Beijing-Tianjin-Hebei (BTH) is the national capital and largest urbanized metropolis region in northern China. It undergoes severe air pollution events in the form of haze composed from fine particles and dust storms consisting of larger coarse particles. To control and monitor air pollution over this region, accurate spatio-temporal satellite observations are required. Therefore, the main objectives of the present study are to compare and validate the C6 and C6.1 DT, DB and DTB AOD products from 2004–2014 (i) over the three Aerosol Robotic Network (AERONET) sites located in Beijing-Tianjin-Hebei (BTH) region (Beijing, XiangHe, and Xinglong), to highlight the performance difference in C6.1 compared with C6, over (ii) diverse vegetated surfaces to understand the generation of DTB AOD product by the relative contributions of the DB and DT retrievals.

2. Data Sets

Terra-MODIS DT, DB, and DTB C6 and C6.1 aerosol products at 10 km spatial resolution for the BTH region from 2004 to 2014 were downloaded from “the Level-1 and Atmosphere Archive & Distribution System (LAADS) Distributed Active Archive Center (DAAC)”. The Terra-MODIS C6 level-three monthly NDVI product (MOD13A3) at 1 km resolution is used to define different land surface types. For the validation of the MOD04 AOD product, AERONET [11,12] cloud–screened and quality–assured (Version 3, Level 2.0) [31] data were downloaded from the AERONET website for three sites. Specifically, the Beijing site is located over mixed bright urban surfaces, the XiangHe site is located over suburban surfaces, and Xinglong is located over hilly and vegetated surfaces (Figure 1). AERONET provides measurements three-to-five times more accurate than satellite data [32] in seven channels (0.340–1.020μm) every 15 min with an uncertainty of ~0.01–0.02 [11] in the absence of thin cirrus cloud contamination [33]. AERONET data are available from Beijing, XiangHe, and Xinglong sites from March 2001 to June 2018, September 2004 to May 2017, and February 2006 to October 2014, respectively. A summary of the dataset is provided in Table 1.

3. Methodology

The performance of the Terra–MODIS DT, DB and DTB C6 and C6.1 AOD retrievals at 10 km spatial resolution is evaluated on a local scale against three AERONET stations located at urban (Beijing), suburban (XiangHe), and hilly and vegetated surfaces (Xinglong) for a period of 11 years (2004–2014). The step-by-step methodology is as follows: (i) DT AOD retrievals were obtained from the scientific data set (SDS) “Optical_Depth_Land_And_Ocean” containing the recommended high-quality flag (QF = 3) AOD retrievals over land, and the DB AOD retrievals were obtained from the SDS “Deep_Blue_Aerosol_Optical_Depth_550_Land_Best_Estimate” containing the recommended high-quality flag (QF ≥ 2). DTB AOD retrievals were obtained from the SDS “AOD_550_Dark_Target_Deep_Blue_Combined” and the recommended high-quality flag (QF = 3) AOD retrievals were filtered using the SDS “AOD_550_Dark_Target_Deep_Blue_Combined_QA_Flag”. (ii) DT, DB and DTB AOD retrievals were validated and compared by combining all available collocations for each AERONET site. (iii) The DT, DB, and DTB AOD retrievals were filtered according to the categorized four land surface types: non-vegetated surfaces (NVS, NDVI < 0.2), partially vegetated surfaces (PVS, 0.2 ≤ NDVI ≤ 0.3), moderately vegetated surfaces (MVS, 0.3 < NDVI < 0.5) and densely vegetated surfaces (DVS, NDVI ≥ 0.5) [27], as defined by MOD13A3 NDVI static values. The accuracy of the DTBC6 AOD retrievals can be improved by using dynamic values of NDVI Bilal and Nichol [34], but static NDVI values were used as the DTB product was developed using these values [25,30]. (iv) As AOD data at 550 nm were not available from AERONET measurements, an Ångström exponent 440–675 nm (α440–675) was used to interpolate AOD at 550 nm. (v) To increase the number of collocations and the temporal coverage of AOD retrievals, at least 2 out of 9 pixels were considered within a spatial window of 3 × 3 pixels centered on the AERONET site and at least two values of AERONET AOD were considered within ± 1hr of the Terra overpass. (vi) Errors in collocated AOD retrievals were reported using the relative percent mean error (RPME, Equation (1)), the root mean square error (RMSE, Equation (2)), and the expected error (EE, Equation (3)) of the DT algorithm over land, defined as
RPME = ( A O D ¯ ( M O D I S )   A O D ¯ ( A E R O N E T ) A O D ¯ ( A E R O N E T ) )   × 100
RMSE =   1 n i = 1 n ( AOD ( MODIS ) i   AOD ( AERONET ) i ) 2
EE =   ± ( 0.05 + 0.15 × A O D ( A E R O N E T ) )

4. Results and Discussion

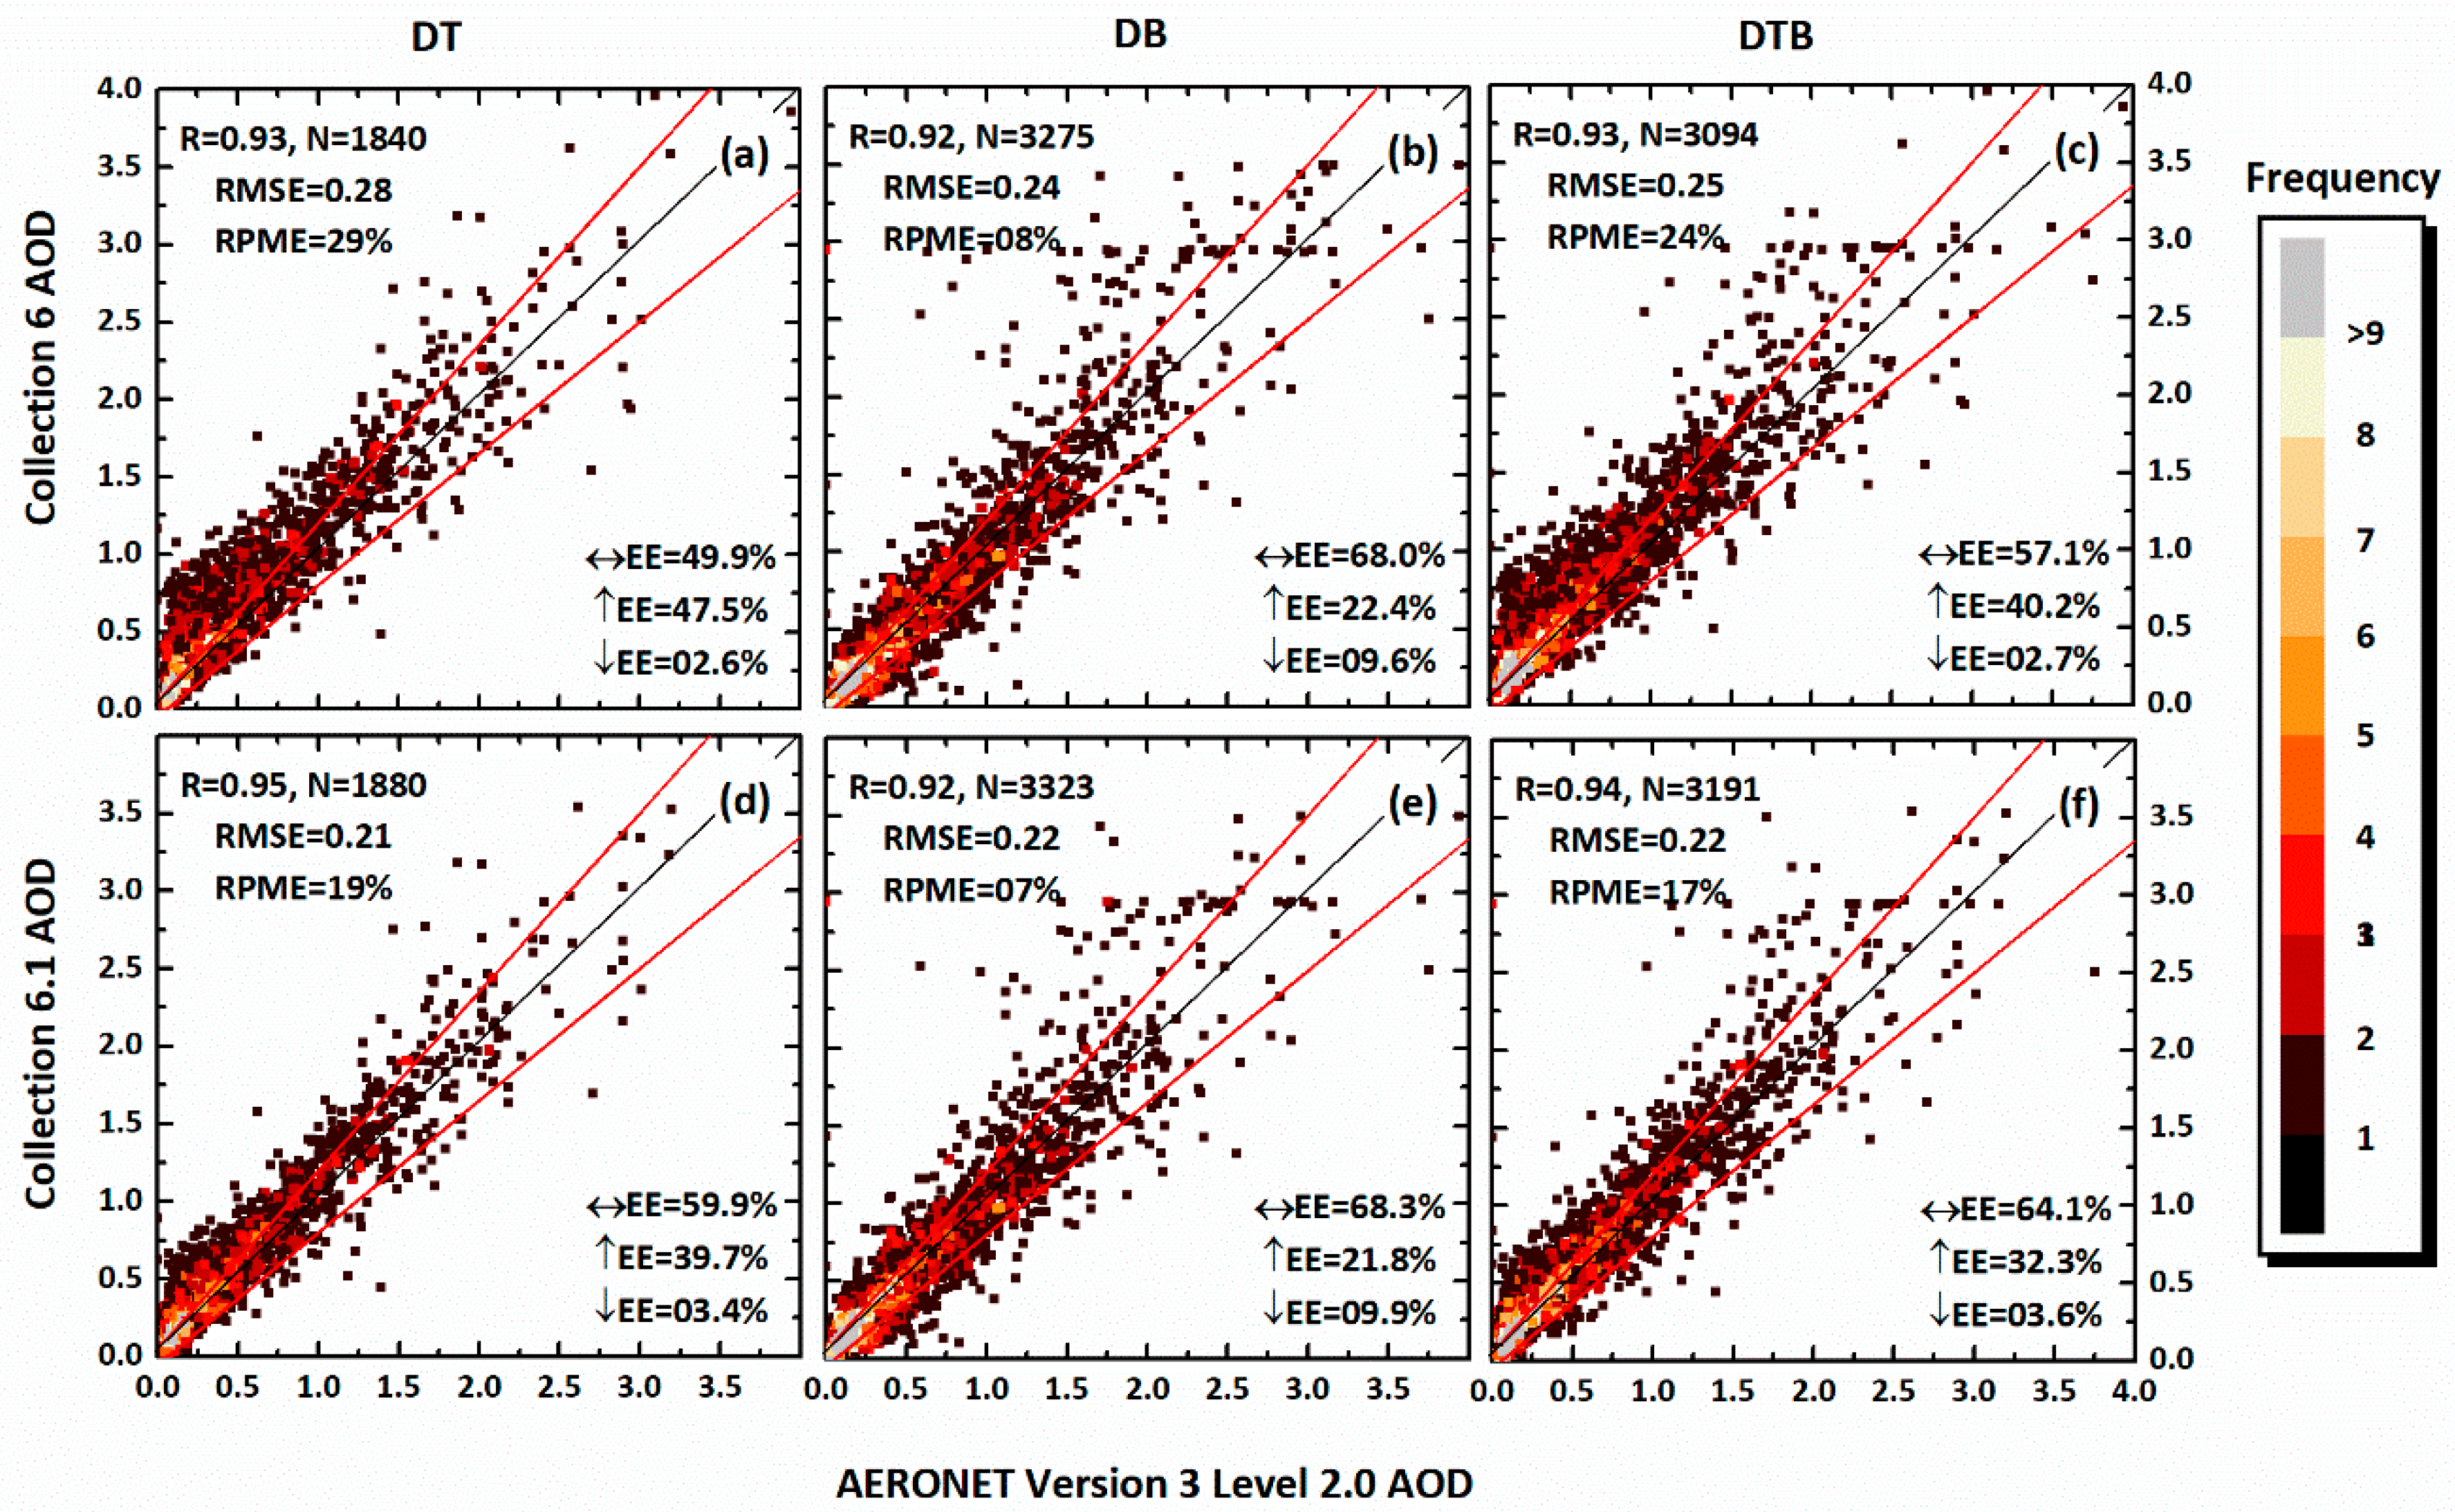
4.1. Validation of MODIS AOD Retrievals at Local Scale

In general, variance in the collocated AOD retrievals is mostly influenced by either the surface reflectance or the aerosol model used in the inversion process [9,35,36,37]. Variance during high aerosol loading events is usually due to an error in the aerosol scheme. In contrast, variance in AOD retrievals during low aerosol loading events are usually due to the error in the estimated surface reflectance [6,7,8,9,10,27,35,37,38,39,40,41,42,43,44,45,46]. High (low) agreement between satellite retrievals and AERONET AOD indicate that satellite retrievals follow (or do not follow) the aerosol variation as measured by the sun photometers [27].
For retrieval verification with AERONET, total numbers of DT C6 collocations were 721, 1060, and 60 for Beijing, XiangHe and Xinglong, respectively. Small numbers of collocations for the Xinglong site compared to the other two sites may be due to the limitation of the algorithm to retrieve AOD over the high elevated site (899 m above sea level), as a total of 909 AOD measurements were available within ± 1 h of the Terra overpass. In Figure 2, red lines represent the EE envelope and the black line represents the 1:1 line. Verification shows that the DT C6 AOD retrievals (Figure 2a–c) were correlated well with AOD measurements for each site, as the range of correlation coefficient (R) was between 0.90-0.96. This indicates that the DT algorithm has the ability to represent the aerosol variation measured by AERONET [27]. DT C6 AOD retrievals performed better over Xinglong and XiangHe, as 78.3% and 67.7% of the retrievals were within (↔) the EE compared with Beijing (↔EE = 21.4%), respectively.
Large errors were observed at Beijing, which might be due to the errors in the estimated surface reflectance and aerosol scheme during low and high aerosol loadings, respectively that led to 76% of the retrievals above (↑) the EE, RMSE of 0.37 and RPME of 49%. Similar results were reported by previous studies over the region [8,40,41]. Similar to C6, DT C6.1 performed better over Xinglong and XiangHe compared to Beijing. Modifications in DT C6.1 increased the percentage of retrievals ↔EE and reduced the RMSE and RPME. Specifically at Beijing, where the percentage of retrievals ↔EE increased from 21.4% to 35.5%, the percentage of retrievals ↑EE decreased from 76% to 60.4% and the RMSE and RPME decreased from 0.37 to 0.24 and from 49% to 27%, respectively. These relatively significant improvements at Beijing may be due to the modified surface reflectance ratios for urban areas based on the MODIS operational surface reflectance (MOD09) [26].
DB C6 and C6.1 AOD collocations were 75–108% and 101–144% greater than the DT C6 and C6.1, respectively. DB AOD retrievals performed well over Beijing and Xinglong sites, compared to XiangHe, in terms of larger percentage of retrievals ↔EE, a smaller percentage of retrievals ↑EE, and smaller RPME. In contrast, a large number of retrievals were below (↓) the EE at the Beijing and Xinglong sites compared to XiangHe. DB includes more collocations than DT over Xinglong, although DT is designed to retrieve AOD over such regional surface. Also, the number of collocations of DB C6.1 was greater than DB C6 over these hillier areas, which might be due to improved surface reflectance modeling for elevated terrain in C6.1. Significant improvements in DB C6.1 compared to C6 were not observed. Overall, the performance of C6 and C6.1 were comparable.
The numbers of collocations for DTB AOD retrievals (Figure 2m–r) were greater than DT (Figure 2a–f) but less than DB AOD. Similar statistics were reported by previous studies [27,39,42]. Similar to DT AOD, the performance of DTB retrievals was better over the Xinglong and XiangHe sites compared with Beijing, which was due to more contributions of DT retrievals in the DTB AOD dataset. At Beijing, a larger percentage of retrievals ↔EE, a smaller percentage of retrievals ↑EE, and small RMSE and RPME were found compared to DT AOD. This plausibly occurred due to relative contributions of the DB AOD retrievals (Figure 2g–l), as they performed better than DT AOD over this site. Modifications and improvements in DT and DB C6.1 increased the percentage of DTB AOD retrievals ↔EE from 48.1% to 60%, decreased the percentage of retrievals ↑EE from 49.2% to 36%, and reduced the RMSE and RPME from 0.28 to 0.23, and 31% to 18%, respectively at Beijing, though performance at the other sites was comparable with C6.

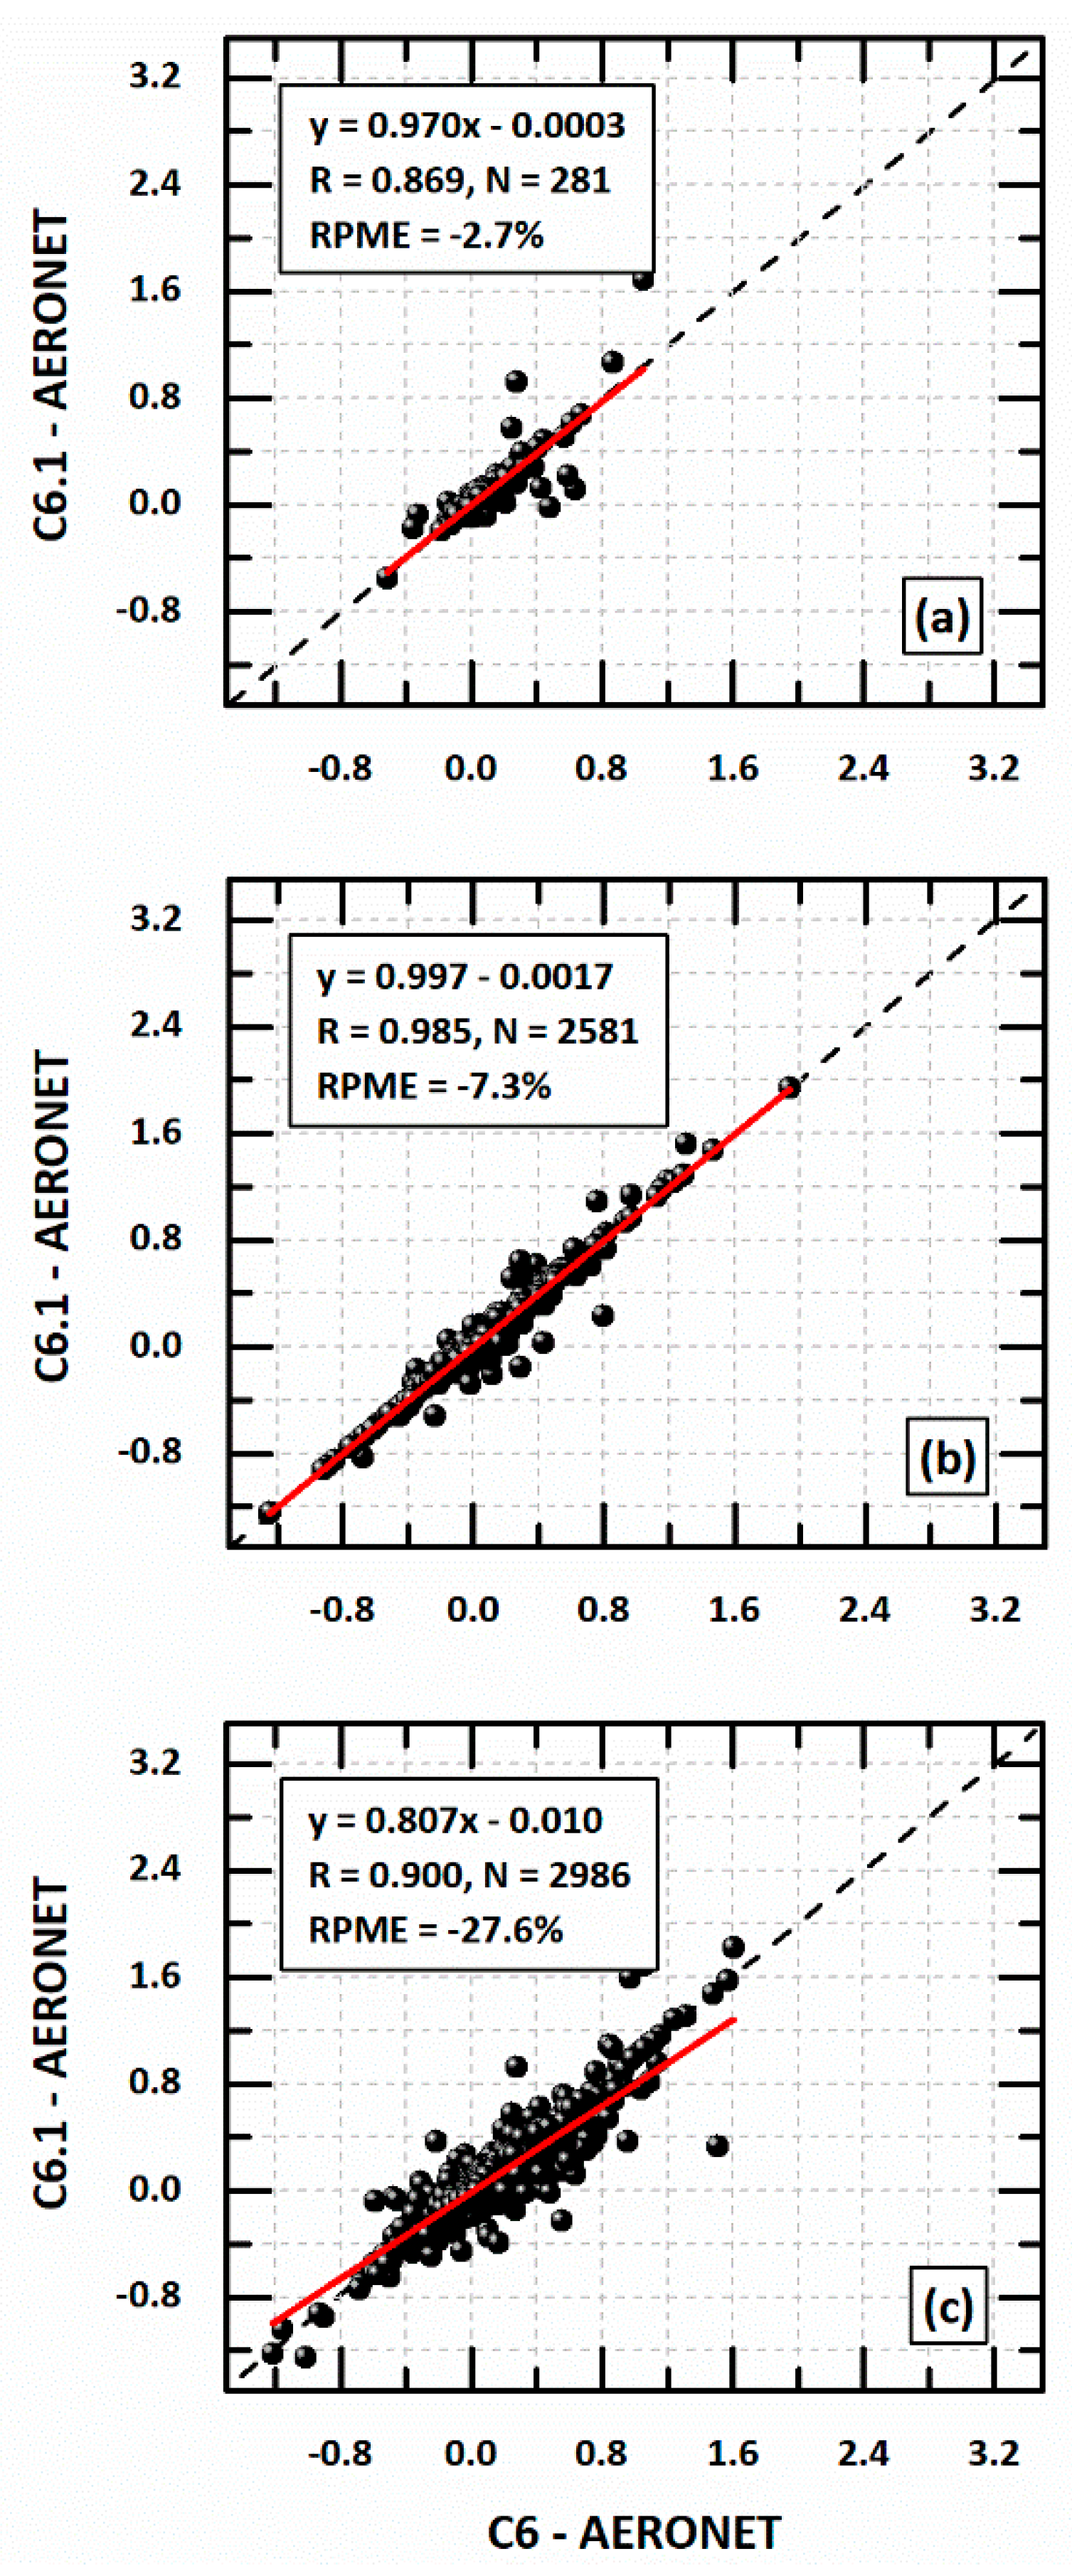
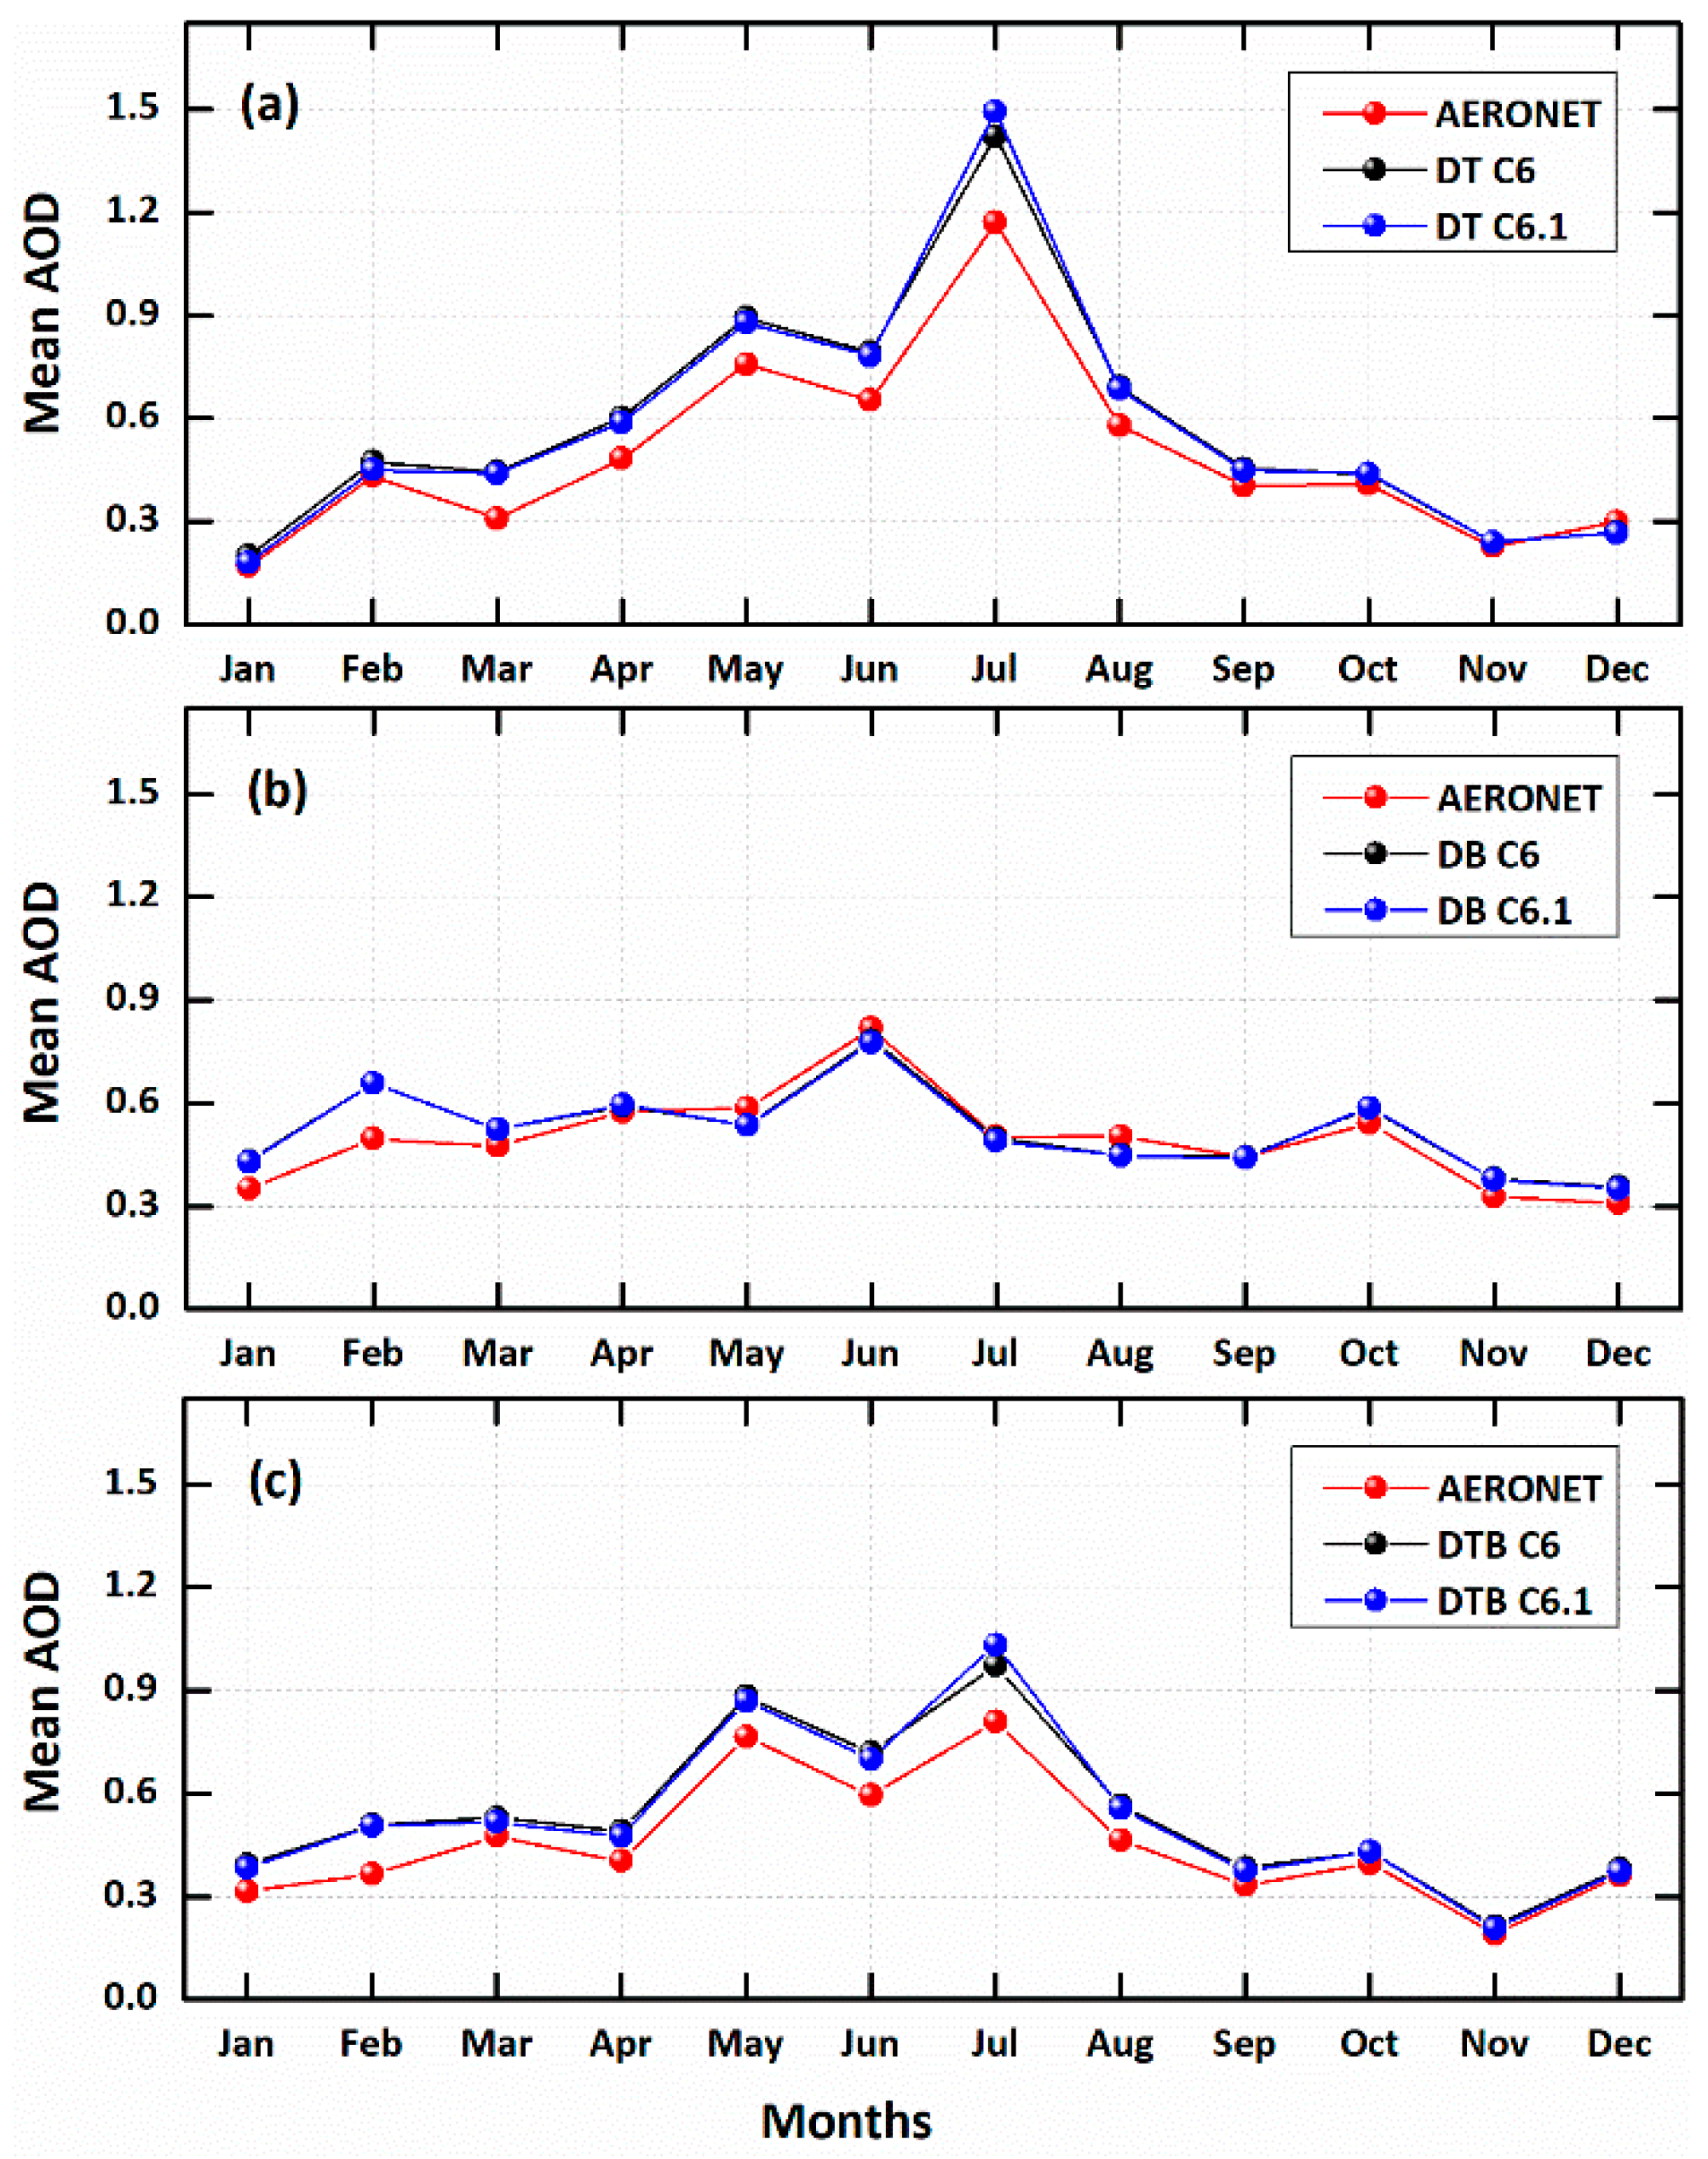
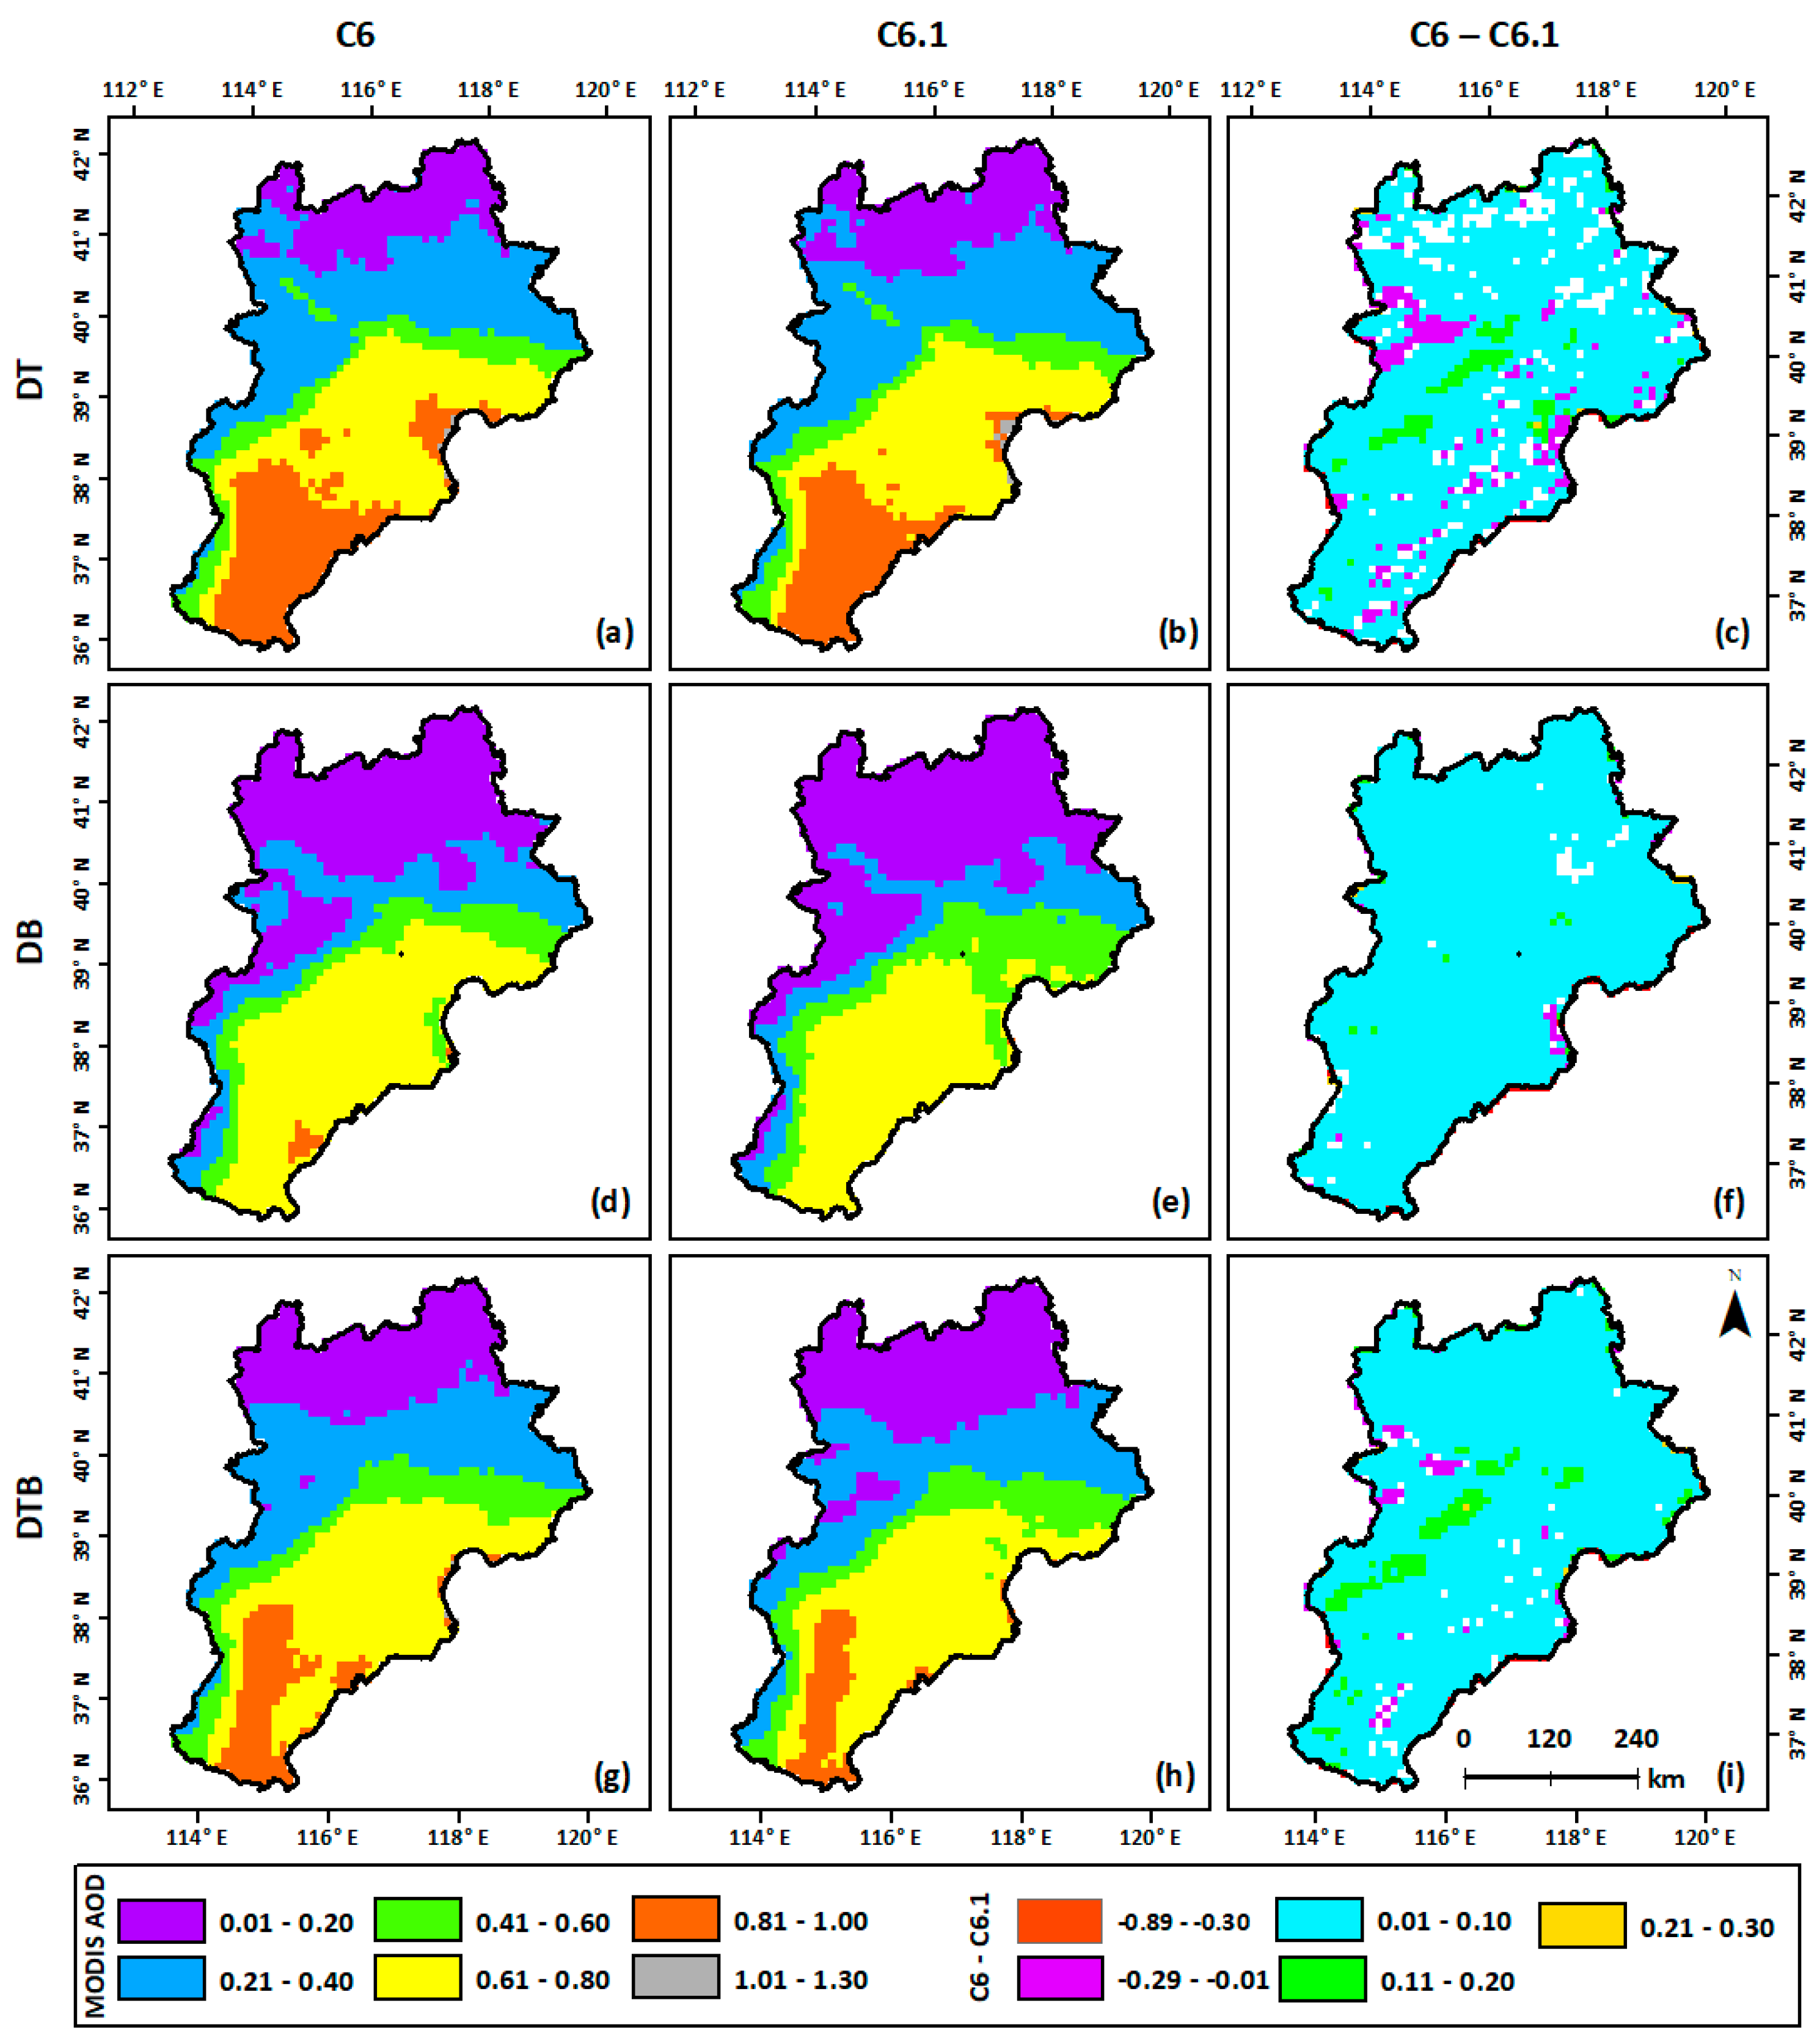
4.2. Evaluation of MODIS AOD Retrievals at Regional Scale

The MODIS DT, DB and DTB AODs from each site were combined together for regional verification (Figure 3). This exercise shows the high correlative agreement of 0.93 for the DT (Figure 3a,d) collocated AOD, which indicates that DT reproduces aerosol variation regionally. DT C6 and C6.1 have collocation totals and R, but improvements and modifications in C6.1 significantly improve AOD quality, as the percentage of retrievals (↑) ↔EE (decreased) increased from (47.5%) 49.9% to (39.7%) 59.9%, RMSE and RPME decreased from 0.28 to 0.21 and 29% to 19%, respectively, compared with C6. Overall, significant improvements and modifications are still required for DT to improve over BTH.
The number of DB C6.1 (C6) collocations was 77% (80%) greater than DT C6.1 (C6) at the regional scale. Similar to DT, the DB algorithm has the ability to follow the actual variation in aerosol concentrations as measured by AERONET, as R between the DB AOD retrievals and AERONET AOD measurements was > 0.90. The DB AOD has a large percentage of retrievals ↔EE and small RPME compared with DT AOD over BTH. Overall, the performance of DB AOD was reasonable, as 68% of the retrievals fell ↔EE. However, no significant improvements were observed in C6.1 compared with C6.
Similar to the local scale, DTB AOD retrievals (Figure 3c,f) were greater in numbers than DT AOD (Figure 3a,c), but less than DB AOD (Figure 3b,d). DTB AOD were more influenced by the DT AOD than DB AOD, as the correlation coefficient, the percentage of retrievals ↓, ↑, and ↔EE, RMSE, and RPME were comparable with DT AOD at the regional scale. Overall, the performance of DTB AOD was poor compared with DB AOD, and this can be improved by considering more DB AOD retrievals in DTB as suggested by our previous studies [27,39,42].
Figure 4 shows differencing scatter plots between C6 – AEORNET and C6.1 – AERONET for DT- (Figure 4a), DB- (Figure 4b) and DTB- collocated (Figure 4c) AOD observations to determine the exact temporal differences between C6 and C6.1 AOD. For this purpose, an equal number of C6 and C6.1-collocated AOD observations for the same time and site were obtained. Results show that differences between C6 – AEROENT and C6.1 – AERONET for DB were well correlated with each other, as the correlation (R ~ 0.99) was higher than DT (R ~ 0.87) and DTB (R ~ 0.90) AOD differences. Negative values of RPME suggest that DT, DB, and DTB C6.1 AOD have 2.7%, 7.3%, and 27.6%, respectively, less error compared with C6 AOD. Overall, these results suggest that the DB C6 and C6.1 AOD were comparable over the region due to high values of R, a slope close to 1 (0.997) and small RPME, compared to DT and DTB AOD. Further, significant differences were observed between DTB C6 and C6.1 AOD in terms of RPME.
In order to evaluate the temporal performance of the AOD products against AERONET over BTH, collocated AOD observations from AERONET and MODIS were averaged for each month from 2004–-2014 (Figure 5). Results show different temporal trends of DT (Figure 5a) and DB (Figure 5b) AOD over the region. High DT and DB AOD were observed in July and June, respectively, which might be due to different numbers of collocated observations of DT and DB for each month. No significant improvements in DT and DB C6.1 were observed on a monthly basis compared with C6, as monthly averaged observations were the same for both datasets. In the case for DT, AOD was overestimated for C6 and C6.1 from March to October compared with AERONET. Whereas, for DB, AOD from both collections was overestimated from October to March, compared to AERONET. Figure 5c shows that the DTB AOD have the same temporal trend as DT from April to October and the same trend as DB from October to March due to more contributions from the respective DT and DB retrievals. Similar results were reported in a previous study [34]. Overall, the DB AOD retrievals performed better and compared more favorably with AERONET measurements in terms of small RPME (C6 = 5.3, C6.1 = 4.8), compared to DT (C6 = 17.5, C6.1 = 17.0) and DTB (C6 = 18.3, C6.1 = 17.5) AOD.
C6 and C6.1 AOD were also compared spatially over BTH as seen in Figure 6. For this purpose, daily AOD retrievals from 2004 to 2014 were averaged for each collection and product. Distinct layers of AOD were observed over the region (Figure 6) and AOD varied from north to south (hilly to urban areas). The DT algorithm retrieved high AOD compared to DB, which contributed to the DTB AOD retrievals over this region. Similar findings were observed in the previous section and other studies [27,39]. Overall, the range of differences between C6 and C6.1 was found from −0.89 to 0.30, and large differences were observed between DT and DTB C6 and C6.1 AOD over certain areas compared to DB AOD. These results suggest that DB C6 and C6.1 AOD retrievals exhibit the same spatial pattern and values compared to DT and DTB AOD.
In order to evaluate DT and DB AOD over different land surfaces and understand their relative contributions to DTB AOD, each as validated over diverse vegetated surfaces (Figure 7) defined by NDVI: non-vegetated surfaces (NVS, NDVI < 0.2), partially-vegetated surfaces (PVS, 0.2 ≤ NDVI ≤ 0.3), moderately-vegetated surfaces (MVS, 0.3 < NDVI < 0.5) and densely-vegetated surfaces (DVS, NDVI ≥ 0.5) [27]. For DT C6.1 (C6), the 52 (65), 535 (503), 981 (961), and 312 (311) collocations were available for NVS, PVS, MVS, and DVS, respectively. The RMSE (RPME) of DT C6.1 AOD was reduced from 0.12 (22%) to 0.09 (19%) for NVS, 0.28 (50%) to 0.17 (25%) for PVS, and 0.30 (28%) to 0.23 (19%) for MVS, and no significant improvements were observed for DVS. DT C6 and C6.1 collocated retrievals did not fulfill the requirements of EE for PVS and MVS, as the percentage of retrievals ↔EE was less than 66% [28]. Relatively good performance from the DT algorithm was in fact expected, as it was designed and developed to retrieve accurate AOD for vegetated surfaces. Only DT AOD was considered in DTB for MVS, which introduced the same errors as observed in DT as shown in Figure 7s,w. Overall, the improvements observed in C6.1 compared to C6 were mainly due to the modified estimated surface reflectance.
The numbers of DB collocations were greater in numbers than DT for all types of surfaces except DVS, where they were comparable. In general, it is expected that the DB algorithm performs better for NVS than PVS, MVS, and DVS, and the DT algorithm exhibits better performance over vegetated surfaces than DB. Based on this concept, DB AOD retrievals were ignored in DTB over surfaces where NDVI > 0.3, and only considered over the surfaces where 0.3 < NDVI [25,27,30,34,39,42]. However, this study found that the performance and accuracy of DB- collocated retrievals were good over PVS, MVS and DVS compared to NVS (Figure 7i–p) in terms of (small) large percentages of retrievals (↑) ↔EE, and small RMSE and RPME. The DB AOD retrievals were also better than DT-collocated retrievals for NDVI > 0.2 surfaces. In contrast, the DT AOD performance was better than DB AOD for NDVI < 0.2 surfaces in terms of large (small) percentage of retrievals ↔ (↑)EE, and small RMSE, though they are in small numbers. Similar to our previous studies [27,39,42], this study also suggests that to improve the quality for DTB, DT AOD can be included in the DTB product for NDVI < 0.2 and DB AOD can be included for NDVI > 0.3 surfaces, as these retrievals were ignored in DTB [25]. Improvements/changes in the DB C6.1 algorithm did not show significant improvements, as C6- (Figure 7i–l) and C6.1- (Figure 7m–p) collocated retrievals were comparable for all surfaces.
DTB AOD retrievals for NVS and MVS should be the same as DB and DT AOD retrievals, respectively, but a mismatch was found. This might be due to using different NDVI data. This study used the monthly NDVI L3 operational product, whereas NDVI climatological data were used for the generation of DTB AOD retrievals [25,30]. The performance of the DTB AOD over NVS, and MVS and DVS was almost the same as DB and DT AOD, respectively, which was expected. For these surfaces, only DB and DT AOD were considered, respectively. However, DTB AOD performance over PVS was much better than DT AOD due to more contributions of DB. DTB AOD performance over NVS, and MVS and DVS can thus be improved by considering DT and DB AOD, respectively [27,39]. Overall, the DTB C6.1 AOD retrievals were better than C6 due to modifications and improvements in the respective retrievals.
Figure 8 shows a trend in the percentage of AOD retrievals ↔EE, RMSE, and RPME over diverse vegetated surfaces. Over NVS (NDVI < 0.2), the statistical performance of DT C6 and C6.1 was better than DB and DTB in terms of a larger percentage of retrievals ↔EE, and a very small RMSE, though RPME is comparable for all retrievals. The reasonable performance of DT suggests that the surface reflectance scheme used in the inversion works well over NVS. Over PVS (0.2 ≤ NDVI ≤ 0.3), DT C6 retrievals performed poorly compared with other retrievals for all of the statistical parameters, and this might be due to the underestimation in the estimated surface reflectance and error in the aerosol scheme as can be seen in Figure 7. DT performance was improved in C6.1 compared to C6, likely due to the modified surface reflectance scheme. However, it was still worst compared with DB.
Over MVS (0.3 < NDVI < 0.5) and DVS (DVS, NDVI ≥ 0.5), statistical performance of DB C6 and C6.1 was better than the DTB retrievals in terms of the larger percentage of retrievals ↔EE and a very small RPME, though RMSE was comparable with DT. Overall, the statistical performance of DT C6 showed its worst results over PVS and MVS, which might be due to errors in the estimated surfaces reflectance. The new modified surface reflectance scheme introduced in the DT C6.1 has likely improved such performance. These results suggest that DT-collocated AOD were good for surfaces with NDVI < 0.2 and DB-collocated AOD were good for surfaces with NDVI > 0.3, and that these retrievals can be considered in the DTB combined AOD product to improve overall performance.

5. Conclusions

The primary objective of this study is to verify and compare Terra-MODIS Collection (C6) and C6.1 Dark-Target (DT), Deep-Blue (DB) and merged DTB AOD retrievals versus AERONET sun photometer AOD derived over mixed urban surfaces (Beijing), suburban surfaces (XiangHe) and hilly and vegetated surfaces (Xinglong). For this, high-quality assurance flag MODIS AOD retrievals were obtained from 2004–2014. These retrievals were also validated and compared over diverse land surface types, including non-vegetated surfaces (NVS, NDVI < 0.2), partially vegetated surfaces (PVS, 0.2 ≤ NDVI ≤ 0.3), moderately vegetated surfaces (MVS, 0.3 < NDVI < 0.5) and densely vegetated surfaces (DVS, NDVI ≥ 0.5), as categorized by static values of monthly NDVI obtained from the Terra-MODIS L3 monthly NDVI product (MOD13A3 C6). The main outcomes of this research are:
(1)
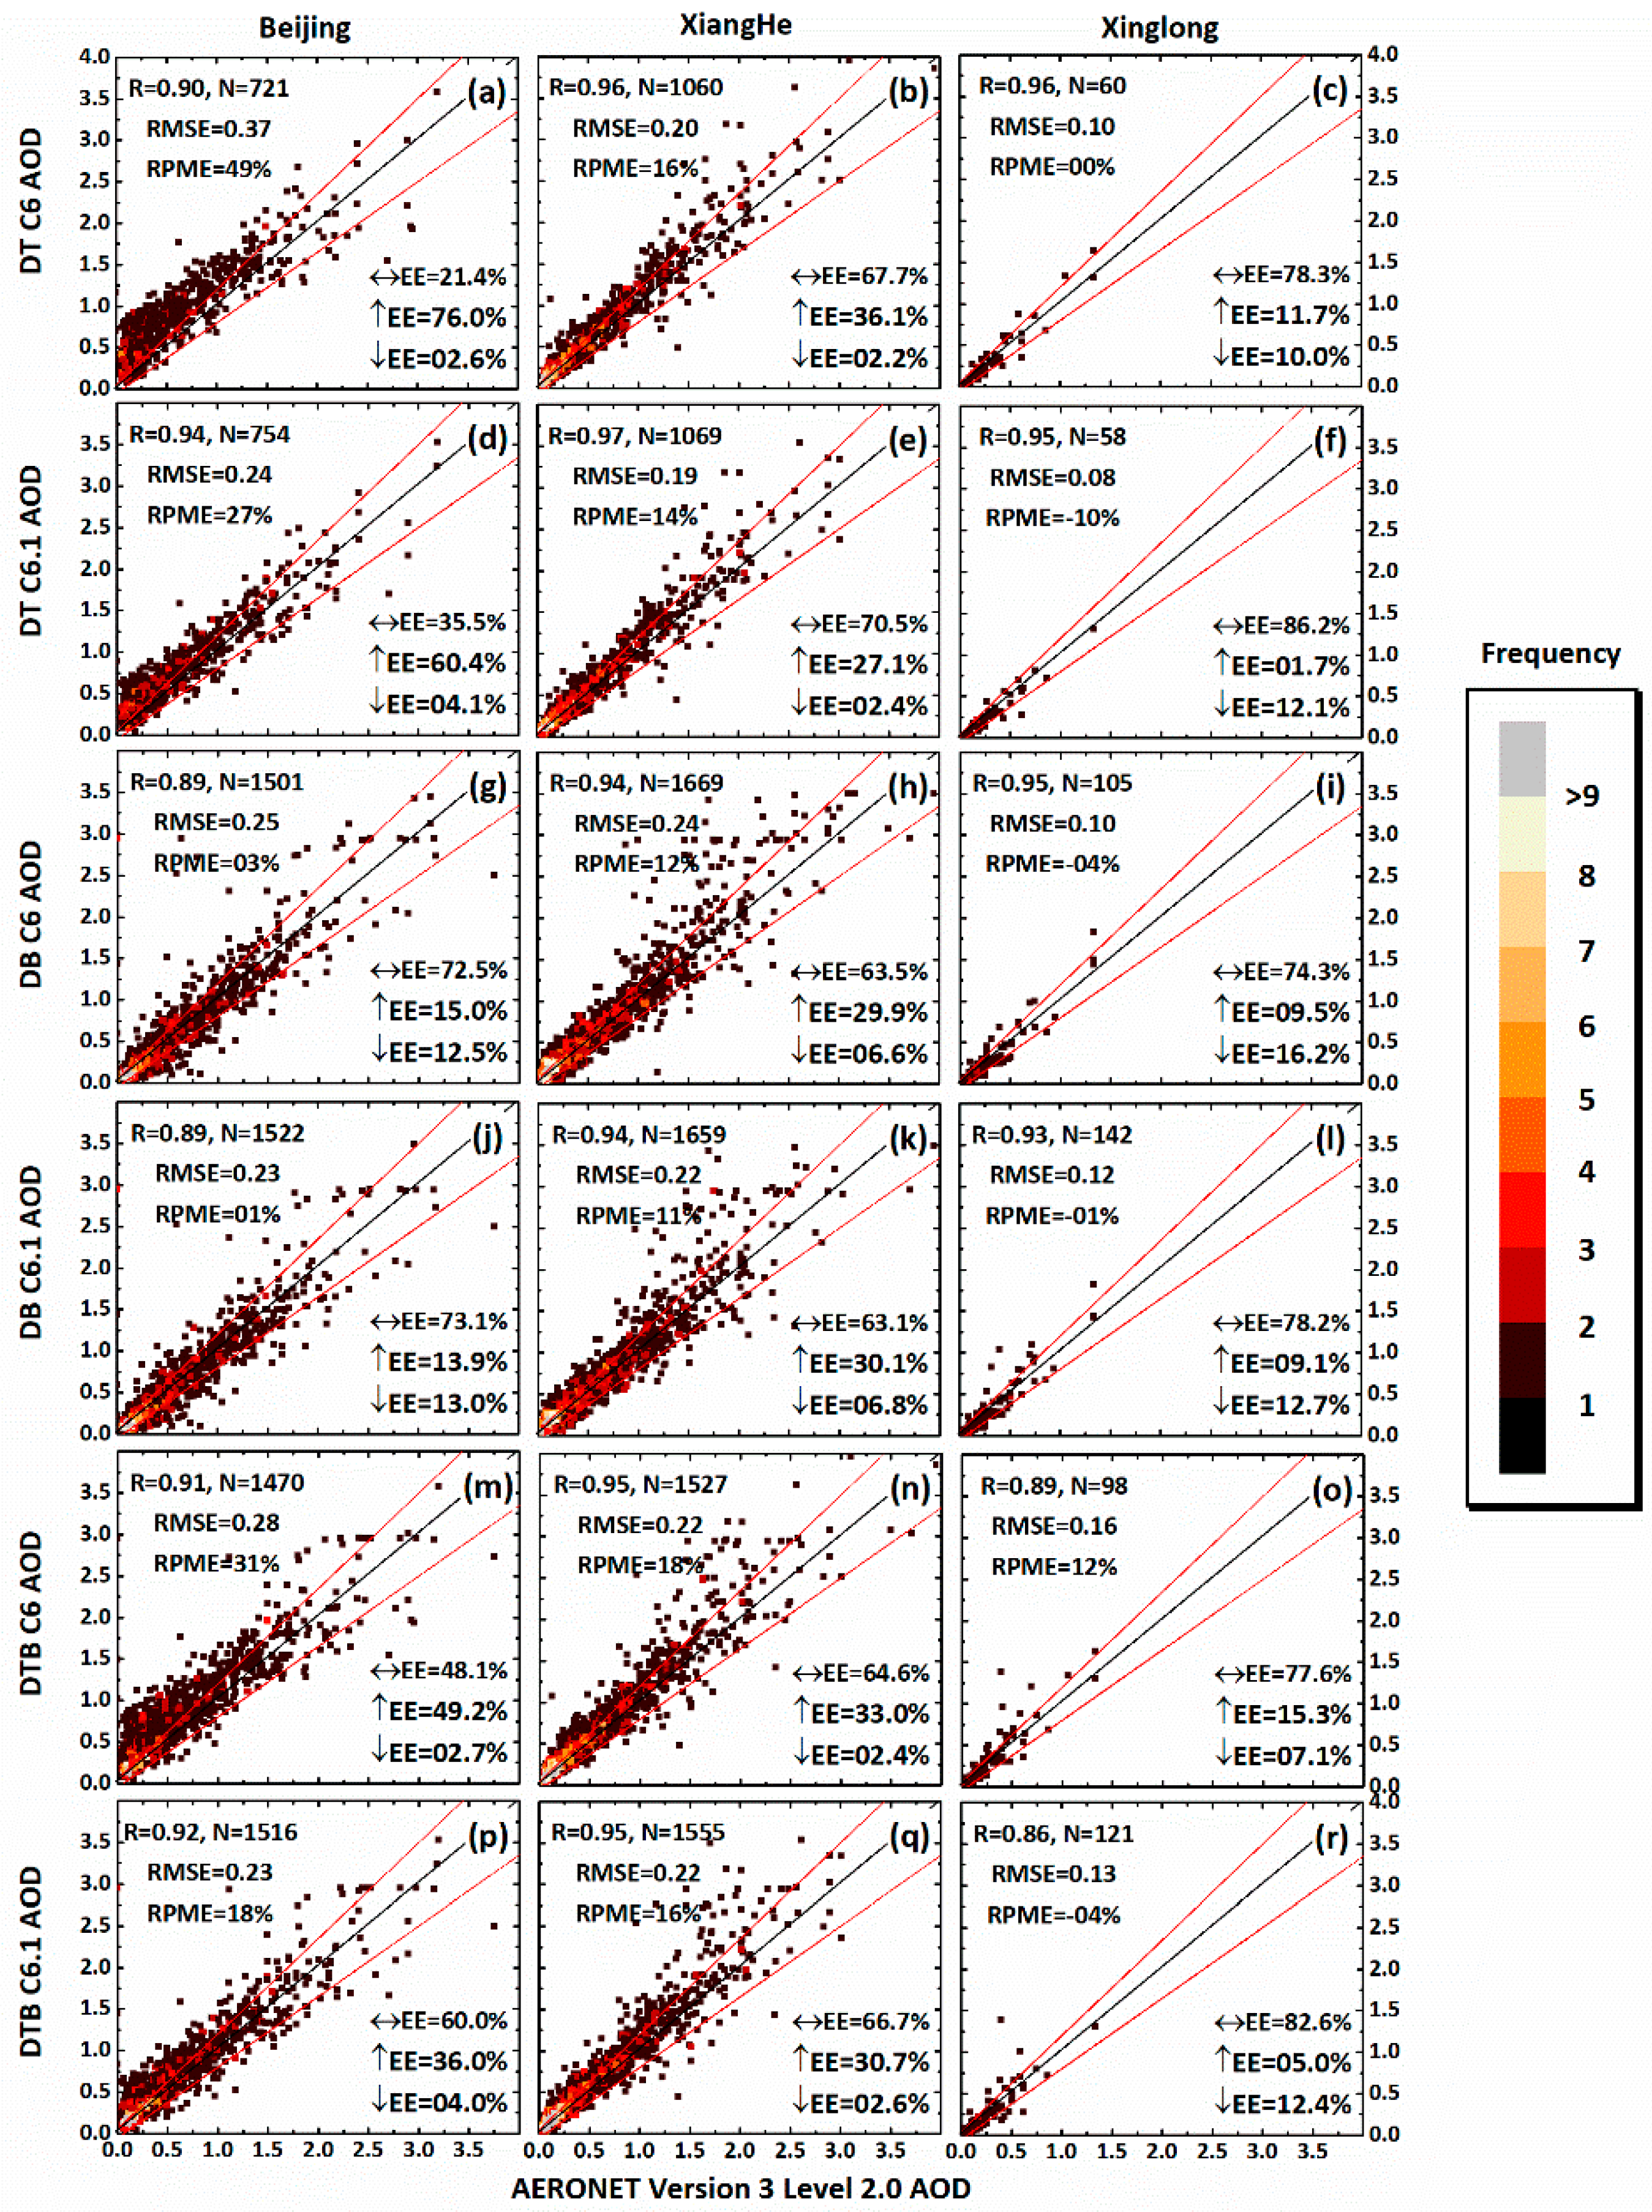
DT, DB, and DTB C6 and C6.1 collocated AOD retrievals correlated well with AERONET AOD measurements at the three designated sites.
(2)
DT C6.1 collocated AOD retrievals were better than C6 due to use of modified surface reflectance ratios, and, overall, both had a large error at Beijing.
(3)
DB has more collocations than DT over Xinglong, although DT is designed to retrieve AOD over these surfaces.
(4)
DB C6 and C6.1 AOD retrievals performed equally, as no significant changes in DB C6.1 compared to C6 were observed.
(5)
The percentage of DTB-collocated AOD retrievals ↔EE increased, and the RMSE and RPME decreased due to improvements/changes in the DT C6.1 at Beijing.
(6)
At the regional scale, DB C6 and C6.1 AOD retrievals performed better than DT and DTB C6 and C6.1 AOD.
(7)
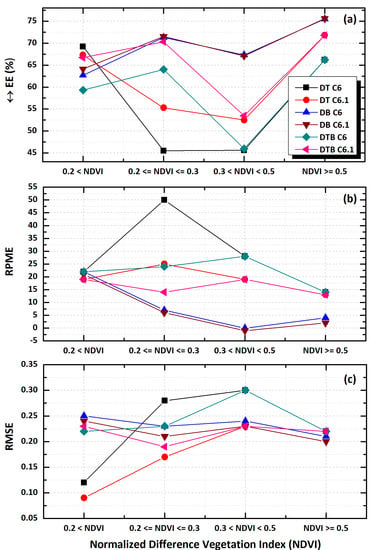
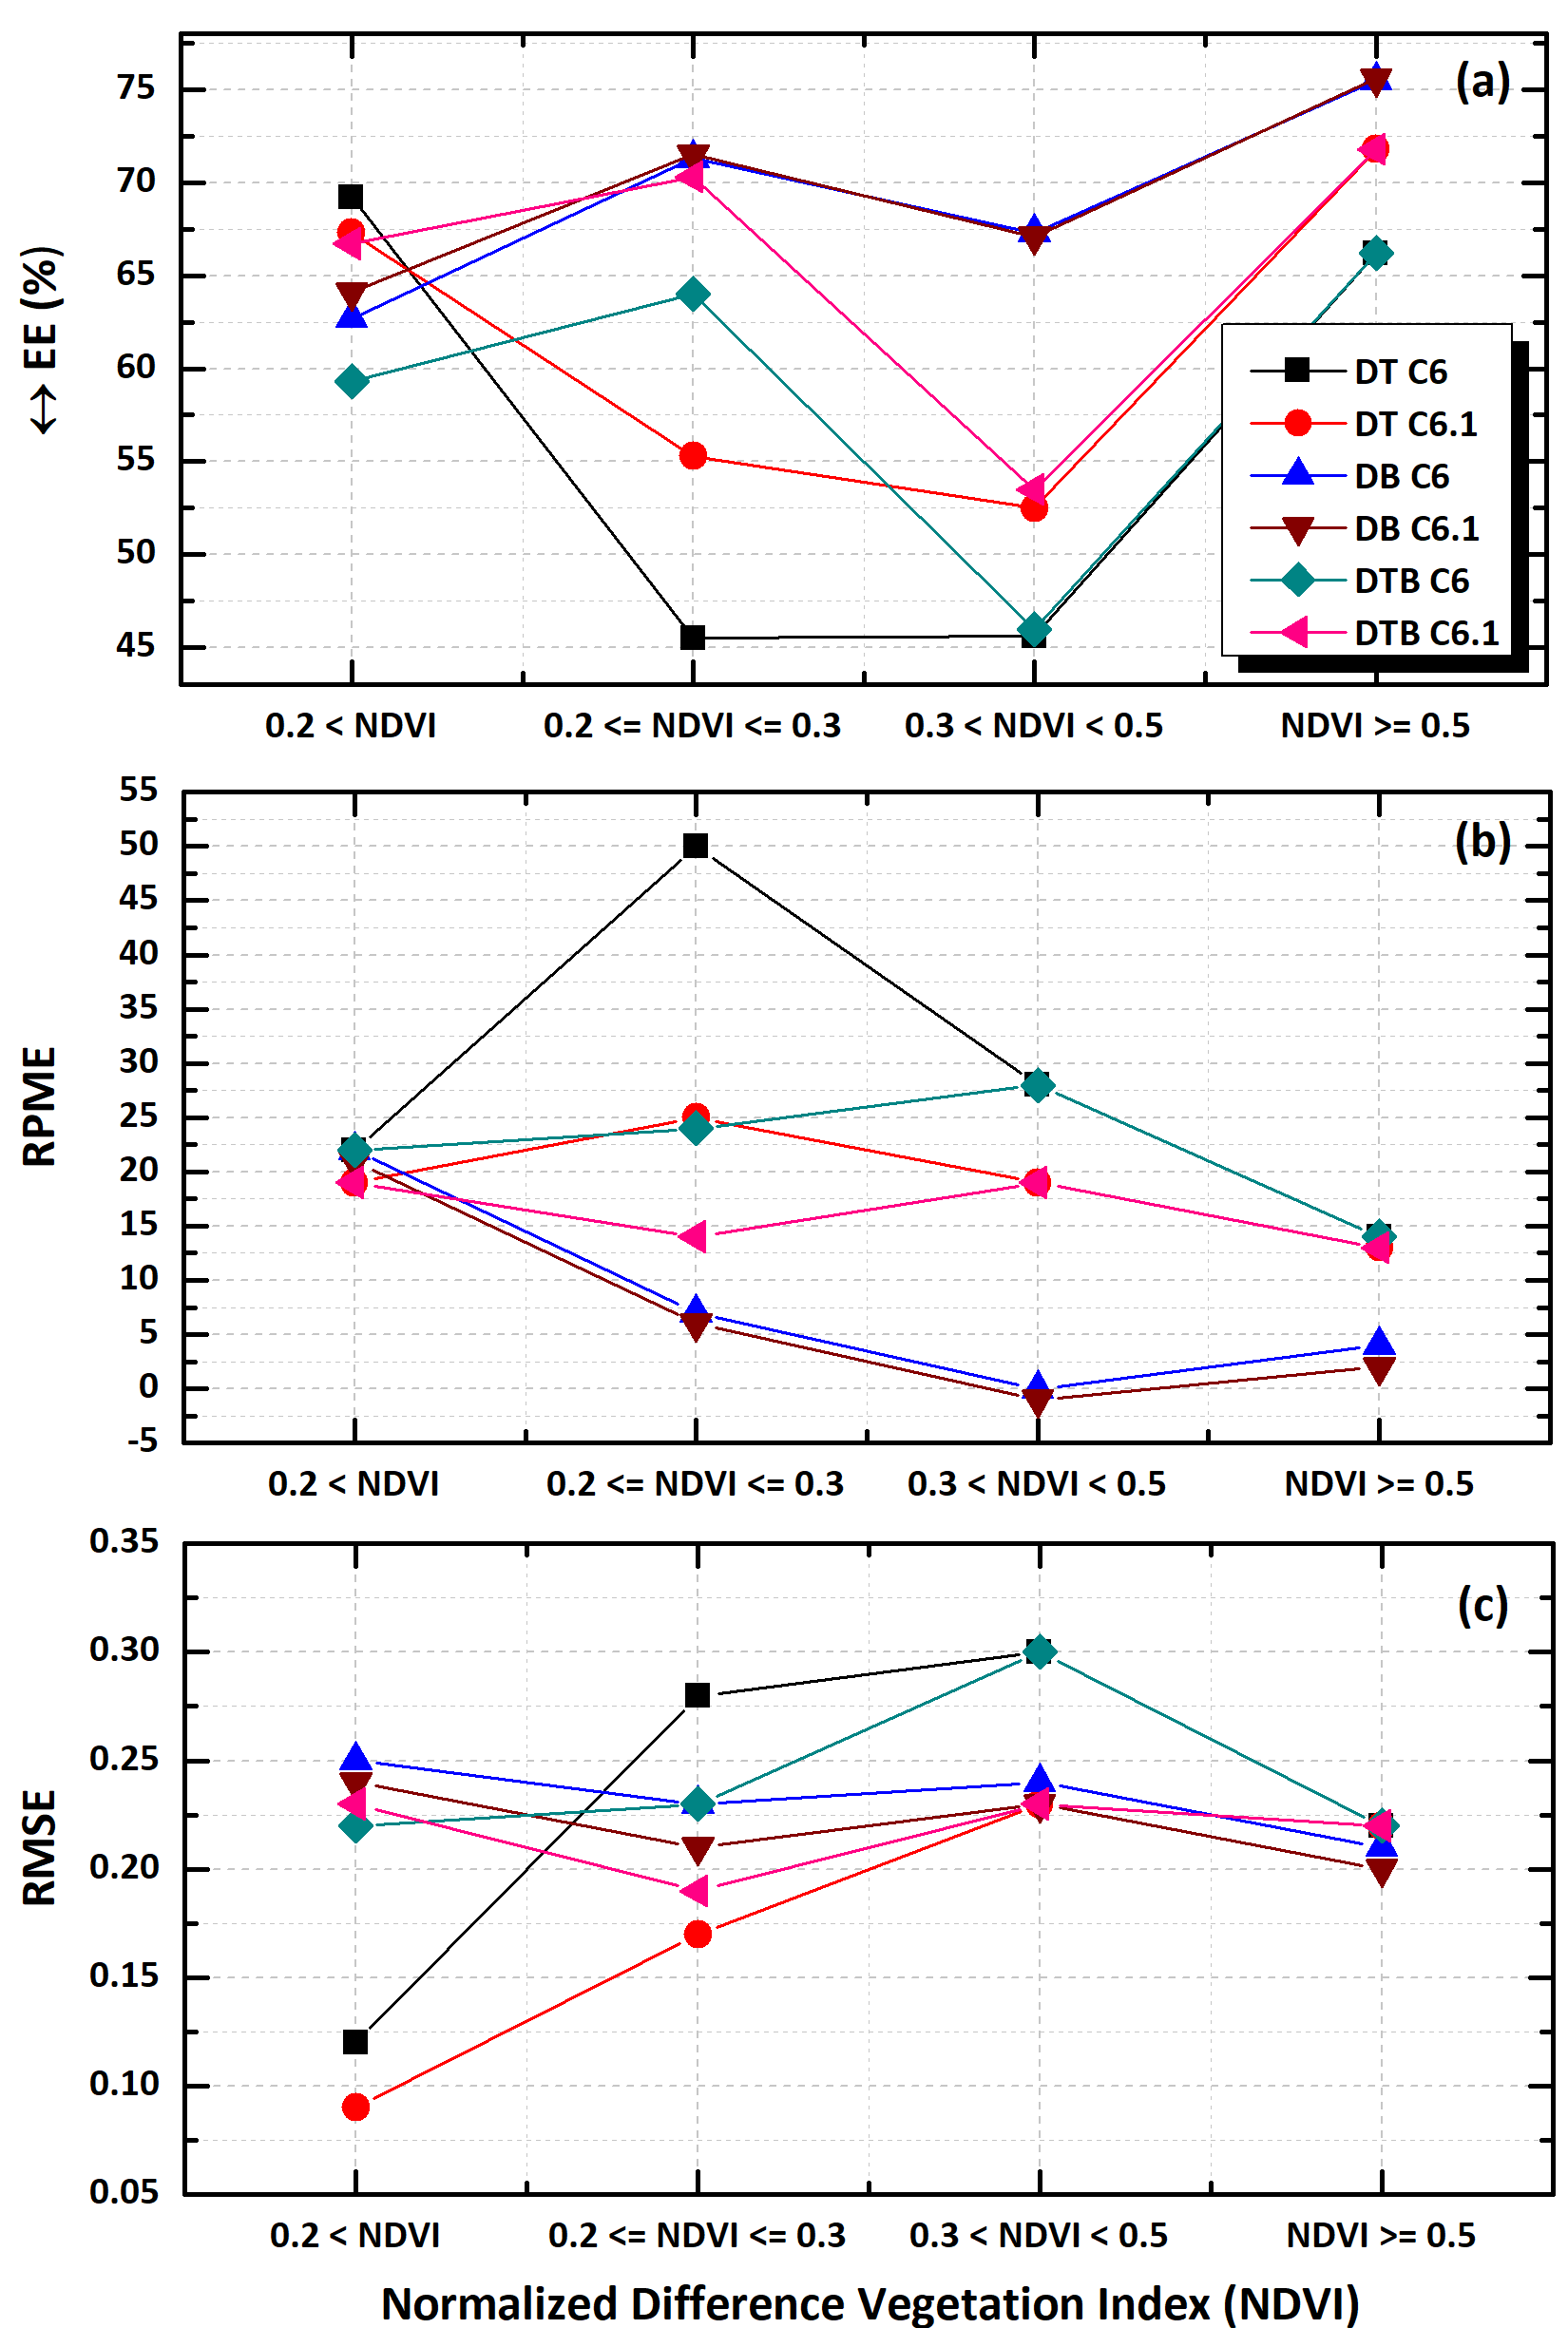
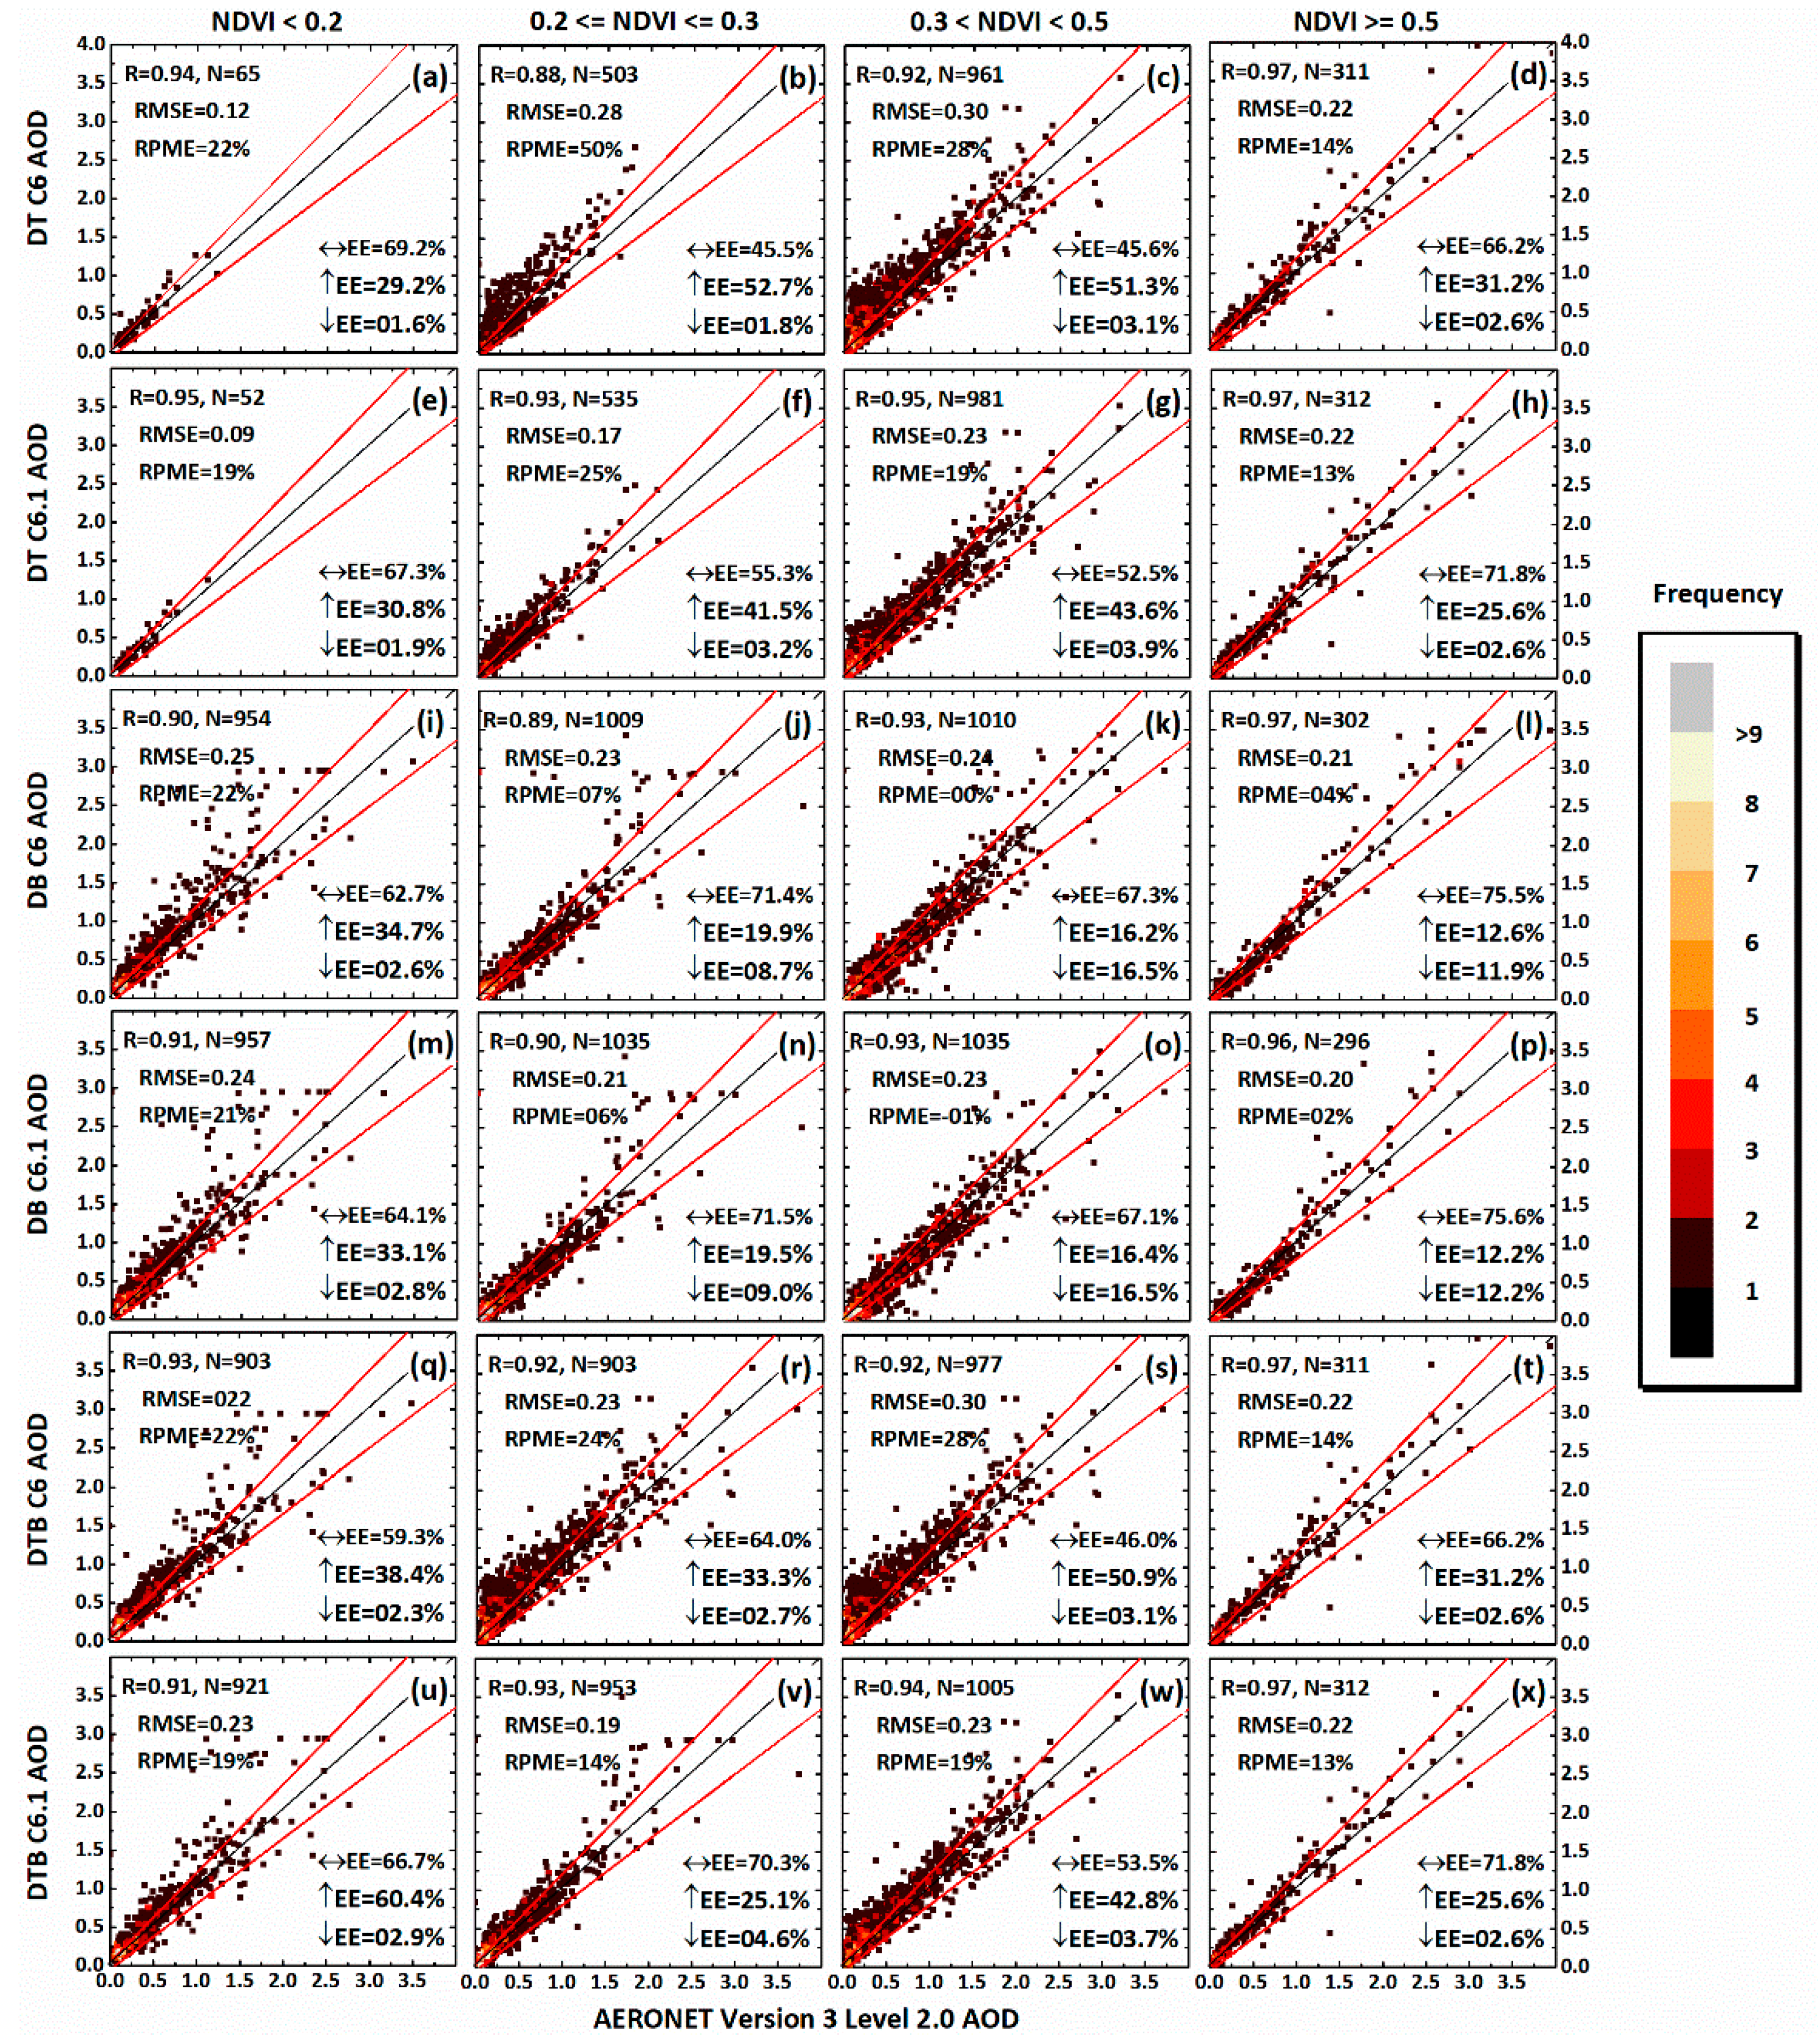
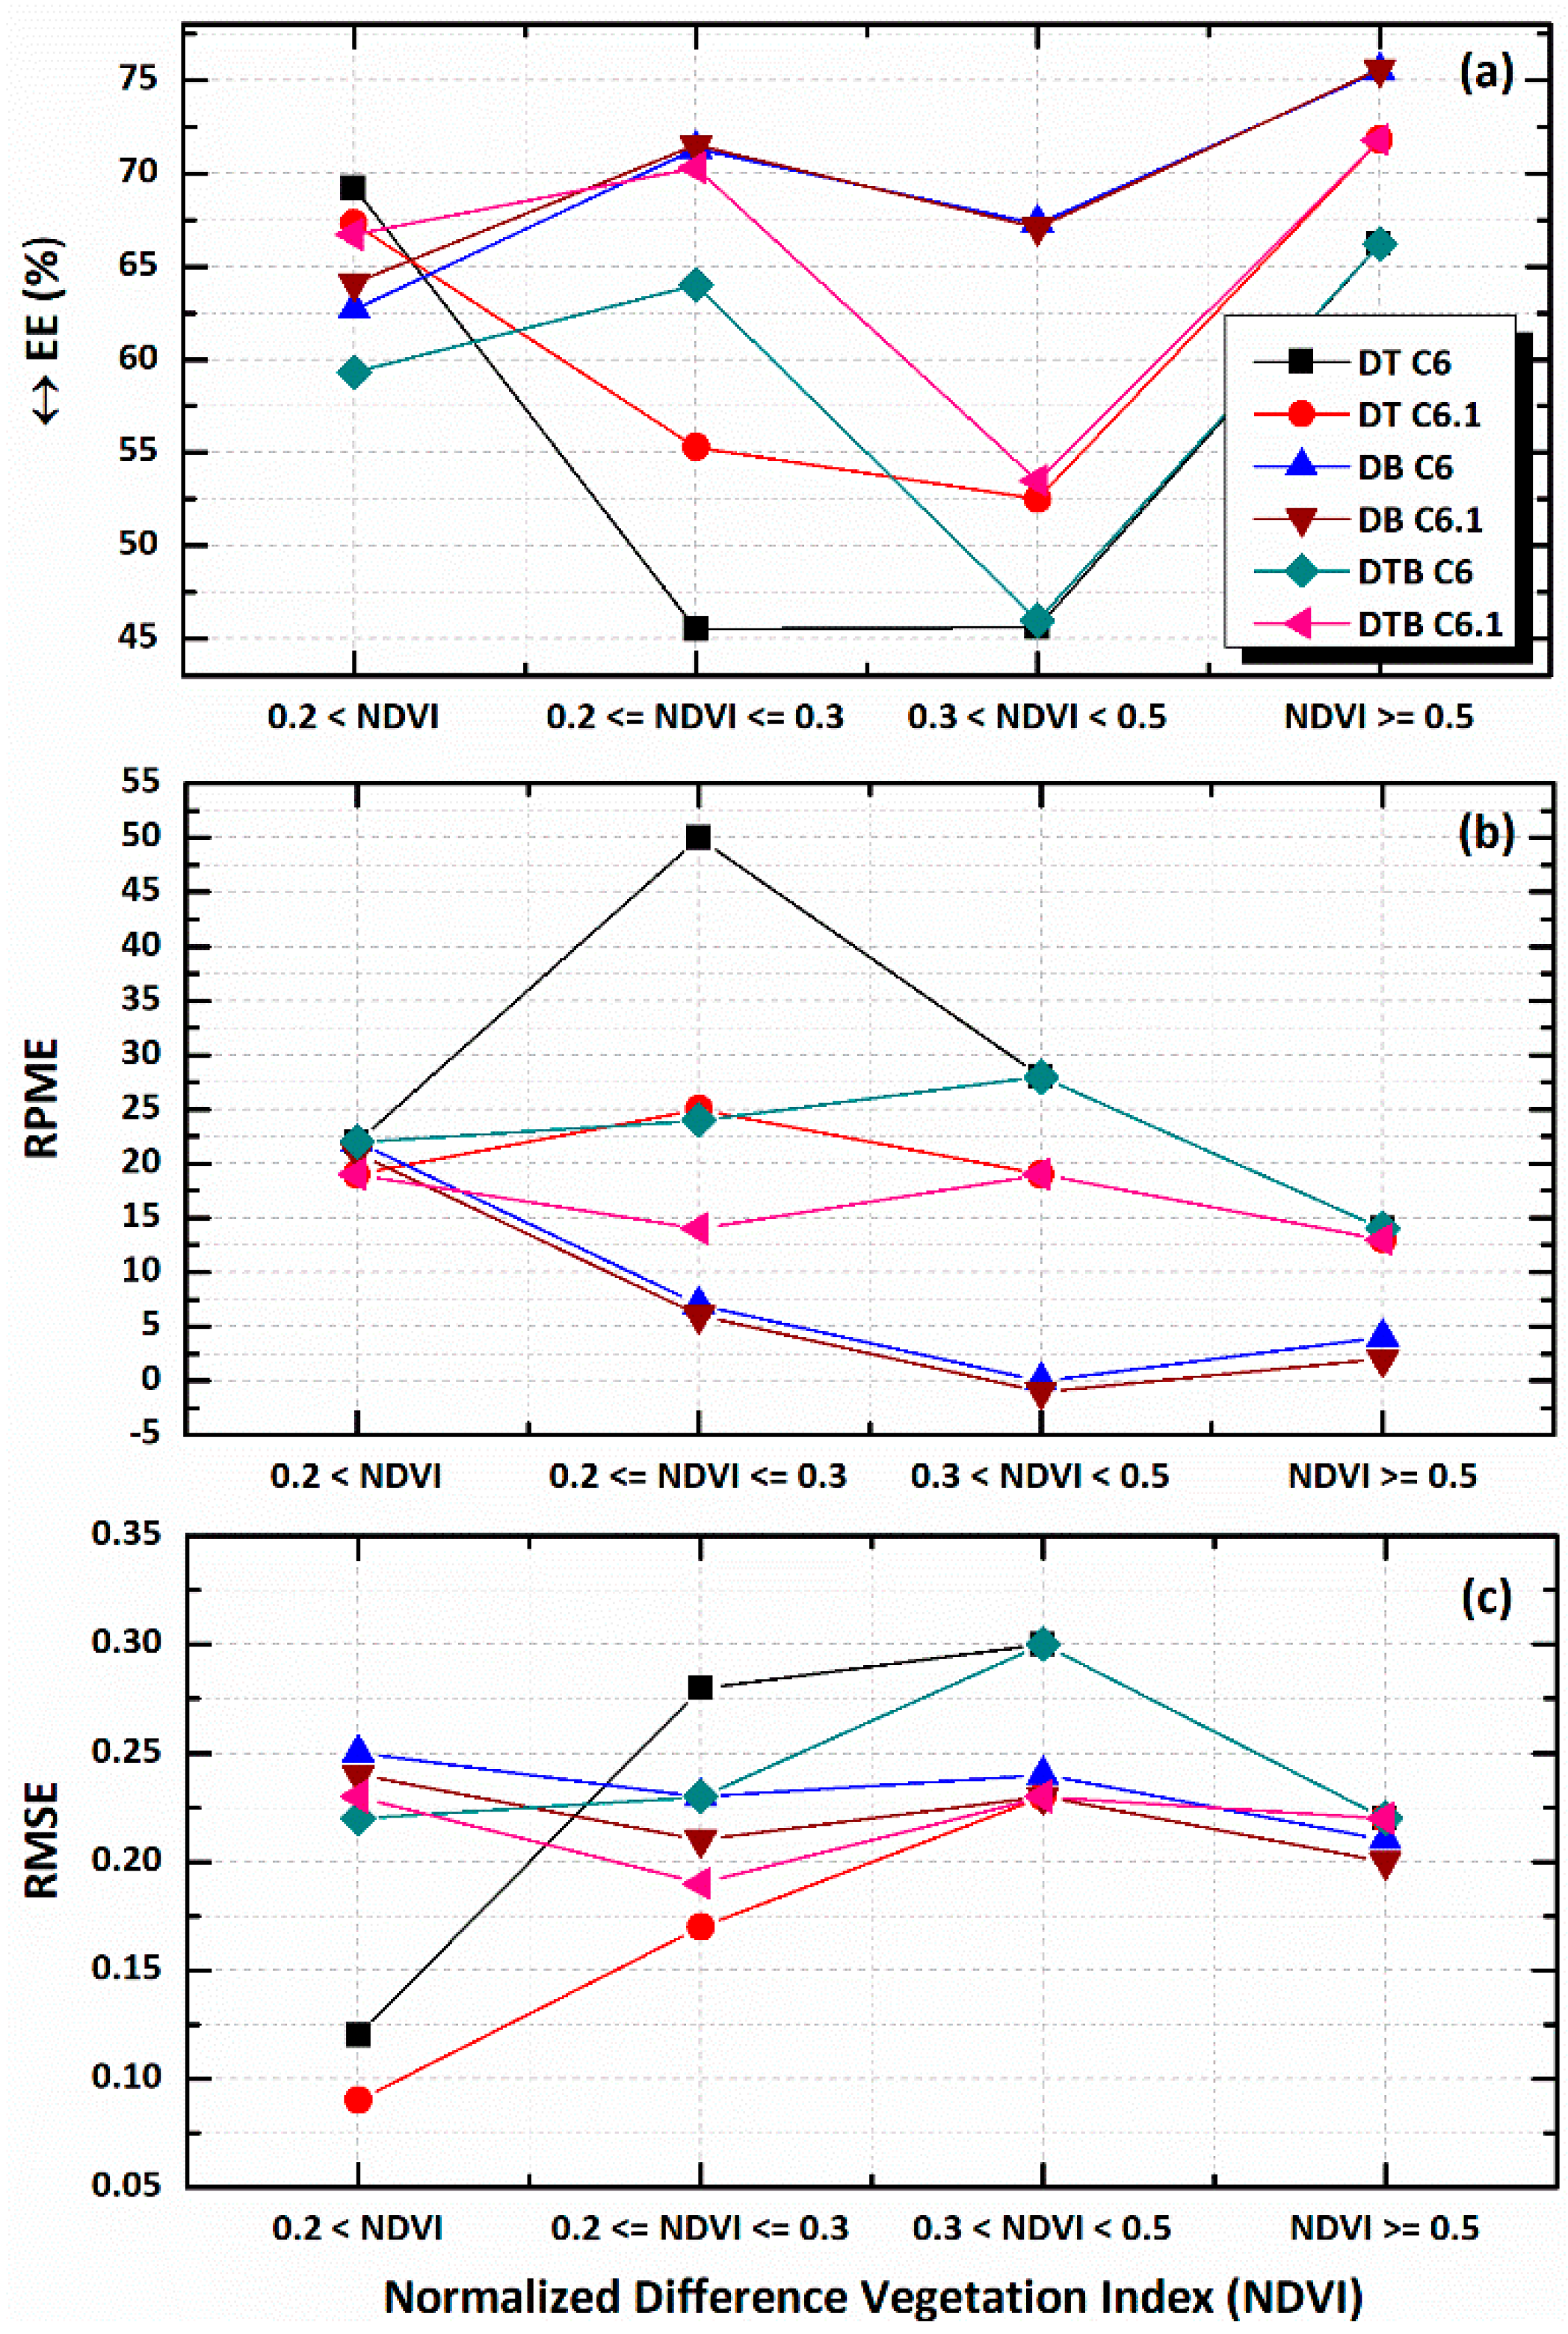
For diverse vegetated surfaces, the percentage of DT C6 and C6.1-collocated AOD was less than 68% for MVS surfaces, where the reasonable performance of DT was expected since it was designed and developed to retrieve accurate AOD for vegetated surfaces.
(8)
DT and DB-collocated AOD retrievals performed better than each other over surfaces with NDVI < 0.2 and NDVI > 0.2, respectively, in terms of small RMSE and a large percentage of collocated retrievals ↔EE.
This study also concludes that DB and DT AOD retrievals should be considered for surfaces with NDVI > 0.3 and NDVI < 0.2, respectively, in the new integrated product, to improve the quality of DTB AOD overall.

Author Contributions

M.B. and J.N. designed the paper; J.N., M.B., Z.Q., J.C., and S.L. reviewed and revised the paper; M.N., L.W., and S.X. helped in data processing.

Funding

This work was jointly supported by the National Key Research and Development Program of China (No.2016YFC1400904), Jiangsu Chair Professor, and the Startup Foundation for Introduction Talent of NUIST (2017r107).

Acknowledgments

The authors would like to acknowledge NASA Goddard Space Flight Center for MODIS data, and Principal Investigators of AERONET sites. We are thankful to Devin White (Oak Ridge National Laboratory) for MODIS Conversion Tool Kit (MCTK).

Conflicts of Interest

The authors declare no conflict of interest

References

  1. Kaufman, Y.J.; Tanré, D.; Boucher, O. A satellite view of aerosols in the climate system. Nature 2002, 419, 215–223. [Google Scholar] [CrossRef] [PubMed]
  2. Pope, C.A.; Ezzati, M.; Dockery, D.W. Fine-particulate air pollution and life expectancy in the United States. N. Engl. J. Med. 2009, 360, 376–386. [Google Scholar] [CrossRef] [PubMed]
  3. Pope, C.A.; Dockery, D.W. Health effects of fine particulate air pollution: Lines that connect. J. Air Waste Manag. Assoc. (1995) 2006, 56, 709–742. [Google Scholar] [CrossRef]
  4. Pope, C.A.; Burnett, R.T.; Thun, M.J.; Calle, E.E.; Krewski, D.; Ito, K.; Thurston, G.D. Lung cancer, cardiopulmonary mortality, and long-term exposure to fine particulate air pollution. Jama J. Am. Med. Assoc. 2002, 287, 1132–1141. [Google Scholar] [CrossRef]
  5. Cheung, H.-C.; Wang, T.; Baumann, K.; Guo, H. Influence of regional pollution outflow on the concentrations of fine particulate matter and visibility in the coastal area of southern China. Atmos. Environ. 2005, 39, 6463–6474. [Google Scholar] [CrossRef]
  6. Bilal, M.; Nichol, J.; Spak, S. A New Approach for Estimation of Fine Particulate Concentrations Using Satellite Aerosol Optical Depth and Binning of Meteorological Variables. Aerosol Air Qual. Res. 2017, 11, 356–367. [Google Scholar] [CrossRef]
  7. Zou, B.; Pu, Q.; Bilal, M.; Weng, Q.; Zhai, L.; Nichol, J.E. High-Resolution Satellite Mapping of Fine Particulates Based on Geographically Weighted Regression. IEEE Geosci. Remote Sens. Lett. 2016, 13, 495–499. [Google Scholar] [CrossRef]
  8. Bilal, M.; Nichol, J.E. Evaluation of MODIS aerosol retrieval algorithms over the Beijing-Tianjin-Hebei region during low to very high pollution events. J. Geophys. Res. Atmos. 2015, 120, 7941–7957. [Google Scholar] [CrossRef] [Green Version]
  9. Bilal, M.; Nichol, J.E.; Chan, P.W. Validation and accuracy assessment of a Simplified Aerosol Retrieval Algorithm (SARA) over Beijing under low and high aerosol loadings and dust storms. Remote Sens. Environ. 2014, 153, 50–60. [Google Scholar] [CrossRef]
  10. Bilal, M.; Nichol, J.E.; Bleiweiss, M.P.; Dubois, D. A Simplified high resolution MODIS Aerosol Retrieval Algorithm (SARA) for use over mixed surfaces. Remote Sens. Environ. 2013, 136, 135–145. [Google Scholar] [CrossRef]
  11. Holben, N.; Tanr, D.; Smirnov, A.; Eck, T.F.; Slutsker, I.; Newcomb, W.W.; Schafer, J.S.; Chatenet, B.; Lavenu, F.; Kaufman, J.; et al. An emerging ground-based aerosol climatology: Aerosol optical depth from AERONET. J. Geophys. Res. Atmos. 2001, 106, 12067–12097. [Google Scholar] [CrossRef] [Green Version]
  12. Holben, B.N.; Eck, T.F.; Slutsker, I.; Tanré, D.; Buis, J.P.; Setzer, A.; Vermote, E.; Reagan, J.A.; Kaufman, Y.J.; Nakajima, T.; et al. AERONET—A Federated Instrument Network and Data Archive for Aerosol Characterization. Remote Sens. Environ. 1998, 66, 1–16. [Google Scholar] [CrossRef] [Green Version]
  13. Li, Z.; Zhao, X.; Kahn, R.; Mishchenko, M.; Remer, L.; Lee, K.-H.; Wang, M.; Laszlo, I.; Nakajima, T.; Maring, H. Uncertainties in satellite remote sensing of aerosols and impact on monitoring its long-term trend: A review and perspective. Ann. Geophys. 2009, 27, 2755–2770. [Google Scholar] [CrossRef]
  14. Riffler, M.; Popp, C.; Hauser, A.; Fontana, F.; Wunderle, S. Validation of a modified AVHRR aerosol optical depth retrieval algorithm over Central Europe. Atmos. Meas. Tech. 2010, 3, 1255–1270. [Google Scholar] [CrossRef] [Green Version]
  15. Hauser, A.; Oesch, D.; Foppa, N.; Wunderle, S. NOAA AVHRR derived aerosol optical depth over land. J. Geophys. Res. 2005, 110, D08204. [Google Scholar] [CrossRef]
  16. Sayer, A.M.; Hsu, N.C.; Bettenhausen, C.; Jeong, M.-J.; Holben, B.N.; Zhang, J. Global and regional evaluation of over-land spectral aerosol optical depth retrievals from SeaWiFS. Atmos. Meas. Tech. 2012, 5, 1761–1778. [Google Scholar] [CrossRef] [Green Version]
  17. Kahn, R.A.; Gaitley, B.J.; Garay, M.J.; Diner, D.J.; Eck, T.F.; Smirnov, A.; Holben, B.N. Multiangle Imaging SpectroRadiometer global aerosol product assessment by comparison with the Aerosol Robotic Network. J. Geophys. Res. 2010, 115, D23209. [Google Scholar] [CrossRef]
  18. Kahn, R.A.; Gaitley, B.J.; Martonchik, J.V.; Diner, D.J.; Crean, K.A.; Holben, B. Multiangle Imaging Spectroradiometer (MISR) global aerosol optical depth validation based on 2 years of coincident Aerosol Robotic Network (AERONET) observations. J. Geophys. Res. 2005, 110, D10S04. [Google Scholar] [CrossRef]
  19. Torres, O.; Bhartia, P.K.; Herman, J.R.; Sinyuk, A.; Ginoux, P.; Holben, B. A Long-Term Record of Aerosol Optical Depth from TOMS Observations and Comparison to AERONET Measurements. J. Atmos. Sci. 2002, 59, 398–413. [Google Scholar] [CrossRef]
  20. Torres, O.; Tanskanen, A.; Veihelmann, B.; Ahn, C.; Braak, R.; Bhartia, P.K.; Veefkind, P.; Levelt, P. Aerosols and surface UV products from Ozone Monitoring Instrument observations: An overview. J. Geophys. Res. 2007, 112, D24S47. [Google Scholar] [CrossRef]
  21. Vidot, J.; Santer, R.; Aznay, O. Evaluation of the MERIS aerosol product over land with AERONET. Atmos. Chem. Phys. 2008, 8, 7603–7617. [Google Scholar] [CrossRef] [Green Version]
  22. Liu, H.; Remer, L.A.; Huang, J.; Huang, H.-C.; Kondragunta, S.; Laszlo, I.; Oo, M.; Jackson, J.M. Preliminary evaluation of S-NPP VIIRS aerosol optical thickness. J. Geophys. Res. Atmos. 2014, 119, 3942–3962. [Google Scholar] [CrossRef] [Green Version]
  23. Jackson, J.M.; Liu, H.; Laszlo, I.; Kondragunta, S.; Remer, L.A.; Huang, J.; Huang, H.-C. Suomi-NPP VIIRS aerosol algorithms and data products. J. Geophys. Res. Atmos. 2013, 118, 12673–612689. [Google Scholar] [CrossRef]
  24. Hsu, N.C.; Jeong, M.-J.; Bettenhausen, C.; Sayer, A.M.; Hansell, R.; Seftor, C.S.; Huang, J.; Tsay, S.-C. Enhanced Deep Blue aerosol retrieval algorithm: The second generation. J. Geophys. Res. Atmos. 2013, 118, 9296–9315. [Google Scholar] [CrossRef] [Green Version]
  25. Levy, R.C.; Mattoo, S.; Munchak, L.A.; Remer, L.A.; Sayer, A.M.; Patadia, F.; Hsu, N.C. The Collection 6 MODIS aerosol products over land and ocean. Atmos. Meas. Tech. 2013, 6, 2989–3034. [Google Scholar] [CrossRef] [Green Version]
  26. Gupta, P.; Levy, R.C.; Mattoo, S.; Remer, L.A.; Munchak, L.A. A surface reflectance scheme for retrieving aerosol optical depth over urbansurfaces in MODIS Dark Target retrieval algorithm. Atmos. Meas. Tech. 2016, 9, 3293–3308. [Google Scholar] [CrossRef]
  27. Bilal, M.; Nazeer, M.; Qiu, Z.; Ding, X.; Wei, J. Global Validation of MODIS C6 and C6.1 Merged Aerosol Products over Diverse Vegetated Surfaces. Remote Sens. 2018, 10, 475. [Google Scholar] [CrossRef]
  28. Levy, R.C.; Remer, L.A.; Kleidman, R.G.; Mattoo, S.; Ichoku, C.; Kahn, R.; Eck, T.F. Global evaluation of the Collection 5 MODIS dark-target aerosol products over land. Atmos. Chem. Phys. 2010, 10, 10399–10420. [Google Scholar] [CrossRef] [Green Version]
  29. Sayer, A.M.; Hsu, N.C.; Bettenhausen, C.; Jeong, M.-J. Validation and uncertainty estimates for MODIS Collection 6 “Deep Blue” aerosol data. J. Geophys. Res. Atmos. 2013, 118, 7864–7872. [Google Scholar] [CrossRef] [Green Version]
  30. Sayer, A.M.; Munchak, L.A.; Hsu, N.C.; Levy, R.C.; Bettenhausen, C.; Jeong, M.J. MODIS Collection 6 aerosol products: Comparison between Aqua’s e-Deep Blue, Dark Target, and “merged” data sets, and usage recommendations. J. Geophys. Res. Atmos. 2014, 119, 13965–13989. [Google Scholar] [CrossRef]
  31. Giles, D.M.; Sinyuk, M.S.; Sorokin, J.S.; Schafer, A.; Smirnov, I.; Slutsker, T.F.; Eck, B.N.; Holben, J.R.; Lewis, J.R.; Campbell, E.J.; et al. Advancements in the Aerosol Robotic Network (AERONET) Version 3 database–automated near real-time quality control algorithm with improved cloud screening for Sun photometer aerosol optical depth measurements. Atmos. Meas. Tech. 2019, 12, 169–209. [Google Scholar] [CrossRef]
  32. Remer, L.A.; Chin, M.; DeCola, P.; Feingold, G.; Halthore, R.; Kahn, R.A.; Quinn, P.K.; Rind, D.; Schwarts, S.E.; Streets, D.; et al. Executive Summary, in Atmospheric Aerosol Properties and Climate Impacts. In A Report by the U.S. Climate Change Science Program and the Subcommittee on Global Change Research; Chin, M., Kahn, R.A., Schwartz, S.E., Eds.; National Aeronautics and Space Administration: Washington, DC, USA, 2009. [Google Scholar]
  33. Chew, B.N.; Campbell, J.R.; Reid, J.S.; Giles, D.M.; Welton, E.J.; Salinas, S.V.; Liew, S.C. Tropical cirrus cloud contamination in sun photometer data. Atmos. Environ. 2011, 45, 6724–6731. [Google Scholar] [CrossRef]
  34. Bilal, M.; Nichol, J. Evaluation of the NDVI-Based Pixel Selection Criteria of the MODIS C6 Dark Target and Deep Blue Combined Aerosol Product. IEEE J. Sel. Top. Appl. Earth Obs. Remote Sens. 2017, 10, 3448–3453. [Google Scholar] [CrossRef]
  35. Li, Z.; Niu, F.; Lee, K.-H.; Xin, J.; Hao, W.M.; Nordgren, B.L.; Wang, Y.; Wang, P. Validation and understanding of Moderate Resolution Imaging Spectroradiometer aerosol products (C5) using ground-based measurements from the handheld Sun photometer network in China. J. Geophys. Res. 2007, 112. [Google Scholar] [CrossRef] [Green Version]
  36. He, Q.; Li, C.; Tang, X.; Li, H.; Geng, F.; Wu, Y. Validation of MODIS derived aerosol optical depth over the Yangtze River Delta in China. Remote Sens. Environ. 2010, 114, 1649–1661. [Google Scholar] [CrossRef]
  37. Xie, Y.; Zhang, Y.; Xiong, X.; Qu, J.J.; Che, H. Validation of MODIS aerosol optical depth product over China using CARSNET measurements. Atmos. Environ. 2011, 45, 5970–5978. [Google Scholar] [CrossRef]
  38. Bilal, M.; Nazeer, M.; Nichol, J.E. Validation of MODIS and VIIRS derived aerosol optical depth over complex coastal waters. Atmos. Res. 2017, 186, 43–50. [Google Scholar] [CrossRef]
  39. Bilal, M.; Nichol, J.; Wang, L. New customized methods for improvement of the MODIS C6 Dark Target and Deep Blue merged aerosol product. Remote Sens. Environ. 2017, 197, 115–124. [Google Scholar] [CrossRef]
  40. He, L.; Wang, L.; Lin, A.; Zhang, M.; Bilal, M.; Wei, J. Performance of the NPP-VIIRS and aqua-MODIS Aerosol Optical Depth Products over the Yangtze River Basin. Remote Sens. 2018, 10, 117. [Google Scholar] [CrossRef]
  41. Wei, J.; Sun, L.; Huang, B.; Bilal, M.; Zhang, Z.; Wang, L. Verification, improvement and application of aerosol optical depths in China Part 1: Inter-comparison of NPP-VIIRS and Aqua-MODIS. Atmos. Environ. 2018, 175, 221–233. [Google Scholar] [CrossRef]
  42. Bilal, M.; Qiu, Z.; Campbell, J.R.; Spak, S.; Shen, X.; Nazeer, M. A New MODIS C6 Dark Target and Deep Blue Merged Aerosol Product on a 3 km Spatial Grid. Remote Sens. 2018, 10, 463. [Google Scholar] [CrossRef]
  43. Wei, J.; Huang, B.; Sun, L.; Zhang, Z.; Wang, L.; Bilal, M. A Simple and Universal Aerosol Retrieval Algorithm for Landsat Series Images Over Complex Surfaces. J. Geophys. Res. Atmos. 2017. [Google Scholar] [CrossRef]
  44. Nichol, J.; Bilal, M. Validation of MODIS 3 km Resolution Aerosol Optical Depth Retrievals Over Asia. Remote Sens. 2016, 8, 328. [Google Scholar] [CrossRef]
  45. Bilal, M.; Nichol, J.E.; Nazeer, M. Validation of Aqua-MODIS C051 and C006 Operational Aerosol Products Using AERONET Measurements Over Pakistan. IEEE J. Sel. Top. Appl. Earth Obs. Remote Sens. 2016, 9, 2074–2080. [Google Scholar] [CrossRef]
  46. Sun, L.; Wei, J.; Bilal, M.; Tian, X.; Jia, C.; Guo, Y.; Mi, X. Aerosol optical depth retrieval over bright areas using Landsat 8 OLI images. Remote Sens. 2016, 8, 23. [Google Scholar] [CrossRef]
Figure 1. Land cover and yearly-averaged Normalized Difference Vegetation Index (NDVI) maps of the study area with overlaid Aerosol Robotic Network (AERONET) sites. (a) MODIS land cover data, (b) AERONET sites and NDVI values
Remotesensing 11 00486 g001
Figure 2. Validation of MODerate resolution Imaging Spectroradiometer (MODIS) aerosol optical depth (AOD) retrievals from 2004–2014 at the Beijing, XiangHe and Xinglong AERONET sites, including DT C6 (ac), DT C6.1 (df), DB C6 (gi), DB C6.1 (jl), DTB C6 (mo), and DTB C6.1 (pr). The black line is the 1:1 line, and red lines are the expected error envelope.
Remotesensing 11 00486 g002
Figure 3. Validation of MODIS AOD retrievals from 2004–2014 at the regional scale: DT C6 (a), DB C6 (b), DTB C6 (c), DT C6.1 (d), DB C6.1 (e), and DTB C6.1 (f). The black line is the 1:1 line and red lines are the expected error envelope.
Remotesensing 11 00486 g003
Figure 4. Differencing scatter plots between (C6 – AERONET)- and (C6.1 – AERONET)-collocated AOD retrievals, for, (a) DT AOD, (b) DB AOD, and (c) DTB AOD. The red and dotted black lines represent the regression and 1:1 lines, respectively.
Remotesensing 11 00486 g004
Figure 5. Temporal trends of monthly averaged collocated observations of DT AOD (a), DB AOD (b), and DTB AOD (c) retrievals from 2004–2014 over BTH.
Remotesensing 11 00486 g005
Figure 6. Spatial comparison between C6 and C6.1 AOD retrievals from 2004 to 2014 over the BTH region, where (a), (b) and (c) represent DT C6, C6.1 and C6 – 6.1, (d), (e) and (f) represent DB C6, C6.1 and C6 – 6.1, and (g), (h) and (i) represent DTB C6, C6.1 and C6 – 6.1, respectively.
Remotesensing 11 00486 g006
Figure 7. Validation of MODIS AOD retrievals from 2004–2014 over NVS, PVS, MVS, and DVS, where DT C6 (ad), DB C6 (eh), DTB C6 (il), DT C6.1 (mp), DB C6.1 (qt), and DTB C6.1 (ux). The black line is the 1:1 line, and red lines are the expected error envelope.
Remotesensing 11 00486 g007
Figure 8. A trend of the percentage of retrievals ↔EE (a), RMSE (b), and RPME (c) in AOD retrievals over diverse vegetated surfaces of the BTH region.
Remotesensing 11 00486 g008
Table 1. Summary of the data sets used.
DataScientific Data Set (SDS)AOD
AERONETVersion 3 Level 2.0 AOD
MOD04 C6 and C6.1Optical_Depth_Land_And_OceanDT AOD over land and ocean
Deep_Blue_Aerosol_Optical_Depth_550_LandDB AOD over land
Deep_Blue_Aerosol_Optical_Depth_550_Land_QA_flagIndicate quality of pixel
AOD_550_Dark_Target_Deep_Blue_CombinedDT, DB or their average AOD
AOD_550_Dark_Target_Deep_Blue_Combined_QA_FlagIndicate quality of pixel
MOD13A3 C61 km NDVIMonthly NDVI

