A Remote Sensing Based Integrated Approach to Quantify the Impact of Fluvial and Pluvial Flooding in an Urban Catchment

 , , ,
, , ,
Abstract
:
1. Introduction
- To model the spatial distribution of pluvial and fluvial flooding using a high-resolution DEM based 2D model for the study site of Cockermouth.
- To compare the flood extent and damage for different land use types between pluvial and fluvial flooding.
- To estimate the number of residential properties affected by pluvial and fluvial flooding using a combination of model results and UAS data collection.
2. Methodology
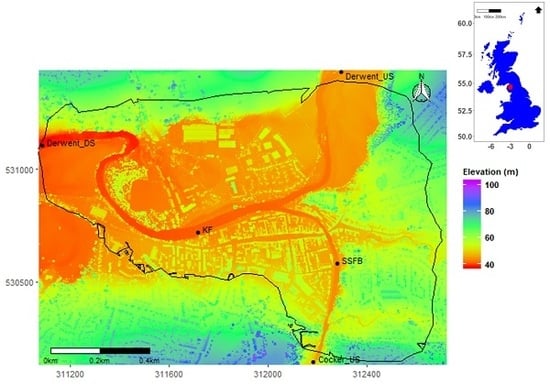
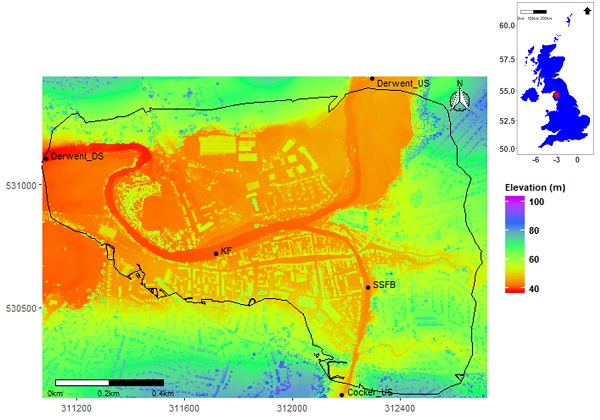
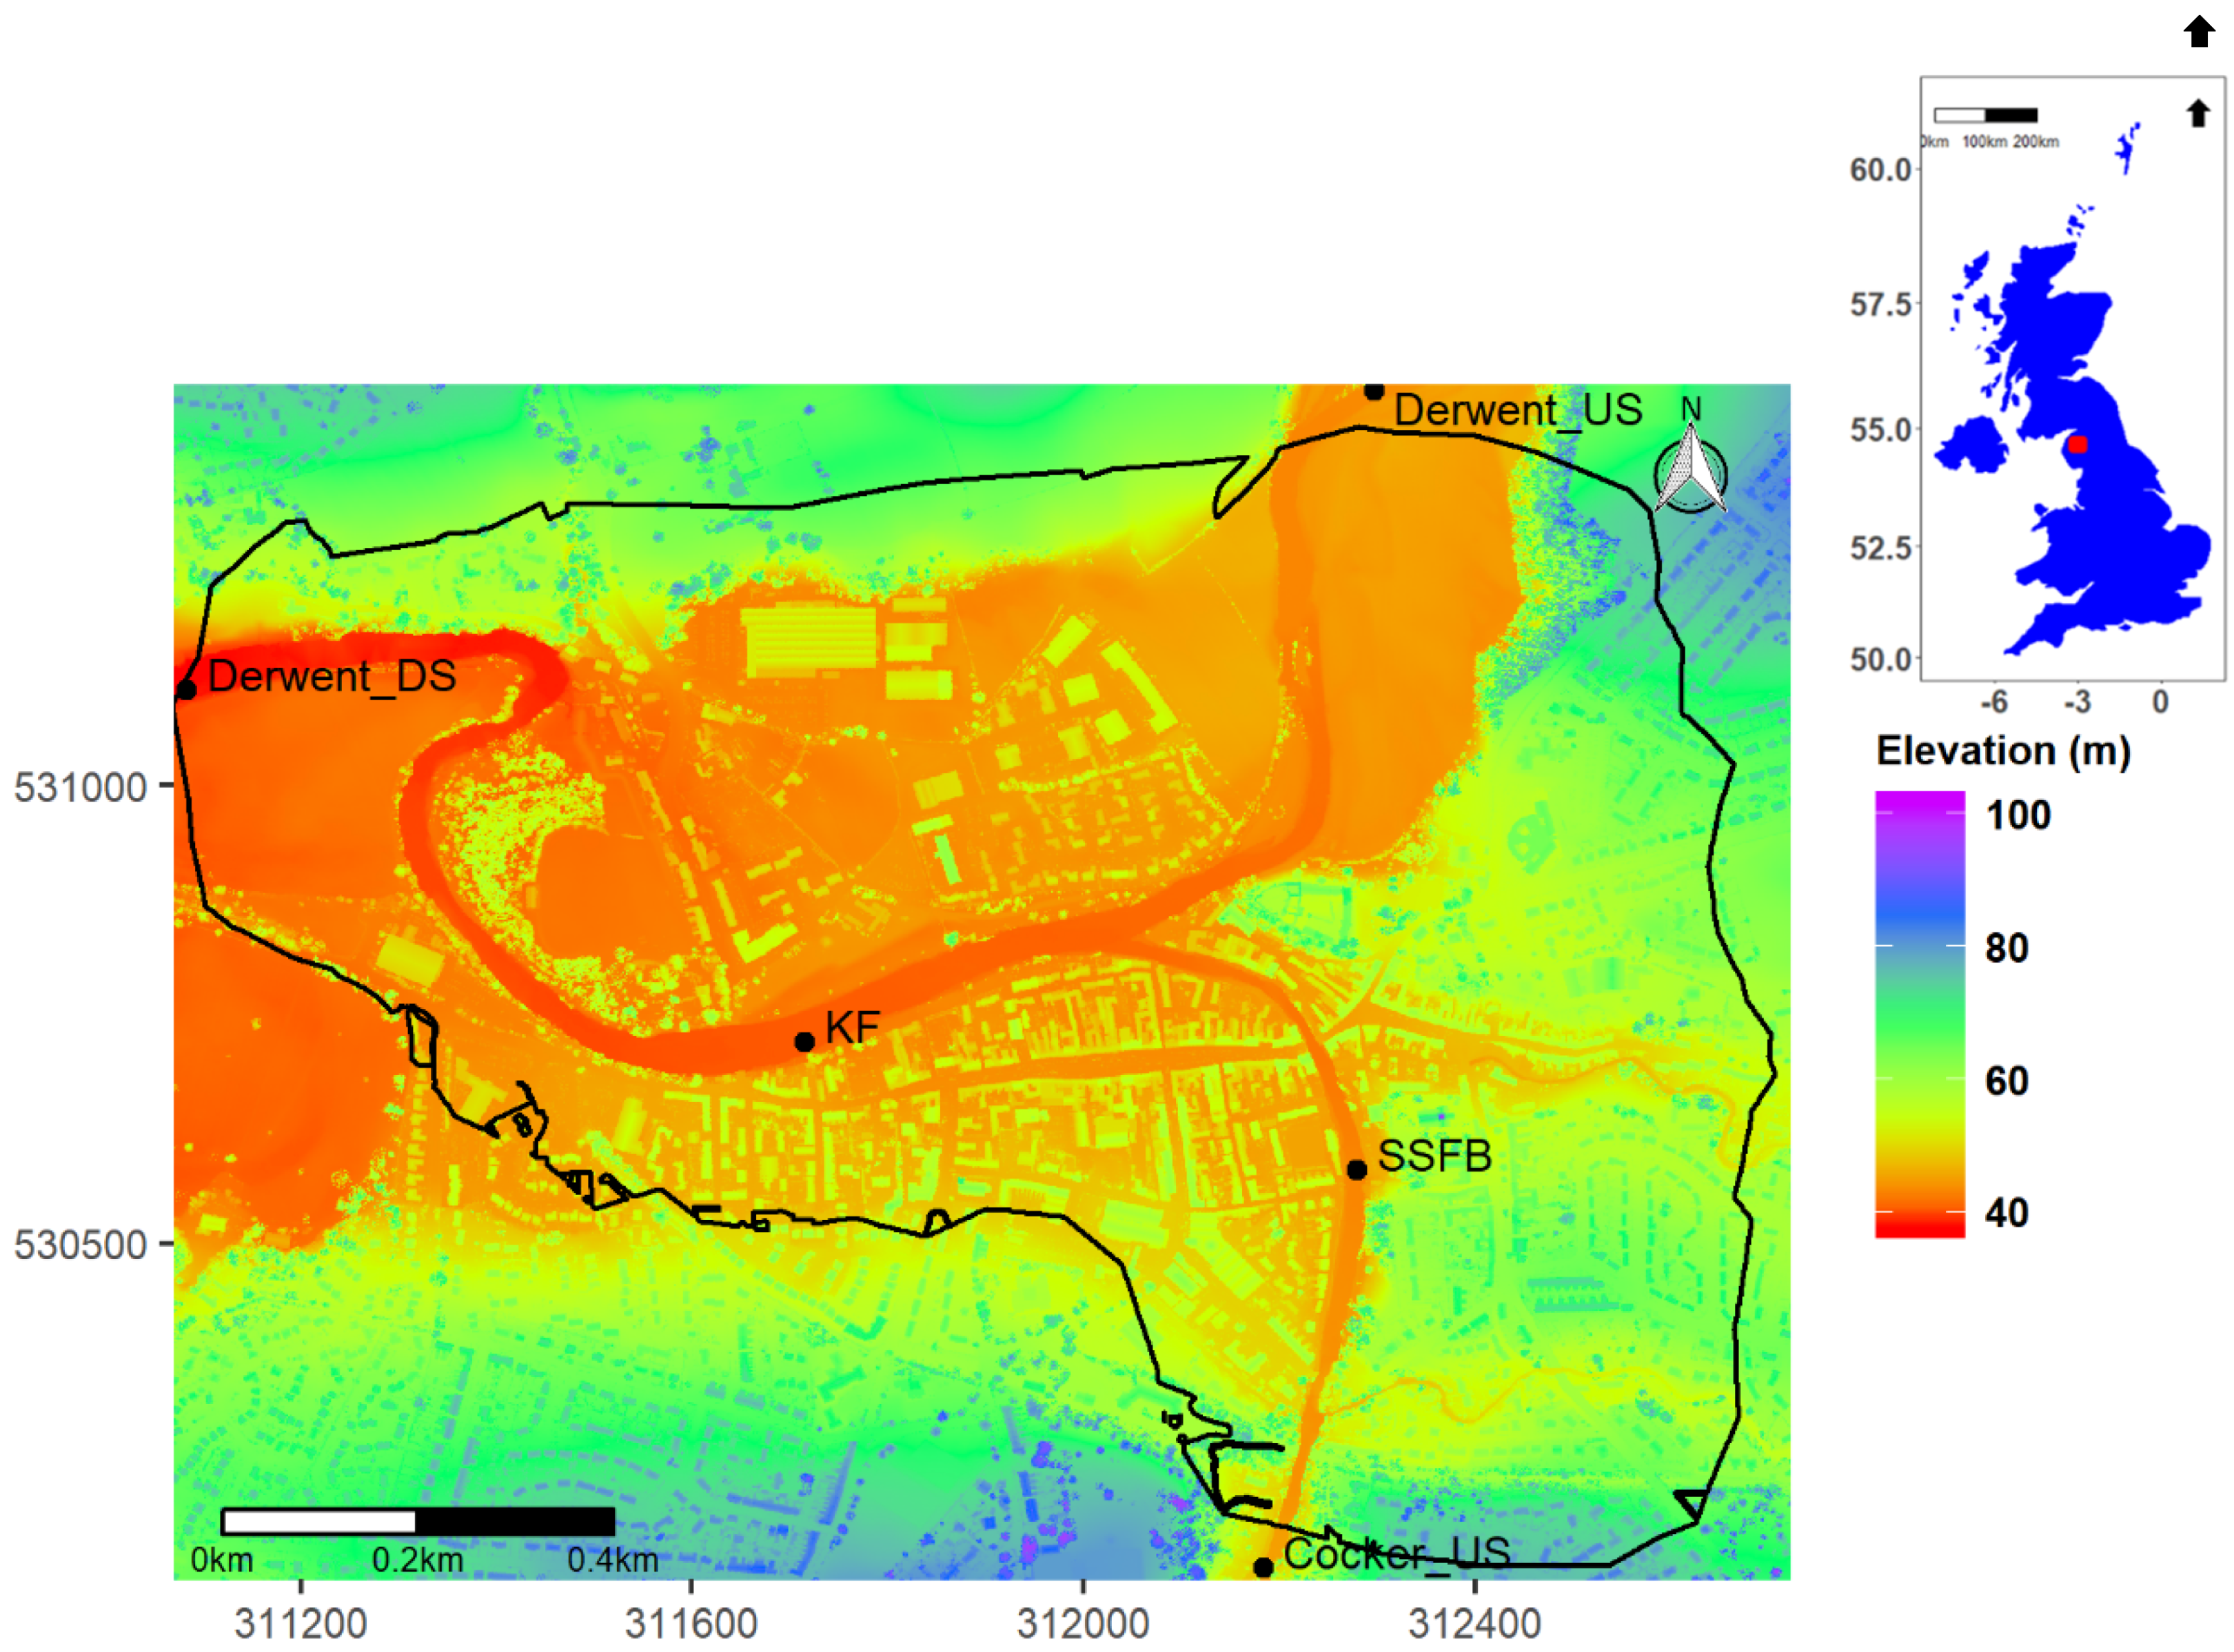
2.1. Study Site and Selected Flood Event
2.2. Data Collection and Collation
2.2.1. UAS Data
2.2.2. Topographical and Hydrological data
2.2.3. Flood Impact
2.3. Photogrammetric Analysis
2.4. Flood Inundation Modelling
2.5. Flood Extent and Impact
3. Results
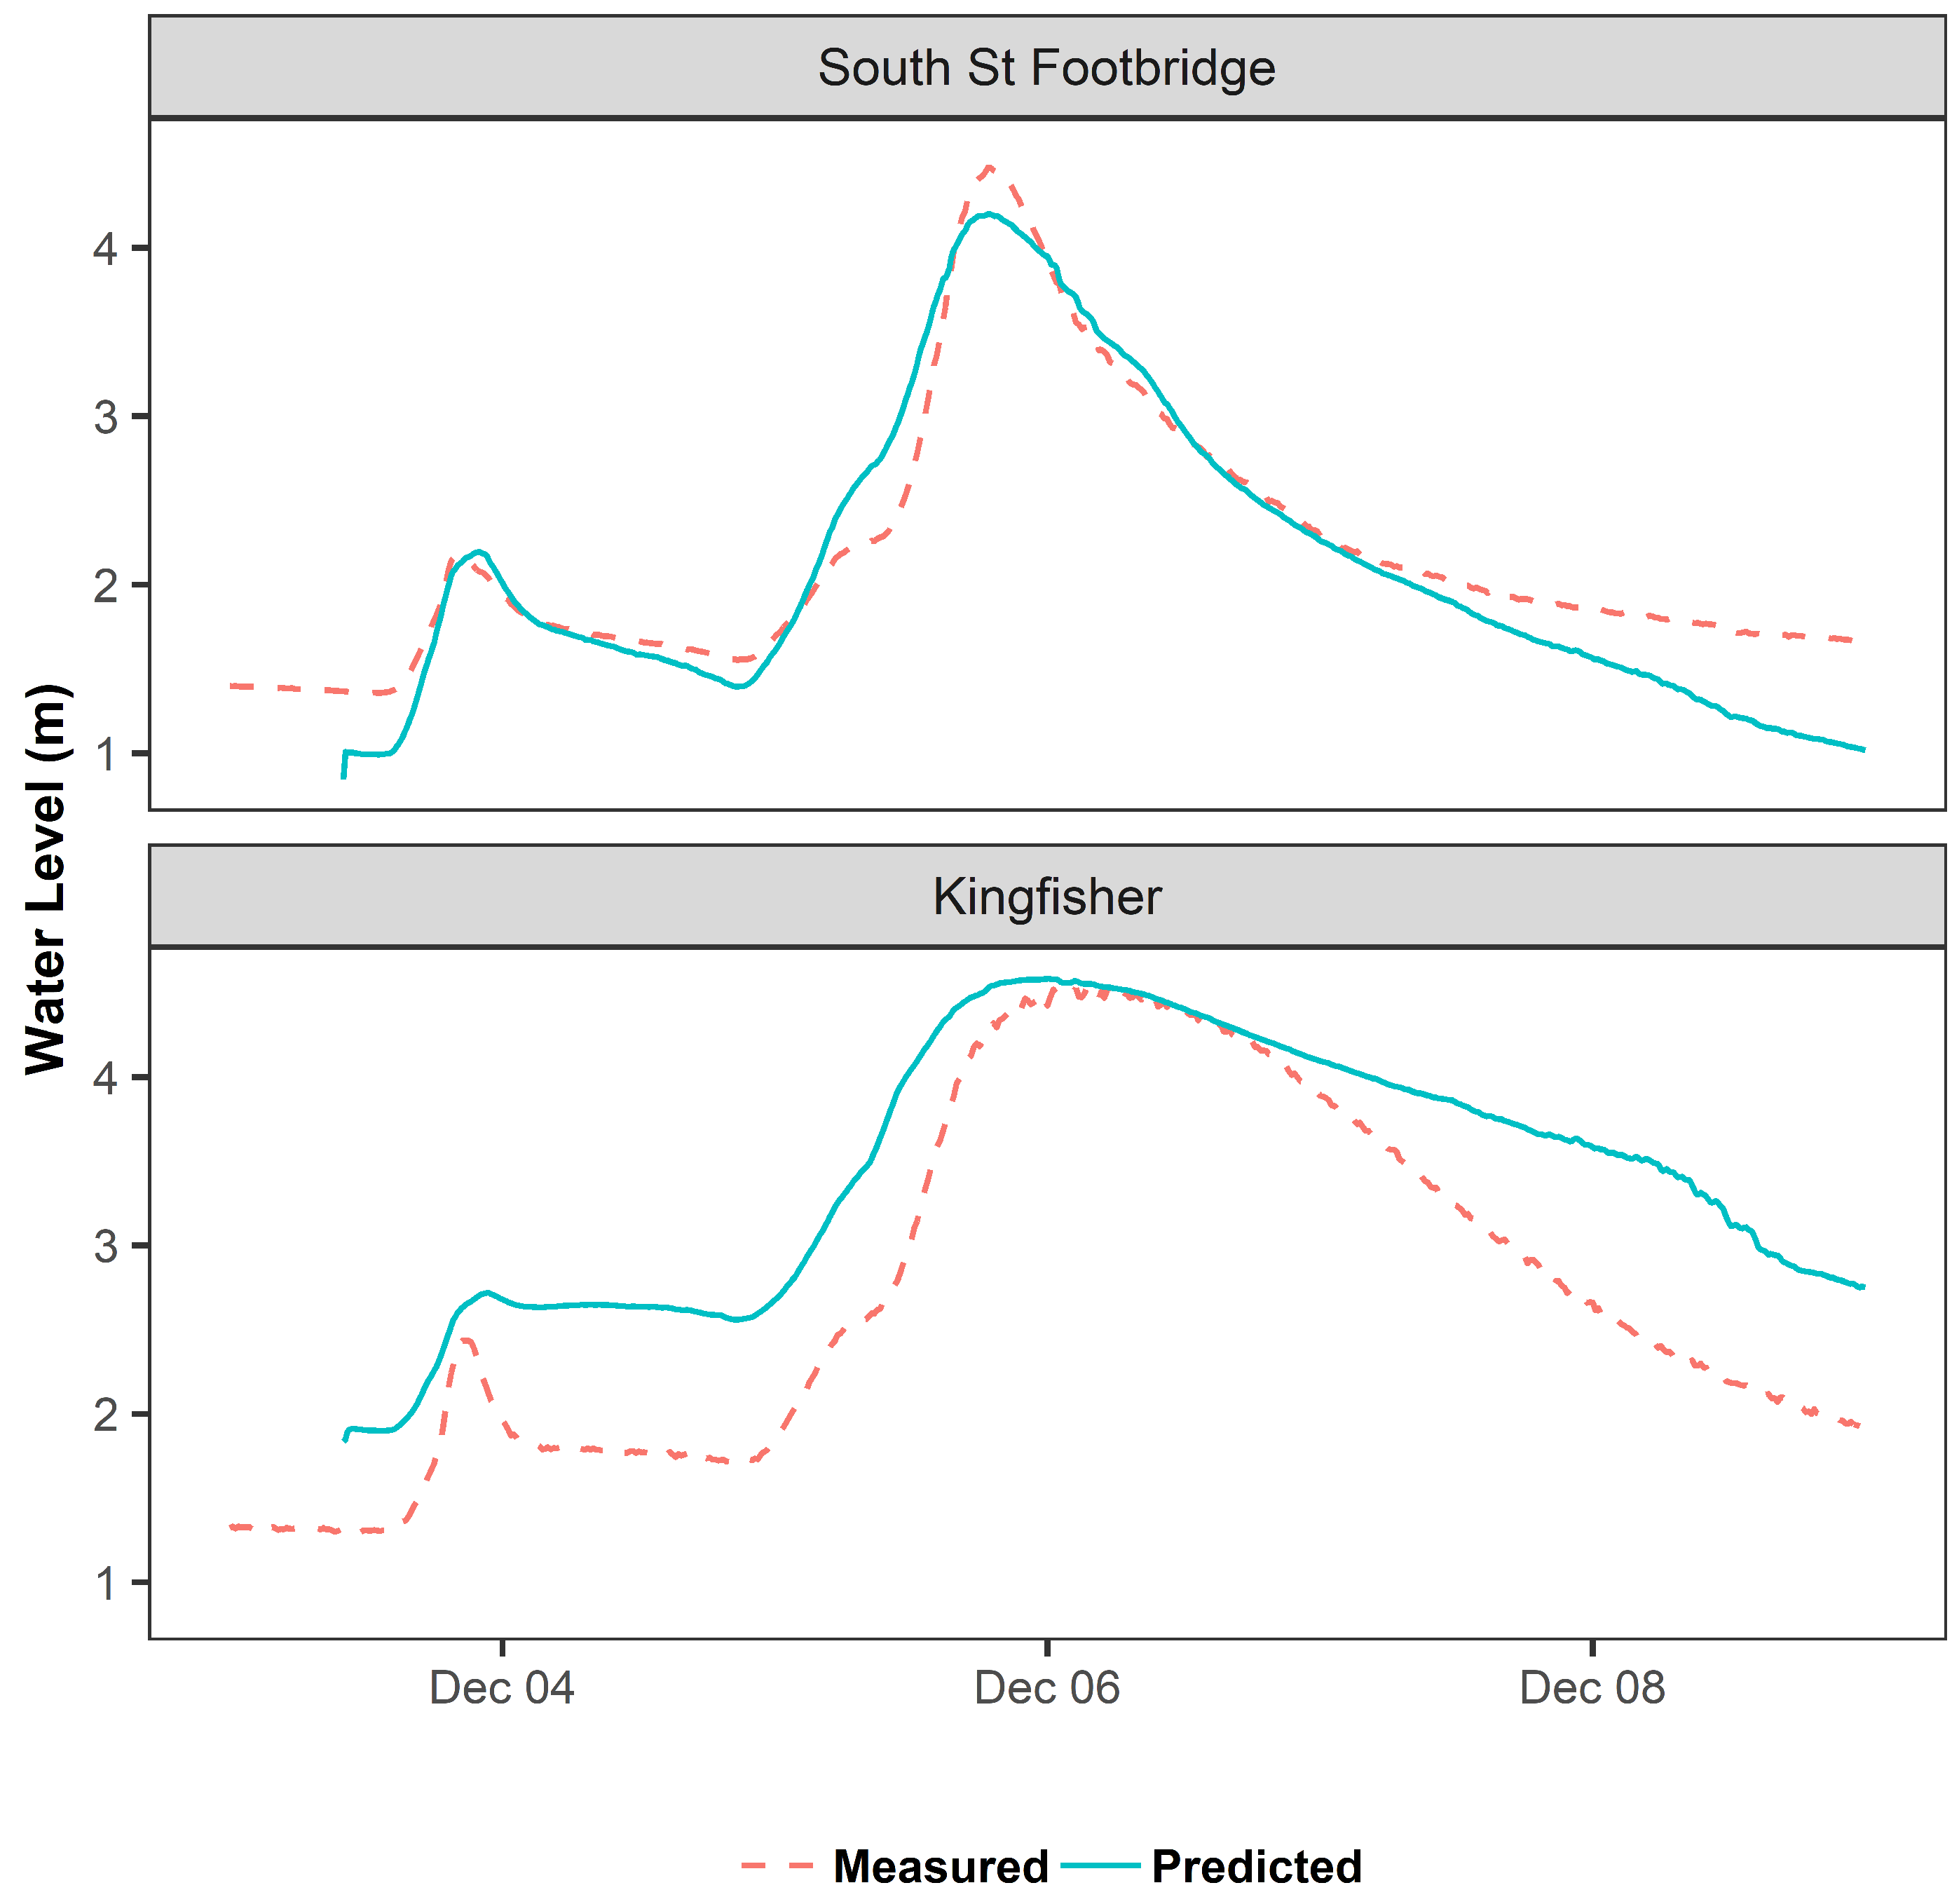
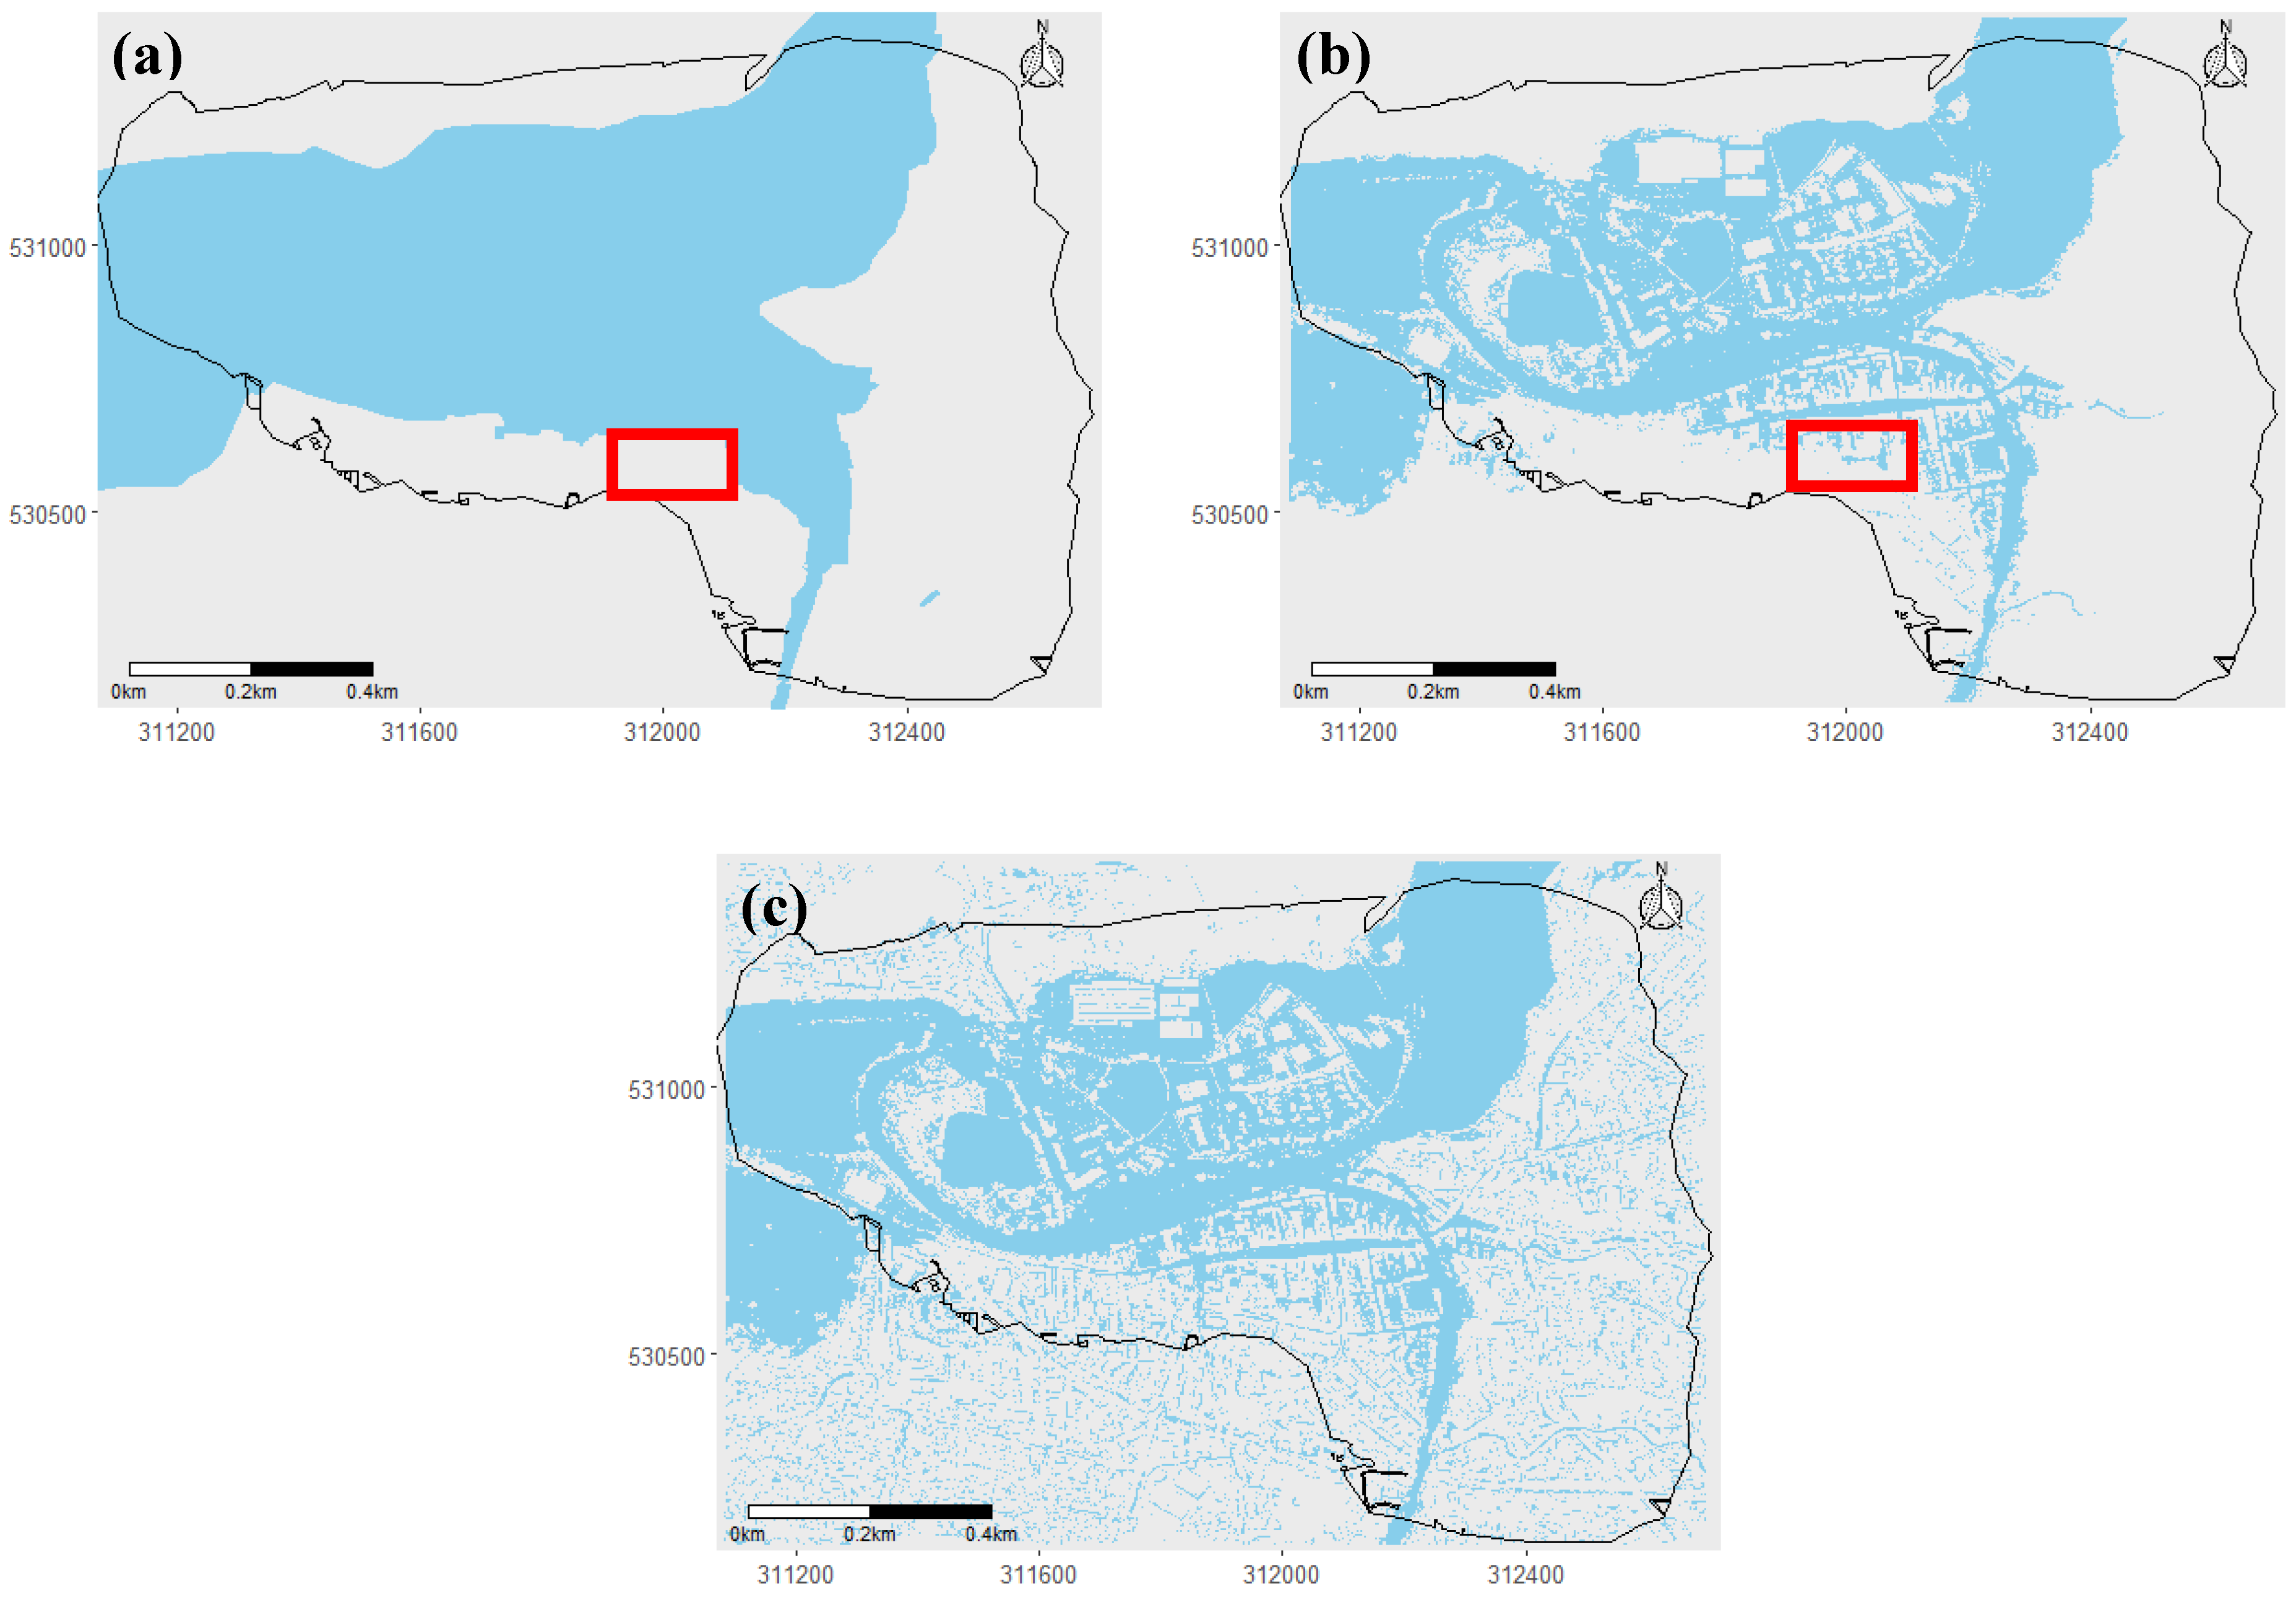
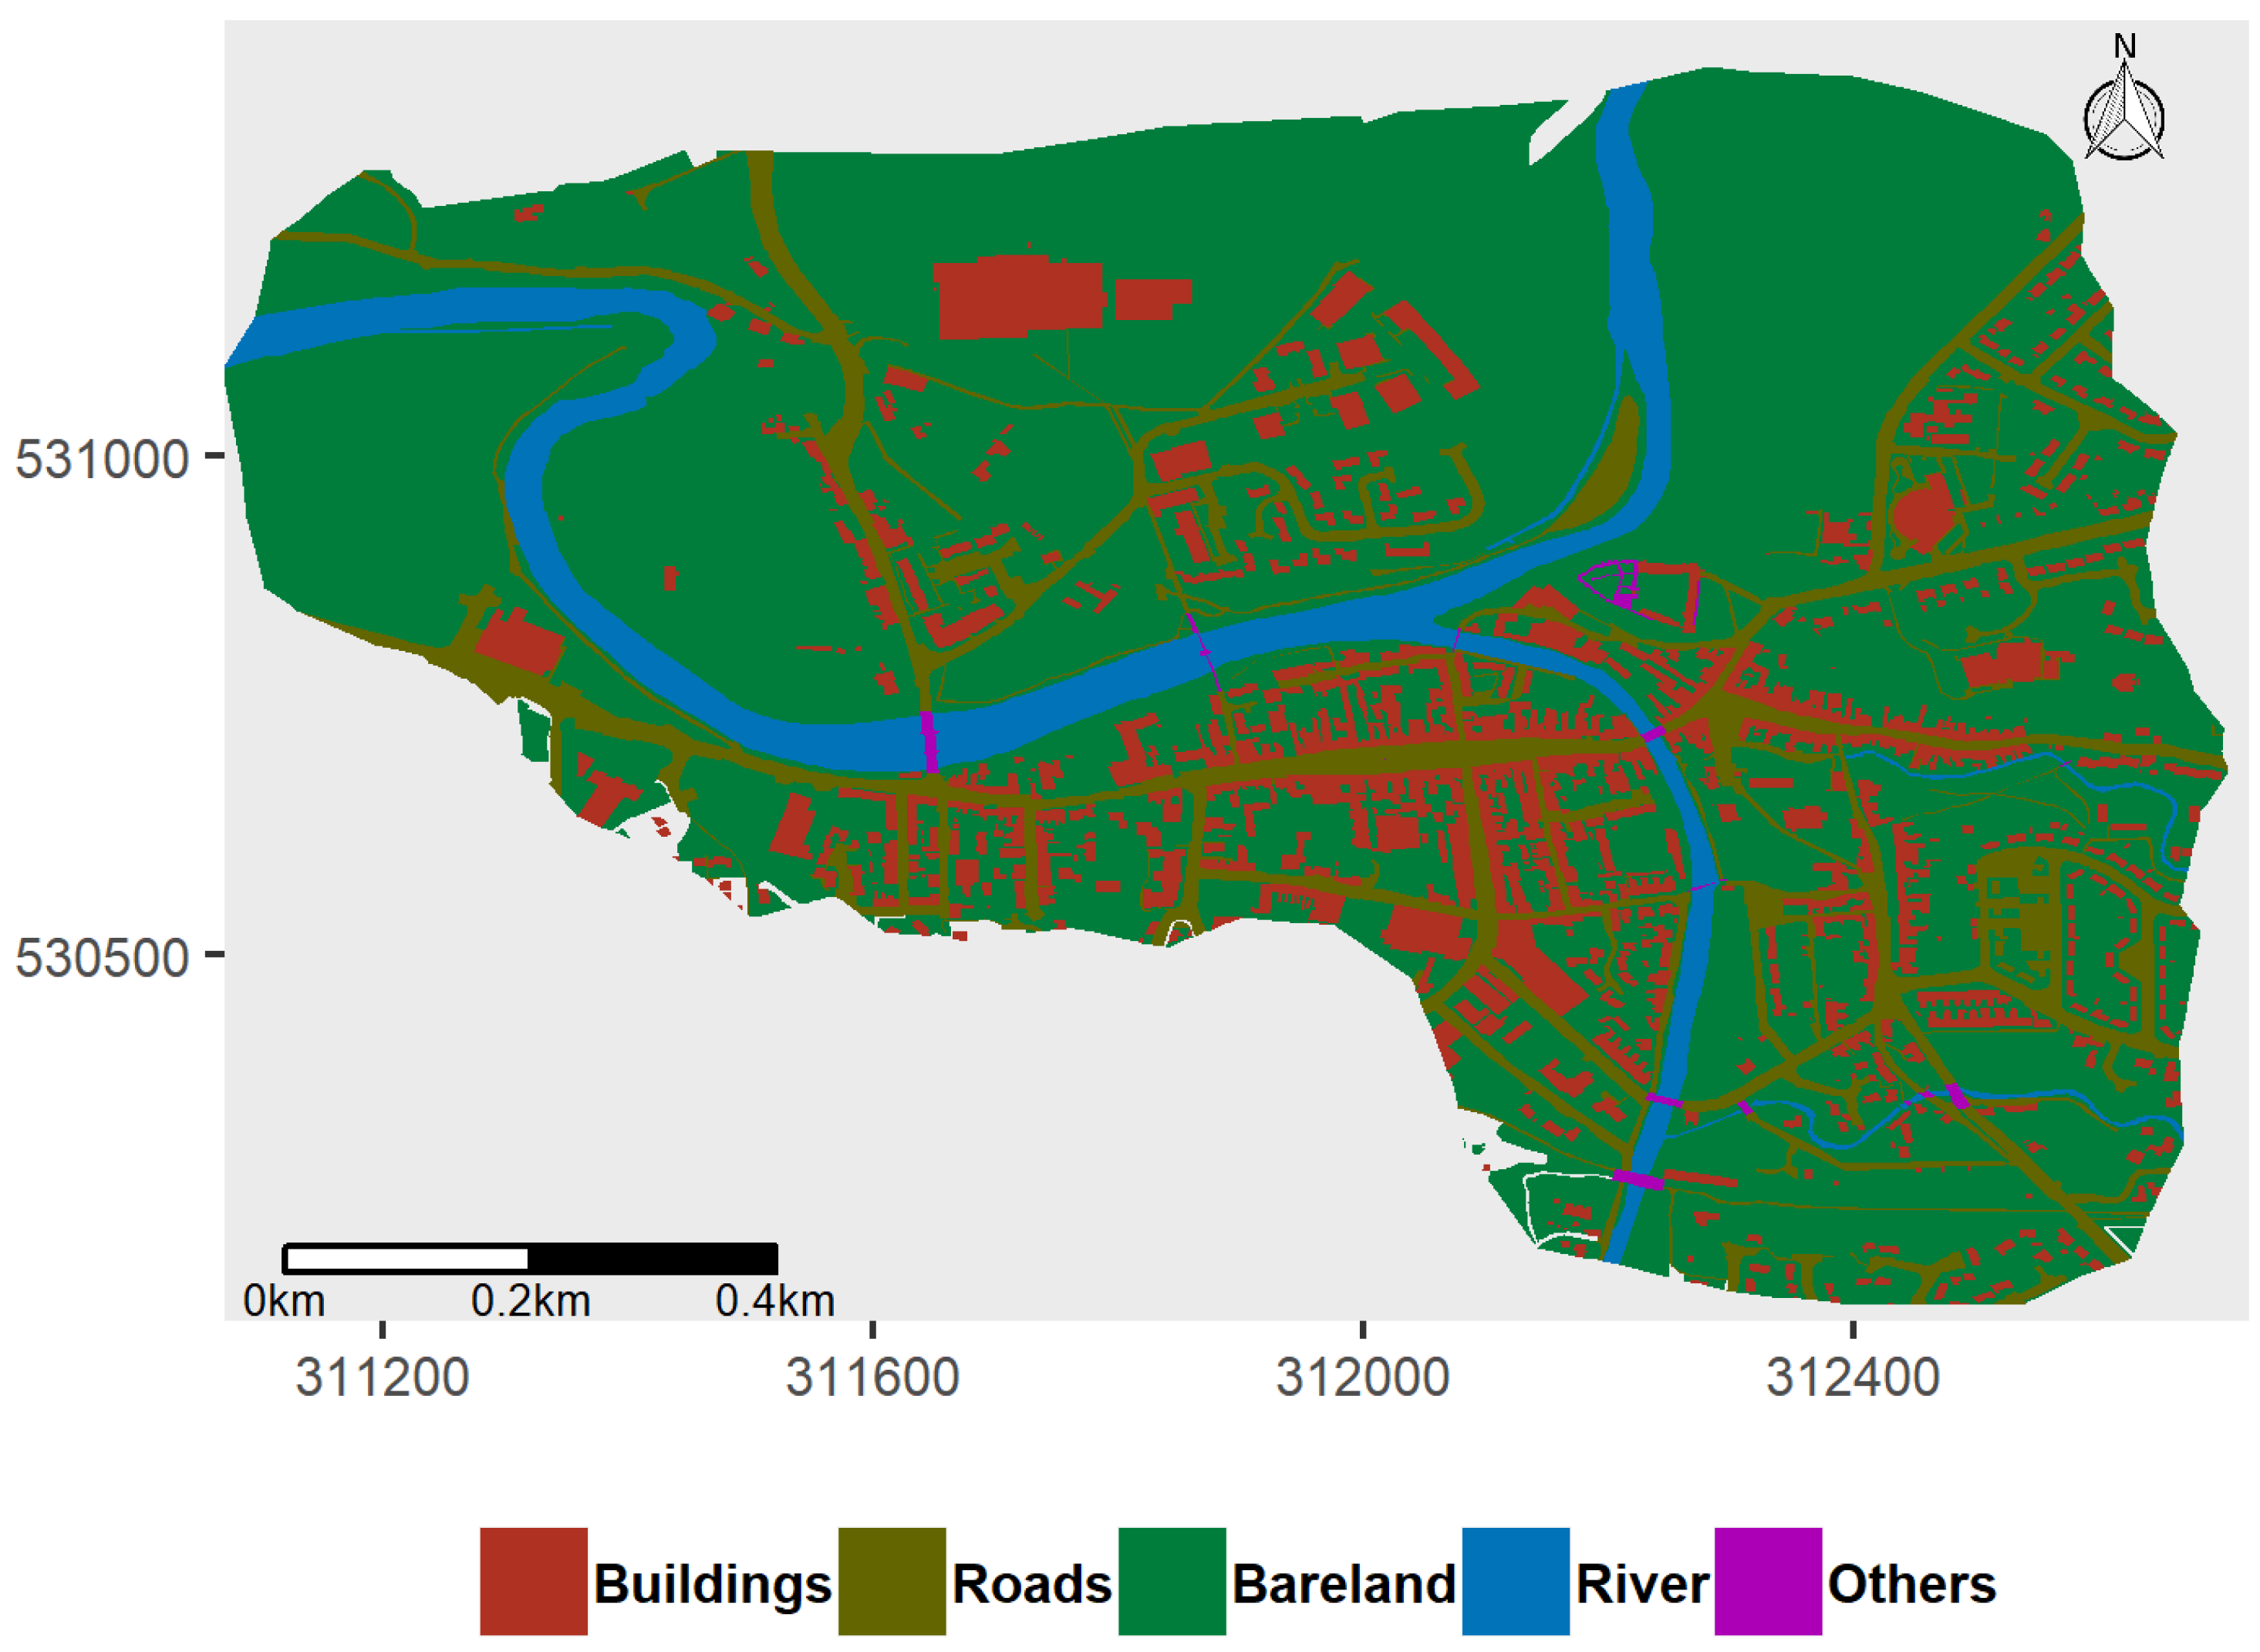
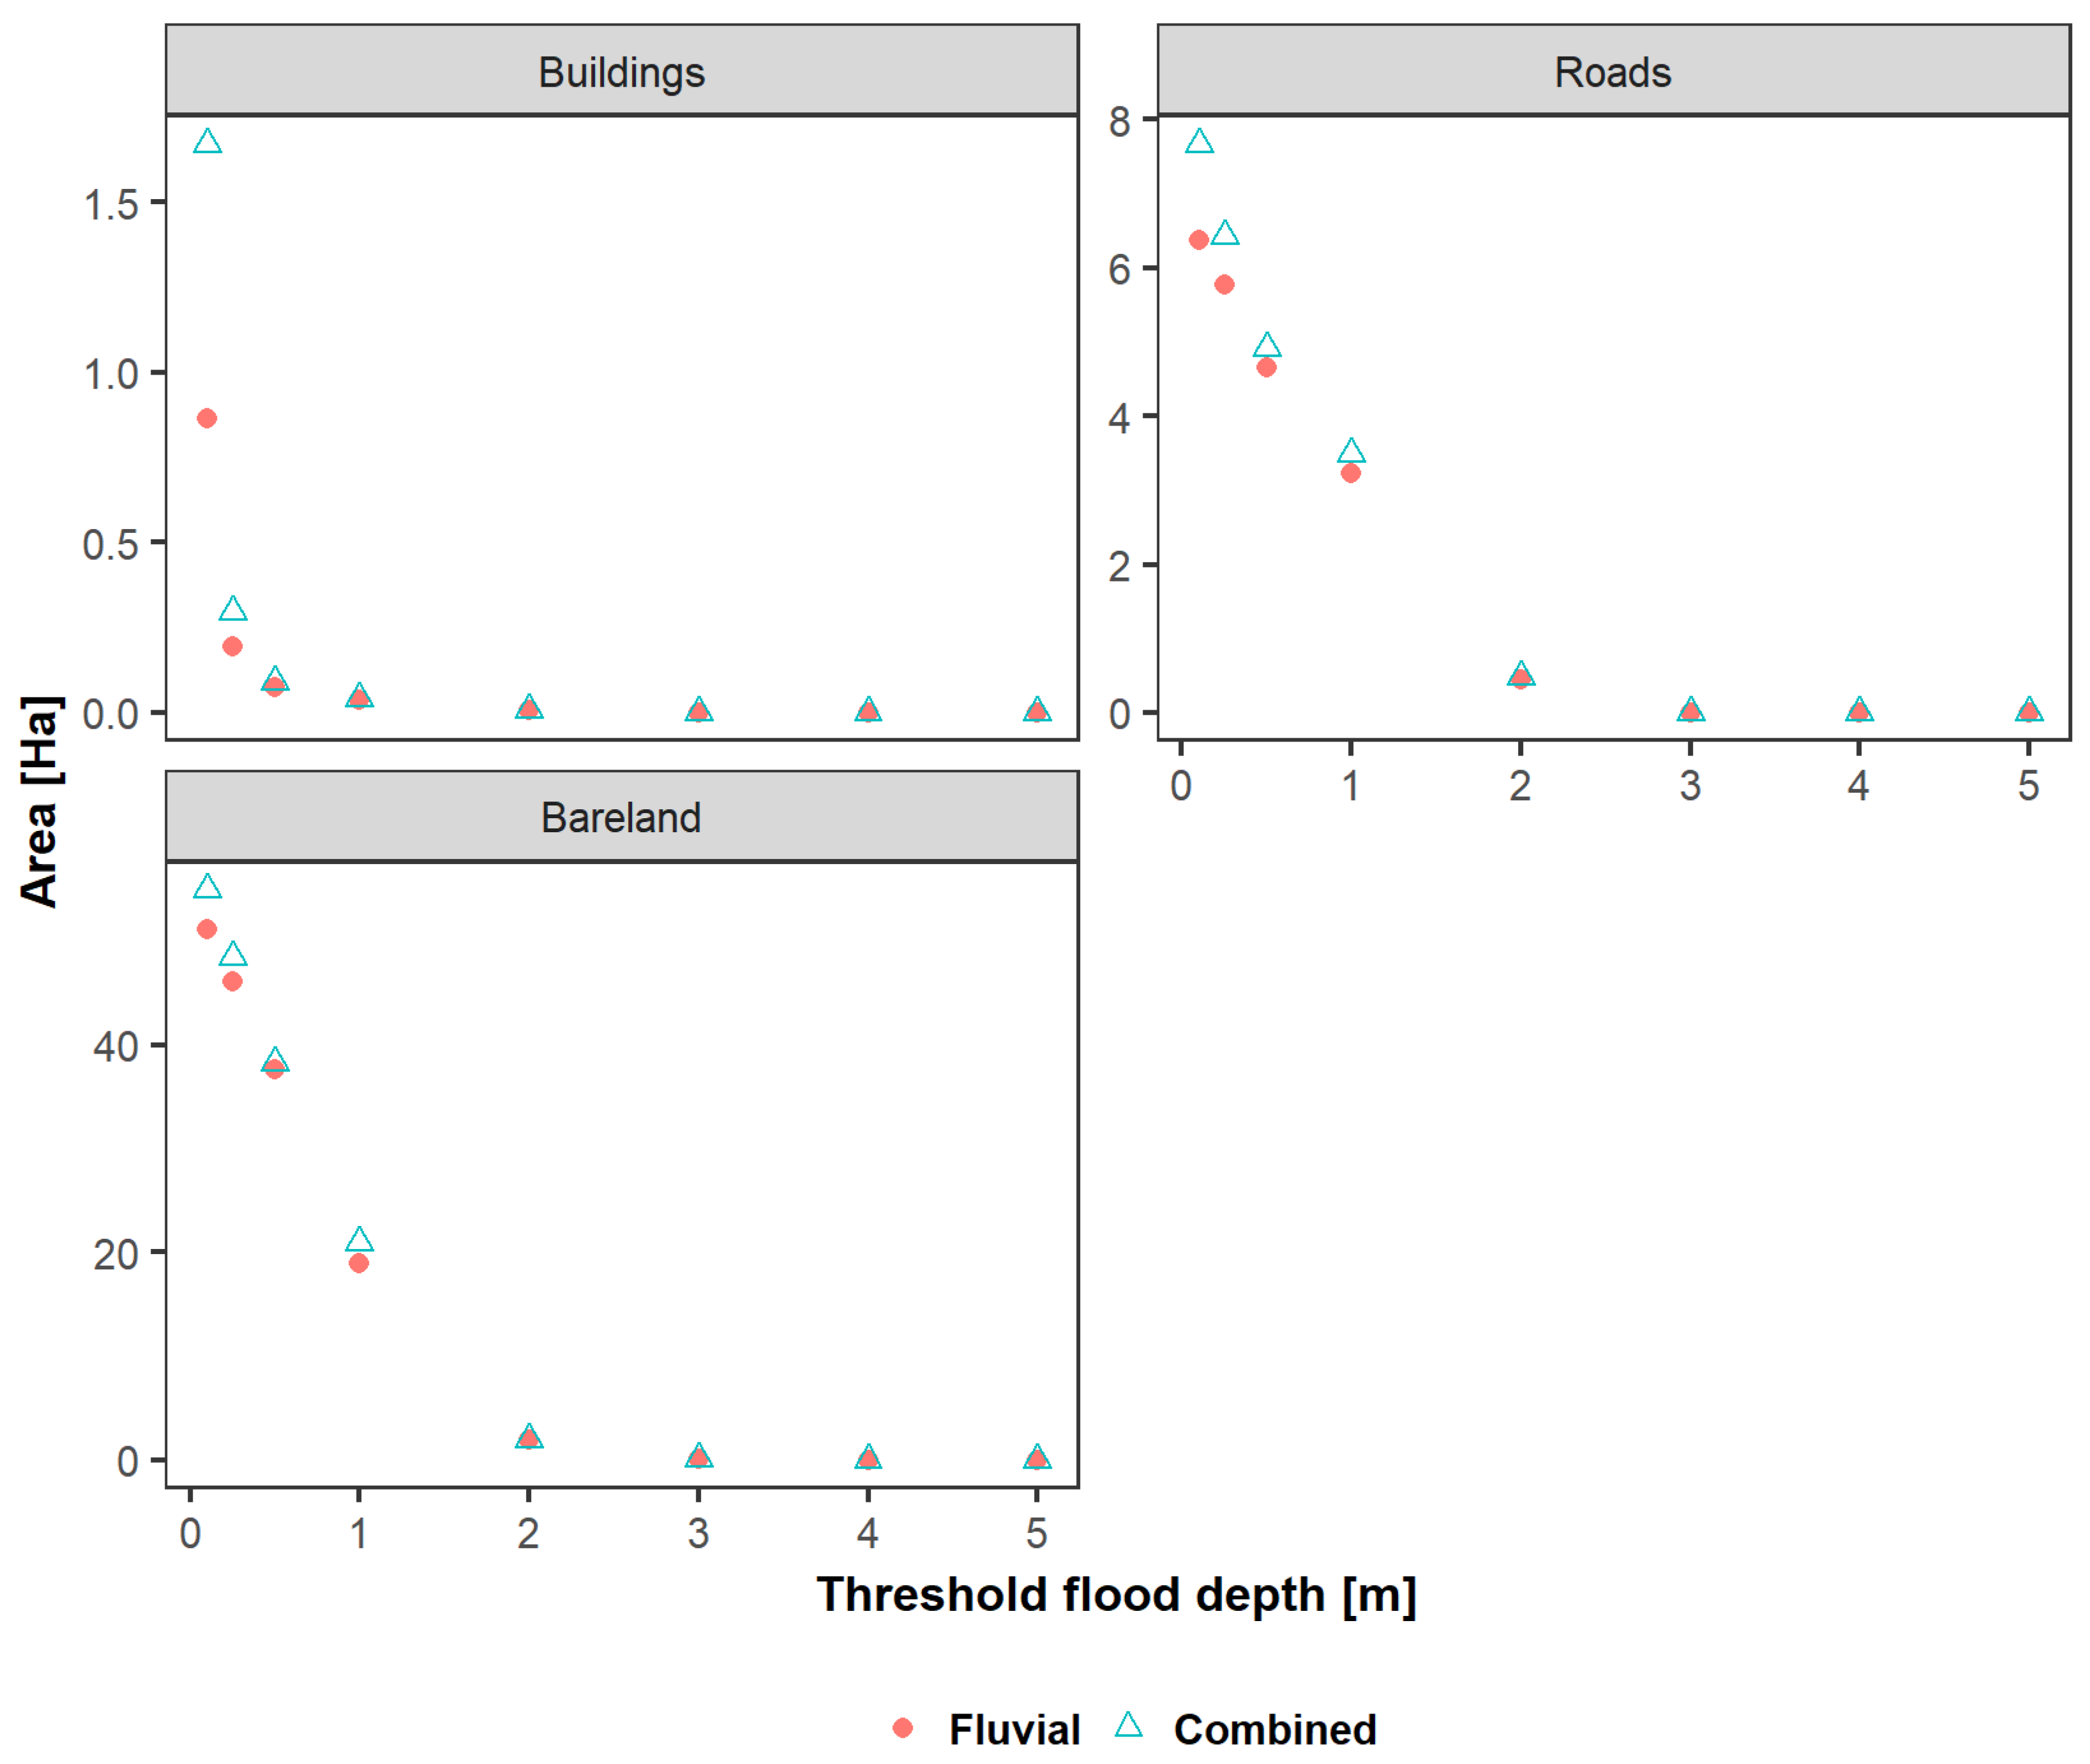
3.1. Flood Extent
3.2. Flood Impact
4. Discussion
5. Conclusions
Author Contributions
Funding
Acknowledgments
Conflicts of Interest
References
- Environment Agency. Flooding in England: A National Assessment of Flood Risk; Environment Agency: Bristol, UK, 2009; Volume 36.
- Sterna, L. Pluvial Flood Damage Modelling—Assessment of the Flood Damage Model HOWAD-PREVENT; Delft University of Technology: Delft, The Netherlands, 2012. [Google Scholar]
- Houston, D.; Werritty, A.; Bassett, D. Pluvial (Rain-Related) Flooding in Urban Areas: The Invisible Hazard; University of Glasgow: Glasgow, UK, 2011. [Google Scholar]
- Bowker, P. Flood Resistance and Resilience Solutions: An R & D Scoping Study; Food and Rural Affairs: London, UK, 2007. [Google Scholar]
- Penning-Rowsell, E.; Priest, S.; Parker, D.; Morris, J.; Tunstall, S.; Viavattene, C.; Chatterton, J.; Owen, D. MCM-Online | The Handbook; Routledge: Abingdon, UK, 2016. [Google Scholar]
- Penning-Rowsell, E.; Priest, S.; Parker, D.; Morris, J.; Tunstall, S.; Viavattene, C.; Chatterton, J.; Owen, D. MCM-Online | The Manual; Routledge: Abingdon, UK, 2013. [Google Scholar]
- Penning-Rowsell, E.C. A realistic assessment of fluvial and coastal flood risk in England and Wales. Trans. Inst. Br. Geogr. 2015, 40, 44–61. [Google Scholar] [CrossRef]
- Arnell, N.W.; Gosling, S.N. The impacts of climate change on river flood risk at the global scale. Clim. Change 2016, 134, 387–401. [Google Scholar] [CrossRef]
- Speight, L.J.; Hall, J.W.; Kilsby, C.G. A multi-scale framework for flood risk analysis at spatially distributed locations. J. Flood Risk Manag. 2017, 10, 124–137. [Google Scholar] [CrossRef]
- Zhou, Q.; Mikkelsen, P.S.; Halsnæs, K.; Arnbjerg-Nielsen, K. Framework for economic pluvial flood risk assessment considering climate change effects and adaptation benefits. J. Hydrol. 2012, 414–415, 539–549. [Google Scholar] [CrossRef]
- Douglas, I.; Garvin, S.; Lawson, N.; Richards, J.; Tippett, J.; White, I. Urban pluvial flooding: A qualitative case study of cause, effect and nonstructural mitigation. J. Flood Risk Manag. 2010, 3, 112–125. [Google Scholar] [CrossRef]
- Olsen, S.A.; Zhou, Q.; Linde, J.J.; Arnbjerg-Nielsen, K. Comparing Methods of Calculating Expected Annual Damage in Urban Pluvial Flood Risk Assessments. Water 2015, 7, 255–270. [Google Scholar] [CrossRef]
- Rivas Casado, M.; Irvine, T.; Johnson, S.; Palma, M.; Leinster, P. The Use of Unmanned Aerial Vehicles to Estimate Direct Tangible Losses to Residential Properties from Flood Events: A Case Study of Cockermouth Following the Desmond Storm. Remote Sens. 2018, 10, 1548. [Google Scholar] [CrossRef]
- Mark, O.; Weesakul, S.; Apirumanekul, C.; Aroonnet, S.B.; Djordjević, S. Potential and limitations of 1D modelling of urban flooding. J. Hydrol. 2004, 299, 284–299. [Google Scholar] [CrossRef]
- Asselman, N.E.M.; van Wijngaarden, M. Development and application of a 1D floodplain sedimentation model for the River Rhine in The Netherlands. J. Hydrol. 2002, 268, 127–142. [Google Scholar] [CrossRef]
- Cobby, D.M.; Mason, D.C.; Davenport, I.J. Image processing of airborne scanning laser altimetry data for improved river flood modelling. ISPRS J. Photogramm. Remote Sens. 2001, 56, 121–138. [Google Scholar] [CrossRef]
- Chen, A.S.; Evans, B.; Djordjević, S.; Savić, D.A. A coarse-grid approach to representing building blockage effects in 2D urban flood modelling. J. Hydrol. 2012, 426–427, 1–16. [Google Scholar] [CrossRef]
- Vojinovic, Z.; Tutulic, D. On the use of 1D and coupled 1D-2D modelling approaches for assessment of flood damage in urban areas. Urban Water J. 2009, 6, 183–199. [Google Scholar] [CrossRef]
- Leandro, J.; Chen, A.S.; Djordjević, S.; Savić, D.A. Comparison of 1D/1D and 1D/2D Coupled (Sewer/Surface) Hydraulic Models for Urban Flood Simulation. J. Hydraul. Eng. 2009, 135, 495–504. [Google Scholar] [CrossRef]
- Saksena, S.; Merwade, V. Incorporating the effect of DEM resolution and accuracy for improved flood inundation mapping. J. Hydrol. 2015, 530, 180–194. [Google Scholar] [CrossRef]
- Vaze, J.; Teng, J.; Spencer, G. Impact of DEM accuracy and resolution on topographic indices. Environ. Model. Softw. 2010, 25, 1086–1098. [Google Scholar] [CrossRef]
- Ogania, J.L.; Puno, G.R.; Alivio, M.B.T.; Taylaran, J.M.G. Effect of digital elevation model’s resolution in producing flood hazard maps. Glob. J. Environ. Sci. Manag. 2019, 5, 95–106. [Google Scholar]
- Bates, P.D. Integrating remote sensing data with flood inundation models: how far have we got? Hydrol. Process. 2012, 26, 2515–2521. [Google Scholar] [CrossRef]
- Rigelsford, J. Remote Sensing in Hydrology and Water Management. Sens. Rev. 2001, 21, ii-ii(1). [Google Scholar] [CrossRef]
- Kheder, D.K. Application of Remote Sensing and GIS for Flood Risk Assessment: A case study of Al Kharj Valley Saudi Arabia. Int. J. Sci. Eng. Res. 2014, 5, 110–115. [Google Scholar]
- Chen, B.; Krajewski, W.F.; Goska, R.; Young, N. Using LiDAR surveys to document floods: A case study of the 2008 Iowa flood. J. Hydrol. 2017, 553, 338–349. [Google Scholar] [CrossRef]
- Ettritch, G.; Hardy, A.; Bojang, L.; Cross, D.; Bunting, P.; Brewer, P. Enhancing digital elevation models for hydraulic modelling using flood frequency detection. Remote Sens. Environ. 2018, 217, 506–522. [Google Scholar] [CrossRef]
- dhi MIKE. Available online: https://www.mikepoweredbydhi.com/ (accessed on 16 December 2018).
- innovyze InfoWorks. Available online: http://www.innovyze.com/products/infoworks_icm/ (accessed on 16 December 2018).
- USACE HECRAS. Available online: http://www.hec.usace.army.mil/software/hec-ras/ (accessed on 16 December 2018).
- Oliver, G.; Tim, A. Surface Water Flooding Hazard Impact Model Impact Library Refinement and Testing: Phase 2 Report. 2016, Volume 44. Available online: http://www.naturalhazardspartnership.org.uk/wp-content/uploads/2016/10/Surface-Water-Flooding-Hazard-Impact-Model-Impact-Library-Development_2.0.pdf (accessed on 9 March 2019).
- Visser, F. The Day Roads Became Rivers: A GIS-Based Assessment of Flash Floods in Worcester. In Flood Risk Management: Research and Practice; Huntington, S., Samuels, P., Allsop, W., Harrop, J., Eds.; CRC Press: London, UK, 2008; pp. 1617–1621. [Google Scholar]
- Visser, F. Rapid mapping of urban development from historic Ordnance Survey maps: An application for pluvial flood risk in Worcester. J. Maps 2014, 10, 276–288. [Google Scholar] [CrossRef]
- Office for National Statistics Local statistics—Office for National Statistics. Available online: https://www.ons.gov.uk/help/localstatistics (accessed on 16 November 2018).
- Met Office UK STORM CENTRE. Available online: https://www.metoffice.gov.uk/barometer/uk-storm-centre (accessed on 16 November 2018).
- McCall, I.; Evans, C. Flood Investigation Report; Environment Agency: Bristol, UK; Cumbria County Council: Cumbria, UK, 2016.
- The National River Flow Archive 75003—Derwent at Ouse Bridge. Available online: https://nrfa.ceh.ac.uk/data/station/info/75003 (accessed on 3 January 2019).
- The National River Flow Archive 75004—Cocker at Southwaite Bridge. Available online: https://nrfa.ceh.ac.uk/data/station/info/75004 (accessed on 3 January 2019).
- MetOffice UK Storm Desmond. Available online: https://www.metoffice.gov.uk/barometer/uk-storm-centre/storm-desmond (accessed on 17 December 2018).
- Gaugemap Kingfisher Cockermouth. Available online: https://www.gaugemap.co.uk/#!Detail/649 (accessed on 4 January 2019).
- Gaugemap South Street Footbridge. Available online: https://www.gaugemap.co.uk/#!Detail/648 (accessed on 4 January 2019).
- UK Civil Aviation Authority—Safety and Airspace Regulation Group. CAP722: Unmanned Aircraft System Operations in UK Airspace-Guidance; UK Civil Aviation Authority: London, UK, 2015. [Google Scholar]
- UK Civil Aviation Authority—The Office of the General Counsel. CAP 393: The Air Navigation Order 2016 and Regulations; UK Civil Aviation Authority: London, UK, 2018. [Google Scholar]
- Aviation Weather Centre METAR Data. Available online: https://www.aviationweather.gov/metar/data?ids=EGOM&format=decoded&hours=36&taf=on&layout=on&date=0 (accessed on 4 January 2019).
- Environment Agency. Available online: https://data.gov.uk/dataset/80c522cc-e0bf-4466-8409-57a04c456197/lidar-composite-dsm-1m (accessed on 25 July 2018).
- Patel, D.P.; Ramirez, J.A.; Srivastava, P.K.; Bray, M.; Han, D. Assessment of flood inundation mapping of Surat city by coupled 1D/2D hydrodynamic modeling: A case application of the new HEC-RAS 5. Nat. Hazards 2017, 89, 93–130. [Google Scholar] [CrossRef]
- Moya Quiroga, V.; Kure, S.; Udo, K.; Mano, A. Application of 2D numerical simulation for the analysis of the February 2014 Bolivian Amazonia flood: Application of the new HEC-RAS version 5. RIBAGUA Rev. Iberoam. del Agua 2016, 3, 25–33. [Google Scholar] [CrossRef]
- Pasquier, U.; He, Y.; Hooton, S.; Goulden, M.; Hiscock, K.M. An integrated 1D–2D hydraulic modelling approach to assess the sensitivity of a coastal region to compound flooding hazard under climate change. Nat. Hazards 2018, 94, 1–23. [Google Scholar] [CrossRef]
- U.S. Army Corps of Engineering. HEC-RAS 5.0 Hydraulic Reference Manual; U.S. Army Corps of Engineers, Institute for Water Resources, Hydrologic Engineering Center: Davis, CA, USA, 2016; ISBN CPD-68.
- Environment Agency. What Is the Updated Flood Map for Surface Water? Environment Agency: Bristol, UK, 2013.
- Forlani, G.; Dall’Asta, E.; Diotri, F.; di Cella, U.M.; Roncella, R.; Santise, M. Quality assessment of DSMs produced from UAV flights georeferenced with on-board RTK positioning. Remote Sens. 2018, 10, 311. [Google Scholar] [CrossRef]
- Leitão, J.P.; Moy De Vitry, M.; Scheidegger, A.; Rieckermann, J. Assessing the quality of digital elevation models obtained from mini unmanned aerial vehicles for overland flow modelling in urban areas. Hydrol. Earth Syst. Sci. 2016, 20, 1637–1653. [Google Scholar] [CrossRef]
- Yeh, M.L.; Chou, Y.T.; Yang, L.S. The evaluation of GPS techniques for UAV-based Photogrammetry in Urban Area. Int. Arch. Photogramm. Remote Sens. Spat. Inf. Sci. ISPRS Arch. 2016, 41, 1079–1084. [Google Scholar] [CrossRef]
- Moramarco, T.; Melone, F.; Singh, V.P. Assessment of flooding in urbanized ungauged basins: a case study in the Upper Tiber area, Italy. Hydrol. Process. 2005, 19, 1909–1924. [Google Scholar] [CrossRef]
- Grimaldi, S.; Petroselli, A.; Arcangeletti, E.; Nardi, F. Flood mapping in ungauged basins using fully continuous hydrologic–hydraulic modeling. J. Hydrol. 2013, 487, 39–47. [Google Scholar] [CrossRef]


| Parameter | Value |
|---|---|
| Wingspan | 163 cm |
| Length | 120 cm |
| Lippo battery (30 C, 18.5 V) | 5300 mAh |
| Flight endurance | 50 min |
| GPS | GNSS-RTK – L1/L2 GPS, GLONASS with RTK |
| GPS accuracy (planimetry) | 0.01 cm |
| GPS accuracy (altimetry) | 0.015 cm |
| IMU | 9DOF |
| Take payload | 2.7 kg |
| SSFB | KF | |
|---|---|---|
| RMSE (m) | 0.28 | 0.69 |
| Percentage error in the prediction of peak flow | 6% | 1% |
| The Contribution of Pluvial Flooding in Total Flood Depth | Number of Properties |
|---|---|
| 0 (Fluvial flooding only) | 16 |
| (0%, 25%] | 84 |
| (25%, 50%] | 41 |
| (50%, 75%] | 11 |
| (7%, 100%) | 10 |
| 100% (Pluvial flooding only) | 51 |
| Total | 213 |
© 2019 by the authors. Licensee MDPI, Basel, Switzerland. This article is an open access article distributed under the terms and conditions of the Creative Commons Attribution (CC BY) license (http://creativecommons.org/licenses/by/4.0/).
Share and Cite
Muthusamy, M.; Rivas Casado, M.; Salmoral, G.; Irvine, T.; Leinster, P. A Remote Sensing Based Integrated Approach to Quantify the Impact of Fluvial and Pluvial Flooding in an Urban Catchment. Remote Sens. 2019, 11, 577. https://0-doi-org.brum.beds.ac.uk/10.3390/rs11050577
Muthusamy M, Rivas Casado M, Salmoral G, Irvine T, Leinster P. A Remote Sensing Based Integrated Approach to Quantify the Impact of Fluvial and Pluvial Flooding in an Urban Catchment. Remote Sensing. 2019; 11(5):577. https://0-doi-org.brum.beds.ac.uk/10.3390/rs11050577
Chicago/Turabian StyleMuthusamy, Manoranjan, Monica Rivas Casado, Gloria Salmoral, Tracy Irvine, and Paul Leinster. 2019. "A Remote Sensing Based Integrated Approach to Quantify the Impact of Fluvial and Pluvial Flooding in an Urban Catchment" Remote Sensing 11, no. 5: 577. https://0-doi-org.brum.beds.ac.uk/10.3390/rs11050577