Vertical Structures of Dust Aerosols over East Asia Based on CALIPSO Retrievals
by
 ,
,
Di Liu
1, 
Tianliang Zhao
1,*,
Richard Boiyo
1,2,
Siyu Chen
3,*,
Zhengqi Lu
1,
Yan Wu
4 and
Yang Zhao
5,6 1
Collaborative Innovation Centre on Forecast and Evaluation of Meteorological Disasters, Key Laboratory of Meteorological Disaster, Ministry of Education (KLME), International Joint Laboratory on Climate and Environment Change (ILCEC), Key Laboratory for Aerosol-Cloud-Precipitation of China Meteorological Administration, School of Atmospheric Physics, Nanjing University of Information Science and Technology, Nanjing 210044, China
2
Department of Physical Sciences, Meru University of Science and Technology, P.O. Box 972-60200 Meru, Kenya
3
Key Laboratory for Semi-Arid Climate Change of the Ministry of Education, College of Atmospheric Sciences, Lanzhou University, Lanzhou 730000, China
4
Heilongjiang Meteorological Bureau, Harbin 150030, China
5
State Key Laboratory of Severe Weather, Chinese Academy of Meteorological Sciences, Beijing 100081, China
6
Nanjing University of Information Science and Technology, Nanjing 210044, China
*
Authors to whom correspondence should be addressed.
Remote Sens. 2019, 11(6), 701; https://0-doi-org.brum.beds.ac.uk/10.3390/rs11060701
Submission received: 1 February 2019
/
Revised: 14 March 2019
/
Accepted: 21 March 2019
/
Published: 23 March 2019
(This article belongs to the Special Issue High Resolution Active Optical Remote Sensing Observations of Aerosols, Clouds and Aerosol-Cloud Interactions and Their Implication to Climate)
Abstract
:The spatiotemporal and especially the vertical distributions of dust aerosols play crucial roles in the climatic effect of dust aerosol. In the present study, the spatial-temporal distribution of dust aerosols over East Asia was investigated using Cloud-Aerosol Lidar and Infrared Pathfinder Satellite Observations (CALIPSO) retrievals (01/2007–12/2011) from the perspective of the frequency of dust occurrence (FDO), dust top layer height (TH) and profile of aerosol subtypes. The results showed that a typical dust belt was generated from the dust source regions (the Taklimakan and Gobi Deserts), in the latitude range of 25°N~45°N and reaching eastern China, Japan and Korea and, eventually, the Pacific Ocean. High dust frequencies were found over the dust source regions, with a seasonal sequence from high to low as follows: spring, summer, autumn and winter. Vertically, FDOs peaked at about 2 km over the dust source regions. In contrast, FDOs decreased with altitude over the downwind regions. On the dust belt from dust source regions to downwind regions, the dust top height (TH) was getting higher and higher. The dust TH varied in the range of 1.9–3.1 km above surface elevation (a.s.e.), with high values over the dust source regions and low values in the downwind areas, and a seasonally descending sequence of summer, spring, autumn and winter in accord with the seasonal variation of the boundary layer height. The annual AOD (Aerosol Optical Depth) was generally characterized by two high and two low AOD centers over East Asia. The percent contribution of the Dust Aerosol Optical Depth to the total AOD showed a seasonal variation from high to low as follows: spring, winter, autumn and summer. The vertical profile of the extinction coefficient revealed the predominance of pure dust particles in the dust source regions and a mixture of dust particles and pollutants in the downwind regions. The dust extinction coefficients over the Taklimakan Desert had a seasonal pattern from high to low as follows: spring, winter, summer and autumn. The results of the present study offered an understanding of the horizontal and vertical structures of dust aerosols over East Asia and can be used to evaluate the performance aerosol transport models.
1. Introduction
Dust aerosol, one of the most important aerosol species, modifies the energy balance and the hydrologic cycle directly by absorbing and scattering solar radiation and indirectly by altering cloud microphysical properties [1,2,3]. East Asia, the second largest contributor of dust aerosols in the world, emits nearly 600 tons of dust particles into the atmosphere annually through the erosion of soil mainly from natural conditions and partly from human activities [4,5]. Approximately 30% of the dust particles redeposit back into emission regions, 20% are transported to eastern China, and the rest are transported to the Pacific Ocean and beyond by westerly jets which can significantly affect the Asian monsoon system [6,7]. The deposition of dust particles serves as a key mineral supplement for the marine biopshere and for remote rainforests, thus altering the global carbon cycle [8].
It is well known that the vertical structure of dust aerosols plays a crucial role in the atmospheric thermal structure and the aerosol radiative forcing [9,10]. The vertical distribution of dust aerosols largely determines their residence and transport time [11]. Dust aerosols can also uplift to the upper troposphere and travel around the world via westerlies [12]. However, previous work using aircraft, upper-air sounding balloons and ground-based platforms are limited in space and time, offering little information on the vertical structure of dust aerosols. These limitations have been partially addressed with the launch of the Cloud-Aerosol Lidar and Infrared Pathfinder Satellite Observations (CALIPSO) satellite [13,14]. Huang et al. provided an analysis of the distribution of aerosols of different types on a global scale on the basis of five-year CALIPSO data [15]. Guo et al. used CALIPSO, MODIS (Moderate Resolution Imaging Spectroradiometer) and OMI (Ozone Monitoring Instrument) measurements to build three-dimensional (3D) patterns of the occurrence frequency of aerosol, dust and smoke in China [16]. Proestakis et al. described the 3D distribution of dust aerosols over southeastern Asia [17]. Nan et al. investigated the vertical distribution of dust particles for the Taklimakan Desert and for the downwind regions using CALIPSO measurement [18].
In this study, we used five years (January 2007 to December 2011) of CALIPSO Level 3 data to gain further insights into the generation, emission, transport, distribution and speciation of aerosols over East Asia. East Asia was divided into five regions to achieve a stronger understanding of the spatial distribution of dust aerosols in relation to emission sources and transport processes. For each region, the analysis was made of the frequency of dust occurrence (FDO), dust Top Height (TH), Aerosol Optical Depth (AOD), percent contribution of dusts to the total AOD (D_AOD), light extinction coefficient, speciation (pure dust versus pollution aerosols) and horizontal dust transport flux.
A previous study conducted over our study domain concentrated mainly on individual dust storm events involving pure dust [19]. However, human health concerns and policy on pollution controls require detailed knowledge of the speciation of dust (pure dust versus dust mixed with biomass burning smoke) and the mean behaviors of total dust (sum of pure and polluted dust). Another related study documented the seasonal variations of the aerosol extinction profile and occurrence frequency using five-year Level 3 CALIPSO products, focusing on global patterns [15]. In the present study, we also used the Level 3 products, but focused on regional patterns and specifically on the contrast between pure dusts generated from dust source regions in western China and those mixed with smoke from pollution source regions in eastern China. By analyzing spatial patterns of AOD, D_AOD and profiles of extinction coefficients of various aerosol types, we further investigated into long-distance dust transport, which is known to impact the public health of populated centers in eastern China, Korea and Japan.
2. Data and Methods
CALIPSO was launched into a sun-synchronous orbit in April, 2006 with a repeating cycle of 16 days. The main instruments aboard CALIPSO include a Cloud-Aerosol Lidar with Orthogonal Polarization (CALIOP), a Wide Field Camera (WFC) and an Infrared Imager Radiometer (IIR). These instruments can not only retrieve the vertical profiles of clouds and aerosols, but also provide information concerning cloud-aerosol interactions and surface radiative budgets [20]. CALIPSO continuously retrieves profiles of attenuated backscatter at 532 and 1064 nm and of polarized backscatter at 532 nm in the latitude range of 82°N–82°S with high horizontal and vertical resolutions of 333 m and 30–60 m, respectively [21].
Three-level products are included in CALIPSO data. Level 1 (L1) products offer a large volume of raw signals of high spatial resolutions. They are classified with a cloud-aerosol discrimination (CAD) algorithm into clouds and aerosols products, with negative and positive values representing aerosols and clouds, respectively. Level 2 (L2) products consist of six aerosol subtypes classified using a scene classification algorithm [22]. The six aerosol subtypes are pure dust, polluted dust, smoke, clean continental, polluted continental and clean marine aerosols with the corresponding Lidar ratios for the retrieval of aerosol light extinction coefficient. Level 3 (L3) products provide specific monthly variables, such as monthly mean AOD and extinction coefficients, from the L2 products. Relative to data products from other space-borne sensors, the CALIPSO data offer three main advantages for the investigation of the vertical distribution and transport of dust particles. First, CALIPSO can retrieve profiles of backscatter in different atmospheric layers to estimate the vertical profiles of aerosols and clouds, can distinguish between dust and other types of aerosols based on the observed depolarization ratios, and can minimize the interference associated with prevailing surface conditions, and hence, are able to retrieve aerosol profiles where other space-borne sensors may not be able to. Second, being an active remote sensor, it can retrieve information on aerosols and clouds in both daylight and night hours [23]. Third, CALIPSO can retrieve the vertical distributions of different aerosol subtypes; such information is crucial for understanding the long-range transport of aerosols at the regional and the global scales.
L3 is a globally monthly product with a 2° × 5° latitude-longitude grid, and a vertical resolution of 60 m from the ground to 12 km with a total of 208 layers. Uncertainties exist when CALIPSO retrieves optical properties [24]. Data on extinction below the height of 180 m were excluded as a precautionary measure to avoid biases resulting from the physical interpretation of near-ground aerosols [25]. Following [15], we also only considered extinction coefficients of >0.001 km−1 to ensure high levels of accuracy.
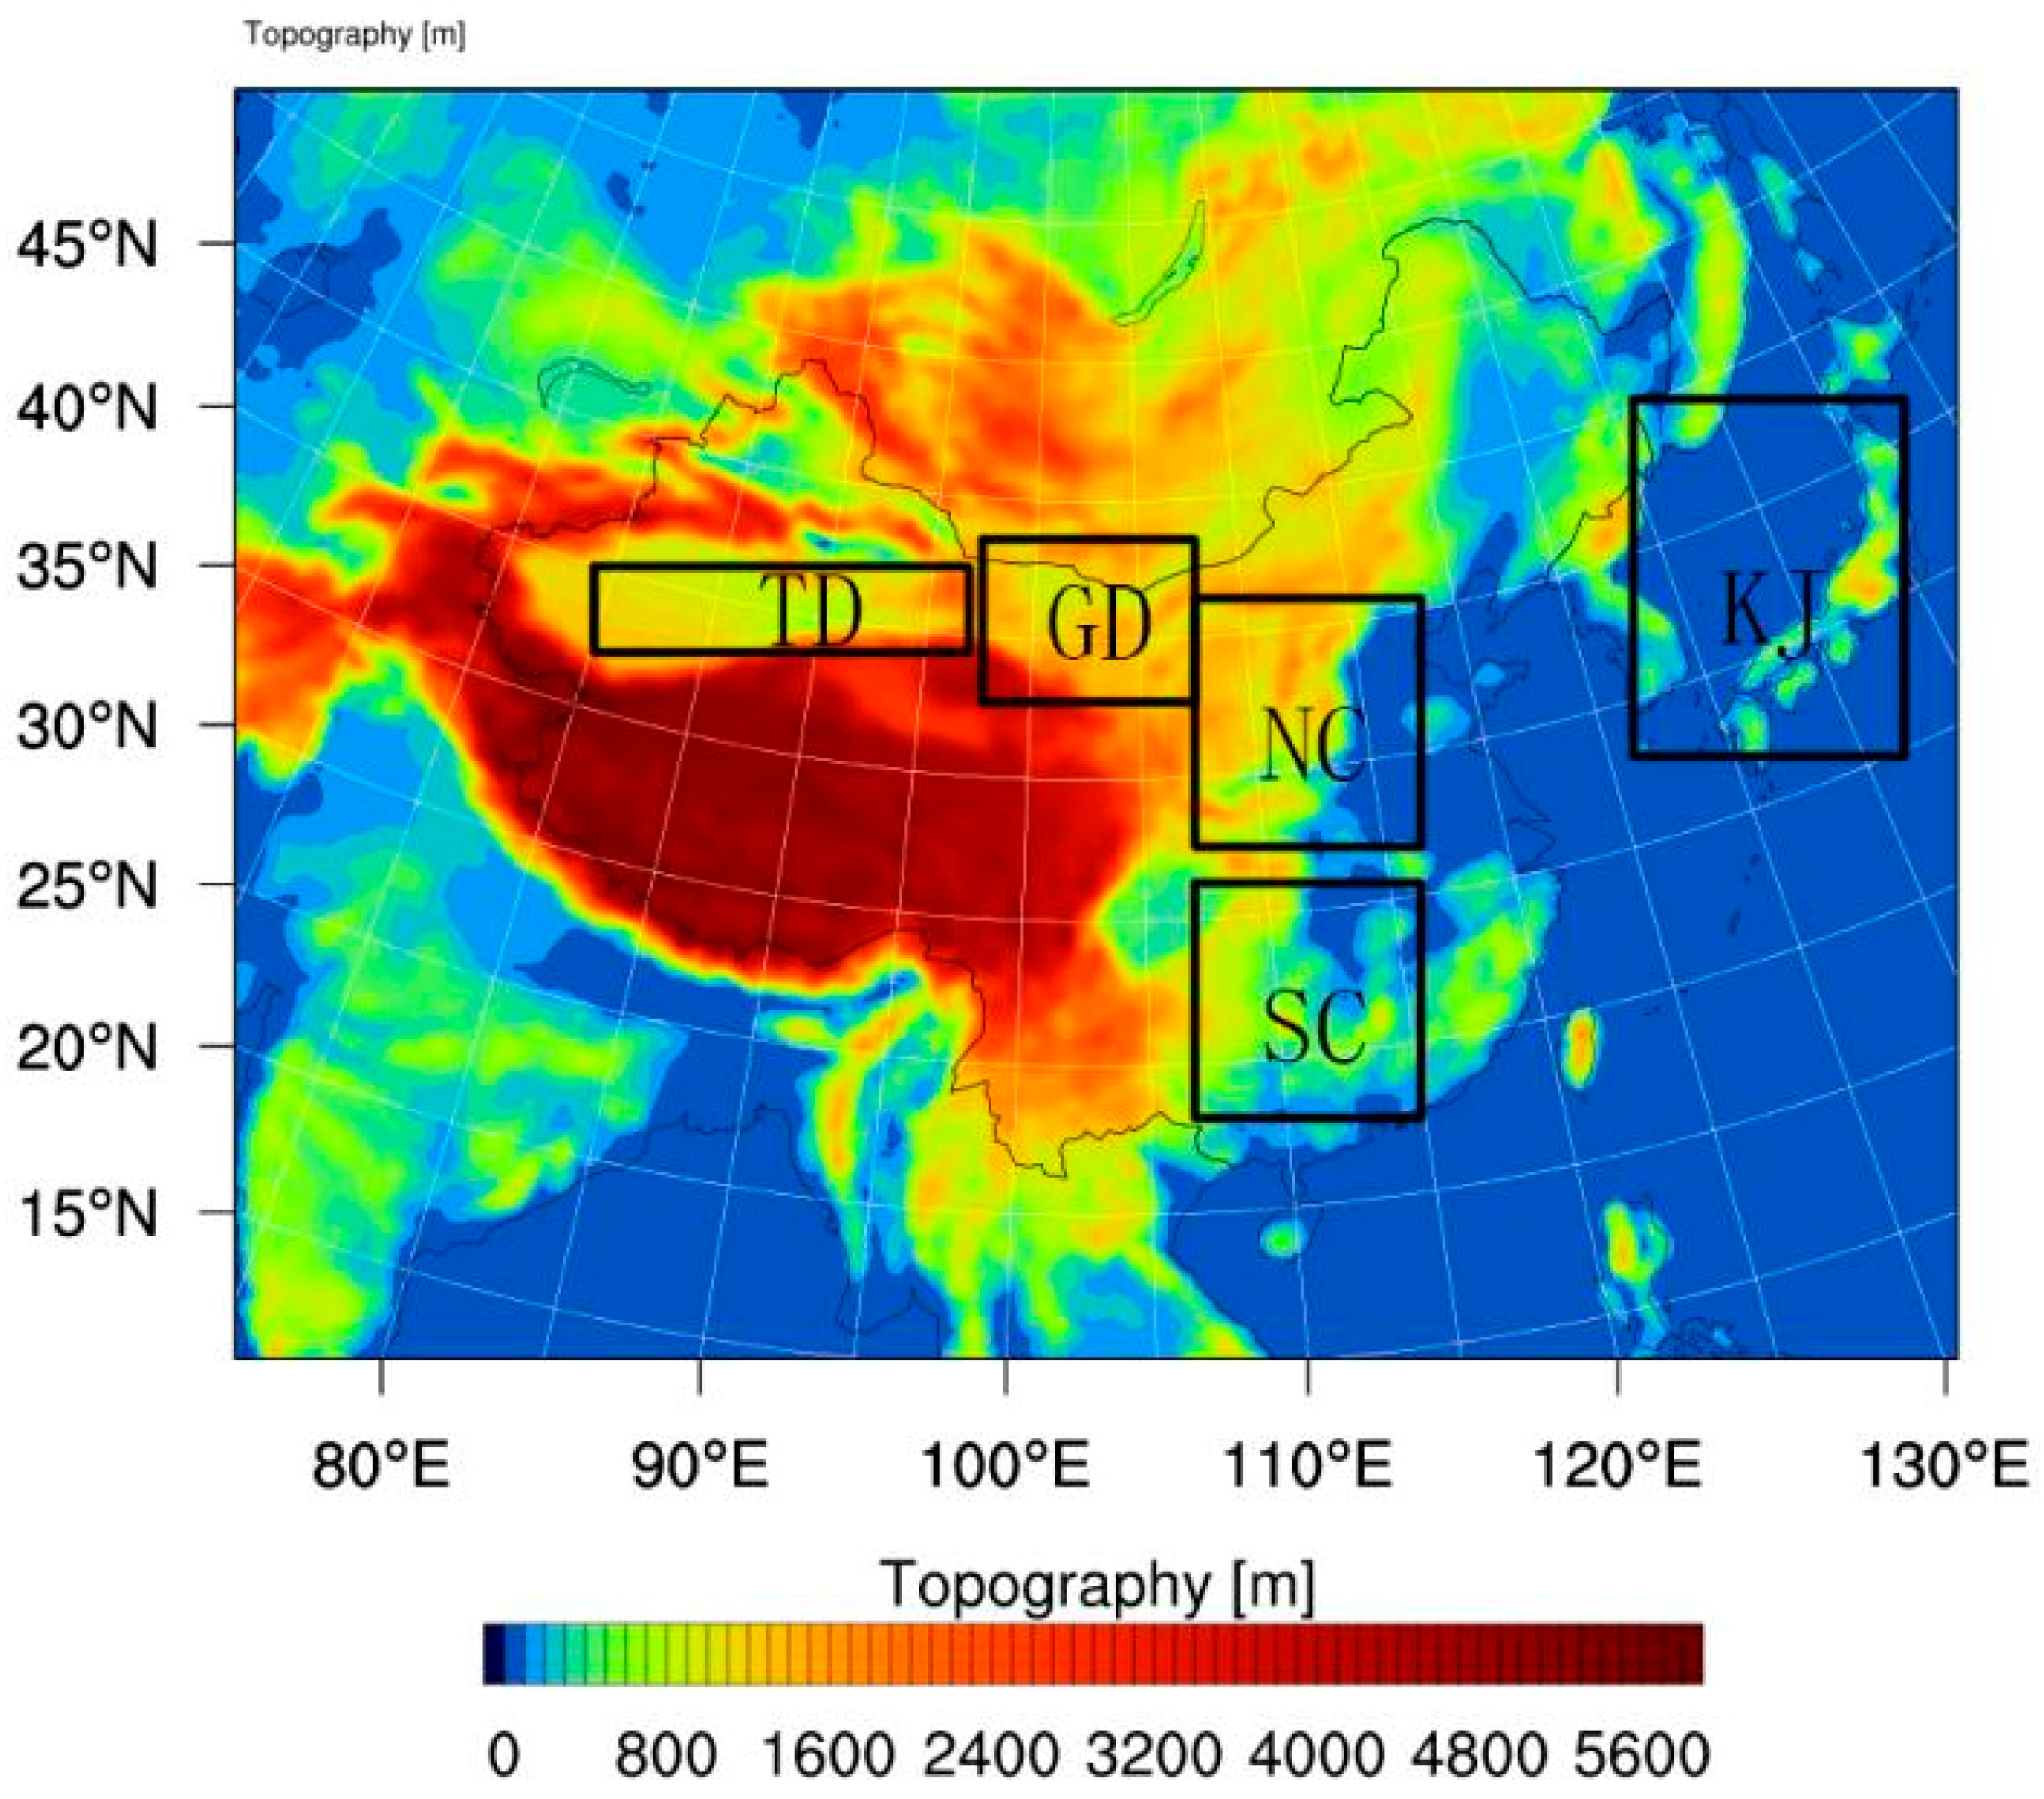
To better understand the distribution of dust aerosols over different surface types, five homogenous regions over East Asia were analyzed in the present study (Figure 1). They include the Taklimakan Desert (TD; dust source region), the Gobi Desert (GD; dust source region), northern China (NC; a region affected by anthropogenic aerosols), southern China (SC; also under the influence of anthropogenic aerosols) and Korea-Japan (KJ; under the influence of marine aerosols).
The FDO is defined as the ratio of the number of CALIPSO overpasses with dust observations to the total number of CALIPSO overpasses (including conditions of clear air and aerosols) [17]:
where Pdust represents the number of CALIPSO dust overpasses and Pall denotes the total number of CALIPSO overpasses.
The seasonally averaged CALIPSO L3 dust profile Top Height (TH) is by definition the height at which dust AOD contribution (D_AOD) aggregates to 98% [17].
The dust column concentration (Mdu) and D_AOD (τdu) are calculated with Equations (2) and (3) [26];
where n(r) represents particle size distribution of dust aerosol, ρ is dust aerosol density and Q is extinction index. Following other researchers [26], we obtain:
according to Kaufman et al. (2005), the horizontal dust transport flux (F) is calculated with Equation (5) [26]:
where W represents the monthly mean west wind speed (m s−1), Mdu is the monthly mean column dust concentration (g m−2), and L is longitudinal length (m). Following other researchers [26,27,28], we adopted wind fields of 500 hPa over the TD and GD and of 850 hPa over the NC and SC.
For the purpose of validation, the CALIPSO AOD and pure dust D_AOD were compared with those from the Modern-Era Retrospective analysis for Research and Applications, version 2 (MERRA-2), over the same time period. MERRA-2 calculation of these parameters is driven by anthropogenic emission inventories and natural dust emission parameterization and is bias-corrected by assimilation of MODIS and AVHRR satellite AOD products [29].
3. Results and Discussion
3.1. Frequency of Dust Occurrence (FDO)
The TD is the largest desert in China and the second largest shifting desert in the world. It emits large volumes of dust particles into the atmosphere annually. Most of the emitted particles are deposited back to the ground primarily as the result of weak tropospheric winds and complex topography: the center of the Tarim Basin is surrounded by mountains toward the south, north and west [30]. Dust episodes are less frequent but more severe over the GD. Most dust particles emitted by the GD are easily uplifted to the troposphere and transported downwind primarily due to the plateau topography (910–1520 m) of the GD. Additionally, as the main desert region of East Asia, the GD includes stationary deserts, such as the Tengger Desert and Badain Jaran Desert, and shifting deserts, such as the Mu Us Sandland. Over the NC and SC, abundant anthropogenic aerosols are mixed with pure dust through long-range transport, forming polluted dusts [31]. The KJ region suffers not only from polluted dust transported by westerlies from upwind regions (e.g., the NC and SC), but also from locally-formed marine aerosols. To understand the generation and transport of dust aerosols over East Asia, we divided the study period into four seasons, March–April–May (MAM), June–July–August (JJA), September–October–November (SON) and December–January–February (DJF), based on prevailing climatological conditions observed over the study domain.
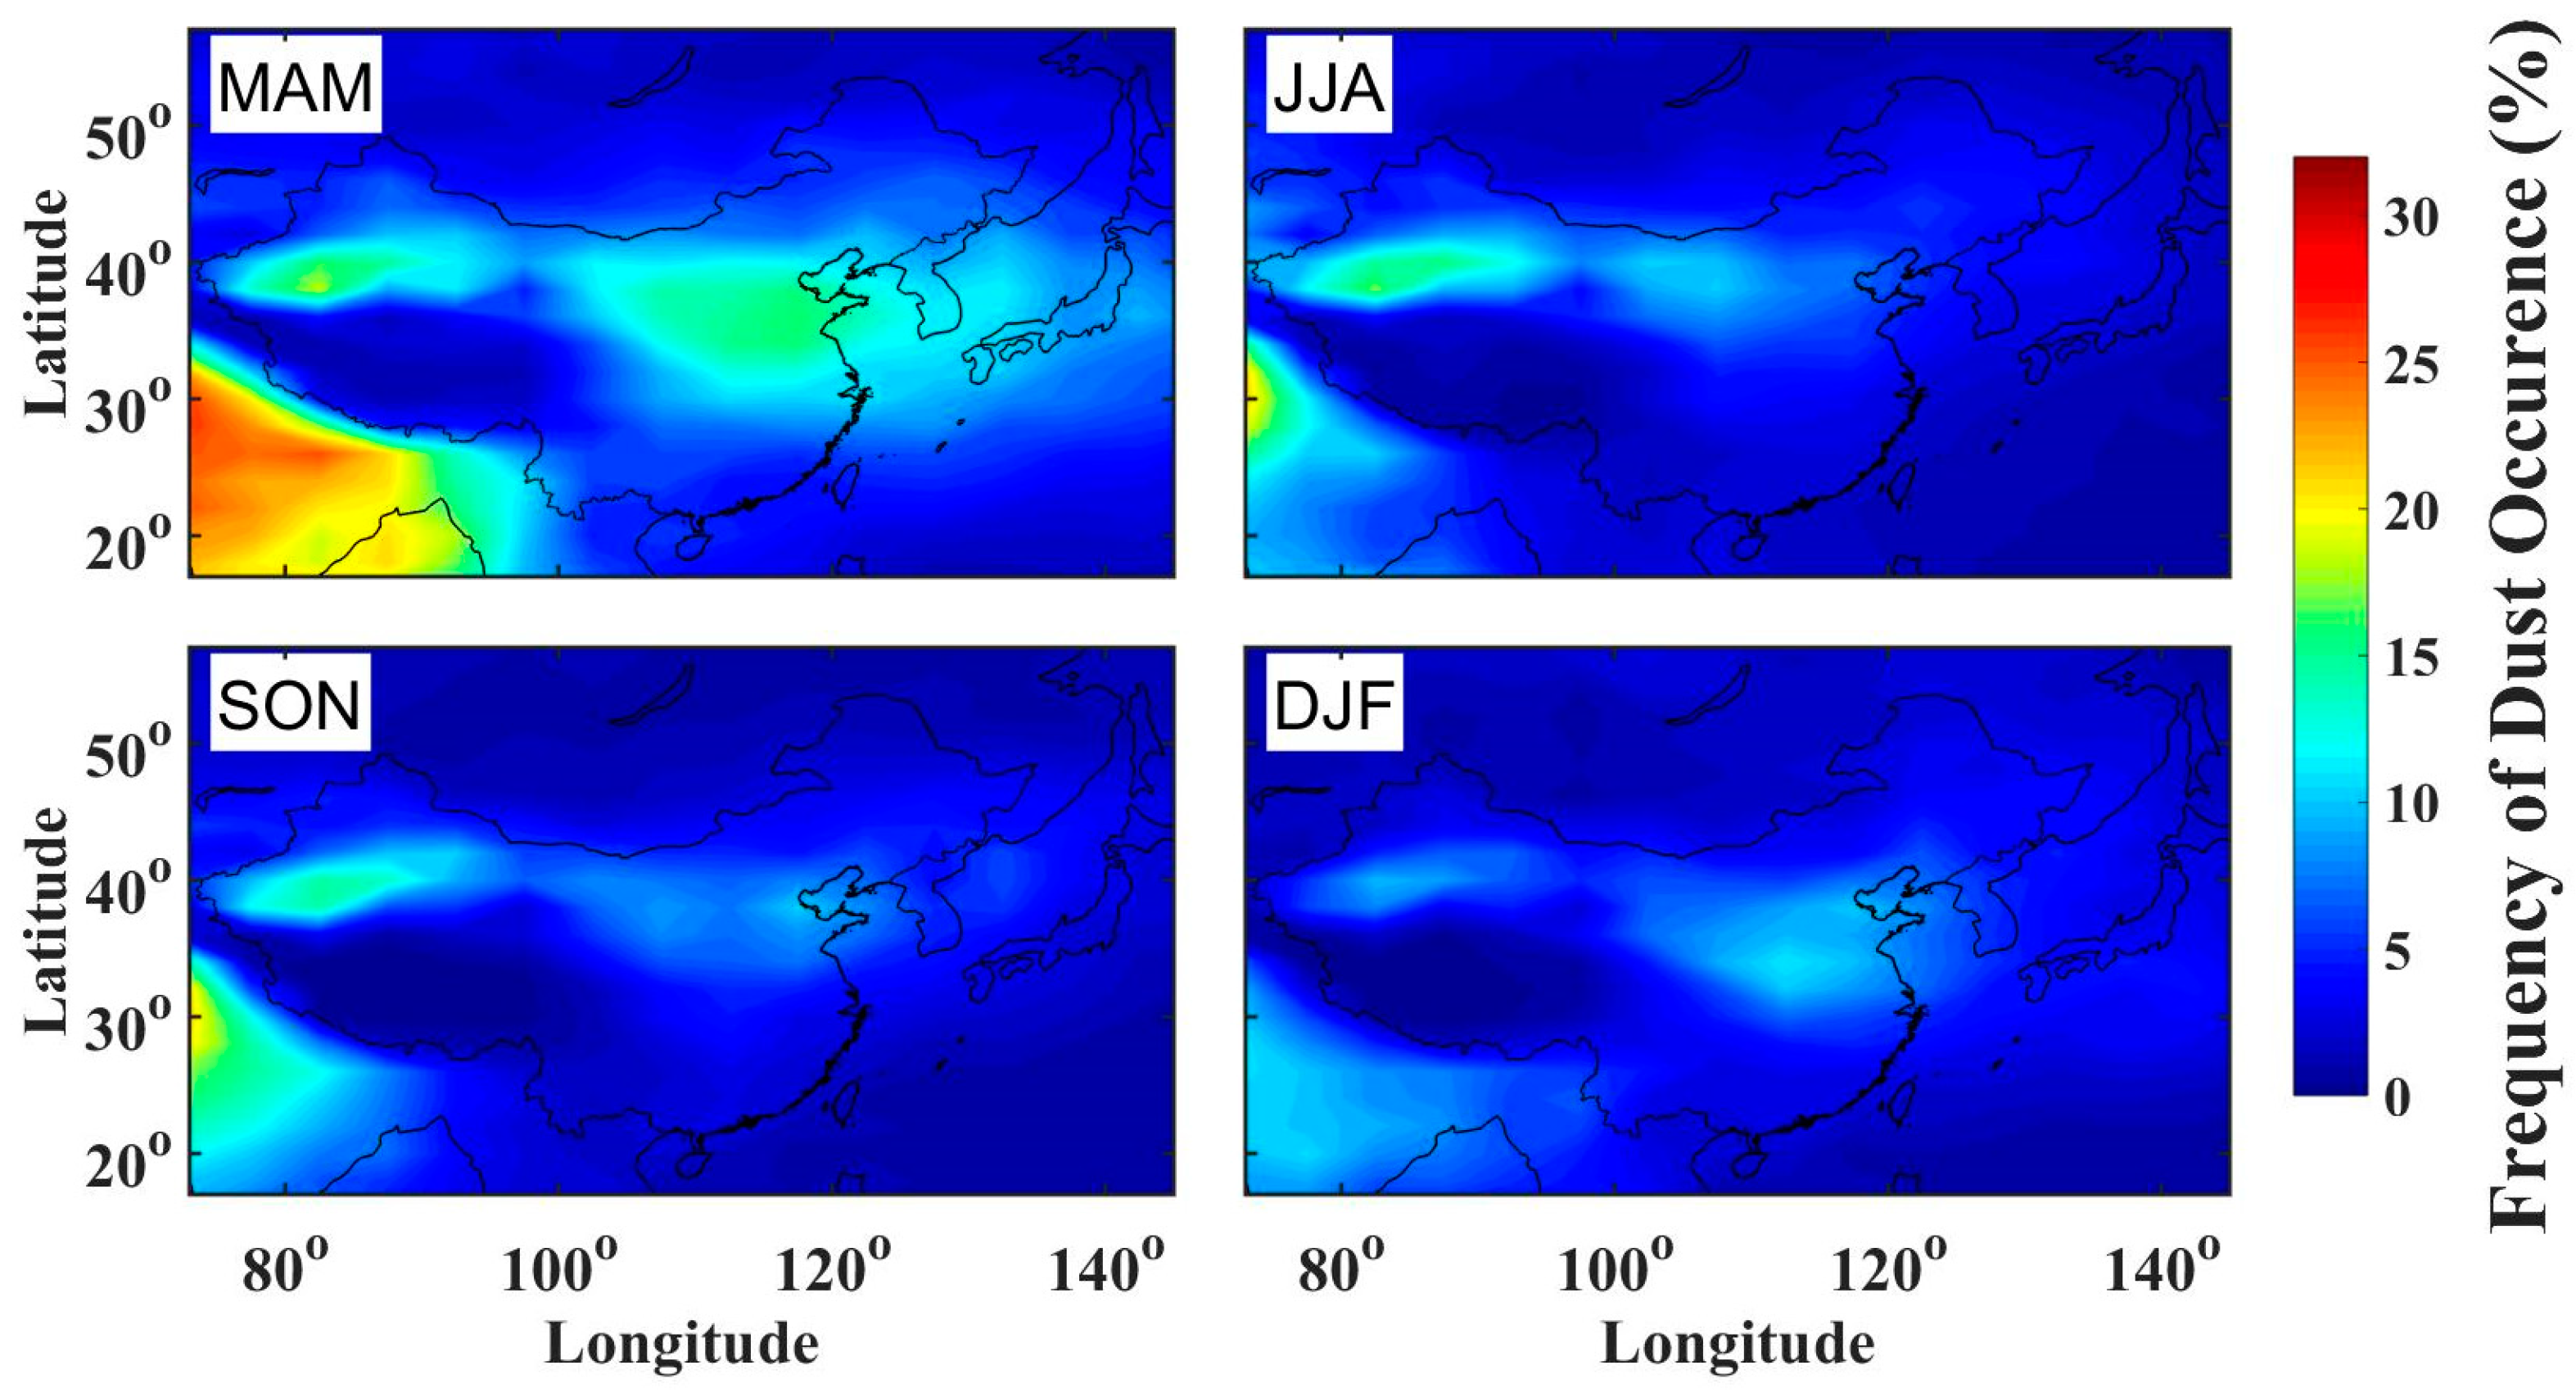
FDO values show significant levels of spatiotemporal heterogeneity, in order from high to low as follows: MAM, JJA, SON and DJF (Figure 2). The highest FDOs of 18.4% were observed over the TD in MAM and decreased in JJA with the highest values of 17.1%. Distributions of FDOs observed during SON corresponded to those observed in JJA but with a lower value of 14.6% over the TD and higher values observed over the NC. The FDOs observed during DJF were the lowest relative to those of other seasons with the highest value of 11% found over the NC. These results were consistent with those reported previously for East Asia [17]. The spatial pattern of seasonally averaged FDOs was characterized by two high FDO centers over dust source regions (the TD and GD). There existed a dust belt from the dust source regions (the TD and GD) to eastern China, Japan, Korea and beyond, in the latitudinal range of 25°N to 45°N. In MAM, FDOs over KJ reached as high as 11 %, which was close to the value for the GD dust source region, indicating efficient long-distance transport in this season. That two distinct FDO patterns exited over the TD and GD implied that the diffusion and long-range transport of dust aerosols from the TD were limited, or to put it differently, most dust aerosols emitted from the TD could not be transported to downwind regions since the TD was mainly surrounded by rugged mountains [3]. Since the whole study domain is under the control of westerlies and obstacles from the Himalayan Mountains, dust aerosols from South Asia and India enter continental China from southwestern China, affecting the NC, SC and KJ in MAM and DJF [32,33,34]. In the NC, the highest value of FDOs of 16.1% was observed during MAM.
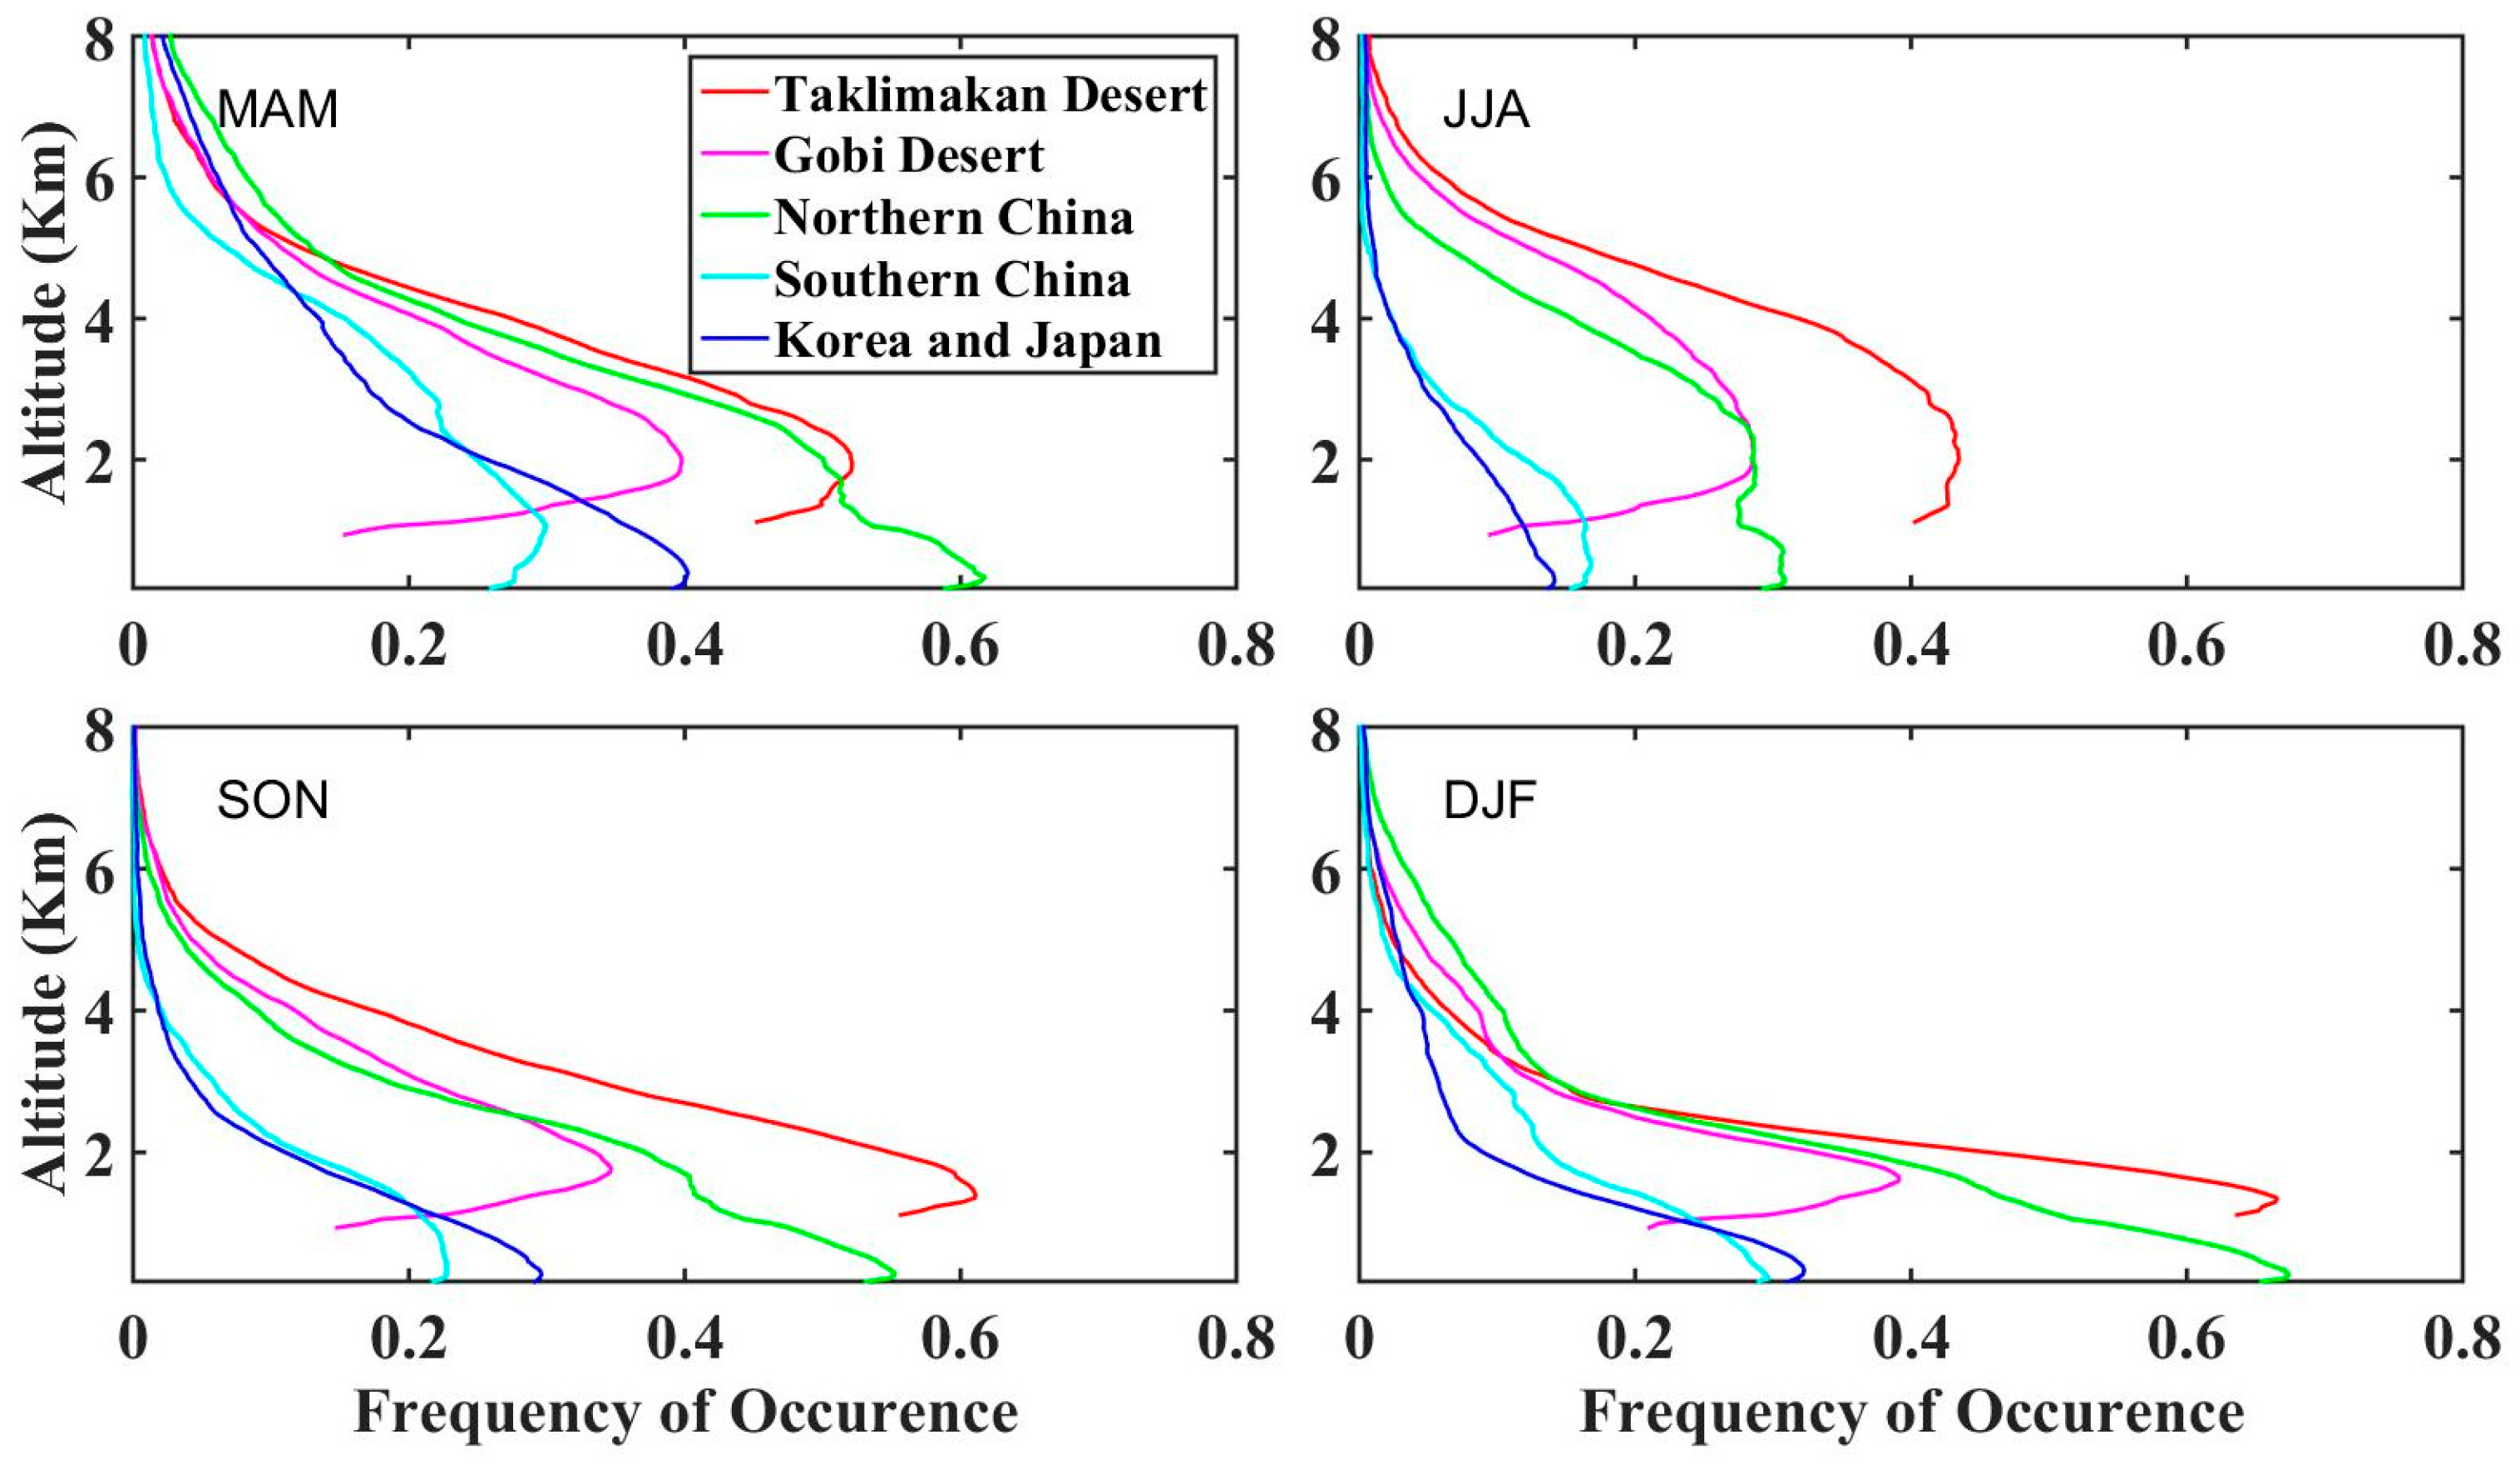
The vertical distributions of the FDO over the dust source regions (TD and GD) follow a comparable pattern, with significant seasonality (Figure 3). The profile peaked at a height of about 2 km above the surface; beyond this height, the FDO decreased with increasing height. In other words, large volumes of dust aerosols were uplifted into the lower troposphere from the dust source regions, where they could undergo mixing and long-range transport (to eastern China and even to the western Pacific Ocean). The peak FDO values were 52.0% and 40.0% in MAM and 43.5% and 28.5% in JJA over the TD and GD, respectively.
Over the regions downwind of these sources (the NC, SC and KJ), FDO decreased with increasing height from the ground to the upper troposphere. The closer to the dust source regions, the higher the FDO: of these three regions, the overall FDO profile showed the highest values over the NC and lowest values over KJ, with the profile over SC generally falling in between. At the NC, the near surface FDO was greater than 60% in MAM, SON and DJF with the highest FDO of 67.1% recorded during DJF. This high value could be attributed to the proximity to the dust regions and to the dominance of aerosols generated by use of fossil fuels [35]. FDOs over the SC ranged from 27.0% to 29.9%, with peak values of 29.9% observed during MAM. The highest FDO observed over the KJ (40.2%) occurred during MAM, a pattern that resembled that of the SC. These profiles confirmed the presence of a dust belt in the latitude range of 25°N to 45°N that transported significant volumes of dust from the dust source regions.
3.2. Seasonal Distribution of Dust Top Height
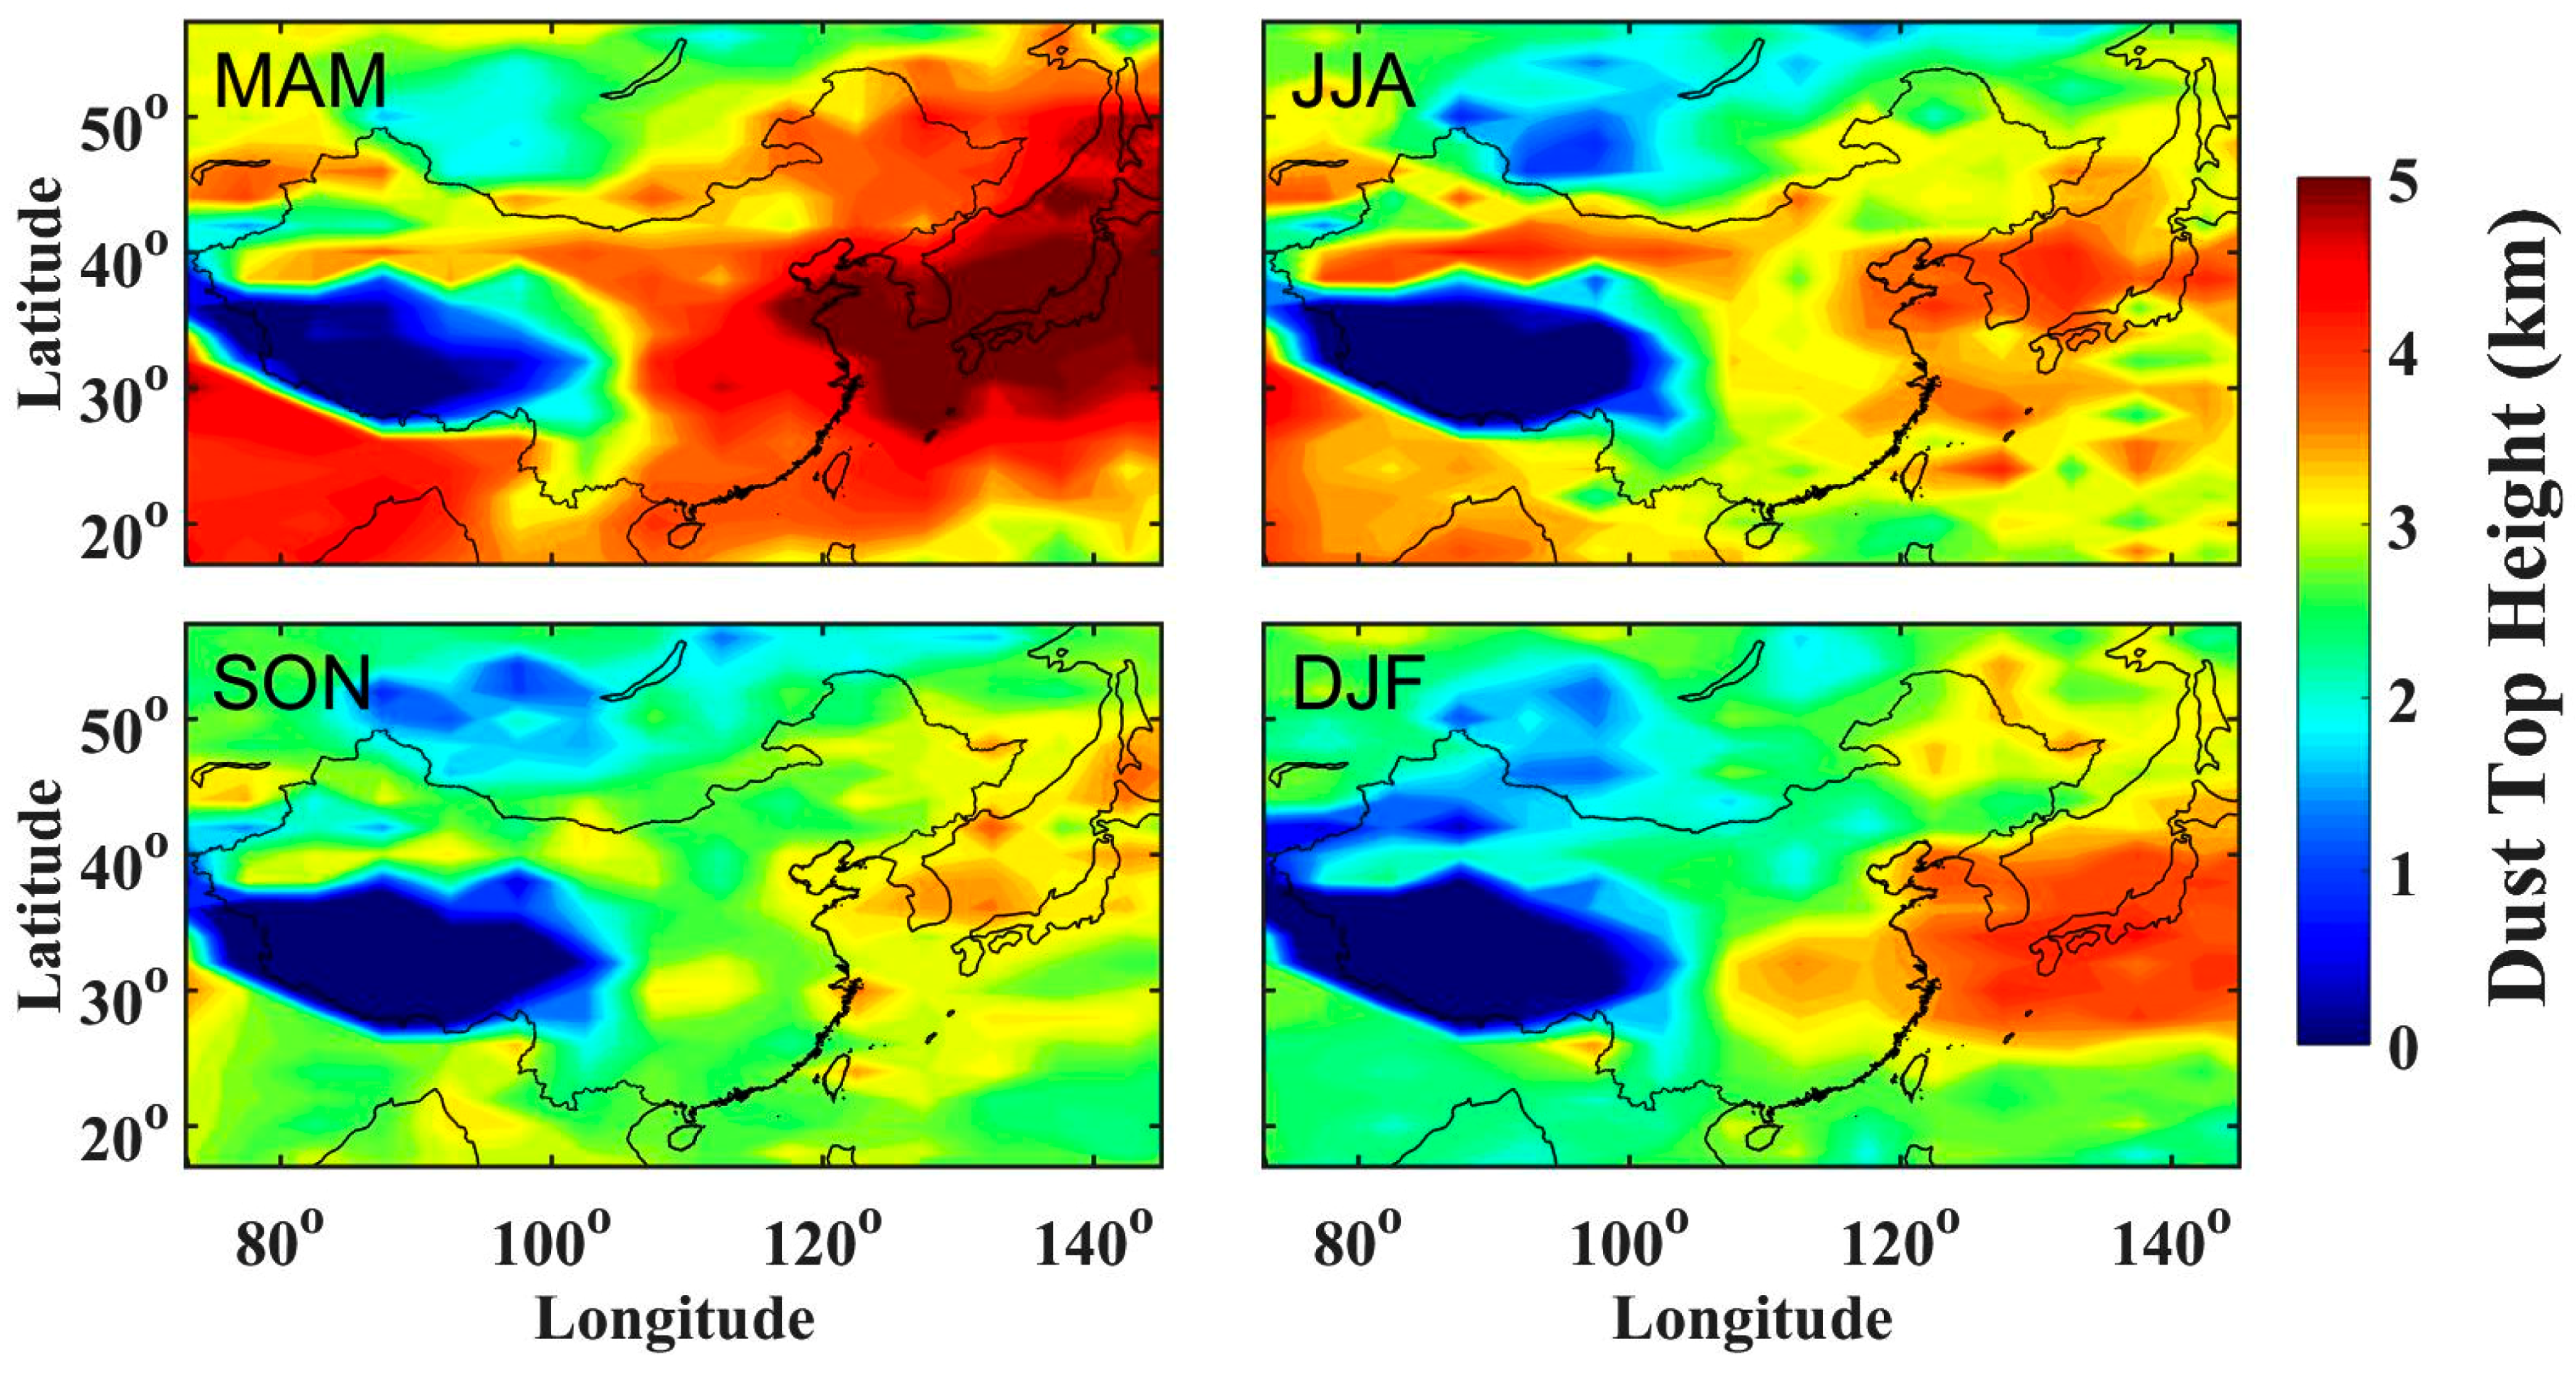
The information on the dust TH can help elucidate mechanisms of long-range transport of the dust aerosols. The dust TH, which is defined as the height above surface elevation (a.s.e.), shows significant seasonal variations over East Asia (Figure 4). Over the TD and GD, the dust TH was the largest in MAM with an average value of 3.1 km (a.s.e.) and the lowest in DJF with an average value of 1.9 km (a.s.e.). Note that the variations here resembled those of the boundary layer height [36]. In comparison, over the downwind regions (the NC, SC and KJ), the dust TH values were still the highest in MAM with a range of 3.9~5.0 km, and the lowest in SON with a range of 2.7~3.2 km. The dust belts were evident in all four seasons. During MAM, the dust TH increased along the dust belt from the dust source regions to the downwind regions, implying progressive vertical expansion of the dust layer as the airmass absorbed dust particles from the ground along its transport pathway. Although not shown in Figure 4, other studies have demonstrated that, aided by the ascending movement of the East Asian and the North American troughs, the vertical expansion of the dust layer can continue all the way to North America [37]. Thus, these patterns of dust storm explain why the highest dust TH values were recorded during MAM in the downwind regions.
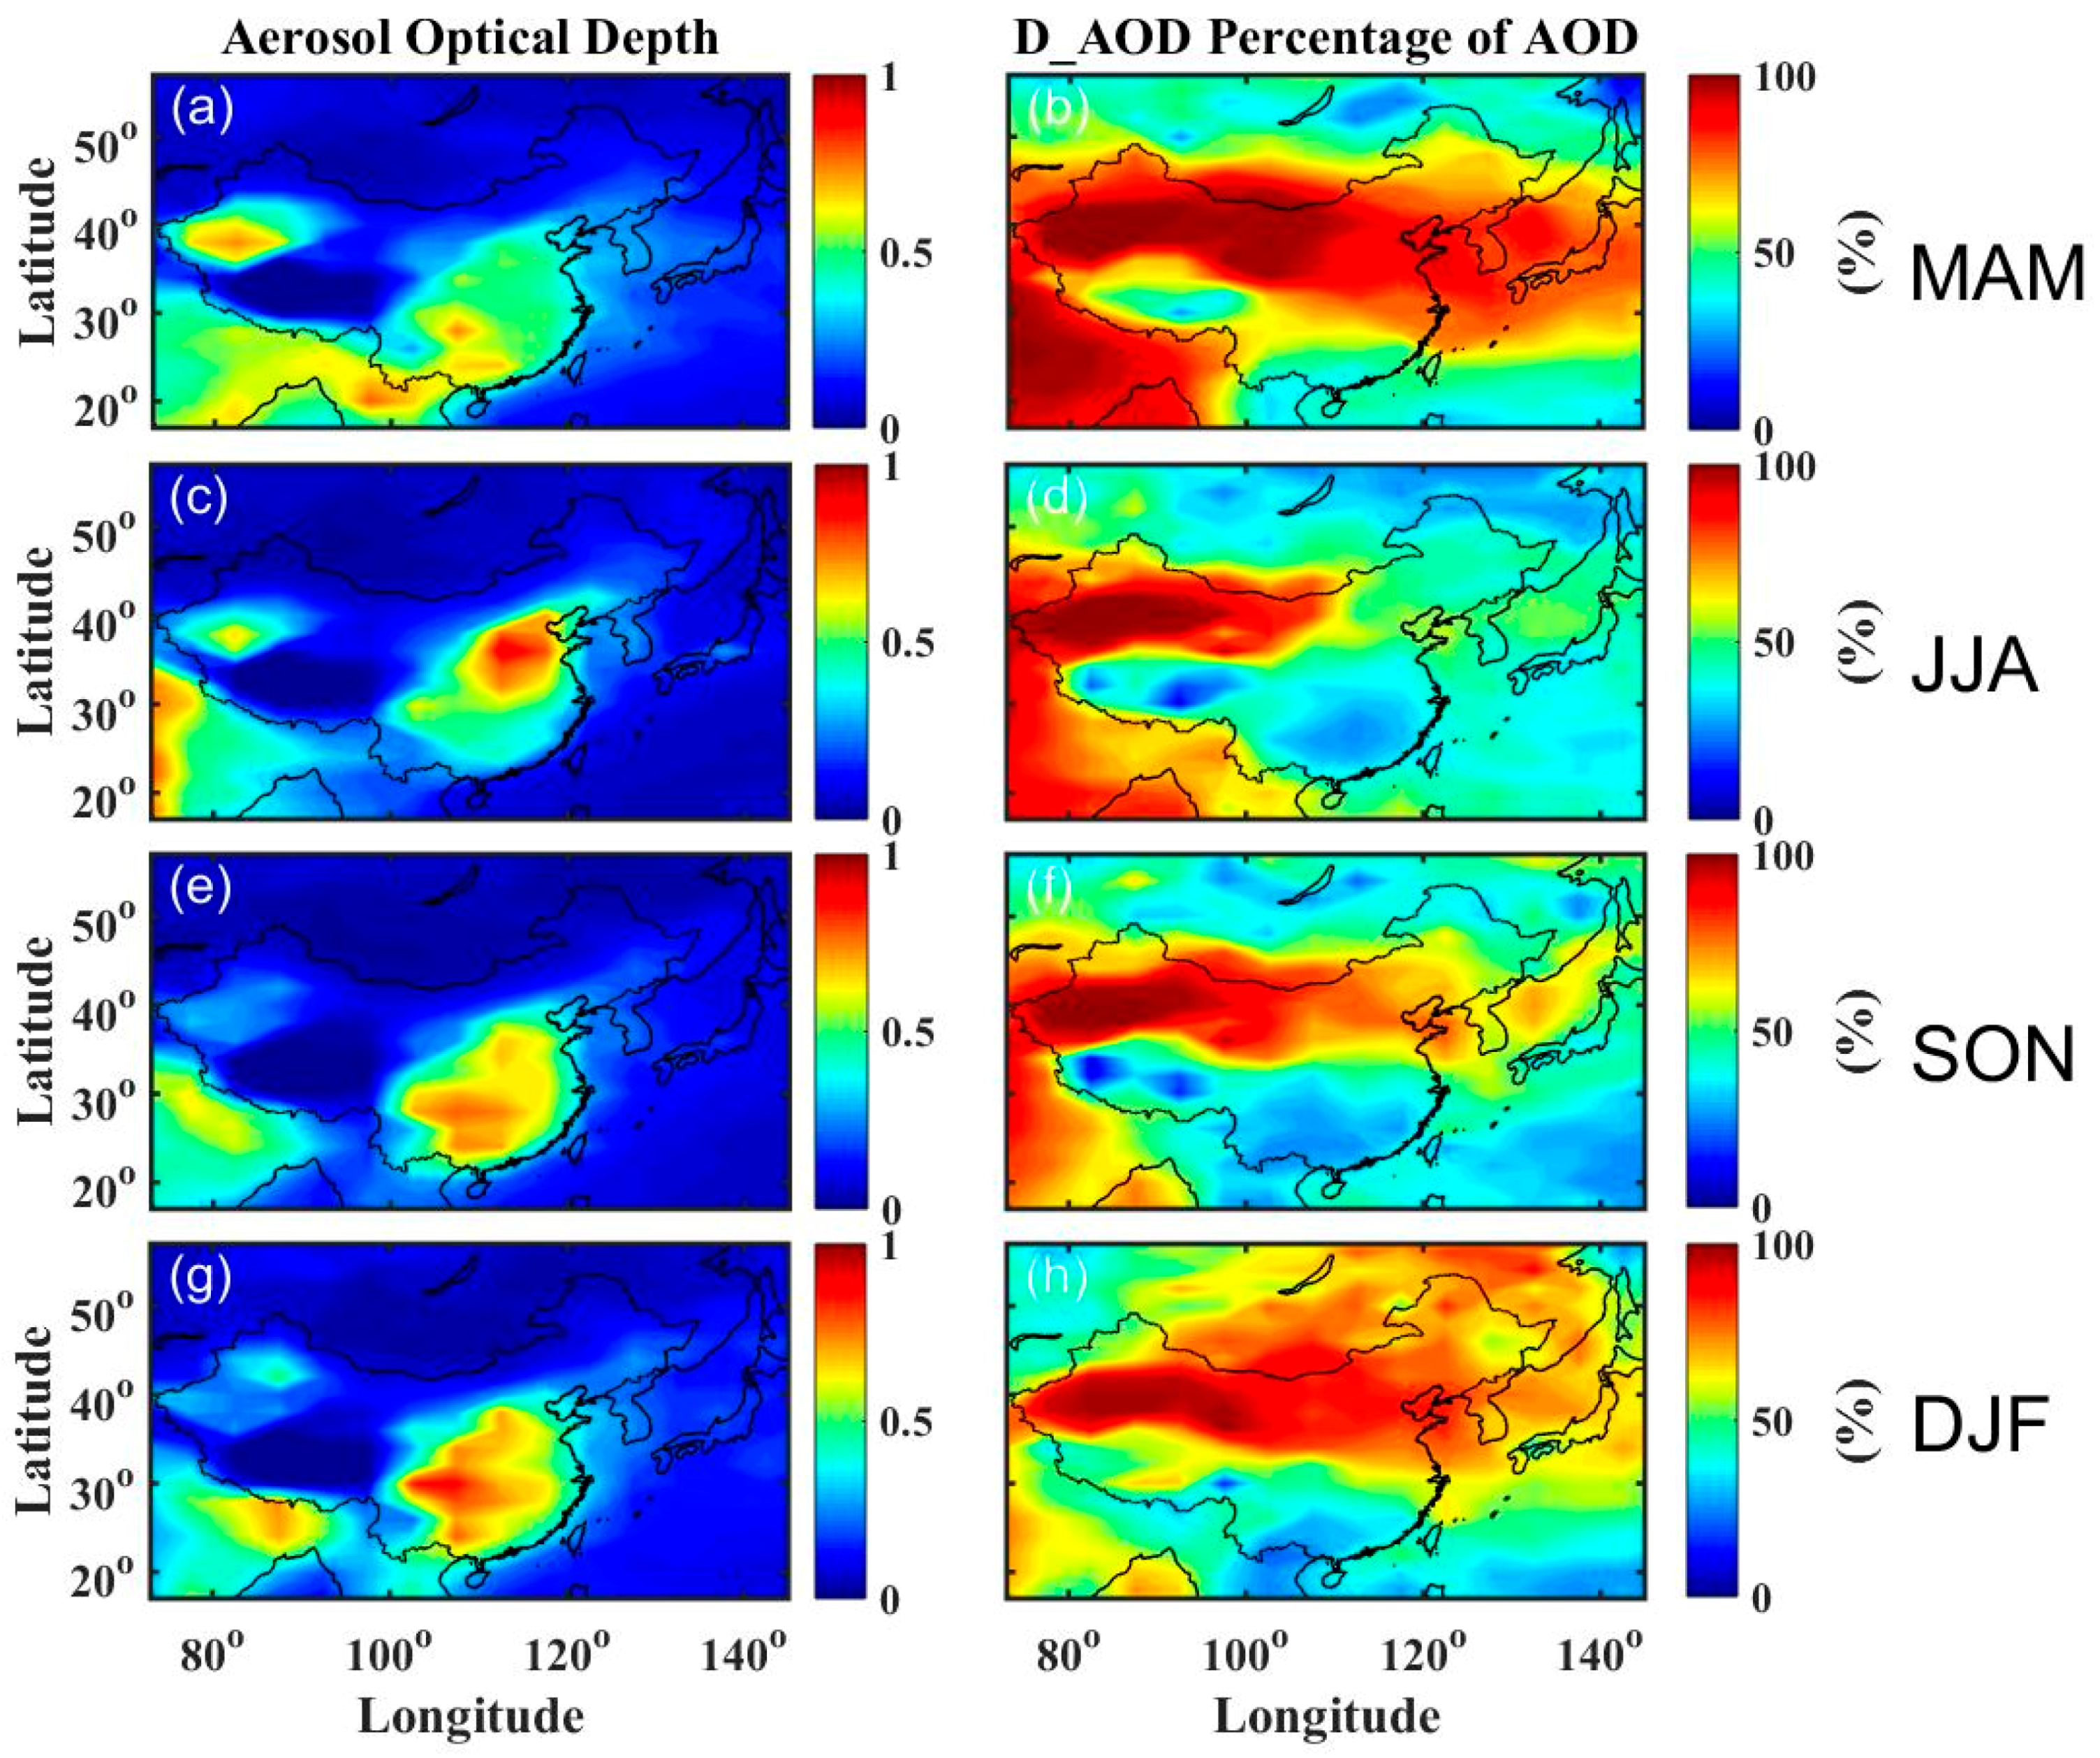
3.3. Seasonal Distribution of AOD and the Percentage of D_AOD to the Total AOD
To develop a stronger understanding of the contributions of dust aerosols to atmospheric aerosols, it is necessary to further analyze dust aerosols generated from anthropogenic activities by investigating the variations of AOD and the percent contribution of dust aerosols to the total AOD (D_AOD). The seasonally averaged AOD is generally characterized by two high AOD centers and two low AOD centers over East Asia (Figure 5). Economically developed and industrialized areas of eastern China and areas under the influence of natural dust sources constituted the high AOD centers. In contrast, less developed areas with smaller populations across the Tibetan Plateau and eastern Inner Mongolia constituted the low AOD centers. In addition to natural dust aerosols, aerosols emitted by anthropogenic activities, such as smoke particles from burning of agricultural biomass, sulphate and black and organic carbon aerosols from industrial activities could be responsible for enhanced levels of aerosol loadings during DJF over the SC with a high AOD value of 0.88 [38,39,40].
The data on D_AOD reveal once again a distinct dust belt, especially in MAM and DJF. In these two seasons, high percentages (>70%) were found along the belt that extends from the dust source regions to the coastal line of eastern China. The large percentage of greater than 95% observed over the dust source regions indicated that natural dust aerosols served as the most important component of atmospheric aerosols. Meanwhile, obvious seasonal variations were observed. The highest D_AOD during MAM was closely related to frequent and intensive dust storm events in the dust source regions. The distribution of D_AOD in SON was similar to that observed in MAM but with lower percentage values [41]. In JJA, the dust belt was much smaller in extent, limited mostly to the dust source regions (the TD and GD) but with abnormally high percentages (>85%). The small spatial extent of the dust belt in JJA can be partially explained by the prevailing climate: JJA is the rainy season in Eastern China, Japan and Korea, and most of the dust aerosols are removed by wet deposition.
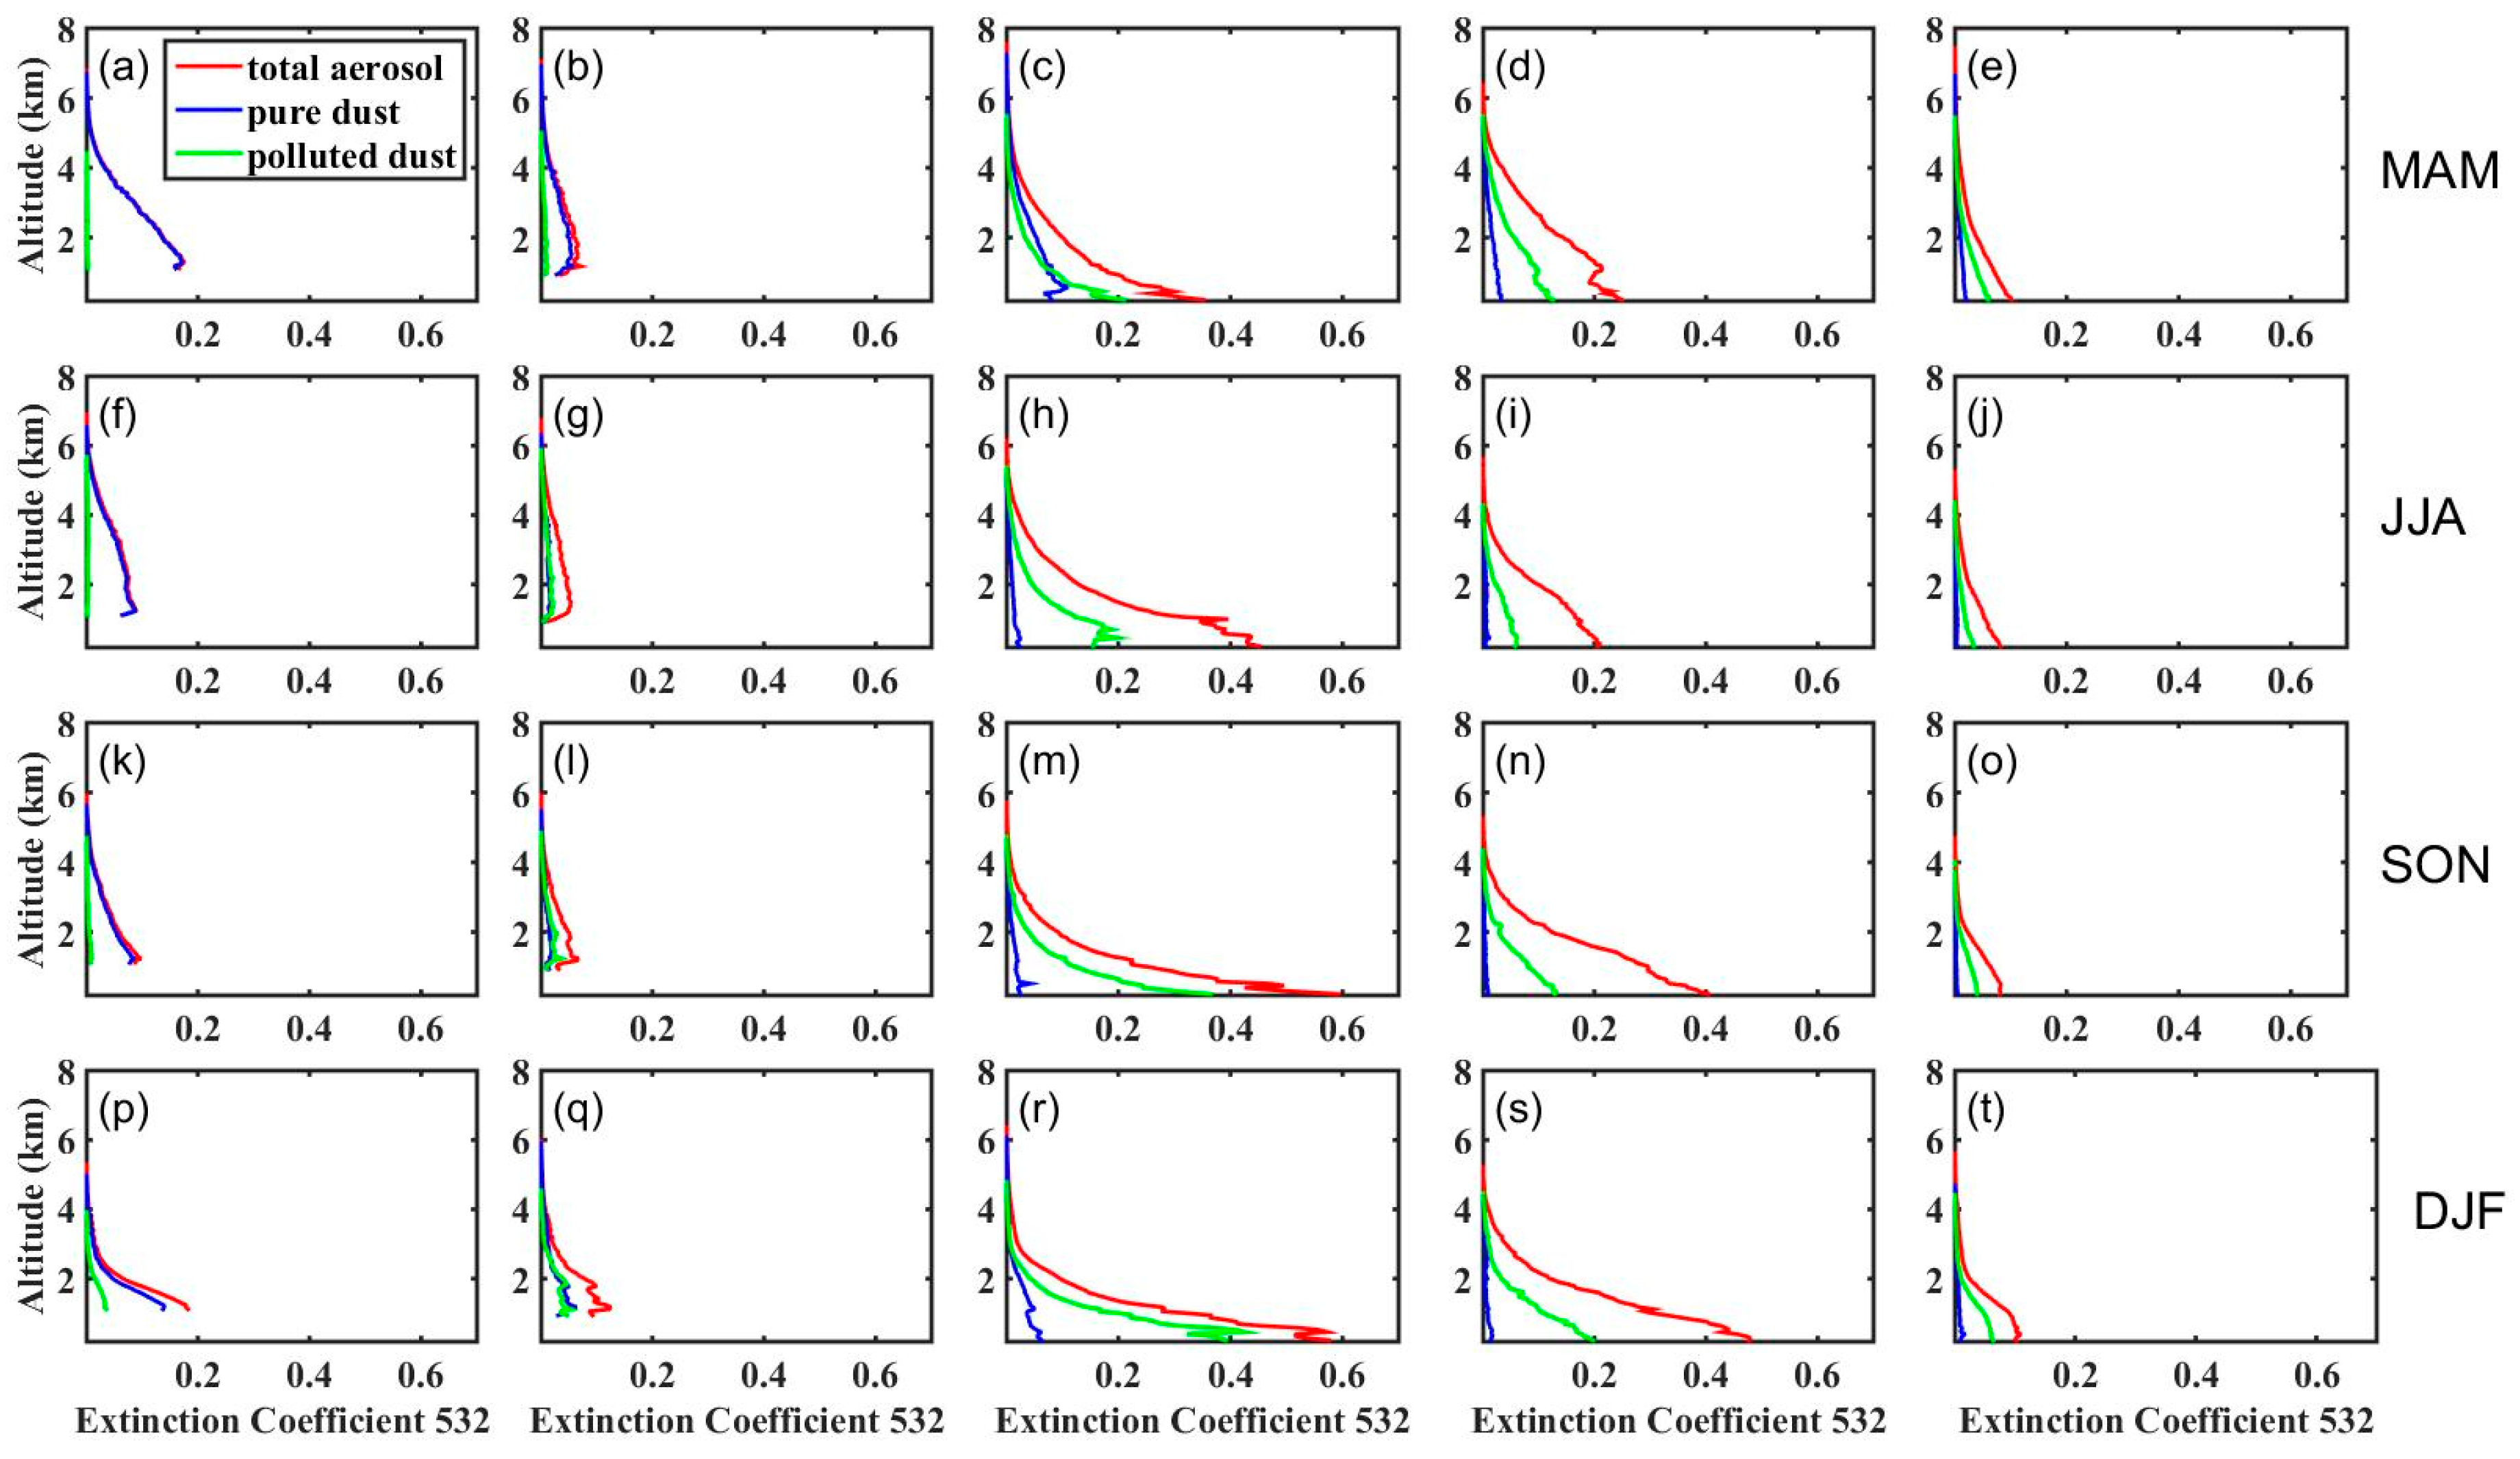
3.4. Extinction Coefficient of Pure and Polluted Dust
The vertical profiles of extinction coefficients for the three main aerosol types (total aerosol, pure dust and polluted dust) are presented in Figure 6. Here, polluted dust is defined as the mixture of pure dust and smoke particles generated from biomass burning, and total aerosol includes clean marine, pure dust, polluted dust, polluted continental, clean continental, polluted dust and smoke components [42]. Except for a small proportion of polluted dust in DJF, pure dust was the only component of the total aerosols over the dust source regions (TD and GD), showing that pure dust dominated throughout the year. In these two regions, high dust extinction coefficients (TD: 0.17 km−1; GD: 0.06 km−1) were observed at an altitude of 1~2 km during MAM.
As evidenced in Figure 6s,t, extinction coefficients of polluted dust (<0.04 km−1) were observed over the dust source regions (the TD and GD) in the winter, largely as the result of fossil fuel burning in the winter heating period. Over the NC, the region downwind of the deserts, extinction coefficients of pure dust were much lower than those of polluted dust, indicating the dominate role of anthropogenic activities in this region across all four seasons. Another notable feature about NC is that extinction coefficients of pure dust were higher than those of polluted dust above the height of 1.1 km in MAM (Figure 6c), again confirming that emission and transport of dusts from the deserts were large contributors to air quality problems during this time of the year.
Over the SC and KJ, aerosol extinction profiles did not show considerable seasonal variations, and major aerosol subtypes could be listed in descending order as follows: total aerosols, polluted dust and pure dust. The extinction coefficients of pure dues were less than 0.04 km−1 year-round while polluted dust accounted for 40~60% of total aerosols, illustrating that local pollution sources dominated over the role of dust long-distance transport.
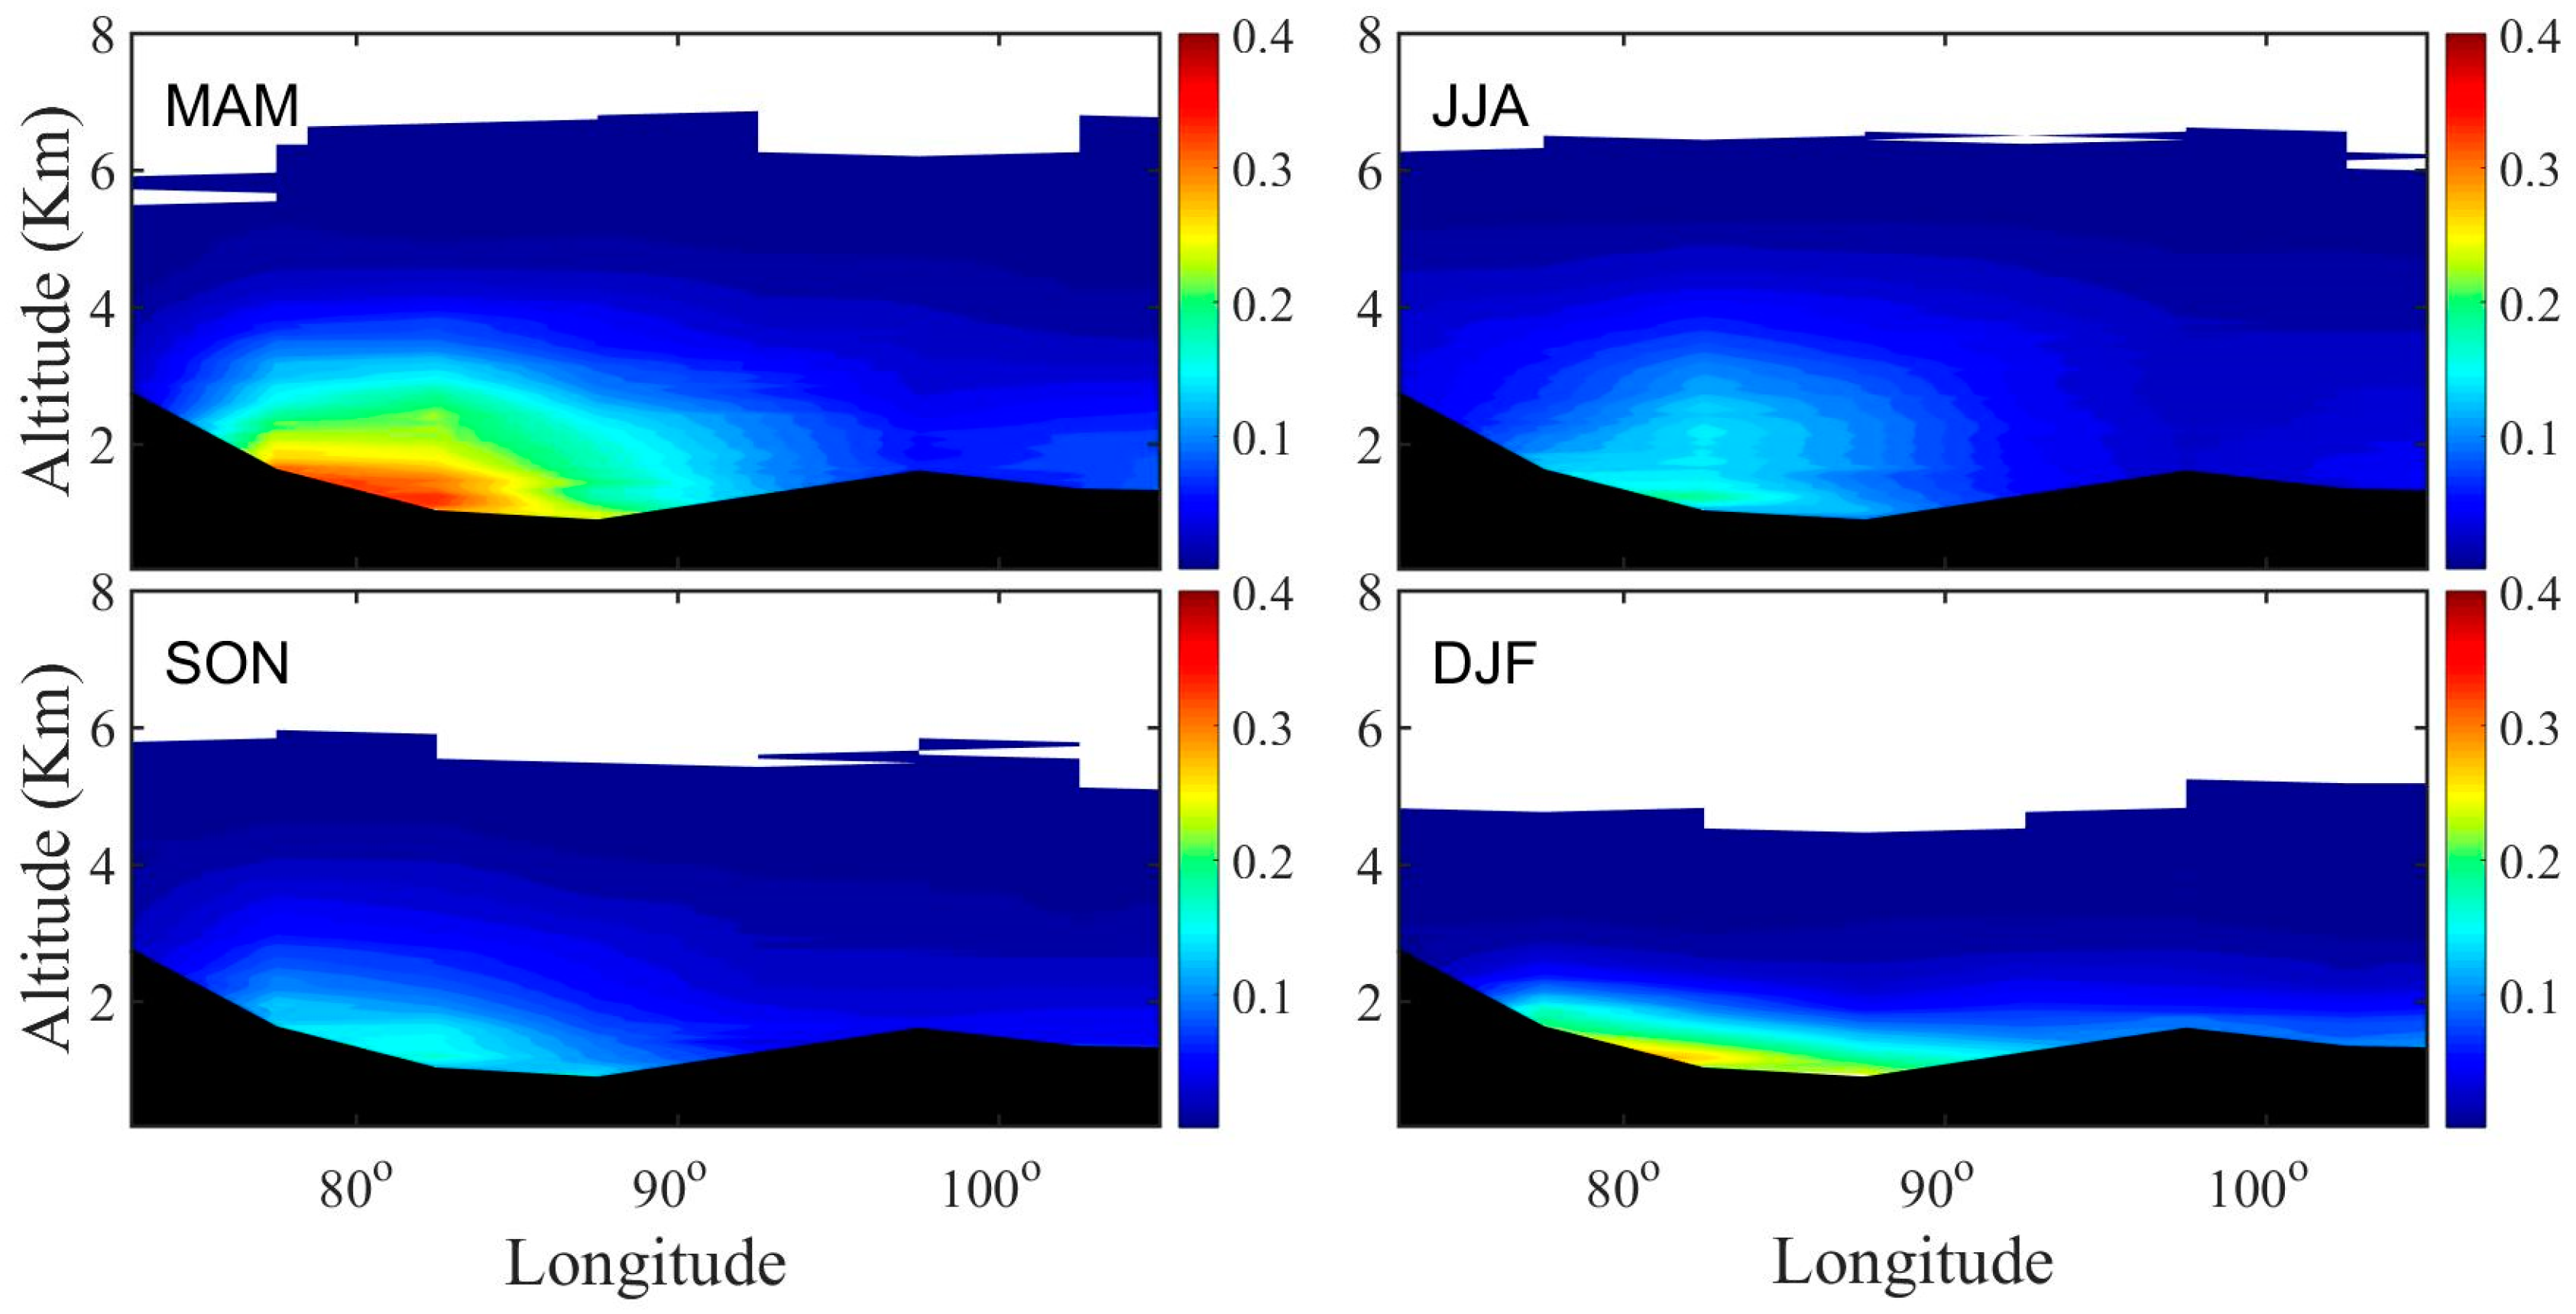
To further understand the dust transport pattern, we present the vertical distribution of the dust extinction coefficient along the W-E transact at 40°N (Figure 7). The highest dust extinction coefficients were observed over the TD (80–97.5°E). If we used a threshold value of 0.1 km−1, the dust layer in this longitudinal range extended to a height of 4 km in MAM and JJA, 3 km in SON, and roughly 2.5 km in DJF. Fewer dust storm events occur in JJA than in MAM. However, it appears that such dust devils were able to generate large volumes of dust aerosols through localized disturbances, and because of strong convections, the emitted dust particles were uplifted to up to 4 km beyond the boundary layer height (BLH), where strong wind caused some dust aerosols to be transported to the downwind regions [36,37,43]. On the other hand, due to prevailing topographic conditions, only some particles were successfully transported to the downwind regions on account of topographic obstacles, especially in SON and DJF [3].
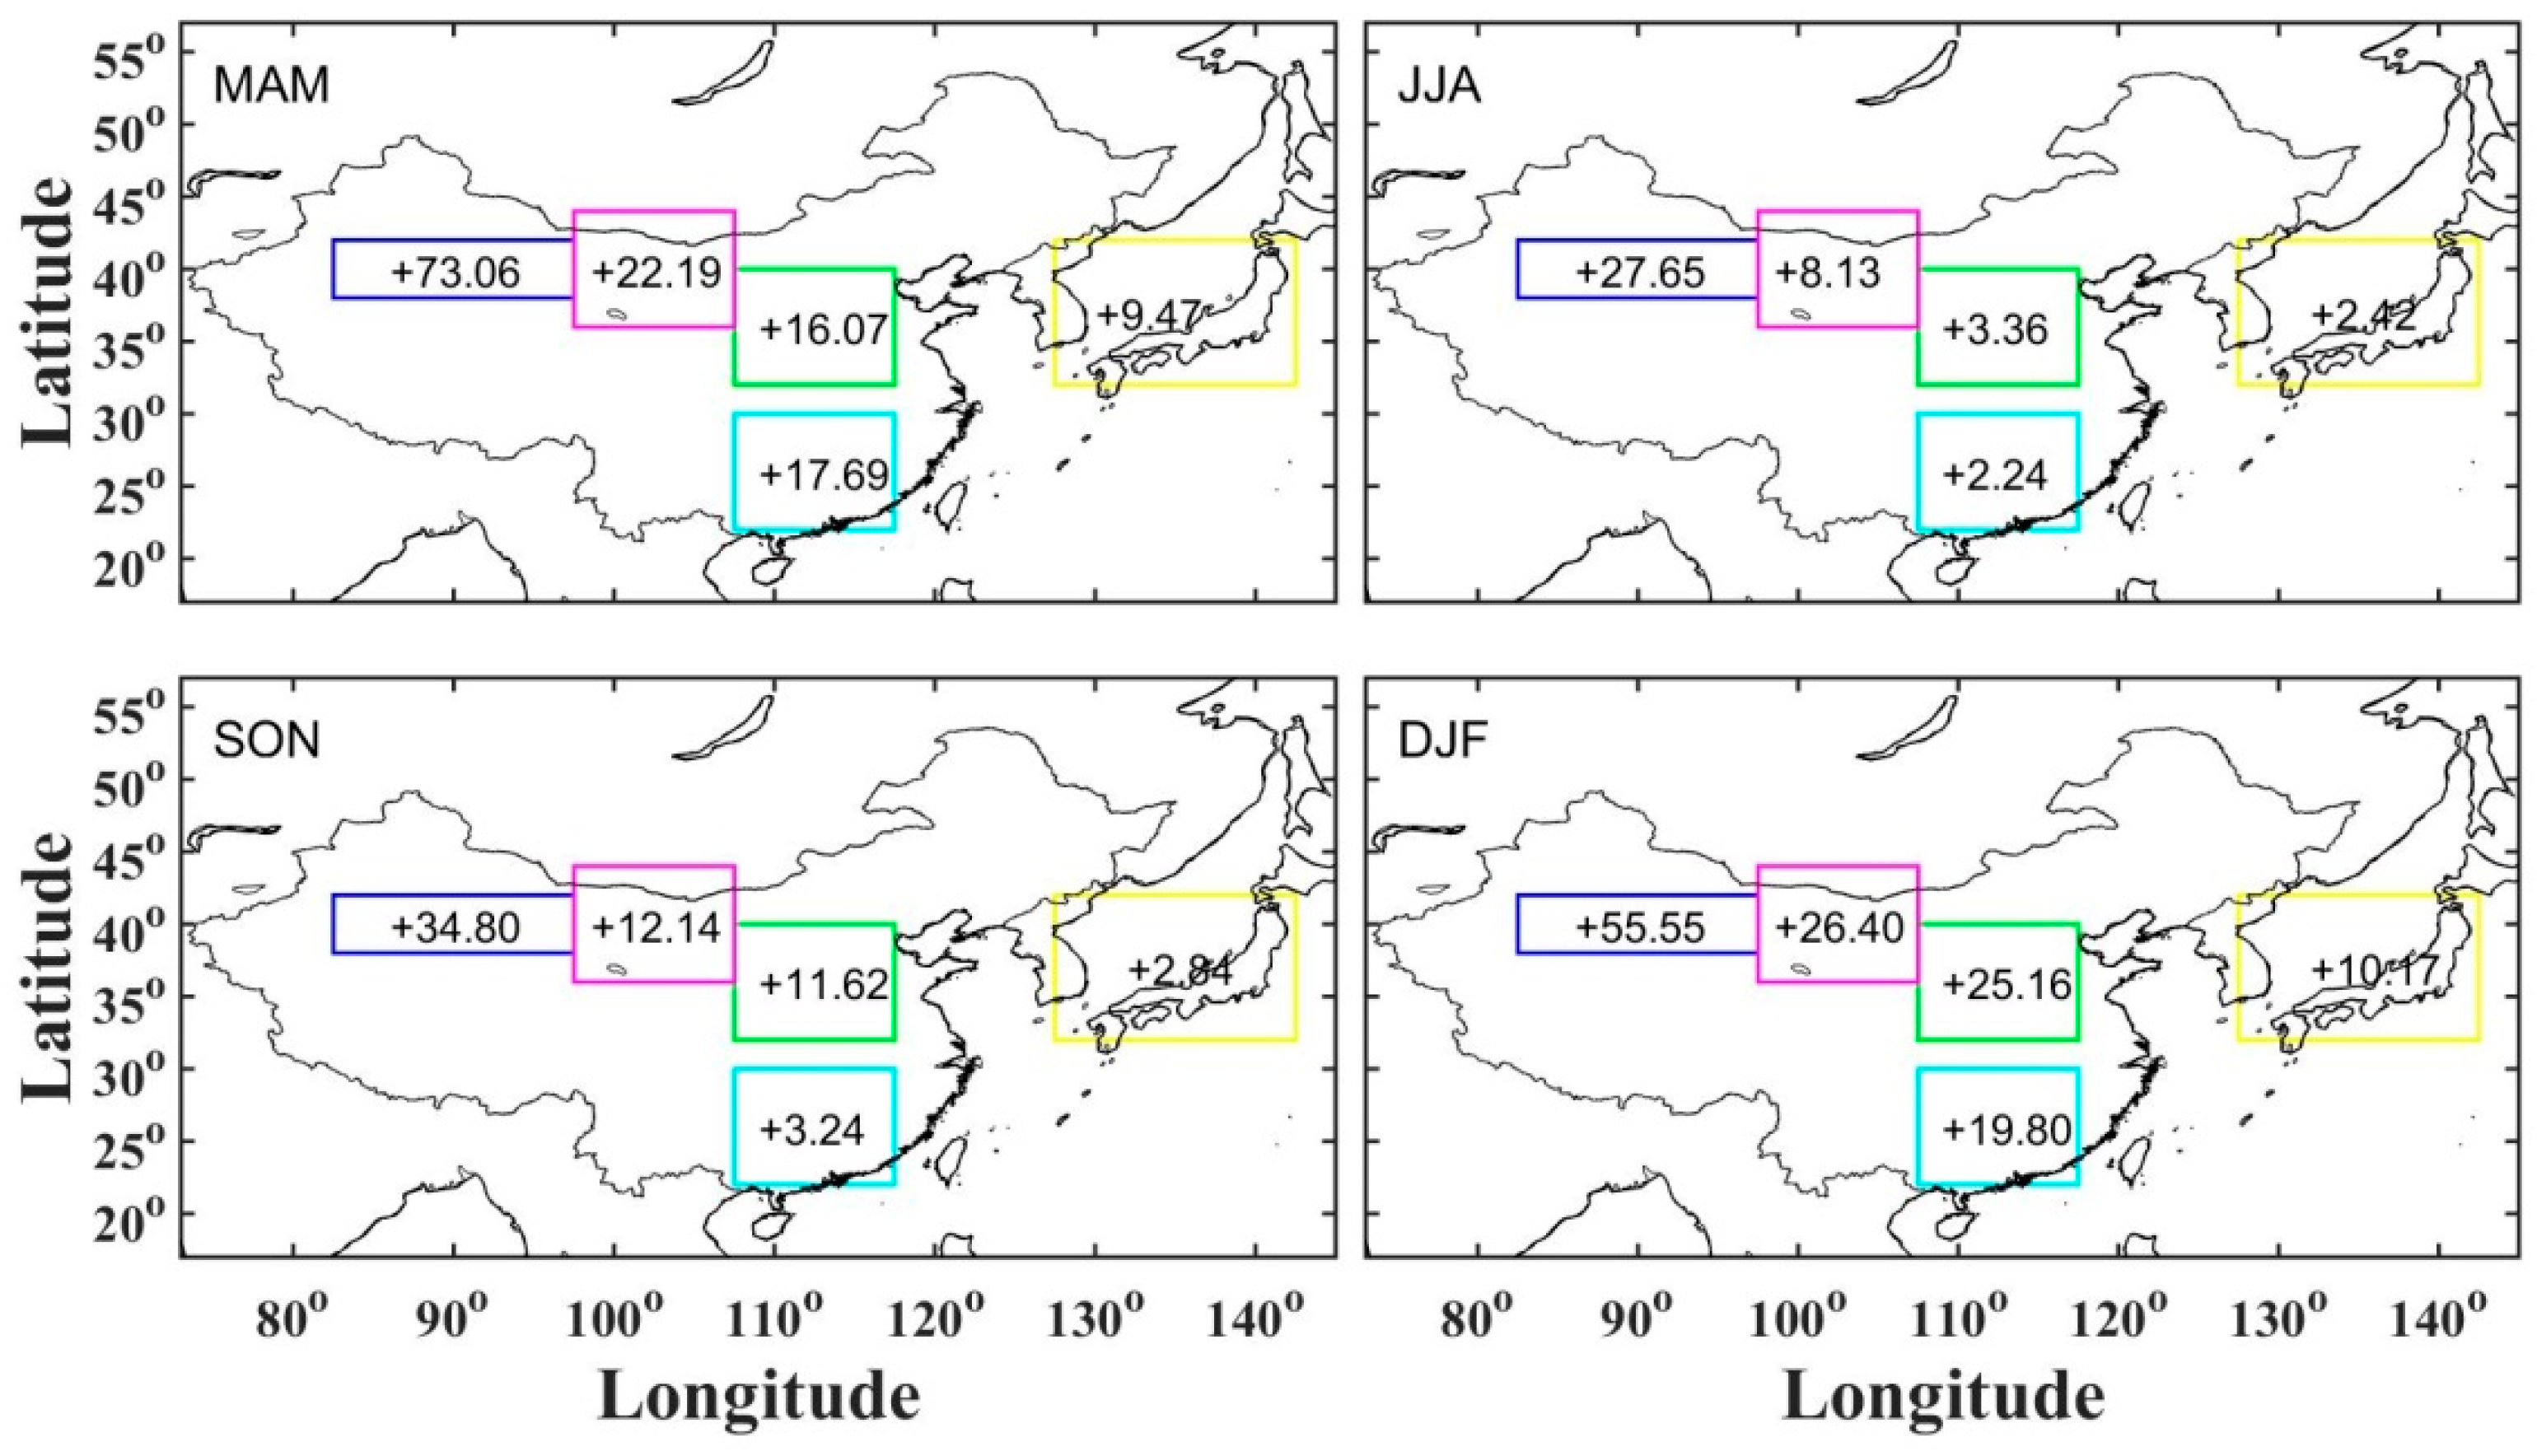
3.5. Horizontal Dust Transport Flux
Figure 8 shows the horizontal dust transport flux for the five homogenous regions of East Asia. Unsurprisingly, horizontal dust transport flux was the highest over the dust source regions: the TD followed by the GD. Seasonally, the horizontal total dust transport flux over all the five regions was, in descending order: DJF, MAM, SON and JJA. The two dust source regions emitted 95.2 Tg, 35.8 Tg, 46.9 Tg and 82 Tg of dust aerosols into the atmosphere during MAM, JJA, SON and DJF, respectively. The NC and SC sources contributed 35.4%, 15.6%, 31.7% and 54.8% to the total in MAM, JJA, SON and DJF, respectively, and the corresponding flux fractions for the KJ amounted to 9.9%, 6.7%, 6.1% and 12.4%. Notably, since a large percent of the dust over the KJ region originated from the TD, the seasonal variation of the horizontal dust transport flux over the KJ resembled that observed over the TD, with higher levels observed in MAM and DJF and lower levels recorded in JJA and SON.
3.6. Comparison with MERRA-2
Supplementary Figure S1 presents the MERRA-2 AOD and the percent contribution of pure dust aerosol to AOD for our study region. To allow easy comparison, in Figure S2 we present the same quantities from the CALIPSO retrieval. In Figure 5, the percentages of D_AOD include both pure dust and polluted dust. In Figure S2, the percentage values are for pure mineral dust originated from the ground, and so a direct comparison can be made of the MERRA-2 D_AOD percentage values. MERRA-2 can be used as independent evaluation of the CALISPO products because MERRA-2 aerosol variables have been extensively validated against Aerosol Robotic Network (AERONET) measurements [44] and because MERRA-2 does not use CALIPSO to do bias correction. A previous study has shown that the vertical profile of the CALIOP attenuated backscatter coefficient agrees well with that derived by MERRA-2 for Continental USA, South America, Northern and Southern Africa [29]. Here we find that the CALIPSO captured the broad spatial patterns of both AOD and D_AOD for East Asia as calculated by MERRA-2. In the case of AOD, both show two pollution centers, with a heavily polluted region in eastern China and another less pollution region in western China. In the case of D_AOD of pure dust, the highest values were located in the dust source regions (Taklimakan Desert and Gobi Desert) according to both data products.
4. Conclusions
The present study analyzed the seasonal variation of dust aerosols and transport over East Asia using CALIPSO retrievals. To develop deeper insight into the spatiotemporal distribution of dust aerosols, the study domain was divided into five homogenous regions including the Taklimakan Desert (TD), the Gobi Desert (GD), northern China (NC), southern China (SC) and Korea-Japan (KJ) with distinct emissions sources. The frequency of dust occurrence, dust Top Height and extinction coefficients were assessed for each study region.
Our results confirmed that large amounts of dust particles were emitted from the dust regions (TD and GD). The emitted dusts formed a dust belt within a latitudinal range of 25°N to 45°N and extended to eastern China, Japan, Korea and the Pacific Ocean. The dust belt was strongest in the spring outside the rainy season. High frequencies of dust occurrence were found over the dust source regions sequenced in descending order as follows: spring, summer, autumn and winter. FDOs showed to isolated centers over the Taklimakan Desert and Gobi Desert, implying limitations of the diffusion and long-range transport of the dust aerosols over the Taklimakan Desert, meaning that most of uplifted dust aerosols were blocked by the mountains around the Tarim basin and eventually settled back to the ground.
The dust top height over East Asia presents significant seasonal variations with values of roughly 3.5~5.1 km (a.s.e.) over the dust source regions and recorded in descending order as follows: summer, spring, autumn and winter. Over the dust belt, the dust Top Height increased from dust source regions to downwind regions; furthermore, frequent dust storms occurring over East Asia during the spring showed why the dust Top Height was the highest in the spring across the downwind regions.
The AOD was generally characterized by two high AOD centers and two low AOD centers over East Asia. The dust belt was the shortest and had the lowest AOD in the summer with higher dust to AOD percentages (>85%) observed only over the Taklimakan and Gobi Deserts, showing that dust aerosols can hardly travel long distances in the rainy season due to wet deposition.
Pure dust was predominant across all four seasons. Over northern China and in areas direct downwind of the dust source regions, polluted dust generated from anthropogenic activities also played an important role. The dust extinction coefficients over the Taklimakan Desert were sequenced in descending order as follows: spring, winter, summer and autumn. The west-to-east transect of the extinction coefficient further confirmed that only some of the emitted dust particles successfully reached the downwind regions due to topographical obstacles and this blocking effect was especially strong in the autumn and winter.
The main advantages of the CALIPSO system lie in its ability to obtain vertical profiles of aerosols, which are crucial for understanding the distribution and transport of dust. However, the satellite completes a cycle over 16 days, producing data gaps that may miss detection of some dust events. A preliminary comparison with MERRA-2 data product, which is continuous in time, showed that when averaged over multiple years, the horizontal distributions of AOD and D_AOD from the CALIPSO captured the broad patterns calculated by MERRA-2. Future work should use MODIS, MERRA-2 and CALIPSO data to build a 3D structure of the dust trajectory over East Asia to gain STRONGER insight into long-range transport of East Asian dust to other regions of the globe.
Supplementary Materials
The following are available online at https://0-www-mdpi-com.brum.beds.ac.uk/2072-4292/11/6/701/s1, Figure S1: Seasonal distribution of Aerosol Optical Depth (left panels) and percentage contributions of pure dust to the total AOD (right panels) over East Asia based on MERRA-2 data, Figure S2: Seasonal distribution of Aerosol Optical Depth (left panels) and percentage contributions of pure dust to the total AOD (right panels) over East Asia based on CALIPSO data.
Author Contributions
D.L., T.Z., and S.C. designed the study. D.L. carried out THE research and wrote the manuscript. T.Z., R.B., and S.C. contributed to the preparation of the manuscript through review, editing, and comments. Z.L. wrote the results section. Y.W. and Y.Z. helped polish the manuscript. And all authors were involved in modifying the paper, and the literature review.
Funding
This research was supported by the Foundation for National Natural Science Foundation of China (No. 41830965; No. 91837103).
Acknowledgments
We thank TC Chakraborty, Yale University, for providing the MERRA-2 data graphs.
Conflicts of Interest
The authors declare no conflict of interest.
References
- Twomey, S.; Piepgrass, M.; Wolfe, T. An assessment of the impact of pollution on global cloud albedo. Tellus B 1984, 36, 356–366. [Google Scholar] [CrossRef]
- Huang, J.; Fu, Q.; Su, J.; Tang, Q.; Minnis, P.; Hu, Y.; Yi, Y.; Zhao, Q. Taklimakan dust aerosol radiative heating derived from CALIPSO observations using the Fu-Liou radiation model with CERES constraints. Atmos. Chem. Phys. 2009, 9, 4011–4021. [Google Scholar] [CrossRef] [Green Version]
- Chen, S.; Huang, J.; Li, J.; Jia, R.; Jiang, N.; Kang, L.; Ma, X.; Xie, T. Comparison of dust emission, transport, and deposition between the Taklimakan Desert and Gobi Desert from 2007 to 2011. Sci. China Earth Sci. 2017, 60, 1–18. [Google Scholar] [CrossRef]
- Zhang, X.; Arimoto, R.; An, Z. Dust emission from Chinese desert sources linked to variations in atmospheric circulation. J. Geophys. Res. Atmos. 1997, 102, 28041–28047. [Google Scholar] [CrossRef] [Green Version]
- Huang, J.; Patrick, M.; Chen, B.; Huang, Z.; Liu, Z.; Zhao, Q.; Yi, Y.; Ayers, J. Long-range transport and vertical structure of Asian dust from CALIPSO and surface measurements during PACDEX. J. Geophys. Res. Atmos. 2008, 113. [Google Scholar] [CrossRef] [Green Version]
- Xie, X.; Liu, X.; Che, H.; Xie, X.; Wang, H.; Li, J.; Shi, Z.; Liu, Y. Modeling East Asian Dust and Its Radiative Feedbacks in CAM4-BAM. J. Geophys. Res. Atmos. 2018, 123, 1079–1096. [Google Scholar] [CrossRef]
- Duce, R.; Unni, C.; Ray, B.; Prospero, J.; Merrill, J. Long rang atmospheric transport of soil dust from Asia to the Tropical North Pacific: Temporal variability. Science 1980, 209, 1522–1524. [Google Scholar] [CrossRef] [PubMed]
- Zhang, X.; Gong, S.; Zhao, T.; Arimoto, R.; Wang, Y.; Zhou, Z. Sources of Asian dust and role of climate change versus desertification in Asian dust emission. Geophys. Res. Lett. 2003, 30, 5–8. [Google Scholar] [CrossRef]
- Claquin, T.; Schulz, M.; Balkanski, Y.; Boucher, O. Uncertainties in assessing radiative forcing by mineral dust. Tellus B 1998, 50, 491–505. [Google Scholar] [CrossRef]
- Zhang, G.; Zhang, Z.; Liu, J. Spatial distribution of wind erosion and its driving factors in China. J. Geogr. Sci. 2001, 11, 127–139. [Google Scholar]
- Bourgeois, Q.; Ekman, A.; Krejci, R. Aerosol transport over the Andes from the Amazon Basin to the remote Pacific Ocean: A multiyear CALIOP assessment. J. Geophys. Res. Atmos. 2015, 120, 8411–8425. [Google Scholar] [CrossRef] [Green Version]
- Chen, S.; Huang, J.; Qian, Y.; Zhao, C.; Kang, L.; Yang, B.; Wang, Y.; Liu, Y.; Yuan, T.; Wang, T.; et al. An Overview of Mineral Dust Modeling over East Asia. J. Meteorol. Res. 2017, 31, 633–653. [Google Scholar] [CrossRef]
- Xu, X.; Zhou, X.; Weng, Y.; Tian, G.; Liu, Y.; Yan, P.; Ding, G.; Zhang, Y.; Mao, J.; Qiu, H. Study on variational aerosol fields over Beijing and its adjoining areas derived from Terra-MODIS and ground sunphotometer observation. Chin. Sci. Bull. 2003, 48, 2010–2017. [Google Scholar] [CrossRef]
- Qiu, H.; Zhong, J.; Dong, X. Land-use and land-cover changes and dust storms in Tarim Basin, northwest China. Proc. SPIE Int. Soc. Opt. Eng. 2003, 4890, 652–656. [Google Scholar]
- Huang, L.; Jiang, J.; Tackett, J.; Su, H.; Fu, R. Seasonal and diurnal variations of aerosol extinction profile and type distribution from CALIPSO 5-year observations. J. Geophys. Res. Atmos. 2013, 118, 4572–4596. [Google Scholar] [CrossRef] [Green Version]
- Guo, J.; Liu, H.; Wang, F.; Huang, J.; Xia, F.; Lou, M.; Wu, Y.; Jiang, J.; Xie, T.; Zhaxi, Y.; et al. Three-dimensional structure of aerosol in china: A perspective from multi-satellite observations. Atmos. Res. 2016, 178, 580–589. [Google Scholar] [CrossRef]
- Proestakis, E.; Amiridis, V.; Marinou, E.; Georgoulias, A.; Solomos, S.; Kazadzis, S.; Chimot, J.; Che, H.; Alexandri, G.; Binietoglou, I.; et al. 9-year spatial and temporal evolution of desert dust aerosols over South-East Asia as revealed by CALIOP. Atmos. Chem. Phys. 2017, 18, 1337–1362. [Google Scholar] [CrossRef]
- Nan, Y.; Wang, Y. De-coupling interannual variations of vertical dust extinction over the Taklimakan Desert during 2007–2016 using CALIOP. Sci. Total. Environ. 2018, 633, 608–617. [Google Scholar] [CrossRef] [PubMed]
- Yu, X.; Kumar, K.; Lü, R.; Ma, J. Changes in column aerosol optical properties during extreme haze-fog episodes in January 2013 over urban Beijing. Environ. Pollut. 2016, 210, 217–226. [Google Scholar] [CrossRef] [PubMed]
- Winker, D.; Vaughan, M.; Omar, A.; Hu, Y.; Powell, K. Overview of the calipso mission and caliop data processing algorithms. J. Atmos. Ocean. Technol. 2009, 26, 2310–2323. [Google Scholar] [CrossRef]
- Winker, D.; Hunt, W.; Mcgill, M. Initial performance assessment of CALIOP. Geophys. Res. Lett. 2007, 34, L19803. [Google Scholar] [CrossRef]
- Liu, Z.; Vaughan, M.; Winker, D.; Kittaka, C.; Getzewich, B.; Kuehn, R.; Omar, A.; Powell, K.; Trepte, C.; Hostetler, C. The calipso lidar cloud and aerosol discrimination: Version 2 algorithm and initial assessment of performance. J. Atmos. Ocean. Technol. 2009, 26, 1198–1213. [Google Scholar] [CrossRef]
- Liu, Z.; Omar, A.; Vaughan, M.; Hair, J.; Kittaka, C.; Hu, Y.; Powell, K.; Trepte, C.; Winker, D.; Hostetler, C.; et al. Calipso lidar observations of the optical properties of Saharan dust: A case study of long-range transport. J. Geophys. Res. 2008, 113, D07207. [Google Scholar]
- Lolli, S.; Madonna, F.; Rosoldi, M.; Campbell, J.; Welton, E.; Lewis, J.; Gu, Y.; Pappalardo, G. Impact of varying lidar measurement and data processing techniques in evaluating cirrus cloud and aerosol direct radiative effects. Atmos. Meas. Tech. 2018, 11, 1639–1651. [Google Scholar] [CrossRef] [Green Version]
- CALIPSO. CALIPSO Quality Statements Lidar Level 3 Aerosol Profile Monthly Products Version Release 1.00. 2011. Available online: http://eosweb.larc.nasa.gov/PRODOCS/calipso/Quality_Summaries/CALIOP_L3AProProducts_1-00.html (accessed on 15 July 2012).
- Kaufman, Y.; Koren, I.; Remer, L.; TanrÉ, D.; Ginoux, P.; Fan, S. Dust transport and deposition observed from the terra-moderate resolution imaging spectroradiometer (MODIS) spacecraft over the Atlantic ocean. J. Geophys. Res. Atmos. 2005, 110, 1–12. [Google Scholar] [CrossRef]
- Maring, H. Mineral dust aerosol size distribution change during atmospheric transport. J. Geophys. Res. 2003, 108, 8592. [Google Scholar] [CrossRef]
- Huang, J.; Wang, T.; Wang, W.; Li, Z.; Yan, H. Climate effects of dust aerosols over East Asian arid and semiarid regions. J. Geophys. Res. Atmos. 2014, 119, 11398–11416. [Google Scholar] [CrossRef]
- Buchard, V.; Randles, C.; Silva, A.; Darmenov, A.; Colarco, P.; Govindaraju, R.; Ferrare, R.; Hair, J.; Beyersdorf, A.; Ziemba, L.; et al. The MERRA-2 Aerosol Reanalysis, 1980 Onward. Part II: Evaluation and Case Studies. J. Clim. 2017, 30, 6851–6872. [Google Scholar] [CrossRef]
- Chen, S.; Huang, L.; Kang, H.; Wang, X.; Ma, Y.; He, T.; Yuan, B.; Yang, Z.; Huang, Z.; Zhang, G. Emission, transport and radiative effects of mineral dust from Taklimakan and Gobi Deserts: Comparison of measurements and model results. Atmos. Chem. Phys. 2017, 17, 2401–2421. [Google Scholar] [CrossRef]
- Xu, C.; Ge, J.; Huang, J.; Fu, Q.; Liu, H.; Chen, B. Observations of Dust Aerosol over China Based on CALIPSO Spaceborne Lidar. J. Desert Res. 2014, 34, 1353–1362. [Google Scholar]
- Xu, C.; Ma, Y.; Yang, K.; You, C. Tibetan Plateau Impacts on Global Dust Transport in the Upper Troposphere. J. Clim. 2018, 31, 4745–4756. [Google Scholar] [CrossRef]
- Kang, L.; Huang, J.; Chen, S.; Wang, X. Long-term trends of dust events over Tibetan Plateau during 1961–2010. Atmos. Environ. 2016, 125, 188–198. [Google Scholar] [CrossRef] [Green Version]
- Chen, S.; Huang, J.; Zhao, C.; Qian, Y.; Leung, L.; Yang, B. Modeling the transport and radiative forcing of Taklimakan dust over the Tibetan Plateau: A case study in the summer of 2006. J. Geophys. Res. Atmos. 2013, 118, 797–812. [Google Scholar] [CrossRef]
- Hu, K.; Kumar, K.; Kang, N.; Boiyo, R.; Wu, J. Spatial-temporal characteristics of aerosols and changes in trends over China with recent MODIS Collection 6 satellite data. Environ. Sci. Pollut. Res. 2017, 25, 6909–6927. [Google Scholar] [CrossRef] [PubMed]
- Luo, H.; Han, Y.; Li, Y. Temporal evolution of the boundary layer height and contribution of dust devils to dust aerosols. China Environ. Sci. 2017, 37, 2438–2442. [Google Scholar]
- Han, Y.; Fang, X.; Zhao, T.; Kang, S. Long range trans-pacific transport and deposition of asian dust aerosols. J. Environ. Sci. 2008, 20, 424–428. [Google Scholar] [CrossRef]
- Che, H.; Zhao, H.; Wu, Y.; Xia, X.; Zhu, J.; Wang, H.; Wang, Y.; Sun, J.; Yun, J.; Zhang, X.; et al. Analyses of aerosol optical properties and direct radiative forcing over urban and industrial regions in Northeast China. Meteorol. Atmos. Phys. 2015, 127, 345–354. [Google Scholar] [CrossRef]
- Huang, J.; Liu, J.; Chen, B.; Nasiri, S. Detection of anthropogenic dust using CALIPSO lidar measurements. Atmos. Chem. Phys. 2015, 15, 11653–11665. [Google Scholar] [CrossRef] [Green Version]
- Tian, P.; Zhang, L.; Ma, J.; Tang, K.; Xu, L.; Wang, Y.; Cao, X.; Liang, J.; Ji, Y.; Jiang, J.; et al. Radiative absorption enhancement of dust mixed with anthropogenic pollution over East Asia. Atmos. Chem. Phys. 2018, 18, 7815–7825. [Google Scholar] [CrossRef]
- Chen, S.; Huang, J.; Qian, Y.; Ge, J.; Su, J. Effects of aerosols on autumn precipitation over Mid-eastern China. J. Trop. Meteorol. 2014, 20, 242–250. [Google Scholar]
- Chen, S.; Jiang, N.; Huang, J.; Xu, X.; Zhang, H.; Zang, Z.; Huang, K.; Xu, X.; Wei, Y.; Guan, X.; et al. Quantifying contributions of natural and anthropogenic dust emission from different climatic regions. Atmos. Environ. 2018, 191, 94–104. [Google Scholar] [CrossRef]
- Han, Y.; Wang, K.; Liu, F.; Zhao, T.; Yin, Y.; Duan, J.; Luan, Z. The contribution of dust devils and dusty plumes to the aerosol budget in western China. Atmos. Environ. 2016, 126, 21–27. [Google Scholar] [CrossRef]
- Randles, C.; Sliva, A.; Buchard, V.; Colarco, P.; Darmenov, A.; Govindaraju, R.; Smirnov, A.; Holben, B.; Ferrare, R.; Hair, J.; et al. The MERRA-2 Aerosol Reanalysis, 1980—Onward, Part I: System Description and Data Assimilation Evaluation. J. Clim. 2017, 30, 6823–6850. [Google Scholar] [CrossRef] [PubMed]
Figure 1.
Topographical map of the study domain. Homogenous regions highlighted in black boxes include: (1) the Taklimakan Desert (TD), (2) the Gobi Desert (GD), (3) Northern China (NC), (4) Southern China (SC) and (5) Korea-Japan (KJ).
Figure 1.
Topographical map of the study domain. Homogenous regions highlighted in black boxes include: (1) the Taklimakan Desert (TD), (2) the Gobi Desert (GD), (3) Northern China (NC), (4) Southern China (SC) and (5) Korea-Japan (KJ).

Figure 2.
The seasonal variations in the frequency of dust occurrence over East Asia based on Cloud-Aerosol Lidar and Infrared Pathfinder Satellite Observations (CALIPSO) data.
Figure 2.
The seasonal variations in the frequency of dust occurrence over East Asia based on Cloud-Aerosol Lidar and Infrared Pathfinder Satellite Observations (CALIPSO) data.

Figure 3.
Vertical distribution of the frequency of dust occurrence over: (1) the Taklimakan Desert (red line), (2) the Gobi Desert (magenta line), (3) Northern China (green line), (4) Southern China (light blue line) and (5) Korea-Japan (dark blue) based on CALIPSO data.
Figure 3.
Vertical distribution of the frequency of dust occurrence over: (1) the Taklimakan Desert (red line), (2) the Gobi Desert (magenta line), (3) Northern China (green line), (4) Southern China (light blue line) and (5) Korea-Japan (dark blue) based on CALIPSO data.

Figure 4.
The seasonal distribution of dust Top Height (km) over East Asia based on CALIPSO data.

Figure 5.
Seasonal distribution of Aerosol Optical Depths and percentages of D_AOD to the total AOD over East Asia based on CALIPSO data.
Figure 5.
Seasonal distribution of Aerosol Optical Depths and percentages of D_AOD to the total AOD over East Asia based on CALIPSO data.

Figure 6.
Profiles of the seasonal average aerosol extinction coefficient (km−1) derived from CALIPSO observations over 1. The Taklimakan Desert (a,f,k,p), 2. The Gobi Desert (b,g,l,q), 3. Northern China (c,h,m,r), 4. Southern China (d,i,n,s) and 5. Korea-Japan (e,j,o,t).
Figure 6.
Profiles of the seasonal average aerosol extinction coefficient (km−1) derived from CALIPSO observations over 1. The Taklimakan Desert (a,f,k,p), 2. The Gobi Desert (b,g,l,q), 3. Northern China (c,h,m,r), 4. Southern China (d,i,n,s) and 5. Korea-Japan (e,j,o,t).

Figure 7.
Seasonal cross sections of total dust extinction coefficients (km−1) along a latitude of 40°N and longitudinal range of 73°E to 105° E based on CALIPSO data.
Figure 7.
Seasonal cross sections of total dust extinction coefficients (km−1) along a latitude of 40°N and longitudinal range of 73°E to 105° E based on CALIPSO data.

Figure 8.
Seasonal distribution of horizontal dust transport flux (Tg) over East Asia (dark blue box: Taklimakan Desert, magenta box: Gobi Desert, green box: Northern China, light blue box: Southern China and yellow box: Korea-Japan).
Figure 8.
Seasonal distribution of horizontal dust transport flux (Tg) over East Asia (dark blue box: Taklimakan Desert, magenta box: Gobi Desert, green box: Northern China, light blue box: Southern China and yellow box: Korea-Japan).

© 2019 by the authors. Licensee MDPI, Basel, Switzerland. This article is an open access article distributed under the terms and conditions of the Creative Commons Attribution (CC BY) license (http://creativecommons.org/licenses/by/4.0/).
Share and Cite
MDPI and ACS Style
Liu, D.; Zhao, T.; Boiyo, R.; Chen, S.; Lu, Z.; Wu, Y.; Zhao, Y. Vertical Structures of Dust Aerosols over East Asia Based on CALIPSO Retrievals. Remote Sens. 2019, 11, 701. https://0-doi-org.brum.beds.ac.uk/10.3390/rs11060701
AMA Style
Liu D, Zhao T, Boiyo R, Chen S, Lu Z, Wu Y, Zhao Y. Vertical Structures of Dust Aerosols over East Asia Based on CALIPSO Retrievals. Remote Sensing. 2019; 11(6):701. https://0-doi-org.brum.beds.ac.uk/10.3390/rs11060701
Chicago/Turabian StyleLiu, Di, Tianliang Zhao, Richard Boiyo, Siyu Chen, Zhengqi Lu, Yan Wu, and Yang Zhao. 2019. "Vertical Structures of Dust Aerosols over East Asia Based on CALIPSO Retrievals" Remote Sensing 11, no. 6: 701. https://0-doi-org.brum.beds.ac.uk/10.3390/rs11060701
Note that from the first issue of 2016, this journal uses article numbers instead of page numbers. See further details here.