UAV-Based Photogrammetric Tree Height Measurement for Intensive Forest Monitoring


1
Thünen Institute of Forest Ecosystems, Alfred-Möller-Str. 1, Haus 41/42, 16225 Eberswalde, Germany
2
Faculty of Forest and Environment, Eberswalde University of Sustainable Development, Alfred-Möller-Str. 1, Haus 11, 16225 Eberswalde, Germany
3
Department of Geography, University of Bonn, Meckenheimer Allee 166, 53115 Bonn, Germany
*
Author to whom correspondence should be addressed.
Remote Sens. 2019, 11(7), 758; https://0-doi-org.brum.beds.ac.uk/10.3390/rs11070758
Submission received: 28 February 2019
/
Revised: 25 March 2019
/
Accepted: 25 March 2019
/
Published: 28 March 2019
(This article belongs to the Special Issue Remote Sensing Techniques for Precision Forestry)
Abstract
:The measurement of tree height has long been an important tree attribute for the purpose of calculating tree growth, volume, and biomass, which in turn deliver important ecological and economical information to decision makers. Tree height has traditionally been measured by indirect field-based techniques, however these methods are rarely contested. With recent advances in Unmanned Aerial Vehicle (UAV) remote sensing technologies, the possibility to acquire accurate tree heights semi-automatically has become a reality. In this study, photogrammetric and field-based tree height measurements of a Scots Pine stand were validated using destructive methods. The intensive forest monitoring site implemented for the study was configured with permanent ground control points (GCPs) measured with a Total Station (TS). Field-based tree height measurements resulted in a similar level of error to that of the photogrammetric measurements, with root mean square error (RMSE) values of 0.304 m (1.82%) and 0.34 m (2.07%), respectively (n = 34). A conflicting bias was, however, discovered where field measurements tended to overestimate tree heights and photogrammetric measurements were underestimated. The photogrammetric tree height measurements of all trees (n = 285) were validated against the field-based measurements and resulted in a RMSE of 0.479 m (2.78%). Additionally, two separate photogrammetric tree height datasets were compared (n = 251), and a very low amount of error was observed with a RMSE of 0.138 m (0.79%), suggesting a high potential for repeatability. This study shows that UAV photogrammetric tree height measurements are a viable option for intensive forest monitoring plots and that the possibility to acquire within-season tree growth measurements merits further study. Additionally, it was shown that negative and positive biases evident in field-based and UAV-based photogrammetric tree height measurements could potentially lead to misinterpretation of results when field-based measurements are used as validation.
1. Introduction
Tree height is an important parameter required to quantify timber resources and is essential in evaluating the economic and ecological value of a forest stand. In particular, height plays an important role in the calculation of individual and total stand volumes [1], assessing the overall productive capacity of a site [2] and determining the social status of an individual tree’s ability to access resources [3]. Furthermore, tree height is critical in the estimation of forest biomass and carbon stocks [4], which are factors of increasing relevance for the mitigation of climate change through forest activities [5,6,7].
As a typical measurement parameter for forest inventory and monitoring programs, tree height (h) is measured in the field by means of the direct or indirect measurement of the distance between the base (ground-level) and the tip (apical meristem) of a tree [8,9,10]. The direct measurement of tree heights can be accomplished with telescopic measuring poles, however the measurement accuracy and precision is limited to heights of up to 23 m and the method is slow and cumbersome [1]. Alternatively, direct measurements can be carried out with destructive methods, where trees are required to be harvested and the length determined along the ground with a measuring tape. Indirect measurement, on the other hand, would be that of non-destructive geometric or trigonometric methods [2] carried out via field measurements with a hypsometer [11], laser device [12], or Total Station (TS) [4]. Indirect tree measurement is also possible using remote sensing techniques, as in traditional photogrammetric measurements derived from analog aerial imagery [13,14], digital aerial photogrammetry (DAP) [15,16], active sensor remote sensing techniques, such as Light Detection and Ranging (LiDAR) [4,17,18,19], or Interferometric Synthetic Aperture Radar (InSAR) [20,21].
Recent developments in remote sensing technologies, such as LiDAR and Digital Photogrammetry, opened up new possibilities in not only the estimation of individual tree heights, but also in the estimation of tree crown diameter [12,22]. Tree height and crown diameter can be further utilized to estimate individual tree characteristics, such as stem diameter and volume [22,23]. Such technological advances in forestry-related remote sensing are partly attributable to the arrival of relatively new terms, such as “Precision Forestry” [24,25,26,27,28,29]. Based on reliable and accurate data, precision forestry delivers detailed information on the structural [30] and ecological aspects of forests at a high spatial and temporal resolution, even at the individual tree level [26]. Remote sensing platforms are being implemented to obtain such data from various satellite, aerial, and terrestrial platforms, which make use of active and passive sensors [25,31]. LiDAR-based active sensor systems, such as Airborne Laser Scanning (ALS), are of great interest due to the possibility to acquire highly detailed 3D information on the structural aspects of forests [17].
Typically, the interest in more detailed 3D forest information has mostly been driven by the prospect of profitability [26] within the forest industry, however, for research purposes, the prospect of obtaining highly accurate and timely forest structural data is also of interest [32]. Forest inventories and monitoring on the national and international level are nonetheless often limited to public funding, which can restrict the accessibility to costlier methods of remote sensing, such as for ALS. Digital Aerial Photogrammetry (DAP), in particular Unmanned Aerial Vehicle Photogrammetry (UAVP), however, offers a cost-effective alternative to ALS, where passive consumer grade sensors can be mounted on a civilian UAV [33]. A typical UAV mounted with passive sensors can be acquired and operated at a fraction of the cost of ALS with similar results and accuracy [34].
Numerous studies involving the extraction of individual tree heights through ALS and DAP have been carried out with promising results [11,12,35,36,37,38,39,40,41]. One aspect common among all of these studies is that they implement indirect field-based tree measurements for validation. Indirect field-based measurements can, however, also potentially be subjected to error propagation [10,42,43,44]. To the authors’ knowledge, there are few studies that implement direct measurements for the verification of ALS and DAP tree height estimations, as this would require destructive methods that can prove costly or impractical. Sibona et al. [45], however, assessed tree height estimation using ALS and field-based survey methods by implementing 100 harvested trees for validation. Results showed that the ALS-derived tree heights were closer to the direct tree measurements than traditional field-based measurements. In a recent study conducted by Wang et al. [46], the authors implement a non-destructive statistical method, which showed that field measurements tend to overestimate tree heights for codominant trees when correlated with ALS and Terrestrial Laser Scanning (TLS).
In this study, we explored the possibility of enhancing or even replacing field-based tree height measurements for long-term forest monitoring plots. Using the Britz Research Station as a case study, our aim was as follows: (i) determine the accuracy of traditional field-based tree height measurements against destructive direct measurements; (ii) determine the accuracy of UAV-based photogrammetrically derived tree heights against direct measurements; (iii) compare photogrammetric tree heights against field-based measurements; and (iv) assess the repeatability of temporal photogrammetric tree heights.
2. Materials and Methods
2.1. Study Site
The study site is located within the Schorfheide Biosphere reserve near the village of Britz, Brandenburg (52.87°N 13.83°S, 42 m above sea level), approximately 50 km north-east of Berlin, Germany. The Britz research station was originally established in 1972 by the Institute for Forest Sciences Eberswalde for the purpose of conducting forest hydrological research with the use of large-scale lysimeters [47]. Currently, the Britz Research Station is under management of the Thünen Institute for Forest Ecosystems and consists of nine plots of varying species and structure with intact lysimeters (see Figure 1).
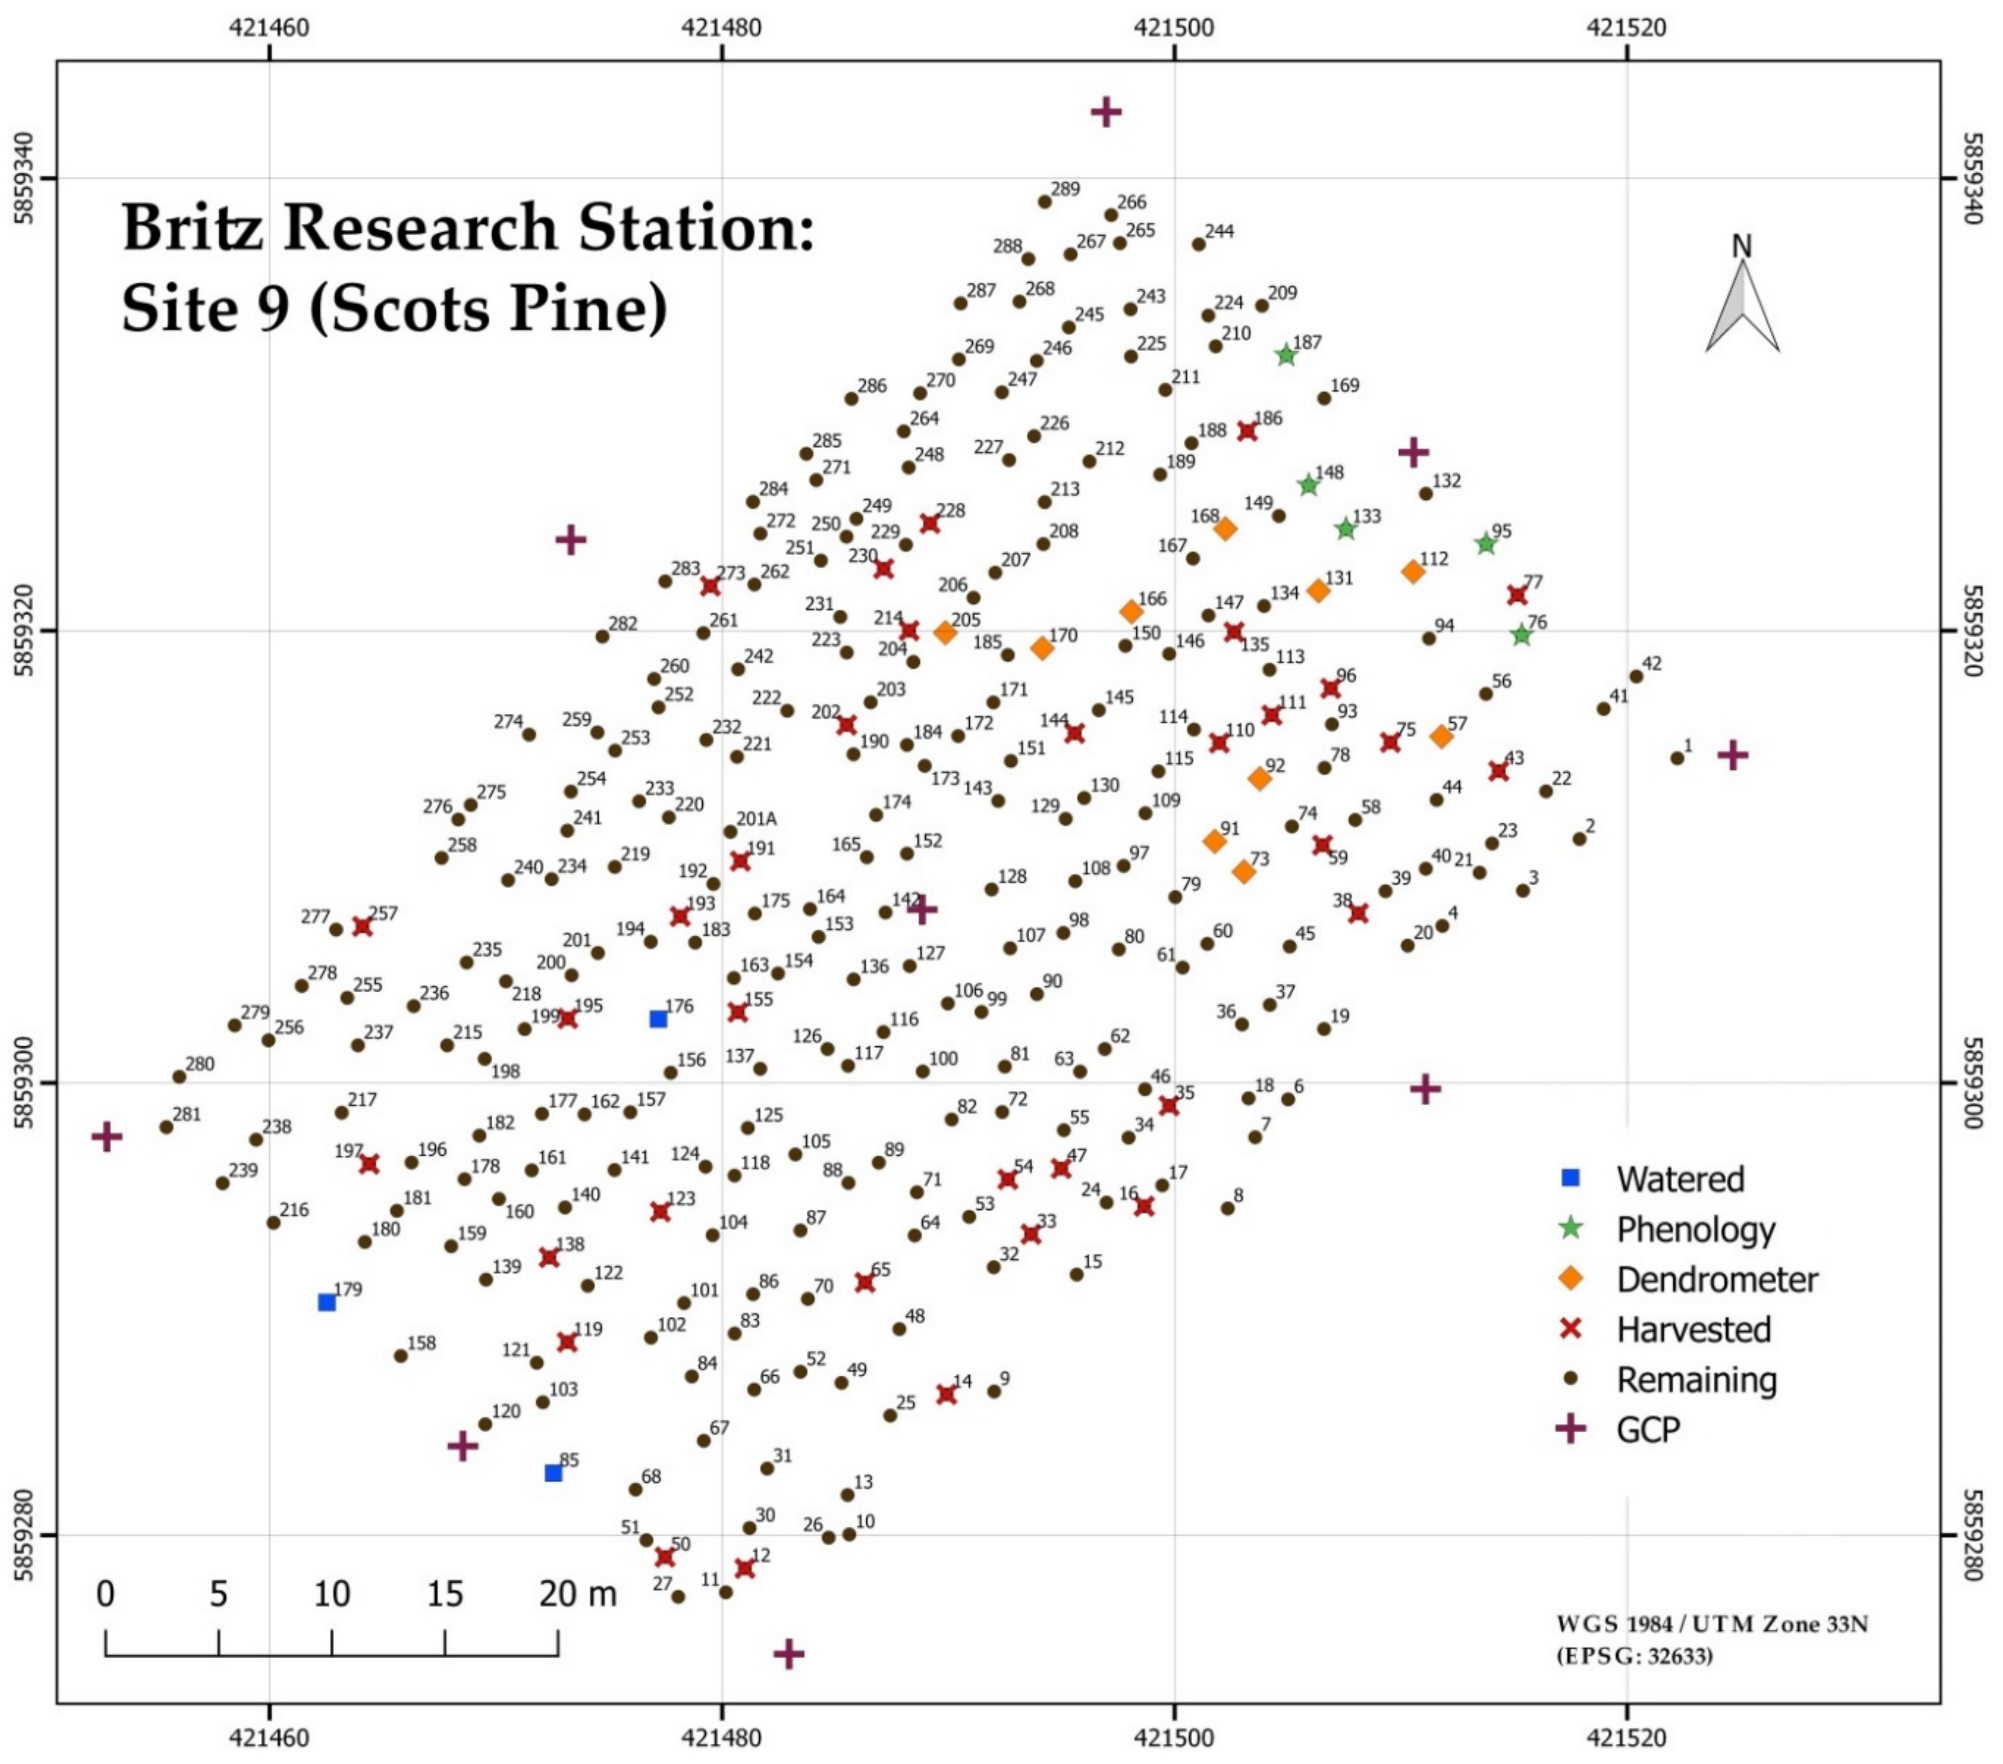
The dominating tree species for plots 1 to 3 and 5 to 9 were planted as 2-year-old seedlings in 1974. For this study, the 0.24 ha monoculture Scots Pine stand (plot 9) was chosen and consisted of 289 trees before selective harvesting took place in late March, 2018. Ten of the trees are equipped with analog and digital dendrometers for continuous diameter at breast height (dbh) measurement and one tree is capable of sending its daily dendrometric measurements to a twitter feed (https://treewatch.net/). Five trees are marked for long-term phenological analysis and three trees are artificially watered to field capacity twice a week during the growth season (see Figure 2).
2.2. Field Measurements
Each individual tree height of the entire stand was measured indirectly prior to felling with a Vertex IV hypsometer (Haglöf, www.haglof.se), which is an instrument capable of measuring angles and distances by means of ultrasound and calculates tree heights based on the trigonometric principle [8]. Tree height field measurements were carried out by an experienced forest inventory specialist from the German Forest Inventory (Bundeswaldinventur) in February, 2018, before harvesting procedures. Direct measurements were carried out in late March, 2018 (see Figure 3), after selective felling, where the length of each tree was measured as the length on the ground from the base of the cut to the apical bud. The stump height was added to the length of the harvested tree while taking the undercut in to consideration.
2.3. Ground Control Points and Tree Stem Positions
Due to residual positional errors caused by the multipath effect under a dense forest canopy, fixed Real Time Kinematic (RTK) Global Navigation Satellite System (GNSS) (Topcon GR-3) positioning was unattainable for the purpose of Ground Control Point (GCP) measurement. Alternatively, GCPs were measured with a Sokkia Set 510 TS, which is essentially an electronic theodolite capable of electronic distance measurement. Three GCPs were recorded on an open field adjacent to the study plot (see Figure 1), where a fixed RTK GNSS signal was possible. The TS was then positioned on a GCP and the azimuth was calibrated using a second GCP. The third GCP was used as a control. Following the TS setup process, each of the 9 GCPs for the study plot were measured with the TS. Special care was taken in insuring the visibility between the TS and the target prism in relation with the aerial nadir visibility of GCPs through small gaps in the canopy. This procedure was best carried out during the winter months when ground vegetation and lower story deciduous trees are not affecting visibility. Concurrent with the GCP measurements, the individual tree stem positions were also recorded with the TS. Four different GCP positions were required to measure tree stems due to limitations in visibility.
2.4. Remotely Sensed Data Acquisition
Aerial UAV imagery was acquired using a 36-megapixel full format Sony A7r RGB camera with a fixed lens (35 mm Zeiss Sonnar 2.8). The camera was focused manually at a hyper focal distance and fixed permanently to inhibit variations in focal length. Camera settings were as follows: Shutter speed: 1/650; F-stop: f8; ISO: Auto (100–800); Format: RAW; Intervalometer: 2 s. The sensor was mounted onboard an OctoXL 6S12 Octocopter (see Figure 4) from Mikrokopter (HiSystems GmbH) and flown autonomously with a predetermined flight plan. The flight plan was comprised of seven flight lines (at nadir) calculated in accordance to a focal length of 35.3 mm, 7360 × 4912 sensor size (pixel), 80% frontal- and side-overlap, and a flying height of 75 m. The theoretical Ground Surface Distance (GSD) was estimated at 1 cm. Images were triggered with an internal intervalometer calculated to shoot every two seconds and were deemed essential in order to eliminate any misfiring or latency in waypoint-activated triggering [48]. The same flight plan was flown for the pre-harvest mission on February 13th, 2018, and the post-harvest mission on April 29th, 2018 (see Figure 3). Each mission was flown within ± 60 min of solar noon and at an average maximum wind speed of 2.25 m/s for the pre-harvest mission and 3.83 m/s after harvesting. The maximum average wind speed was determined from onsite wind speed measurements at a height of 18 m.
2.5. Processing and Tree Height Extraction
The original raw images (Sony ARW) for both datasets were indirectly georeferenced [49] by synchronizing the image time stamps with the Octocopters log file. Images were preprocessed in order to match exposure histograms and corrected for Vignetting before being converted to 8-bit Tagged Image File Format (TIFF). Point clouds and orthomosaics were generated using the Structure from Motion (SfM) software Pix4Dmapper version 4.1.25 (Pix4D, Lausanne, Switzerland). At least 5 calibrated images were manually marked for each GCP and initial processing settings were set to full image scale with geometrically verified matching activated. The point clouds were processed at an optimal point density with the image scale set at half image size.
Point clouds and derivatives were processed with FUSION/LDV [50], rLiDAR, and lidR packages in the R software package [51,52,53]. A Digital Terrain Model (DTM) raster was created by interpolating (nearest neighbor) a combination of the tree positions and GCPs and implemented to calculate the Canopy Height Models (CHMs). The DTM and CHMs were created at a resolution of 0.5 m and 0.3 m, respectively. Treetops were detected using the local maximum algorithm and allocated an ID in reference to the TS tree positions. Missed or falsely detected trees were found by manually adjusting TS tree positions with the aid of the Orthomosaic and CHM (Figure 5), and by creating a 0.1 m buffer to capture the maximum pixel values. Typically, we have found that at least 80% of trees will be automatically detected, which is in accordance with Mohan et al. [54]. Simply creating buffers around the TS positions to extract tree heights was not possible due an offset of the apical meristem to the stem position, especially evident with codominant trees. Figure 3 shows the full processing workflow in relation to the image acquisition and field data collection campaigns.
2.6. Statistical Analysis
The statistical analysis in this study was carried out with the R software package [51] and based upon the validation of the tree heights derived from the two photogrammetric datasets acquired before and after harvesting, as well as a validation of the field-based indirect measurements. The direct measurements of the felled trees were used as validation for the indirect field measurements, as well as the photogrammetric dataset before harvesting. The indirect field measurements were implemented as validation for all tree heights of the photogrammetric dataset prior to harvesting, as well as the photogrammetric dataset containing the remaining trees after harvesting.
The datasets to be validated were assessed by quantifying the total error, systematic error, and random error [42], as well as calculating the coefficient of determination R-squared [55]. We adopted the method from Larjavaara et al. [42] and used the terms systematic error (bias) and random error in order to clarify the difference between precision (lower random error) and accuracy (lower systematic error). Total error was determined by calculating the root mean squared error (RMSE):
where = predicted values, = observed values, = mean of observed n values, = total number of samples [42,56,57,58]. The mean error (ME) is synonymous with the systematic error and calculated as follows:
The sample standard deviation of error (SDE) depicts the random error and is calculated as follows:
R-squared was determined by calculating a linear model and provides a measure of how well the data is fitted to the regression line.
3. Results
3.1. Processing Results and Statistical Analysis
The two resulting CHMs were named PPCpre and PPCpost and represent the photogrammetrically calculated tree heights before and after harvesting. Table 1 displays some of the statistical parameters of the resulting point clouds and orthomosaics. Important to note is that the RMSE values shown in Table 1 represent only the relative accuracy with regard to the GCPs and calibrated images, rather than absolute geolocation accuracy. Furthermore, a decrease in point density for the PPCpost dataset is most probably due to absent trees in the point cloud after harvesting.
The four main datasets for the study were labeled (see Table 2) and adjusted for sample size in terms of the harvested trees (n = 34), all trees of the stand prior to harvesting (n = 285), and the remaining trees after harvesting (n = 251). Each dataset was tested for normal distribution and an overview of descriptive statistics are displayed in Table 3. Figure 6 shows the distribution of all datasets as boxplots.
The validation of indirect field measurements against the direct measurements was labeled Fieldharv_Direct and the validation of the photogrammetric point cloud derived tree heights against the direct measurements was labelled PPCpre_harv_Direct. Both comparisons implemented the 34 felled trees as samples. The photogrammetric tree height dataset prior to harvesting (PPCpre_Fieldall) was compared to the indirect field measurements for the entire stand (n = 285), as well as with an adjusted sample size (n = 251) excluding the harvested trees (PPCpre_rem_Fieldall_rem). This was done to enable a comparison of the photogrammetric datasets before and after harvesting (PPCpre_rem_Fieldall_rem and PPCpost_Fieldall_rem). Finally, both photogrammetric tree height datasets containing the remaining 251 trees before and after thinning were compared to each other (PPCpre_rem_PPCpost). The overall statistical results are in Table 4.
3.2. Validation with Direct Measurements
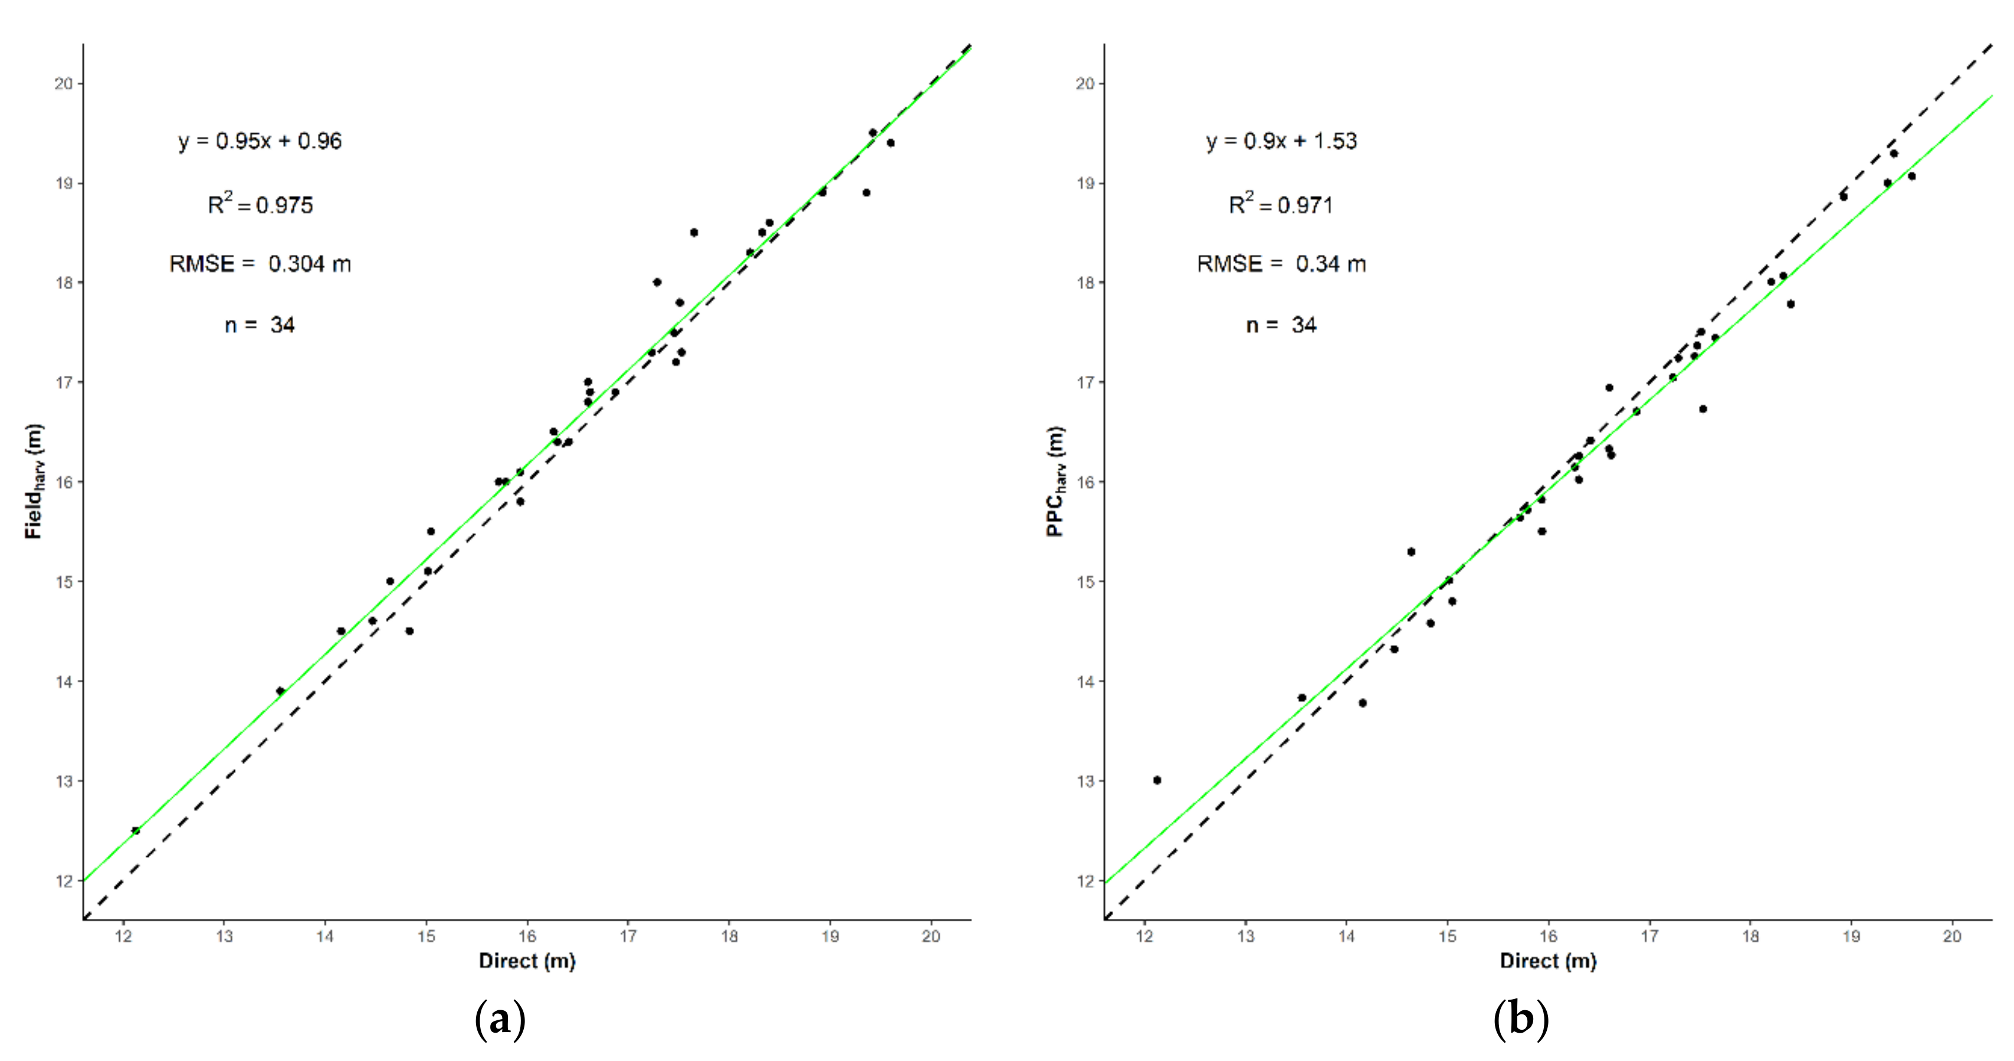
The direct destructive measurement method of the felled trees was assumed the most accurate measurement possible within the framework of this study and was used as a control for the field measurements, as well as the photogrammetric dataset prior to harvesting. When compared to the direct measurements (Direct), the indirect field measurements (Fieldharv) resulted in a RMSE of 0.304 m (1.82%) and a systematic error of 0.144 m (0.86%), showing an overestimation of tree heights. In comparison with the direct measurements (Direct), the photogrammetric measurements (PPCpre_harv) fared slightly worse than the field measurements with a RMSE of 0.34 m (2.07%) and a systematic error of −0.134 m (−0.81%), suggesting an underestimation of tree heights. In terms of random error, the field measurements showed a lower standard deviation error with 0.271 m (1.72%), as opposed to 0.317 m (1.93%) for the photogrammetric dataset. Both regression lines were determined significant (p < 0.001), however, the Fieldharv data displayed a better goodness of fit, particularly with the tallest trees (see Figure 7).
3.3. Validation with Indirect Measurements
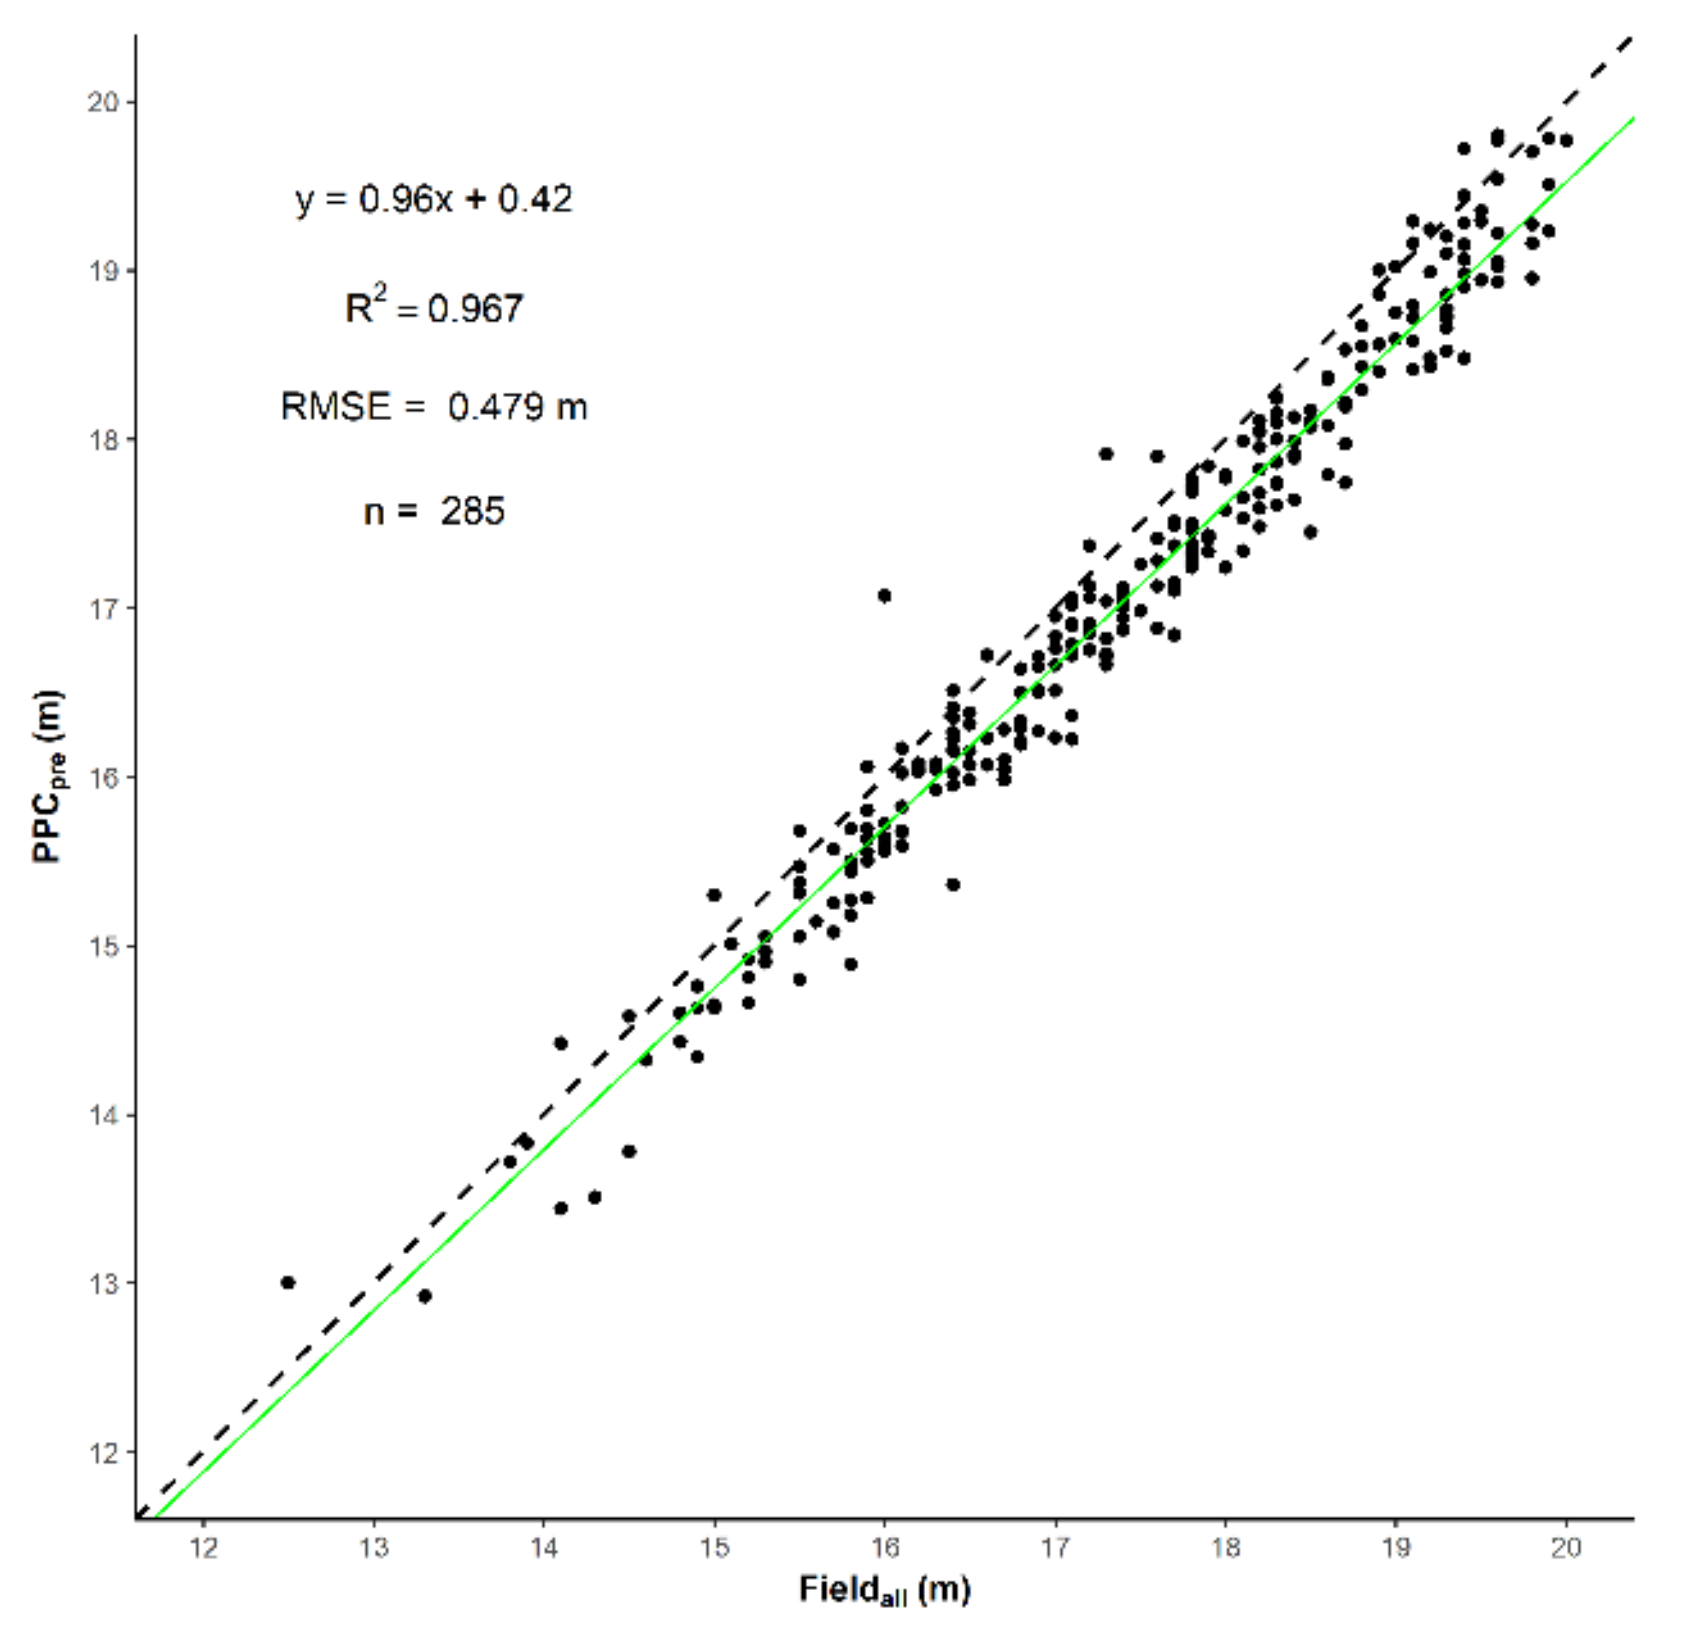
When compared to the indirect field measurements (Fieldall), the photogrammetric tree heights fared similarly in terms of total error and bias. PPCpre resulted with a RMSE of 0.479 m (2.78%) against Fieldall, as well as a bias of −0.365 m (−2.21%) and random error of 0.311 m (1.81%). Figure 8 shows an underestimation of the photogrammetric tree heights (n = 285) in comparison to the field measurements.
The photogrammetric datasets PPCpre_rem and PPCpost before and after harvesting (n = 251) resulted in a RMSE of 0.486 m (2.81%) and 0.477 m (2.75%), respectively. Photogrammetric tree heights were also underestimated when compared to field measurements with a bias of −0.377 m (−2.18%) for PPCpre_rem and −0.369 m (−2.13%) for PPCpost. As with Figure 8, Figure 9 also shows an underestimation of the photogrammetric tree heights (n = 251) in comparison to the field measurements. Important to note here is that the distribution of points below the regression line could also be partially attributable to an overestimation of field-based measurements, as shown in Figure 7a.
3.4. Comparison of Photogrammetric Datasets
Comparing both photogrammetric datasets (see Figure 10) resulted in a very low RMSE of 0.138 m (0.794%). Systemic and Random error were also very low at 0.008 m (0.04%) and 0.138 m (0.79%), respectively. Additionally, the comparison showed a very high correlation between the two photogrammetric datasets (R2 = 0.993).
4. Discussion
Since the arrival of various modern remote sensing technologies, such as ALS and UAVP, point cloud and raster-derived tree heights have been typically validated against indirect field-based measurements [11,12,35,36,37,38,39,40,41]. Field-based tree height measurements should, however, be validated themselves, as the measurement methods implemented alongside the experience and training of technicians could vary, thus increasing uncertainty [42]. Furthermore, measurement errors in tree height can result in an increase in volume prediction error when volume functions involving dbh and h are implemented [59].
In this study, we showed that field-based measurements (RMSE = 0.30 m, 1.82%), when measured by an experienced technician, can result in a similar RMSE as photogrammetric measurements (RMSE = 0.34 m, 2.07%) in an even-aged Scots Pine stand. Interestingly, both measurement methods showed similar amounts of bias, however in opposing directions. The field-based measurements were overestimated with a positive bias of 0.144 m, and the photogrammetric tree heights were underestimated with a negative bias of −0.134 m. Systemic error in opposing directions could be attributable to the total error of the photogrammetric datasets (PPCpre, PPCpre_rem, PPCpost) when compared to the field measurements (approximate RMSE = 0.48 m). This shows that unknown opposing biases can convolute results when uncertainty exists within validation data. According to the instruction manual of the German Federal Carbon Inventory (Kohlenstoffinventur 2017), error tolerance for tree height measurement is set at ±5% for coniferous trees and ±10% for deciduous trees and a maximum error cut-off of ±2 m for both tree types [60]. This leaves the photogrammetrically derived tree heights from this study well within the error tolerance for a typical forest inventory when direct and indirect measurements are used as validation. Important to note here is that the level of error within a forest inventory in terms of tree height is traditionally controlled by a designated technician, however, uncertainty in bias could also exist here. On the other hand, this study shows that when direct measurements are unavailable, field-based measurements can be used with a certain level of reliably for the validation of UAVP, ALS, and TLS tree measurement techniques, which is also in line with the findings of Luoma et al. [61]. Further research is, however, required for the significance of the bias found in this study on single tree and area-based volume predictions.
In terms of the added time and cost involved with measuring GCPs and individual tree stem positions with the TS, though not cost-effective for interim study areas, could however prove feasible for long-term intensive monitoring plots. Permanent GCPs, as well as tree positions, are not only useful for constructing a reliable DTM for multi-temporal tree height extraction, but also for accurate crown positioning required for phenological observations. Additionally, individual tree positions remain valid throughout an individual tree’s life span, enabling the possibility for long-term time-series analysis with various sensors and remote sensing platforms. GCPs could also be implemented for longer periods depending on the durability of permanent ground markings, particularly during thinning procedures. Furthermore, such sites could be implemented for the testing and calibration of remote sensing technologies for the purpose of assessment [62,63,64,65,66], as well as sensor fusion and upscaling [67,68,69].
The trees selected for harvesting were chosen with the criteria of facilitating the further development of selected “future” trees, which are trees typically chosen for their vitality and planned as final crop trees. For this reason, the selected trees for harvesting were less dominant than neighboring future trees and were often part of the lower portions of the canopy. Such positioned trees are often more challenging for photogrammetric tree height extraction, particularly in mixed stands, and can typically result in overestimation due to occlusion from the branches of the more dominant neighboring trees [15,70]. Overestimation was, however, not the case in this study, as underestimation of the photogrammetric tree heights was more evident. Underestimation of the photogrammetric tree heights could have been attributable to the direct measurements of trees when measured on the ground after felling. Most trees, while standing, will have at least a slight leaning angle, as discovered when comparing the highest pixel values in the CHM to the tree stem positions. Tree angle can also increase with less dominant trees, as they will often resort to growing in the direction of openings in the canopy. When such a tree is extended out on a horizontal surface, the length of the tree could vary to the standing height, as the leaning angle is somewhat eliminated. This could explain the underestimation of the photogrammetric tree height measurements caused from the extension of the tree length on the ground during direct measurements. Corrections for underestimation in such cases could be solved with a correction calculation [60] based on the leaning angle of a tree, which could be derived from the planar distance of the tree top to the stem position, as well as tree height. With regards to the overestimation of field-based measurements, this was also reported by Wang et al. [46], particularly for codominant trees.
The comparison of both photogrammetric datasets (PPCpre_rem_PPCpost) was carried out in order to determine the repeatability of tree height measurements among various flight missions. The results show a RMSE of 0.138 m between separate flight missions, suggesting a very high precision. Repeatability at this level shows a promising possibility to measure within-season tree height growth [35] and could merit further study. In terms of long-term intensive forest monitoring plots, such as the Britz Research Station or Level II of International Cooperative Programme (ICP) Forests [32], within-season growth could be a logical enhancement to match highly accurate continuous tree measurement devices, such as electronic dendrometers [71] and sap flow sensors [72]. The question herein lies whether a precision of approximately 0.14 m between photogrammetric datasets is viable for within-season growth measurement when the typical annual growth for a Scots’ Pine could be estimated roughly at approximately 0.3 m. As mentioned above, the maximum allowance of error by a typical forest inventory is ±2 m. Such a margin of potential tree height error makes it difficult to model tree growth under a span of 10 years [1]. Less than 10 years could result in unusable results (i.e., possible negative growth values), despite the field-based measurement accuracy determined in this study (RMSE = 0.304 m). The reason for this is probably not due to the lack of precision of field-based measurements. Luoma et al. [61] found there was no statistically significant difference within the measurement of tree heights among four technicians. The problem lies rather, according to Wang et al. [46], in the fact that field-based tree heights are more sensitive to stand conditions, for example in trees that are over 20 m, as well as the uncertainty in determining the tree tops of deciduous trees. Additionally, there are also the challenges in carrying out field-based measurements on uneven and sloping terrain.
The precision of UAVP-based tree heights on intensive monitoring plots established through the methods described in this paper could be the missing link in establishing tree growth models under 10 years. Within-season measurements would be an ideal outcome for reasons introduced above, however probably only possible for sites stocked with younger trees or fast-growing trees, for example in species with the genus Populus or Salix. Measurements on a yearly basis, however, should be theoretically possible and further testing is required. UAVP does, however, have issues of occlusion of the ground floor and lower parts of the canopy, as well as tree height underestimation, as shown in this study. Occlusion and underestimation can also be relevant for ALS and TLS technologies [46,73]. Furthermore, automated algorithms implemented for tree height estimation can show significant differences, especially in structural divers and dense forest stands [73].
With regards to UAVP actually replacing field-based measurements, this is still somewhat of a challenge, especially for typical forest inventories due to the difficulties of georeferencing images in forested areas. In terms of intensive forest monitoring plots, in particular at research stations (Level III—core plots), the methodology introduced in this study shows that UAVP could prove an invaluable addition to on-site continuous measurements of not just the highly temporal and rapid acquisition of tree heights but also the measurement of tree crown diameter, as well as the quantification of phenological observations. Such measurements could also be carried out in stands where accessibility is an issue for traditional field methods. The deciding factors will most probably be reliant on an increased demand for such highly temporal datasets, time efficiency compared to field-based methods, the availability of the technical expertise of personnel, and the affordability of Unmanned Aerial Systems (UASs) and sensors.
5. Conclusions
The focus of this study was to determine the accuracy and precision of tree height measurements using UAV photogrammetry at an intensive forest monitoring site. We showed that photogrammetric measurements can attain similar accuracies to that of indirect field measurements in an even-aged Scots Pine stand when destructive direct measurements are used as validation. It was found that compared to direct measurements, indirect field-based measurements tend to overestimate tree heights and UAV-based photogrammetric measurements have a tendency to underestimate tree heights. Such positive and negative biases show a potential for a misinterpretation of results when photogrammetric tree heights are validated with field measurements, especially when biases are unknown. Nevertheless, it was determined that field-based measurements are adequate for the purpose of the validation of UAVP tree heights when direct measurements are not available. We also discovered a very high precision between photogrammetric tree height measurements derived from two separate UAV missions, which could suggest a possibility to obtain yearly tree height increments, or even measurements within a growth season for young or fast-growing tree species.
This paper shows that UAVP has the potential to possibly replace in situ tree height measurements at intensive forest monitoring plots where a permanent GCP configuration is available.
Author Contributions
Conceptualization, S.K., T.G.M.S., and J.P.M.; data curation, S.K.; formal analysis, S.K.; funding acquisition, T.G.M.S. and J.P.M.; investigation, S.K.; methodology, S.K.; project administration, T.G.M.S. and J.P.M.; resources, T.G.M.S. and J.P.M.; software, S.K.; supervision, T.G.M.S., J.P.M., and K.G.; validation, S.K.; visualization, S.K.; writing—original draft, S.K.; writing—review and editing, S.K., T.G.M.S., J.P.M., and K.G.
Funding
The equipment for this research was funded by the EU-Commission within the European Regional Development Fund (EFRE) project for “Knowledge and Technology Transfer” under the grant number 80160635.
Acknowledgments
The authors would like to thank the members of the Britz Research Station (Thünen Institute), namely Jürgen Müller for support in the field and during felling. Our thanks also goes to Kinga Jánosi and Jens Wiesehahn (Thünen Institute), as well as the student employees from the Eberswalde University for Sustainable Development (HNEE) for their support in the field.
Conflicts of Interest
The authors declare no conflict of interest.
References
- Kershaw, J.A.; Ducey, M.J.; Beers, T.W.; Husch, B. Forest Mensuration, 5th ed.; John Wiley & Sons: Chichester, UK; Hoboken, NJ, USA, 2016; ISBN 978-1-118-90203-5. [Google Scholar]
- West, P.W. Tree and Forest Measurement; Springer International Publishing: Cham, Switzerland, 2015; ISBN 978-3-319-14707-9. [Google Scholar]
- Thenkabail, P.S. Land Resources Monitoring, Modeling, and Mapping with Remote Sensing; CRC Press: Boca Raton, FL, USA, 2015; ISBN 978-1-4822-1798-8. [Google Scholar]
- Andersen, H.-E.R.; Stephen, E.; McGaughey, R.J. A rigorous assessment of tree height measurements obtained using airborne lidar and conventional field methods. Can. J. Remote Sens. 2006, 32, 355–366. [Google Scholar] [CrossRef]
- Bolte, A.; Ammer, C.; Löf, M.; Madsen, P.; Nabuurs, G.-J.; Schall, P.; Spathelf, P.; Rock, J. Adaptive forest management in central Europe: Climate change impacts, strategies and integrative concept. Scand. J. For. Res. 2009, 24, 473–482. [Google Scholar] [CrossRef]
- Spathelf, P.; Stanturf, J.; Kleine, M.; Jandl, R.; Chiatante, D.; Bolte, A. Adaptive measures: Integrating adaptive forest management and forest landscape restoration. Ann. For. Sci. 2018, 75, 55. [Google Scholar] [CrossRef]
- Picard, N.; Saint-André, L.; Henry, M. Manual for Building Tree Volume and Biomass Allometric Equations from Filed Measurement to Prediction; Food and Agriculture Organization of the United Nations (FAO): Rome, Italy, 2012; ISBN 978-92-5-107347-6. [Google Scholar]
- Van Laar, A.; Akça, A. Forest Mensuration; Springer: Dordrecht, The Netherlands, 2007; ISBN 978-1-4020-5990-2. [Google Scholar]
- Watts, S.B.; Tolland, L. Forestry Handbook for British Columbia; Part 2; Forestry Undergraduate Society, University of British Columbia: Vancouver, BC, Canada, 2005; ISBN 978-0-88865-447-2. [Google Scholar]
- Bragg, D.C. Accurately Measuring the Height of (Real) Forest Trees. J. For. 2014, 112, 51–54. [Google Scholar] [CrossRef]
- Apostol, B.; Lorent, A.; Petrila, M.; Gancz, V.; Badea, O. Height Extraction and Stand Volume Estimation Based on Fusion Airborne LiDAR Data and Terrestrial Measurements for a Norway Spruce [Picea abies (L.) Karst.] Test Site in Romania. Not. Bot. Horti Agrobot. Cluj-Napoca 2016, 44, 313–323. [Google Scholar] [CrossRef]
- Falkowski, M.J.; Smith, A.M.; Hudak, A.T.; Gessler, P.E.; Vierling, L.A.; Crookston, N.L. Automated estimation of individual conifer tree height and crown diameter via two-dimensional spatial wavelet analysis of lidar data. Can. J. Remote Sens. 2006, 32, 153–161. [Google Scholar] [CrossRef]
- Rogers, E.J. Estimating tree heights from shadows on vertical aerial photographs. J. For. 1949, 47, 182–191. [Google Scholar]
- Spurr, S.H. Photogrammetry and Photo-Interpretation. With a section on Applications to Forestry, 2nd ed.; Ronald Press: New York, NY, USA, 1960; ISBN 60-9662. [Google Scholar]
- St-Onge, B.; Audet, F.-A.; Bégin, J. Characterizing the Height Structure and Composition of a Boreal Forest Using an Individual Tree Crown Approach Applied to Photogrammetric Point Clouds. Forests 2015, 6, 3899–3922. [Google Scholar] [CrossRef]
- Guerra-Hernandez, J.; Gonzalez-Ferreiro, E.; Sarmento, A.; Silva, J.; Nunes, A.; Correia, A.C.; Fontes, L.; Tomé, M.; Diaz-Varela, R. Short Communication. Using high resolution UAV imagery to estimate tree variables in Pinus pinea plantation in Portugal. For. Syst. 2016, 25, eSC09. [Google Scholar] [CrossRef]
- Maltamo, M.; Næsset, E.; Vauhkonen, J. (Eds.) Forestry Applications of Airborne Laser Scanning; Managing Forest Ecosystems; Springer Netherlands: Dordrecht, The Netherlands, 2014; Volume 27, ISBN 978-94-017-8662-1. [Google Scholar]
- Næsset, E.; Gobakken, T.; Holmgren, J.; Hyyppä, H.; Hyyppä, J.; Maltamo, M.; Nilsson, M.; Olsson, H.; Persson, Å.; Söderman, U. Laser scanning of forest resources: The nordic experience. Scand. J. For. Res. 2004, 19, 482–499. [Google Scholar] [CrossRef]
- Kaartinen, H.; Hyyppä, J.; Yu, X.; Vastaranta, M.; Hyyppä, H.; Kukko, A.; Holopainen, M.; Heipke, C.; Hirschmugl, M.; Morsdorf, F.; et al. An International Comparison of Individual Tree Detection and Extraction Using Airborne Laser Scanning. Remote Sens. 2012, 4, 950–974. [Google Scholar] [CrossRef]
- Huanmin, L.; Erxue, C.; Jian, C.; Xiaowen, L. Forest height estimation methods using polarimetric SAR interferometry. J. Remote Sens. 2010, 14, 806–821. [Google Scholar]
- Pohl, C.; Loong, C.K. In-situ Data Collection for Oil Palm Tree Height Determination using Synthetic Aperture Radar. Available online: https://0-iopscience-iop-org.brum.beds.ac.uk/article/10.1088/1755-1315/34/1/012027 (accessed on 28 March 2019).
- Hyyppä, J.; Mielonen, T.; Hyyppä, H.; Maltamo, M.; Yu, X.; Honkavaara, E.; Kaartinen, H. Using individual tree crown approach for forest volume extraction with aerial images and laser point clouds. Int. Arch. Photogramm. Remote Sens. Spat. Inf. Sci. 2005, 36, W19. [Google Scholar]
- Jucker, T.; Caspersen, J.; Chave, J.; Antin, C.; Barbier, N.; Bongers, F.; Dalponte, M.; van Ewijk, K.Y.; Forrester, D.I.; Haeni, M.; et al. Allometric equations for integrating remote sensing imagery into forest monitoring programmes. Glob. Chang. Biol. 2017, 23, 177–190. [Google Scholar] [CrossRef] [PubMed]
- Corona, P.; Chianucci, F.; Quatrini, V.; Civitarese, V.; Clementel, F.; Costa, C.; Floris, A.; Menesatti, P.; Puletti, N.; Sperandio, G.; et al. Precision forestry: Concepts, tools and perspectives in Italy. For. Riv. Selvic. Ed. Ecol. For. 2017, 14, 1–12. [Google Scholar] [CrossRef]
- Dash, J.; Pont, D.; Brownlie, R.; Dunningham, A.; Watt, M.; Pearse, G. Remote sensing for precision forestry. N. Z. J. For. 2016, 60, 15. [Google Scholar]
- Holopainen, M.; Vastaranta, M.; Hyyppä, J. Outlook for the Next Generation’s Precision Forestry in Finland. Forests 2014, 5, 1682–1694. [Google Scholar] [CrossRef]
- Smaltschinski, T.; Becker, G. Precision Forestry und forstliche Wertschöpfungskette; Institut für Forstnutzung und Forstliche Arbeitswissenschaft: Freiburg, Germany, 2009; p. 4. [Google Scholar]
- Šumarstvo. Precision Forestry—Definition and Technologies. Šumarski List 2010, 134, 603–610. [Google Scholar]
- Taylor, S.E.; Veal, M.W.; Grift, T.E.; McDonald, T.P.; Corley, F.W. Precision Forestry: Operational Tactics For Today And Tomorrow. In Proceedings of the International meeting of the Council on Forest Engineering, Schaegl, Austria, 5–9 October 2002; Volume 7. [Google Scholar]
- Moskal, L.M.; Erdody, T.; Kato, A.; Richardson, J.; Zheng, G.; Briggs, D. Lidar Applications in Precision Forestry. Proc. Silvilaser 2009, 11, 154–163. [Google Scholar]
- White, J.; Coops, N.; Wulder, M.; Vastaranta, M.; Hilker, T.; Tompalski, P. Remote Sensing Technologies for Enhancing Forest Inventories: A Review. Can. J. Remote Sens. 2016, 42, 619–641. [Google Scholar] [CrossRef]
- Ferretti, M.; Fischer, R. (Eds.) Developments in environmental science. In Forest Monitoring: Methods for Terrestrial Investigations in Europe with an Overview of North America and Asia, 1st ed.; Elsevier: Amsterdam, The Netherlands; Boston, MA, USA, 2013; ISBN 978-0-08-098222-9. [Google Scholar]
- Eisenbeiß, H. Mitteilungen/Institut für Geodäsie und Photogrammetrie an der Eidgenössischen Technischen Hochschule Zürich. In UAV Photogrammetry; ETH, Inst. für Geodäsie und Photogrammetrie: Zürich, Switzerland, 2009; ISBN 978-3-906467-86-3. [Google Scholar]
- Wallace, L.; Lucieer, A.; Malenovský, Z.; Turner, D.; Vopěnka, P. Assessment of Forest Structure Using Two UAV Techniques: A Comparison of Airborne Laser Scanning and Structure from Motion (SfM) Point Clouds. Forests 2016, 7, 62. [Google Scholar] [CrossRef]
- Dempewolf, J.; Nagol, J.; Hein, S.; Thiel, C.; Zimmermann, R. Measurement of Within-Season Tree Height Growth in a Mixed Forest Stand Using UAV Imagery. Forests 2017, 8, 231. [Google Scholar] [CrossRef]
- Liu, G.; Wang, J.; Dong, P.; Chen, Y.; Liu, Z. Estimating Individual Tree Height and Diameter at Breast Height (DBH) from Terrestrial Laser Scanning (TLS) Data at Plot Level. Forests 2018, 9, 398. [Google Scholar] [CrossRef]
- Mielcarek, M.; Stereńczak, K.; Khosravipour, A. Testing and evaluating different LiDAR-derived canopy height model generation methods for tree height estimation. Int. J. Appl. Earth Obs. Geoinf. 2018, 71, 132–143. [Google Scholar] [CrossRef]
- Popescu, S.C.; Wynne, R.H.; Nelson, R.F. Estimating plot-level tree heights with lidar: Local filtering with a canopy-height based variable window size. Comput. Electron. Agric. 2002, 37, 71–95. [Google Scholar] [CrossRef]
- Panagiotidis, D.; Abdollahnejad, A.; Surový, P.; Chiteculo, V. Determining tree height and crown diameter from high-resolution UAV imagery. Int. J. Remote Sens. 2016, 38, 2392–2410. [Google Scholar] [CrossRef]
- Gatziolis, D.; Fried, J.S.; Monleon, V.S. Challenges to estimating tree height via LiDAR in closed-canopy forests: A parable from western Oregon. For. Sci. 2010, 56, 139–155. [Google Scholar]
- Imai, Y.; Setojima, M.; Yamagishi, Y.; Fujiwara, N. Tree-height measuring characteristics of urban forests by LiDAR data different in resolution. In Proceedings of the International Society of Photogrammetry and Remote Sensing Conference, Istanbul, Turkey, 12–23 July 2004; Volume 4, pp. 12–23. [Google Scholar]
- Larjavaara, M.; Muller-Landau, H.C. Measuring tree height: A quantitative comparison of two common field methods in a moist tropical forest. Methods Ecol. Evol. 2013, 4, 793–801. [Google Scholar] [CrossRef]
- Boi, M. Efficiency of ultrasonic Vertex III hypsometer compared to the most commonly used hypsometers in Croatian forestry. Croat. J. For. Eng. 2005, 13, 91–99. [Google Scholar]
- Butt, N.; Slade, E.; Thompson, J.; Malhi, Y.; Riutta, T. Quantifying the sampling error in tree census measurements by volunteers and its effect on carbon stock estimates. Ecol. Appl. 2013, 23, 936–943. [Google Scholar] [CrossRef] [PubMed]
- Sibona, E.; Vitali, A.; Meloni, F.; Caffo, L.; Dotta, A.; Lingua, E.; Motta, R.; Garbarino, M. Direct Measurement of Tree Height Provides Different Results on the Assessment of LiDAR Accuracy. Forests 2016, 8, 7. [Google Scholar] [CrossRef]
- Wang, Y.; Lehtomäki, M.; Liang, X.; Pyörälä, J.; Kukko, A.; Jaakkola, A.; Liu, J.; Feng, Z.; Chen, R.; Hyyppä, J. Is field-measured tree height as reliable as believed—A comparison study of tree height estimates from field measurement, airborne laser scanning and terrestrial laser scanning in a boreal forest. ISPRS J. Photogramm. Remote Sens. 2019, 147, 132–145. [Google Scholar] [CrossRef]
- Müller, J.; Bolte, A. The use of lysimeters in forest hydrology research in north-east Germany. Landbauforschung 2009, 59, 1–10. [Google Scholar]
- Krause, S.; Hartmann, F.; Mund, J.-P. UAV Workflow Optimization for the Acquisition of High-Quality Photogrammetric Point Clouds in Forestry. GI-Forum 2016, 1, 72–84. [Google Scholar] [CrossRef]
- Siebert, S.; Teizer, J. Mobile 3D mapping for surveying earthwork projects using an Unmanned Aerial Vehicle (UAV) system. Autom. Constr. 2014, 41, 1–14. [Google Scholar] [CrossRef]
- McGaughey, R.J. FUSION/LDV: Software for LIDAR Data Analysis and Visualization.; US Department of Agriculture, Forest Service: Pacific Northwest Research Station: Seattle, WA, USA,, 2018.
- R Core Team. R: A Language and Environment for Statistical Computing; R Foundation for Statistical Computing: Vienna, Austria, 2016. [Google Scholar]
- Silva, C.A.; Hudak, A.; Vierling, L.A. rLiDAR: An R Package for Reading, Processing and Visualizing LiDAR (Light Detection and Ranging) Data. Available online: https://rdrr.io/cran/rLiDAR/ (accessed on 28 March 2019).
- Roussel, J.-R.; Auty, D. LidR: Airborne LiDAR Data Manipulation and Visualization for Forestry Applications. Available online: https://rdrr.io/cran/lidR/ (accessed on 28 March 2019).
- Mohan, M.; Silva, C.; Klauberg, C.; Jat, P.; Catts, G.; Cardil, A.; Hudak, A.; Dia, M. Individual Tree Detection from Unmanned Aerial Vehicle (UAV) Derived Canopy Height Model in an Open Canopy Mixed Conifer Forest. Forests 2017, 8, 340. [Google Scholar] [CrossRef]
- Matasci, G.; Hermosilla, T.; Wulder, M.A.; White, J.C.; Coops, N.C.; Hobart, G.W.; Zald, H.S.J. Large-area mapping of Canadian boreal forest cover, height, biomass and other structural attributes using Landsat composites and lidar plots. Remote Sens. Environ. 2018, 209, 90–106. [Google Scholar] [CrossRef]
- White, J.; Stepper, C.; Tompalski, P.; Coops, N.; Wulder, M. Comparing ALS and Image-Based Point Cloud Metrics and Modelled Forest Inventory Attributes in a Complex Coastal Forest Environment. Forests 2015, 3704–3732. [Google Scholar] [CrossRef]
- Straub, C.; Stepper, C.; Seitz, R.; Waser, L.T. Potential of UltraCamX stereo images for estimating timber volume and basal area at the plot level in mixed European forests. Can. J. For. Res. 2013, 43, 731–741. [Google Scholar] [CrossRef]
- Vastaranta, M.; Niemi, M.; Karjalainen, M.; Peuhkurinen, J.; Kankare, V.; Hyyppä, J.; Holopainen, M. Prediction of Forest Stand Attributes Using TerraSAR-X Stereo Imagery. Remote Sens. 2014, 6, 3227–3246. [Google Scholar] [CrossRef]
- Arias-Rodil, M.; Diéguez-Aranda, U.; Burkhart, H.E. Effects of Measurement Error in Total Tree Height and Upper-Stem Diameter on Stem Volume Prediction. For. Sci. 2017, 63, 250–260. [Google Scholar]
- Riedel, T. Aufnahmeanweisung für die Kohlenstoffinventur 2017 (CI 2017): 1. Auflage, Juli 2016 (Version 1.2); Bundesministerium für Ernährung und Landwirtschaft (BMEL): Bonn, Germany, 2017; Volume 99. [Google Scholar]
- Luoma, V.; Saarinen, N.; Wulder, M.; White, J.; Vastaranta, M.; Holopainen, M.; Hyyppä, J. Assessing Precision in Conventional Field Measurements of Individual Tree Attributes. Forests 2017, 8, 38. [Google Scholar] [CrossRef]
- Zimmermann, F.; Eling, C.; Klingbeil, L.; Kuhlmann, H. Precise Positioning of UAVs—Dealing with Challenging RTK-GPS Measurement Conditions During Automated UAV Flights. ISPRS Ann. Photogramm. Remote Sens. Spat. Inf. Sci. 2017, IV-2/W3, 95–102. [Google Scholar] [CrossRef]
- Gerke, M.; Przybilla, H.-J. Accuracy Analysis of Photogrammetric UAV Image Blocks: Influence of Onboard RTK-GNSS and Cross Flight Patterns. Photogramm. Fernerkund. Geoinf. 2016, 2016, 17–30. [Google Scholar] [CrossRef]
- Liang, Z.; Hanfeng, L.; Dingjie, W.; Yanqing, H.; Jie, W. Asynchronous RTK precise DGNSS positioning method for deriving a low-latency high-rate output. J. Geod. 2015, 89, 641–653. [Google Scholar] [CrossRef]
- Hakala, T.; Markelin, L.; Honkavaara, E.; Scott, B.; Theocharous, T.; Nevalainen, O.; Näsi, R.; Suomalainen, J.; Viljanen, N.; Greenwell, C.; et al. Direct Reflectance Measurements from Drones: Sensor Absolute Radiometric Calibration and System Tests for Forest Reflectance Characterization. Sensors 2018, 18, 1417. [Google Scholar] [CrossRef] [PubMed]
- Kraft, T.; Geßner, M.; Meißner, H.; Cramer, M.; Gerke, M.; Przybilla, H.J. Evaluation of a Metric Camera System Tailored for High Precision UAV Applications. ISPRS Int. Arch. Photogramm. Remote Sens. Spat. Inf. Sci. 2016, XLI-B1, 901–907. [Google Scholar] [CrossRef]
- Dash, J.; Pearse, G.; Watt, M. UAV Multispectral Imagery Can Complement Satellite Data for Monitoring Forest Health. Remote Sens. 2018, 10, 1216. [Google Scholar] [CrossRef]
- Puliti, S.; Saarela, S.; Gobakken, T.; Ståhl, G.; Næsset, E. Combining UAV and Sentinel-2 auxiliary data for forest growing stock volume estimation through hierarchical model-based inference. Remote Sens. Environ. 2018, 204, 485–497. [Google Scholar] [CrossRef]
- Abdollahnejad, A.; Panagiotidis, D.; Surový, P. Estimation and Extrapolation of Tree Parameters Using Spectral Correlation between UAV and Pléiades Data. Forests 2018, 9, 85. [Google Scholar] [CrossRef]
- Baltsavias, E.P. A comparison between photogrammetry and laser scanning. ISPRS J. Photogramm. Remote Sens. 1999, 54, 83–94. [Google Scholar] [CrossRef]
- Drew, D.M.; Downes, G.M. The use of precision dendrometers in research on daily stem size and wood property variation: A review. Dendrochronologia 2009, 27, 159–172. [Google Scholar] [CrossRef]
- Meinzer, F.C.; Bond, B.J.; Warren, J.M.; Woodruff, D.R. Does water transport scale universally with tree size? Funct. Ecol. 2005, 19, 558–565. [Google Scholar] [CrossRef]
- Liang, X.; Hyyppä, J.; Kaartinen, H.; Lehtomäki, M.; Pyörälä, J.; Pfeifer, N.; Holopainen, M.; Brolly, G.; Francesco, P.; Hackenberg, J.; et al. International benchmarking of terrestrial laser scanning approaches for forest inventories. ISPRS J. Photogramm. Remote Sens. 2018, 144, 137–179. [Google Scholar] [CrossRef]
Figure 1.
Overview of the Britz Research Station. Plots 1 and 2: European Beech (Fagus sylvatica). Plot 3: European Larch (Larix decidua) with a Beech understory. Plot 4: Sessile Oak (Quercus petraea). Plot 5: Scots Pine (Pinus sylverstris) with a Beech understory. Plot 6: Scots Pine with an Oak understory. Plots 7 and 8: Douglas Fir (Pseudotsuga menziessi). Plot 9: Scots Pine with a sparse understory of Beech and Oak.

Figure 2.
Overview of the 289 trees of the Scots Pine monoculture.

Figure 3.
Unmanned Aerial Vehicle (UAV) image processing workflow in relation to the image acquisition and field data collection campaigns. SfM: structure from motion; CHM: Canopy Height Model; GCP: ground control point; RTK: Real Time Kinematic; GNSS: Global Navigation Satellite System; TS: Total Station.

Figure 4.
OctoXL 6S12 Octocopter mounted with a fixed lens Sony A7r RGB camera.

Figure 5.
The majority of the treetops (>80%) were detected with the local maxima algorithm. Non-detected trees required positional adjustments dependent on the highest pixel values in proximity to the tree stem positions and visual assessment of the tree crowns in the Orthomosaic. (a) The Canopy Height Model (CHM) before harvesting with automatically detected and adjusted tree tops. (b) Treetop positions shown over the Orthomosaic before harvesting. (c) CHM after harvesting with noticeable gaps in the canopy. (d) Orthomosaic after harvesting.

Figure 6.
Boxplots grouped by sample size showing the distribution of tree heights among all of the datasets.
Figure 6.
Boxplots grouped by sample size showing the distribution of tree heights among all of the datasets.

Figure 7.
(a) Indirect field measurements against the direct measurements (Fieldharv_Direct). (b) Photogrammetric tree heights against the direct measurements (PPCpre_harv_Direct).
Figure 7.
(a) Indirect field measurements against the direct measurements (Fieldharv_Direct). (b) Photogrammetric tree heights against the direct measurements (PPCpre_harv_Direct).

Figure 8.
Photogrammetric tree height dataset prior to harvesting (PPCpre_Fieldall) compared to the indirect field measurements for the entire stand.
Figure 8.
Photogrammetric tree height dataset prior to harvesting (PPCpre_Fieldall) compared to the indirect field measurements for the entire stand.

Figure 9.
Comparison of the photogrammetric datasets before (a) (PPCpre_rem_Fieldall_rem) and after (b) harvesting (PPCpost_Fieldall_rem) with adjusted sample size (n = 251), excluding the harvested trees.
Figure 9.
Comparison of the photogrammetric datasets before (a) (PPCpre_rem_Fieldall_rem) and after (b) harvesting (PPCpost_Fieldall_rem) with adjusted sample size (n = 251), excluding the harvested trees.

Figure 10.
Comparison of both photogrammetric tree height datasets containing the remaining 251 trees before and after thinning (PPCpre_rem_PPCpost).
Figure 10.
Comparison of both photogrammetric tree height datasets containing the remaining 251 trees before and after thinning (PPCpre_rem_PPCpost).


Table 1.
Overview of the resulting statistical parameters for the photogrammetric products before and after harvesting. RMSE: root mean square error; GSD: ground sampling distance.
Table 1.
Overview of the resulting statistical parameters for the photogrammetric products before and after harvesting. RMSE: root mean square error; GSD: ground sampling distance.
| Mission | Calibrated Images | RMSE | GSD (cm/pixel) | Points | Point Density (m3) |
|---|---|---|---|---|---|
| February 13, 2018 (PPCpre) | 143 | 0.009 | 0.90 | 27,576,865 | 2,731.39 |
| April 29, 2018 (PPCpost) | 161 | 0.01 | 1.02 | 27,171,260 | 1,727.18 |
Table 2.
The four main datasets for analysis. Fieldall: all of the field-based measurements carried out before harvesting; UAVP: Unmanned Aerial Vehicle Photogrammetry; PPCpre: UAVP tree heights acquired before harvesting; Direct: direct measurements of trees during harvesting; PPCpost: UAVP tree heights acquired after harvesting.
| Description | n | Acquisition Date | |
|---|---|---|---|
| Fieldall | Field-based indirect measurements | 285 | February, 2018 |
| PPCpre | UAVP mission before harvesting | 285 | February, 2018 |
| Direct | Direct measurements of harvested trees | 34 | March, 2018 |
| PPCpost | UAVP mission after harvesting | 251 | April, 2018 |
Table 3.
Overview of the statistical results of the tree height datasets (in meters) adjusted for sample size for analysis. Direct: direct measurements of trees during harvesting; Fieldharv: field-based measurements carried out before harvesting of only the harvested trees; PPCpre_harv: Unmanned Aerial Vehicle Photogrammetry (UAVP) tree heights acquired before harvesting of only harvested trees; Fieldall: all of the field-based measurements carried out before harvesting; PPCpre: UAVP tree heights acquired before harvesting; Fieldall_rem: field-based measurements carried out before harvesting adjusted for sample size; PPCpre_rem: UAVP tree heights acquired before harvesting adjusted to post harvest sample size; PPCpost: UAVP tree heights acquired after harvesting.
| Min (m) | 1st Quartial (m) | Median (m) | Mean (m) | 3rd Quartial (m) | Max (m) | N | Original Dataset | |
|---|---|---|---|---|---|---|---|---|
| Direct | 12.12 | 15.74 | 16.60 | 16.58 | 17.53 | 19.60 | 34 | - |
| Fieldharv | 12.50 | 15.85 | 16.85 | 16.72 | 17.95 | 19.50 | 34 | Fieldall |
| PPCpre_harv | 13.00 | 15.54 | 16.37 | 16.44 | 17.43 | 19.20 | 34 | PPCpre |
| Fieldall | 11.10 | 16.40 | 17.60 | 17.58 | 18.80 | 21.90 | 285 | - |
| PPCpre | 10.37 | 16.07 | 17.25 | 17.22 | 18.43 | 21.12 | 285 | - |
| Fieldall_rem | 11.10 | 16.45 | 17.80 | 17.70 | 19.00 | 21.90 | 251 | Fieldall |
| PPCpre_rem | 10.37 | 16.15 | 17.34 | 17.32 | 18.54 | 21.12 | 251 | PPCpre |
| PPCpost | 10.45 | 16.10 | 17.36 | 17.33 | 18.62 | 21.09 | 251 | - |
Table 4.
Overall statistical results of the compared tree height datasets.
| Dataset Comparison | Total Error | Systematic Error (Bias) | Random Error | Correlation | Total | ||||
|---|---|---|---|---|---|---|---|---|---|
| RMSE (m) | RMSE (%) | ME (m) | ME (%) | SDE (m) | SDE (%) | R2 | p-Value | n | |
| Fieldharv_Direct | 0.304 | 1.82 | 0.144 | 0.86 | 0.271 | 1.62 | 0.975 | 2.2 × 10⁻¹⁶ | 34 |
| PPCpre_harv_Direct | 0.34 | 2.07 | −0.134 | −0.81 | 0.317 | 1.93 | 0.971 | 2.2 × 10⁻¹⁶ | 34 |
| PPCpre_Fieldall | 0.479 | 2.78 | −0.365 | −2.12 | 0.311 | 1.81 | 0.967 | 2.2 × 10⁻¹⁶ | 285 |
| PPCpre_rem_Fieldall_rem | 0.486 | 2.81 | −0.377 | −2.18 | 0.308 | 1.78 | 0.967 | 2.2 × 10⁻¹⁶ | 251 |
| PPCpost_Fieldall_rem | 0.477 | 2.75 | −0.369 | −2.13 | 0.302 | 1.74 | 0.968 | 2.2 × 10⁻¹⁶ | 251 |
| PPCpre_rem_PPCpost | 0.138 | 0.794 | 0.008 | 0.04 | 0.138 | 0.79 | 0.993 | 2.2 × 10⁻¹⁶ | 251 |
© 2019 by the authors. Licensee MDPI, Basel, Switzerland. This article is an open access article distributed under the terms and conditions of the Creative Commons Attribution (CC BY) license (http://creativecommons.org/licenses/by/4.0/).
Share and Cite
MDPI and ACS Style
Krause, S.; Sanders, T.G.M.; Mund, J.-P.; Greve, K. UAV-Based Photogrammetric Tree Height Measurement for Intensive Forest Monitoring. Remote Sens. 2019, 11, 758. https://0-doi-org.brum.beds.ac.uk/10.3390/rs11070758
AMA Style
Krause S, Sanders TGM, Mund J-P, Greve K. UAV-Based Photogrammetric Tree Height Measurement for Intensive Forest Monitoring. Remote Sensing. 2019; 11(7):758. https://0-doi-org.brum.beds.ac.uk/10.3390/rs11070758
Chicago/Turabian StyleKrause, Stuart, Tanja G.M. Sanders, Jan-Peter Mund, and Klaus Greve. 2019. "UAV-Based Photogrammetric Tree Height Measurement for Intensive Forest Monitoring" Remote Sensing 11, no. 7: 758. https://0-doi-org.brum.beds.ac.uk/10.3390/rs11070758
Note that from the first issue of 2016, this journal uses article numbers instead of page numbers. See further details here.