Article

Emittance Spectroscopy and Broadband Thermal Remote Sensing Applied to Phosphorite and Its Utility in Geoexploration: A Study in the Parts of Rajasthan, India

1
Geosciences Group, National Remote Sensing Centre, Indian Space Research Organization (ISRO) Balanagar, Hyderabad 500037, India
2
Graduate School of Environmental Studies, Nagoya University, Nagoya 464-8601, Japan
3
Department of Geological and Mining Engineering and Sciences, Michigan Technological University, Houghton, MI 49931, USA
*
Author to whom correspondence should be addressed.
Submission received: 11 April 2019 / Revised: 23 April 2019 / Accepted: 24 April 2019 / Published: 27 April 2019

Abstract

:
The contrast in the emissivity spectra of phosphorite and associated carbonate rock can be used as a guide to delineate phosphorite within dolomite. The thermal emissivity spectrum of phosphorite is characterized by a strong doublet emissivity feature with their absorption minima at 9 µm and 9.5 µm; whereas, host rock dolomite has relatively subdued emissivity minima at ~9 µm. Using the contrast in the emissivity spectra of phosphorite and dolomite, data obtained by the thermal bands of Advanced Spaceborne Thermal Emission and Reflection Radiometer (ASTER) sensor were processed to delineate phosphorite within dolomite. A decorrelation stretched ASTER radiance composite could not enhance phosphorite rich zones within the dolomite host rock. However, a decorrelation stretched image composite of selected emissivity bands derived using the emissivity normalization method was suitable to enhance large surface exposures of phosphorite. We have found that the depth of the emissivity minima of phosphorite gradually has increased from dolomite to high-grade phosphorite, while low-grade phosphate has an intermediate emissivity value and the emissivity feature can be studied using three thermal bands of ASTER. In this context, we also propose a relative band depth (RBD) image using selected emissivity bands (bands 11, 12, and 13) to delineate phosphorite from the host rock. We also propose that the RBD image can be used as a proxy to estimate the relative grades of phosphorites, provided the surface exposures of phosphorite are large enough to subdue the role of intrapixel spectral mixing, which can also influence the depth of the diagnostic feature along with the grade. We have validated the phosphorite pixels of the RBD image in the field by carrying out colorimetric analysis to confirm the presence of phosphorite. The result of the study indicates the utility of the proposed relative band depth image derived using ASTER TIR bands for delineating Proterozoic carbonate-hosted phosphorite.

Graphical Abstract

1. Introduction

Phosphorites are known as the source rock of fertilizer, and its exploration is very important for agriculture-dependent countries like India that have huge populations. New methods are essential for exploring additional pockets of phosphorite as India imports 85% of the phosphorite used to make fertilizer [1]. In this study, we propose a simple, easily reproducible thermal remote sensing-based method for the delineation of phosphorite as the input for detailed exploration. Phosphate minerals are known to have diagnostic absorption features within the spectral domain of 8.3 to 11.25 micrometers [2]. However, there are no records available on the attempts made to analyze and utilize the emissivity spectra of phosphorite (constituted with phosphate-bearing minerals) for geological exploration. This study aims to delineate phosphorite within host rocks based on the processing of broadband thermal multispectral data using the emissivity contrast of phosphate and dolomite. Phosphorite or sedimentary phosphate deposit is a sedimentary rock which is constituted varieties of phosphate minerals such as apatite, fluroapatite, etc. [3]. In phosphorite, fluorine in phosphate minerals are often replaced by hydroxyl, chlorine irons [3]. On the other hand, host rock or associated rock of phosphorite is primarily dolomite. Dolomite is sedimentary rock primarily constituted with different carbonate minerals like dolomite (predominant), calcite, quartz, etc. Main constituent minerals of phosphorite (i.e., fluroapatite) and its host rock (predominantly dolomite) have their diagnostic emissivity features within the spectral domain of 8.3 to 11.25 micrometers [3,4]. The study is relevant for the exploration of Paleoproterozoic phosphorite. The phosphorites of Paleoproterozoic age are primarily hosted by dolomite, dolomitic limestone, and associated carbonate rocks in different parts of the world, for example, the Irece Basin (eastern-central Brazil), Simian series of rocks (central Gujhao, China), and Heerapur (Madhya Pradesh, India) [5,6]. These phosphorites occur as bands, patches of different size within the dolomite. These patches could be resolvable in the thermal images using the emissivity spectra of phosphate minerals. Emissivity spectra of the target are the result of atomic and molecular vibration. Vibrational spectroscopy in the thermal infrared (TIR) domain is sensitive to the molecular structure and chemical composition of minerals [7]. All rock-forming minerals display spectral signatures in their emissivity spectra due to the different vibrational modes resulting from the stretching and bending vibrations of bonds in their crystal lattices [7,8]. Most importantly, fundamental vibrational absorptions of geologic materials occur within the spectral range of 3 to 50µm [7,8]. However, the records of mapping geological material using thermal spectra were limited to quartz-rich igneous intrusive rocks, other silicate mineral-dominant rock types and metasedimentary rock units [9,10,11,12,13,14]. Records are also limited on the use of broadband thermal spectroscopy to study economically important rocks, like phosphorite.
At present, no spaceborne thermal sensor is operative which can collect emissivity spectra with a fine spectral resolution (for example, with a spectral resolution of 10 to 30 nm). However, the spectral domain of 8.0 to 11.5 µm is being used for space-based broadband thermal spectroscopy as it is within the atmospheric window and suitable for detecting various silicate minerals [9,10,11,12,14]. In the present context, five thermal spectral bands of the Advanced Spaceborne Thermal Emission and Reflection Radiometer (ASTER) sensor operative within the spectral domain of 8.125 to 11.625 µm [15,16] are suitable for carrying out the study of phosphorite mapping using thermal bands as different geological targets can be targeted using quantitative mineralogical parameter such as emissivity [17,18]. ASTER was launched with the Terra satellite in 1999 and gained popularity as spectral bands of ASTER are capable for detecting spectrally sensitive minerals like calcite, different clay minerals, mica, etc. [15,16]. This popularity is especially true for bands in the shortwave infrared (SWIR) spectral domain and TIR spectral domain [19,20,21,22,23,24]. ASTER TIR bands have also been widely used for delineating feldspar-rich intrusive, e.g., albite granitoids, alkali granite, and different granitoid systems, and also for delineating mafic igneous complexes from their silicic counterparts in geological mapping [10,11,25,26,27,28,29]. However, the spectral dimensionality of ASTER TIR bands is an issue as these bands are also known to display striping noise and a poor signal to noise ratio (SNR) [28]. Furthermore, the spatial resolutions of spaceborne thermal sensors are coarse (ASTER has 90-meter spatial resolution for its TIR bands). Therefore, the scene within the pixels of spaceborne thermal sensors is also heterogeneous. This heterogeneity hinders the detailed characterization of the target using its emissivity spectrum as the emissivity of a pixel (which is containing different target) is often different to that of the target unless the pure target occupies a considerable portion of the pixel.
There has been an attempt to delineate phosphorite from dolomite using the contrast of their reflectance spectra [30]. This spectral contrast in the visible near infrared (VNIR) and SWIR domain is due to the presence of a secondary vibrational feature (overtone and combination) of carbonate mineral in dolomite and absence of such feature in the phosphorite [31,32]. Therefore, the detection of phosphorite in the VNIR-SWIR domain is an indirect approach. On the other hand, the TIR domain is characterized by the doublet vibrational feature of phosphate-bearing mineral (i.e., fluroapatite) of phosphorite [2]. There are no records on the use of emissivity spectroscopy to delineate carbonate and phosphate and corresponding upscaling to the broadband emissivity of ASTER bands. Here, attempt has been made to derive an image enhanced product to delineate phosphorite and also use the same product as the proxy to find the relative grade variation in phosphorite under specific condition. Therefore, an approach is proposed for targeting Palaeoproterozoic phosphorite based on the spectral contrast of phosphorite and the host rock dolomite in the TIR bands of ASTER. The potential of broadband emissivity feature as a proxy to process the ASTER TIR bands to delineate low and high-grade phosphorite from the host dolomite rock has been analyzed in this study. In this regard, we studied the emissivity contrast of dolomite and phosphorite in their laboratory spectra and also in ASTER TIR sensor resampled counterparts. Further, we compared the image-based emissivity spectra of phosphorite pixels with their corresponding ASTER resampled laboratory spectra to ensure that the spectral features of phosphorite have been translated from ASTER resampled laboratory spectra to their image spectra. After confirming the translation, the relative spectral emissivity bands of ASTER (derived from ASTER level 1B data) were processed to derive an appropriate index image to delineate phosphorite. Potential of the relative emissivity extraction method in preserving the shape of the emissivity spectra of minerals and rocks, provides the scope of deriving a simple and reproducible method to delineate phosphorite using their broadband emissivity spectra [12,33,34,35].

2. Study Area and Geology

The study area is located 18 km southeast of Udaipur, one of the major towns of Rajasthan, the largest state of India (Figure 1).
In the study area, phosphorite is associated with carbonate-rich sediments of the Aravalli Super Group [36]. A geological map of the study area is presented in Figure 2. Although the grade of the regional metamorphism is low for these sediments (metamorphosed under green-schist facies), at places, higher grade metamorphism is also reported [37]. The distribution of different depositional facies, particularly dolomite with stromatolitic phosphorite, is controlled by paleo sea floor topography suggesting the presence of an epicontinental sea during the deposition of phosphorites [36]. It has also been suggested that the deposition of phosphorite and dolomite were triggered in the Paleoproterozoic period after the ephemeral relief in the platform part of the paleo sea was obliterated by intense weathering [37,38]. Dolomitic marble, dolomite, stromatolitic limestone, cherty quartzite phyllite, and quartzite are the major sedimentary rock units of the Aravalli Group while metavolcanics are intermittent volcanic units of a volcano-sedimentary sequence of the lower Proterozoic period in the study area. Granite gneiss, amphibolites, migmatites, etc. are part of the basement rock above which Aravalli sediments were deposited (Figure 2).

3. Materials and Methods

3.1. Materials

3.1.1. Rock Samples

In the study area, we have identified two major types of phosphorite: one type is low-grade phosphorite with P2O5 content 10–15% and another variant is high-grade Stromatolite bearing phosphorite with P2O5 content 28–30%. Low-grade phosphorite is massive and rich in dolomite mineral with fluroapatite. High-grade phosphorite is stromatolitic, easily weathered, and constituted with primarily fluroapatite. In these stromatolitic phosphorites, we either have both dolomite and fluroapatite as dominant minerals, or it is predominantly constituted with fluroapatite. Mode of occurrence of the samples in the field (dolomite, low-grade, and high-grade phosphorite) is shown in Figure 3. The dolomite and associated phosphorites are exposed on the denudational hills and pediment surface. Samples are collected from the surface exposures of these geomorphic units for the spectral analysis. Initially, large samples were broken from the surface exposures of rocks. Each representative sample was broken into few fragments. One sample fragment was used for spectral analysis, and other two fragments were used for X-Ray diffraction (XRD) and X-Ray fluorescence (XRF) analysis, respectively.

3.1.2. ASTER Data

ASTER has nine bands in the VNIR and SWIR spectral domain and five bands in the TIR domain [15,16,39,40] (Table 1). The TIR subsystem of the ASTER sensor operates within the spectral domain of 8.125 to 11.65 µm and is characterized by five spectral bands. These channels collect spectral data using a single telescope with a spatial resolution of 90 m. It has a “whiskbroom” scanning mirror [40]. Each band uses ten mercury–cadmium–telluride detectors that are cooled to 80 K using a mechanical split Sterling cycle [40]. We have used ASTER Level 1B data for the spatial mapping of phosphorite rich zones within the study area. The reason for selection of ASTER Level 1B data was guided by the previous study results obtained by different researchers using the same type of dataset (ASTER Level 1B) on the derivation of the mineralogically sensitive geological index [11,12,25]. Use of Level 1B data would also help in reducing the uncertainties resulted from the implementation of atmospheric correction algorithms on the radiance data [10,11]. Further, we assumed that the role of the atmosphere would be minimal in the recorded radiance of the thermal multispectral sensor, which has its spectral bands in atmospheric window of TIR domain. Further, records are available on the derivation of relative emissivity from Level 1B data of ASTER TIR bands [33,34] Emissivity normalization is one of such proven method which is known to be effective in deriving the shape of emissivity spectra [41,42].

3.1.3. Spectral Data

Emissivity spectra of representative samples of dolomite and major variants of phosphorite were collected in the laboratory. We have collected thermal emissivity spectra within the spectral domain of 8 to 12 µm using a portable Fourier-transformed (FT)-infrared (IR) spectrometer manufactured by D&P Instruments, United States of America [43]. The spectrometer has a functional spectral range of 2 to 16 micrometers. However, we have not processed and analyzed the emissivity spectra of the rock samples for the spectral domain of 2 to 8 µm as this domain is beyond the spectral range of ASTER TIR bands. The spectral resolution of the spectrometer is 4 cm−1 wave number within the spectral range of 8.125 to 11.67µm (i.e., the spectral range of ASTER). The spectrometer is composed of a nitrogen-cooled indium–gallium arsenide/mercury cadmium telluride detector [40] and worked on the principle of Fourier-transform [44]. Therefore, it can collect spectral data for very large wavelength domains.

3.1.4. Mineralogical and Chemical Data

XRD data of representative samples of phosphorites are used to estimate the minerals present in the samples to understand how mineralogy (i.e., dominant constituent minerals) contributes to shaping the Emissivity spectra of phosphorite samples. We used a specialized diffractometer system (6E-XRD 3003 TT automated system) to carry out diffraction studies of the powdered samples (200 mesh size) using the characteristic CuK(α) radiation (crystal monochromated).
A wavelength dispersive XRF instrument (MagiX Pro PW 244-PANalytical model) was used to estimate the major oxides with the primary emphasis on understanding the variation of P2O5 content in the phosphorite samples. Sample preparation method followed for collecting XRD and XRF data is similar to the method; which has been discussed in the literature [30].

3.2. Methods

3.2.1. Spectral Data Collection and Analysis

We have collected representative samples of dolomite and major variants of phosphorite samples from the study area. These samples were cut into rectangular blocks of 4-inch x 5-inch size to 5-inch x 6-inch size range. Samples were placed under the optics of the spectrometer and viewed with the optics to ensure that the emittance of the samples was collected from the sample surface only. Emissivity spectra of representative samples of phosphorite and host rock were derived from the collected emitted radiance of the sample and black body in the laboratory using an FTIR spectrometer (Figure 4). An emissivity spectrum is a plot of emissivity as a function of wavelength. Here, emissivity is derived by estimating the ratio of the emitted radiance of the sample to the emitted radiance of a blackbody at a specified temperature. We collected the emitted radiance of the sample after elevating its temperature using a heater to ensure that the emissivity spectra are collected with a high signal to noise ratio (SNR). We also maintained the isothermal condition during the measurement of emitted radiance by keeping the sample above a low conductive unit so that it would not conduct its accumulated heat fast. Before measuring the emitted radiance of the sample, we calibrated the instrument by measuring the emitted radiance of a blackbody at two different temperatures. One measurement was taken at 10 °C (lower than ambient temperature), and another was taken a few degrees centigrade higher than the temperature of the hot sample [44]. Measured emitted radiance of a black body at two different temperatures (one higher than the sample temperature and the other lower than the sample temperature) was helpful to estimate the emitted radiance of a blackbody at the same temperature with that of the sample [44]. Black body emitted radiance was used to normalize the emitted radiance of the sample to derive the emissivity of the sample temperature. The instrument performs satisfactorily within the temperature range of 5° to 40° centigrade [43].
While collecting emissivity spectra, blackbody temperature is regulated using electrostatic heating [44]. The facility to perform electrostatic heating is in-built in the spectrometer. We used a gold plate having a low emissivity (0.2) to measure the contribution of downwelling radiance [44]. Downwelling radiance is subtracted from the emitted radiance of the sample and blackbody before their respective emittance/emitted radiance values are used to derive emissivity. The conceptual framework and methodology to collect emissivity spectra have been discussed in the literature [44,45].
In this study, the emissivity spectra of different grades of phosphorite (broadly two grades: 10–15% and 38–40% P2O5 content) were compared with the emissivity spectrum of dolomite (Figure 4). Higher-grade phosphorites are represented by two specific types: one is dolomite-bearing phosphorite and the other is stromatolite without the presence of dolomite as a constituent mineral. We compared spectral contrast of major targets (different phosphorite and dolomite) and also analyzed the spectral contrast of different samples of each variant of phosphorite and dolomite to understand the inter-rock and intrarock variation of the emissivity spectra (Figure 4 and Figure 5). Further, the emissivity spectra of specified grade phosphorite samples and host rock were compared with the emissivity spectra of respective dominant constituent minerals to understand how mineralogy influences the emittance spectra of rocks [45,46] (Figure 6). Laboratory emissivity spectra of rock samples were also resampled to the ASTER bandwidth to understand how spectral contrast of dolomite and host rock was translated from sample to ASTER bandwidth (Figure 7). An attempt was also made to understand how spectral contrast between dolomite and phosphorite would be gradually reduced if the spectra of both the end members are linearly mixed within a pixel of ASTER TIR sensor, which is of 90-m size (Figure 8). In order to derive spectra of pixels mixed with dolomite and phosphorite in different proportion, we added their respective pure spectra with different weights. Weights are assigned based on the assumption that spatial extent (in terms of fraction) of the pixel is occupied by only these two targets (i.e., dolomite and phosphorite) in different fractions. This was required to understand the role of other factors such as intrapixel mixing in reducing the spectral contrast of dolomite and phosphorite except for the grade (i.e., P2O5) of phosphorite. Detailed results related to the analysis of spectral data are discussed in the results section.
We also compared the shape of the broadband emissivity spectrum of phosphorite of ASTER pixel with the ASTER resampled counterpart (Figure 9). This was required to confirm the fact that image-based emissivity spectra of phosphorite could preserve the broadband emissivity feature of the phosphorite that has been observed in the ASTER resampled laboratory spectra. Image-based emissivity spectra were collected from a few regions of interests (ROI) distributed above the known phosphorite exposures around Jhamar\Kotra and Sameta areas. This has made the basis for ASTER TIR image processing for delineating phosphorite within its host rock.

3.2.2. Mineralogical and Chemical Analysis

Original representative samples of phosphorite and dolomite were broken into three pieces to carry out mineralogical and elemental analysis along with the analysis of emissivity spectra. One piece of the sample of each type of rock was used for the collection and analysis of emissivity spectra. The other two pieces of the same sample were used for XRF and XRD analysis respectively. A wavelength dispersive XRF instrument was used to estimate the dominant oxides. Representative samples of phosphorite and dolomite were pulverized and consequently sieved using 200-mesh sizes for XRF samples. The results of XRF analysis are given in Table 2. In this study, P2O5 content is only used to relate this chemical data with the depth of the broadband diagnostic emissivity feature of different phosphorite samples.
We used the diffractometer system (6E-XRD 3003 TT automated system) to utilize the CuK(α) radiation (crystal monochromated) for X-ray diffraction studies of the powdered samples (200 mesh size). Before performing XRD measurements, phosphorite rock samples were pulverized and consequently sieved using 80-mesh sieves. After obtaining the desired grain size, we separated the lighter mineral phases (e.g., phosphate and dolomite) from the heavier mineral fractions using methylene iodide solution. We have separately analyzed powdered fractions of dolomite and apatite minerals using the diffractometer to avoid the overlapping of peaks of different mineral phases in the diffractograms of the samples. Predominant minerals (i.e., fluorapatite, dolomite, and quartz) were only identified using XRD analysis based on their peaks at a specified incident angle (Figure 4). The mineralogy of samples with their relative abundance derived from XRD study was used as a reference to analyze the emissivity spectra of rocks.

3.2.3. ASTER Data Analysis and Field Validation

We analyzed ASTER Level 1B “at sensor radiance” data with reference to the geological map of the study area. Paleoproterozoic phosphorites are primarily associated with dolomite or other carbonate rocks. Therefore, we processed the ASTER data for a portion of the study area; which was covering the spatial extent of the host rock—dolomite. In this regard, we used the lithological boundary of dolomite as delineated in the geological map of the Geological Survey of India to spatially subset the ASTER TIR image. The spatial subsetting of the ASTER image is useful in reducing the number of targets to be delineated in ASTER thermal bands. This may enhance the mapping accuracy (as number of unknown to be detected will be few) as ASTER TIR bands are known for poor intrinsic dimensionality due to the presence of striping noise and the poor signal received at band 14 of the sensor [28,29].
Based on the broadband emissivity features of phosphorite, we prepared image composite using three radiance bands after attempting decorrelation stretching (Figure 10). We derived the radiance image composite after extracting the desired portion from the ASTER scene using the lithological outline of dolomite as “region of interest” (Figure 11). Further, we enhanced the separability of surface exposures of phosphorite rich zones from host rock by deriving the emissivity image composite. In this regard, we derived emissivity using the “emissivity normalization” method. The image-based emissivity product derived using the above method is known for preserving the overall shape of emissivity spectra and the wavelength of diagnostic emissivity features of the target [33,34,42]. In this method, temperature values of the pixels were derived for each spectral band using a fixed emissivity value (0.96) [42]. Consequently, we derived spectral emissivity for each pixel using the highest temperature value of each pixel (i.e., from the set of different temperature values in different bands) derived using fixed emissivity in the first instance. Before deriving relative emissivity from the ASTER thermal radiance bands, we implemented “in-scene atmospheric correction” on ASTER radiance bands based on the assumption that atmosphere remained uniform over the scene and a black body is present in the scene [47]. In this method, we also assumed that the atmosphere is single layered and downwelling component of atmosphere is absent. Atmosphere calibration is made based on deriving gain and offset by regressing measured and theoretical radiance of blackbody at specified wavelength. In the scene, pixels which record highest temperature are assumed as the mathematical approximation of black body [47]. After calibrating the scene using thermal atmospheric correction, emissivity normalization method was implemented. For delineating phosphorite, we also used three emittance bands to derive decorrelation stretched emissivity composite image to delineate phosphorite within dolomite (Figure 12).
Further, a relative band depth (RBD) image was derived using emissivities of bands 11, 12, and 13 (derived using the emissivity normalization method) to enhance the strong emissivity minima on emissivity spectra of phosphorite (Figure 12). This RBD image was derived as per the contrast observed in the ASTER resampled laboratory emissivity spectra of dolomite and phosphorite and their mixed variants (Figure 8 and Figure 9). We derived a relative band depth (RBD) image to delineate rock phosphate using a single band product. Finally, we validated the TIR image enhanced products (RBD image and emissivity image composite) by visiting the field locations of phosphorite pixels and confirming the presence of phosphorite based on rapid colorimetric analysis of samples collected from the rock exposures (small rectangles) (Figure 13). In this regard, the pulverized rock samples (rock samples were broken and manually pulverized) were mixed with an acidic ammonium molybdate solution to rapidly identify the presence of phosphate in the sample.

4. Results and Discussion

We analyzed the emissivity spectra of representative samples of different rocks to understand inter-rock emissivity variation (Figure 4) of phosphorite and dolomite. We also analyzed the contrast in the emissivity spectra of different samples of same rock type (Figure 5). We found emissivity spectra of different samples of the same rock were similar to each other and overlapping one over the other. Therefore, emissivity spectra of different samples of same rock were stacked and plotted (Figure 5a–c). It is quite evident that the emissivity contrast of different samples of same rock would be indistinguishable when we would analyze their ASTER resampled counterpart or their image spectra as the broad emissivity spectra would be further more generalized. Therefore, we concentrated our study to identify the inter-sample emissivity contrast in this study and used the inter-rock emissivity variation as a reference for processing ASTER TIR bands. In the study area, we found one low-grade and two high-grade variants of phosphorite. Details of these samples were discussed in the Section 3.1. We further analyzed the mineralogical significance of emissivity spectra (and related contrast) of dolomite and phosphorites using the XRD data of these samples as the reference (Table 2). Analysis of Emissivity spectra is the basis for processing of the ASTER data. Therefore, we analyzed the emissivity spectra of low-grade and high-grade phosphorite and host rock with reference to the emissivity spectra of their constituent minerals (Figure 6). While analyzing the emissivity spectra of these samples, it was observed that phosphorite had a strong doublet with minimal at 9 µm and 9.5 µm, while emissivity spectrum of dolomite sample was characterized with emissivity minima at 11.2 µm [2] (Figure 4 and Figure 6a). Similar to dolomite, a diagnostic emissivity minima (i.e., at 11.2 µm) was also observed in the low-grade phosphorite (i.e., P1), but the same feature is obscured in the emissivity spectra of dolomite depleted, high to moderate grade phosphorite samples (P11) (Figure 4 and Figure 6a–c). We, however, could identify the same feature in the emissivity spectra of dolomite-bearing high-grade phosphorite (Figure 6d). The fundamental vibration of carbonate bonds governs the emissivity minima at 11.2 µm [48]. In contrast, the emissivity doublet of phosphorite is absent in the emissivity spectra of dolomite samples (sample P6) (Figure 4), and subdued emissivity minima are identified in the dolomite emissivity spectrum (Figure 6a). The above details on the spectral contrast of dolomite and phosphorite are subdued in the ASTER resampled emissivity spectra of these samples (Figure 8).
However, we observed that the ASTER resampled emissivity spectra of phosphorite samples had the stronger depth of emissivity minima with respect to the dolomite emissivity feature at 9.2 µm (Figure 7). Depth of the emissivity feature of high-grade variant was more than the low-grade variant of phosphorite.
It is known that the emissivity minima of emissivity spectra of rocks and constituent minerals can be studied to estimate relative grade or compositional variation based on the assumption that the grain size has a negligible influence on the quantitative parameters (i.e., depth and width) of emissivity features [48,49]. In the study, this assumption may be true as dolomite, and different phosphorites had similar grain size. This provided us a scope to relate emissivity minima with the grade or P2O5 content. We found that the depth of broadband emissivity minima of phosphorite correlates broadly with two phosphorite grade or variants present in the study area (Figure 8 and Table 2). This assumption is made based on the observation that high-grade phosphorite (high P2O5 content) has a larger depth of its diagnostic emissivity feature with respect to lower grade phosphorite. However, in addition to grade, the spectral purity of the pixels of the ASTER image may also influences the depth of emissivity minima. The depth of the broad emissivity feature gradually reduces (i.e., the depth will be reduced) if the dolomite is linearly mixed with different proportions of phosphorite within the spatial extent of the large pixels of the ASTER bands. The role of intrapixel mixing in reducing the depth of emissivity feature has been analyzed based on deriving mixed pixel spectra by linearly combining ASTER resampled emissivity spectra of dolomite and phosphorite (high-grade variants) with different weights (proportional to their respective spatial abundance in the pixel) (Figure 8). We found that the depth of the emissivity feature of phosphorite would be gradually reduced with the decrease in the relative spatial abundance of phosphorite within the pixel. Therefore, delineation of phosphorite within the dolomite would be difficult if the patchy or very small phosphorite exposures are mixed with the exposure of dolomite occupying the major portion of the pixel. However, broadband emissivity minima of phosphorite can be used to derive ASTER based image products to delineate large exposures of phosphorite and also can be used to relatively delineate the grade of phosphorite exposures from the low-grade variants provided the exposures are of larger size.
Further, we also confirmed that the shape of the image spectra of phosphorite pixels was comparable with the ASTER resampled laboratory counterpart of emissivity spectrum of phosphorite. This was ascertained by cross-comparing the spectra of phosphate mines at selected places with the ASTER resampled emissivity spectrum of high-grade phosphorite (Figure 9). The comparative assessment of image spectra of phosphorite with respect to ASTER resampled laboratory counterpart is essential to ascertain the spectral consistency of target from ground to sensor.
Consequently, we processed the ASTER TIR bands based on the analysis of the emittance spectra of dolomite and the two major variants of phosphorite, as discussed in the previous section. ASTER data were further processed for the portions covering the spatial extent of host rock dolomite as the main or large exposures of phosphorite occur within dolomite/dolomitic marble. We prepared the ASTER radiance image composite using selected radiance bands after attempting the decorrelation stretching. In the radiance-composite image of ASTER TIR bands (prepared using bands 11–13) we could not delineate phosphorite exposures effectively (except some patches on Jhamarkotra mine (Figure 10). Consequently, we prepared an emissivity composite to delineate large surface exposures of phosphorite using the emissivities of bands 11–13. In this image product, phosphorite exposures were enhanced with pinkish-red color (Figure 11). We also derived a relative band depth (RBD) image (Figure 12) using the emissivity patterns defining the shoulders (bands 11 and 13) and absorption minima (band 12) of the broadband emissivity feature of phosphorite (Figure 7). A higher value of this RBD image was indicative of progressive phosphorite enrichment within the dolomite as the depth of the emissivity feature was broadly related to the phosphate grade (i.e., higher grade phosphorite had a larger depth than the lower grade variant), provided the phosphorite exposures were large (Figure 7, Figure 8 and Figure 12). In this colour density sliced RBD image, “red colored” pixels were indicative of high-grade phosphorite while yellow colored pixels were indicative of low-grade phosphorite. Blue pixels indicated the presence of dolomite.
We carried out field validation to clarify the results of RBD images at the selected sites. We collected rock samples from the exposures identified with red or yellow pixels in the RBD image. Most of the areas are phosphate bearing. Phosphorite-bearing rock powders were found to have changed color from colorless to yellow as ammonium molybdate reacts with phosphate to precipitate “yellow colored” ammonium phosphate [50].
In this regard, we identified phosphorite within dolomite by injecting acidic ammonium molybdate solution in the pulverized sample of rock collected from the rock exposure at the west of Kharwarja. The RBD image shows an intermediate value with yellow color at this site (shown with rectangle). The phosphorite is associated with the dolomite, and the reported grade was low [37] (Figure 13a,c). We could also identify the presence of stromatolitic phosphorite at a site occurring at the south of Kharwarja, The site had relative high value in RBD image as it was above the red pixels of RBD image (Figure 13a,d). Stromatolitic phosphorites are high-grade phosphorite in the study area [37]. Similarly, stromatolitic phosphorite was also identified in a site situated to the north of Sameta (Figure 13b,e). We showed the field location of this site with a small rectangle on the RBD image and site was above the high-value pixels (i.e., it is red colored) of RBD image.
The proposed method of phosphorite mapping using TIR bands would be applicable for any Proterozoic dolomite hosted phosphorite deposit in any part of the world. The proposed RBD image can also be used to identify the relative grade variations in the phosphorite exposures provided the exposures are large enough to make band depth values of RBD image invariant to the modifications; which could be due to intrapixel mixing and the mapping was attempted within the spatial extent of host rock of phosphorite. The proposed method is rapid and can be used to identify areas with high phosphorite content for the detailed exploration of rock-phosphate. Index-based delineation of phosphorite using ASTER TIR bands is guided by characteristic absorption feature of phosphorite. Therefore, index images derived from ASTER relative emissivity bands would not only help in the delineation of phosphorite, but also would help in relatively estimating grade of phosphorite with large and homogeneous surface exposures. Similar grade estimation may not be possible in VNIR-SWIR spectral domain as grade sensitive spectral feature is absent in the VNIR-SWIR domain. However, small patchy exposures of phosphorite which can be detected using spectral contrast of dolomite and phosphorite in ASTER SWIR band product based on the implementation of subpixel mapping approach can be subdued in the TIR band based product proposed for phosphorite [30].This is due to intratarget spectral mixing of dolomite and small patchy exposure of phosphorite, which would hinder the detection of small exposures in broadband, coarse resolution thermal bands of ASTER. However, the proposed approach of TIR band based mapping of phosphorite can be supplemented with a geophysical survey like caliper logging or gammy ray logging (phosphate is often associated with radioactive minerals) for the detailed exploration of identified anomaly [51].

5. Conclusions

Based on the methodology adopted and the results obtained, the following conclusions are derived from the present study.
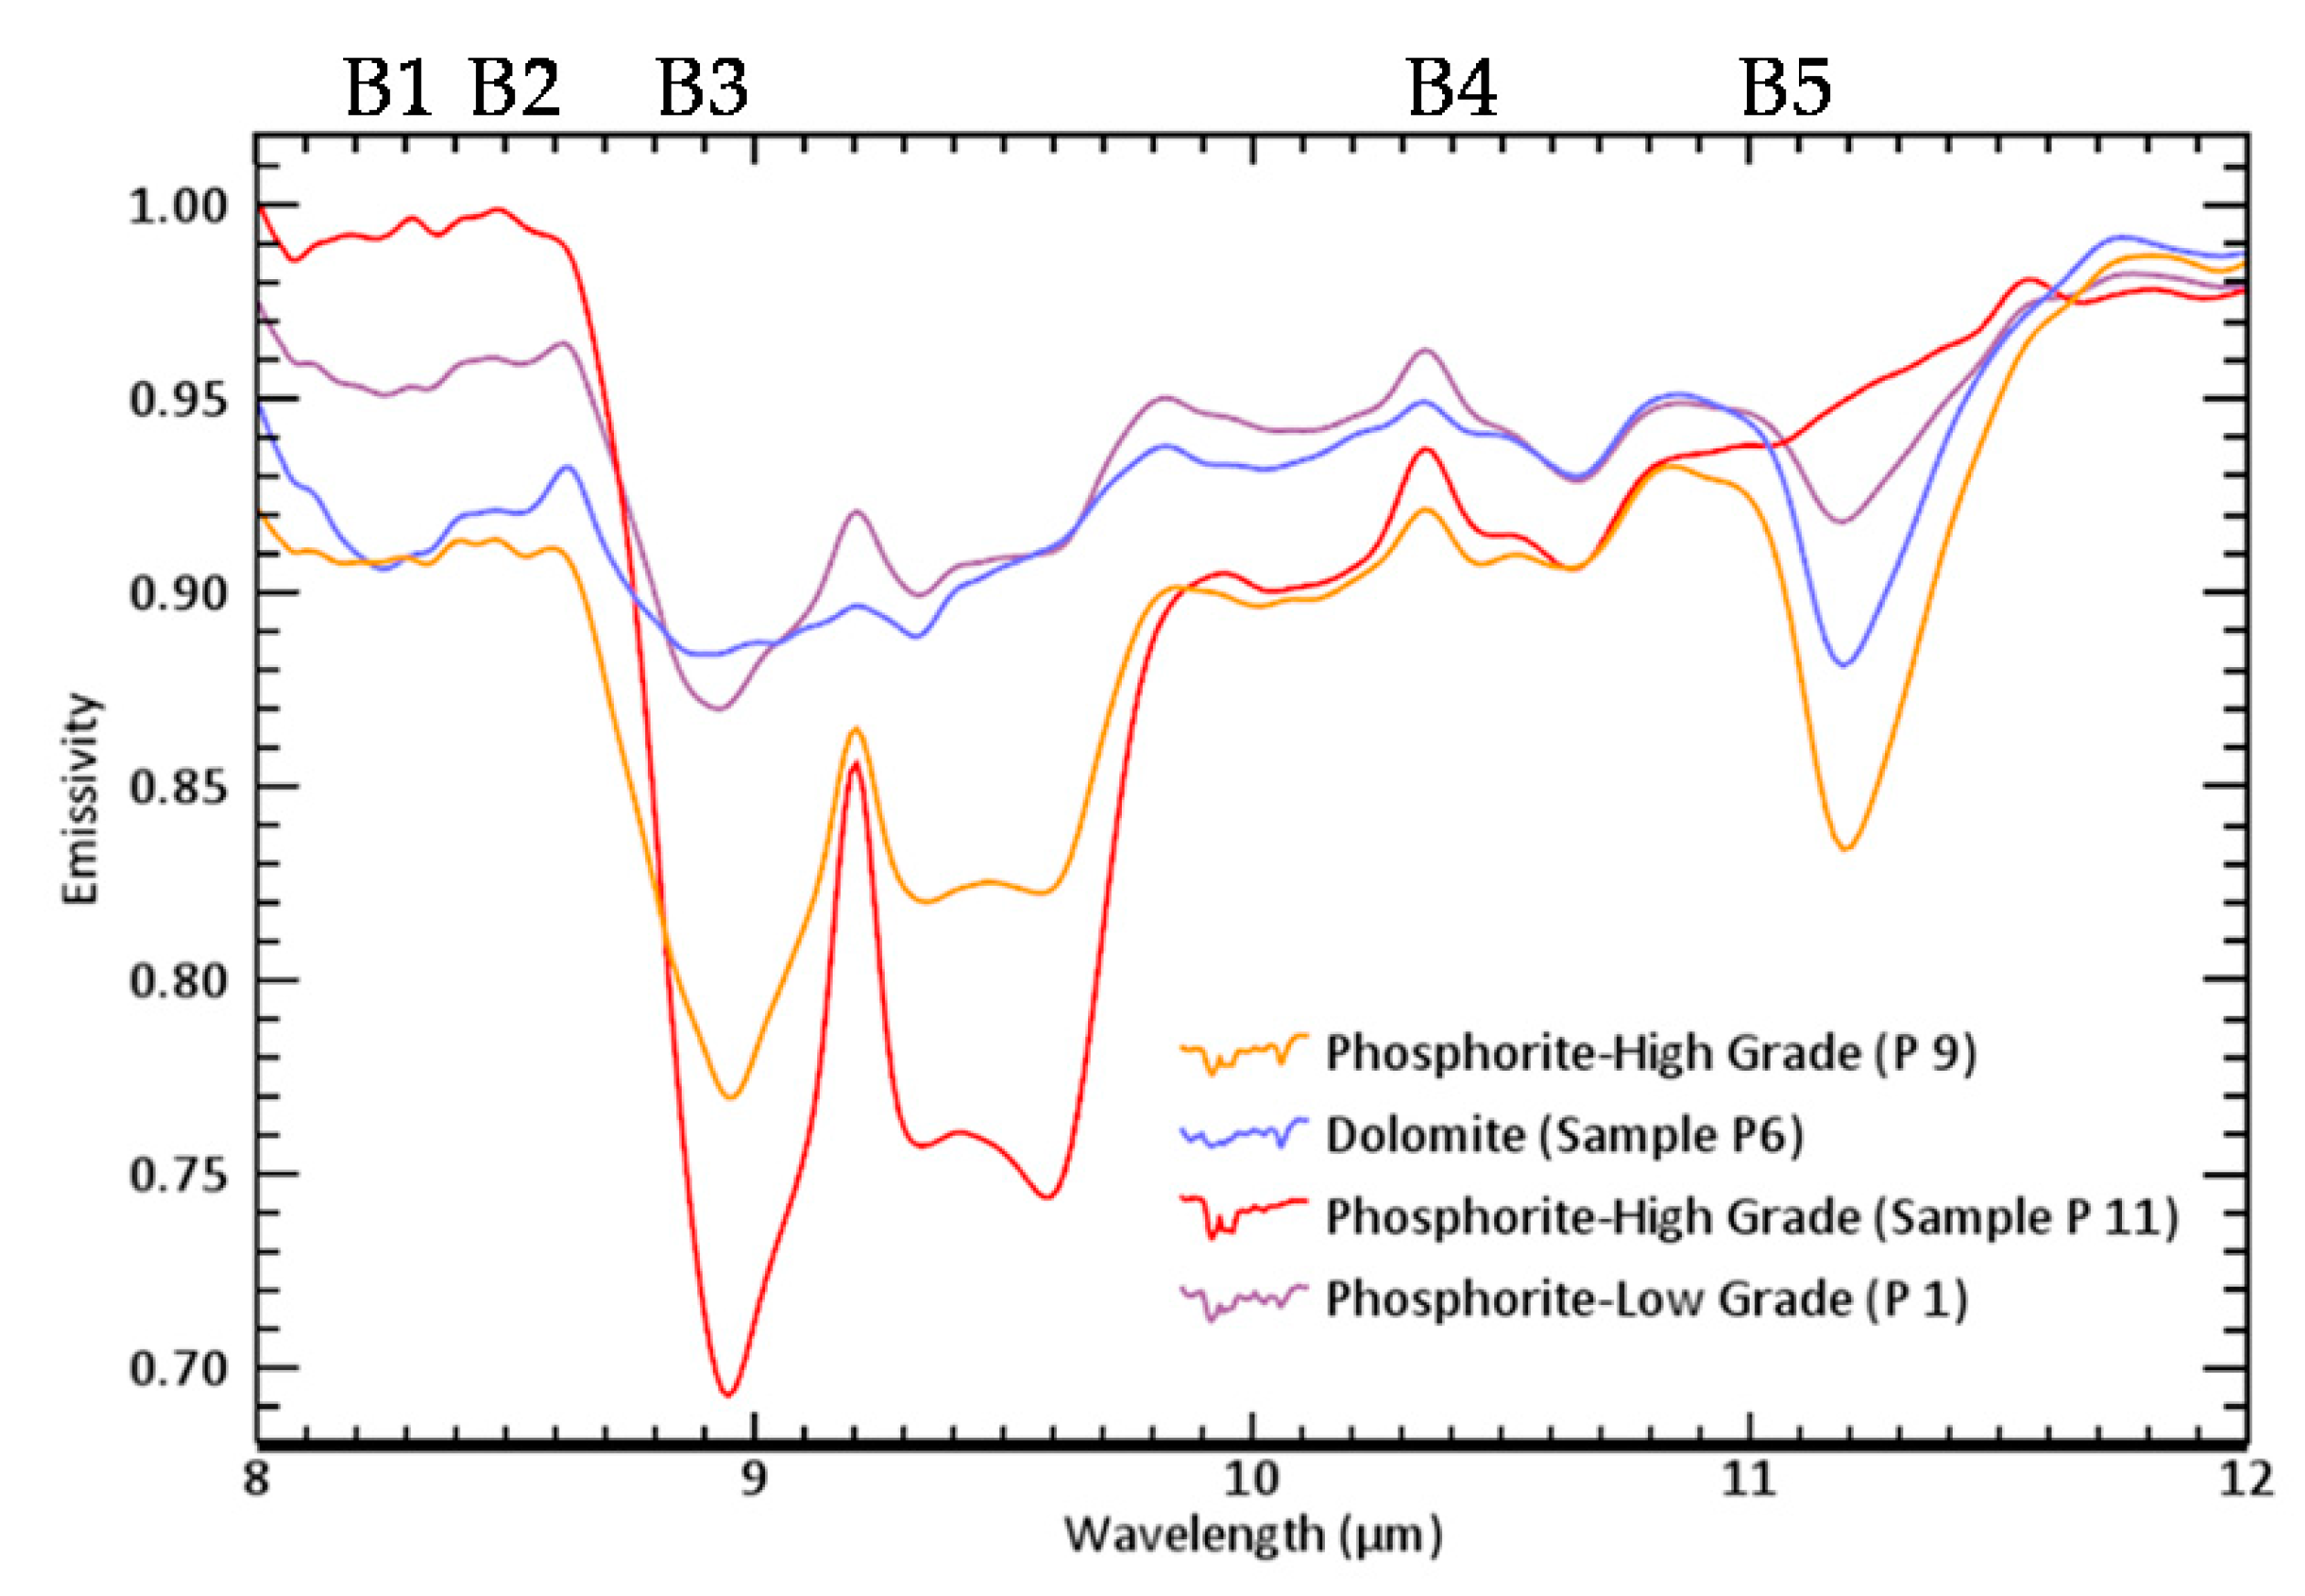
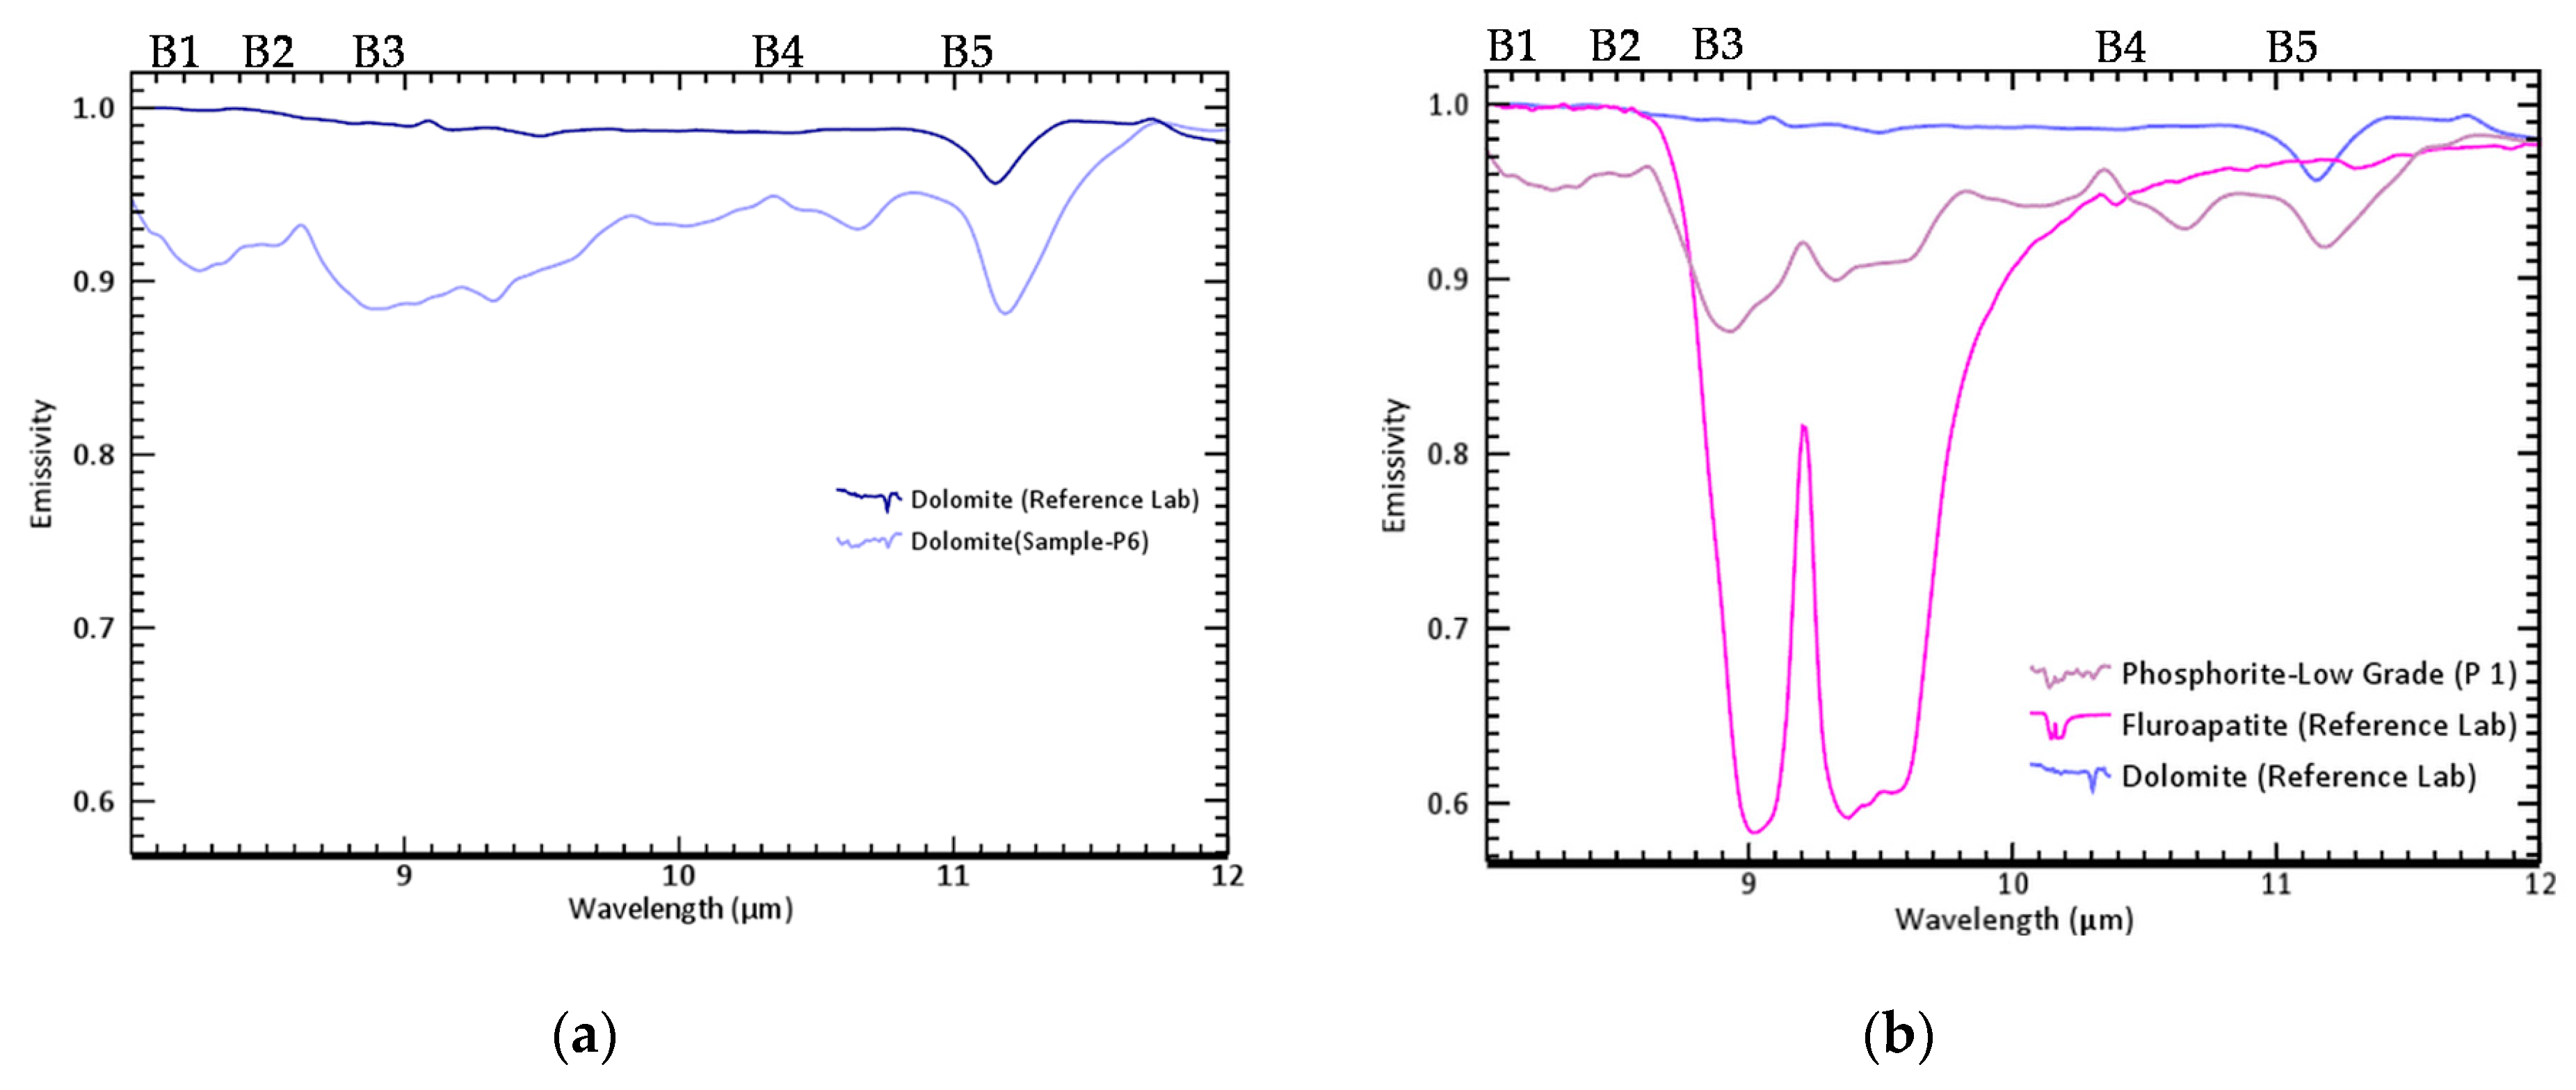
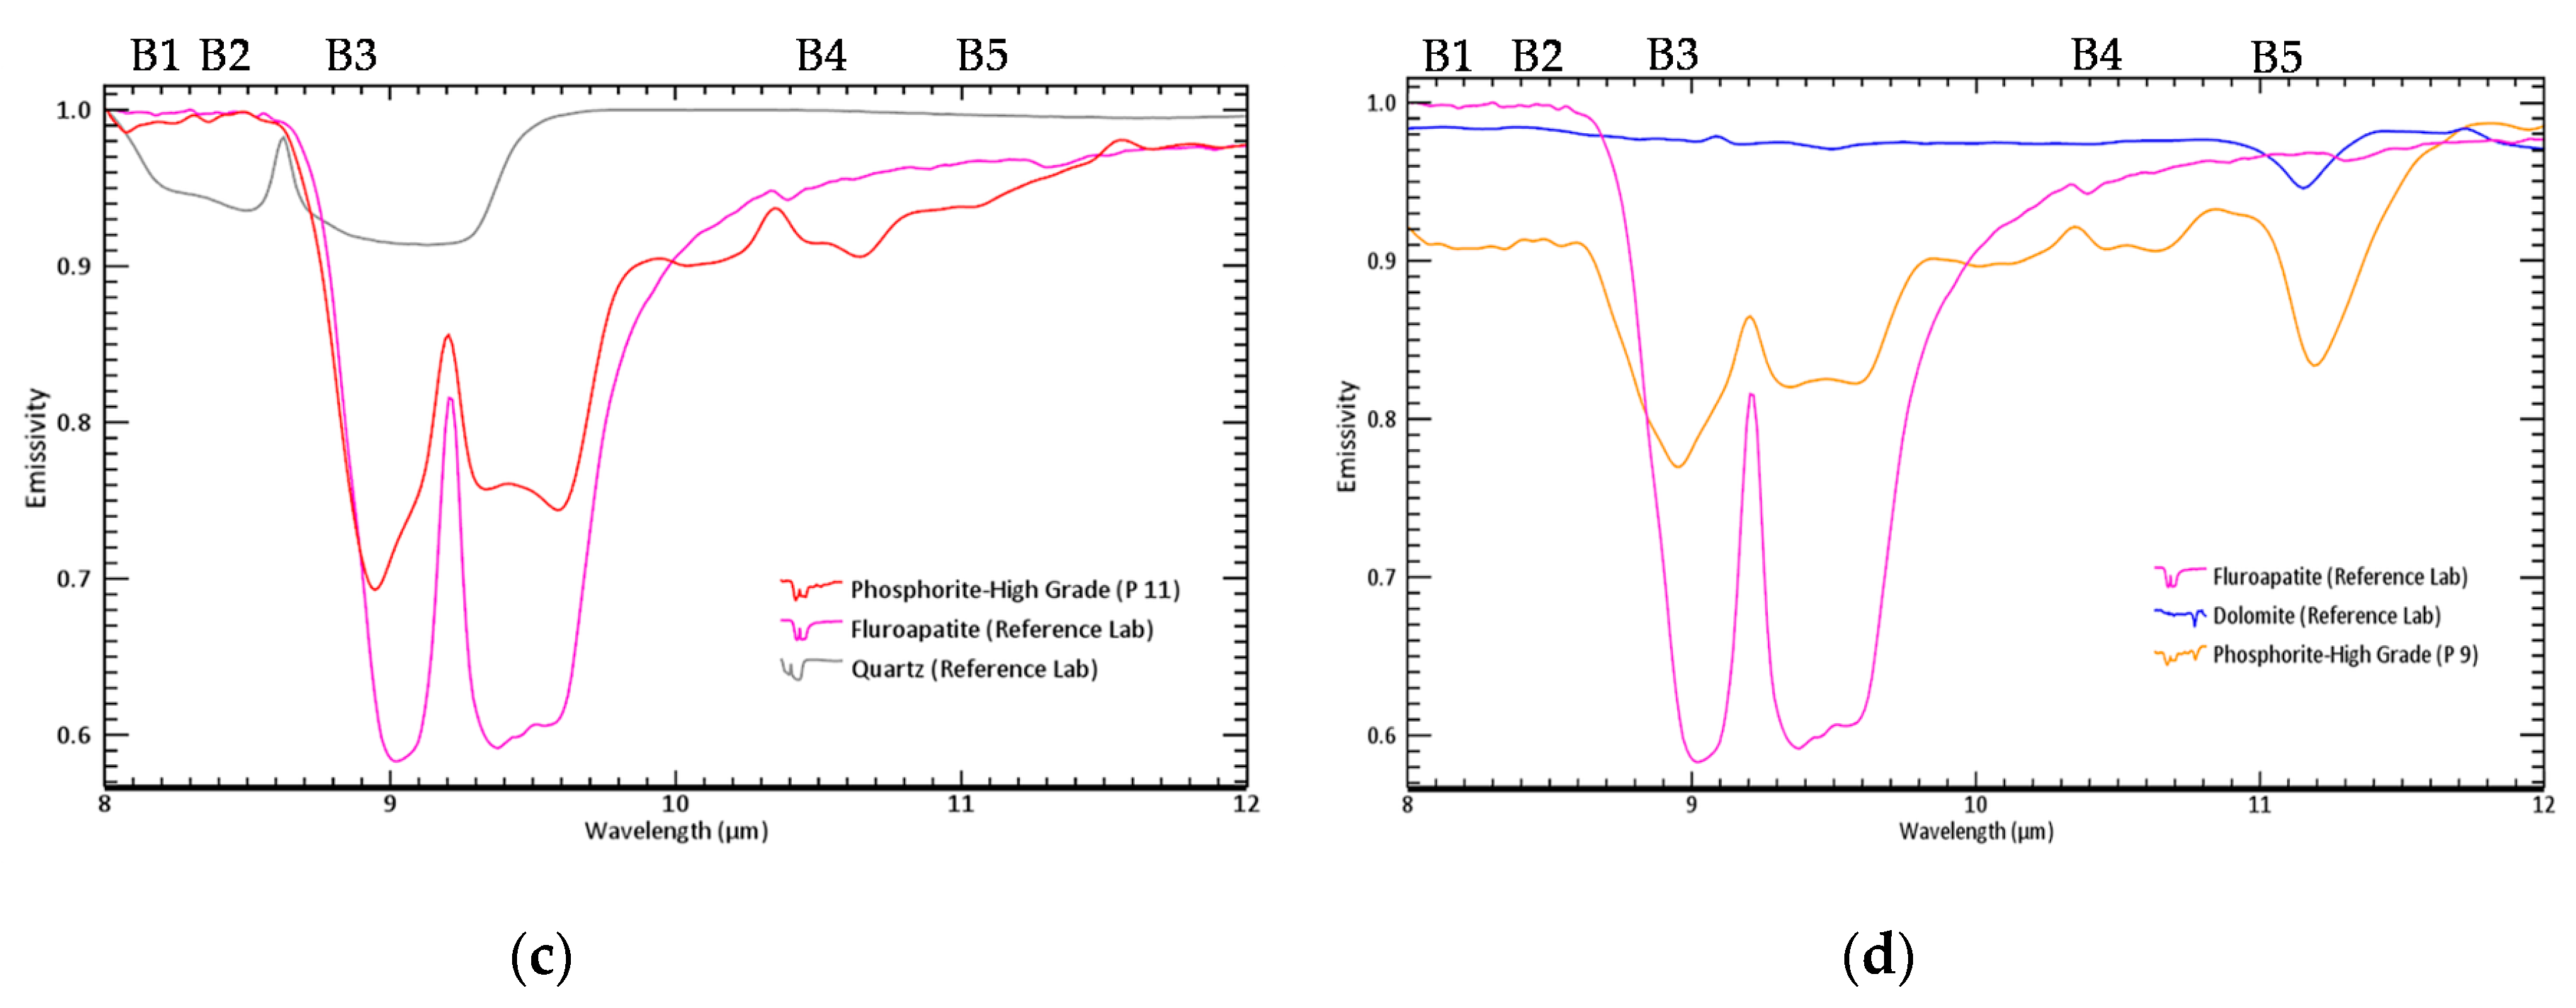
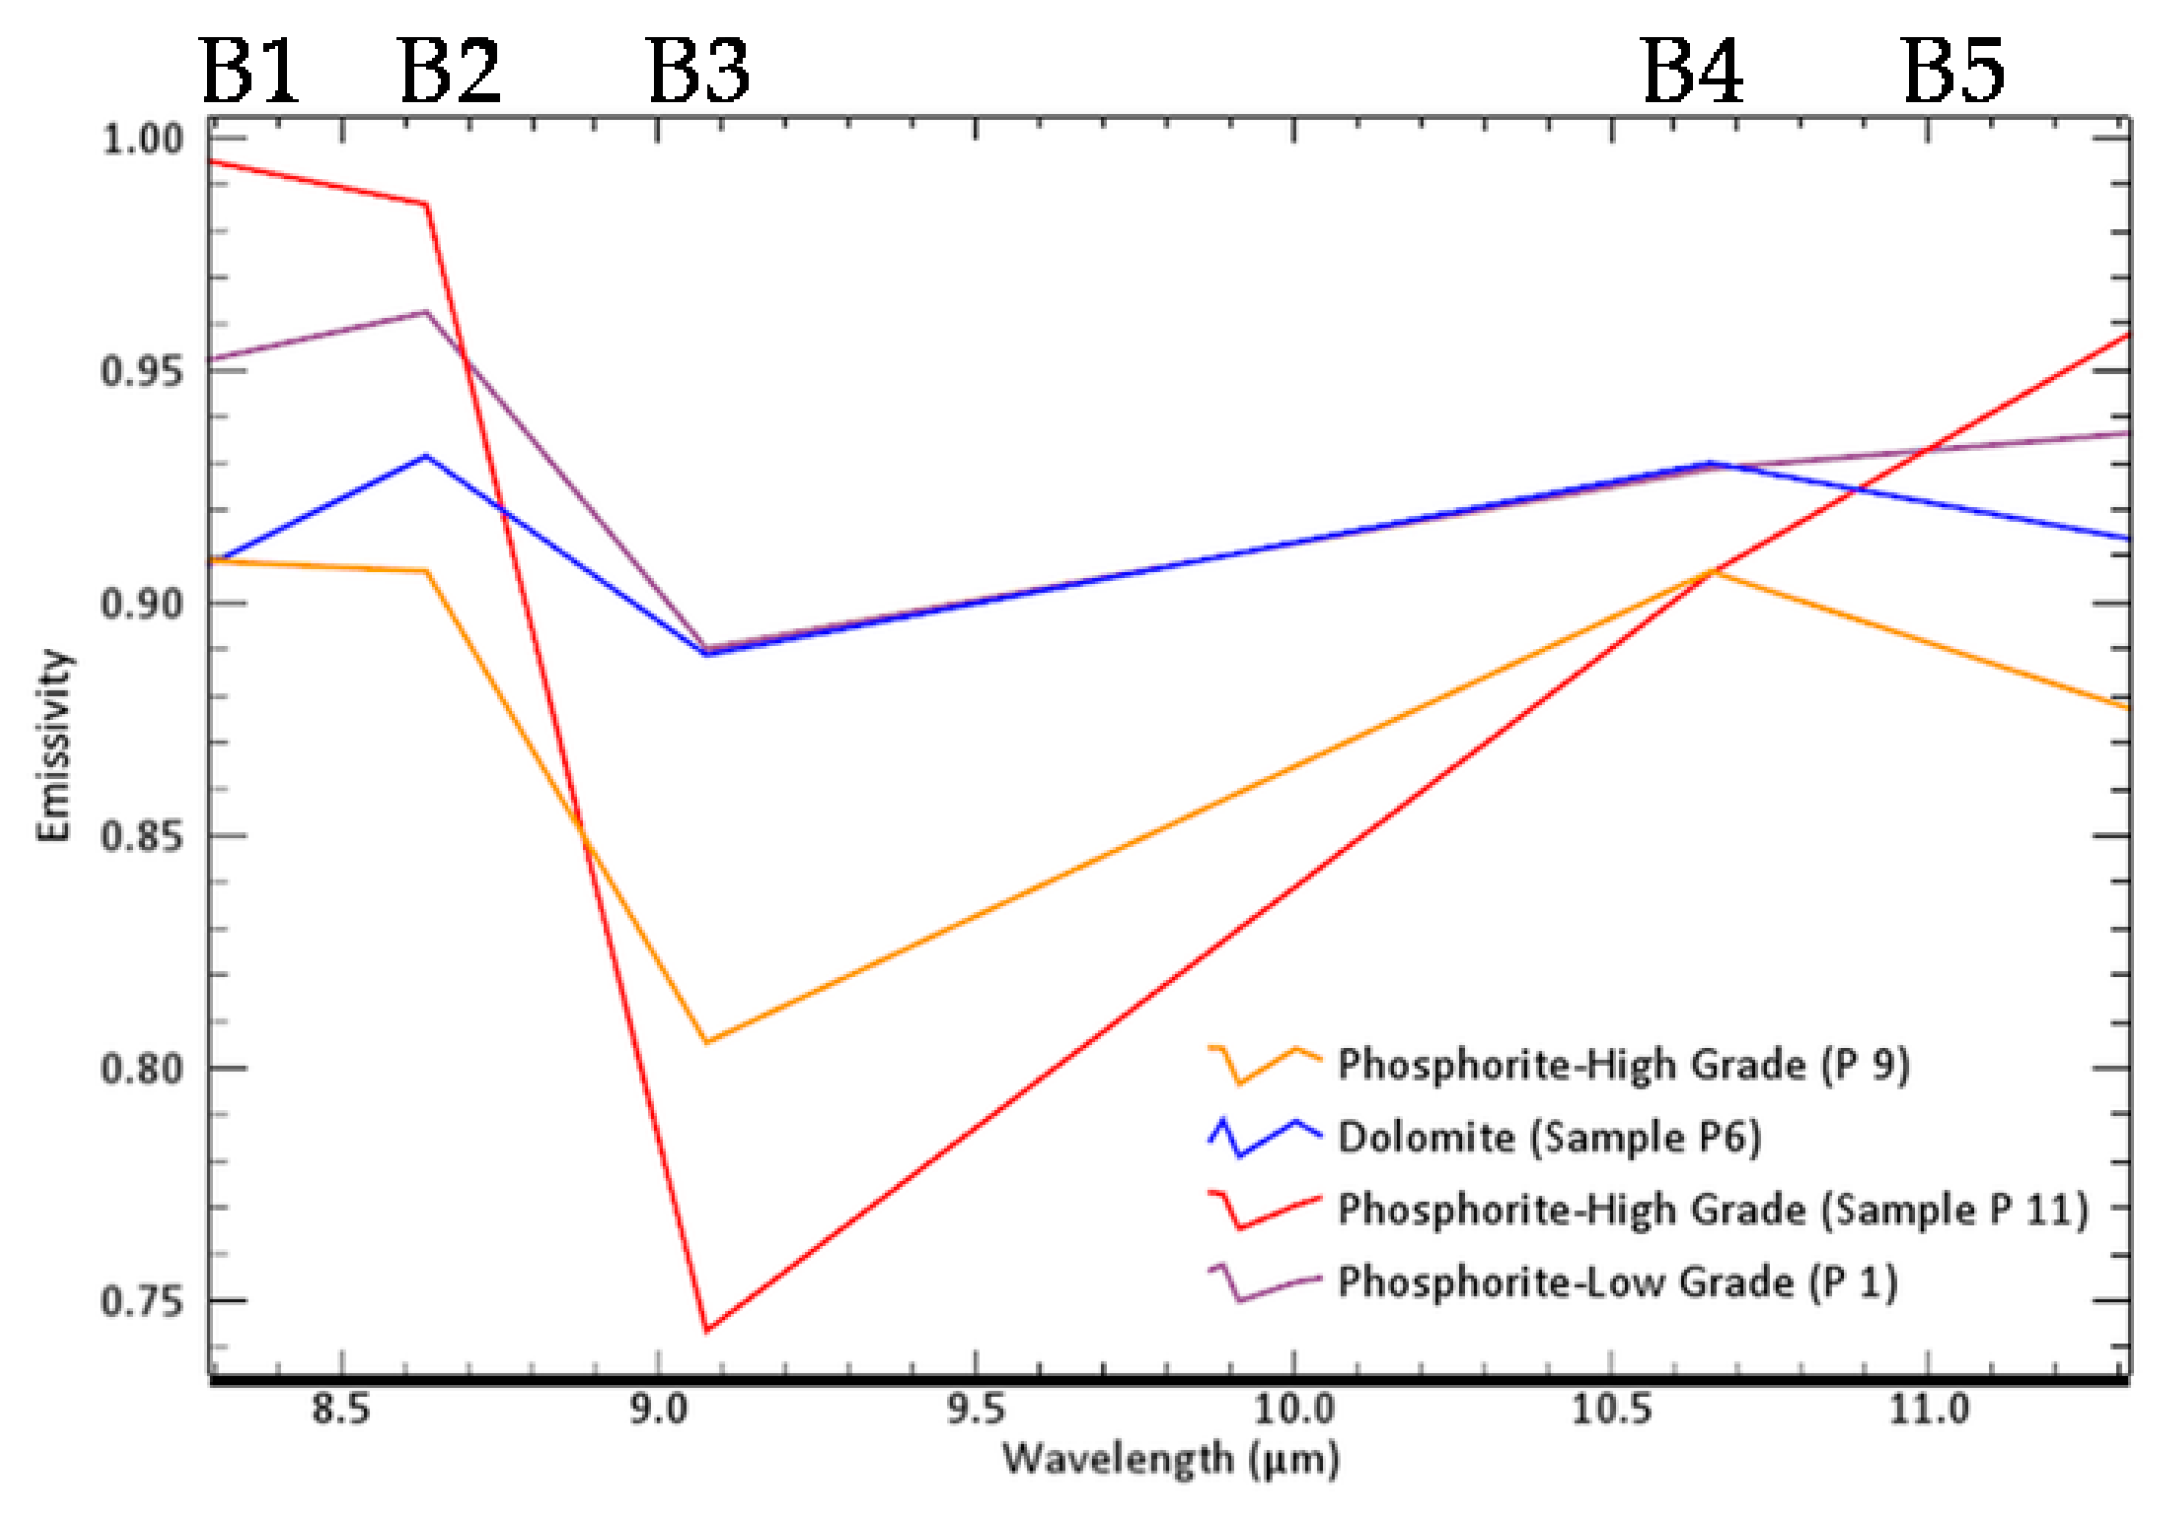
  • Emissivity spectra of dolomite and phosphorite are distinct from each other. A strongly emissive doublet characterizes the emissivity spectra of phosphorite samples while dolomite is devoid of such emissivity minima.
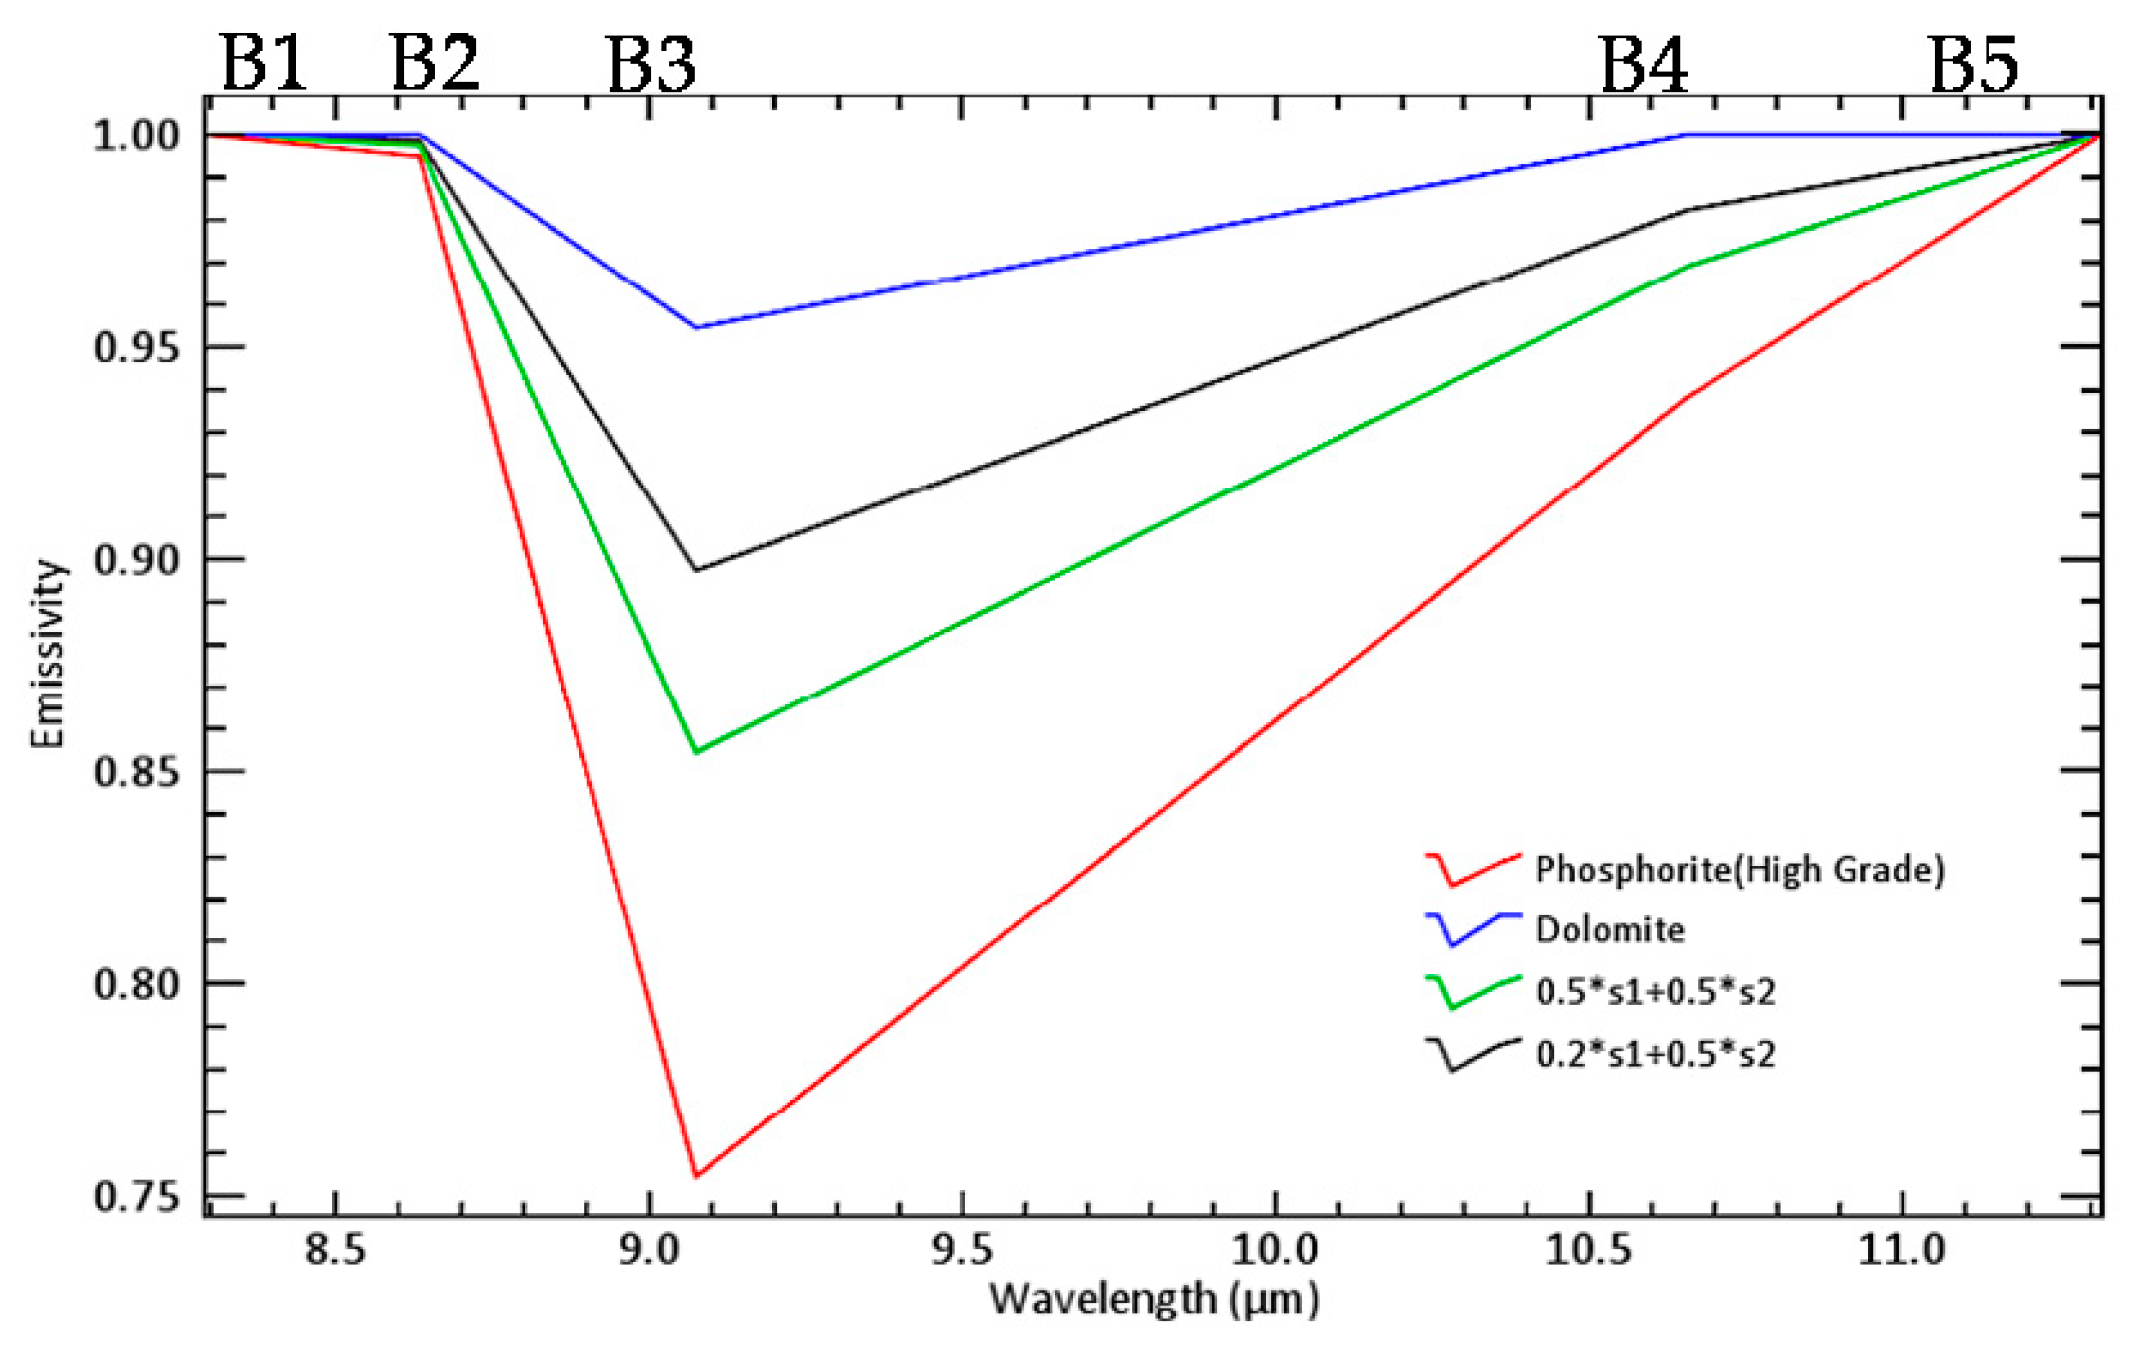
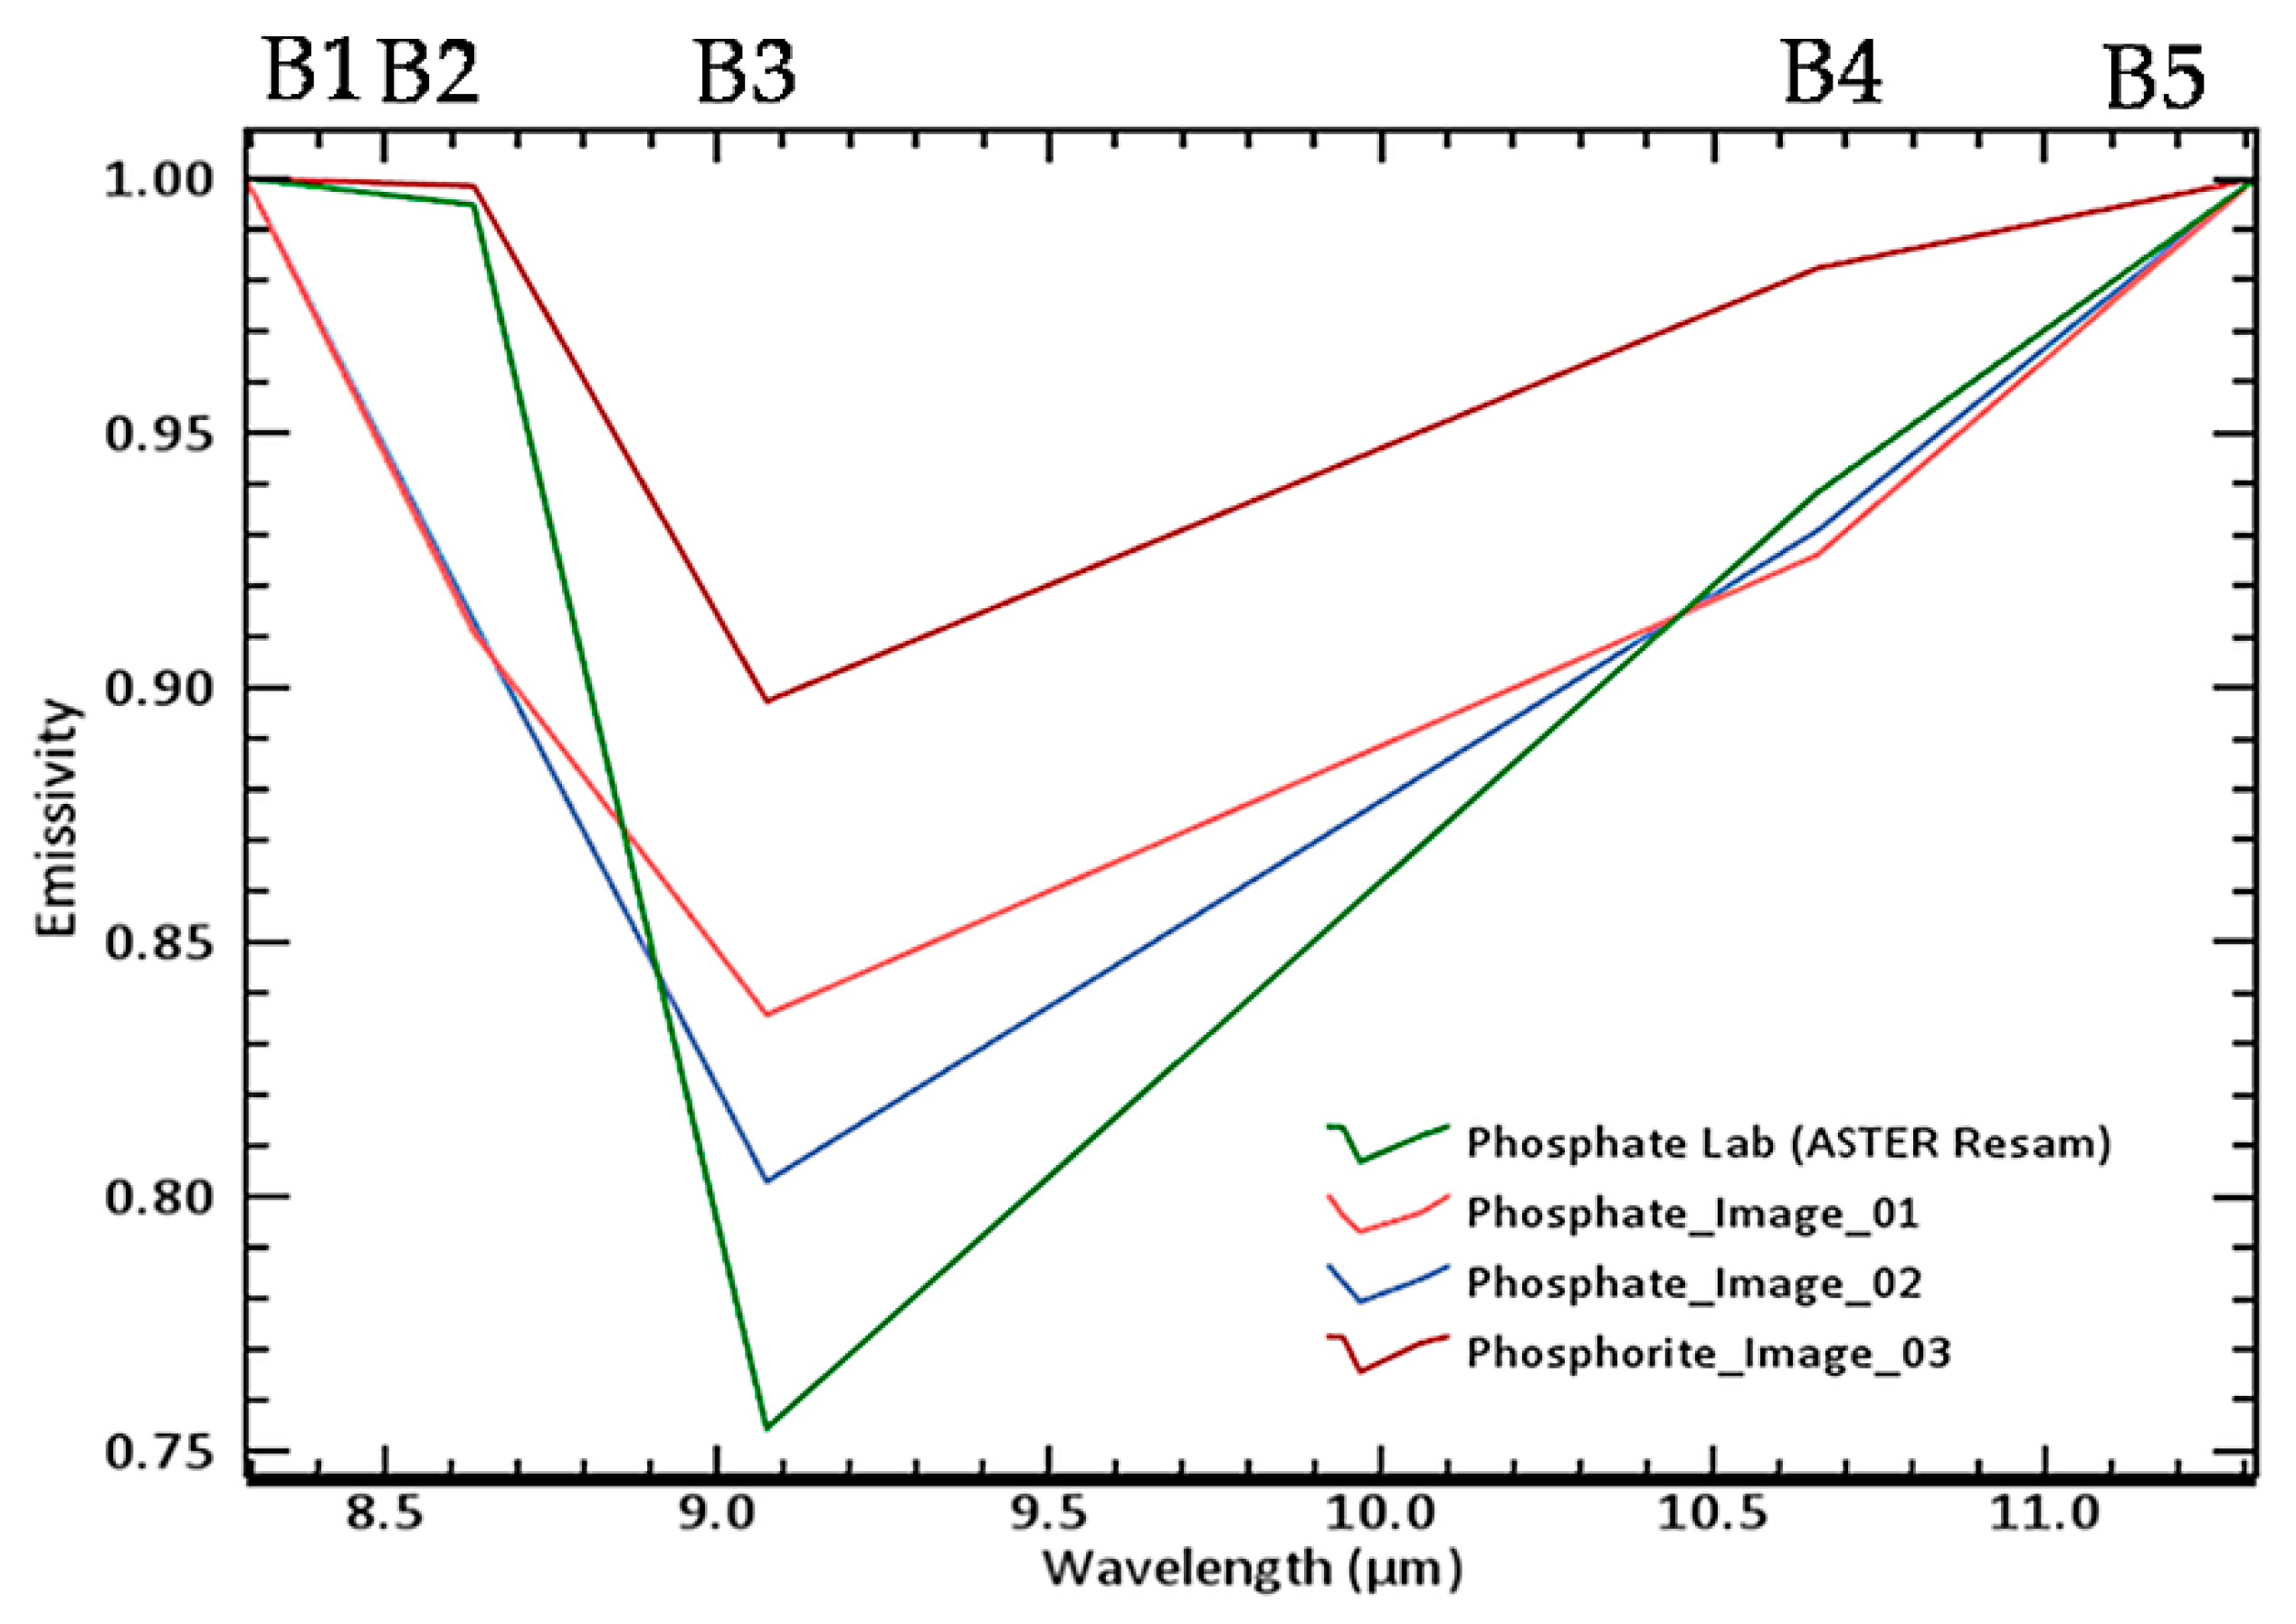
  • The spectral contrast of dolomite and phosphorite has been further generalized in the ASTER image spectra, and ASTER resampled laboratory spectra (Figure 6). The contrast in the emissivity is limited to the depth variation of the emissivity feature at 9.1 µm for dolomite and phosphorite. Phosphorite emissivity spectra have a larger depth with respect to the emissivity spectrum of dolomite having negligible depth at the wavelength.
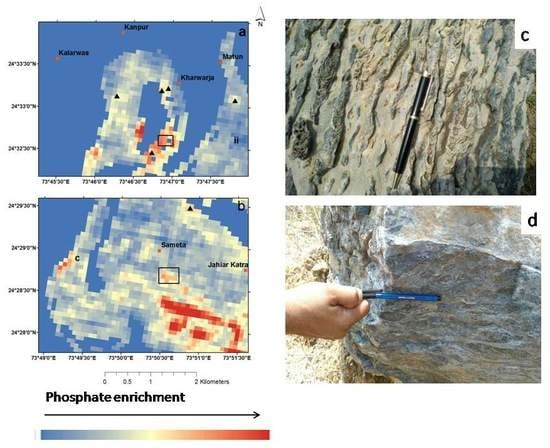
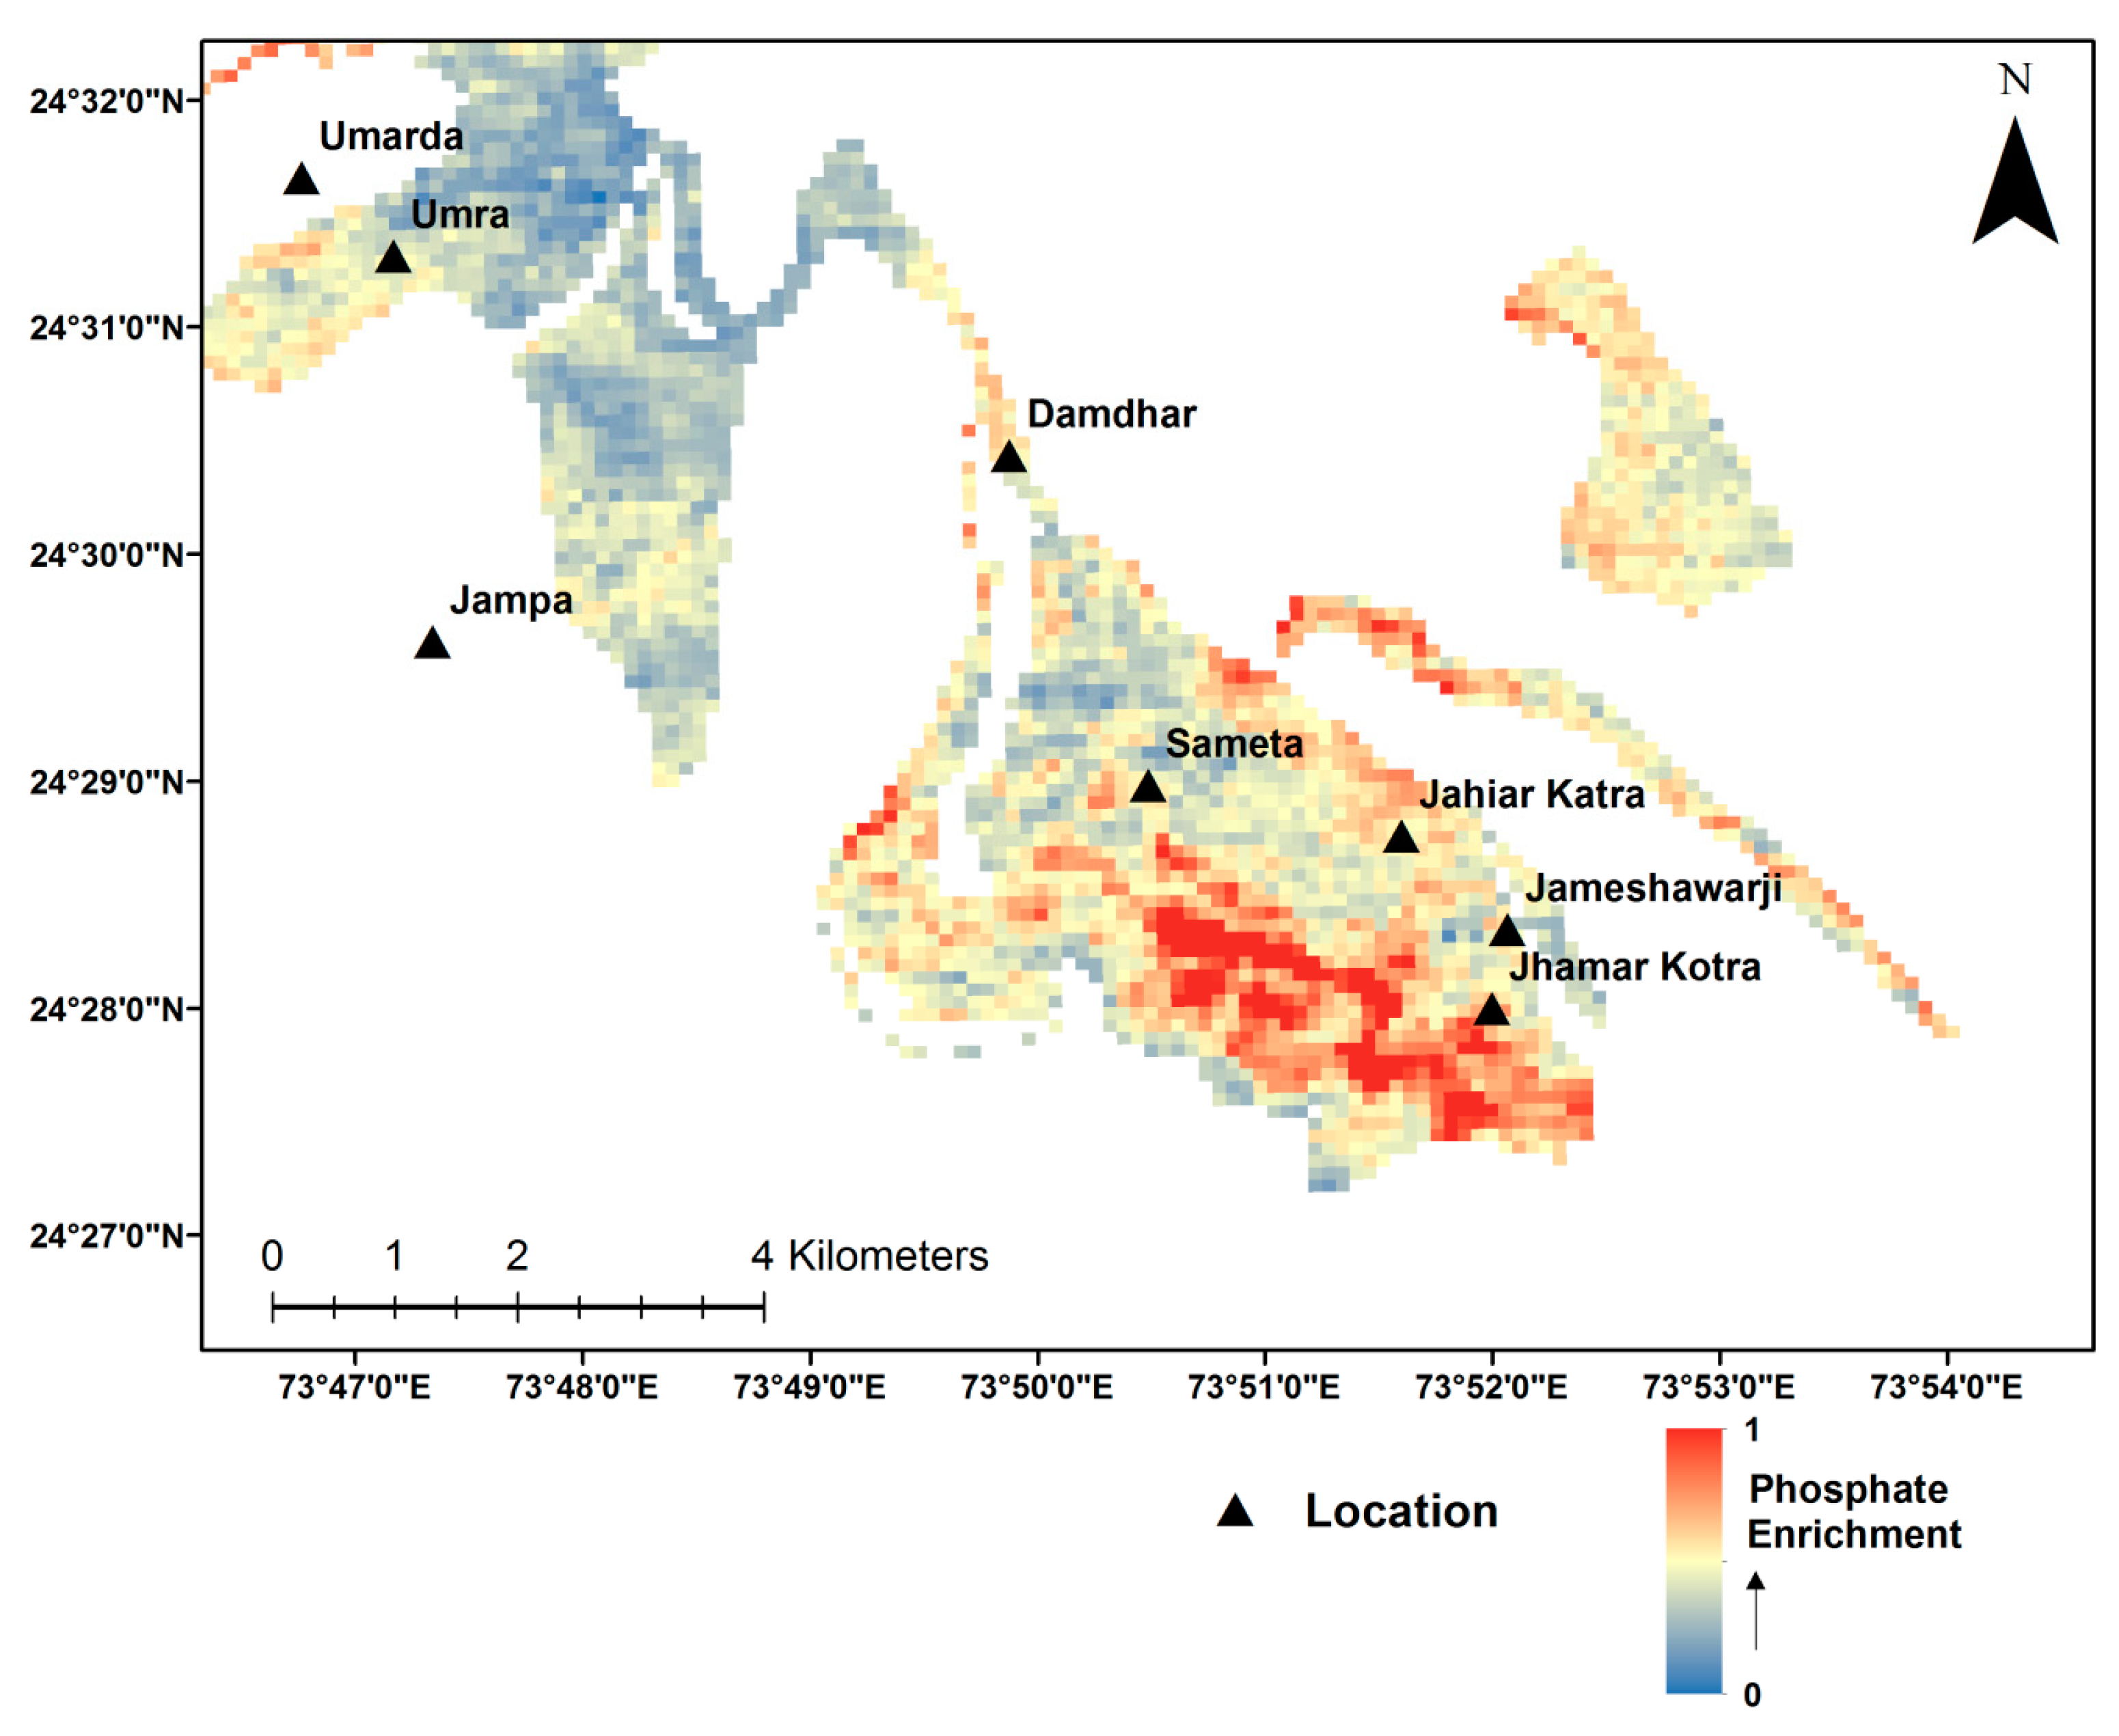
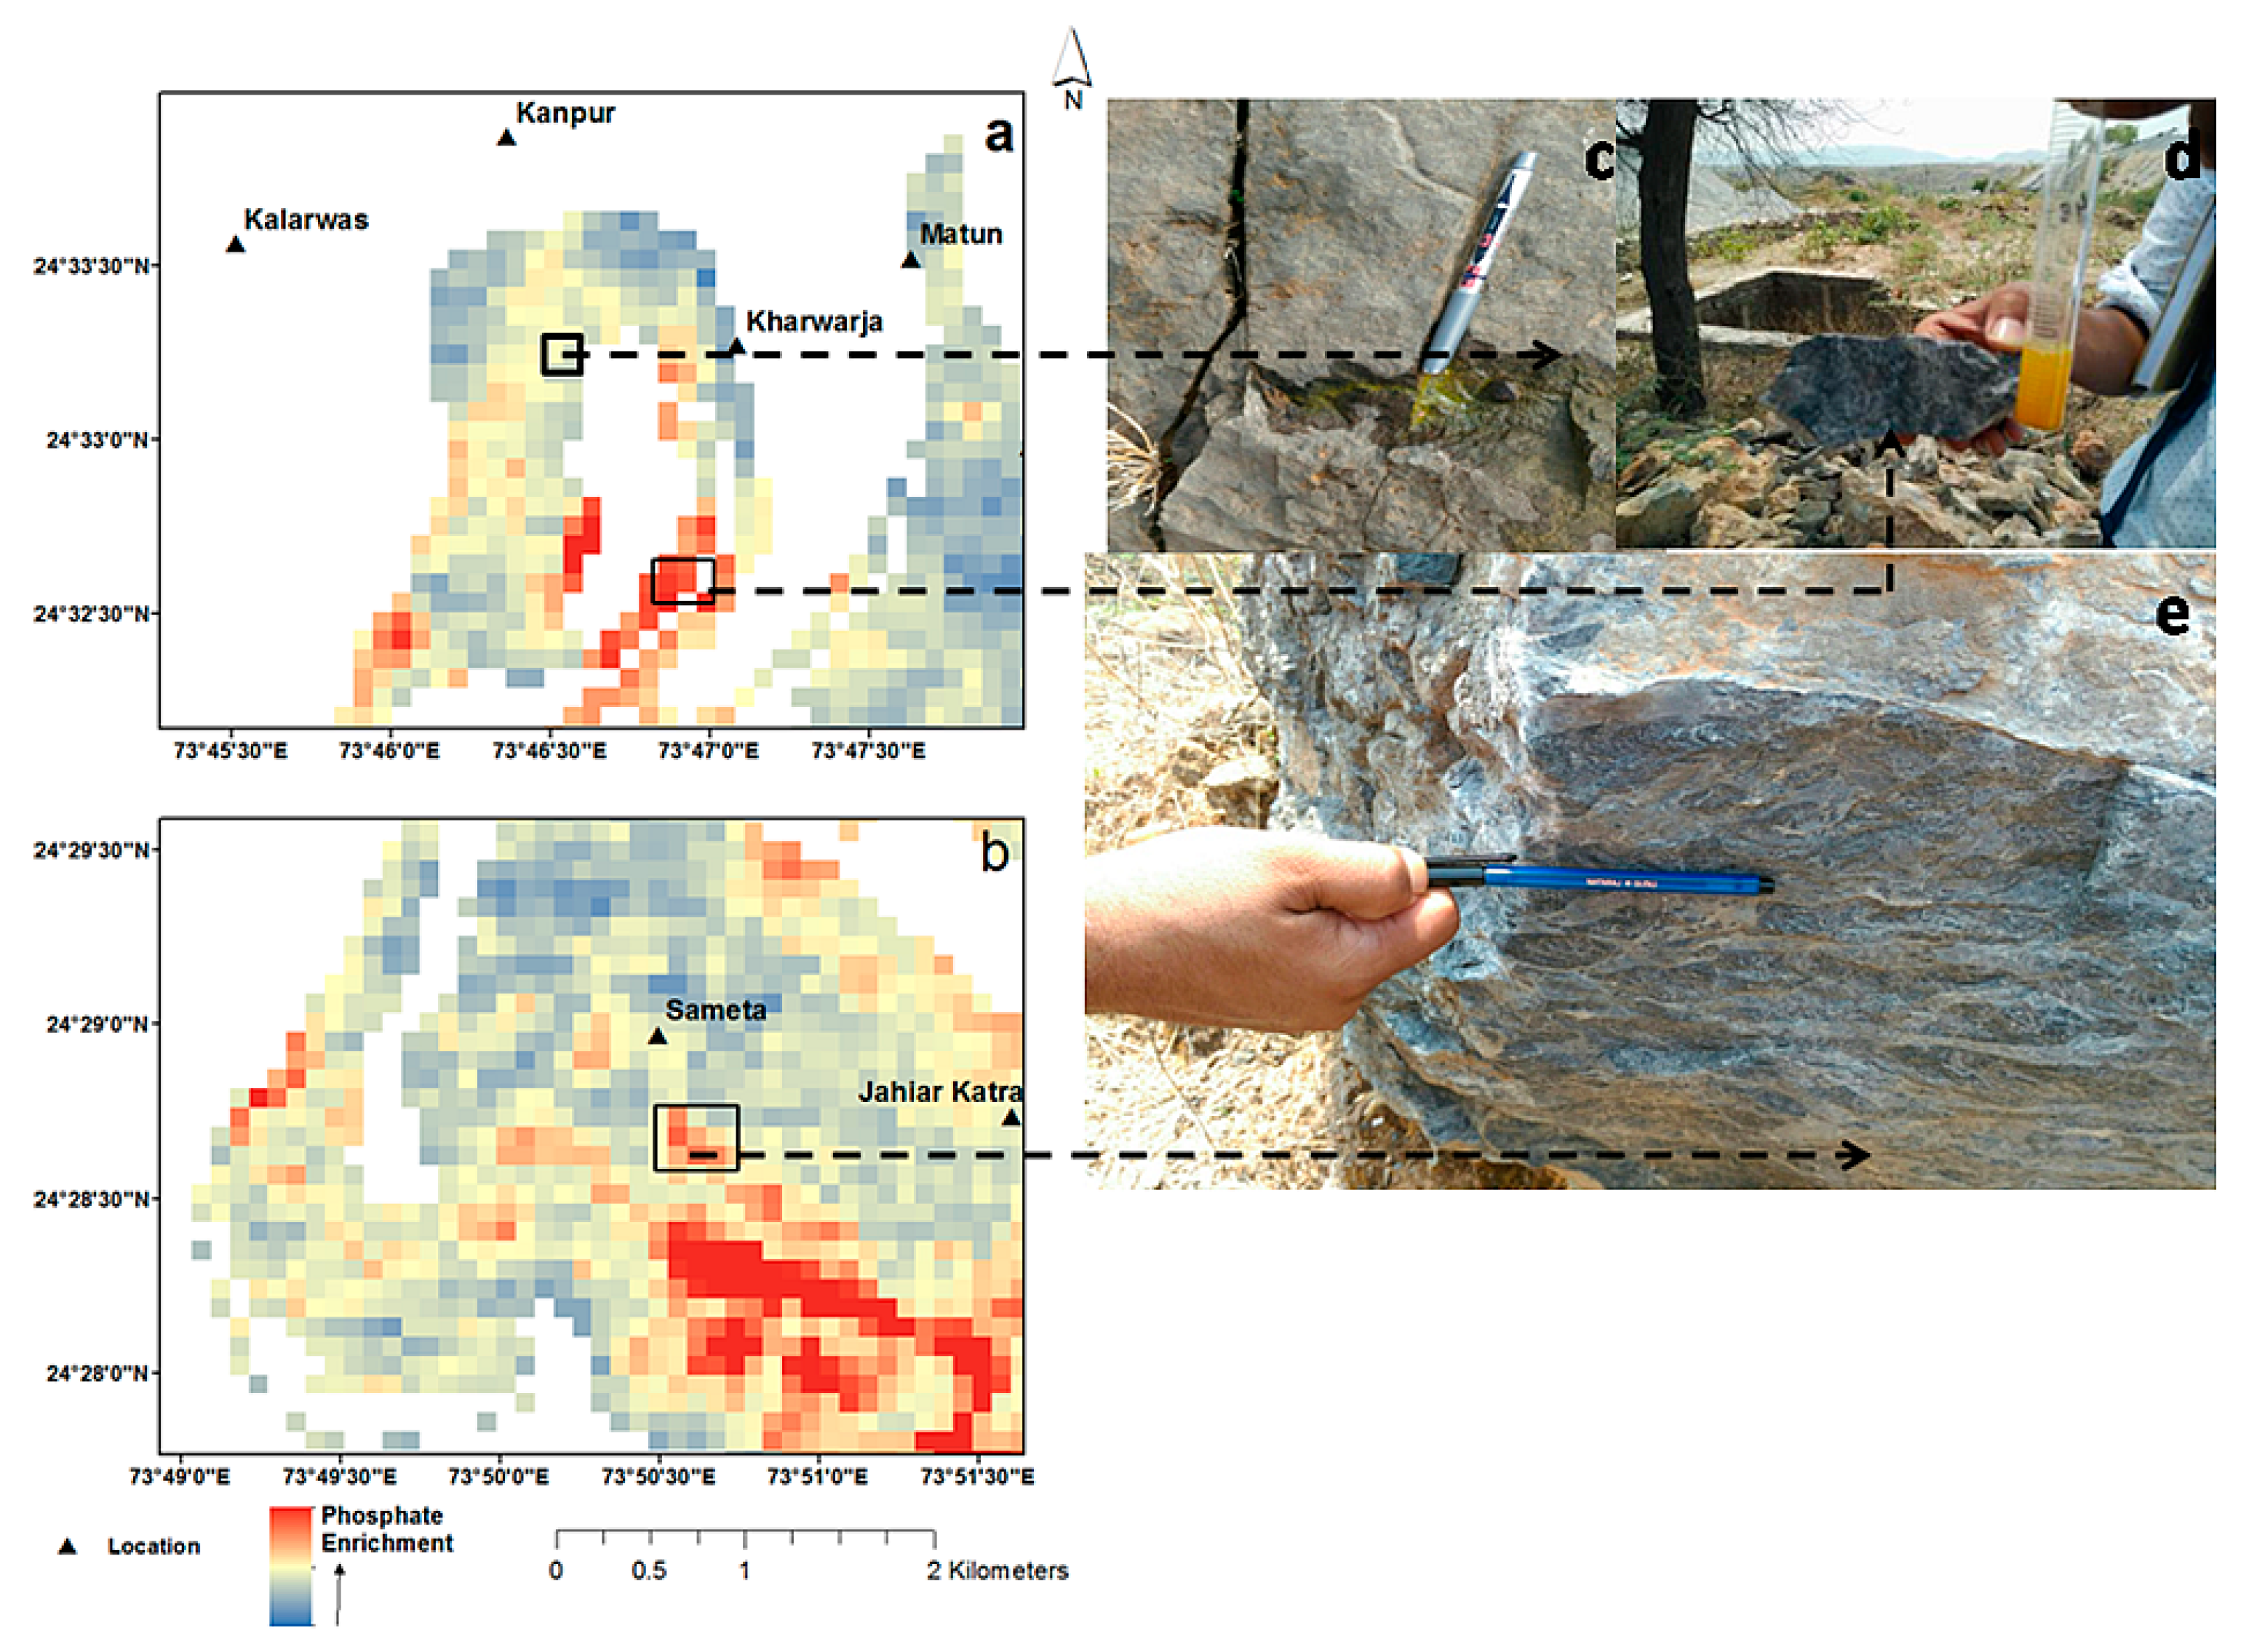
  • We proposed an RBD image-based on the emissivity contrast of dolomite and phosphate. The proposed RBD image of ASTER TIR bands can be used to delineate phosphorite provided the spatial mapping using the RBD image is restricted within the spatial extent of the host rock, i.e., dolomite or carbonate rocks. In this study, low-grade phosphorite exposures have intermediate value (yellow color), while high-grade phosphorite have high value (identified with yellow pixels)
  • The proposed approach of broadband TIR band based phosphorite mapping is simple, reproducible and can be used for targeting phosphorite occurring under similar geological setups. Many important carbonate phosphorite deposits in the world have a similar geological setup.

Author Contributions

The details of the contribution made by all the authors in different segment of work are as follows: (a) Conceptualisation: A.G. and K.V.K.; (b) Methodology: A.G., K.R.; Validation, A.G. and K.R.; Formal Analysis with suggestions to improve part of the analysis of the final result: A.G., Y.Y., S.C.; Writing-Original Draft Preparation: A.G., Y.Y., S.C.; Writing-Review & Editing: A.G., S.C., Y.Y.; Supervision: K.V.K.; Funding Acquisition: K.V.K., A.G. (for internal fund of Indian Space Research Organisation, Department of Space, Govt. of India) and Yashushi Yamaguchi(Publication Charge).

Funding

This research received no external funding.

Acknowledgments

The authors are thankful to the Director of the National Remote sensing Centre for his overall guidance. The authors are thankful to the authorities of the Atomic Mineral Directorate for exploration and research, Hyderabad, India (AMD) for providing analytical support. The authors are also thankful to the Officers of the AMD and Geological Survey of India for their guidance during validation of result.

Conflicts of Interest

The authors declare no conflict of interest.

References

  1. Choudhuri, R. Two Decades of Phosphorite Investigations in India; Geological Society: London, UK, 1990; Volume 52, pp. 305–311. [Google Scholar]
  2. Lane, M.D.; Dyar, M.D.; Bishop, J.L. Spectra of phosphate minerals as obtained by visible-near infrared reflectance, thermal infrared emission, and Mössbauer laboratory analyses. In Proceedings of the Lunar and Planetary Science Conference, League City, TX, USA, 12–16 March 2007; Volume 38, p. 2210. [Google Scholar]
  3. Tucker, M.E. Sedimentary Petrology: An Introduction to the Origin of Sedimentary Rocks, 3rd ed.; John Wiley & Sons: Hoboken, NJ, USA, 1 April 2009. [Google Scholar]
  4. Buettner, K.J.; Kern, C.D. The determination of infrared emissivities of terrestrial surfaces. J. Geophys. Res. 1965, 70, 1329–1337. [Google Scholar] [CrossRef]
  5. Misi, A.; Kyle, J.R. Upper Proterozoic carbonate stratigraphy, diagenesis, and stromatolitic phosphorite formation, Irecê Basin, Bahia, Brazil. J. Sediment. Res. 1994, 64, 299–310. [Google Scholar]
  6. Cook, P.T.; Shergold, J.H. Phosphate Deposits of the World, Proterozoic and Cambrian Phosphorites; Cambridge University Press: Cambridge, UK, 1986; Volume 1, p. 386. [Google Scholar]
  7. Salisbury, J.W.; Walter, L.S. Thermal infrared (2.5–13.5 μm) spectroscopic remote sensing of igneous rock types on particulate planetary surfaces. J. Geophys. Res. 1989, 94, 9192–9202. [Google Scholar] [CrossRef]
  8. Salisbury, J.W.S.; D’Aria, D.M. Emissivity of terrestrial materials in the 8–14 µm atmospheric windows. Remote Sens. Environ. 1992, 42, 83–106. [Google Scholar] [CrossRef]
  9. Ninomiya, Y.; Fu, B.; Cudahy, T.J. Detecting lithology with advanced spaceborne thermal emission and reflection radiometer (ASTER) multispectral thermal infrared “radiance-at-sensor” data. Remote Sens. Environ. 2005, 99, 127–139. [Google Scholar] [CrossRef]
  10. Ding, C.; Liu, X.; Liu, W.; Liu, M.; Li, Y. Mafic and ultramafic and quartz-rich rock indices deduced from ASTER thermal infrared data using a linear approximation to the planck function. Ore Geol. Rev. 2014, 60, 161–173. [Google Scholar] [CrossRef]
  11. Ding, C.; Li, X.; Liu, X.; Zhao, L. Quartzose–mafic spectral feature space model: A methodology for extracting felsic rocks with ASTER thermal infrared radiance data. Ore Geol. Rev. 2015, 66, 283–292. [Google Scholar] [CrossRef]
  12. Guha, A.; Kumar, V. New ASTER derived thermal indices to delineate mineralogy of different granitoids of Archaean Craton and analysis of their potentials with reference to Ninomiya’s indices for delineating quartz and mafic minerals of granitoids-an analysis in Dharwar Craton, India. Ore Geol. Rev. 2016, 74, 76–87. [Google Scholar]
  13. Rani, K.; Guha, A.; Pal, S.K.; Vinod Kumar, K. Comparative analysis of potentials of ASTER thermal infrared band derived emissivity composite, radiance composite and emissivity-temperature composite in geological mapping of Proterozoic rocks in parts Banswara, Rajasthan. J. Indian Soc. Remote Sens. 2019. [Google Scholar] [CrossRef]
  14. Van der Meer, F.D.; Van der Werff, H.M.A.; Van Ruitenbeek, F.J.A.; Hecker, C.A.; Bakker, W.H.; Noomen, M.F.; Van der Meijde, M.; Carranza, E.J.M.; De Smeth, J.B.; Woldai, T. Multi-and hyperspectral geologic remote sensing: A review. Int. Appl. Earth Observ. Geoinf. 2012, 14, 112–128. [Google Scholar] [CrossRef]
  15. Yamaguchi, Y.; Kahle, A.B.; Tsu, H.; Kawakami, T.; Pniel, M. Overview of advanced spaceborne thermal emission and reflection radiometer (ASTER). IEEE Trans. Geosci. Remote Sens. 1998, 36, 1062–1071. [Google Scholar] [CrossRef]
  16. Abrams, M. The advanced spaceborne thermal emission and reflection radiometer (ASTER): Data products for the high spatial resolution imager on NASA’s Terra platform. Int. J. Remote Sens. 2000, 21, 847–859. [Google Scholar] [CrossRef]
  17. Becker, F.; Li, Z.L. Surface temperature and emissivity at various scales: Definition, measurement and related problems. Remote Sens. Rev. 1995, 12, 225–253. [Google Scholar] [CrossRef]
  18. Tang, H.; Li, Z.L. Quantitative Remote Sensing in Thermal Infrared: Theory and Applications; Springer: Heidelberg, Germany, 2014. [Google Scholar]
  19. Hubbard, B.E.; Crowley, J.K. Mineral mapping on the Chilean–Bolivian Altiplano using co-orbital ALI, ASTER and Hyperion imagery: Data dimensionality issues and solutions. Remote Sens. Environ. 2005, 99, 173–186. [Google Scholar] [CrossRef]
  20. Hewson, R.D.; Cudahy, T.J.; Mizuhiko, S.; Ueda, K.; Mauger, A.J. Seamless geological map generation using ASTER in the Broken Hill-Curnamona province of Australia. Remote Sens. Environ. 2005, 99, 159–172. [Google Scholar] [CrossRef]
  21. Chen, X.; Warner, T.A.; Campagna, D.J. Integrating visible, near-infrared and short-wave infrared hyperspectral and multispectral thermal imagery for geological mapping at Cuprite, Nevada. Remote Sens. Environ. 2007, 110, 344–356. [Google Scholar] [CrossRef]
  22. Bell, J.H.; Bowen, B.B.; Martini, B.A. Imaging spectroscopy of jarosite cement in the Jurassic Navajo Sandstone. Remote Sens. Environ. 2010, 114, 2259–2270. [Google Scholar] [CrossRef]
  23. Brandmeier, M. Remote sensing of Carhuarazo volcanic complex using ASTER imagery in Southern Peru to detect alteration zones and volcanic structures–a combined approach of image processing in ENVI and ArcGIS/ArcScene. Geocarto Int. 2010, 25, 629–648. [Google Scholar] [CrossRef]
  24. Bedini, E. Mineral mapping in the Kap Simpson complex, central East Greenland, using HyMap and ASTER remote sensing data. Adv. Space Res. 2011, 47, 60–73. [Google Scholar] [CrossRef]
  25. Ninomiya, Y.; Matsunaga, T.; Yamaguchi, Y.; Ogawa, K.; Rokugawa, S.; Uchida, K.; Muraoka, H.; Kaku, M. A comparison of thermal infrared emissivity spectra measured in situ, in the laboratory, and derived from thermal infrared multispectral scanner (TIMS) data in Cuprite, Nevada, USA. Int. J. Remote Sens. 1997, 18, 1571–1581. [Google Scholar] [CrossRef]
  26. Aboelkhair, H.; Ninomiya, Y.; Watanabe, Y.; Sato, I. Processing and interpretation of ASTER TIR data for mapping of rare-metal-enriched albite granitoids in the Central Eastern Desert of Egypt. J. Afr. Earth Sci. 2010, 58, 141–151. [Google Scholar] [CrossRef]
  27. Matar, S.S.; Bamousa, A.O. Integration of the ASTER thermal infra-red bands imageries with geological map of Jabal Al Hasir area, AsirTerrane, the Arabian Shield. J. Taibah Univ. Sci. 2013, 7, 1–7. [Google Scholar] [CrossRef]
  28. Yajima, T.; Yamaguchi, Y. Geological mapping of the Francistown area in north-eastern Botswana by surface temperature and spectral emissivity information derived from advanced spaceborne thermal emission and reflection radiometer (ASTER) thermal infrared data. Ore Geol. Rev. 2013, 53, 134–144. [Google Scholar] [CrossRef]
  29. Son, Y.S.; Kang, M.K.; Yoon, W.J. Lithological and mineralogical survey of the Oyu Tolgoi region, Southeastern Gobi, Mongolia using ASTER reflectance and emissivity data. Int. J. Appl. Earth Observ. Geoinf. 2014, 26, 205–216. [Google Scholar] [CrossRef]
  30. Guha, A.; Vinod Kumar, K.; Porwal, A.; Rani, K.; Singaraju, V.; Singh, R.P.; Khandelwal, M.K.; Raju, P.V.; Diwakar, P.G. Reflectance spectroscopy and ASTER based mapping of rock-phosphate in parts of Paleoproterozoic sequences of Aravalli Group of rocks, Rajasthan, India. Ore Geol. Rev. 2018. [Google Scholar] [CrossRef]
  31. Gaffey, S.J. Spectral reflectance of carbonate minerals in visible and near infrared: Anhydrous carbonate minerals. J. Geophys. Res. 1987, 92, 1429–1440. [Google Scholar] [CrossRef]
  32. Gaffey, S.J. Spectral reflectance of-carbonate minerals in the visible and near infrared (0.35–2.55 microns): Calcite, aragonite, and dolomite. Am. Mineral. 1986, 71, 151–162. [Google Scholar]
  33. Li, Z.L.; Becker, F.; Stoll, M.P.; Wan, Z. Evaluation of six methods for extracting relative emissivity spectra from thermal infrared images. Remote Sens. Environ. 1999, 69, 197–214. [Google Scholar] [CrossRef]
  34. Li, Z.L.; Tang, B.H.; Wu, H.; Ren, H.; Yan, G.; Wan, Z.; Trigo, I.F.; Sobrino, J.A. Satellite derived land surface temperature: Current status and perspectives. Remote Sens. Environ. 2013, 131, 14–37. [Google Scholar] [CrossRef]
  35. Guha, A.; Vinod Kumar, K. Integrated approach of using aster derived emissivity and radiant temperature for delineating different granitoids—a case study in parts of Dharwar Craton, India. Geocarto Int. 2015, 31, 860–869. [Google Scholar] [CrossRef]
  36. Roy, A.B.; Paliwal, B.S.; Shekhawat, S.S.; Nagori, D.K.; Golani, P.R.; Bejarniya, B.R. Stratigraphy of the Aravalli Supergroup in the type area. Geol. Soc. India Mem. 1988, 7, 121–138. [Google Scholar]
  37. Banerjee, D.M.; Schidlowski, M.; Arneth, J.D. Genesis of upper proterozoic Cambrian phosphorite deposits of India: Isotopic inferences from carbonate fluroapatite, carbonate and organic carbon. Precambrian Res. 1986, 33, 239–253. [Google Scholar] [CrossRef]
  38. Roy, A.B.; Paliwal, B.S. Evolution of lower Proterozoic epicontinental deposits: Stromatolite-bearing Aravalli rocks of Udaipur, Rajasthan, India. Precambrian Res. 1981, 14, 49–74. [Google Scholar] [CrossRef]
  39. Abrams, M.; Tsu, H.; Hulley, G.; Iwao, K.; Pieri, D.; Cudahy, T.; Kargel, J. The advanced spaceborne thermal emission and reflection radiometer (ASTER) after fifteen years: Review of global products. Int. J. Appl. Earth Observ. Geoinf. 2015, 38, 292–301. [Google Scholar] [CrossRef]
  40. NASA. ASTER. Available online: https://asterweb.jpl.nasa.gov/ (accessed on 1 January 2016).
  41. Hook, S.J.; Gabell, A.R.; Green, A.A.; Kealy, P.S. A comparison of techniques for extracting emissivity information fromthermal infrared data for geologic studies. Remote Sens. Environ. 1992, 42, 123–135. [Google Scholar] [CrossRef]
  42. Kealy, P.S.; Hook, S.J. Separating temperature and emissivity in thermal infrared multispectral scanner data: Implications for recovering land surface temperatures. IEEE Trans. Geosci. Remote Sens. 1993, 31, 1155–1164. [Google Scholar] [CrossRef]
  43. D&P Instruments. Available online: http://www.dpinstruments.com/ (accessed on 15 June 2018).
  44. Ruff, S.W.; Christensen, P.R.; Barbera, P.W.; Anderson, D.L. Quantitative thermal emission spectroscopy of minerals: A laboratory technique for measurement and calibration. J. Geophys. Res. 1997, 102, 14899–14913. [Google Scholar] [CrossRef] [Green Version]
  45. Christensen, P.R.; Bandfield, J.L.; Hamilton, V.E.; Howard, D.A.; Lane, M.D.; Piatek, J.L.; Ruff, S.W.; Stefanov, W.L. A thermal emission spectral library of rock-forming minerals. J. Geophys. Res. Planets 2000, 105, 9735–9739. [Google Scholar] [CrossRef] [Green Version]
  46. Kokaly, R.F.; Clark, R.N.; Swayze, G.A.; Livo, K.E.; Hoefen, T.M.; Pearson, N.C.; Wise, R.A.; Benzel, W.M.; Lowers, H.A.; Driscoll, R.L.; et al. USGS Spectral Library Version 7; No. 1035; US Geological Survey: Reston, VA, USA, 2017.
  47. Johnson, B.R.; Young, S.J. In-Scene Atmospheric Compensation: Application to SEBASS Data Collected at the ARM Site, Technical Report, Space and Environment Technology Center; The Aerospace Corporation: El Segundo, CA, USA, 1998. [Google Scholar]
  48. Hamilton, V.E.; Christensen, P.R.; McSween, H.Y., Jr. Determination of Martian meteorite lithologies and mineralogies using vibrational spectroscopy. J. Geophys. Res. Planets 1997, 102, 25593–25603. [Google Scholar] [CrossRef] [Green Version]
  49. Hamilton, V.E. Thermal infrared emission spectroscopy of the pyroxene mineral series. J. Geophys. Res. Planets 2000, 105, 9701–9716. [Google Scholar] [CrossRef] [Green Version]
  50. Mission, G. Colorimetric estimation of phosphorus in steels. Chemiker Zeitung 1908, 32, 633. [Google Scholar]
  51. Wynn, J.C.; Bazzari, M.; Bawajeeh, A.; Tarabulsi, Y.; Showail, A.; Hajnoor, M.O.; Techico, L.; Wynn, J.P. Phosphate Content Derived from Well Logging, Al Jalamid Phosphate Deposit, Northern Saudi Arabia; U.S. Geological Survey Mission Data File Report IR-869; U.S. Geological Survey: Reston, VA, USA, 1994; 9p.
Figure 1. The extent of the study area is shown on the Advanced Spaceborne Thermal Emission and Reflection Radiometer (ASTER) false color composite image prepared using visible and near-infrared bands of ASTER. In this false color composite image, Red = Band 3 of ASTER visible near infrared (VNIR) sensor, Green =Band 2 of VNIR sensor, Blue =Band 1 of VNIR sensor of ASTER. For specification of ASTER VNIR bands, please refer Table 1.
Remotesensing 11 01003 g001
Figure 2. Lithological Map of the area (Source: Geological Survey of India (GSI); Unpublished). Triangles are important locations where phosphorites are exposed.
Remotesensing 11 01003 g002
Figure 3. (a). Surface exposures of dolomite. (b) Surface exposures of low-grade rock phosphate (c). Surface exposures of high-grade phosphorite.
Remotesensing 11 01003 g003
Figure 4. Continuum removed thermal emissivity spectra of representative samples of dolomite and phosphorites (P1 is low-grade; P11 and P9 are medium-to-high-grade phosphorite; P6 is dolomite ). Broad mineralogy of the samples and P2O5 content of the samples are given in Table 2. Wavelength positions of five TIR bands of ASTER are also shown (B1 to B5).
Remotesensing 11 01003 g004
Figure 5. (a) Emissivity spectra of different samples of host rock dolomite(different samples of same rock type are denoted P6_1, P6_2, and so on). (b) Emissivity spectra of different samples of low-grade phosphorite (different samples of same rock type are denoted P1_1, P1_2, and so on). (c) Emissivity spectra of medium to high-grade phosphorite (different samples of same rock type are denoted P9_1, P9_2, and so on). (d) Emissivity spectra of high-grade phosphorite (different samples of same rock type are denoted P11_1, P11_2, and so on).
Remotesensing 11 01003 g005
Figure 6. (a). Continuum removed thermal spectrum of dolomite (P6) and the spectra of the dominant constituent mineral are plotted. (b) Continuum removed thermal spectrum of low-grade phosphorite (P1), and the spectra of dominant constituent minerals are plotted. (c) Continuum removed thermal spectrum of medium to high-grade phosphorite (P11) and the spectra of dominant constituent minerals are plotted (d). Continuum removed thermal spectrum of medium to high-grade phosphorite (P9) and the spectra of dominant constituent minerals are plotted. Mineral spectra is collected from United States Geological Survey (USGS) spectral library. The spectral data base is available with ENVI 5.1 software package. Wavelength positions of five TIR bands of ASTER are also shown (B1 to B5).
Remotesensing 11 01003 g006aRemotesensing 11 01003 g006b
Figure 7. ASTER resampled spectra of representative samples of phosphorite and dolomite. Wavelength positions of five TIR bands of ASTER are also shown (B1 to B5).
Remotesensing 11 01003 g007
Figure 8. Comparison between phosphorite, dolomite and their intermediate mixed variants. Intermediate mixed variants are derived by linear mixing Emissivity spectra of dolomite (S1) and phosphorite (S2) to understand the role of intrapixel mixing in the detection of phosphorite. Wavelength positions of five TIR bands of ASTER are also shown (B1 to B5).
Remotesensing 11 01003 g008
Figure 9. Comparison between the ASTER TIR band resampled mean high-grade phosphorite spectrum and with the few image spectra of phosphorite pixels. These pixels are the known exposures of phosphorite around the Jhamar Kotra mining area. Wavelength position of ASTER five TIR bands are also shown (B1 to B5).
Remotesensing 11 01003 g009
Figure 10. Decorrelation stretched false color composite prepared using spectral bands of ASTER level 1B radiance data. In this image composite, Red = Band 13, Green =band 12, and Blue = band 11 of ASTER thermal infrared sensor. Please refer to Table 1 for ASTER TIR band nuber detail.
Remotesensing 11 01003 g010
Figure 11. Decorrelation stretched emissivity normalization composite derived using red = emissivity of band 13, green = emissivity of band 12, and blue = emissivity of band 11. In this figure, Phosphorite pixels are enhanced with a red and pinkish-magenta color. Please refer to Table 1 for ASTER TIR band nuber detail.
Remotesensing 11 01003 g011
Figure 12. Density sliced relative band depth image derived using three emissivity bands of ASTER (Band 13+Band 11)/Band 12. Relative subpixel abundance of phosphate is increasing with yellow to red color, while blue zones are dolomite.
Remotesensing 11 01003 g012
Figure 13. (a). Density sliced relative band depth image for Kharawarja (Matun). (b). Sameta and the Jhmar Kotra mine. High phosphorite rich zones have been demarcated with red color. Field check areas beyond the present mine are shown with a rectangle. Field validation in the east of the Kharwarja area (c) and south of the Kharwarja area (d) and Sameta area (e).
Remotesensing 11 01003 g013
Table 1. ASTER thermal infrared (TIR) data specifications (here visible–near-infrared (VNIR) bands are used for preparing the study area map while data processing is restricted to TIR bands). Band 6 to Band 9 are part of ASTER short wave infrared(SWIR) region. These SWIR spectral bands are not used in this study.
Sensor TypeBand NumberSpectral Width or Wavelength Range (µm)Spatial Resolution (meter) Radiometric Resolution (in bits)
Visible Infrared (VNIR)10.52–0.60158
20.63–0.69158
3N0.78–0.86158
Thermal Infrared Sensor (TIR)Band 108.125–8.4759012
Band 118.8475–8.825
Band 128.925–9.275
Band 1310.25–10.95
Band 1410.95–11.65
Table 2. Results of XRD and X-ray fluorescence (XRF) analysis of representative samples of phosphorite and dolomite to identify the presence of the dominant mineral phases and their relative proportion along with the P2O5 Content [30].
Nature of SamplesSample No. and DetailsMajor Dominant Minerals Identified Using XRD Data (Arranged as Per the Decreasing Order of Relative Abundance)P2O5 Content in % (XRF)
Phosphorite and dolomiteP1(low-grade phosphorite)Fluroapatite, dolomite13.94
P6 (Dolomite)Dolomite, quartz ----
P9 (Dolomite bearing high-grade phosphorite)Fluroapatite, dolomite,38.53
P11 (Dolomite depleted high-grade phosphorite)Fluroapatite, quartz39.11

