Multispectral and Radar Data for the Setting of Gold Mineralization in the South Eastern Desert, Egypt


1
Department of Geology, Faculty of Science, Benha University, Benha 13518, Egypt
2
Institute of Geosciences, University of Kiel, Ludewig-Meyn Str. 10, 24118 Kiel, Germany
3
Geology Department, Faculty of Science, Aswan University, Aswan 81528, Egypt
4
Geology Department, Faculty of Science, Cairo University, Giza 12613, Egypt
5
National Authority for Remote Sensing & Space Sciences (NARSS), Cairo 1564, Egypt
*
Author to whom correspondence should be addressed.
Remote Sens. 2019, 11(12), 1450; https://0-doi-org.brum.beds.ac.uk/10.3390/rs11121450
Submission received: 14 May 2019
/
Revised: 7 June 2019
/
Accepted: 16 June 2019
/
Published: 18 June 2019
(This article belongs to the Special Issue Multispectral and Hyperspectral Remote Sensing Data for Mineral Exploration and Environmental Monitoring of Mined Areas)
Abstract
:Satellite-based multi-sensor data coupled with field and microscopic investigations are used to unravel the setting and controls of gold mineralization in the Wadi Beitan–Wadi Rahaba area in the South Eastern Desert of Egypt. The satellite-based multispectral and Synthetic Aperture Radar (SAR) data promoted a vibrant litho-tectonic understanding and abetted in assessing the regional structural control of the scattered gold occurrences in the study area. The herein detailed approach includes band rationing, principal component and independent component analyses, directional filtering, and automated and semi-automated lineament extraction techniques to Landsat 8- Operational Land Imager (OLI), Advanced Spaceborne Thermal Emission and Reflection Radiometer (ASTER), Phased Array L-band Synthetic Aperture Radar (PALSAR), and Sentinel-1B data. Results of optical and SAR data processed as grayscale raster images of band ratios, Relative Absorption Band Depth (RBD), and (mafic–carbonate–hydrous) mineralogical indices are used to extract the representative pixels (regions of interest). The extracted pixels are then converted to vector shape files and are finally imported into the ArcMap environment. Similarly, manually and automatically extracted lineaments are merged with the band ratios and mineralogical indices vector layers. The data fusion approach used herein reveals no particular spatial association between gold occurrences and certain lithological units, but shows a preferential distribution of gold–quartz veins in zones of chlorite–epidote alteration overlapping with high-density intersections of lineaments. Structural features including en-echelon arrays of quartz veins and intense recrystallization and sub-grain development textures are consistent with vein formation and gold deposition syn-kinematic with the host shear zones. The mineralized, central-shear quartz veins, and the associated strong stretching lineation affirm vein formation amid stress build-up and stress relaxation of an enduring oblique convergence (assigned as Najd-related sinistral transpression; ~640–610 Ma). As the main outcome of this research, we present a priority map with zones defined as high potential targets for undiscovered gold resources.
1. Introduction
Remote-sensing applications and the recently made free-of-charge or low-cost satellite data boosted scientific research and helped the industry to understand features controlling mineral resources. The ideal cases are areas uncovered by vegetation and characterized by arid or semi-arid atmospheric conditions. The Nubian Shield is a typical example of well-exposed crystalline basement rocks with historically known resources, i.e., gold and copper. The South Eastern Desert (SED) terrane, a part of the Nubian Shield, is underlain by Neoproterozoic crystalline rock belts of mainly dismembered ophiolites, island arc metavolcanic/metasedimentary rocks, and less abundant poorly dated gneissic and schistose metasedimentary rocks. The tectonic build-up of the SED terrane was mainly shaped during the final assembly of East- and West-Gondwanas [1,2,3]. Accretion-related structures document two principal episodes of shortening at ca. 715–700 Ma and 685–665 Ma [4]. Deformation was initiated by northeast (NE)–southwest (SW) pure shear and progressed to simple shearing along the east-northeast (ENE)–west-southwest (WSW) direction. The first event is expressed by SW-verging intrafolial tight and overturned folds and thrusts, while the second event is documented by NW–NNW-trending large-scale open folds, piggyback thrusts strongly segmented by N–S and NW–SE to WNW–ESE sinistral strike–slip faults [5]. The SED terrane encompasses three major structural systems, namely the NW–WNW-trending Allaqi-Heiani suture, N–S Hamisana zone, and NW–SE Wadi Hodein–Wadi Kharit shear corridor (Figure 1) [1,2,6,7]. Deformation along the Wadi Hodein–Wadi Kharit shear corridor includes sinistral shearing and northwest-directed thrusting, extension, and tectonic escape, collectively resulting in a dominant northwesterly structural trend. The latter is considered the western extension of the Najd fault system in the Arabian Shield into the Nubian Shield [8].
Several gold occurrences are located in the SED terrane, mostly along second- or third-order shear zones assigned to as post-accretionary structures (Figure 1) [9,10]. The gold–quartz veins and related hydrothermal alteration halos in the SED occur in distinctive geologic/structural settings [10], namely (i) steeply or moderately dipping silicified, carbonated brittle–ductile shear zones between allochthonous listvenized ophiolitic blocks and island arc-metavolcanic and metasedimentary rocks, i.e., where acid and intermediate dykes and flat extensional granophyre dykes are abundant (e.g., Hutit, El-Beida, and El-Anbat deposits), (ii) steeply dipping anastomosing ductile shear zones wrapped around or cutting syn- or late-orogenic granitoid intrusions (e.g., Korbiai, Madari, Romite, Egat), and (iii) in ductile shear zones in highly deformed ophiolitic or island arc terranes cutting locally carbonaceous pelitic or volcanogenic metasedimentary rocks (e.g., Um El-Tuyor, Betam, Seiga, Shashoba, Um Garayat, and Haimur).
In the Wadi Rahaba–Wadi Beitan area, auriferous quartz veins are controlled mainly by NNW–SSE shear zones, but gold occurrences along the ENE–WSW or NE–SW fault/fractures zone are also less commonly observed. Generally, gold occurrences in the Wadi Rahaba–Wadi Beitan area are small-scale, with a few mineralized quartz veins that are generally < 100 m long. However, shafts, dumps, buildings and leaching basins left behind by ancient miners refer to extensive mining activities.
Band combination and false color composite (FCC) images are used in geological applications based on known optical and Synthetic Aperture Radar (SAR) characteristics in specific wavelength regions [11,12,13,14,15,16,17,18,19,20,21]. The satellite imagery spectral data used for mineral exploration span the visible to infrared regions. As hydrothermal alteration is a typical associate with hydrothermal mineral deposits, mapping or detecting the hydrothermal alteration zones is a prime focus of mineral exploration programs using the remote-sensing data. Most of the hydrothermal alteration mineral species have distinctive features in the shortwave infrared (SWIR) region, making the Advanced Spaceborne Thermal Emission and Reflection Radiometer (ASTER) and Landsat-8 Operational Land Imager (OLI) sensors important free-of-charge data sources for mineral mapping, particularly in arid geographical regions. Several techniques developed for the analysis of the SWIR data include band-rationing (BR), principal component analysis (PCA), the relative absorption band depth (RBD), and the spectral mineralogical indices that are proven effective in lithological and hydrothermal alteration mapping if integrated with field data [22,23,24,25,26,27,28,29,30,31].
The Phased Array Type L-Band Synthetic Aperture Radar (PALSAR) acquires data in the quad mode, i.e., horizontal-horizontal (HH), horizontal-vertical (HV), vertical-horizontal (VH), and Vertical-Vertical (VV). Also, a European radar imaging satellite Sentinel-1 is equipped with a synthetic aperture radar (SAR-C). The band math operator and directional filtering are used to generate backscatter images from SAR data, where the resultant images serve as a suitable data source for manual and automated techniques [32,33]. Extraction of structural lineaments from satellite-based imagery data is accomplished using edge enhancement, directional filtering, and manual digitizing techniques [34,35]. The automatic lineament extraction (ALE) technique is done using software algorithms, i.e., Canny Edge Detection [36]. However, the reference of the trustworthiness of the ALE with this algorithm is the manual extraction of lineaments that are verified by fieldwork.
The present work examines the spatial relationship between gold mineralization and structural elements, providing a meaningful hypothesis in relating gold metallogeny to the structures and evolution of the SED. Lithological and structural mapping is based on integrated field, microscopic, and multi-sensor imagery data (Landsat-8 OLI, ASTER, PALSAR, and Sentinel-1). Interpretations of the outcrop-scale and microscopic-scale structural elements are detailed herein to provide valuable information about the known occurrences for the sake of promoting the determination of new exploration targets along the regional structures.
2. Geologic Setting
The Wadi Beitan–Wadi Rahaba area comprises two major lithologic units: (1) autochthonous gneisses and migmatites in the west, and (2) allochthonous ophiolitic mélange and island arc-metavolcanic assemblage rocks in the east (Figure 2). The gneissic rocks are mainly hornblende–biotite granodiorite gneisses. They are light gray, coarse-grained, with feldspar and quartz as the main constituents in addition to less common hornblende, biotite, and garnet. Regionally, these gneisses are affected by extensive stromatic migmatization and show a well-developed banding. The ophiolitic mélange rocks (admixed serpentinite, metabasalt, chert, and carbonaceous metasedimentary rocks) occupy the central part of the study area as two elongated NNW-trending thrust sheets separated by a belt of island arc-metavolcanic/metavolcaniclastic rocks. The regional foliation generally strikes NW–SE and dips to the NE or to SW at moderate angles.
The ophiolitic mélange and arc assemblages are intruded by gabbro–diorite, granodiorite, and younger gabbro/granite, and also dissected by later dykes, quartz veins, and plugs. The gabbro–diorite intrusions are heterogeneous in composition, commonly of diorite, foliated with minor folds at their peripheries. The mylonitized syn-tectonic granodiorite is confined to the gneisses/ophiolitic mélange contact in the western part of the study area. They exhibit a well-developed mylonitic foliation, and are composed essentially of stretched orthoclase and quartz porphyroclasts, set in a fine- to medium-grained sheared matrix of orthoclase and quartz with a lower percentage of plagioclase and mafic minerals. The post-tectonic granites are common in the eastern part of the study area, but also exposed as dispersed blocks in the southwestern part (Figure 2). These rocks vary from buff and white coarse-grained granite to pink, fine-grained aplitic leucogranite.
The Wadi Hodein area is 20 km west of the Red Sea coast in the SED and is occupied by a Neoproterozoic greenstone belt of variably deformed ophiolite and island arc-volcanic/plutonic rocks. These metamorphic rocks are intruded by syn-tectonic granites and late- to post-tectonic gabbros and granites. Moreover, the Neoproterozoic rocks are unconformably overlain by Cretaceous sandstones and intruded by Tertiary basalt [38]. The ophiolite rocks (serpentinite, metagabbro, and less common pillow metabasalt) form discontinuous NW–SE-trending sheets (10–20 km in length) overthrusted on the island arc-metavolcanic/volcaniclastic rocks along steeply east-dipping thrust/strike–slip fault structures. Serpentinite and talc–carbonate rocks form large NW–SE-trending elongated masses. Moreover, small elongated slices (<100 m) of highly sheared serpentinite and talc–carbonate schist are tectonically incorporated within the island arc-metavolcanic/volcaniclastic terrains [1,39,40]. The island arc-metavolcanic/volcaniclastic assemblages form NNW–SSE- and NW–SE-trending belts of highly foliated and sheared basic–intermediate to acidic metavolcanic/volcaniclastic rocks [39,40,41,42].
Deformation history of the Wadi Hodein wrench includes multi-deformational stages D1–D4 [38,40,42,43,44]. The early NNE–SSW crustal shortening (D1) led to the creation of WNW–ESE tight intrafolial or overturned folds (F1) and axial planar foliations (S1) parallel to the primary (lamination) bedding (So) of the island arc-metavolcanic/volcaniclastic rocks. The second event (D2) involved subsequent sinistral transpression along thrust segments at the base of the ophiolitic blocks and formed steeply dipping, left-lateral NNW–SSE ductile shear zones and major faults that deformed most of the exposed lithologies. Macroscopic and mesoscopic NNW–SSE folds (F2), verging commonly to the WSW, are associated with pervasive axial planar crenulation cleavage (S2) in the metavolcanic/volcaniclastic rocks.
Gold-bearing quartz lodes are commonly observed where S2 is superimposed on S1. Finally, during the youngest deformational stage, a weak brittle deformation led to ENE–WSW dextral strike–slip faults cutting across the syn-orogenic granodiorite and pre-existing rocks. The brittle deformation event might be attributed to the Red Sea rift [42].
3. Remote-Sensing Data Processing
3.1. Data Characteristics and Methods
Fusion of satellite optical and microwave data is applied herein for comprehensive lithologic mapping and geological structures to inspect the regional and mine-scale setting of gold mineralization in the study area. The ASTER data (Table 1) cover a wide spectral range of 14 spectral bands, measuring reflected radiation in three bands between 0.52 and 0.86 μm (visible-near infrared, VNIR) with 15-m resolution, and six bands from 1.6 to 2.43 μm (shortwave Infrared, SWIR) with 30-m resolution. The emitted radiation is measured at 90-m resolution in five bands through the 8.125–11.65-μm wavelength region (thermal infrared; TIR). The ASTER standard data also include topographic information digital elevation models (DEM) [28]. The Landsat-8 OLI data comprise nine spectral bands from which seven bands measure the reflected VNIR and SWIR radiation with 30-m spatial resolution for bands 1–7 and 9, while the panchromatic band 8 has 15-m resolution. The ultra-blue band 1 is operative in coastal and aerosol targets, whereas band 9 is valued for cloud detection. The TIR bands collects two thermal bands (10 and 11) that measure the emitted radiation through the 10.6–12.5 μm wavelength region (TIR) with 100-m spatial resolution [29]. The applied projection method for the ASTER and Landsat-8 OLI/TIRS data is UTM (Universal Transverse Mercator), Zone N36 according to the WGS-84 datum.
In this study, subsets of cloud-free level 1B ASTER (AST_L1B_ 00312252006082422, acquired on 25 December 2006) and cloud-free level 1T OLI (Terrain-corrected, LC81730442019067LGN00, Path 173/Row 44, acquired on 8 March 2019) VNIR–SWIR data were processed using the ENVI software, version 5.1, provided by ITT Visual Information Solutions (now Exelis Visual Information Solutions). The spectral response curves of some selective minerals, acquired from U.S. Geological Survey spectral library [45], were employed to evaluate the diagnostic spectral features of rock forming minerals and assess lithological mapping and delineating the major mylonitic zones.
The active synthetic aperture radar (SAR) data were integrated with ASTER and ASTER–GDEM (global digital elevation model) data for structural enhancement, lineament extraction, and mapping of major fault/shear zones controlling the distribution of gold occurrences in the study area. The microwave SAR data are an important source of professional data used for mapping of geological structures [46]. The PALSAR sensor is an L-band SAR, with fully polarized (HH, HV, VH, and VV) and multi observation modes (fine, polarimetric, and ScanSar) with 10-, 30-, and 100-m spatial resolution, respectively [47,48]. The C-band SAR sensors of Sentinel-1 satellites have a dual-polarization (co-polarized VV or HH, and cross-polarized VH or HV), interferometric wide-swath (IW) mode and a spatial resolution of 5 × 20 m [49]. Subsets of Fine Beam Dual (FBD) HH + HV polarization, level 1.5 ALOS_PALSAR scenes (ALPSRP075090450 and ALPSRP077570445, acquired on 22 June and 9 July 2007, respectively) and Sentinel-1B data (S1B_IW_GRDH_1SDV_20180712t033727-20180712t033752, acquired on 12 July 2018) were processed for lineament extraction and structural mapping in this study.
Methods applied for rigorous analysis of the SWIR data include band-rationing (BR), principal component analysis (PCA), independent component analysis (ICA), and the relative absorption band depth (RBD). Ninomiya’s mineralogical indices were also used to effectively help in lithological and hydrothermal alteration mapping, integrated with fieldwork data (Figure 3) [22,23,24,25,26,27,28,29,30,31]. Adaptive filtering, band math, PCA, and directional filtering were applied to PALSAR and Sentinel-1 data for lineament extraction by manual and automated means. The latter was achieved though edge enhancement of the microwave data using the LINE extraction algorithm tool in the PCI-Geomatica software package (version 2017). The LINE algorithm includes edge detection, thresholding, and curve extraction [36,50,51]. The algorithm merges pairs of facing and close parallel polylines controlled by defining specific parameters. The final polylines could be exported as a vector layer and imported into the ArcGIS environment. Figure 3 illustrates the flowchart and techniques applied for the different data types in this study.
3.2. Pre-Processing of Satellite Data
Removing the atmospheric effects is an important pre-processing step needed for qualitative and quantitative analysis of surface reflectance data [52,53]. The atmospheric correction involves re-scaling and conversion of the radiance data collected by optical sensors to surface reflectance data; therefore, the obtained reflectance spectra can be calibrated directly with the standard reflectance spectra collected in the laboratory and field. In the present study, the FLAASH (fast line-of-sight atmospheric analysis of spectral hypercube) algorithm was employed for the atmospheric correction and reflectance conversion of Landsat-8 OLI and ASTER VNIR–SWIR data [54]. The VNIR and SWIR bands of ASTER and OLI sensors were subjected to radiometric calibration, layer-stacked, and re-sampled to 30-m spatial resolution. The fast line-of-sight atmospheric analysis of spectral hypercubes (FLAASH) algorithm [54] was then applied to the radiometrically calibrated radiance data with the band interleaved by line (BIL) format. Thermal atmospheric correction and emissivity normalization parameters were applied to the TIR bands.
The side-looking architecture of the microwave SAR sensors resulted in foreshortening, layover, and shadowing as the main distortions in the SAR images [55,56]. Foreshortening is predominant in the elevated mountainous geographic terrains, especially if the side-looking architecture is steep and the mountains slant toward the sensor. Layover occurs in the terrains of sufficiently steep slopes, where the layover zones appear with bright tone. Shadows in the SAR images occur as dark regions tarnished by thermal noise. In this study, such distortions were minimized by applying ortho-rectification of SAR subsets using the 12.5-m digital elevation model (DEM) of ALOS–PALSAR data. The SAR images are commonly corrupted by speckles that diminish the differentiation ability between objects and reduce the accuracy of feature extraction. In this study, we applied Lee adaptive filtering to the PALSAR and Sentinel-1B data to remove the radar speckles while preserving edges, lineaments, and structural features. The Lee filter enables smoothing of the speckled data based on statistics computed in filter windows, where the calculated pixel values replace the original pixel values using the surrounding pixels [57,58].
3.3. Optical Data-Based Lithological Mapping
3.3.1. Band Ratios and Relative Absorption Band Depth
Band-rationing, a powerful image processing technique, enhances the spectral variations between surface materials and highlights target anomalies, while suppressing some information such as the difference in albedo and topographic slope effects [59]. Band ratios are mathematical transformations in which the digital numbers (DN) of one band are divided by those of another band. They signify differences between DN values of diagnostic reflectance and adsorption features in the spectral bands. The relative absorption band depth (RBD) is a useful three-band math transformation in which the sum of the two shoulders having reflectance maxima is divided by the third band including the absorption feature minima [31]. Accordingly, this technique typifies the relative absorption depth of absorption peaks, and is utilized commonly for identifying rock-forming minerals that have diagnostic Fe, Mg-OH, and CO3 absorption features. The OLI-band ratios (6/7, 6/2, 5/6, 4/2, 6/5 × 4/5) and the ASTER–RBD (6 + 9/8, 5 + 7/6, 6 + 9/82, 5 + 7/62) values were processed to improve the identification of the Fe, Mg-OH, Al-OH-bearing, and carbonate rocks in the study area.
The OLI-band ratio 6/7 (1.61/2.20 µm) is equivalent to the ASTER-band ratio 4/6 (1.656/2.209 µm) and the Enhanced Thematic Mapper (ETM)-band ratio 5/7 (1.65/2.22 µm) analyzed for CO3 and OH-bearing minerals [28,60,61,62]. The grayscale image of this ratio brings out clay minerals, serpentine, and many alteration zones with a bright image signature (Figure 4A). The OLI-band ratio 6/5 (1.610/0.865) coincides with the ASTER-band ratio 4/3 (1.656/0.807 µm) and the ETM-band ratio 5/4 (1.650/0.825 µm). This ratio converts the ferrous iron (Fe+2)–silicate-bearing minerals (i.e., olivine and pyroxene) into bright pixels and clearly distinguishes the mafic from non-mafic rocks [62,63]. The OLI-band ratio 4/2 (0.6550/0.4825) approaches much of the ASTER-band ratio 2/1 (0.661/0.556 µm) and the ETM-ratio 3/1 (0.6600-0.4825 µm) that are used to highlight rocks rich in hematite [61]. The FCC image of three OLI-band ratios (6/7 in red (R), 6/5 in green (G), 4/2 in blue (B)) was used to characterize the mixed serpentinite, quartz–carbonate (listvenite), and talc–carbonate schist in yellow and reddish pixels (Figure 4B). The highly tectonized metavolcanic rocks and carbonaceous metasedimentary rocks appear in purple and lemon colors, respectively. The island arc-metavolcanic and metavolcaniclastic rocks appear as dark-green pixels, while granitic rocks exhibit a bluish-green spectral signature. The FFC OLI-band ratio image (R: 6/7, G: 6/2, B: 6/5 × 4/5) highlights the talc–carbonate schist, serpentinite, and graphite-bearing metasedimentary rocks as rose, red, and magenta pixels, respectively (Figure 5A). This image enables the distinction between mafic rocks as blue pixels and felsic rocks as green ones. The ASTER-based RBD (6 + 9/82) image (Figure 5B) and (7 + 9/8) image (not shown) intensify the spectral signature of amphibole, chlorite, and other Fe–Mg-OH-bearing minerals and show them as bright pixels, whereas the RBD (5 + 7/6) discriminates the Al-OH-bearing silicate minerals, i.e., muscovite, sericite, and kaolinite, commonly described for altered felsic rocks.
3.3.2. Mineralogical Indices
The spectral mineralogical indices are reflectance combinations of two or more spectral bands signifying the relative abundance of target objects. Accordingly, the spectral indices of rock-forming minerals are mathematical expressions and band ratios used to facilitate the mapping of lithology and hydrothermally mineral alteration zones. Using the six ASTER–SWIR bands, four spectral mineralogical indices (OH-bearing mineral index, OHI; kaolinite index, KLI; alunite index, ALI; calcite index, CLI) were developed by Ninomiya [64] for mapping the hydrothermally altered zones and mineral anomalies. The OHI is calculated as (band 7/band 6) × (band 4/band 6), the KLI is developed by way of (band 4/band 5) × (band 8/band 6), and the ALI is formulated as (band 7/band 5) × (band 7/band 8), while the CLI is calculated as (band 6/band 8) × (band 9/band 8). Three spectral indices using ASTER TIR bands (quartz index, QI; carbonate index, CI; mafic index, MI) were advocated to facilitate the mapping of quartz, carbonate, and mafic–ultramafic rocks [65]. New spectral indices (Fe-mineral index, Fe-MI; Al-OH-bearing mineral index, Al-OH-MI; Fe–Mg-OH-bearing mineral index, Fe-Mg-OH-MI) were developed to evaluate the abundance of iron oxide/hydroxide minerals, Al-OH, CO3, and Fe–Mg-OH-bearing alteration minerals [21]. For the Landsat-8 VNIR–SWIR data, the Fe-MI is calculated as (band 6/band 5) × (band 4/band 3), and the Al-OH-MI as (band 6/band 7) − (band 4). For ASTER VNIR–SWIR data, the Fe-MI is calculated through (band 4/band 3) × (band 2/band 1), the Al-OH-MI by means of (band 5) × (band 7/band 6), and the Fe-Mg-OH-MI as a result of (band 7) × (band 9/band 8). In this study, the QI, CI, and MI of Ninomiya et al. [65] and the Fe-Mg-OH-MI of Pour et al. [21] were processed using the ASTER SWIR–TIR bands. A better differentiation between the mafic and non-mafic rocks was attained by the MI and QI grayscale images, while the ultramafic rocks and associating carbonate and Fe–Mg-OH-bearing alteration zones were clearly differentiated in the grayscale images of CI and Fe-Mg-OH-MI (Figure 6A,B).
3.3.3. Principal and Independent Component Analyses (PCA and ICA)
The loading of Operational Land Imager (OLI) and ASTER multispectral data is attained to reduce dimensionality of correlated data and suppress the redundant information [66]. The resultant principal components are subjected to a nonlinear band generation method of the ICA transformation for finer classification and to remove correlation and detect the self-determining components. The eigenvector loadings of principal component 1 (PC1) show high contributions (0.480 and −0.490) for the ASTER relative band depth (6 + 9)/82 and Fe-Mg-OH MI, respectively (Table 2). The PC2 loadings indicate strongly negative contributions (−0.618 and −0.746) for the QI and relative band depth (5 + 7)/6, respectively, while PC3 shows highly positive loading (0.691) for the OLI-band ratio (5/6). The eigenvector loadings of PC5 show strongly positive (0.631) and negative (−0.596) contributions for the OLI-band ratios (5/6) and (6/7), respectively. The RGB composite combination of PC5, PC2, and PC3 distinguishes the undifferentiated mafic metavolcanic rocks of Wadi Rahaba from the felsic/mafic island arc metavolcanic rocks of G. El-Urga.
The PC5, PC2, and PC3 image highlights the post-tectonic granites of Wadi Rahaba, and the granodiorite gneisses and migmatites of Wadi Beitan (Figure 7A). The ophiolitic serpentinite, talc–chlorite schist, and talc–carbonate altered zones appear as indigo blue and pink pixels, whereas chlorite–tremolite–actinolite schists and Fe-OH-bearing alteration zones appear as green pixels. The RGB combination of independent components IC3, IC1, and IC2 efficiently discriminates the gabbroic rocks and mafic metavolcanic rocks with light-blue and cyan image signatures, while the island arc-metavolcanic rocks and chlorite–amphibole-bearing schists appear as pink pixels (Figure 7B). The ophiolitic serpentinite, talc–chlorite schist, and talc–carbonate alteration zones have yellow signatures, and the stream sediments of Wadi Na’am and Wadi Beitan appear with a lemon image signature.
3.4. SAR Data-Based Lineament Extraction
The band math operator was used to generate backscatter images from the Sentinel-1B (VV + VH, VV − VH, VV/VH, VV + VH/VH, VV − VH/VH) and PALSAR (HH + HV, HH − HV, HH/HV, HH + HV/HV, HH − HV/HV) bands. The resultant images were statistically analyzed using the PCA transformation (Table 3 and Table 4). The PALSAR PC2 and Sentinel PC3 show the highest positive eigenvector loadings (0.894 and 0.810) for the subtraction and addition images (HH − HV and VV + VH, respectively). Meanwhile, the PALSAR PC3 has a strongly positive loading (0.874) for the addition image (HH + HV) and moderately negative loading (−0.448) for the subtraction image (HH − HV). In contrast, the Sentinel PC2 exhibits moderately positive loading (0.463) for the addition image (VV + VH) and highly negative loading (−0.653) for the ratio image (VV − VH/VH). The PALSAR PC4 and PC5 have highly negative eigenvector values (−0.761 and −0.805) for the ratio images (HH/HV and HH + HV/HV, respectively), while PC4 shows a strongly positive value (0.637) for the ratio image (HH − HV/HV). The Sentinel PC4 and PC5 have highly negative (−0.664) and positive (0.709) loadings for the ratio images (VV − VH/VH and VV/VH, respectively).
Because of its ability to outline structural lineaments, the backscatter PALSAR PC2 and Sentinel PC3 images were subjected to four directional filters (0°, 45°, 90°, and 135°) to enhance the linear features and realize the major structural trends (N–S, NE–SW, E–W, and NW–SE, respectively). Also, the false color composite images of PALSAR PC (PC2, PC5, and PC4), Sentinel PC (PC2, PC4, and PC3), and directional filters (90°, 135°, and 45°) were employed in RGB mode to improve the visualization of the extensive lineaments (Figure 8A,B). Using Coral Draw and ArcMap software, the structural lineaments were manually traced to produce a vector lineament layer. In the PCI Geomatica, the user-defined parameters (Table 5) of the ALE algorithm LINE were applied to the directional filters of PALSAR PC2 and Sentinel PC3 (Figure 9A,B). Hence, afterward, manual editing was carried out to improve the accuracy of lineament auto-detection by adding new or relocating existing segments.
The basic statistical parameters of extracted lineaments are shown in Table 6. The manually extracted lineaments have smaller count (691) and greater maximum length (11.96 km) compared to those of automated lineaments extracted from PALSAR (count = 6324, max length = 3.78 km) and Sentinel-1 (count = 7062, max length = 3.47 km). The manually and automatically extracted lineaments were imported as data layers to the ArcMap environment, and the lineament density maps were, thus, generated using the line density module in the spatial analyst toolbox (Figure 10A,B). The manually extracted lineaments are overlain on the directionally filtered FCC images (R: 90°, G: 135°, B: 45°) of the Sentinel-1B PC3 (Figure 11A) and the automatically extracted lineaments on the directionally filtered PALSAR PC2 FCC (R: 90°, G: 135°, B: 45°) image (Figure 11B). The comparison weighs the manually extracted and directionally filtered Sentinel-1B results.
4. Gold Occurrences
In this section, details of the significant gold occurrences in the study area are given. Aside from the comprehensive description of the geological setting of each of the gold occurrences, a pivotal emphasize is given to the deformation fabrics exhibited by the mineralized quartz veins and the structural elements observed in the mine areas and at the regional map scale.
4.1. Um Eleiga Gold Deposit
The Um Eleiga area, ~45 km west of the Red Sea coast, hosts a historic gold deposit in the SED. The gold mine lies along the NNW–SSE-trending Wadi Um Eleiga (Figure 12A), where traces of placer mining and shallow pits, dumps, ancient mining camps, stone anvils, hammers, and grinding date back to the Roman–Byzantine and early Islamic times [67,68,69]. Gold contents in quartz dumps collected from shallow pits grade as high as 28 g/t [69], whereas the fine-grained alluvium at the base of the Wadi deposits/terraces yield anomalous concentrations of up to 36 g/t Au [40,70].
The Um Eleiga mine area is hosted by an elliptical, zoned intrusive complex (ca. 32 km2) encompassing quartz–gabbro, diorite, tonalite, and granodiorite (Figure 12A). The intrusive complex cuts through allochthonous ophiolitic blocks of serpentinite–chromitite (Gebel Abu Dahr) embedded in a highly tectonized matrix of pelitic and carbonaceous metasedimentary and metavolcanic rocks (see Figure 5A and Figure 7A). The different rock varieties in the complex are separated from each other by gradational contacts. WNW-, NNW-, and N-trending fault/fracture sets densely dissect the complex. The central part of the complex features olivine-, pyroxene-, and/or hornblende-rich gabbros, whereas diorite surrounds the gabbroic core and locally shows a distinct porphyritic texture. Tonalite and granodiorite form the outer parts of the complex. A small body of albitized microdiorite and sets of lamprophyre and andesite dykes cut the western parts of the complex. In the eastern part, the highly tectonized gabbro and diorite contain intensely kaolinitized and oxidized zones in which massive and disseminated goethite, malachite, and azurite are abundant.
The mineralized quartz veins trend mainly NE–SW or ENE–WSW and cut the gabbroic rocks in the central part of the complex and extend beyond the gabbro–diorite boundary (Figure 12B). A later barren generation of N-, NW-, and E-trending quartz veins are restricted to fault intersections and tension gashes in the highly deformed gabbroic rocks. Zoheir et al. [71] suggested that fault/joint intersections are the main structural control of intensely hydrothermal alteration zones and high gold contents in the central part of the Um Eleiga complex. The E-trending fractures cutting the gabbroic rocks are locally associated with chlorite–calcite and chalcedonic quartz alteration assemblage. Sulfide-bearing quartz veins (5–40 cm thick) cutting the gabbro–diorite complex are scarce, and cannot be compared with the extensive old workings. It is herein considered that the old miners worked quartz veins, scattered quartz blocks, and the friable wadi alluvium underneath the consolidated terraces. These milky quartz veins have brecciated borders in which quartz fragments are cemented by chalcedonic quartz, calcite, chlorite, and sulfides (Figure 12C).
Gold-bearing quartz dumps enclose chlorite–sericite–calcite selvages and pyrite–malachite–limonite gossans (Figure 12D,E). The main ore minerals are pyrite, chalcopyrite, sphalerite, pyrrhotite, and gold. Pyrrhotite and sulfarsenide form scarce primary inclusions, whereas pyrite, chalcopyrite, sphalerite, and free gold are late in the paragenetic sequence. Pyrite forms disseminated euhedral to subhedral grains with pyrrhotite inclusions. Chalcopyrite and sphalerite are intergrown with subhedral pyrite grains and also occur as inclusions in pyrite grains. Free-milling gold blebs and specks occur along fine ribbons and selvages of wallrock enclosed in the quartz veins. Hydrothermal alteration phases associated with gold–sulfide quartz veins include fine-grained quartz, chlorite, calcite, sericite, rutile, and sulfides. These hydrothermal minerals are clearly late relative to the igneous paragenesis of the host zoned intrusion. Pyrite, chalcopyrite, and sphalerite are disseminated in domains of pervasive quartz–sericite–chlorite alteration.
4.2. Hutit Gold Occurrence (Also Known as Huzama or Rahaba Mine)
The Hutit gold occurrence lies between the head of Wadi Huzama and Wadi Hutit, a small tributary of Wadi Rahaba (Figure 13A). The mine area is occupied by conspicuous, high to moderately elevated hills of serpentinite, mafic metavolcanics, and pelitic/psammopelitic metasedimentary rocks. Old mining in the area dates back to the early 20th century, but millstones from diorite and gabbro point to old workings, possibly from the Islamic times (seventh to eighth century). Recently, exploration mapping, structural survey, rock chip, and trench sampling, complemented by a ~30,000-m diamond core drilling program completed by Thani Ashanti (now Thani Stratex Resources Ltd.) between 2009 and 2013, indicate an in-house, non-Joint Ore Reserves Committee Code (non-JORC) resource estimate of ~0.5 Moz gold (http://thanistratex.com/projects/projects-overview/).
The old miners extracted the ore bodies from two main (northern and southern) mines. The mine area was mapped at the 1:1000 scale and the mine area was subdivided into northern and southern [69]. Abundant remains of grinding and separation plants are observed in the northern mine (Figure 13B). Nevertheless, the preserved crusher stages, leaching basins, and loading station in the southern mine reflect significant mining activities in the past. In both mines, a main entrance through a horizontal ~E–W adit leads to the veins at a distance of 20 or 35 m.
The gold-bearing quartz veins occur along the contact between elongate allochthonous serpentinite masses and successions of intercalated metavolcanic and metasedimentary rocks. Field criteria indicate that these rocks are tectonically intermixed and intercalated with graphite-bearing schists forming a distinct mélange unit, in which serpentinite blocks are embedded. Contacts between the serpentinite blocks and the underlying rocks are zones of intensive shearing, grain size reduction and abundant talc-, quartz-, and carbonate- rich rocks. Serpentinite is composed essentially of antigorite, relict olivine, subordinate talc, calcite, tremolite, and minor chromite and magnetite. In the sheared horizons, no relics of olivine or pyroxene are found, where the rocks are composed mainly of antigorite and talc. Blocks of ophiolitic metabasalt and metagabbro are embedded in the sheared matrix and stretched parallel to the NW–SE foliation (Figure 13B).
Alternating mafic metavolcanic and metasedimentary rocks prevail in the northern mine. The mélange rocks are characterized by moderate to high deformation, especially in proximity to the large faults. The elongation of clasts within the mélange matrix locally defines a moderately north-northwest plunging lineation. The metavolcanic rocks are mainly dark-colored, foliated, and slightly or intensively contorted. These rocks occupy the western part of the mine area and form an NW–SE-trending belt. The intact massive blocks of these rocks assume basaltic and ultramafic protoliths (Figure 13C,D). The schistose varieties are mainly tremolite–actinolite and chlorite schists. They are intercalated locally with bands of metasedimentary rocks (i.e., metasiltstone and metamudstone), composed essentially of chlorite ± biotite, epidote, and quartz. These schistose rocks are graphite-bearing, especially in the northern part of the mine area.
An NNW–SSE elongate intrusion of gabbro cuts into the tectonized serpentinite in the northern mine. Small masses of micro-granodiorite dyke-like bodies (NW–SE), and dykes with different compositions cut the country serpentinite, metavolcanic, and gabbro rocks in the northern mine. Most of the dykes strike NW–SE, but a small number of the mafic dykes are NE-trending. Rhyodacite, dacite, and andesite dykes are generally porphyritic with tabular plagioclase and rhombic hornblende, embedded in a fine- to very fine-grained groundmass. The mafic dykes, mainly basalt to basaltic andesite, are notably abundant in the northern mine.
NW–SE thrust segments bound the ophiolitic serpentinite masses and dip moderately or steeply to the NE. Emplacement of the serpentinite slices is interpreted as being from east to west, constrained from moderately to steeply east-northeast dipping shear planes and consistently NW-trending stretching lineation, generally consistent with the W-directed tectonic transport of ophiolitic rocks in Wadi Ghadir area, north of the present study area [7]. A kilometer-scale shear zone striking in an NW-SE direction is superimposed on the thrust zone and related fabrics. Analyzing the shear planes, asymmetrical fabrics, and slickensides indicates that this shear zone is a reverse fault zone (Figure 14A), which accommodates a left-lateral displacement. Although nearly parallel to the thrust segments, this shear zone dips steeply to the west (Figure 14B). Conjugate joints and faults are common in the northern mine. Fractures in the country rocks follow two main trends, N 40° E and N 50–60° W. No direct cross-cutting relationship was observed between the quartz veins and dykes.
The mineralized quartz veins occur along a 150-m-wide shear zone, where quartz veins have anastomosing and undulating morphologies, both down-dip and along the strike. The shear zone, quartz veins, and associated hydrothermal alteration overprint the metamorphic mineral assemblage and fabrics in the host metavolcanic and serpentinite rocks. Two types of gold-bearing quartz veins are reported in the mine area, including bluish-gray and milky quartz veins. In the northern mine, a 180-m-long bluish-gray quartz vein varies in thickness from less than 30 up to 150 cm [69]. It strikes parallel to the shear zone (NW–SE) and dips 80° SW in the northern mine. This vein is made up mainly of gray quartz, carbonate, and subordinate colorless quartz and rare sulfides. The main entrance, along an adit from east to west, was used to work out this vein. A milky quartz vein of 20–50 cm thickness and 90 m length occurs in the vicinity of the main quartz vein. The bluish quartz veins are common in the northern mine, whereas milky quartz veins are rather dominant in the southern mine. The banded appearance of the bluish quartz veins (Figure 14C) and their association with intensively altered host rocks, with abundant signs of strain and the absence of gashes and tensional gaps, suggest that these veins were formed under a compressional stress regime through formation of the shear zone. Asymmetric bent quartz lenses (Figure 14E) provide signs of left-lateral shearing, but sub-vertical slickensides along the vein walls also corroborate the reverse nature of the shear zone. Field observations indicate that the milky quartz veins are younger than the bluish-gray quartz veins, on the basis of cross-cutting relationships (Figure 14F).
The bluish-gray quartz veins are surrounded by carbonated, ferruginated, and less commonly kaolinitized wallrocks. The milky quartz veins in the southern mine are commonly surrounded by sericite–chlorite and less commonly epidote where they cut through metavolcanic rocks. In both types of quartz veins, signs of plastic and brittle deformation are abundant. Sub-grain development is the most characteristic feature of zones where the quartz veins are narrow and branchiate. Ribbon-shaped grain formation and less commonly mortar texture are also observed in the quartz veins. All interstitial quartz grains show undulatory extinction, deformation bands, and minor development of tiny equidimensional recrystallized grains around grain margins.
The mineralogy of the quartz veins also includes arsenopyrite, pyrite, and less commonly gold. Both arsenopyrite and pyrite are usually altered into goethite. In this case, appearance of tiny gold, streaky or wire-like particles along the rhythmic zones of goethite is common. This indicates that oxidation led to remobilization of structure-bound gold from pyrite and arsenopyrite to form native gold in secondary sites. Data concerning the ore grade include fire assay concentrations of some samples from the grayish and milky quartz veins. Gabra [70] reported 1–40 g/t in quartz veins from the northern mine and 1–36 g/t in samples from quartz veins intercalated with sheared rocks in the southern mine. Takla et al. [72] analyzed samples from the two different types of quartz veins and reported an average of 20 g/t. They also investigated the hydrothermal alteration zone for its gold content and indicated that the adjacent altered wallrocks contain 8 g/t Au on average [72].
4.3. Um Teneidab Gold Mine (Also Known as Um Kalieb or Um Kalieba Mine)
The Um Teneidab mine is situated 3 km west of Gebel Um Teneidab and 13 km southwest of the Hutit mine. The Um Teneidab mine area is underlain by gabbroic rocks that are cut by abundant offshoots of fine-grained granite (Figure 15A). The contact between granite and the gabbroic host rocks is irregular and sharp (Figure 15B). The area was mapped at the 1:1000 scale and these rocks are assigned as metagabbro–diorite and late-orogenic granite [69]. Takla et al. [72] discussed the features in detail, implying that these rocks belong to the younger gabbroic rocks of the Egyptian basement complex. In the present work, we agree with Hassan and El-Manakhly [69], and classify the gabbroic rocks in the mine area as an island arc-metagabbro–diorite complex. This interpretation is based on some local foliated textures, a corona texture with brown hornblende bounding hypersthene crystals, and presence of more differentiated bosses with diorite composition.
Chlorite is common as an alteration mineral after the ferromagnesian mineral constituents of the host gabbros. The granitic rocks are composed of andesine, orthoclase, quartz, and intensively chloritized biotite. Approaching the quartz veins, plagioclase is more or less completely replaced by sericite and kaolinite. Pyrite is most common as alteration mineral disseminated in the hydrothermally altered granite and gabbroic rocks. Alteration is pervasive where the tectonized gabbro is densely seamed with granitic offshoots.
Structurally, the Um Teneidab mine area is traversed by conjugate NW–SE and NE–SW fault sets. Faults with no obvious lateral displacement dissect the granite body and offshoots in the western part of the mine area. Stretching lineation and slickensides along the quartz vein walls suggest that the shear zone experienced also little ductile deformation (Figure 15C). Formation of this shear zone is attributed to the competence heterogeneity between coarse-grained gabbro and fine-grained granite. Granularity gives additional cohesion contrast that might proceed to a discontinuity zone or plane between these two different lithologies. Abundant quartz veins and felsic dykes are controlled by NW–SE shear/fault sets, but show no direct cross-cutting relations. Deformation is intense in zones where the granite offshoots traverse the gabbroic rocks.
Gold in the Um Teneidab mine area is related to a system of 10–40-cm-thick milky quartz veins extending for more than 200 m along a wrenched shear zone (Figure 15A). These veins are NW- or NNW-trending and are commonly sub-vertical. The main lode is a zone of stockwork of veinlets (70 cm wide) bounded by hydrothermally altered wallrocks forming together a ~2-m-wide mineralization zone. The granite is notably sericitized and silicified close to the quartz veins (Figure 15D). The latter are massive, composed of coarse-grained quartz crystals locally fractured and filled with newly formed quartz, characteristically colorless (less than 3-cm-wide veinlets).
Most quartz veins in the mine area, particularly the thin ones, are completely recrystallized. Porphyroclasts embedded in less recrystallized, mosaic-like, strain-free quartz are observed along the flanks of quartz veins. The quartz porphyroclasts are lensoid and show strong undulose extinction, deformation lamellae, and sub-grain development; they contain numerous fluid inclusions of various generations. The boundaries of the shears are sharp, and the sulfides are clearly confined to zones of shearing and alteration.
Gold is disseminated as flakes in altered pyrite, associated with galena or as fillings in the microfractures of the quartz veins. Gold is also present in the hydrothermally altered wallrocks, i.e., the altered granite (quartz–sericite rocks). Less commonly, relics of pyrite are seen disseminated in the quartz veins, whereas gold wires along rhythmic zones in goethite are accidently seen. Gold occurs as native globules disseminated in the quartz veins, mostly along the grain boundaries. The quartz veins contain from <1 up to 30 g/t gold, with an average of 8 g/t in the altered wallrocks [72].
4.4. Urga Ryan Gold Occurrence
The Urga Ryan gold occurrence is located 17 km SW of the Hutit mine, ~10 km west of Gebel Um Teneidab. The location is ca. 2.5 km south of the intersection of the E–W Wadi Hutib and the nearly N–S Wadi Urga Ryan along the main wadi. The area surrounding the Urga Ryan occurrence is underlain by island arc-metavolcanic rocks, dominated by metaandesite and epidote–chlorite schist (Figure 16A). The metavolcanic sequence is locally affected by a several kilometer-scale shear system that led to intense shearing in an NNW–SSE direction overprinting the WNW–ESE schistosity of the metavolcanic rocks. In the eastern part of the mine area, a large granitoid intrusion of granodiorite or quartz diorite composition cuts the metavolcanic rocks. The granitoid rocks are slightly foliated and tapered along the foliation in the metavolcanic rocks and enclose elongated enclaves parallel to the metavolcanic rock schistosity. The old mine workings are situated in a low hill terrane that is underlain by sheared metavolcanic rocks (Figure 16A) along the main Wadi Urga Ryan, whereas mine houses spread over many tributaries around the area, likely reflecting considerable mine activities. The mineralization is, however, limited to small locations, particularly where the shearing is intense and quartz lenses are abundant.
The mineralization is confined to a local NNW–SSE shear zone, which dips steeply to westward, cutting across the sheared metavolcanic rocks (Figure 16B). The main lode is composed of boudinaged quartz veins and lenses, ranging in thickness from less than 5 cm to 30 cm and extending along the strike for more than 40 m. The host shear zone exhibits features of brittle and ductile regimes manifested by mylonitization, asymmetric boudinaged quartz lenses, and partial recrystallization (Figure 16C). The sense of shear along this shear zone is derived from the lensoidal quartz pockets that point to a left-lateral movement concurrent with vein emplacement (Figure 16D). This observation suggests a spatial and temporal relationship between the shear zone and gold-bearing quartz veins.
The local dynamic recrystallization of the host metavolcanic rocks is assumed to have been strongly catalyzed by fluid flow through dilatant zones and promoted ductility-enhancing mineral reactions. These high-fluid-pressure features likely develop in rocks buried at great depths, indicating mesothermal conditions typical of orogenic gold deposits. In the mine area, hydrothermal alteration is confined to narrow zones of sheared wallrocks bounding the quartz veins and veinlets. The quartz veins gave a gold content ranging from 1–7 g/t [70].
5. Discussion
The ASTER and Landsat-8 OLI band ratio images showed the effective absorption features of the mafic rock-forming minerals and their metasomatic products. Carbonate minerals had diagnostic absorption features in the wavelength region 2.1–2.5 µm corresponding to the OLI-SWIR band 7 and ASTER–SWIR bands 6, 7, and 8. On the contrary, these minerals showed high-reflectance features in the wavelengths of OLI–SWIR band 6 and ASTER–SWIR band 4. Talc, antigorite, and other Mg-OH minerals showed diagnostic absorption responses at the wavelengths (1.39 and 2.3 μm) matching with the OLI–SWIR bands 6 and 7 and ASTER–SWIR bands 4 and 8. Such minerals exhibited strong reflectance through the wavelengths of OLI band 4 and ASTER bands 2 and 6. Kaolinite, muscovite, and other Al-OH-bearing minerals exhibited diagnostic absorption features within the wavelength range 2.1–2.2 μm equivalent to the OLI–SWIR band 7 and ASTER–SWIR bands 5 and 6. The diagnostic absorption features of Fe–Mg-OH-bearing minerals including amphiboles, chlorite, and epidote appeared through the wavelengths of ASTER–SWIR band 8, while their high-reflectance features were recorded within the ASTER–SWIR band 6. The OLI-band ratio (6/7), CI and ASTER–RBD (6 + 9/82 and 5 + 7/62) images were effective in discrimination of carbonate and clay-rich zones, talcous serpentinite, and highly tectonized Mg-OH-bearing rocks. Alternatively, the OLI-band ratio (6/5) and the mafic index (MI) were used to separate the mafic–ultramafic rocks from felsic rocks, while the RBD (6 + 9/8 and 7 + 9/8) and Fe-Mg-OH-MI were utilized to amplify the spectral signature of amphibole-, chlorite-, and epidote-bearing zones (Figure 4, Figure 5, Figure 6 and Figure 7).
The automated extraction technique produces short dense lineaments that are difficult to relate to tectonically significant structures. Dray valleys (wadis) along the weakness zones correspond to the major faults in the automated lineament extraction results, such as Wadi Hutib, W Urga Ryan, and Urga Atshan. These results are not necessarily accurate. The manual extraction of lineaments results in long lineaments corresponding to the major structures deforming the lithological units in the study area (Figure 9A). The line density map represents the number of lineaments per square unit area. The line density maps show a high concentration of lineaments in the central and northern parts, where the NW–SE and NNW–SSE structural trends dominate (Figure 10A).
Thresholding the resultant grayscale images from band ratios, RBD, and mineralogical indices allowed the extraction of representative pixels (regions of interest), which were converted into vector shape files and then added to the ArcMap environment. Finally, the extracted lineaments were laid over the vector data layers of ratios and mineralogical indices to engender a final semi-automated image on which the litho-structural relationships and the spatial distribution of gold occurrences and lineament intersections were best presented (Figure 17). The high deformation and fracturing zones bounding the sheared ophiolitic belt contain most of the shear-associated gold occurrences (see Figure 4A,B). Such zones are propitious features, indicating high probability of zone potential for undiscovered gold resources.
The Wadi Beitan shear zone (Figure 17) discriminates the gneissic granite and gabbro–diorite complex from strongly foliated metavolcanic and metavolcaniclastic rocks in the western part of the map area. Shearing along this zone is oblique with a high-angle dip component along moderately to steeply eastward planes and a left-lateral strike (lateral) component. Widespread shearing bands, pervasive sericite, and carbonate alteration are observed along this zone. Together with the Wadi Khashab shear zone further south, the Wadi Beitan shear zone is part of an extensive (~100-km-long) shear corridor accommodating several, although generally small-scale, gold occurrences. Quartz veins showing signs of ductile shearing are locally sulfide-bearing and are associated with green malachite alteration zones. The Wadi Rahaba shear zone is a steeply east-dipping left-lateral brittle–ductile shear zone separating tectonically mixed ophiolitic rocks from schistose island arc rocks. The ophiolitic and metavolcanic rocks on both sides of the shear zone show S-shaped fault–drag folds, consistent with the sinistral movement. The Hutit gold mine occurs along the Wadi Rahaba shear zone. The Bir Beitan fault is a steeply dipping, ESE-trending strike–slip fault, with local silicification and hydrothermal breccia zones. Hydrothermal brecciation and silica alteration are locally coinciding zones with disseminated sulfide and local malachite staining.
The NNW–SSE shear zones seem to have rather high potential for hydrothermal alteration and quartz veining where intersected by the extensive WNW–ESE shear zones (Figure 17). These shear zones accommodate a prominent sinistral displacement, measured 5 km farther south [42]. A good example is the location of the Urga Ryan occurrence. Younger ~E–W or ENE–WSW faults cut the regional structural trend and dislocate the lithologic boundaries with apparent dextral displacements of 1–2 km. The mixed kinematic shear sense indicators (sigmoidal lenses and stretching lineation) along the WNW–ESE faults may imply that early left-lateral shearing along these faults was obliterated later by a right-lateral displacement, or as a result of rejuvenation of shears antithetic to the master NNW–SSE sinistral shear zones.
Fusion of the field remote-sensing results indicates a prominent difference in the structural setting of gold occurrences. Occurrences confined to the main shear zones in the central parts of the shear corridor (i.e., Hutit and Urga Ryan occurrences) show abundant signs of plastic deformation and tinge with the main NNW–SSE shear trend. Gold occurrences in gabbro–diorite complexes (Um Eleiga and Um Teneidab) show a weaker association with shear zones, but occupy instead zones where shear splays fringe apart. The Um Eleiga and Um Teneidab occurrences are apparently controlled by the older WNW–ESE or NW–SE shear/fault zones that were later overprinted by the more prominent NNW–SSE shear zones. This could bear a temporal relationship suggesting that these two occurrences and other occurrences in identical settings predate the main shearing and the related gold occurrences. In other words, the spatial association revealed from the remote-sensing data and the structural observations during fieldwork may support the idea of gold introduction to the study area at different time episodes. The extracted mineral maps interpreted in terms of hydrothermal alteration and lithological controls on the gold mineralization emphasize the role played by the mylonitic zones (zones of finer grain size and carbonate and Fe-OH-mineral species) in controlling the distribution of the scattered gold occurrences in the study area. In accordance with this observation, we see that domains where the NW–SE and NNW–SSE shear/fault zones intersect are very likely zones of fluid focusing through the time of the shear system (Najd-related) development. Verification made through the mineralogical indices showed overlapping carbonate and hydrous minerals in such lineament intersection zones.
6. Conclusions
Fused satellite radar and radiometer data were integrated with comprehensive field studies of the gold occurrences in the Wadi Beitan–Wadi Rahaba area, supplemented by petrography of the quartz veins, highlighting the gold mineralization controlled by kilometer-scale shear zones. Field and microscopic investigations revealed that most of the mineralization occurs in the central-shear quartz veins within the main shear zone and are associated with strong stretching and mylonitic lineation in the wallrock. These features and the S-folded quartz lenses suggest that formation of the mineralized quartz veins took place under a sinistral transpression regime.
The multispectral and SAR data promoted a robust and fast automated mapping technique of the study area and promoted a better understanding of factors controlling the distribution of gold occurrences. The band-rationing technique, principal component and independent component analyses, spectral mineralogical indices, directional filtering, and automated lineament extraction algorithms were found to be powerful in highlighting and extracting lineaments and hydrothermal alteration zones. A density lineament map and the hydrothermal alteration images indicate that gold occurrences are mostly confined to chlorite–epidote alteration zones coinciding with high lineament intersections. This study concluded with a priority map with zones defined as exploration targets with high potential (Figure 17). These zones and the extensive ~WNW–ESE displacement shear/fault zones associated with epidote–chlorite and silicified hydrothermal breccia have to be sampled and assayed.
Author Contributions
Conceptualization, B.Z. and A.E.; methodology and flowchart set-up, A.E., B.Z., and N.S.; field work and validation, B.Z. and M.A.-W.; writing—review and editing, B.Z. and A.E. Publication fees were waived by Remote Sensing as B.Z. is a guest editor.
Funding
This research received no external funding.
Acknowledgments
Basem Zoheir wishes to acknowledge the Alexander von Humboldt foundation (AvH) for promoting this work. The four anonymous expert reviewers and Remote Sensing editors are thanked for providing constructive comments on the first draft of this paper.
Conflicts of Interest
The authors declare no conflict of interest.
References
- Abdelsalam, M.G.; Stern, R.J. Sutures and shear zones in the Arabian-Nubian Shield. J. Afr. Earth Sci. 1996, 23, 289–310. [Google Scholar] [CrossRef]
- Abdelsalam, M.G.; Abdeen, M.M.; Dowidar, H.M.; Stern, R.J.; Abdelghaffar, A.A. Structural evolution of the Neoproterozoic western Allaqi-Heiani suture zone, Southern Egypt. Precambrian Res. 2003, 124, 87–104. [Google Scholar] [CrossRef]
- Johnson, P.R.; Andresen, A.; Collins, A.S.; Fowler, A.R.; Fritz, H.; Ghebreab, W.; Kusky, T.; Stern, R.J. Late Cryogenian–Ediacaran history of the Arabian–Nubian Shield: A review of depositional, plutonic, structural, and tectonic events in the closing stages of the northern East African Orogen. J. Afr. Earth Sci. 2011, 61, 167–232. [Google Scholar] [CrossRef]
- Stern, R.J.; Hedge, C.E. Geochronologic and isotopic constraints on late Precambrian crustal evolution in the Eastern Desert of Egypt. Am. J. Sci. 1985, 285, 97–127. [Google Scholar] [CrossRef]
- Noweir, A.M.; El-Amawy, M.A.; Rashwan, A.A.; Abdel-Aziz, A.M. Geology and structural evolution of the Pan-African basement rocks around Wadi Umm Araka, Northeast Wadi Allaqi, South Eastern Desert, Egypt. Egypt. J. Geol. 1996, 40, 477–512. [Google Scholar]
- Miller, M.M.; Dixon, T.H. Late Proterozoic evolution of the northern part of the Hamisana zone, northeast Sudan: Constraints on Pan-African accretionary tectonics. J. Geol. Soc. 1992, 149, 743–750. [Google Scholar] [CrossRef]
- Greiling, R.O.; Abdeen, M.M.; Dardir, A.A.; El Akhal, H.; El Ramly, M.F.; Kamal El Din, G.M.; Osman, A.F.; Rashwan, A.A.; Rice, A.H.N.; Sadek, M.F. A structural synthesis of the Proterozoic Arabian–Nubian Shield in Egypt. Geologische Rundschau 1994, 83, 484–501. [Google Scholar] [CrossRef]
- Sultan, M.; Arvidson, R.E.; Duncan, I.J.; Stern, R.J.; El Kaliouby, B. Extension of the Najd shear system from Saudi Arabia to the central Eastern Desert of Egypt based on integrated field and Landsat observations. Tectonics 1988, 7, 1291–1306. [Google Scholar] [CrossRef]
- Kusky, T.M.; Ramadan, T. Structural controls on Neoproterozoic mineralization in the south Eastern Desert, Egypt: An integrated field, Landsat TM, and SIR C/X approach. J. Afr. Earth Sci. 2002, 35, 107–121. [Google Scholar] [CrossRef]
- Zoheir, B.; Emam, A.; El-Amawy, M.; Abu-Alam, T. Auriferous shear zones in the central Allaqi-Heiani belt: Orogenic gold in post-accretionary structures, SE Egypt. J. Afr. Earth Sci. 2018, 146, 118–131. [Google Scholar] [CrossRef]
- Zoheir, B.; Emam, A. Integrating geologic and satellite imagery data for high-resolution mapping and gold exploration targets in the South Eastern Desert, Egypt. J. Afr. Earth Sci. 2012, 66, 22–34. [Google Scholar] [CrossRef]
- Zoheir, B.; Emam, A. Field and ASTER imagery data for the setting of gold mineralization in Western Allaqi–Heiani belt, Egypt: A case study from the Haimur deposit. J. Afr. Earth Sci. 2014, 99, 150–164. [Google Scholar] [CrossRef]
- Pour, A.B.; Hashim, M. Structural geology mapping using PALSAR data in the Bau gold mining district, Sarawak, Malaysia. Adv. Space Res. 2014, 54, 644–654. [Google Scholar] [CrossRef]
- Gabr, S.S.; Hassan, S.M.; Sadek, M.F. Prospecting for new gold-bearing alteration zones at El-Hoteib area, South Eastern Desert, Egypt, using remote sensing data analysis. Ore Geol. Rev. 2015, 71, 1–13. [Google Scholar] [CrossRef]
- Bannari, A.; El-Battay, A.; Saquaque, A.; Miri, A. PALSAR-FBS L-HH Mode and Landsat-TM Data Fusion for Geological Mapping. Adv. Remote Sens. 2016, 5, 246. [Google Scholar] [CrossRef]
- Amer, R.; El Mezayen, A.; Hasanein, M. ASTER spectral analysis for alteration minerals associated with gold mineralization. Ore Geol. Rev. 2016, 75, 239–251. [Google Scholar] [CrossRef]
- Emam, A.; Zoheir, B.; Johnson, P. ASTER-based mapping of ophiolitic rocks: Examples from the Allaqi–Heiani suture, SE Egypt. Int. Geol. Rev. 2016, 58, 525–539. [Google Scholar] [CrossRef]
- Emam, A.; Hamimi, Z.; El-Fakharani, A.; Abdel-Rahman, E.; Barreiro, J.G.; Abo-Soliman, M.Y. Utilization of ASTER and OLI data for lithological mapping of Nugrus-Hafafit area, South Eastern Desert of Egypt. Arabian J. Geosci. 2018, 11, 756. [Google Scholar] [CrossRef]
- Hassan, S.M.; Taha, M.M.; Mohammad, A.T. Late Neoproterozoic basement rocks of Meatiq area, Central Eastern Desert, Egypt: Petrography and remote sensing characterizations. J. Afr. Earth Sci. 2017, 131, 14–31. [Google Scholar] [CrossRef]
- Pour, A.B.; Hashim, M.; Makoundi, C.; Zaw, K. Structural Mapping of the Bentong-Raub Suture Zone Using PALSAR Remote Sensing Data, Peninsular Malaysia: Implications for Sediment-hosted/Orogenic Gold Mineral Systems Exploration. Res. Geol. 2016, 66, 368–385. [Google Scholar] [CrossRef]
- Pour, A.B.; Park, Y.; Park, T.Y.S.; Hong, J.K.; Hashim, M.; Woo, J.; Ayoobi, I. Regional geology mapping using satellite-based remote sensing approach in Northern Victoria Land, Antarctica. Polar Sci. 2018, 16, 23–46. [Google Scholar] [CrossRef]
- Amer, R.; Kusky, T.; Ghulam, A. Lithological mapping in the Central Eastern Desert of Egypt using ASTER data. J. Afr. Earth Sci. 2010, 56, 75–82. [Google Scholar] [CrossRef]
- Amer, R.; Kusky, T.; El Mezayen, A. Remote sensing detection of gold related alteration zones in Um Rus area, Central Eastern Desert of Egypt. Adv. Space Res. 2012, 49, 121–134. [Google Scholar] [CrossRef]
- Mars, J.C.; Rowan, L.C. ASTER spectral analysis and lithologic mapping of the Khanneshin carbonatite volcano, Afghanistan. Geosphere 2011, 7, 276–289. [Google Scholar] [CrossRef] [Green Version]
- Madani, A.A.; Emam, A.A. SWIR ASTER band ratios for lithological mapping and mineral exploration: A case study from El Hudi area, southeastern desert, Egypt. Arabian J. Geosci. 2011, 4, 45–52. [Google Scholar] [CrossRef]
- Sadek, M.F.; Ali-Bik, M.W.; Hassan, S.M. Late Neoproterozoic basement rocks of Kadabora-Suwayqat area, Central Eastern Desert, Egypt: Geochemical and remote sensing characterization. Arabian J. Geosci. 2015, 8, 10459–10479. [Google Scholar] [CrossRef]
- Asran, A.M.; Emam, A.; El-Fakharani, A. Geology, structure, geochemistry and ASTER-based mapping of Neoproterozoic Gebel El-Delihimmi granites, Central Eastern Desert of Egypt. Lithos 2017, 282, 358–372. [Google Scholar] [CrossRef]
- Abrams, M.J.; Brown, D.; Lepley, L.; Sadowski, R. Remote sensing for porphyry copper deposits in Southern Arizona. Econ. Geol. 1983, 78, 591–604. [Google Scholar] [CrossRef]
- Roy, D.P.; Wulder, M.A.; Loveland, T.R.; Woodcock, C.E.; Allen, R.G.; Anderson, M.C.; Helder, D.; Irons, J.R.; Johnson, D.M.; Kennedy, R.; et al. Landsat-8: Science and product vision for terrestrial global change research. Remote Sens. Environ. 2014, 145, 154–172. [Google Scholar] [CrossRef] [Green Version]
- Zhang, X.; Pazner, M.; Duke, N. Lithologic and mineral information extraction for gold exploration using ASTER data in the south Chocolate Mountains (California). ISPRS J. Photogramm. Remote Sens. 2007, 62, 271–282. [Google Scholar] [CrossRef]
- Crowley, J.K.; Brickey, D.W.; Rowan, L.C. Airborne imaging spectrometer data of the Ruby Mountains, Montana: Mineral discrimination using relative absorption band-depth images. Remote Sens. Environ. 1989, 29, 121–134. [Google Scholar] [CrossRef]
- Karnieli, A.; Meisels, A.; Fisher, L.; Arkin, Y. Automatic extraction and evaluation of geological linear features from digital remote sensing data using a Hough transform. Photogramm. Eng. Remote Sens. 1996, 62, 525–531. [Google Scholar]
- Kim, G.B.; Lee, J.Y.; Lee, K.K. Construction of lineament maps related to groundwater occurrence with ArcView and Avenue™ scripts. Comput. Geosci. 2004, 30, 1117–1126. [Google Scholar] [CrossRef]
- Arlegui, L.E.; Soriano, M.A. Characterizing lineaments from satellite images and field studies in the central Ebro basin (NE Spain). Int. J. Remote Sens. 1998, 19, 3169–3185. [Google Scholar] [CrossRef]
- Suzen, M.L.; Toprak, V. Filtering of satellite images in geological lineament analyses: An application to a fault zone in Central Turkey. Int. J. Remote Sens. 1998, 19, 1101–1114. [Google Scholar] [CrossRef]
- Hung, L.Q.; Dinh, N.Q.; Batelaan, O.; Tam, V.T.; Lagrou, D. Remote sensing and GIS-based analysis of cave development in the Suoimuoi catchment (Son La-NW Vietnam). J. Cave Karst Stud. 2002, 64, 23–33. [Google Scholar]
- Conoco Coral. Geological Map of Egypt, Scale 1:500,000, Bernice Sheet, NF 36 NE.; The Egyptian General Petroleum Corporation (EGPC): Cairo, Egypt, 1987. [Google Scholar]
- Nano, L.; Kontny, A.; Sadek, M.F.; Greiling, R.O. Structural evolution of metavolcanics in the surrounding of the gold mineralization at El Beida, South Eastern Desert, Egypt. Ann. Geol. Surv. Egypt 2002, 25, 11–22. [Google Scholar]
- Sadek, M.F. Geological and Structural Setting of Wadi Hodein Area Southeast Egypt with Remote Sensing Applications. In Proceedings of the International Archives of the Photogrammetry, Remote Sensing and Spatial Information Sciences, Beijing, China, 3–11 July 2008; Volume XXXVII-B8. [Google Scholar]
- Zoheir, B.A. Controls on lode gold mineralization, Romite deposit, South Eastern Desert, Egypt. Geosci. Front. 2012, 3, 571–585. [Google Scholar] [CrossRef] [Green Version]
- Sadek, M.F. Discrimination of basement rocks and alteration zones in Shalatein area, Southeastern Egypt using Landsat TM Imagery data. Egypt. J. Remote Sens. Space Sci. 2004, 7, 89–98. [Google Scholar]
- Abdeen, M.M.; Sadek, M.F.; Greiling, R.O. Thrusting and multiple folding in the Neoproterozoic Pan-African basement of Wadi Hodein area, south Eastern Desert, Egypt. J. Afr. Earth Sci. 2008, 52, 21–29. [Google Scholar] [CrossRef]
- Kontny, A.; Sadek, M.F.; Abdallah, M.; Marioth, R.; Greiling, R.O. First investigation on shear zone related gold mineralization at El Beida area, South Eastern Desert, Egypt. In Aspects of Pan-African Tectonics. International Cooperation, Bilateral Seminars International Bureau; De Wall, H., Greiling, R.O., Eds.; Forschungszentrum Julich: Jülich, Germany, 1999; Volume 32, pp. 91–97. [Google Scholar]
- Obeid, M.; Ali, M.; Mohamed, N. Geochemical exploration on the stream sediments of Gabal El Mueilha area, central Eastern Desert, Egypt: An overview on the rare metals. Res. Geol. 2001, 51, 217–227. [Google Scholar] [CrossRef]
- Kokaly, R.F.; Clark, R.N.; Swayze, G.A.; Livo, K.E.; Hoefen, T.M.; Pearson, N.C.; Klein, A.J. USGS Spectral Library Version 7 (No. 1035); US Geological Survey: Reston, VA, USA, 2017.
- Henderson, F.M.; Lewis, A.J. Principles and Applications of Imaging Radar. (Manual of Remote Sensing, Volume 2), 3rd ed.; Wiley: Hoboken, NJ, USA, 1998. [Google Scholar]
- J-Spacesystems. PALSAR User’s Guide, 2nd ed.; 2012; 69p, Available online: http://gds.palsar.ersdac.jspacesystems.or.jp/e/guide/ (accessed on 21 March 2019).
- Ma, J.; Xiao, X.; Qin, Y.; Chen, B.; Hu, Y.; Li, X.; Zhao, B. Estimating aboveground biomass of broadleaf, needleleaf, and mixed forests in northeastern China through analysis of 25-m ALOS/PALSAR mosaic data. For. Ecol. Manag. 2017, 389, 199–210. [Google Scholar] [CrossRef]
- ESA. Sentinel-1: ESA’s Radar Observatory Mission for GMES Operational Services; ESA SP-1322/1; European Space Agency: Paris, France, March 2012. [Google Scholar]
- Marghany, M.; Hashim, M. Lineament mapping using multispectral remote sensing satellite data. Int. J. Phys. Sci. 2010, 5, 1501–1507. [Google Scholar] [CrossRef]
- Bishta, A.Z.; Sonbul, A.R.; Kashghari, W. Utilization of supervised classification in structural and lithological mapping of Wadi Al-Marwah Area, NW Arabian Shield, Saudi Arabia. Arabian J. Geosci. 2014, 7, 3855–3869. [Google Scholar] [CrossRef]
- Flaash, U.S.G. Atmospheric Correction Module: QUAC and Flaash User Guide v. 4.7; ITT Visual Information Solutions Inc.: Boulder, CO, USA, 2009. [Google Scholar]
- Smith, M.J. A Comparison of DG AComp, FLAASH and QUAC Atmospheric Compensation Algorithms Using WorldView-2 Imagery. Master’s Dissertation, University of Colorado, Boulder, CO, USA, 2015. [Google Scholar]
- Cooley, T.; Anderson, G.P.; Felde, G.W.; Hoke, M.L.; Ratkowski, A.J.; Chetwynd, J.H.; Gardner, J.A.; Adler-Golden, S.M.; Matthew, M.W.; Berk, A.; et al. FLAASH, a MODTRAN4-based atmospheric correction algorithm, its application and validation. In Proceedings of the IEEE International Geoscience and Remote Sensing Symposium, Toronto, ON, USA, 24–28 June 2002; Volume 3, pp. 1414–1418. [Google Scholar]
- Gelautz, M.; Frick, H.; Raggam, J.; Burgstaller, J.; Leberl, F. SAR image simulation and analysis of alpine terrain. ISPRS J. Photogramm. Remote Sens. 1998, 53, 17–38. [Google Scholar] [CrossRef]
- Franceschetti, G.; Lanari, R. Synthetic Aperture Radar Processing; Electronic Engineering Systems Series; CRC Press: Boca Raton, FL, USA, 1999. [Google Scholar]
- Lee, J.S.; Jurkevich, L.; Dewaele, P.; Wambacq, P.; Osterlinck, A. Speckle filtering of synthetic aperture radar images: A review. Remote Sens. Rev. 1994, 8, 313–340. [Google Scholar] [CrossRef]
- Sveinsson, J.R.; Benediktsson, J.A. Speckle reduction and enhancement of SAR images in the wavelet domain. In Proceedings of the IGARSS’96, 1996 International Geoscience and Remote Sensing Symposium, Lincoln, NE, USA, 31 May 1996; Volume 1, pp. 63–66. [Google Scholar]
- Jensen, J.R. Introductory Image Processing: A Remote Sensing Perspective; Prentice Hall: New York, NY, USA, 1996. [Google Scholar]
- Glikson, A.Y. Mineral-Mapping in the North Pilbara Craton. In A Directed Principal Components of the Band Ratios Method for Correlating Landsat-5 Thematic Mapper Spectral Data with Geology: AGSO-Australian Geol. Survey Organisation Research Newsletter; AGSO: Canberra City, ACT, Australia, 1997; Volume 26, pp. 1–4. [Google Scholar]
- Sabins, F.F. Remote sensing for mineral exploration. Ore Geol. Rev. 1999, 14, 157–183. [Google Scholar] [CrossRef]
- Inzana, J.; Kusky, T.; Higgs, G.; Tucker, R. Supervised classifications of Landsat TM band ratio images and Landsat TM band ratio image with radar for geological interpretations of central Madagascar. J. Afr. Earth Sci. 2003, 37, 59–72. [Google Scholar] [CrossRef]
- Zumsprekel, H.; Prinz, T. Computer-enhanced multispectral remote sensing data: A useful tool for the geological mapping of Archean terrains in (semi) arid environments. Comput. Geosci. 2000, 26, 87–100. [Google Scholar] [CrossRef]
- Ninomiya, Y. A stabilized vegetation index and several mineralogic indices defined for ASTER VNIR and SWIR data. In Proceedings of the IGARSS 2003, 2003 IEEE International Geoscience and Remote Sensing Symposium. Proceedings (IEEE Cat. No. 03CH37477), Toulouse, France, 21–25 July 2003; Volume 3, pp. 1552–1554. [Google Scholar]
- Ninomiya, Y.; Fu, B.; Cudahy, T.J. Detecting lithology with Advanced Spaceborne Thermal Emission and Reflection Radiometer (ASTER) multispectral thermal infrared “radiance-at-sensor” data. Remote Sens. Environ. 2005, 99, 127–139. [Google Scholar] [CrossRef]
- Bonn, F.; Rochon, G. Précis de télédétection, vol. 1 Principes et méthodes; AUPELF-UREF, Collection Presses Universitaires du Quebec: Montreal, QC, Canada, 1992. [Google Scholar]
- Klemm, D.; Klemm, R.; Murr, A. Gold of the Pharaohs–6000 years of gold mining in Egypt and Nubia. J. Afr. Earth Sci. 2001, 33, 643–659. [Google Scholar] [CrossRef]
- Klemm, R.; Klemm, D. Gold and Gold Mining in Ancient Egypt and Nubia, Geoarchaeology of the Ancient Gold Mining Sites in the Egyptian and Sudanese Eastern Deserts; Springer: Berlin/Heidelberg, Germany, 2013; 663p. [Google Scholar]
- Hassan, O.A.; El-Manakhly, M.M. Gold deposits in the southern Eastern Desert, Egypt. In A commodity Package; Egyptian Geological Survey and Mining Authority: Cairo, Egypt, 1986. [Google Scholar]
- Gabra, S.Z. Gold in Egypt: A Commodity Package; 86 Pages, 11 Figures, 8 Maps; Geological Survey of Egypt: Cairo, Egypt, 1986.
- Zoheir, B.A.; Mehanna, A.M.; Qaoud, N.N. Geochemistry and geothermobarometry of the Um Eleiga Neoproterozoic island arc intrusive complex, SE Egypt: Genesis of a potential gold-hosting intrusion. Appl. Earth Sci. 2008, 117, 89–111. [Google Scholar] [CrossRef]
- Takla, M.A.; El Dougdoug, A.A.; Gad, M.A.; Rasmay, A.H.; El Tabbal, H.K. Gold-bearing quartz veins in mafic and ultramafic rocks, Hutite and Um Tenedba, south Eastern Desert, Egypt. Ann. Geol. Surv. Egypt 1995, 20, 411–432. [Google Scholar]
Figure 1.
Simplified geological map of the South Eastern Desert (SED) of Egypt with the major deformation systems and gold occurrences shown.
Figure 1.
Simplified geological map of the South Eastern Desert (SED) of Egypt with the major deformation systems and gold occurrences shown.

Figure 2.
Geological map of Wadi Beitan–Wadi Rahaba area in South Eastern Desert (SED) of Egypt. Modified from Conoco Coral [37]. The unlabeled yellow filled circles are either insignificant or yet not studied occurrences.
Figure 2.
Geological map of Wadi Beitan–Wadi Rahaba area in South Eastern Desert (SED) of Egypt. Modified from Conoco Coral [37]. The unlabeled yellow filled circles are either insignificant or yet not studied occurrences.

Figure 3.
Flowchart of methods and data types and the succession of processing steps applied for the present study.
Figure 3.
Flowchart of methods and data types and the succession of processing steps applied for the present study.

Figure 4.
Spectral discrimination of ophiolitic rocks by a processed Landsat-8 OLI scene of the study area. (A) Grayscale band ratio (6/7) image; (B) false color composite (FCC) band ratio image (red (R): 6/7, green (G): 6/5, blue (B): 4/2) of the study area. The ophiolitic rocks are highlighted by yellow or lemon-yellow pixels and clearly display signs of shearing and dislocation. Note that the ophiolitic rocks are rather abundant along the eastern shear zone which accommodates the Hutit mine. The yellow-filled circles are gold occurrences and/or locations of old gold mines as in the geological map (Figure 2).

Figure 5.
Ophiolitic mélange mapping promoted by processing OLI and ASTER data. (A) The FCC OLI-band ratio (R: 6/7, G: 6/2, B: 6/5 × 4/5) image discriminates terranes of the mafic rocks in the study area; (B) the grayscale ASTER RBD (6 + 9/82) image clearly highlight the ophiolitic mélange terrane in the central part of the study area and is surrounded by felsic rocks (granites and granitic gneisses) in the eastern and western parts of the image.

Figure 6.
Mineralogical indices images based on the ASTER–SWIR data of the study area. (A) Grayscale image of the carbonate index (CI) of Ninomiya [65]; (B) grayscale image of the Fe-Mg-OH-MI after Pour et al. [21].

Figure 7.
Principal and independent component analysis (PCA and ICA) images of OLI-band ratios, ASTER–RBD, and mineralogical indices. (A) FCC principal component (PC) image (R: PC5, G: PC2, B: PC3); (B) FCC independent component (IC) image (R: IC3, G: IC1, B: IC2).
Figure 7.
Principal and independent component analysis (PCA and ICA) images of OLI-band ratios, ASTER–RBD, and mineralogical indices. (A) FCC principal component (PC) image (R: PC5, G: PC2, B: PC3); (B) FCC independent component (IC) image (R: IC3, G: IC1, B: IC2).

Figure 8.
Structural mapping promoted using PALSAR and Sentinel-1B PCA data. (A) Grayscale image of PALSAR PC2; (B) FCC image of Sentinel-1 PCs (R: PC2, G: PC4, B: PC3).
Figure 8.
Structural mapping promoted using PALSAR and Sentinel-1B PCA data. (A) Grayscale image of PALSAR PC2; (B) FCC image of Sentinel-1 PCs (R: PC2, G: PC4, B: PC3).

Figure 9.
Geological lineament extracted from the SAR data of the study area. (A) Manually extracted lineaments aided by edge enhancement techniques of PALSAR and Sentinel-1 PCA images verified in the fieldwork; (B) results of the automated lineament extraction technique (ALE) using the same images as in Figure 8 after applying the directional filters. Insets are rose diagrams showing the main structural trends in the study area. The manually extracted lineament results obviously show the two main northwest (NW)–southeast (SE) and north-northwest (NNW)–south-southeast (SSE) structural trends, whereas the automated extraction shows only the prevailing NNW–SSE trend.

Figure 10.
Density maps of the extracted structural lineaments in the study area. (A) Line density map of manually extracted lineaments aided by edge enhancement and directional filtering techniques; (B) line density map of lineaments extracted automatically by the LINE algorithm (see the text for more details).

Figure 11.
(A) Manually extracted lineaments overlaying a FCC image of directional filters (R: 90°, G: 135°, B: 45°) on the Sentinel-1B PC3; (B) automatically extracted lineaments superimposed on an FCC (R: 90°, G: 135°, B: 45°) image directionally filtered with PALSAR PC2.
Figure 11.
(A) Manually extracted lineaments overlaying a FCC image of directional filters (R: 90°, G: 135°, B: 45°) on the Sentinel-1B PC3; (B) automatically extracted lineaments superimposed on an FCC (R: 90°, G: 135°, B: 45°) image directionally filtered with PALSAR PC2.

Figure 12.
(A) Geological map of the Um Eleiga gold mine, modified from Zoheir et al. [71]; (B) milky quartz vein cuts across the gabbroic central part of the Um Eleiga intrusive complex; (C) transmitted, crossed polar light photomicrograph of the mineralized quartz veins showing dominant calcite, chlorite, and sulfide minerals; (D,E) Reflected light photomicrographs of the mineralized quartz veins showing disseminated euhedral to subhedral pyrite, and botryoidal malachite replacing chalcopyrite or other Cu-sulfides.

Figure 13.
(A) Geological map of the Hutit gold mine and surroundings, compiled from field work and remote-sensing data interpretations and adapted from Hassan and El-Manakhly [69]; (B) detailed geological map of the main lode in the northern mine and southern mine areas.
Figure 13.
(A) Geological map of the Hutit gold mine and surroundings, compiled from field work and remote-sensing data interpretations and adapted from Hassan and El-Manakhly [69]; (B) detailed geological map of the main lode in the northern mine and southern mine areas.

Figure 14.
(A) Equal area stereographic projection (lower hemisphere) of planes of the shear zone and poles to the associated slickensides; (B) sketch drawing explaining the geometrical relationship between the quartz veined shear zone in the Hutit mine and the thrust structures. Note the deflection of the foliation about the shear zone (based on field observations); (C) nearly vertical, bluish-gray quartz veins associated with highly sheared serpentinite in the northern mine (looking NW); (D) milky quartz vein cutting metavolcanic rocks in the southern mine (looking N); (E) S-shaped quartz vein indicating a sinistral sense of shearing (looking W); (F) grayish quartz vein traversed by milky veinlets. The sample is from the northern mine lode.

Figure 15.
(A) Geologic map of the Um Teneidab gold mine, modified from Hassan and El-Manakhly [69]. The inset photo shows the mine shafts along the ~N–S line as in the map (photo looking to N); (B) granite offshoots cut the host gabbroic rocks and are associated with zones of discoloration in the mine area (photo looking to W); (C) shear zone with quartz veins between tectonized gabbro and fine-grained granite (photo looking to N); (D) milky quartz vein cutting across granite at the Um Teneidab gold mine. Notice the color bleaching of the wallrocks.

Figure 16.
(A) Simplified geological map of the Urga Ryan gold occurrence (compiled from satellite-imagery data coupled with our fieldwork), (B) moderately dipping, strongly foliated, and sheared metavolcanic rocks at the Urga Ryan gold mine with zones of discoloration due to variable hydrothermal alteration distal and proximal to the gold-bearing veins; (C) boudinaged quartz lenses along the shear zone surrounded by ferruginated, sericitized wallrocks; (D) lensoid (sigmoidal) quartz lenses indicating sinistral sense of shear along the host shear zone. Inclined slickensides on the vein wall surfaces suggest that movement was oblique with lateral and vertical components.

Figure 17.
A fused lithological–structural map generated by merging the extracted structural lineaments and mineralogical index vector images of the study area. The inset is a rose diagram of the main structural lineaments. To the right is a grayscale ASTER-band 1 image of the study area. Zones with potential for hidden resources, considered as priority exploration targets, are highlighted.


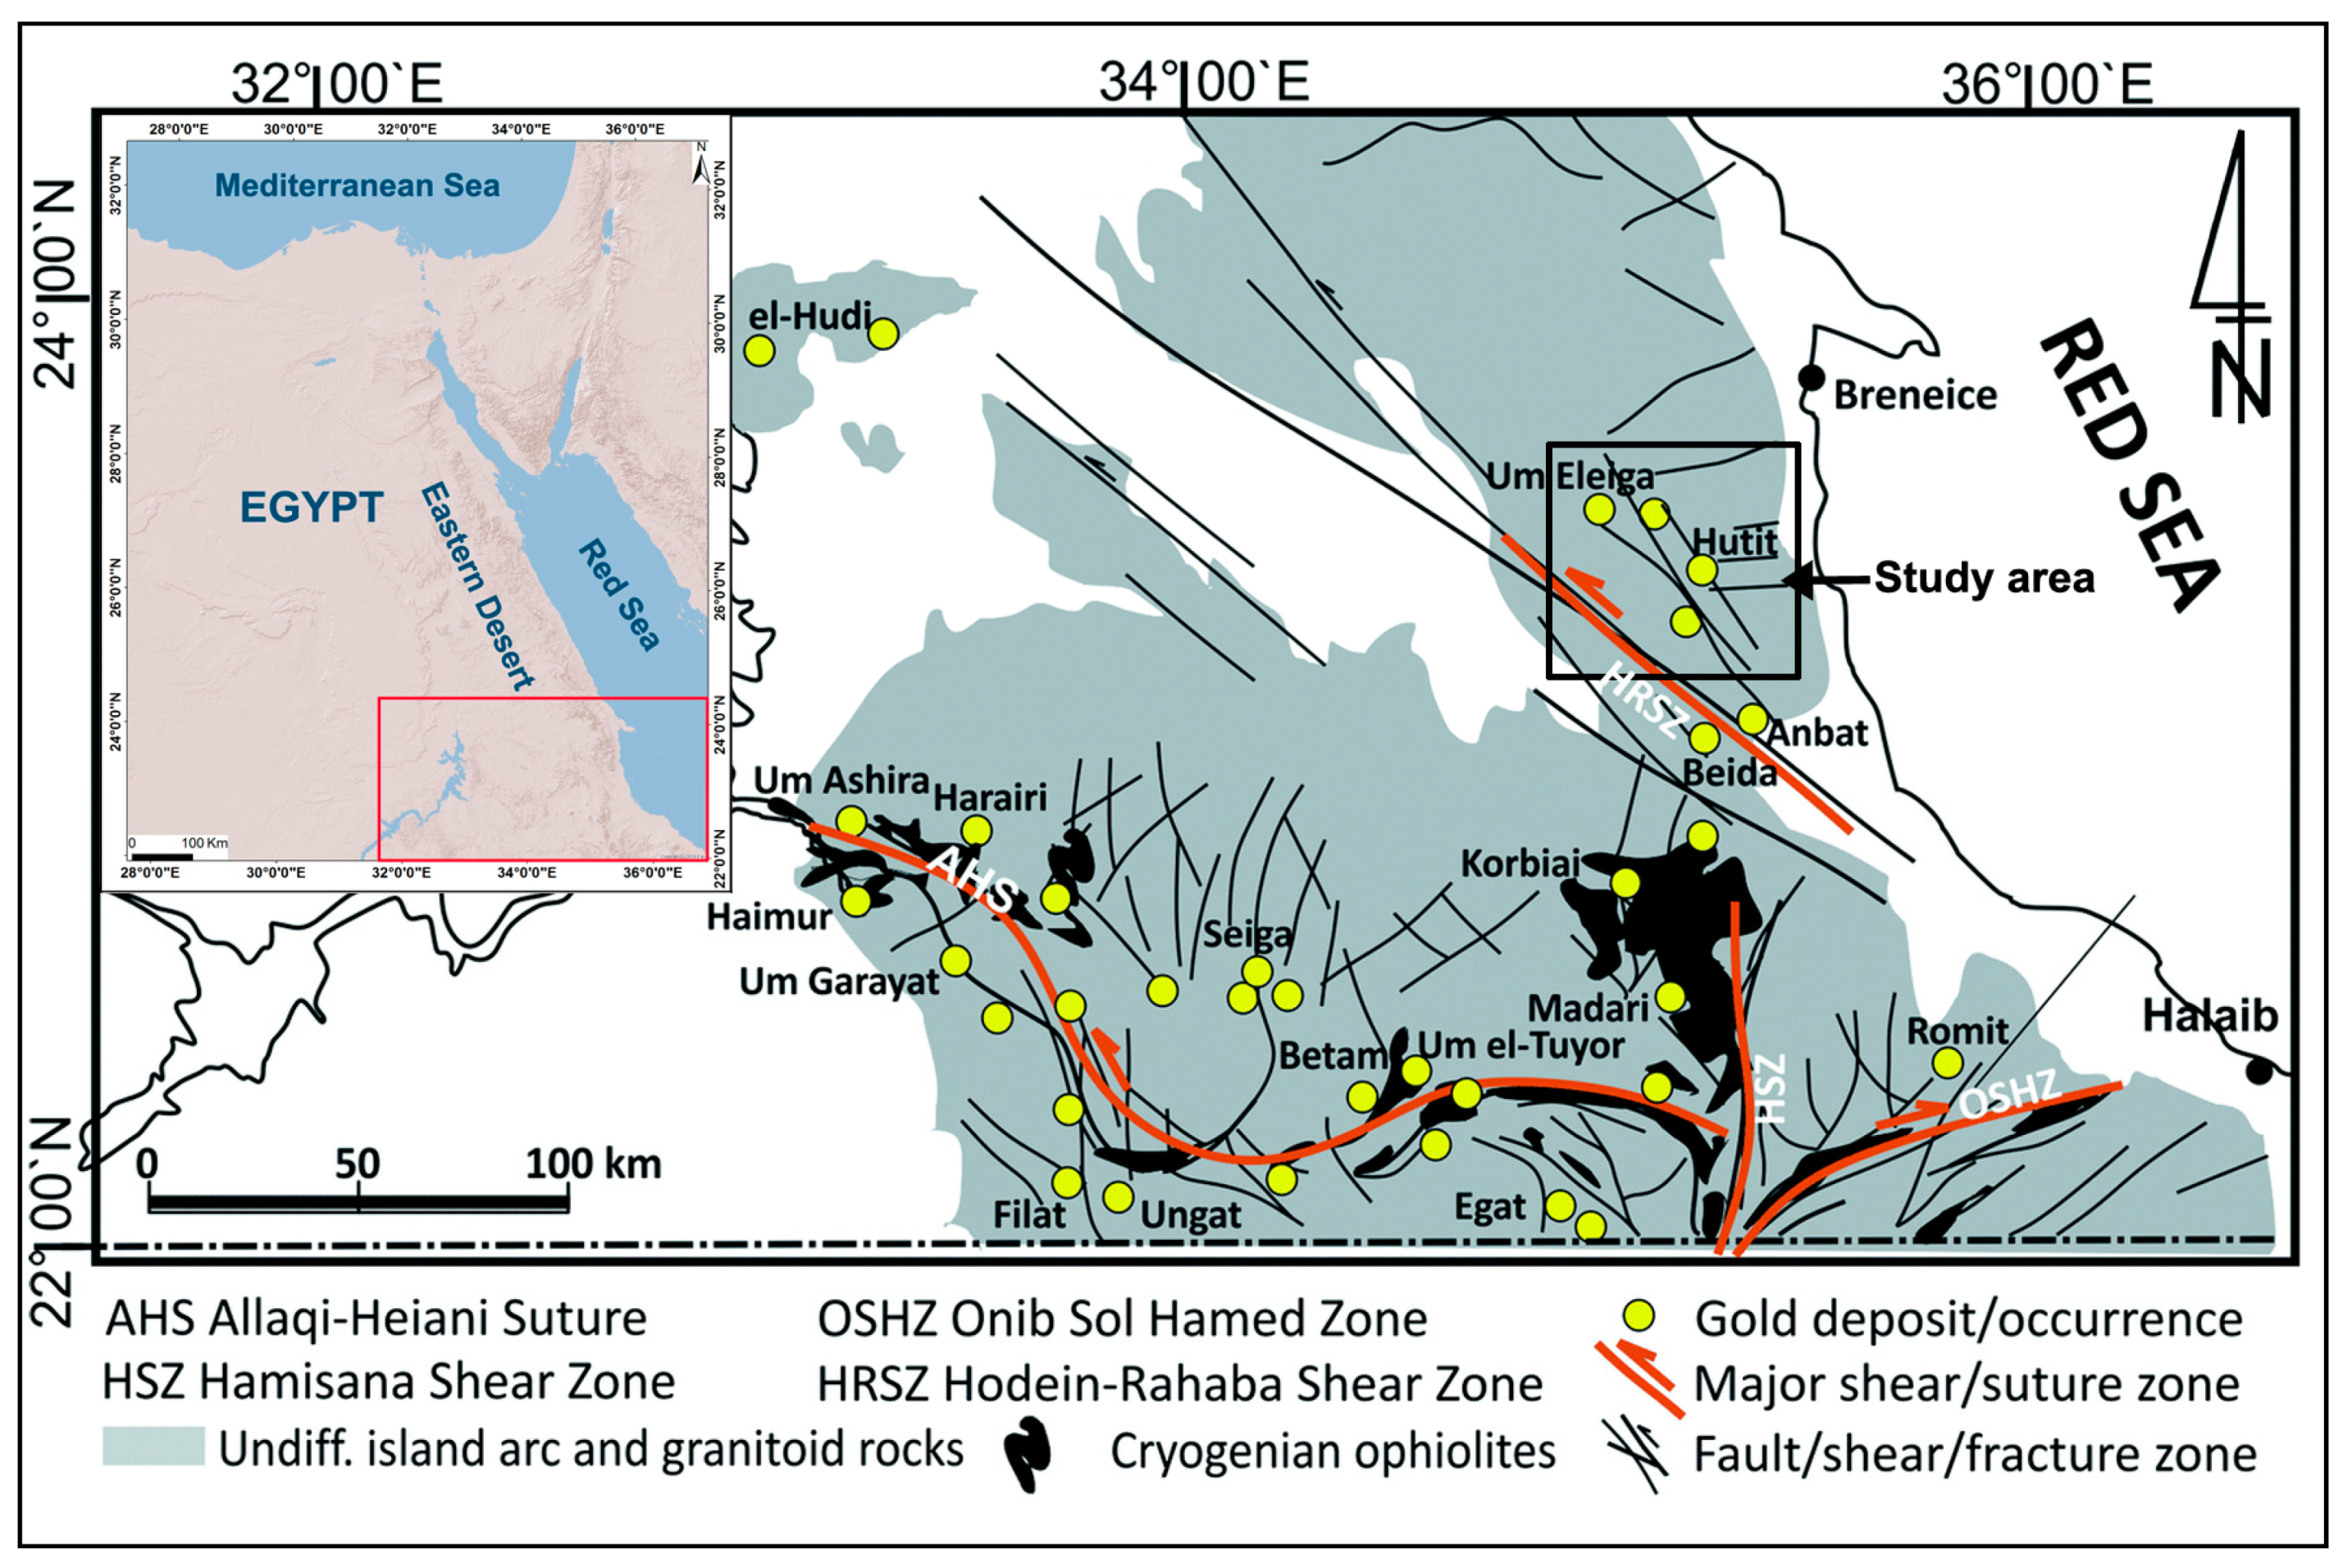
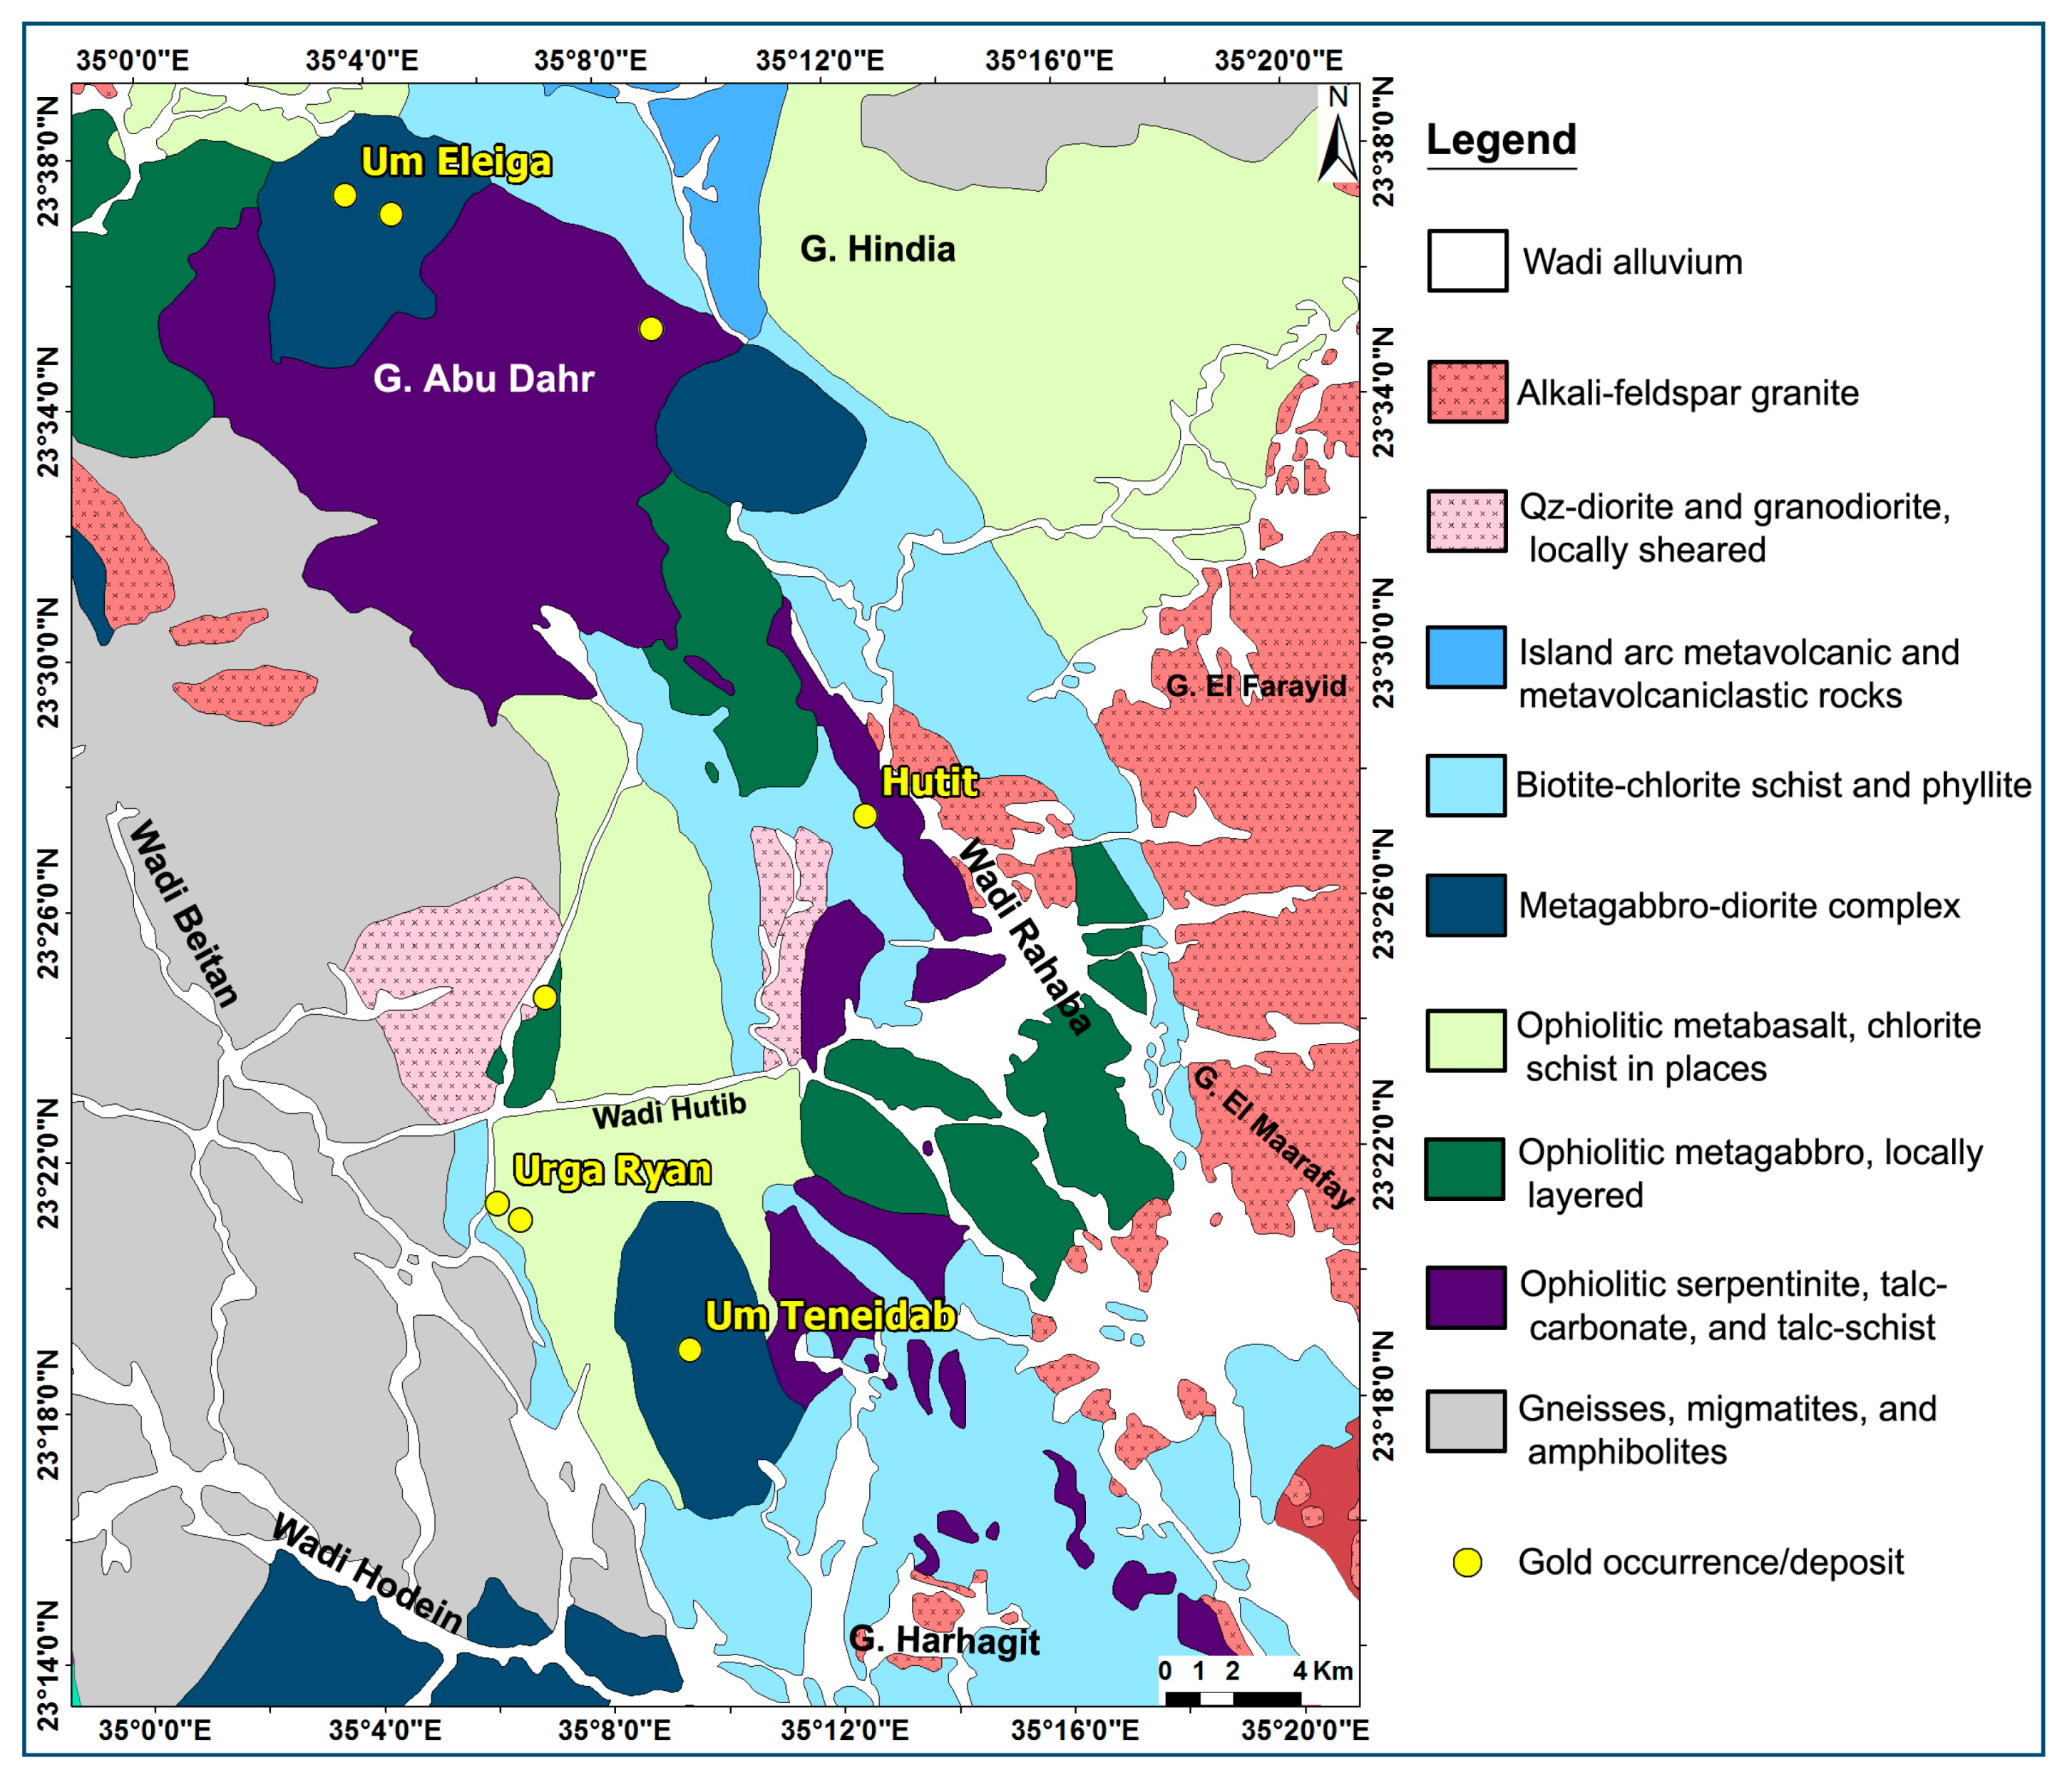
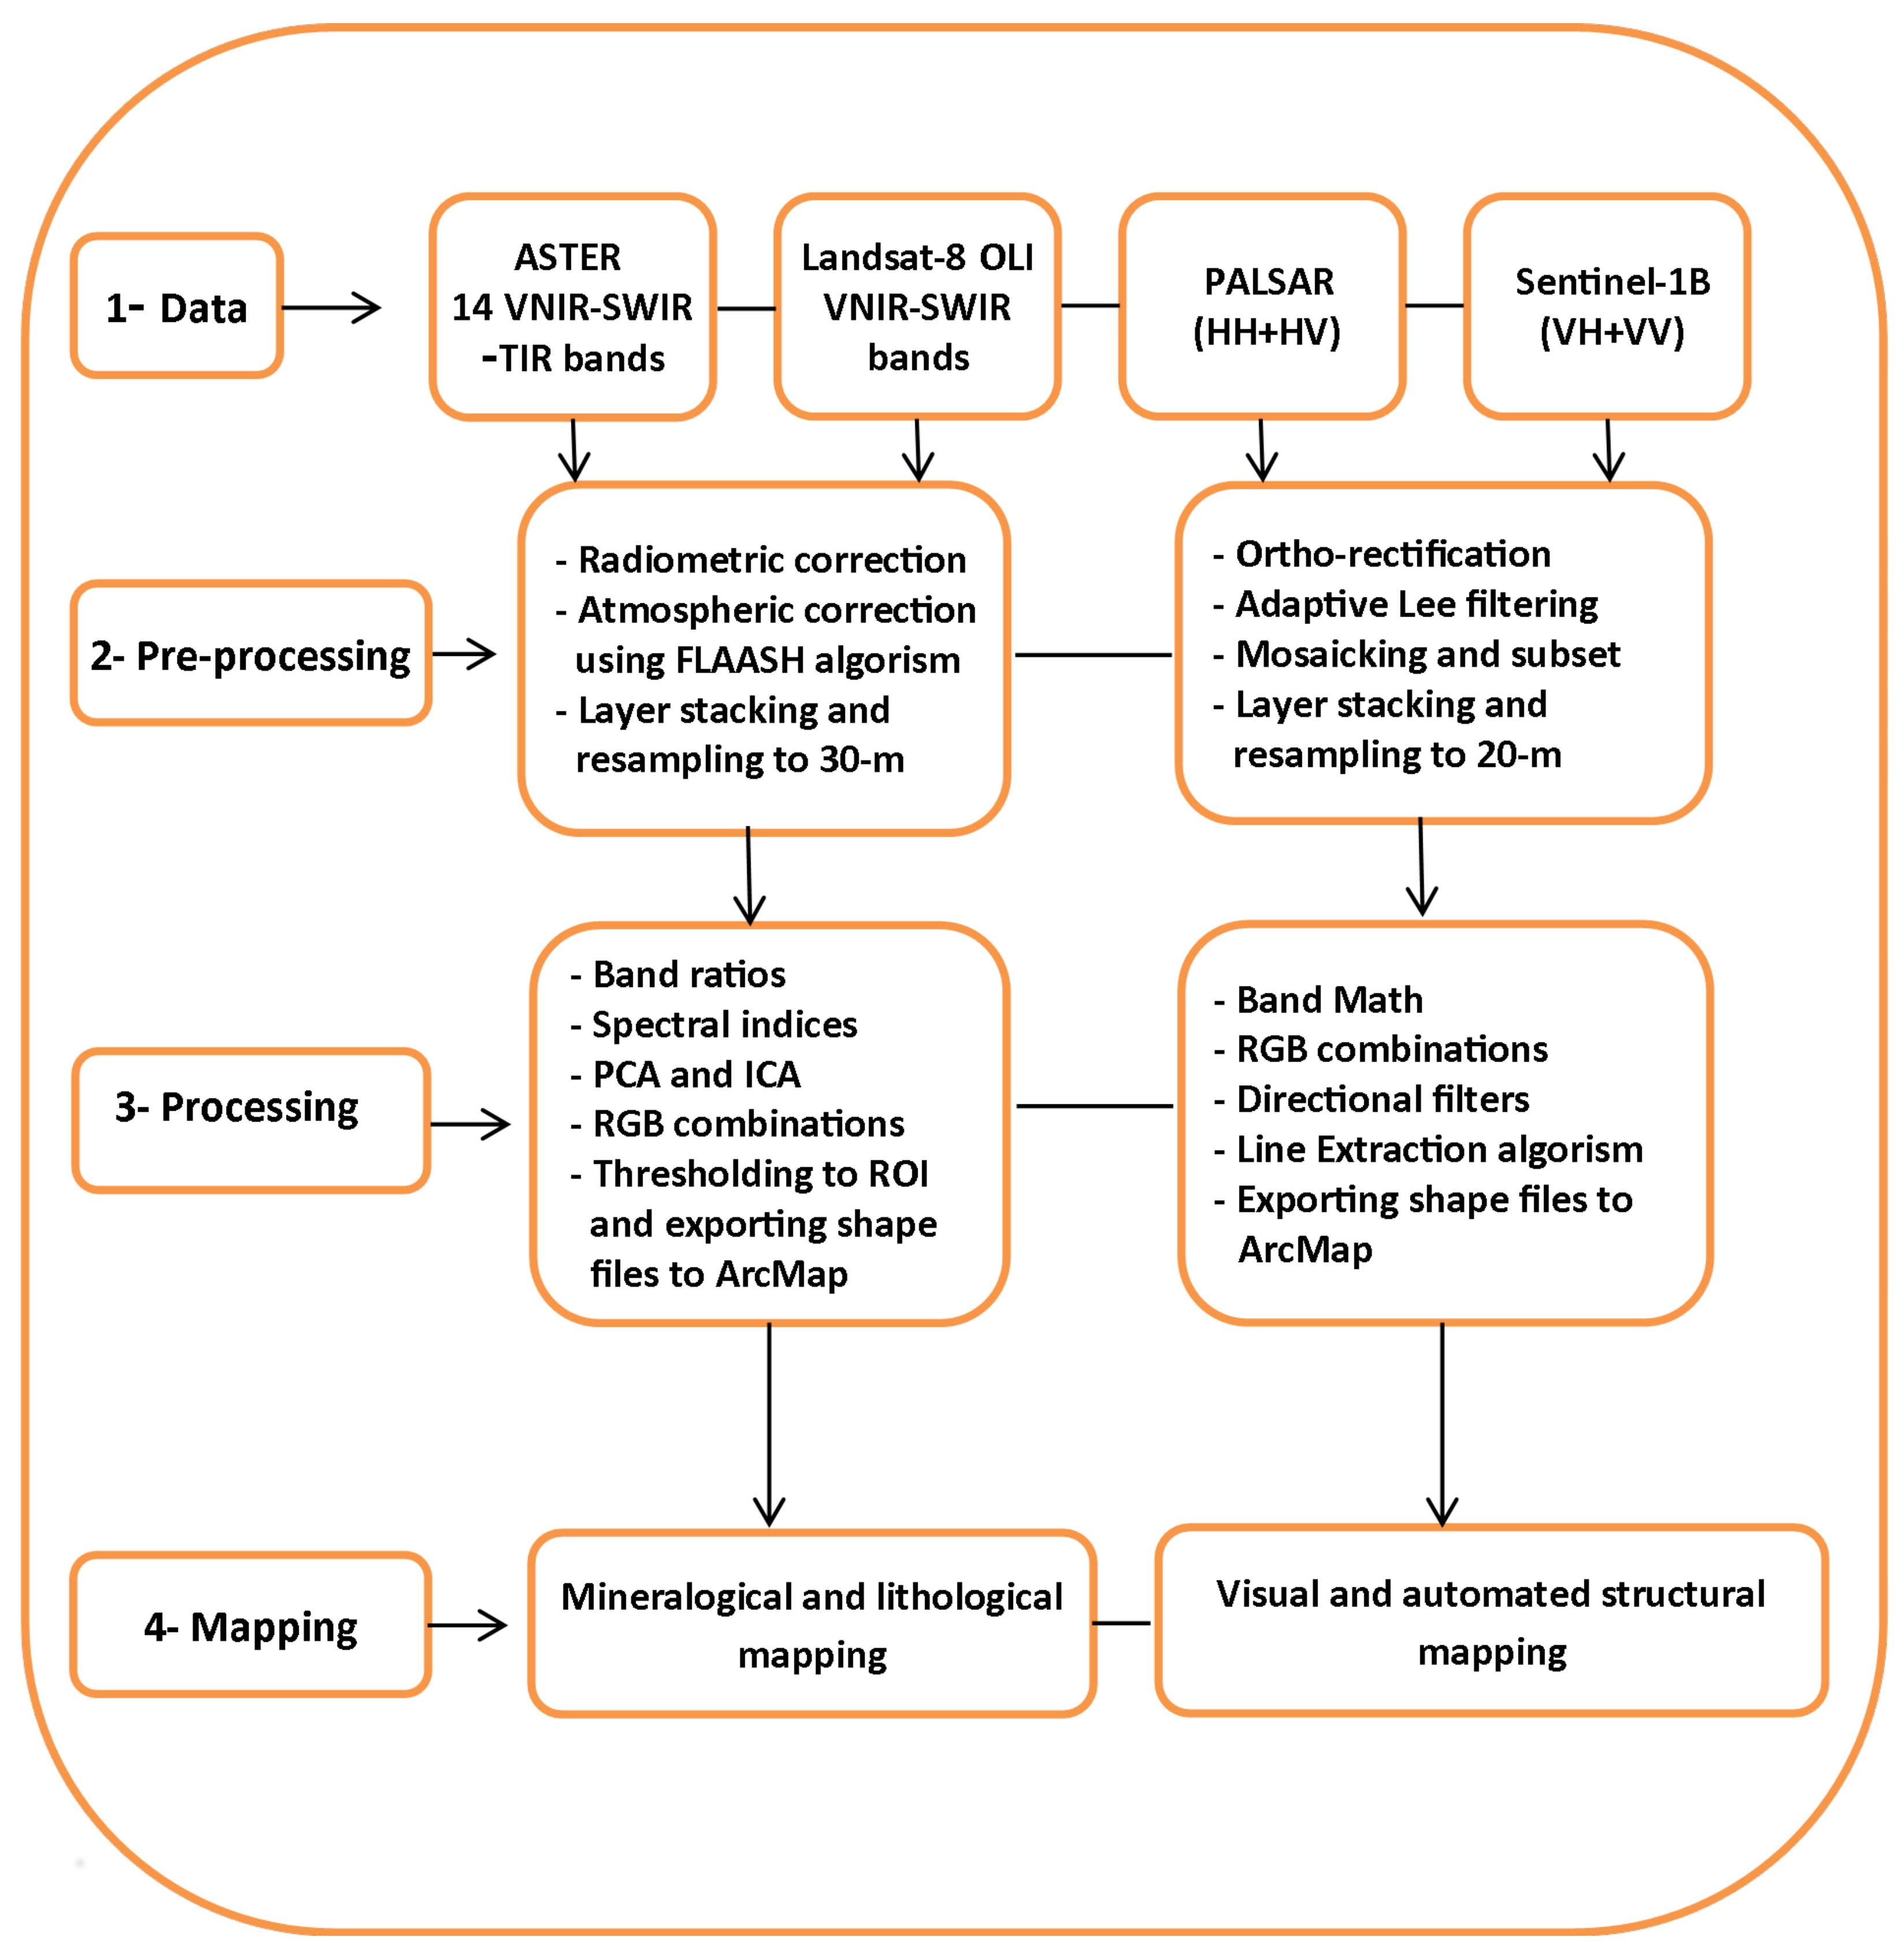
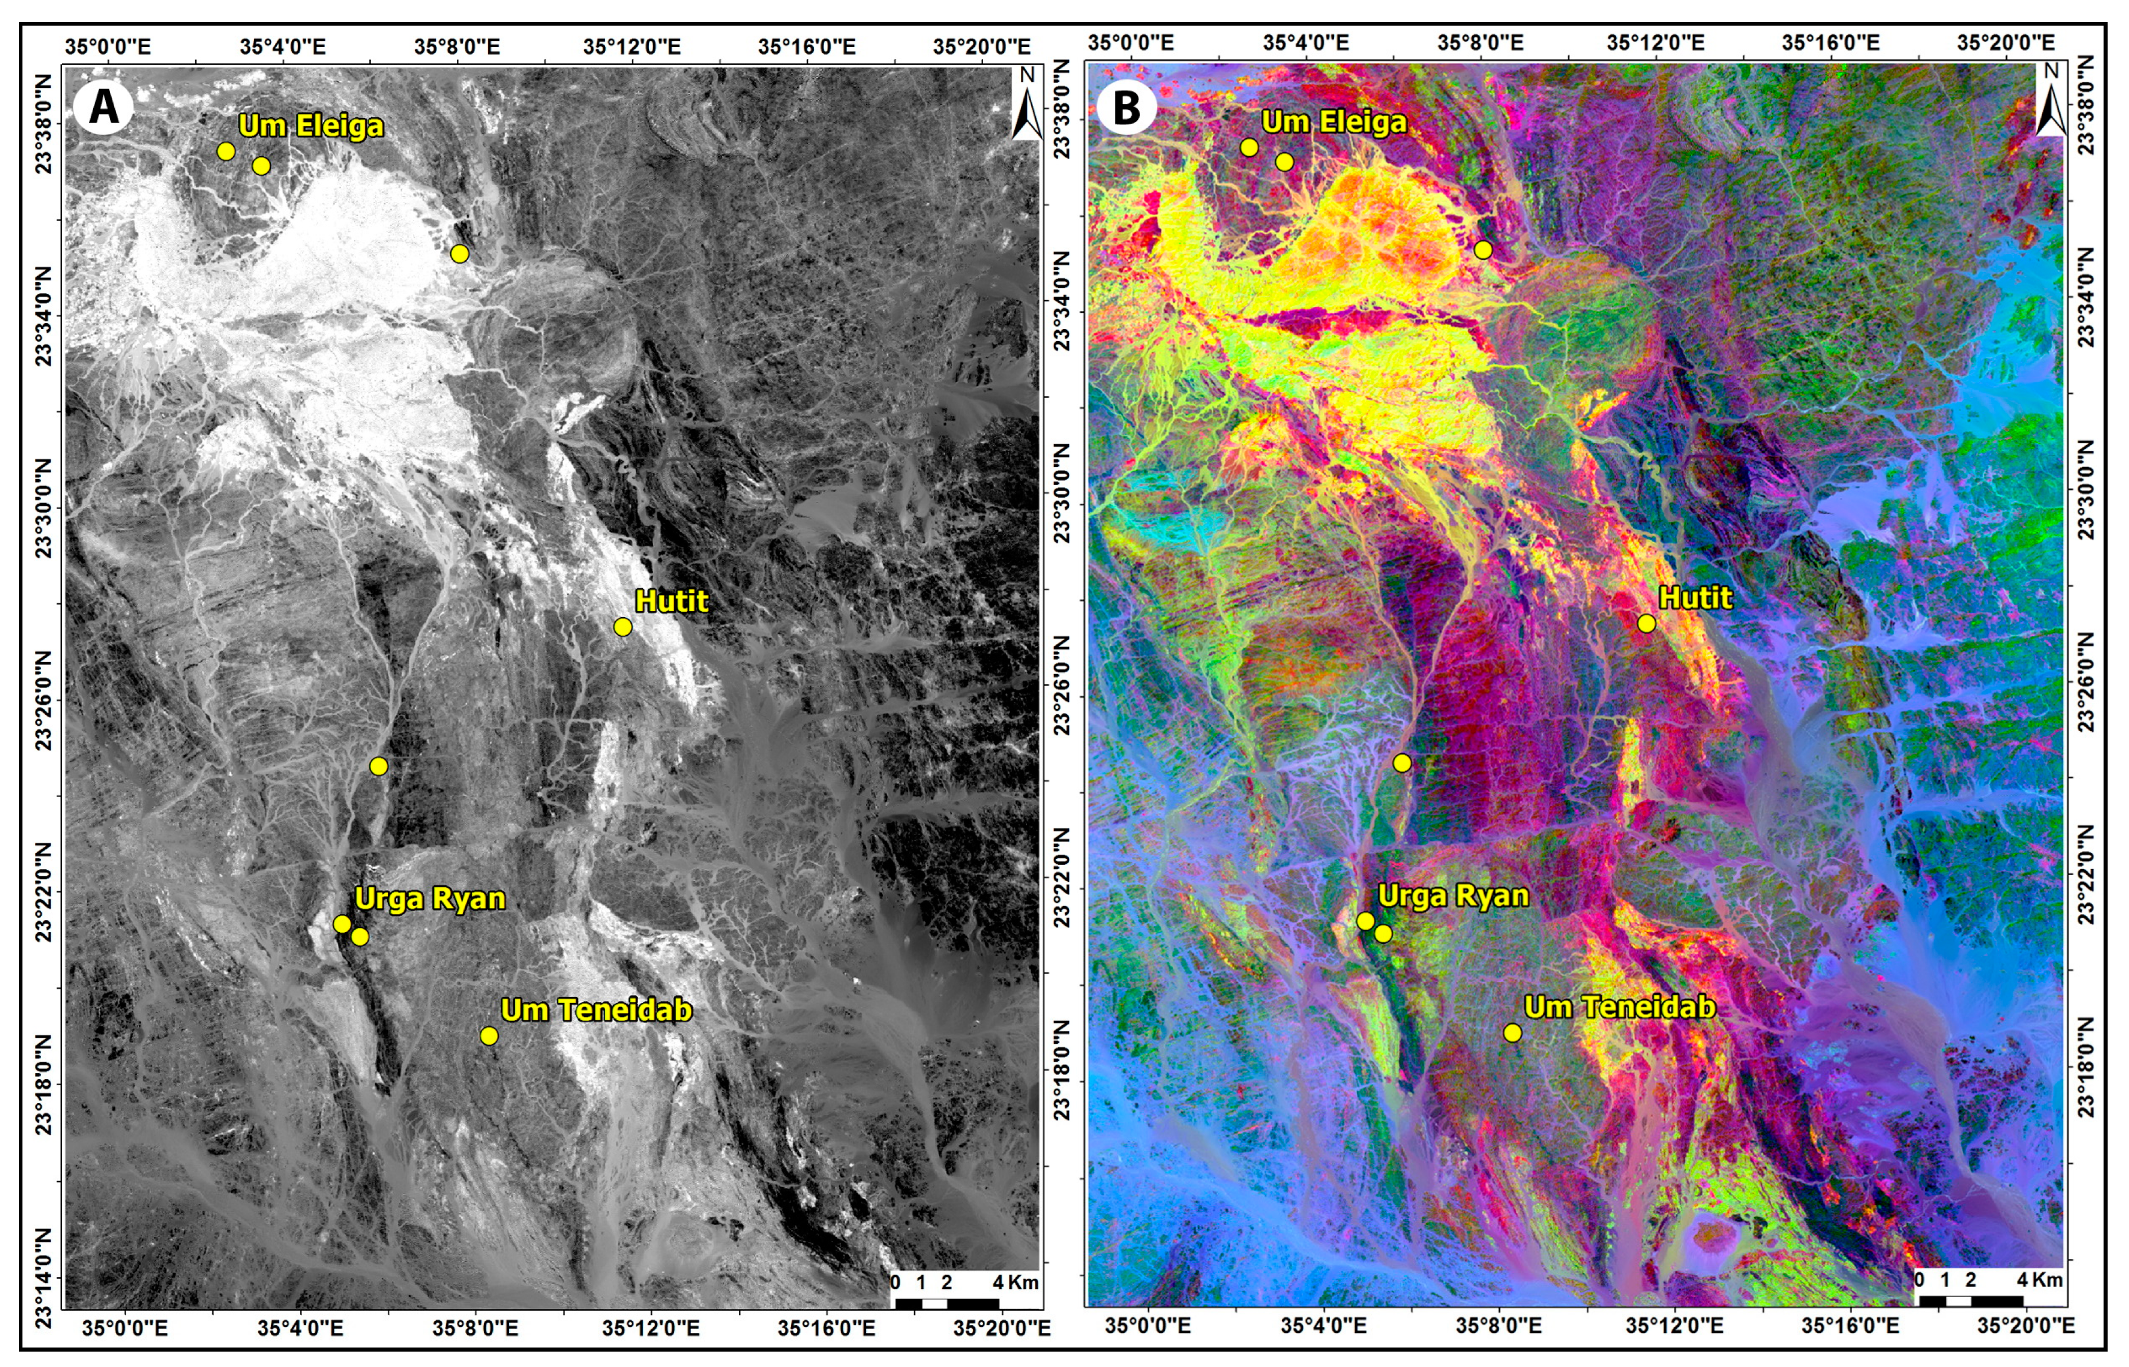
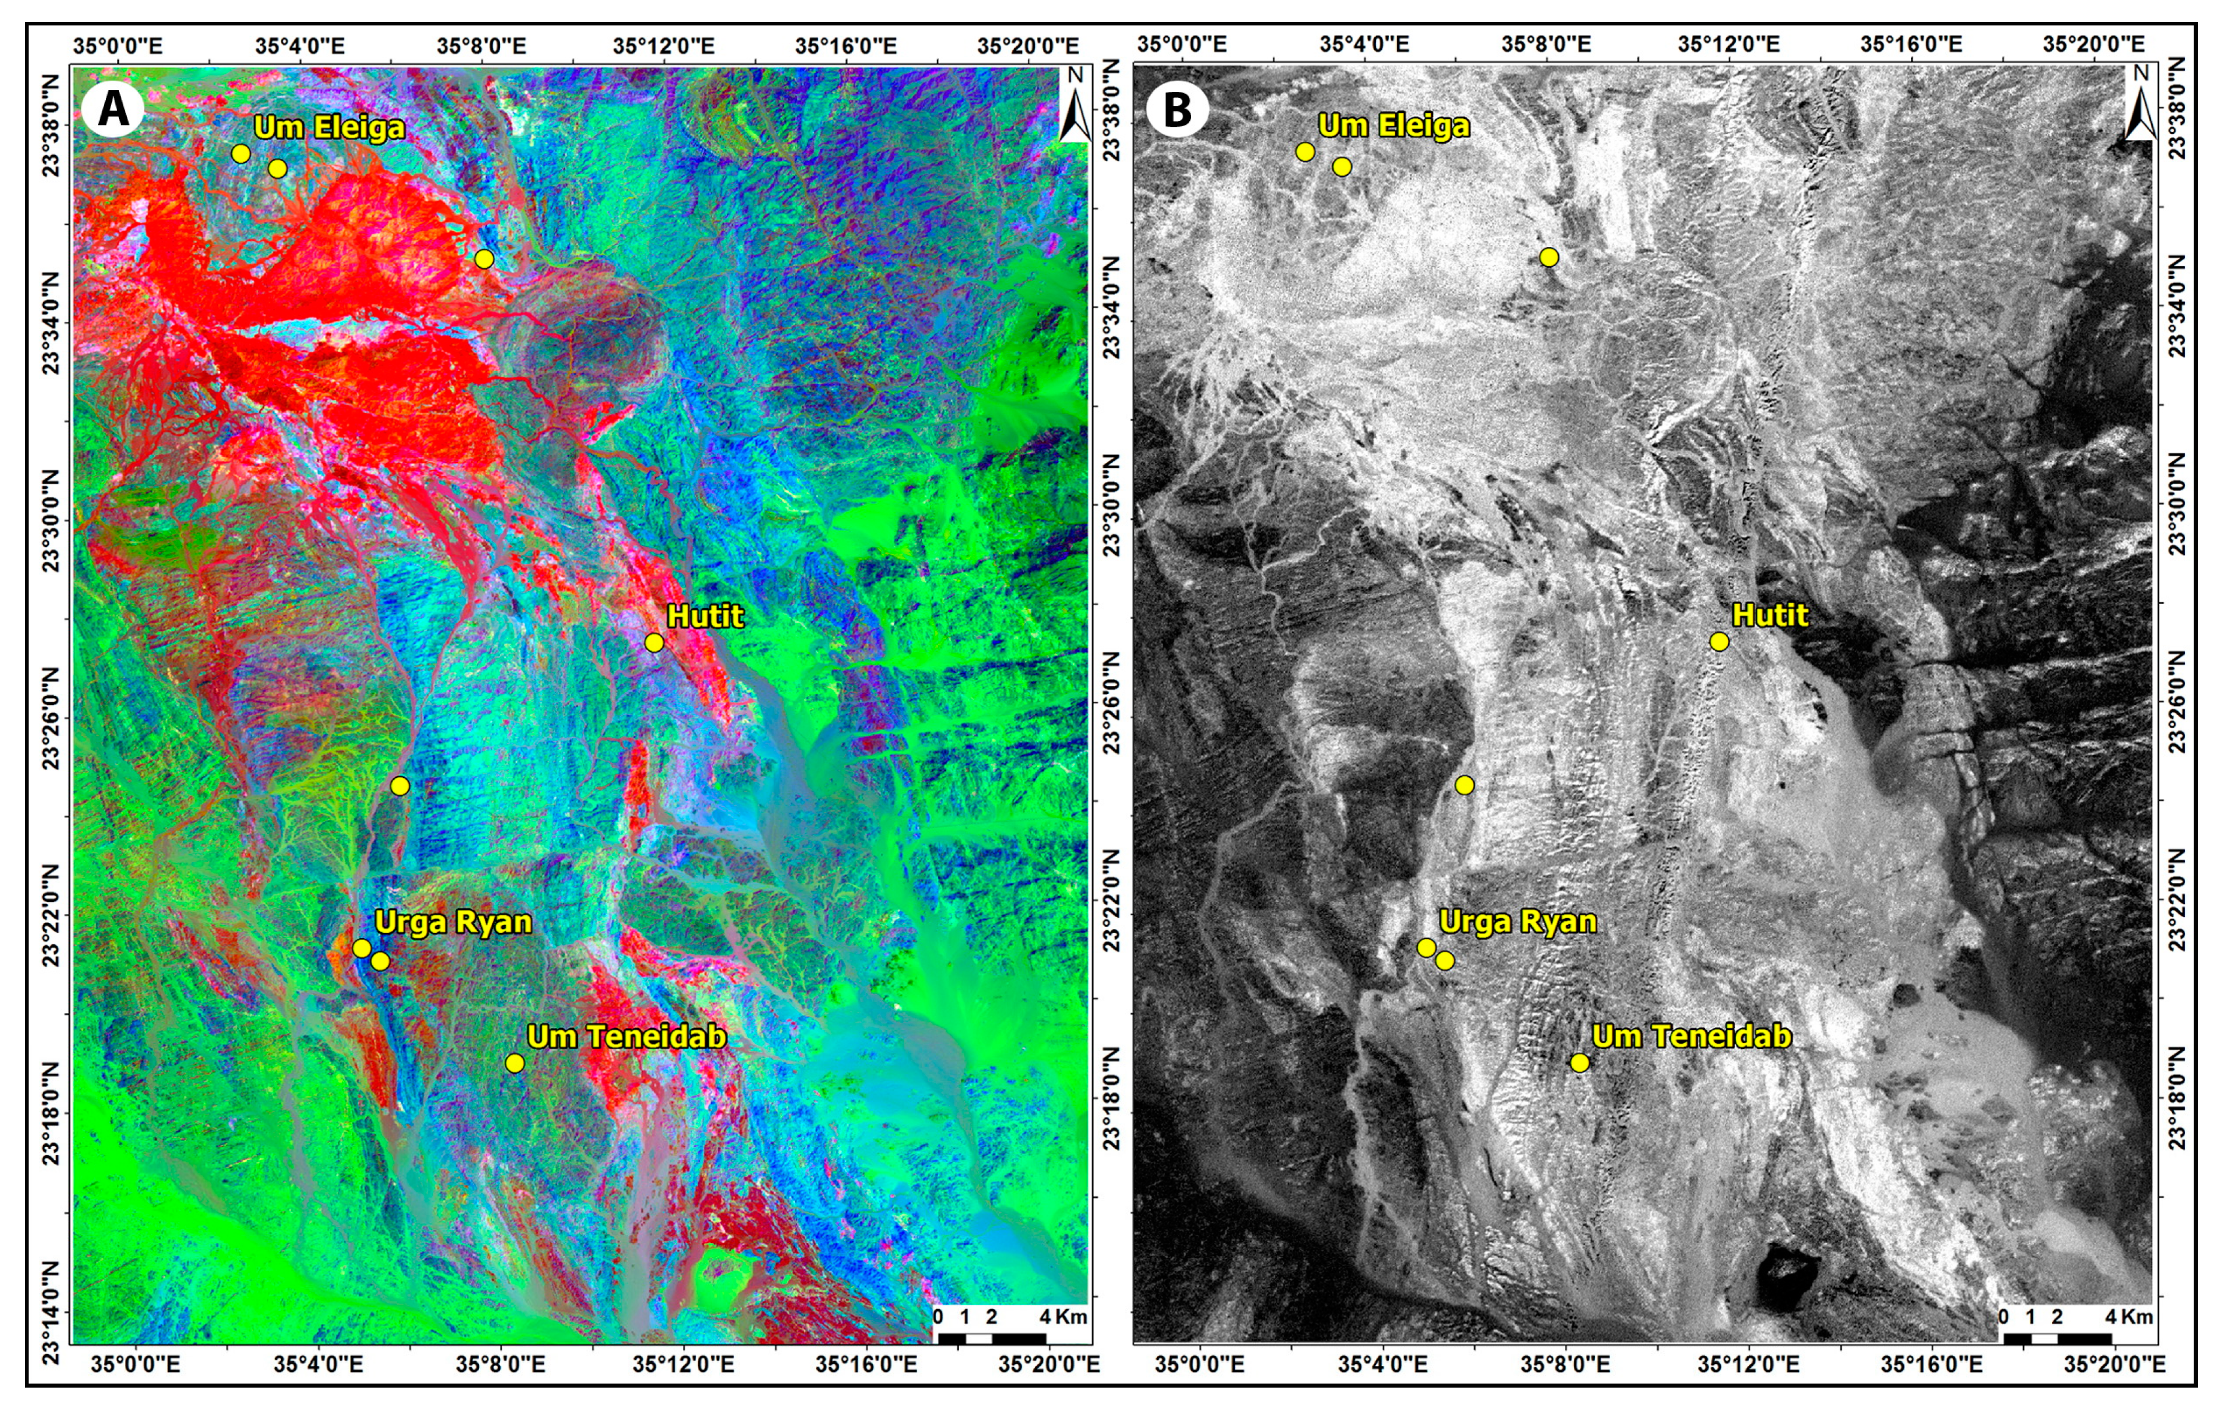
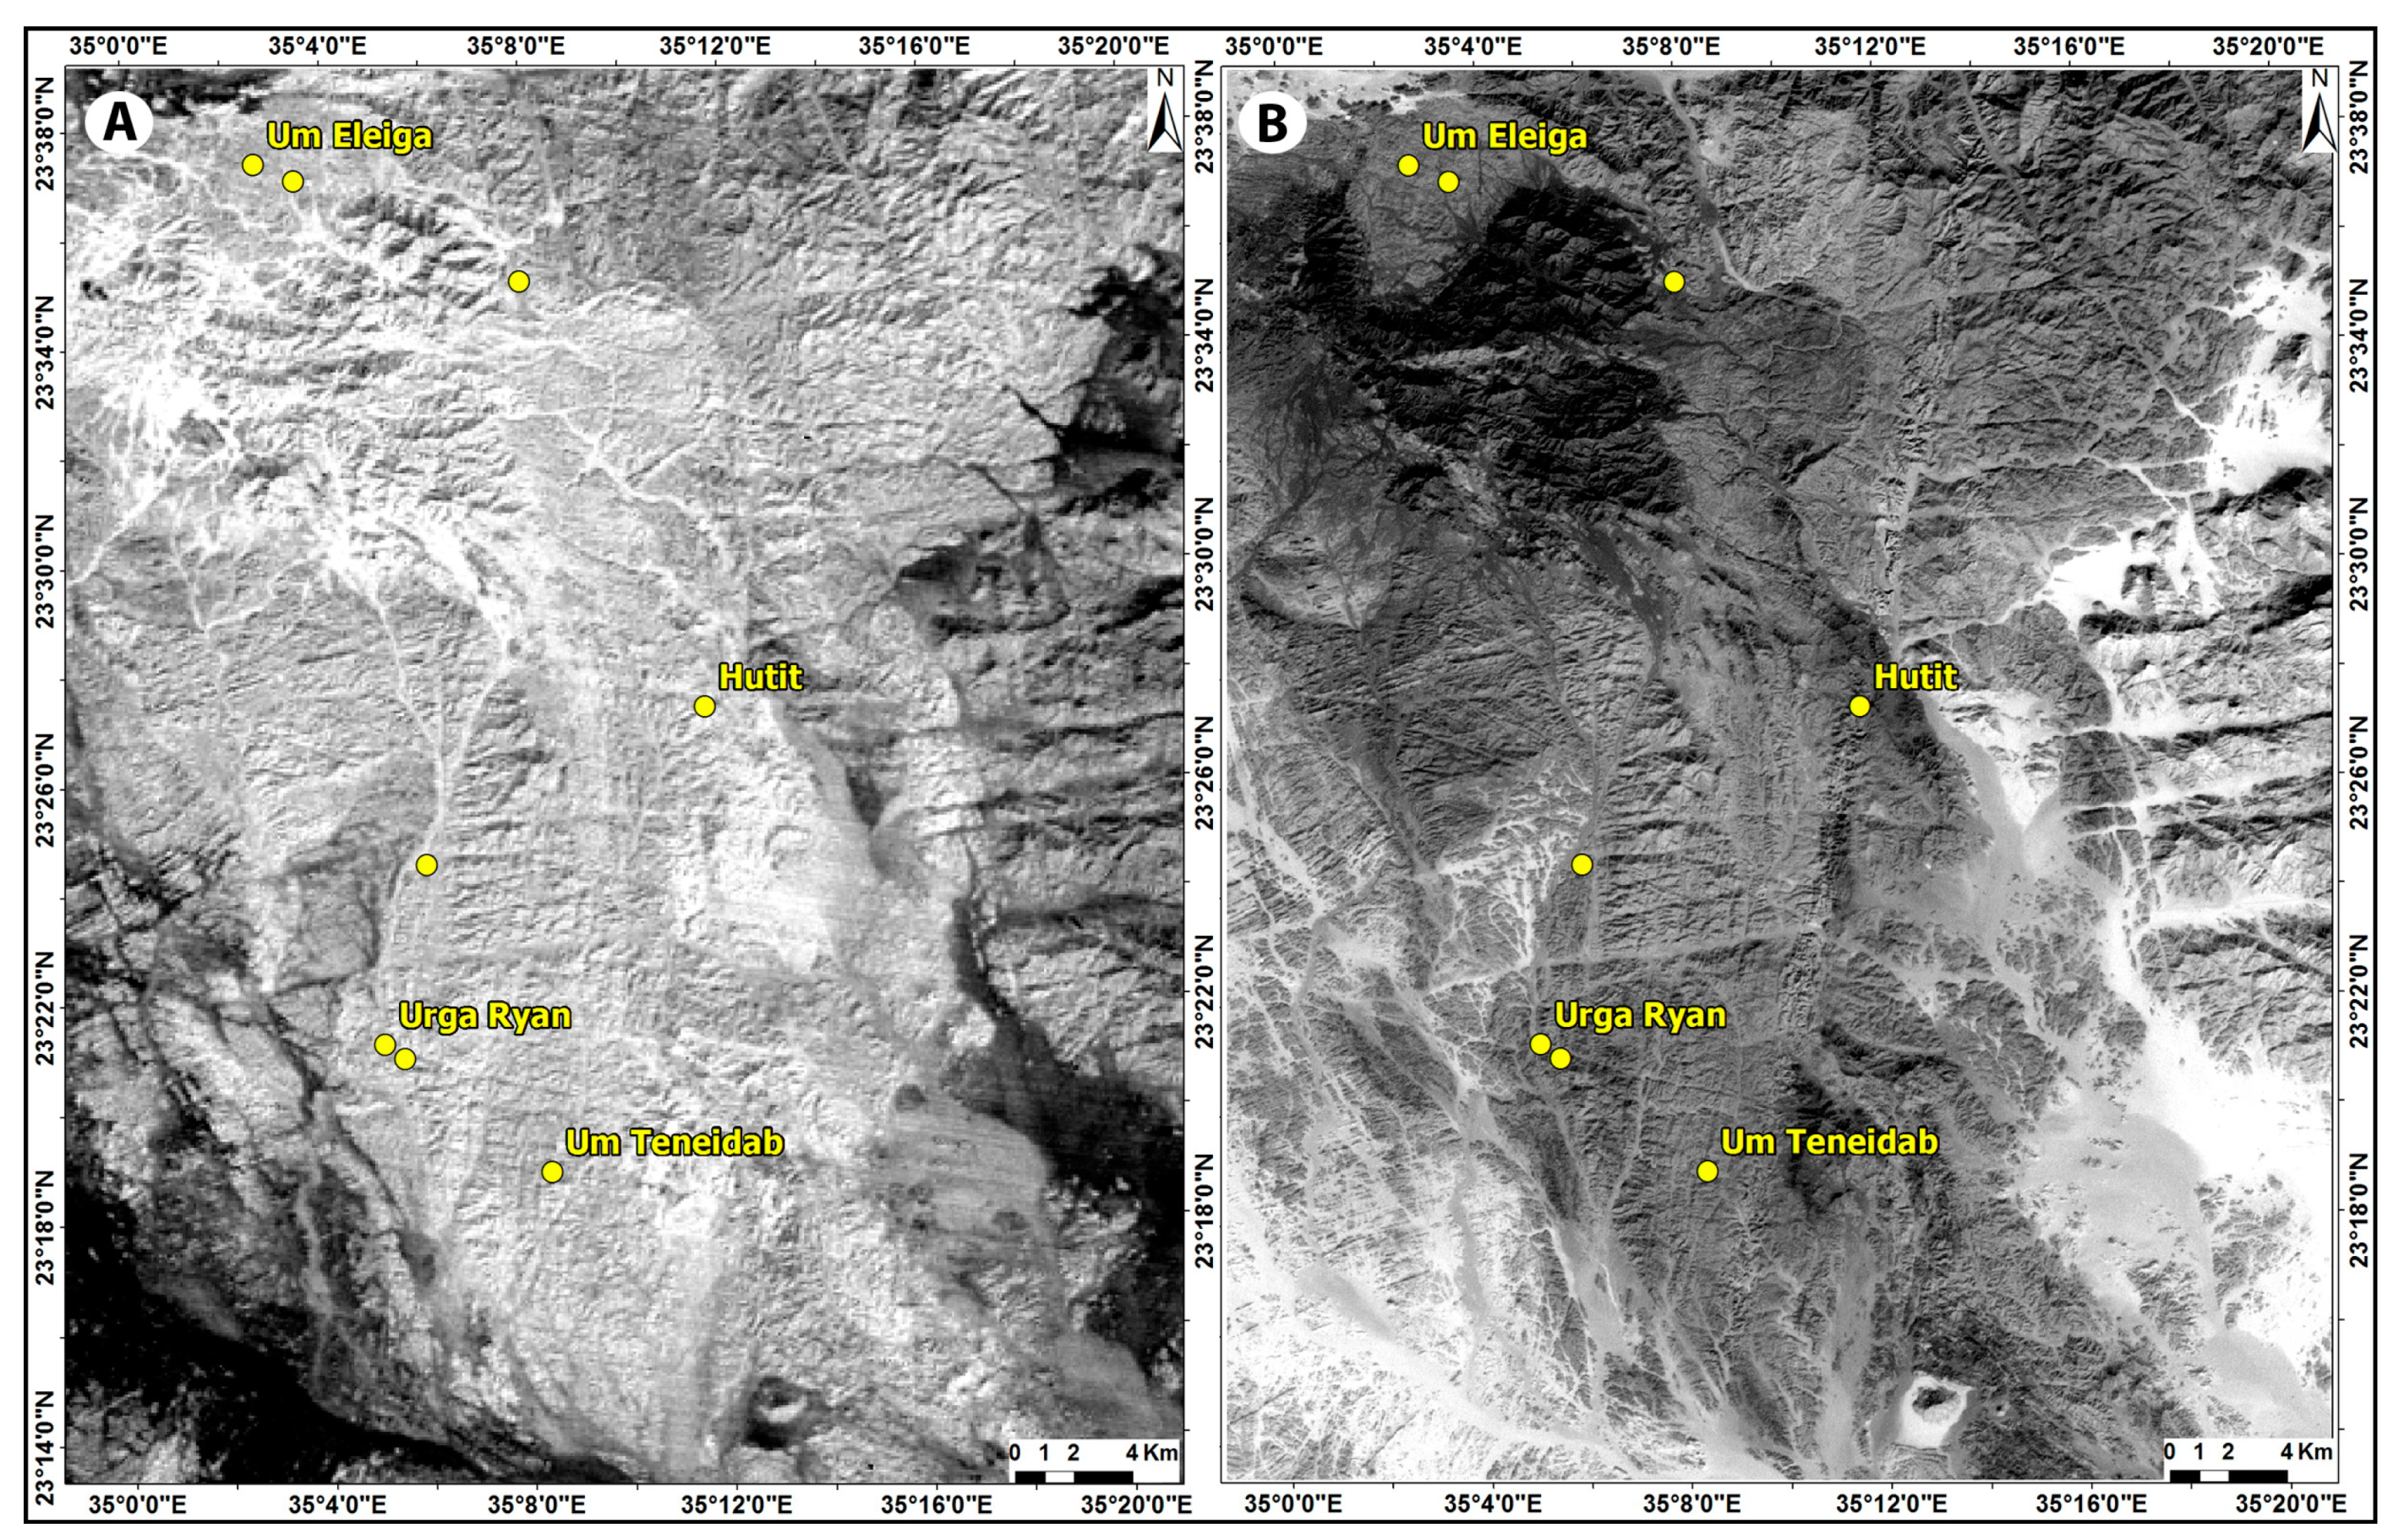
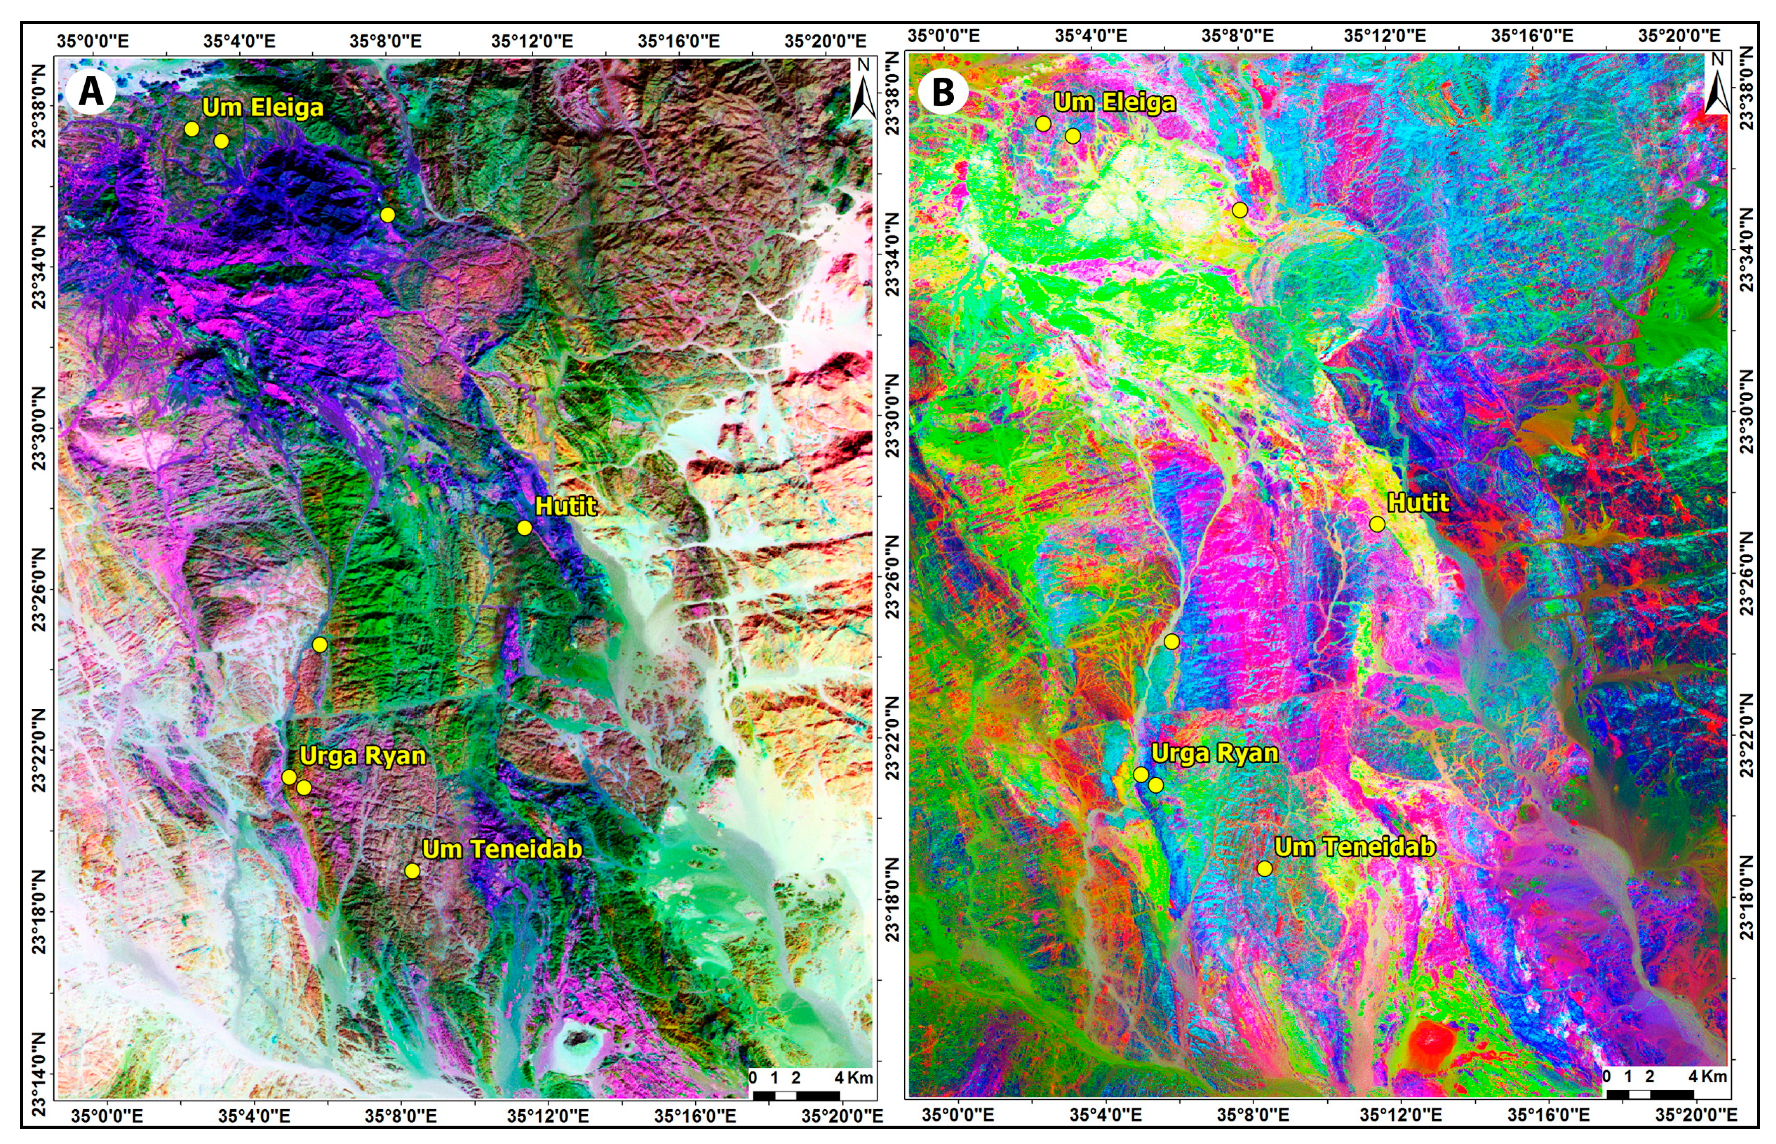
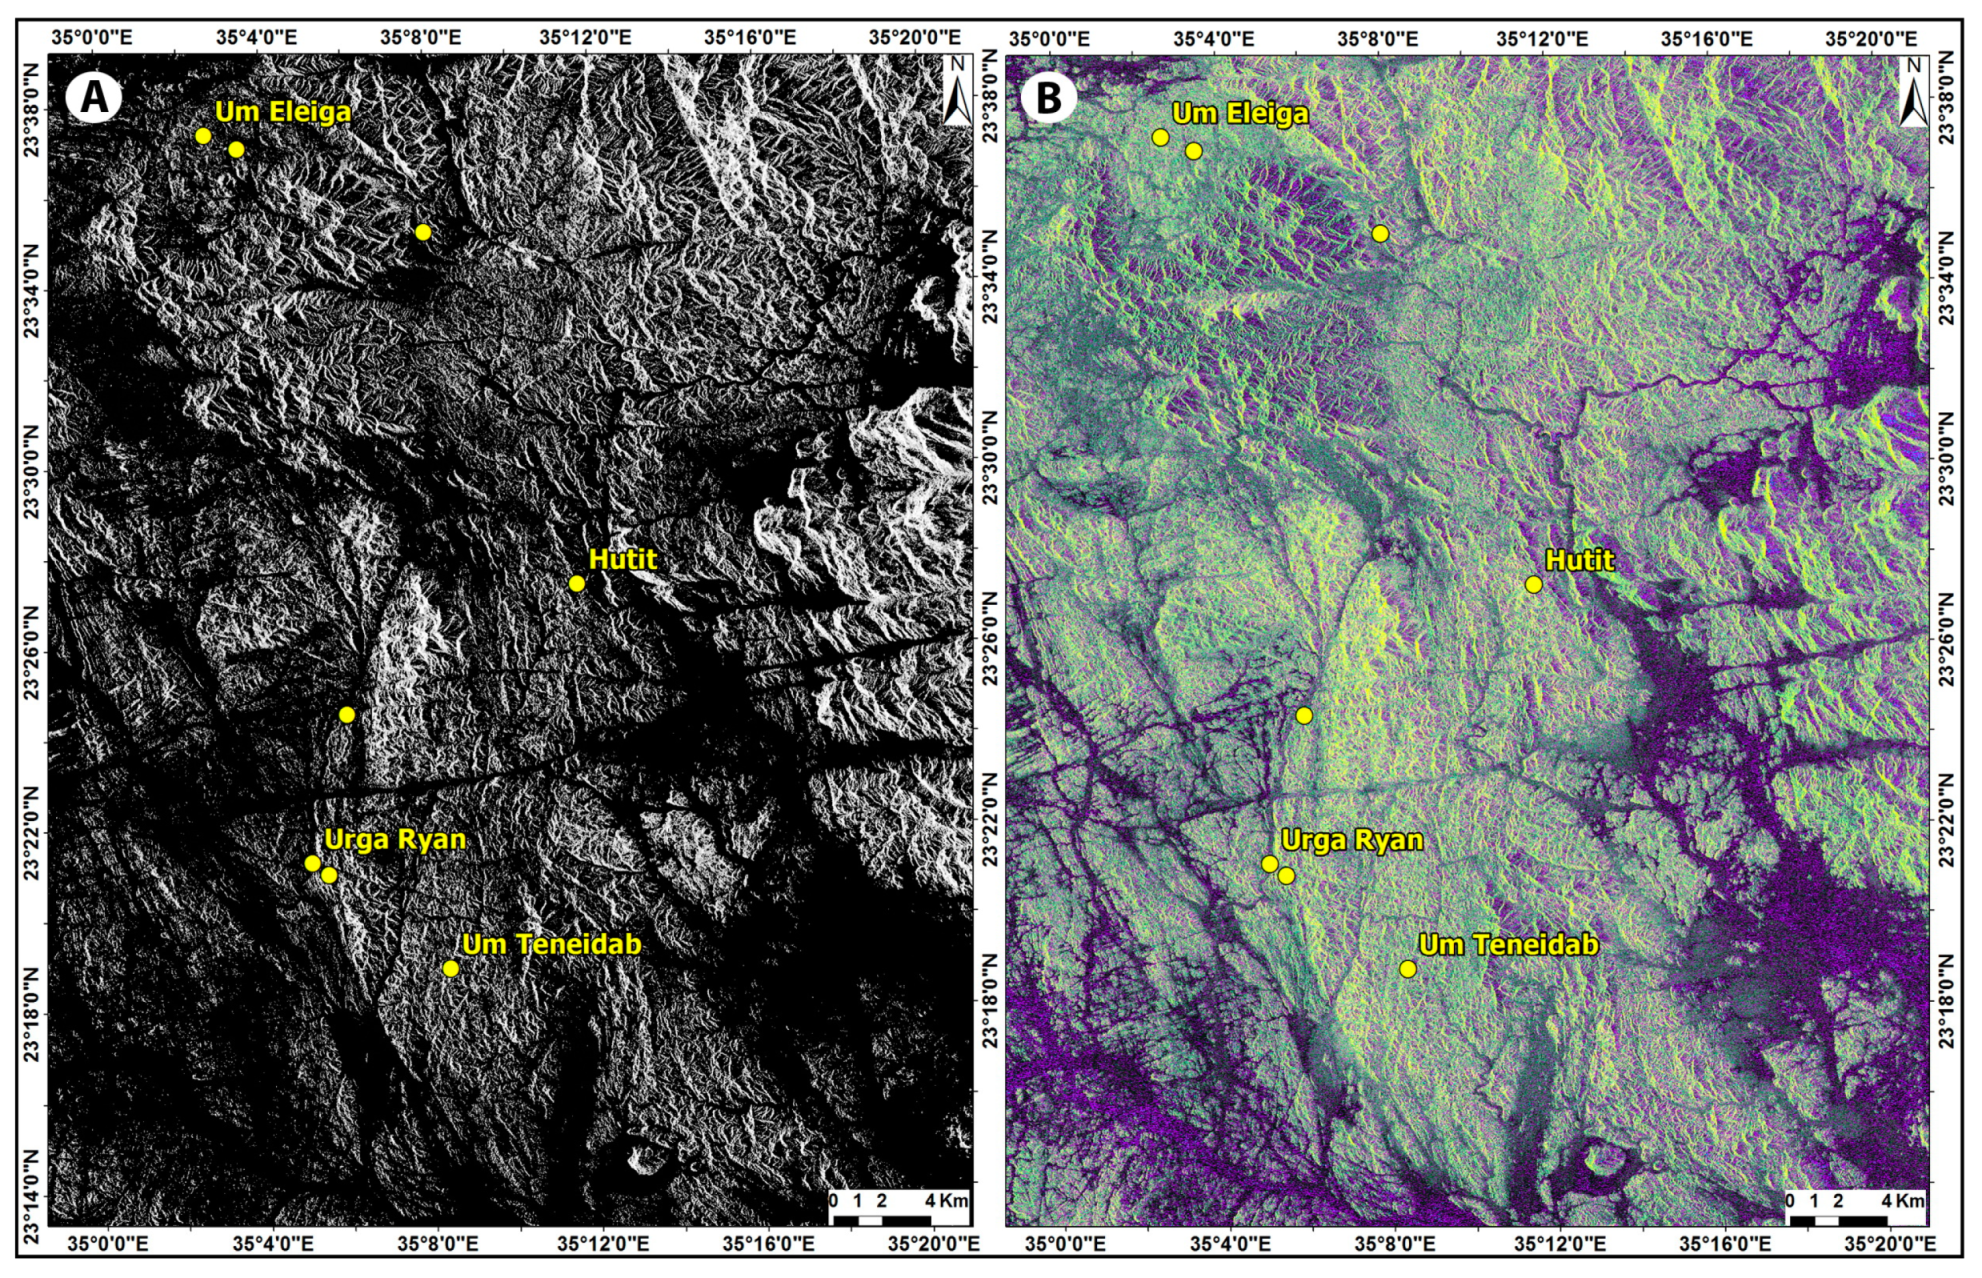
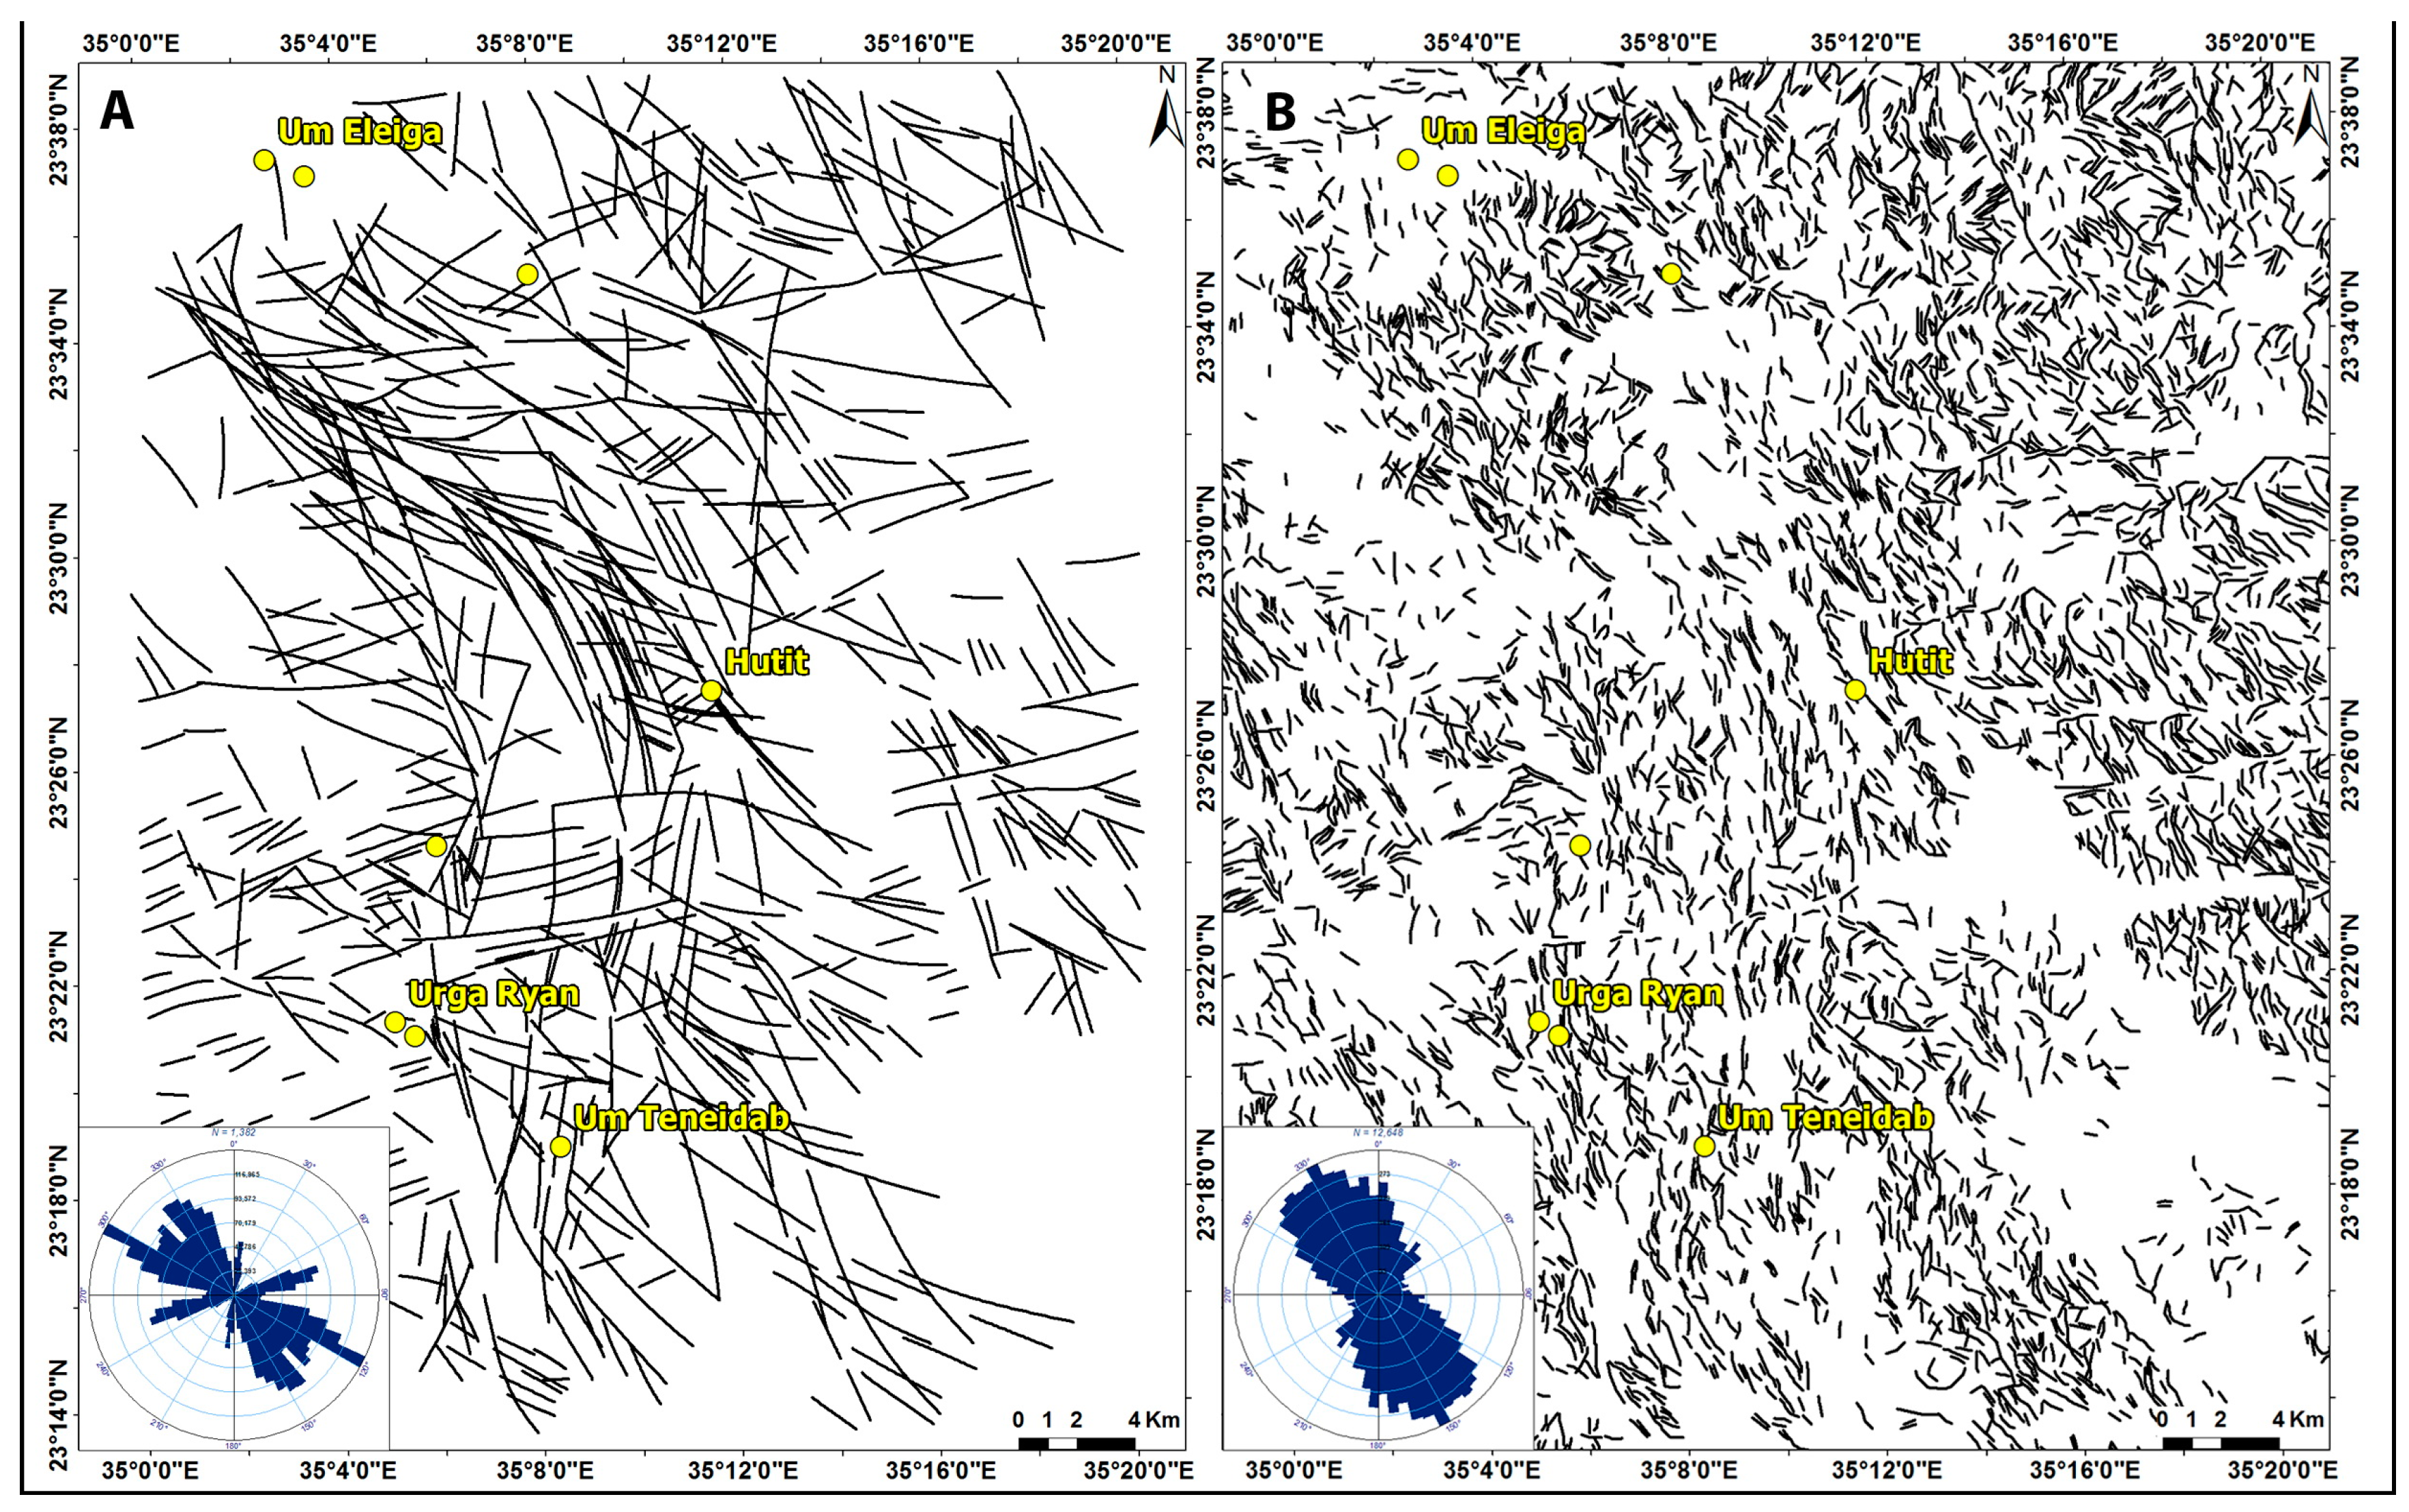
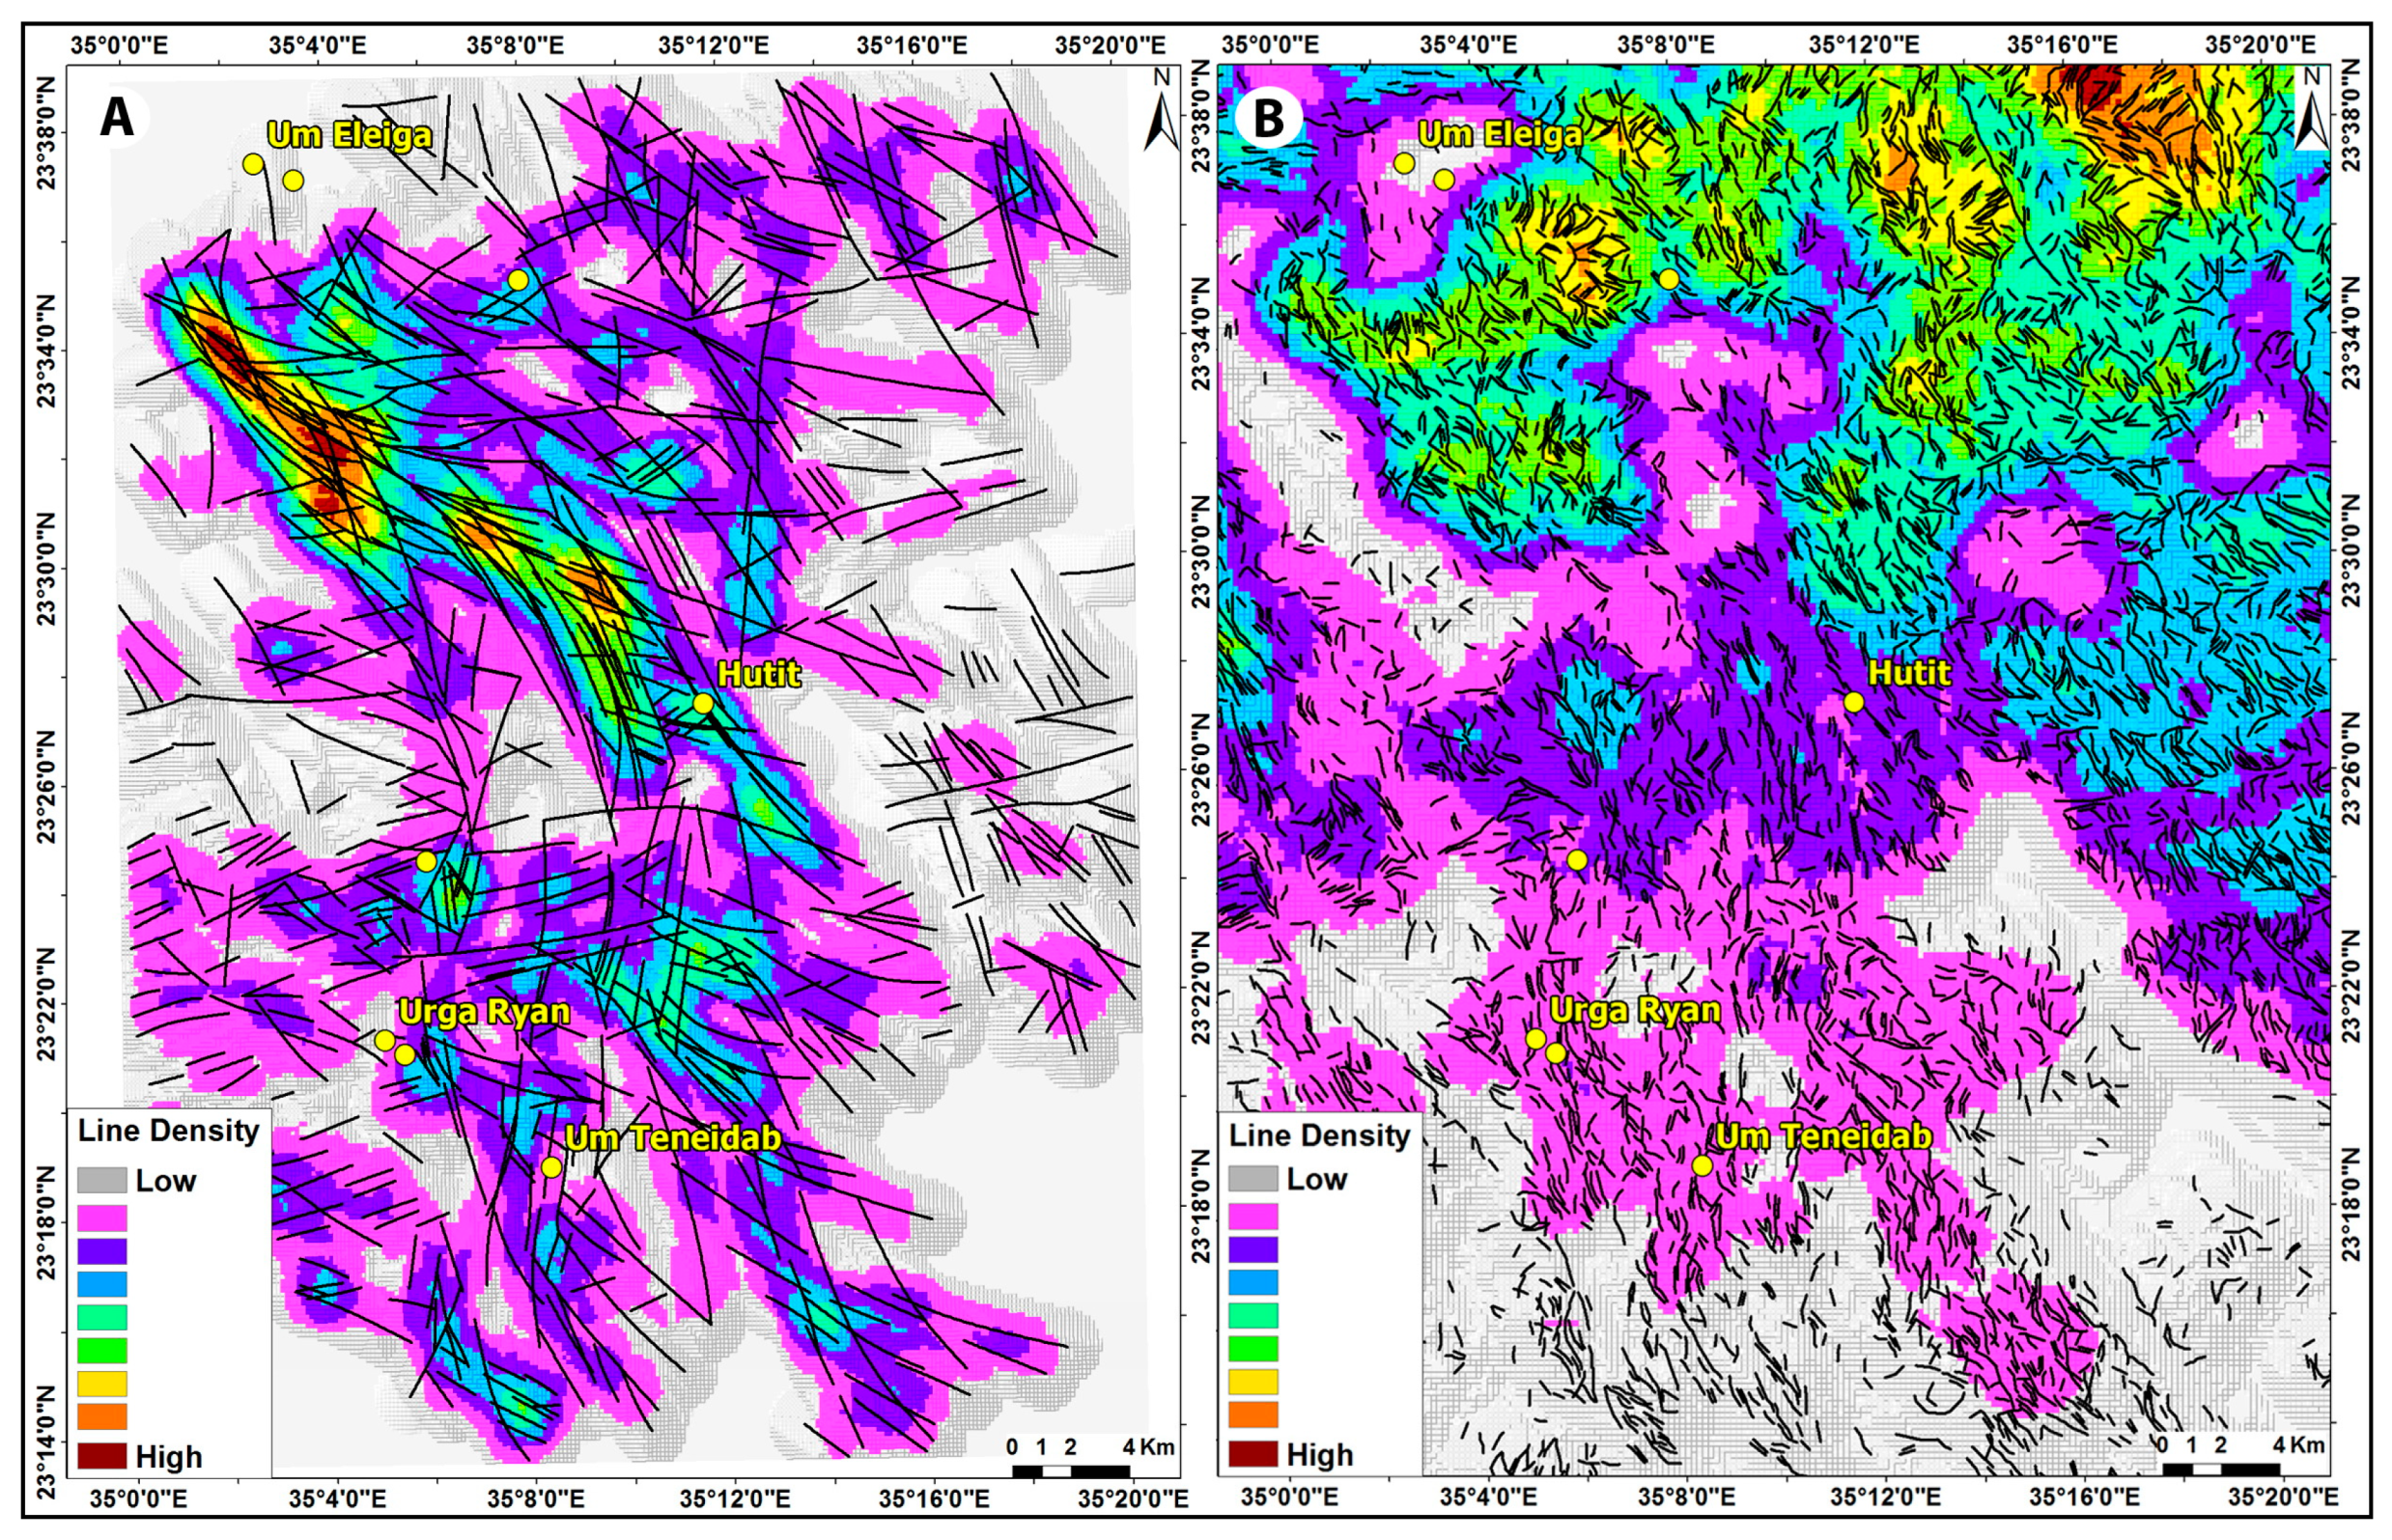
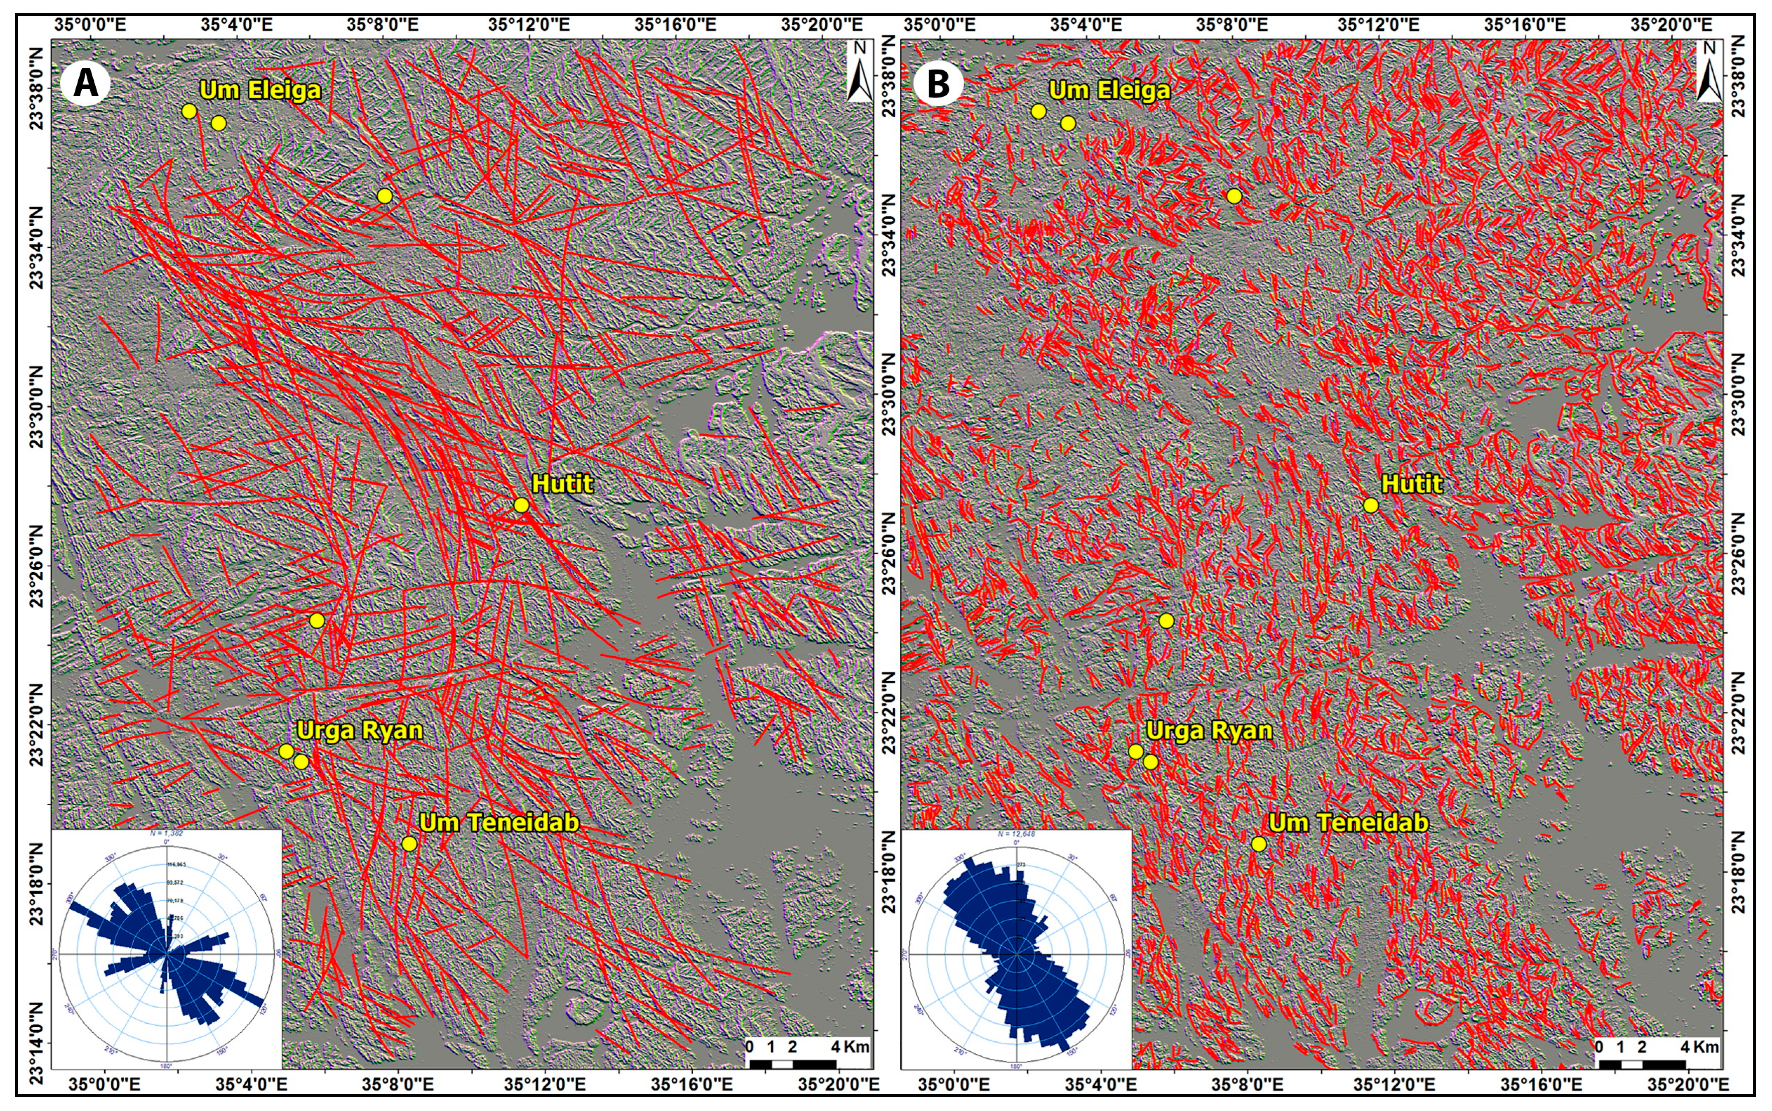
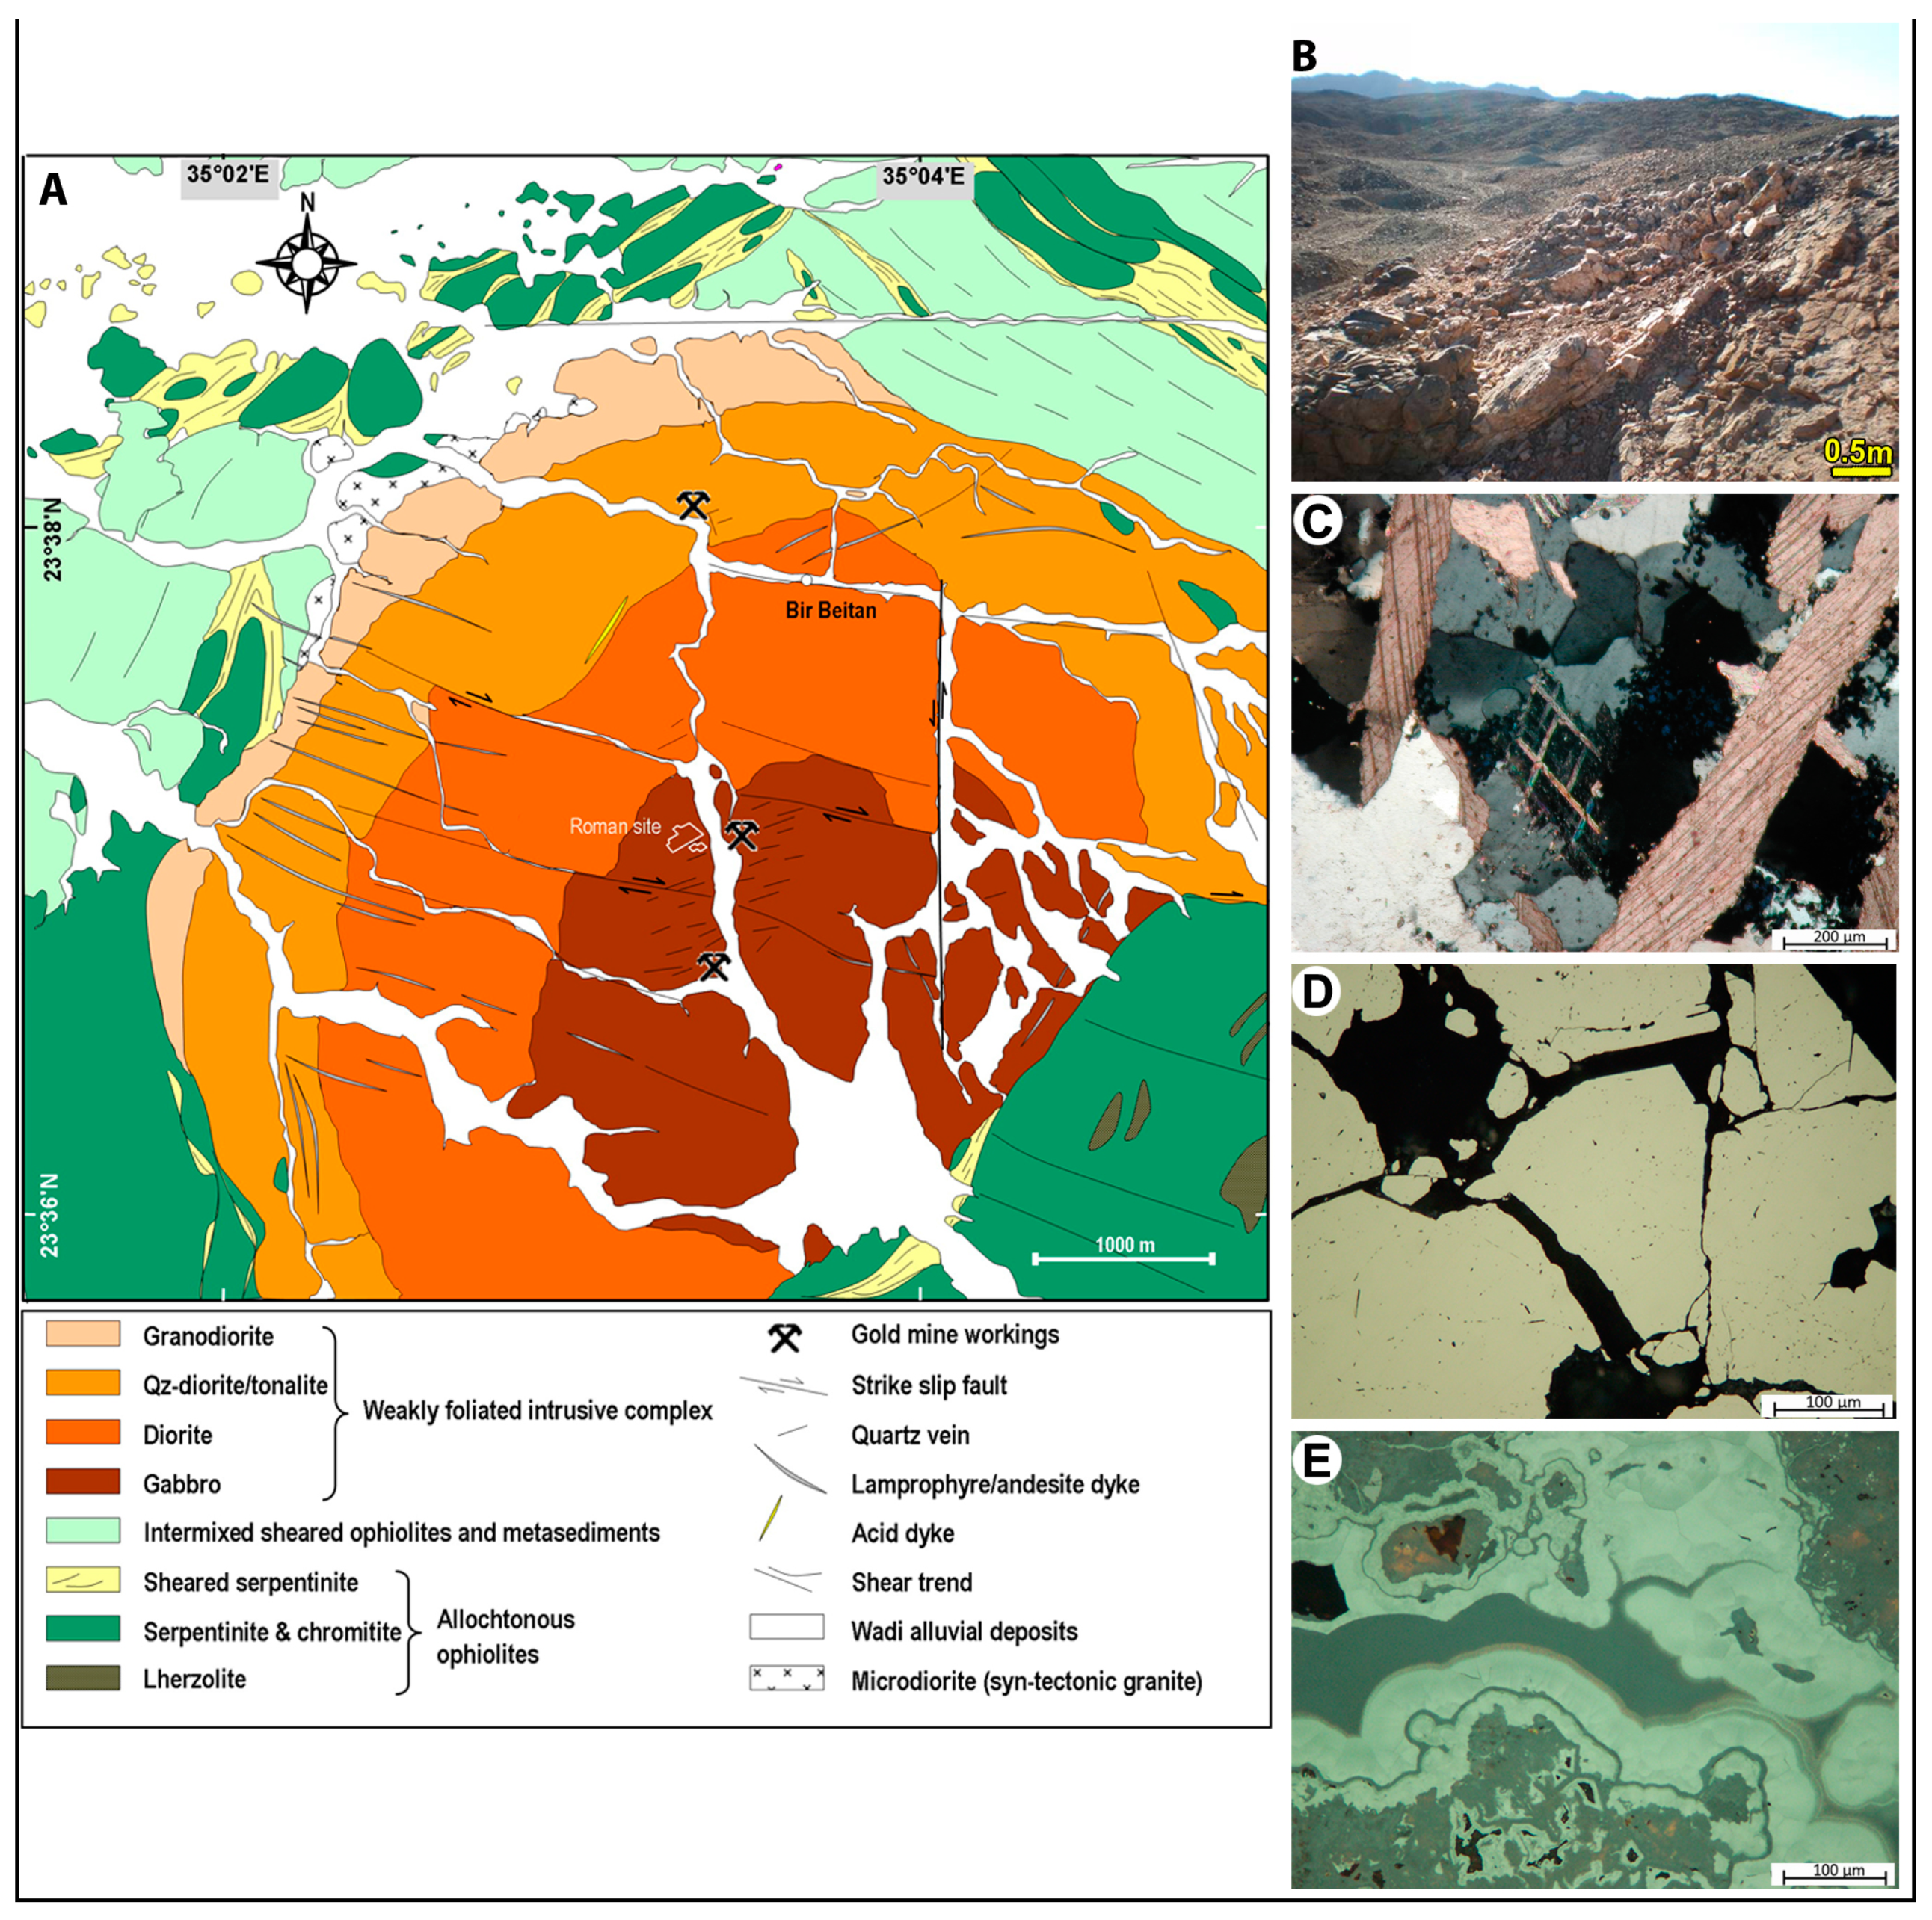
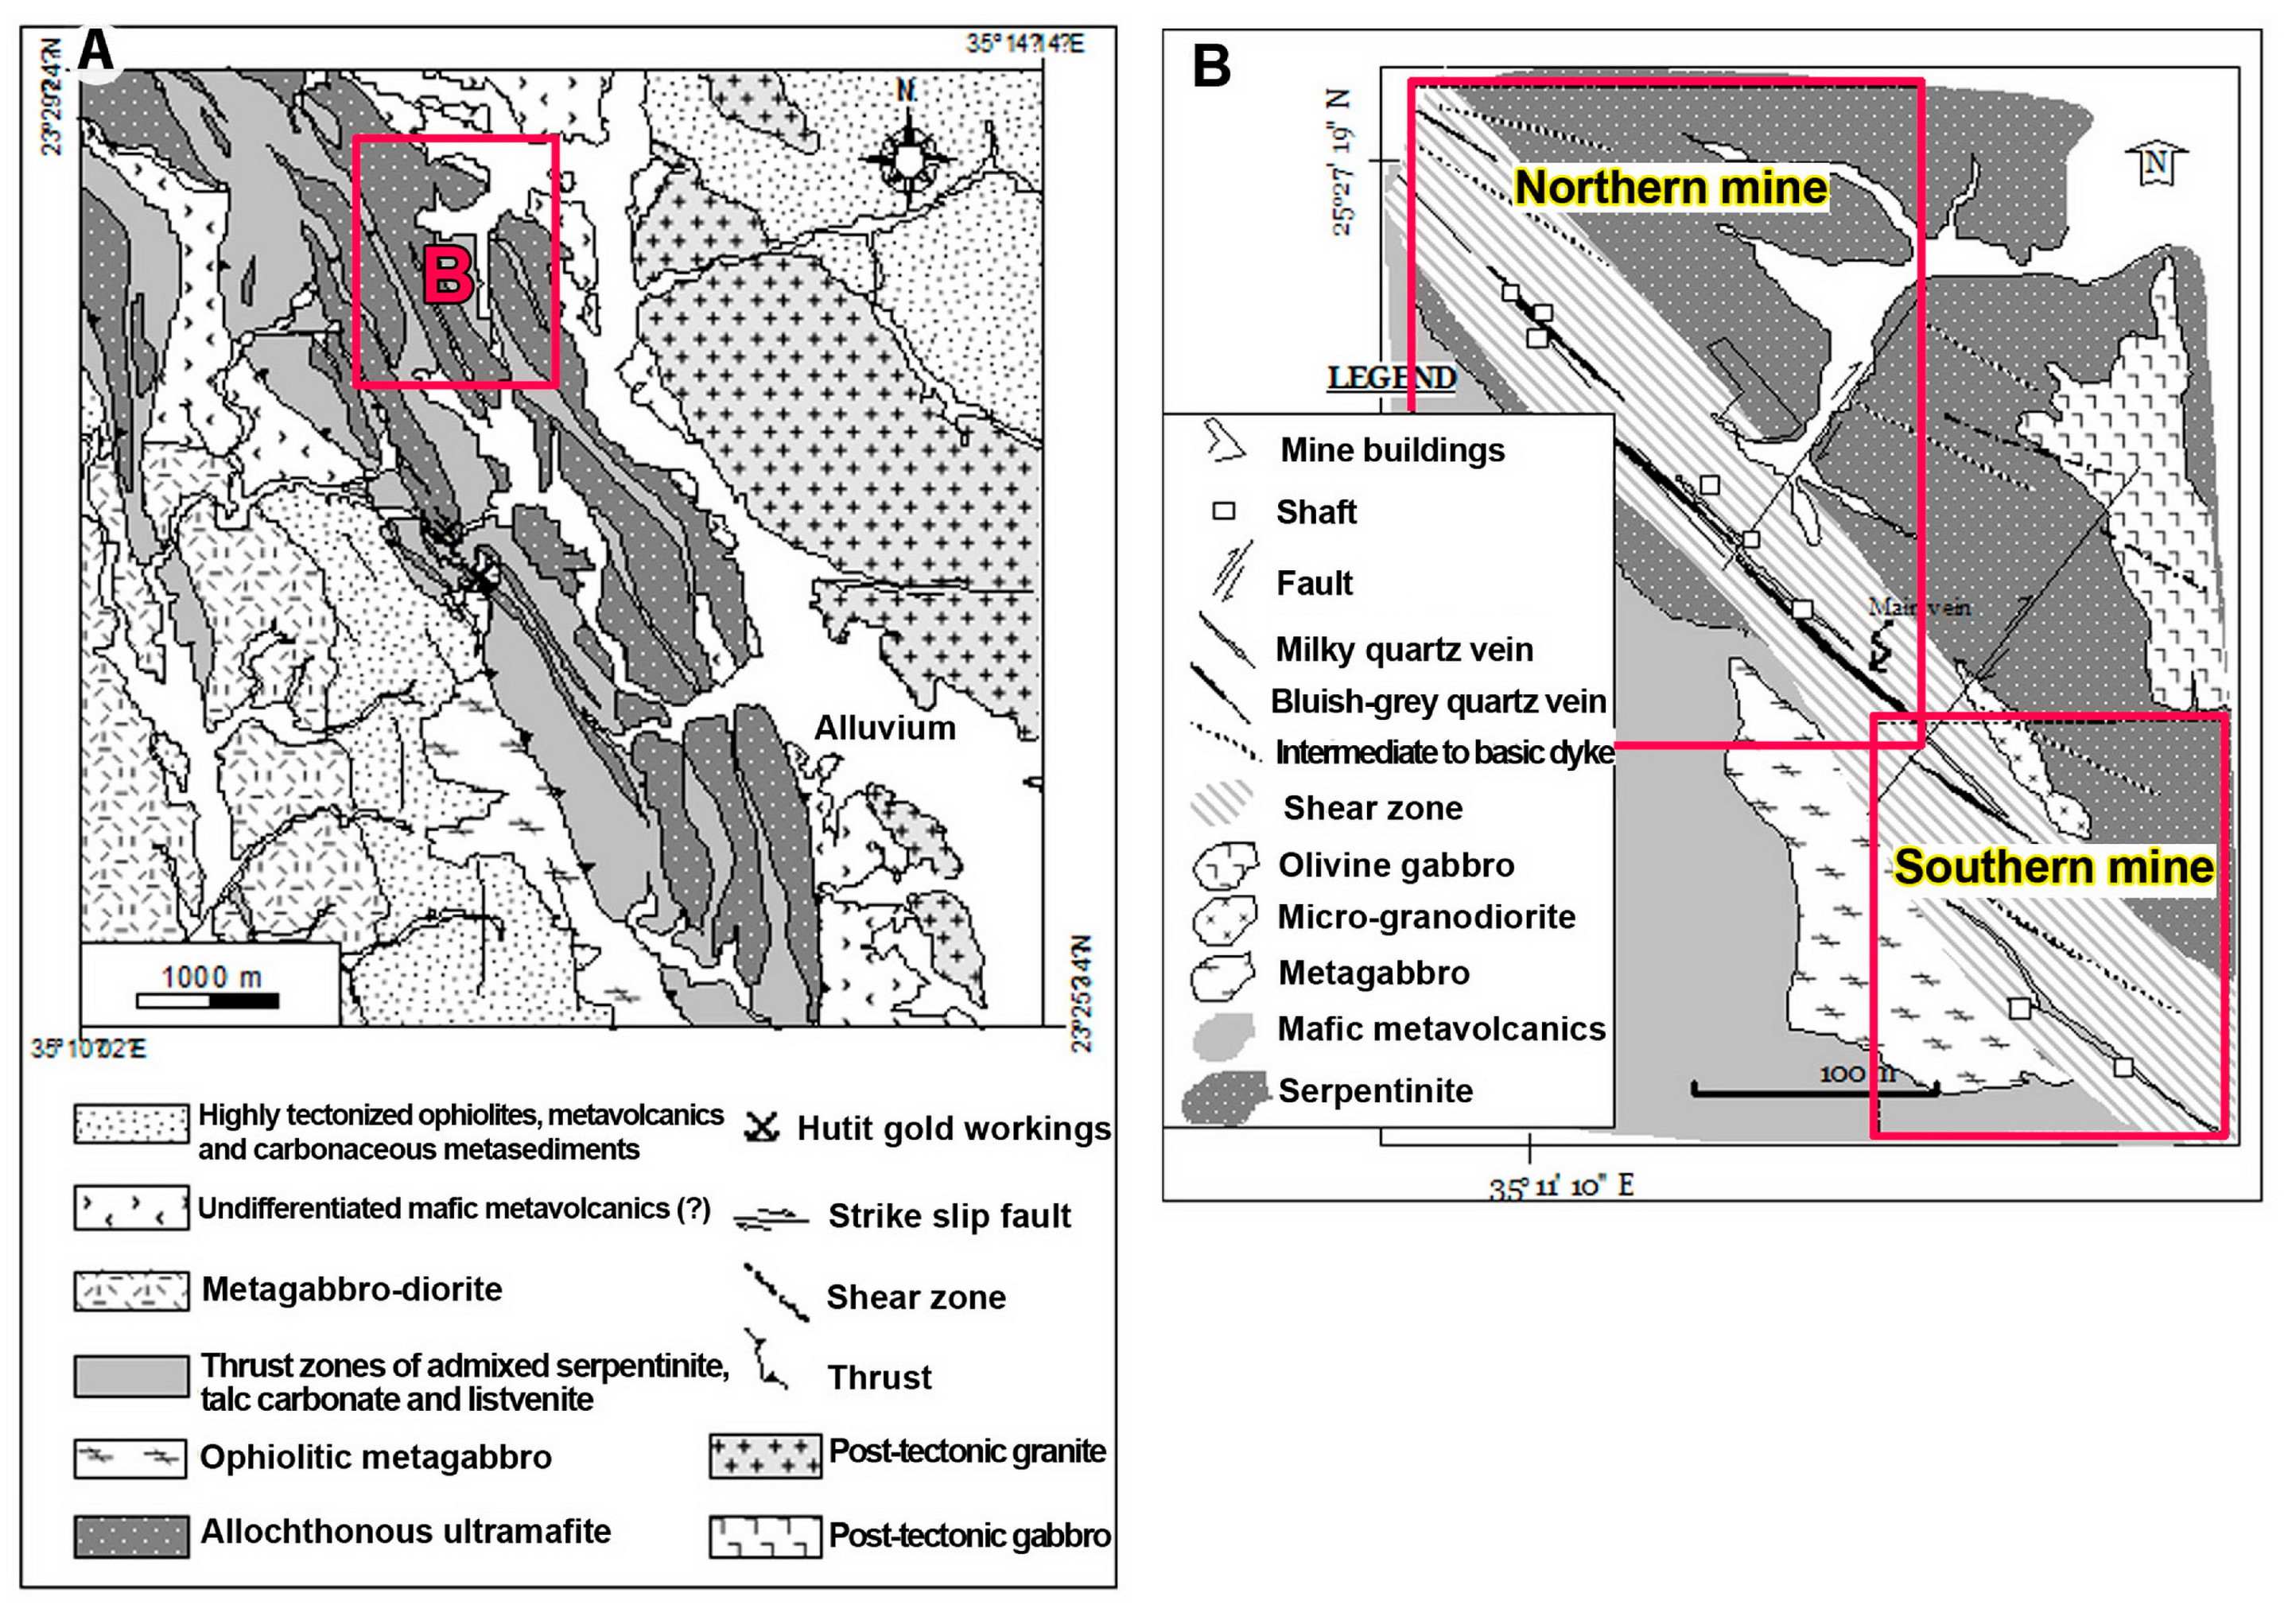
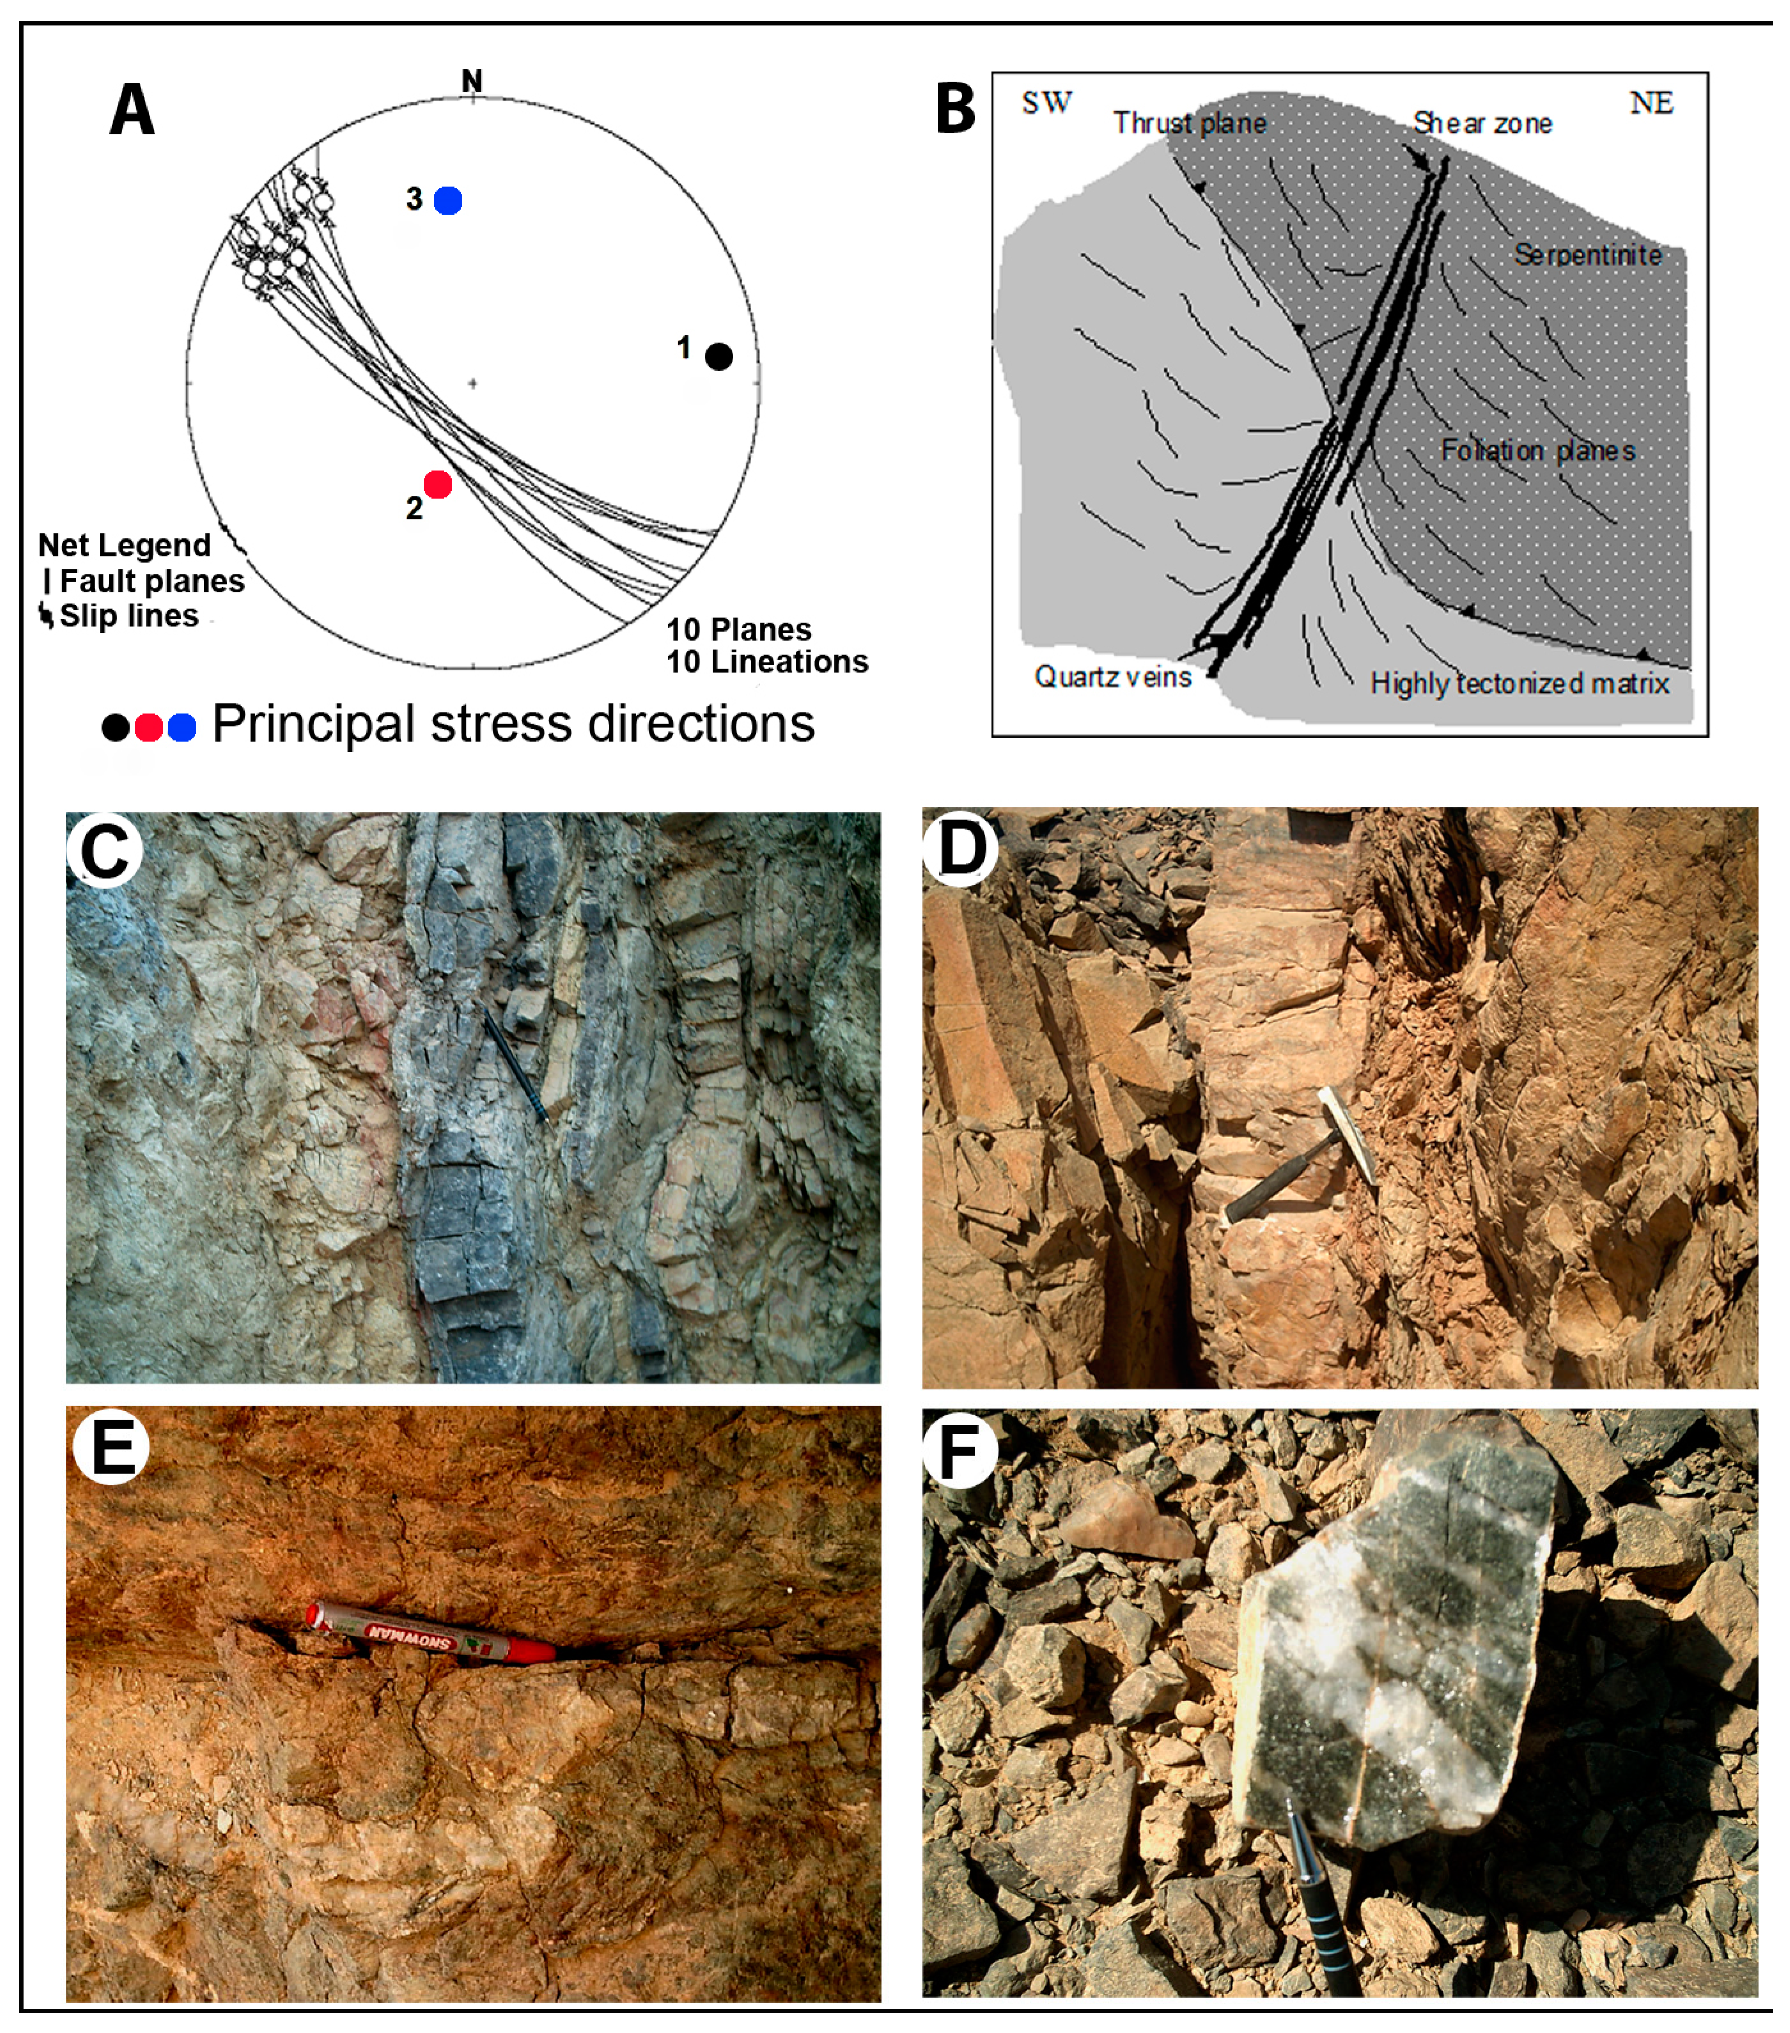
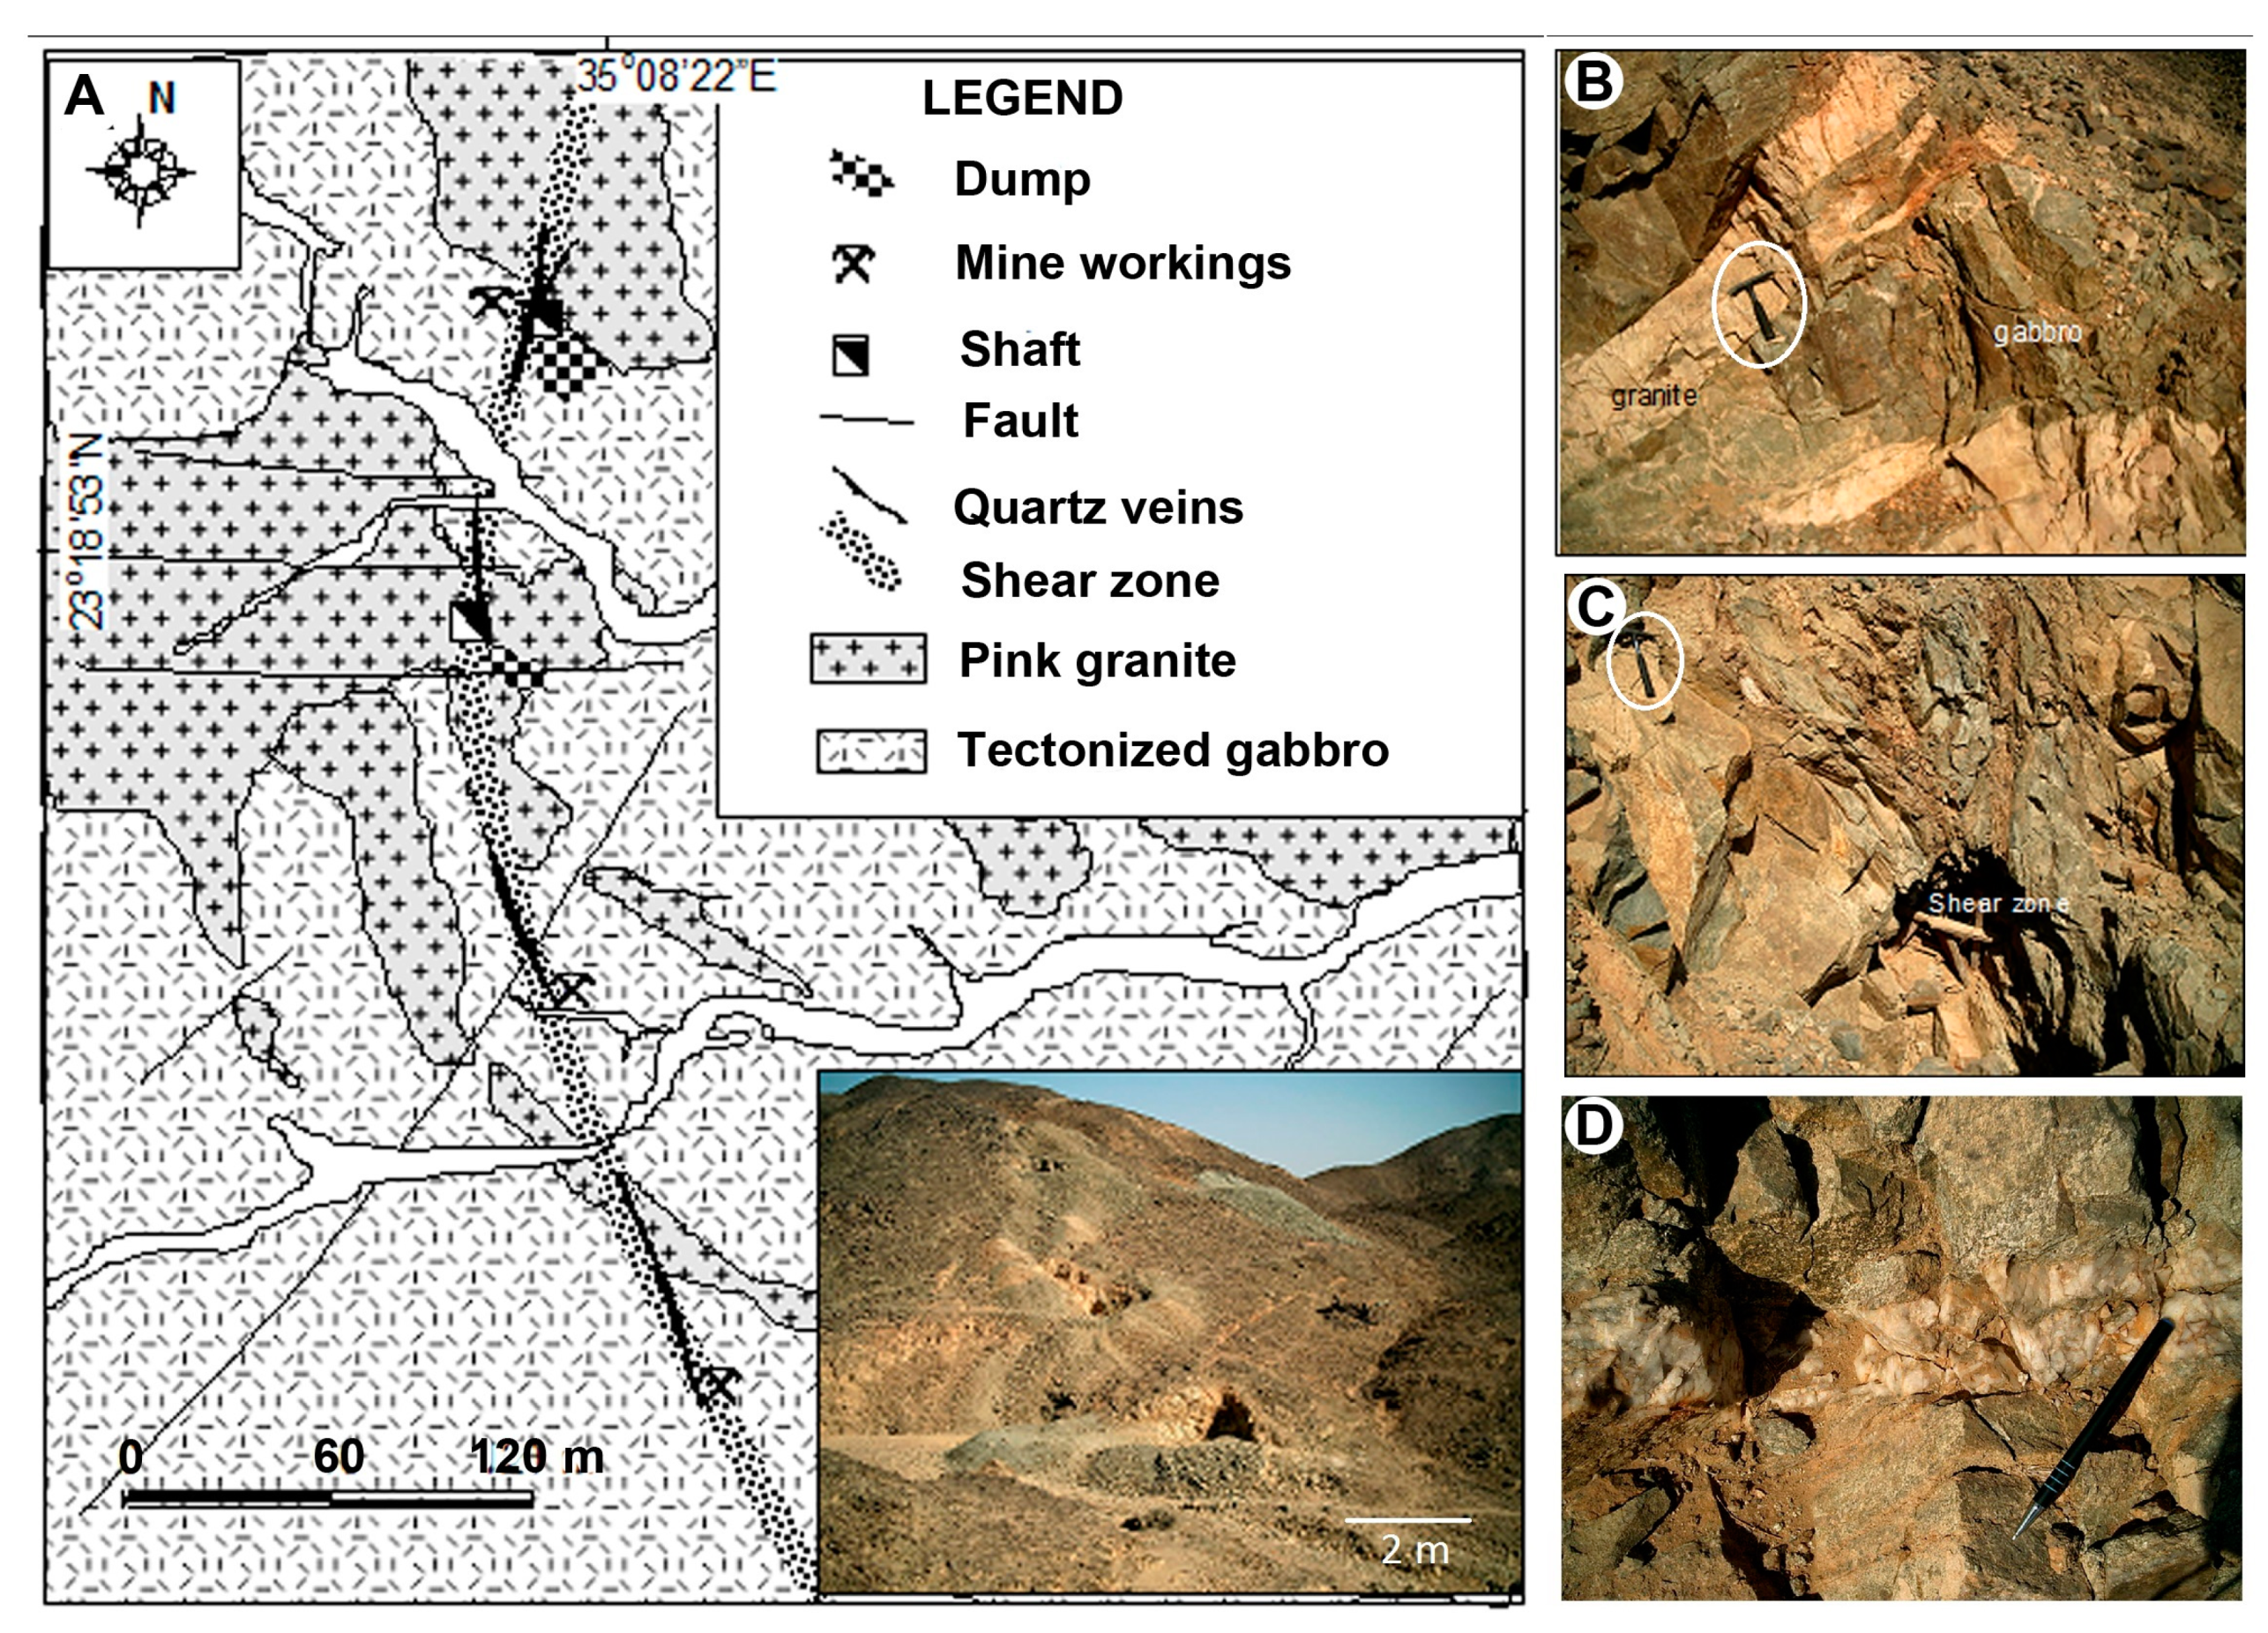
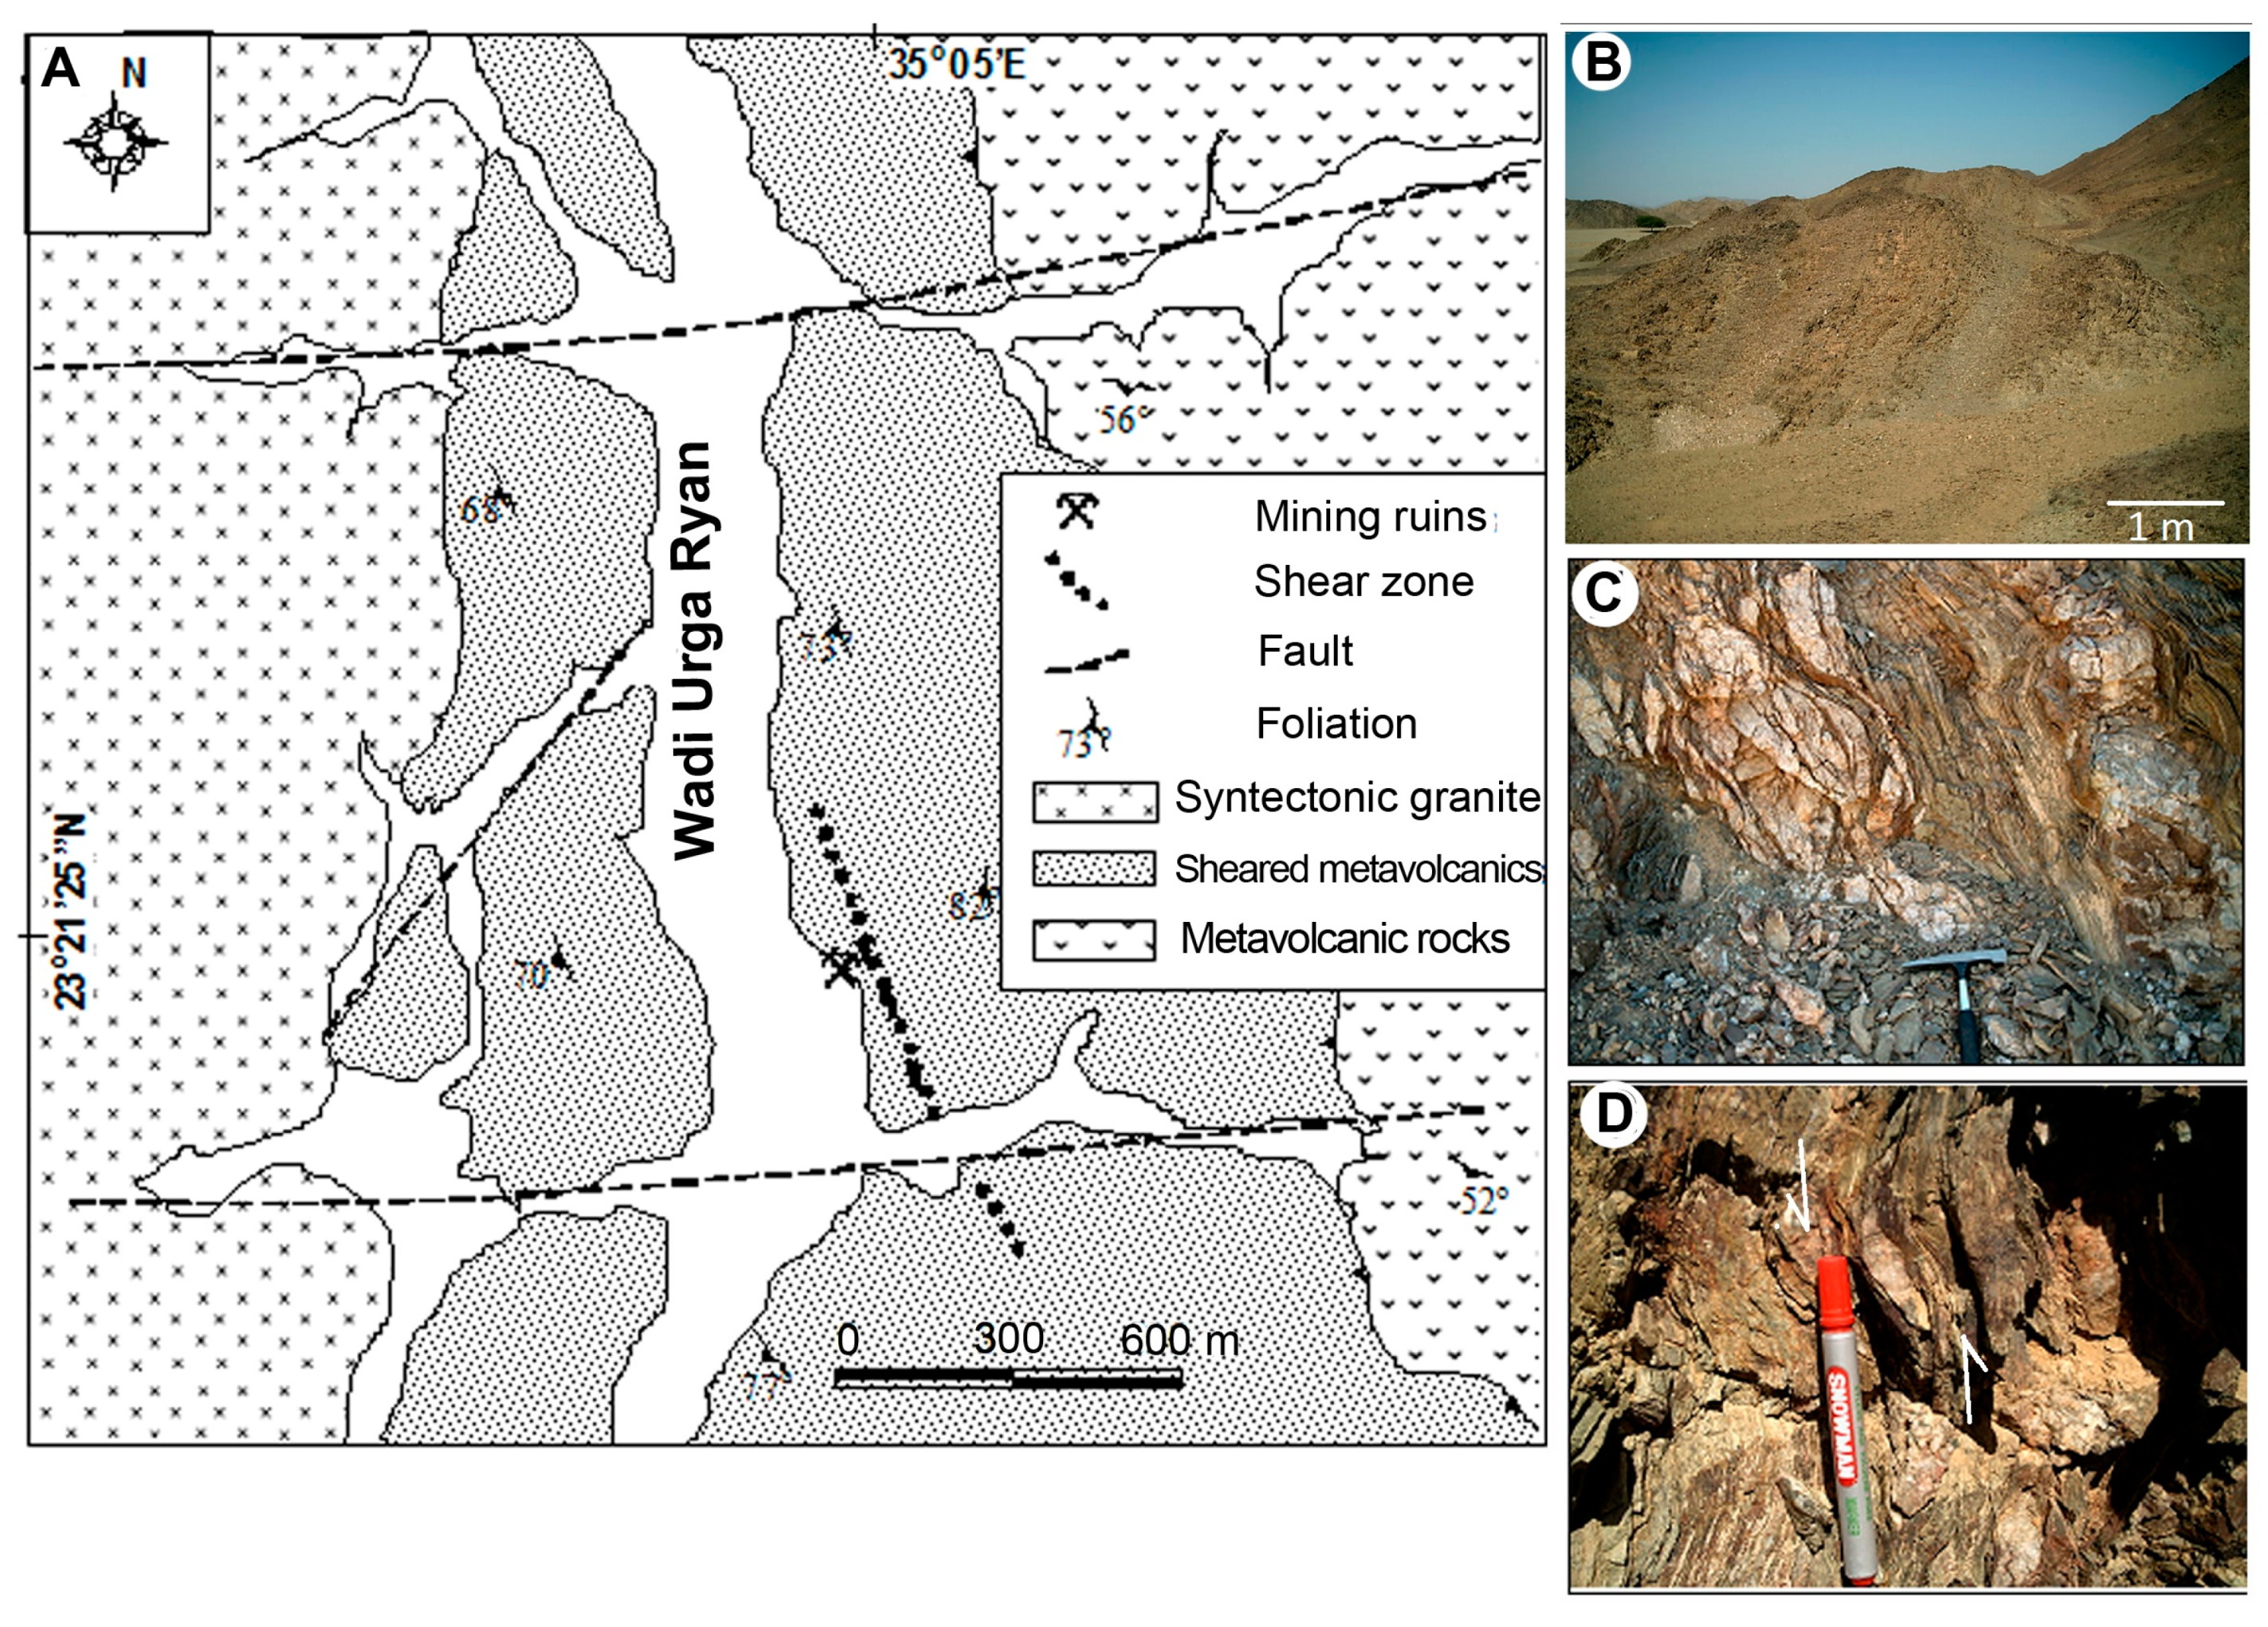
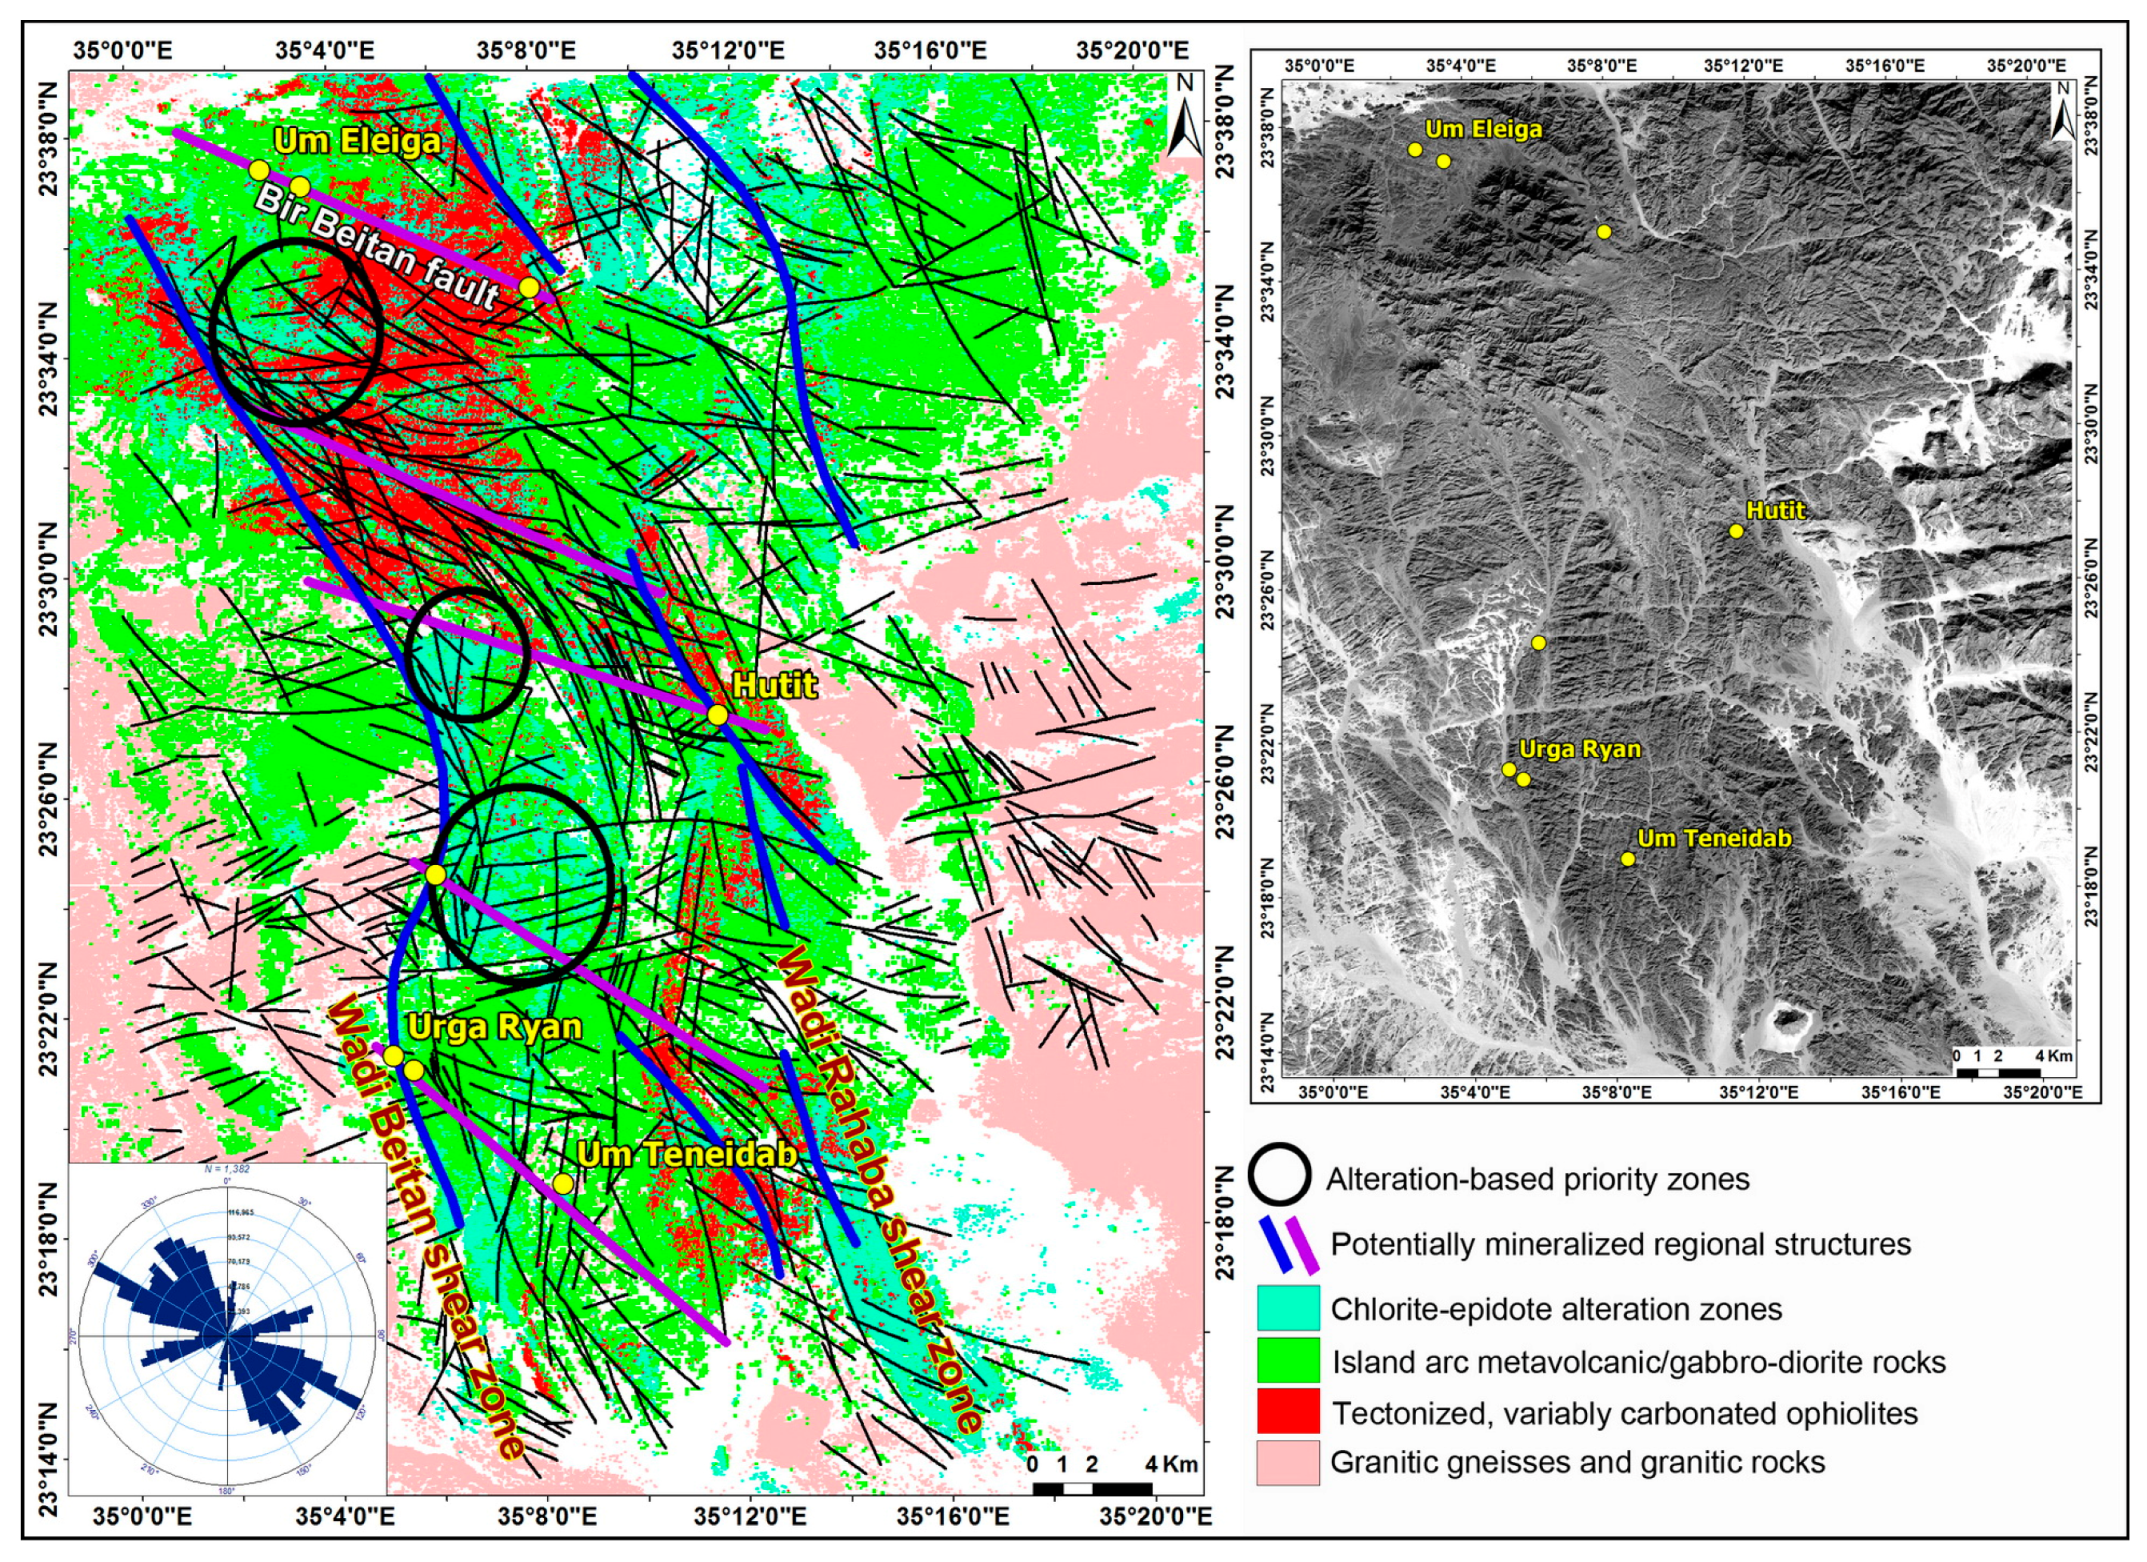
Table 1.
Summarized characteristics of the ASTER and Landsat-8 OLI/TIRS data.
| Aster | Landsat-8 OLI/TIRS | ||||||
|---|---|---|---|---|---|---|---|
| Bands | Spectral Region | Wavelength (µm) | Resolution (m) | Bands | Spectral Region | Wavelength (µm) | Resolution (m) |
| Band 1 | VNIR | 0.52–0.60 | 15 | Band 1 | Coastal | 0.433–0.453 | 30 |
| Band 2 | 0.63–0.69 | Band 2 | Blue | 0.450–0.515 | |||
| Band 3 | 0.78–0.86 | Band 3 | Green | 0.525–0.600 | |||
| Band 4 | SWIR | 1.60–1.70 | 30 | Band 4 | Red | 0.630–0.680 | |
| Band 5 | 2.145–2.185 | Band 5 | NIR | 0.845–0.885 | |||
| Band 6 | 2.185–2.225 | Band 6 | SWIR | 1.560–1.660 | |||
| Band 7 | 2.235–2.285 | Band 7 | 2.100–2.300 | ||||
| Band 8 | 2.295–2.365 | Band 8 | Panchromatic | 0.500–0.680 | 15 | ||
| Band 9 | 2.360–2.430 | Band 9 | Cirrus | 1.360–1.390 | 30 | ||
| Band 10 | TIR | 8.125–8.475 | 90 | Band 10 | TIR | 10.60–11.19 | 100 |
| Band 11 | 8.475–8.825 | Band 11 | 11.50–12.51 | ||||
| Band 12 | 8.925–9.275 | ||||||
| Band 13 | 10.25–10.95 | ||||||
| Band 14 | 10.95–11.65 | ||||||
Table 2.
Eigenvector loadings of principal component analysis (PCA) for OLI-band ratios and ASTER−RBD mineralogical indices. PC—principal component, QI—quartz index, Var.%—variation in percentage.
Table 2.
Eigenvector loadings of principal component analysis (PCA) for OLI-band ratios and ASTER−RBD mineralogical indices. PC—principal component, QI—quartz index, Var.%—variation in percentage.
| Eigenvector | Fe–Mg-OH | QI | (5 + 7)/6 | (6 + 9)/82 | (6/7) | (4/5) | (4/2) | (5/6) | Var.% |
|---|---|---|---|---|---|---|---|---|---|
| PC1 | −0.492 | −0.276 | −0.013 | 0.480 | 0.313 | 0.375 | −0.419 | 0.193 | 44.4 |
| PC2 | 0.011 | −0.618 | −0.746 | −0.173 | −0.001 | −0.084 | 0.081 | −0.135 | 19.8 |
| PC3 | 0.135 | 0.027 | −0.078 | −0.068 | 0.537 | −0.017 | 0.452 | 0.691 | 16.3 |
| PC4 | −0.240 | −0.101 | 0.176 | 0.135 | 0.398 | −0.822 | −0.041 | −0.218 | 7.8 |
| PC5 | −0.202 | −0.158 | 0.046 | −0.052 | −0.596 | −0.367 | −0.202 | 0.631 | 5.7 |
| PC6 | −0.041 | 0.651 | −0.626 | 0.372 | −0.048 | −0.172 | −0.101 | 0.048 | 2.9 |
| PC7 | 0.016 | −0.209 | 0.100 | 0.677 | −0.304 | −0.001 | 0.623 | −0.088 | 1.9 |
| PC8 | −0.800 | 0.198 | −0.046 | −0.343 | −0.074 | 0.113 | 0.416 | −0.103 | 1.2 |
Table 3.
Eigenvector loadings of PCA for Sentinel-1B band math images.
| Eigenvector | VV + VH | VV − VH | VV/VH | VV + VH/VH | VV − VH/VH | Var.% |
|---|---|---|---|---|---|---|
| PC1 | −0.030 | 0.567 | −0.568 | −0.480 | 0.353 | 47.29 |
| PC2 | 0.463 | 0.353 | −0.356 | 0.329 | −0.653 | 30.28 |
| PC3 | 0.810 | −0.222 | 0.209 | −0.492 | 0.093 | 20.05 |
| PC4 | −0.358 | −0.083 | 0.071 | −0.648 | −0.664 | 2.34 |
| PC5 | 0.005 | 0.706 | 0.709 | −0.010 | −0.006 | 0.05 |
Table 4.
Eigenvector loadings of PCA for PALSAR band math images.
| Eigenvector | HH + HV | HH − HV | HH/HV | HH + HV/HV | HH − HV/HV | Var.% |
|---|---|---|---|---|---|---|
| PC1 | 0.205 | −0.013 | 0.562 | 0.569 | 0.564 | 60.19 |
| PC2 | 0.441 | 0.894 | −0.054 | −0.045 | −0.040 | 20.59 |
| PC3 | 0.874 | −0.448 | −0.109 | −0.106 | −0.113 | 17.64 |
| PC4 | −0.003 | −0.010 | −0.761 | 0.121 | 0.637 | 1.20 |
| PC5 | 0.005 | −0.002 | 0.300 | −0.805 | 0.512 | 0.39 |
Table 5.
Parameters used for the LINE extraction algorism applied to the SAR data.
| Parameter | Value (pixel) |
|---|---|
| Edge filter radius | 5 |
| Edge gradient threshold | 20 |
| Curve length threshold | 30 |
| Line fitting error threshold | 2 |
| Angular difference threshold | 15 |
| Linking distance threshold | 40 |
Table 6.
Basic statistics of extracted lineaments from SAR data.
| Method | Visual Extraction | Automated Extraction | |
|---|---|---|---|
| Used Data | RGB PC Images and Filters | Filtered PALSAR PC2 | Filtered Sentinel PC3 |
| Count | 691 | 6324 | 7062 |
| Minimum | 0.49 | 0.38 | 0.34 |
| Maximum | 11.96 | 3.78 | 3.47 |
| Sum | 1949.07 | 4307.17 | 4448.77 |
| Mean | 2.82 | 0.68 | 0.63 |
| Standard Deviation | 1.74 | 0.33 | 0.30 |
© 2019 by the authors. Licensee MDPI, Basel, Switzerland. This article is an open access article distributed under the terms and conditions of the Creative Commons Attribution (CC BY) license (http://creativecommons.org/licenses/by/4.0/).
Share and Cite
MDPI and ACS Style
Zoheir, B.; Emam, A.; Abdel-Wahed, M.; Soliman, N. Multispectral and Radar Data for the Setting of Gold Mineralization in the South Eastern Desert, Egypt. Remote Sens. 2019, 11, 1450. https://0-doi-org.brum.beds.ac.uk/10.3390/rs11121450
AMA Style
Zoheir B, Emam A, Abdel-Wahed M, Soliman N. Multispectral and Radar Data for the Setting of Gold Mineralization in the South Eastern Desert, Egypt. Remote Sensing. 2019; 11(12):1450. https://0-doi-org.brum.beds.ac.uk/10.3390/rs11121450
Chicago/Turabian StyleZoheir, Basem, Ashraf Emam, Mohamed Abdel-Wahed, and Nehal Soliman. 2019. "Multispectral and Radar Data for the Setting of Gold Mineralization in the South Eastern Desert, Egypt" Remote Sensing 11, no. 12: 1450. https://0-doi-org.brum.beds.ac.uk/10.3390/rs11121450
Note that from the first issue of 2016, this journal uses article numbers instead of page numbers. See further details here.