Article

Changes in Forest Net Primary Productivity in the Yangtze River Basin and Its Relationship with Climate Change and Human Activities

1
Joint Innovation Center for Modern Forestry Studies, Nanjing Forestry University, Nanjing 210037, China
2
State Key Laboratory of Hydrology-Water Resources and Hydraulics Engineering, Hohai University, Nanjing 210098, China
3
Institute of Surface-Earth System Science, Tianjin University, Tianjin 300072, China
4
Department of Geosciences, University of Oslo, 0316 Oslo, Norway
*
Author to whom correspondence should be addressed.
Remote Sens. 2019, 11(12), 1451; https://0-doi-org.brum.beds.ac.uk/10.3390/rs11121451
Submission received: 18 April 2019 / Revised: 11 June 2019 / Accepted: 15 June 2019 / Published: 19 June 2019
(This article belongs to the Special Issue Monitoring Forest Change with Remote Sensing)

Abstract

:
Net Primary Productivity (NPP) is a basis of material and energy flows in terrestrial ecosystems, and it is also an important component in the research on carbon cycle and carbon budget. This paper evaluated the spatial distribution pattern and temporal change trends for forest NPP simulated by the LPJ (Lund-Potsdam-Jena) model and NDVI (normalized difference vegetation index) in the Yangtze River basin from 1982 to 2013. The results revealed that: (1) the spatial distribution of the forest NPP and NDVI in the Yangtze River basin has gradually decreased from the southeast coast to the northwest. The forest NPP and NDVI in the mid-lower Yangtze were higher than that of the upper Yangtze; (2) the forest NPP and NDVI in most areas of the Yangtze River basin were positively correlated with the temperature and precipitation. Moreover, the correlations among the temperature with the forest NPP and NDVI were stronger than that of correlations among precipitation with forest NPP and NDVI. Moreover, the extreme drought event in the year of 2004–2005 led the NPP to decrease in the middle and lower Yangtze River basin; (3) human activity such as major ecological projects would have a certain impact on the NPP and NDVI. The increase in forest areas from 2000 to 2010 was larger than that from 1990 to 2000. Moreover, the increasing rate for the NDVI was higher than that of NPP, especially after the year 2000, which indicates that the major ecological projects might have great impacts on the vegetation dynamics. Moreover, more attention should be paid on the joint impacts of human activity and climate change on terrestrial NPP and NDVI.

1. Introduction

Forests cover approximately 4.03 billion hectares worldwide, constituting 49% of the terrestrial gross primary production [1]. They can play a significant role in the carbon cycle because they store a large amount of carbon in the vegetation and soil. Moreover, the annual gross carbon uptake of the global forests equates to approximately half of the carbon emitted from fossil fuels [2]. In general, the NPP (Net Primary Productivity) is an indicator of plant growth and represents the capacity of vegetation to sequester and convert the products of photosynthesis [3]. The estimation of NPP has provided not only important variables for characterizing vegetation activities but has also reflected the considerable impact on the dynamics of regional and global carbon cycles, as well as climate change [4].
An accurate quantitative knowledge of the forest NPP, on a regional and global basis, is of basic importance in many branches of Earth and life sciences. However, it has been difficult to accurately estimate the large-scale forest NPP due to the complex effects of various environmental and biological factors. With the development of satellite remote sensing technology, the high-resolution remote sensing satellite images has been widely used to estimate the forest NPP. For example, Erşahin [5] used the moderate resolution imaging spectroradiometer (MODIS) data for NPP to evaluate the impact of climate on the productivity of forest in Anatolia, Turkey during 2000–2010. Additionally, they found that forests in the Eastern Marmara Transition Subregion had the most significant reduction in NPP, whereas forests located in the northeastern Anatolian Subregion experienced an increase in production. Based on the terrestrial NPP model driven by satellite remote sensing observations, Kimball et al. [6] revealed the general decadal trend of increasing NPP for the pan-Arctic basin and Alaska from 1982 to 2000 of approximately 2.7%. However, the rise of satellite sensing technology has occurred in very short a time. It has been difficult for us to study the change of NPP within a long period by using the remote sensing data. Wang et al. [7] analysed the influence of climate changes on NPP for the arid and semiarid areas in China with Climatic Research Unit (CRU) climatic data and MODIS satellite remote data during 2000–2010 and indicated that precipitation was more positively correlated with NPP than temperature. Exbrayat et al. [8] used satellite observations with climate data to evaluate above-ground biomass (AGB) across the Amazon Basin in order to reconstruct annual maps of potential AGB during 1993–2012. Additionally, they estimated a 0.7 Pg C reduction in potential AGB and discovered that climate change has led to a decline of ~1/3 in the capacity of these disturbed forests. For assessing NPP and its spatial and temporal trends, quite often a combination of models and observational proxies (e.g., NDVI) has been used to ensure the reliability of the results [9].
In recent years, the estimation models have been considered as an essential tool to improve the NPP estimation capability. Estimation models could be divided into three categories: statistic model, parameter model and process model [10]. The CASA (Carnegie–Ames–Stanford Approach) model is a typical static parameter model. Jiang et al. [11] reported that urbanization could result in a reduction of NPP by using the CASA model in the Pearl River Delta, China. Tang et al. [12] used the simulation model of carbon cycle in land ecosystems (Sim-CYCLE), which was a process model, and pointed out that the estimated NPP was higher than the measured value in the Changbai Mountains from 1982 to 2003 under present climate conditions. In addition, the dynamic global vegetation model (DGVM), such as the Lund-Potsdam-Jena (LPJ) Dynamic Global Vegetation Model, could reveal the NPP dynamics under different climate conditions/scenarios as well [13]. The main driving factor of LPJ model is climate data, so it could reflect the variety of NPP under the pure climatic changes. These models have evaluated for a variety of conditions to test their robustness in capturing the spatial and temporal patterns of change in ecosystems’ attributes such as NPP [14,15]. However, there has been significant variability among these models’ results due to differences in formulation of ecosystem processes, underlying assumptions for their formulation in these models, and the uncertainties associated with observations used in understanding these processes [16,17]. Although the models could estimate the large-scale NPP, they have ignored the influences of human activities. For assessing NPP and its spatial and temporal trends, quite often a combination of models and observational proxies (e.g., NDVI) has been used to ensure the reliability of the results [9]. The normalized difference vegetation index (NDVI) is a simple graphical indicator to monitor the change in vegetation by using remote sensing measurements [18], which could be used as an observational proxy to study the global, regional and temporal changes in NPP.
Human activities and ecological construction have also been factors affecting NPP [19]. Chen et al. [20] thought that anthropogenic activity was the main force driving changes in NPP, which played an active role in the growth of regional vegetation. Meanwhile, human activities could lead to desertification, which might decrease the total actual NPP [21]. Yang et al. [22] pointed out that the ecological restoration programs in Xinjiang from 2001 to 2009 could increase the NPP. In addition, the implementation of major national ecological projects in the Three Gorges Reservoir Area since 1998 has markedly counteracted the negative influences of the Three Gorges Project on NPP in this area [14]. In recent years, there have been several major afforestation projects in the Yangtze River basin, such as the Yangtze River Shelterbelt project and the project of Returning Farmlands to Forests. Through these afforestation projects, the proportion and quality of forest vegetation in the Yangtze River have been enhanced, and the NPP and carbon sequestration capacity of forests have improved [23]. In fact, Wu et al. [24] pointed out that human activities and climate change jointly affected the NPP of vegetation, but at present, the quantitative analysis of the impact of human activities on NPP on vegetation is not sufficient from the perspective of spatiotemporal scale and climate disturbance.
Although there have been lots of studies on NPP in the Yangtze River basin, there have been few studies on forest NPP in the basin. Therefore, the purposes of this study were: (1) to reveal the temporal and spatial evolution pattern of forest NPP and NDVI in the Yangtze River basin during the past 30 years; (2) to evaluate the influences of climate changes and human activities on the forest NPP and NDVI in the basin, and then clarify the reasons for the forest NPP and NDVI changes at regional scale. This study is of great significance to the forest water cycle and carbon cycle of the Yangtze River. Moreover, our findings will provide a basis for forest vegetation monitoring and ecological conservation efforts in the Yangtze River basin.

2. Materials and Methods
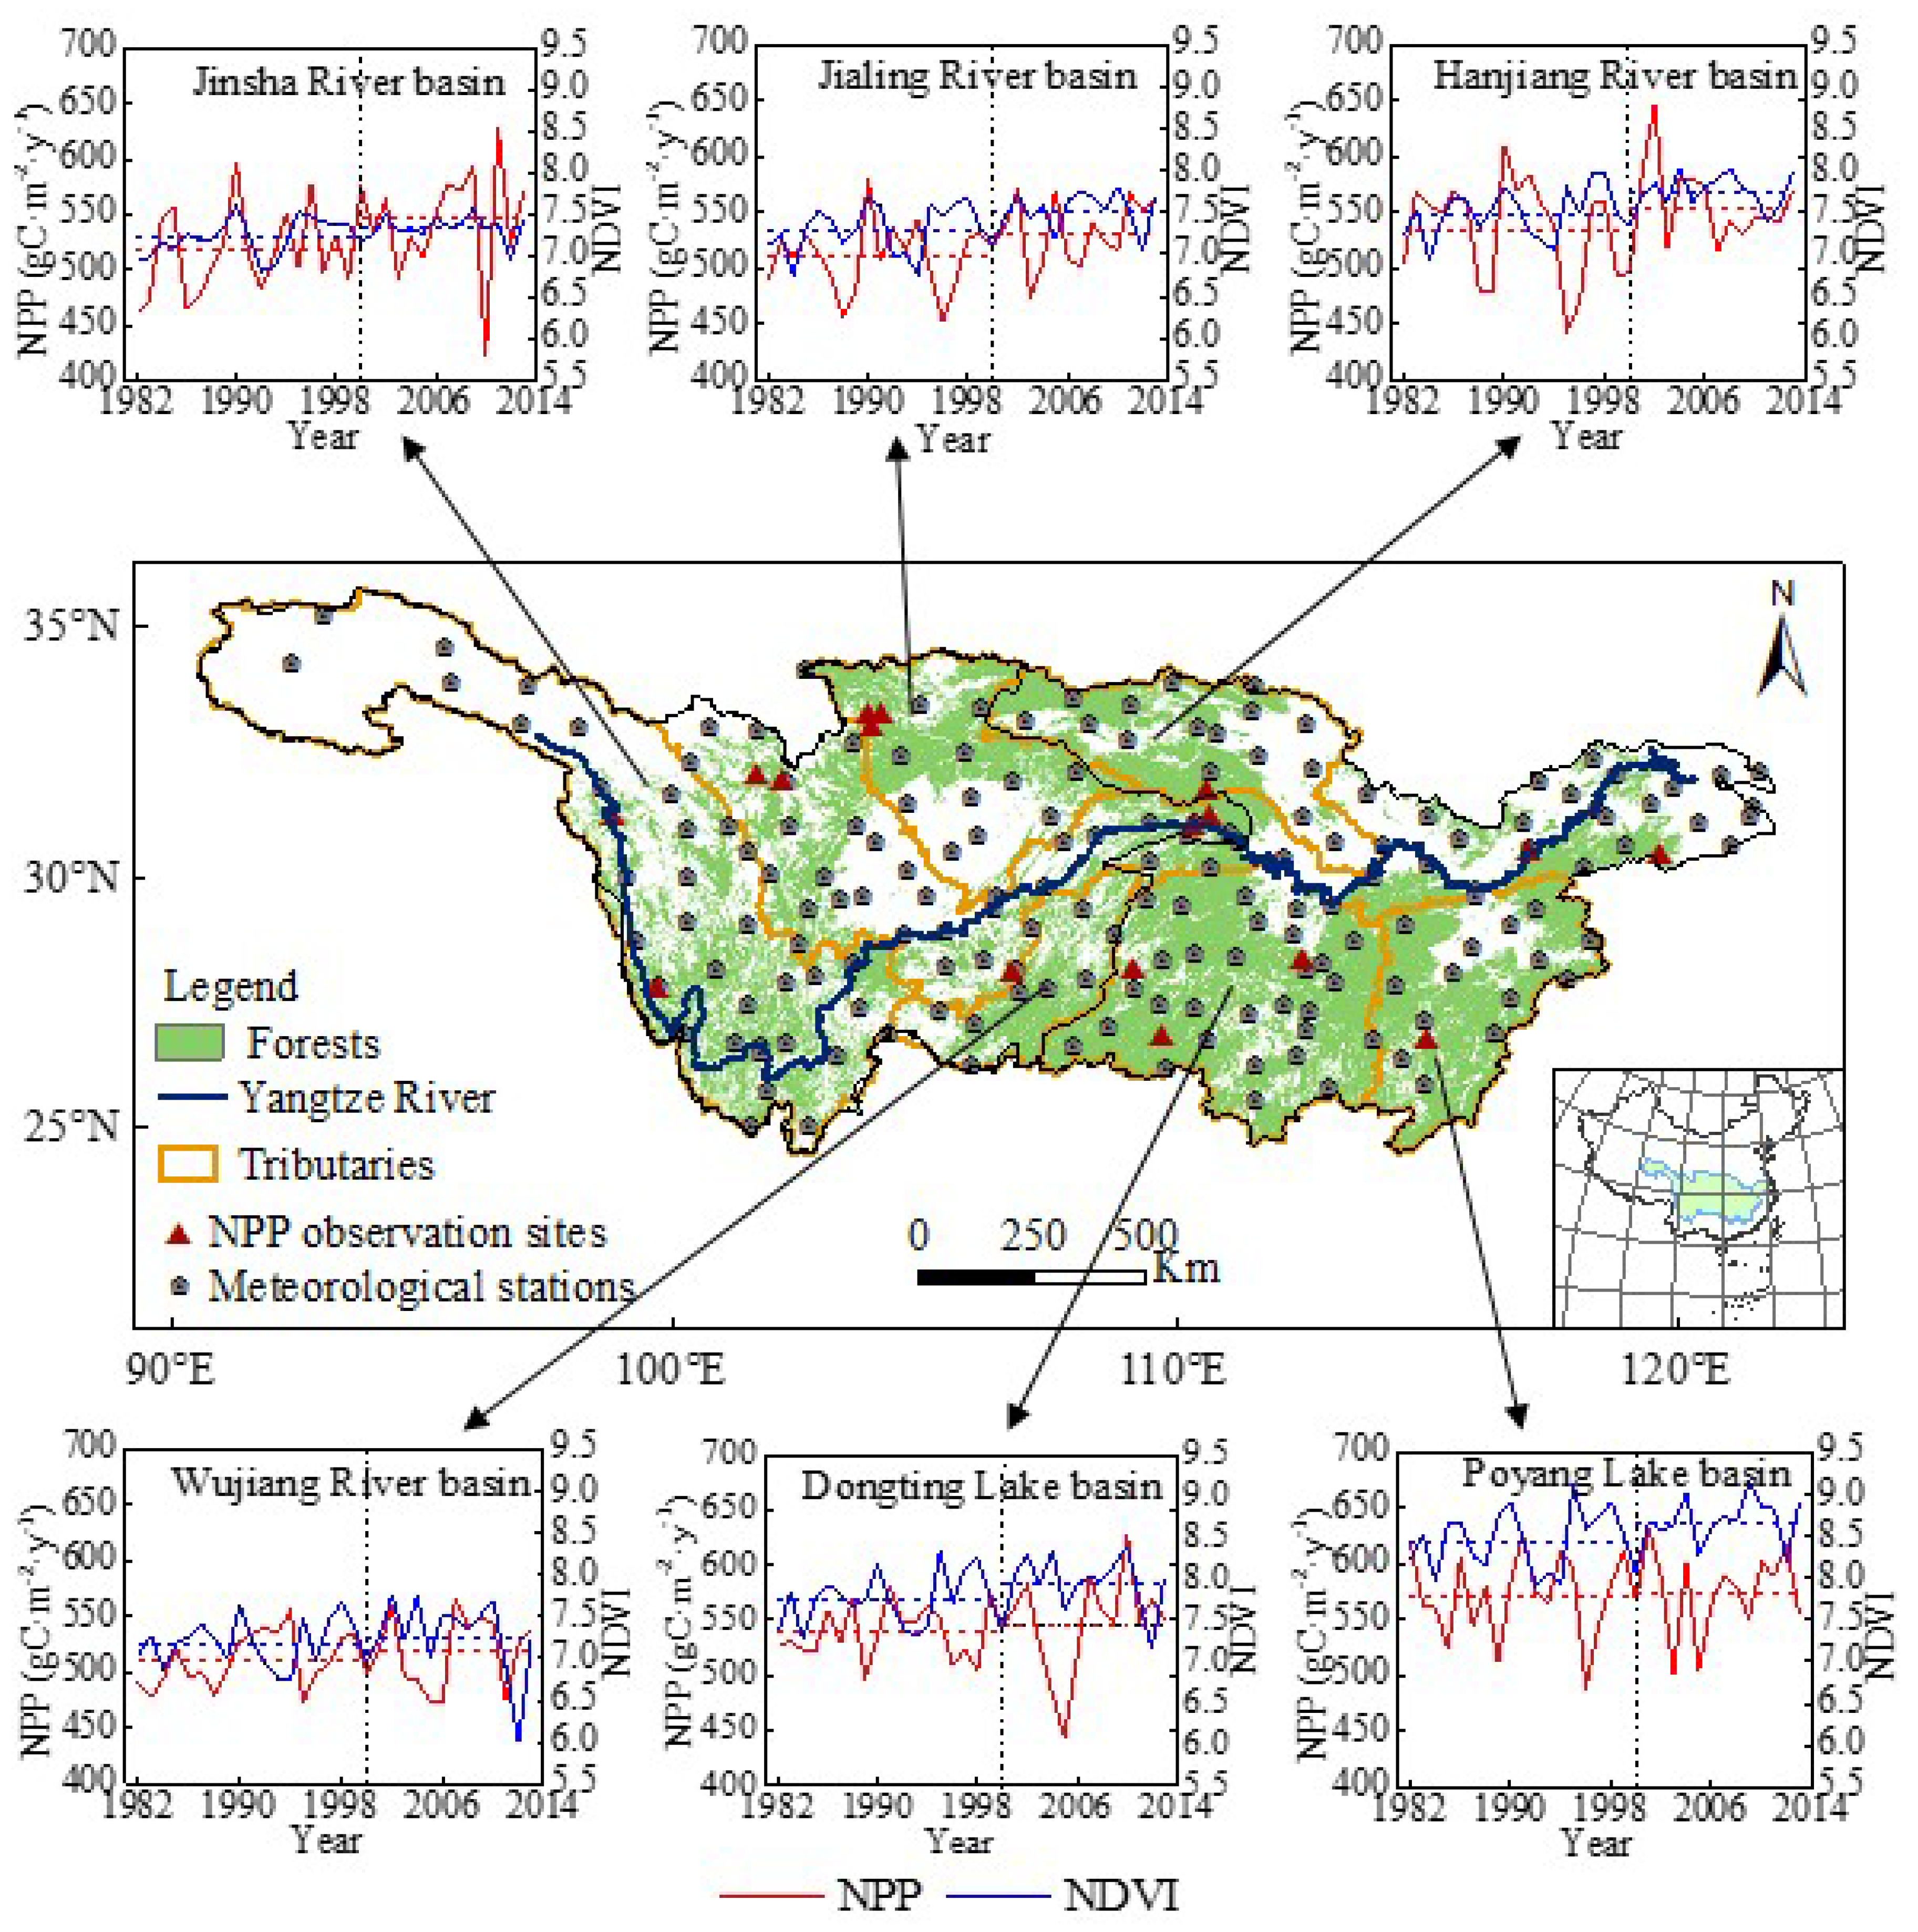
2.1. Study Area

The Yangtze River is the largest river in China and the third largest river in the world, which accounts for 35.1% of the total streamflow of China (Figure 1). This river originates from the Tibetan Plateau, flowing from west to east. The main Yangtze River has an area of 1,800,000 km2, occupying about one fifth of the total land area of China. Most of the Yangtze River basin is affected by the subtropical monsoon climate, where the mean annual precipitation ranges from 270–500 mm in the western region to 1600–1900 mm in the southeastern region [25]. The forest in the Yangtze River basin is abundant because the higher precipitation and temperature conditions (Figure 1).

2.2. Data

Observed meteorological data comes from 175 gauge stations in the Yangtze River basin during 1982–2013 (http://data.cma.cn). Observed NPP data from 17 sites in the Yangtze River basin was from National Ecosystem Research Network of China (http://www.cnern.org.cn/). The simulated NPP data from 1982 to 2013 at a spatial resolution of 0.5° × 0.5° comes from LPJ model.
The MODIS data came from the NASA Land Processes Distributed Active Archive Center with a spatial resolution of 1 km × 1 km (https://e4ftl01.cr.usgs.gov/). The NDVI dataset at a spatial resolution of 8 km × 8 km and 15-day interval were from GIMMS (Global Inventory Modelling and Mapping Studies group, https://ecocast.arc.nasa.gov/data/pub/gimms/3g.v1/). The GIMMS NDVI 3g.v1 is generated from NOAA’s Advanced Very High Resolution Radiometer (AVHRR) data, and the spatial resolution is 1/12°. The dataset spanned from July 1981 to December 2015. It has been calibrated for sensor shift, cloud test and removed the effects of solar zenith angles and other factors [26]. The annual AVHRR GIMMS NDVI dataset was obtained by using the maximum value composite (MVC) method.
The land-use and land-cover change (LUCC) data came from Resource and Environment Data Cloud Platform (http://www.resdc.cn/). The resolution of the LUCC data in 1990, 1995, 2000, 2005 and 2010 was 1 km. The land-use data included six classifications: croplands, forests, grassland, waters, barren and urban. The vegetation map adopted the national 1:1,000,000 map of vegetation types in 2000 which was provided by “Cold and Arid Regions Science Data Center at Lanzhou” (http://westdc.westgis.ac.cn). Moreover, the vegetation map adopted the thirty-meter resolution forest map for China in 2013 which was provided by “Department of Earth Sciences, Tsinghua University” (http://0-data-ess-tsinghua-edu-cn.brum.beds.ac.uk/).

2.3. LPJ Model

The LPJ model has been developed as a DGVM of intermediate complexity with a broad range of potential applications to global problems. The LPJ model can be used to simulate the potential vegetation distribution and estimate the inter-annual variation of NPP [16]. The vegetation structure and composition are described by ten plant functional types (PFTs), which are distinguished according to their phenology, physiology and physiognomy. Monthly gross production for an average PFT individual is summed over a year, and after subtraction of plant respiration expenditures, the remainder is allocated to plant tissues.
The LPJ model is a well-developed model and has been widely used to determine global and regional NPP; therefore, in this study, the LPJ model was used to simulate the NPP in the Yangtze River basin. The LPJ was run from 1961 to 1980 with a pseudo-daily time step, preceded by a 1000-year spin-up period that brought the carbon pools and vegetation cover in equilibrium with climate. The LPJ model used in our article has been intensively validated against observed NPP values by using a data set of forest NPP obtained from forest inventory in China between 1989 and 1993 from plot sites to 0.5° latitude × 0.5° longitude grid cells [27].
The LPJ DGVM was employed in this article due to its broad application in modelling both terrestrial carbon cycles and hydrological cycles [28,29]. The model, which originates from the BIOME model family [30], simulates the vegetation patterns and functions for any time if climate data are available for the specified time [31]. The model was run on a grid-cell basis with input of soil texture, monthly temperature, precipitation, cloud, humidity days and annual atmospheric CO2 concentration, and the output data includes the vegetation NPP, biomass, leaf area index (LAI), evapotranspiration and so on.
In the LPJ model, the NPP is calculated by subtracting maintenance and growth respiration from GPP (Gross Primary Production), which is computed by coupling the photosynthesis and water balance schemes. Additional details about this approach can be found in several studies [32,33]. The formula is as follows:
NPP = 0.75 × (GPP − Rm)
where GPP is the total primary productivity, Rm is the amount of carbon required for a plant to maintain its own required respiration, and 0.75 is the ratio of NPP in the remainder, considering 0.25 to be the growth respiration coefficient.
Simple linear regression was used in this paper for long-term linear trend test. The simple linear regression method is a parametric test method, which consists of two steps, fitting a linear simple regression equation with the time t as independent variable and the vegetational variable (i.e., NPP or NDVI in our article) as dependent variable; testing significance of the slope of the regression equation by the t-test. The 95% confidence interval was used as a threshold to classify the significance of positive and negative [34,35].
A geographic information system was used to process and spatially interpolate meteorological data and NPP data, from which raster images are derived. Correlation analysis was applied to statistically analyse the relationship among the variables. The closer the r value is to 1, the higher the linear correlation among the variables; the smaller the absolute value of the correlation coefficient, the lower the linear correlation among the variables. A correlation coefficient of 0 indicates that there is no linear correlation between the variables. In this study, correlation analysis was used to study the correlation among temperature, precipitation with forest NPP and NDVI. The correlation coefficient (CC) was used to assess the linearity of the correlated datasets. T-test was used to perform the significance test of the slope [34].

3. Results

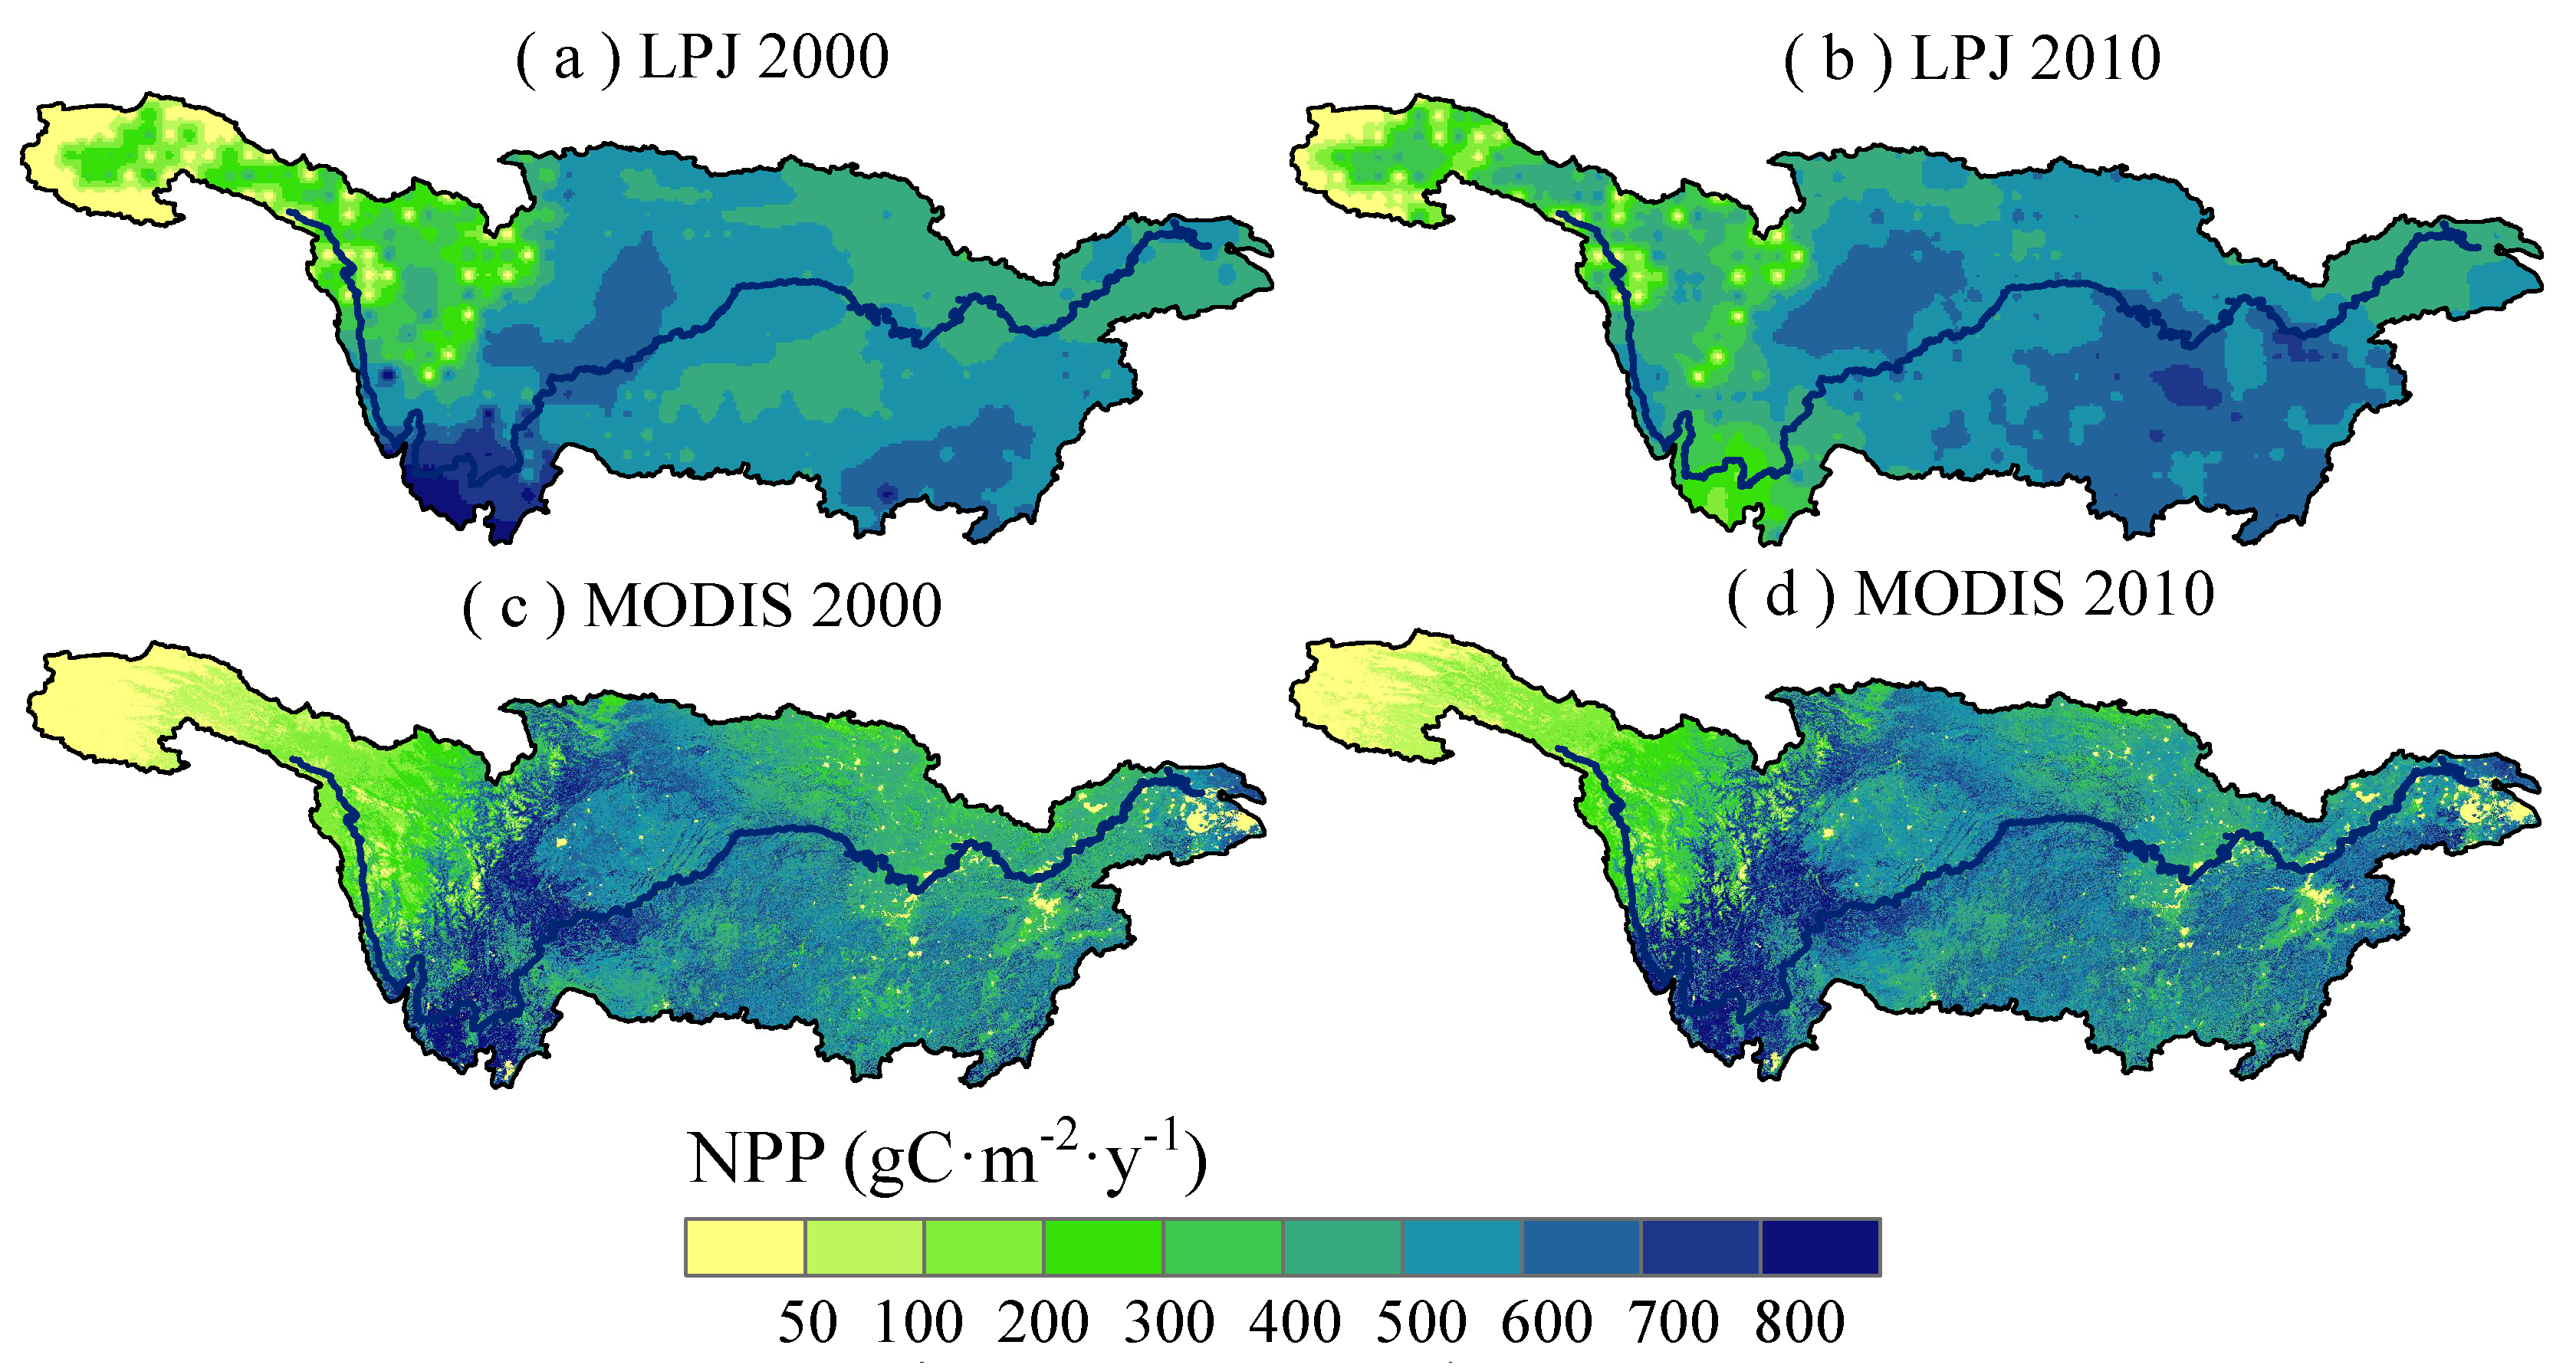
3.1. The LPJ Model Calibration and NPP Simulation in the Yangtze River Basin

The observed NPP site was also used to compare with the NPP simulated by the LPJ model in the Yangtze River basin (Table 1). It can be seen that the forest NPP simulated by the LPJ model fell within the range of existing field survey data, and it was determined that the estimation results had definite reliability generally. However, the simulated NPP in Badong, Songtao, Tongzi and Zhongdianxian were much lower than the observed NPP. On the contrary, the simulated NPP in Huitong and Xingshan were much higher than that of observed NPP. The comparison of the mean annual forest NPP from the LPJ, Carnegie–Ames–Stanford Approach (CASA) and atmosphere vegetation interaction model (AVIM2) and the MODIS image was also analysed in this paper. It indicated that the NPP of broad-leaf and needle-leaf forests driven by LPJ model was higher than that of AVIM2 model, while it was slightly lower than that of MODIS image and CASA model. It should be of concern that the NPP of shrubs was much higher than the NPP from MODIS image and CASA model. Meanwhile, the NPP of Mixed forests was much lower than the NPP from AVIM2 model. These differences might be attributed to the data source and study area, as well as the vegetation types and their classification accuracy (Table 2).
As seen in Figure 2, the NPP simulated by the LPJ model was consistent with the remote sensing images from the MODIS in the spatial distribution in the years 2000 and 2010. However, as shown in Figure 2, there was obvious difference in the sub-basins. The simulated NPP took on higher values in the upper Yangtze reaches in the year 2000, while the higher values occurred in the lower Yangtze River basin, especially in the Poyang Lake basin in the year 2010. As for the MODIS image, it exhibited higher NPP values in the upper Yangtze reaches in both 2000 and 2010. In previous studies, Fensholt et al. [37] and Mariappan [38] reported that the accumulated NDVI was closely related to the NPP in their study areas. Therefore, the accumulated NDVI value was also used to verify the simulated NPP by the LPJ model for a long-term period. As can be seen from the spatial distribution in Figure 3, NDVI and NPP had a good correlation, and the distribution was consistent on the whole, but there were also differences.

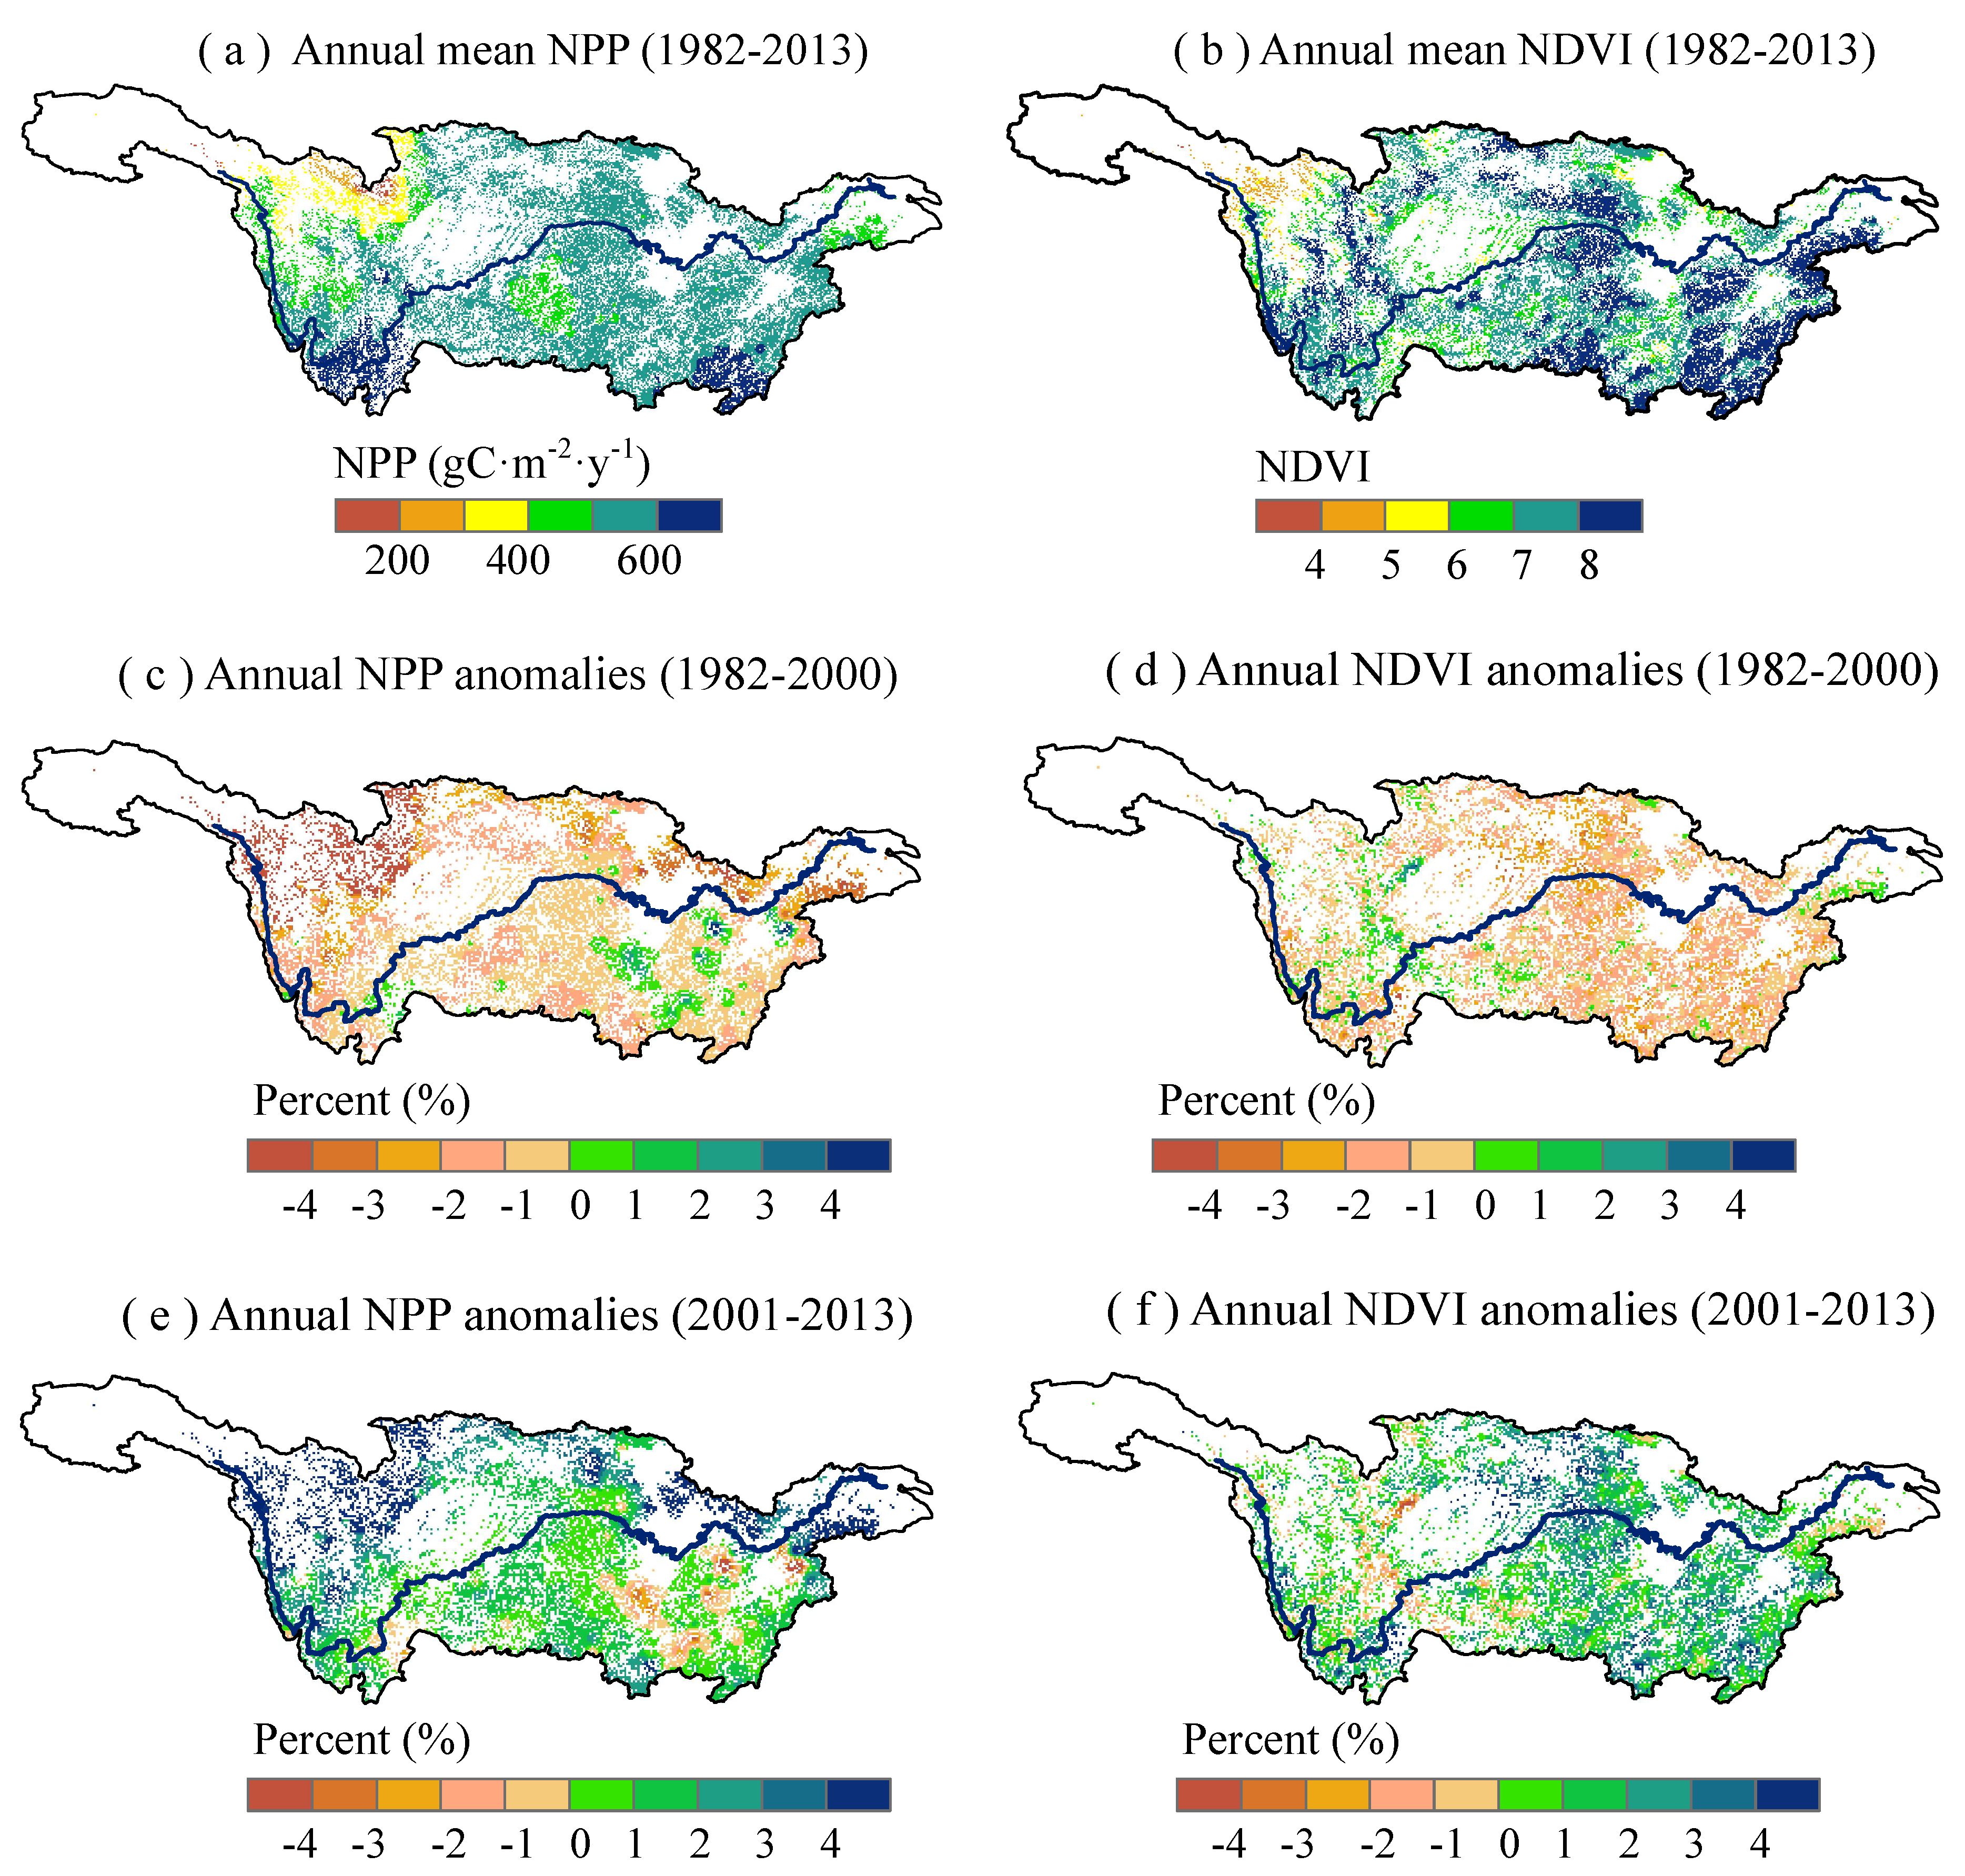
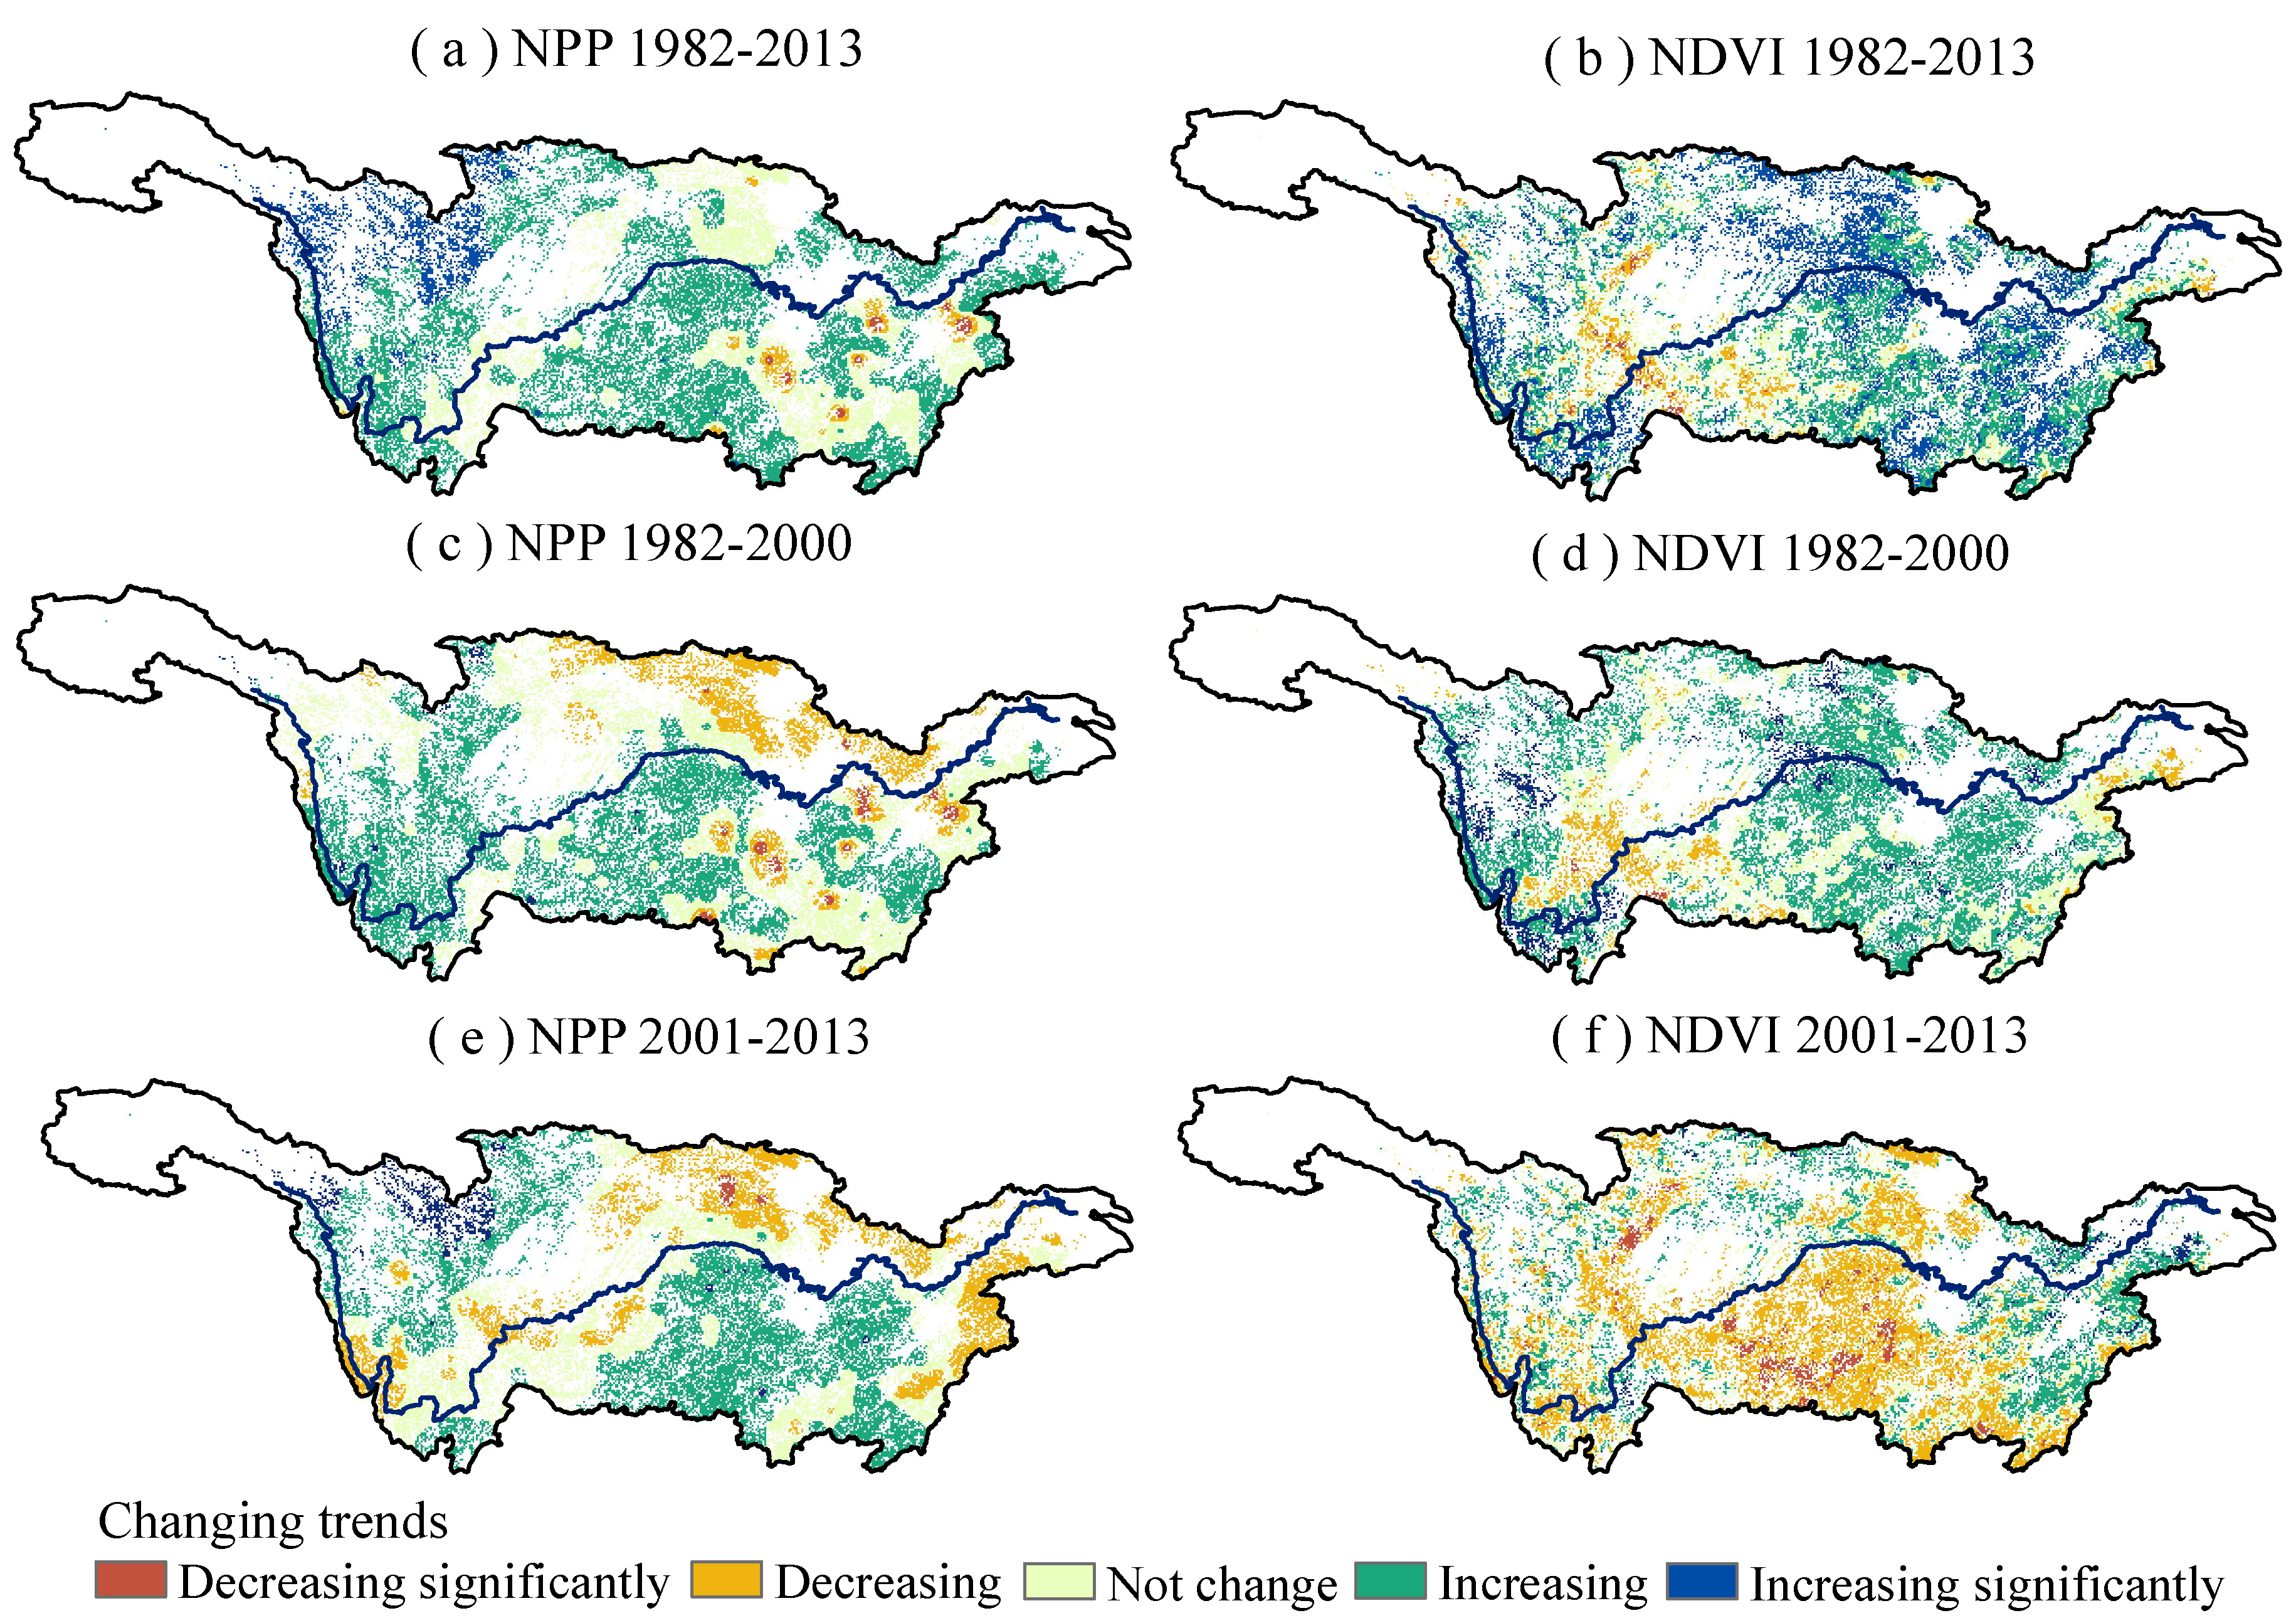
3.2. The Spatial and Temporal Distribution of the Forest NPP in the Yangtze River Basin

The spatial distribution and changing trends of the annual mean NPP and accumulated NDVI for the forests in Yangtze River basin during 1982–2013 were analysed (Figure 3a,b). The results indicated that the spatial distribution of the forest NPP was characterized by a gradually decreasing trend from the southeast to the northwest in the Yangtze River basin from 1982 to 2013. This demonstrates that the spatial distribution of the forest NPP was relatively consistent with the pattern of temperature and precipitation in the basin. However, the east of the basin had the highest NDVI value, which was different from the distribution of NPP. This indicates that the forest NPP in the foothills of the Qinghai–Tibet Plateau and most areas of Jiangxi Province was relatively high, whereas the forest NPP in the Yangtze River delta, the middle reaches of the Yangtze River and the Qinghai–Tibet Plateau was relatively low during the period of 1982–2013. This distribution was closely related to the vegetation type and urbanization level of the entire Yangtze River basin. The hydrothermal conditions in the foothills of the Qinghai–Tibet Plateau were better and thus the forest NPP was relatively higher. For parts of the mid-lower Yangtze, although natural conditions such as photosynthesis, temperature and precipitation were superior, human activities driven by economic interests have resulted in great damage to vegetation in recent years.
There was then a comparison between the annual forest NPP and NDVI anomalies in the Yangtze River basin. As shown in Figure 3c, compared to 1982–2013, the NPP in the northern and southern edge regions of the Yangtze River were gradually decreasing from 1982 to 2000. The NDVI in parts of the east showed the decreasing trends (Figure 3d). Compared to 1982–2013, the NPP and NDVI were increasing generally from 2001 to 2013 in the Yangtze River basin (Figure 3e,f). This demonstrates that the NPP in the north of the Yangtze River basin from 2001 to 2013 increased significantly compared to the period 1982–2013.
The forest NPP and NDVI exhibited a generally increasing trend in the Yangtze River basin from 1982 to 2013 (Figure 4a,b). According to the calculations, the pixels representing forest NPP that presented increasing trends in the entire region were as high as 69% of the total number of pixels, of which 13% of the pixels exhibited significant increasing trends. Moreover, 25% of the Yangtze River basin remained relatively stable. Meanwhile, the pixels representing forest NDVI that took on increasing trends in the entire region were as high as 71% of the total number of pixels, of which 38% of the pixels showed significant increasing trends. In addition, 18% of the Yangtze River basin remained relatively stable. The difference between NPP and NDVI could be due to the influence of human activities, which could not be reflected by the LPJ model.
Hanjiang River basin presented the decreasing trend for the annual forest NPP during 1982–2000 (Figure 4c). However, the annual forest NDVI exhibited the increasing and stable trends in the Hanjiang River basin during 1982–2000 (Figure 4d). While Dongting Lake basin displayed the increasing and stable trends for the annual forest NPP during 2001–2013 (Figure 4e) and the annual forest NDVI took on the decreasing trend in the Dongting Lake basin during 2001–2013 (Figure 4f).
The annual mean forest NPP and accumulated NDVI were analysed in the Yangtze River basin from 1982 to 2013 (Figure 5). The results show that both the NPP and NDVI in mid-lower Yangtze River was higher than that in upper Yangtze River. As presented in Figure 5b, the trends of the forest NDVI in the upper Yangtze reaches took on the same pattern. This phenomenon does not show up in Figure 5a. It should be noted that the patterns of NPP and NDVI are quite different.

3.3. The Impacts of Climate Change and Human Activities on the Forest NPP in the Yangtze River Basin

Figure 6 depicts the correlations among the annual mean forest NPP and accumulated NDVI with temperature and precipitation in the Yangtze River basin from 1982 to 2013. The results reveal that there was a strong relationship between the forest NPP and temperature (r = 0.43, p < 0.01). The same phenomenon was shown in forest NDVI and temperature as well (r = 0.59, p < 0.01). The correlation between forest NDVI and temperature was better than the correlation between forest NPP and temperature (Figure 6a). However, the correlation was not obvious or only weak between the forest NPP and precipitation (r = −0.04, p > 0.05) in the Yangtze River basin (Figure 6b). The relationship between forest NDVI and precipitation was similar to the relationship between forest NPP and precipitation.
The spatial patterns of the correlations among the forest NPP and accumulated NDVI with climate factors were analysed in the Yangtze River basin during the period 1982–2013 (Figure 7). The analysis illustrates that the forest NPP and NDVI were sensitive to climate change in the Yangtze River basin. Forest NPP and NDVI in more than 80% of the region revealed the positive correlations with temperature in the Yangtze River basin (Figure 7a,c). However, the forest NPP was negatively correlated with temperature in the Dongting Lake basin, while the forest NDVI was significant positively correlated with temperature. The forest NPP and precipitation had a positive correlation in 58%, and the forest NDVI and precipitation had a positive correlation in 59% (Figure 7b,d).
Figure 8 displays the average annual temperature, precipitation and forest NPP in the Yangtze River basin during the period 1982–2013. There was a significant correlation between the forest NPP anomalies and temperature anomalies in the Yangtze River basin during 1982–2013. The forest NPP and temperature showed increasing trends, but the temperature and the forest NPP presented different increase rates in the Yangtze River basin, Poyang Lake basin, Dongting Lake basin and Jinsha River basin (Figure 8a,c,e,g). The precipitation anomalies took on the increasing trends during 1982–2000 and presented decreasing trends during 2000–2013 in the Yangtze River basin, Poyang Lake basin and Dongting Lake basin (Figure 8b,d,f). However, the precipitation anomalies displayed decreasing trends during 1982–2000 and presented increasing trends during 2000–2013 in the Jinsha River basin (Figure 8h).
The extreme droughts might have great impacts on the changes of NPP. We selected the extreme drought events in 2004 and 2005 as a case study. During this period, less precipitation appeared in the lower and upper Yangtze River basin [39]. The annual mean precipitation forest NPP anomalies was analysed for the whole Yangtze River basin (Figure 9). The analysis indicated that obviously negative precipitation anomalies occurred in most of the Yangtze River basin during this drought event, especially in the lower and middle Yangtze River basin. The pattern of the NPP anomalies was similar to that of precipitation anomalies, especially in the South of the Yangtze River basin. For example, the NPP decreased obviously in the Poyang Lake basin and Dongting Lake basin along with the decrease of the precipitation. Therefore, large-scale drought events might lead to an obvious decrease for the forest NPP.
Located in central China, the Yangtze River basin is one of the major afforestation zones and has a strong impact on ecosystem productivity [40]. There have been three key national ecological restoration projects in the Yangtze River basin (Table 3). The first project was the Yangtze River Shelter Forest project. The Yangtze River Shelter Forest refers to the government’s construction of shelterbelts and ecological public welfare forests in the upper reaches of the Yangtze River in order to protect the water resources of the Yangtze River. This construction began in 1989. At present, the forest coverage rate in the project area has reached 41% and the afforestation rate of trees has reached 45.4%. The ecological condition and living environment of the river basin have been effectively improved and the ecological safety has been effectively guaranteed. The next project, known as the Returning Farmland to Forest, started in 1999. This project was the largest ecological construction project in the world. The scope of construction included 25 provinces (autonomous regions and municipalities) and Xinjiang Production and Construction Corps. The last project was the Natural Forest Resources Protection project, started in October 2000 and will finish in 2050. The construction scope of this project mainly included the upper and middle reaches of the Yangtze River and the Yellow River. The goal of this project was to solve the problems of natural forest recuperation and recovery, and finally realize the coordinated development of forest resources, economy and society.
This study illustrates that the fluctuations of the six tributaries were different before and after the year 2000. Both of the forest NPP and NDVI in the six tributaries after the year 2000 was higher than that before the year 2000. Moreover, the increasing rate for the NDVI was higher than that of NPP, especially after the year 2000. This was because the NDVI was affected by both human activity and climate change. In recent years, there have been three major national ecological restoration projects in the Yangtze River basin (Table 3). These ecological projects have been carried out and have resulted in an increase of forest coverage during the past few decades, especially after the year 2000.
The forest area has increased obviously in the Yangtze River basin, a change which might be related to the afforestation projects. For example, the implementation of the Yangtze River Shelter Forest project, the Returning Farmland to Forest project and the Natural Forest Resources Protection project have led to an increase in forest land and vegetation coverage in most areas of the Yangtze River basin. The forest NDVI in the Yangtze River basin during 1982–2013 demonstrated an increasing trend, accounting for more than 70% of the total basin area, and concentrated in the Jinsha River basin and mid-lower Yangtze (Figure 4).
The annual mean forest NPP and accumulated NDVI for the tributaries of the Yangtze River basin are analysed in Figure 1. The forest NPP in Jinsha River basin, Poyang Lake basin and Hanjiang River basin had a large fluctuation in the Yangtze River. The average values of NPP and NDVI in the Poyang Lake basin were the largest among the six basins. Before the year 2000, the fluctuation was large, but after the year 2000, the fluctuation became smaller, which was attributed to the implementation of the policy of project of Returning Farmland to Forest. The Returning Farmland to Forest project was conducive to the improvement of forest growth in this region. The average value of forest NDVI in Jinsha River basin was the smallest in the six basins. In 2012, the NDVI in six basins showed a declining trend, especially in the forests of Wujiang River basin and Dongting Lake basin, where NDVI reached the lowest value in the past 30 years. This was because in the years 2011 and 2012, the most serious drought occurred in the Yangtze River basin during the past 60 years. The drought process was characterized by strong intensity, long duration and wide impact range, resulting in serious vegetation damage. The forest NPP in Jialing River basin, Hanjiang River basin and Poyang Lake basin decreased greatly around 1995, which might be related to the flood disaster of the Yangtze River around 1995.
Figure 10 depicts the distribution of various forest vegetation types in the years 2000 and 2013. The type and distribution of forest vegetation was constantly changing due to climate change and human activities. Moreover, the major ecological projects have played a positive role in improving forest coverage and forest protection. The areas of forests were the largest in the land-use of the whole Yangtze River basin (Table 4). Overall, the forest area in the Yangtze River basin revealed increasing trends during the past 30 years and the forest areas increased by 118 km2 from 1990 to 2010. The increase in forest areas from 2000 to 2010 was larger than that from 1990 to 2000. The forest areas in the Yangtze River basin increased by 1409 km2 from 2000 to 2010. This was closely related to the Returning Farmland to Forest project.

4. Discussion

In our paper, the NPP simulated by the LPJ model and NDVI was used to monitor vegetation restoration or degradation. Similar results can be found in previous studies [41,42]. For example, Rashid et al. [9] used a combination of the most recent NDVI and model-based NPP estimates for the period 1982–2012; 80% and 67% of the global land area showed positive NPP and NDVI values, respectively. However, on the temporal scale, both global NPP and NDVI showed a corresponding pattern of increase (decrease) for the duration except for a few years (e.g., 1990 and 1995–1998). Hubert et al. [43] compared "space based" MODIS satellite driven NPP vs terrestrial "ground based" productivity estimates. They reported that MODIS satellite driven annual NPP estimates provide a continuous productivity estimate across Austria and no significant differences between different daily climate input data sets were evident. The two methods will enhance the ability to generate forest productivity assessments across large forest areas.
In this article, we studied that the forest NPP and NDVI generally presented decreasing trends from the southeast to northwest in the Yangtze River basin from 1982 to 2013. We concluded that the spatial and temporal distribution of forest NPP and NDVI would change under the influence of such climate changes as temperature and precipitation. This study illustrates that in the northwestern part of the Yangtze River basin, the positive impact of climate change on NPP offset the negative impact in the southeast region. Moreover, on a particular time scale, the annual average temperature was positively correlated with forest NPP in the Yangtze River basin during the period 1982–2013, whereas precipitation was not significantly correlated with the forest NPP and NDVI. Some other researchers have reached similar conclusions. For example, Potter et al. [44] indicated that vegetation productivity could benefit from climate warming by lengthening growing seasons and enhancing photosynthesis. Gang et al. [45] reported that climate change resulted in increased NPP in savannas, tropical forests, and temperate forests and decreased NPP in a cold desert between 1911 and 2000. Liu et al. [46] considered that sunshine duration and annual average temperature presented a significantly positive association with annual NPP in the Karst area of northwest Guangxi during the period 2000–2013, whereas annual precipitation had no significant correlation with NPP. However, other studies have indicated that a warmer climate could increase plants’ autotrophic respiration and potentially reduce NPP, especially in high-temperature regions [40]. Wang et al. [47] discovered that the temperature variation has more significant impact on NDVI and NPP than the precipitation variation in the southwestern Karst region of China. Fang et al. [48] investigated that the mean annual precipitation was strongly and positively correlated with the MODIS NPP across China’s Xinjiang region from 2000 to 2010.
Human activities could influence forest NPP as well. In this study, we demonstrated that in some areas of the mid-lower Yangtze, the acceleration of urbanization and other human activity factors affected the mean annual forest NPP. Jiang et al. [11] pointed out that on the basin or city scale in China, urbanization in the Pearl River Delta reduced the total NPP by 0.137 TgC from 2000 to 2010. Fei et al. [7] revealed that the implementation of national restoration projects could increase the C stocks in the project regions, especially in north, south, and east China. Yang et al. [22] pointed out that the ecological restoration programs in Xinjiang from 2001 to 2009 could increase the NPP. Moreover, the implementation of major national ecological projects in the Three Gorges Reservoir Area since 1998 has markedly counteracted the negative influences of the Three Gorges Project on NPP in this area [14]. Chen et al. [10] used the Carnegie–Ames–Stanford Approach (CASA) model to stimulate the grassland NPP over the Qinghai–Tibet plateau from 1982 to 2011, and thought that the effect of human activities on the alpine grassland ecosystem obviously intensified in the latter period, so the negative effect caused by climate change to ecosystem could have been relatively mitigated or offset. Chen et al. [20] thought that human activity was the main force driving changes in NPP from 2001 to 2014 in Hengduan Mountain area, China and the majority of NPP residuals were positive, possibly due to the return of farmland back to forest and natural forest protection. Li et al. [49] investigated the ecological engineering project effectiveness on vegetation restoration in the Beijing–Tianjin Sand Source Region from 2000 to 2010 based on the rain use efficiency trend in relation to the land-cover and found that the effectiveness of the ecological engineering projects differed for each subarea and was proportional to the strength of ecological engineering. Wu et al. [24] considered that human activities and climate change jointly affected the NPP of vegetation. For assessing NPP and its spatial and temporal trends, quite often a combination of models and observational proxies (e.g., NDVI) are used to ensure the reliability of the results. However, Yang et al. [22] concluded that human activities produced more obvious positive impact in the increasing of NPP than climate change. Moraes et al. [50] reported that the percentage of the warming resulting from deforestation relative to the warming when the increase in greenhouse gases concentrations was included, was higher than 60% in the tropical region.
Many previous studies have revealed that the afforestation projects have increased the forest coverage, canopy density, forest NPP, forest areas and the carbon storage [51,52]. For example, Pan et al. [2] reported that the magnitude of China’s forest biomass C sink almost doubled during 2000–2007 due to the implementation of afforestation project. Fang et al. [53] pointed out that the increased C stock in Asian terrestrial ecosystems might primarily be attributed to considerable afforestation and reforestation. Due to the implementation of large-scale afforestation and reforestation practices beginning since the late 1970s, China’s forest biomass C stock has increased by 40% between the 1970s and the 2000s. Liu et al. [54] analysed the distribution of the NPP using MODIS datasets and VPM (Vegetation Photosynthesis Model) from 2000–2015 and they explored that the NPP on the Loess Plateau increased significantly from 2000 to 2015 (p < 0.05) since the implementation of Returning Farmland to Forest project. In our study, the implementation of the Yangtze River Shelter Forest project, the Returning Farmland to Forest project and the Natural Forest Resources Protection project have led to an increase in forest areas and vegetation coverage in most areas of the Yangtze River basin.

5. Conclusions

The impact of climatic factors and human activities on the dynamics of forest NPP and NDVI from 1982 to 2013 were examined. The main conclusions drawn from our paper are summarized as follows:
(1)
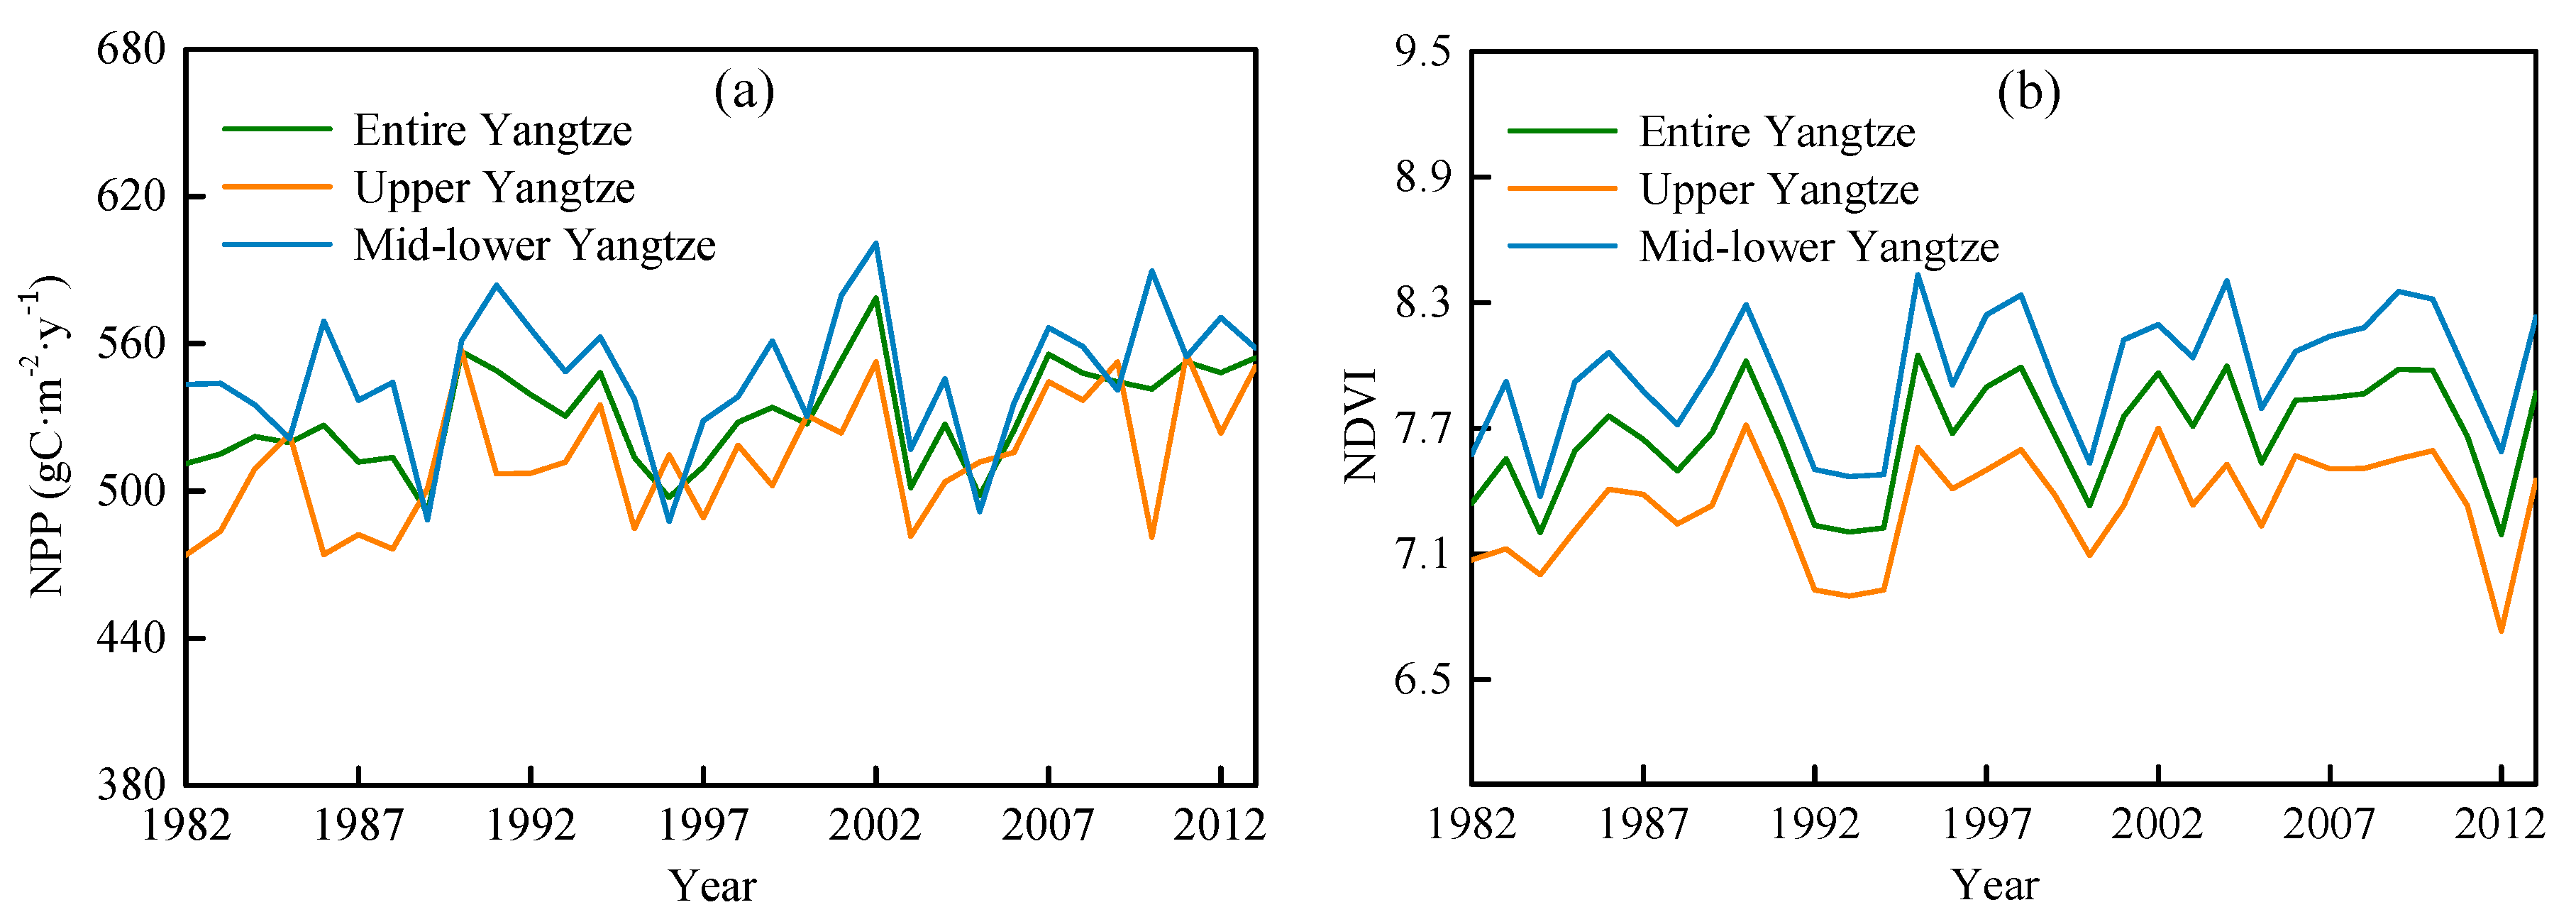
This study examined the general agreement between temporal trends in forest NDVI and the NPP in the Yangtze River basin. The mean annual forest NPP and NDVI in the Yangtze River basin from 1982 to 2013 exhibited generally decreasing trends from the southeast to northwest. The southeastern part of the Yangtze River basin has satisfactory hydrothermal conditions, which could meet the needs of vegetation growth and high yield. The northwest region has low productivity due to poor water and heat conditions.
(2)
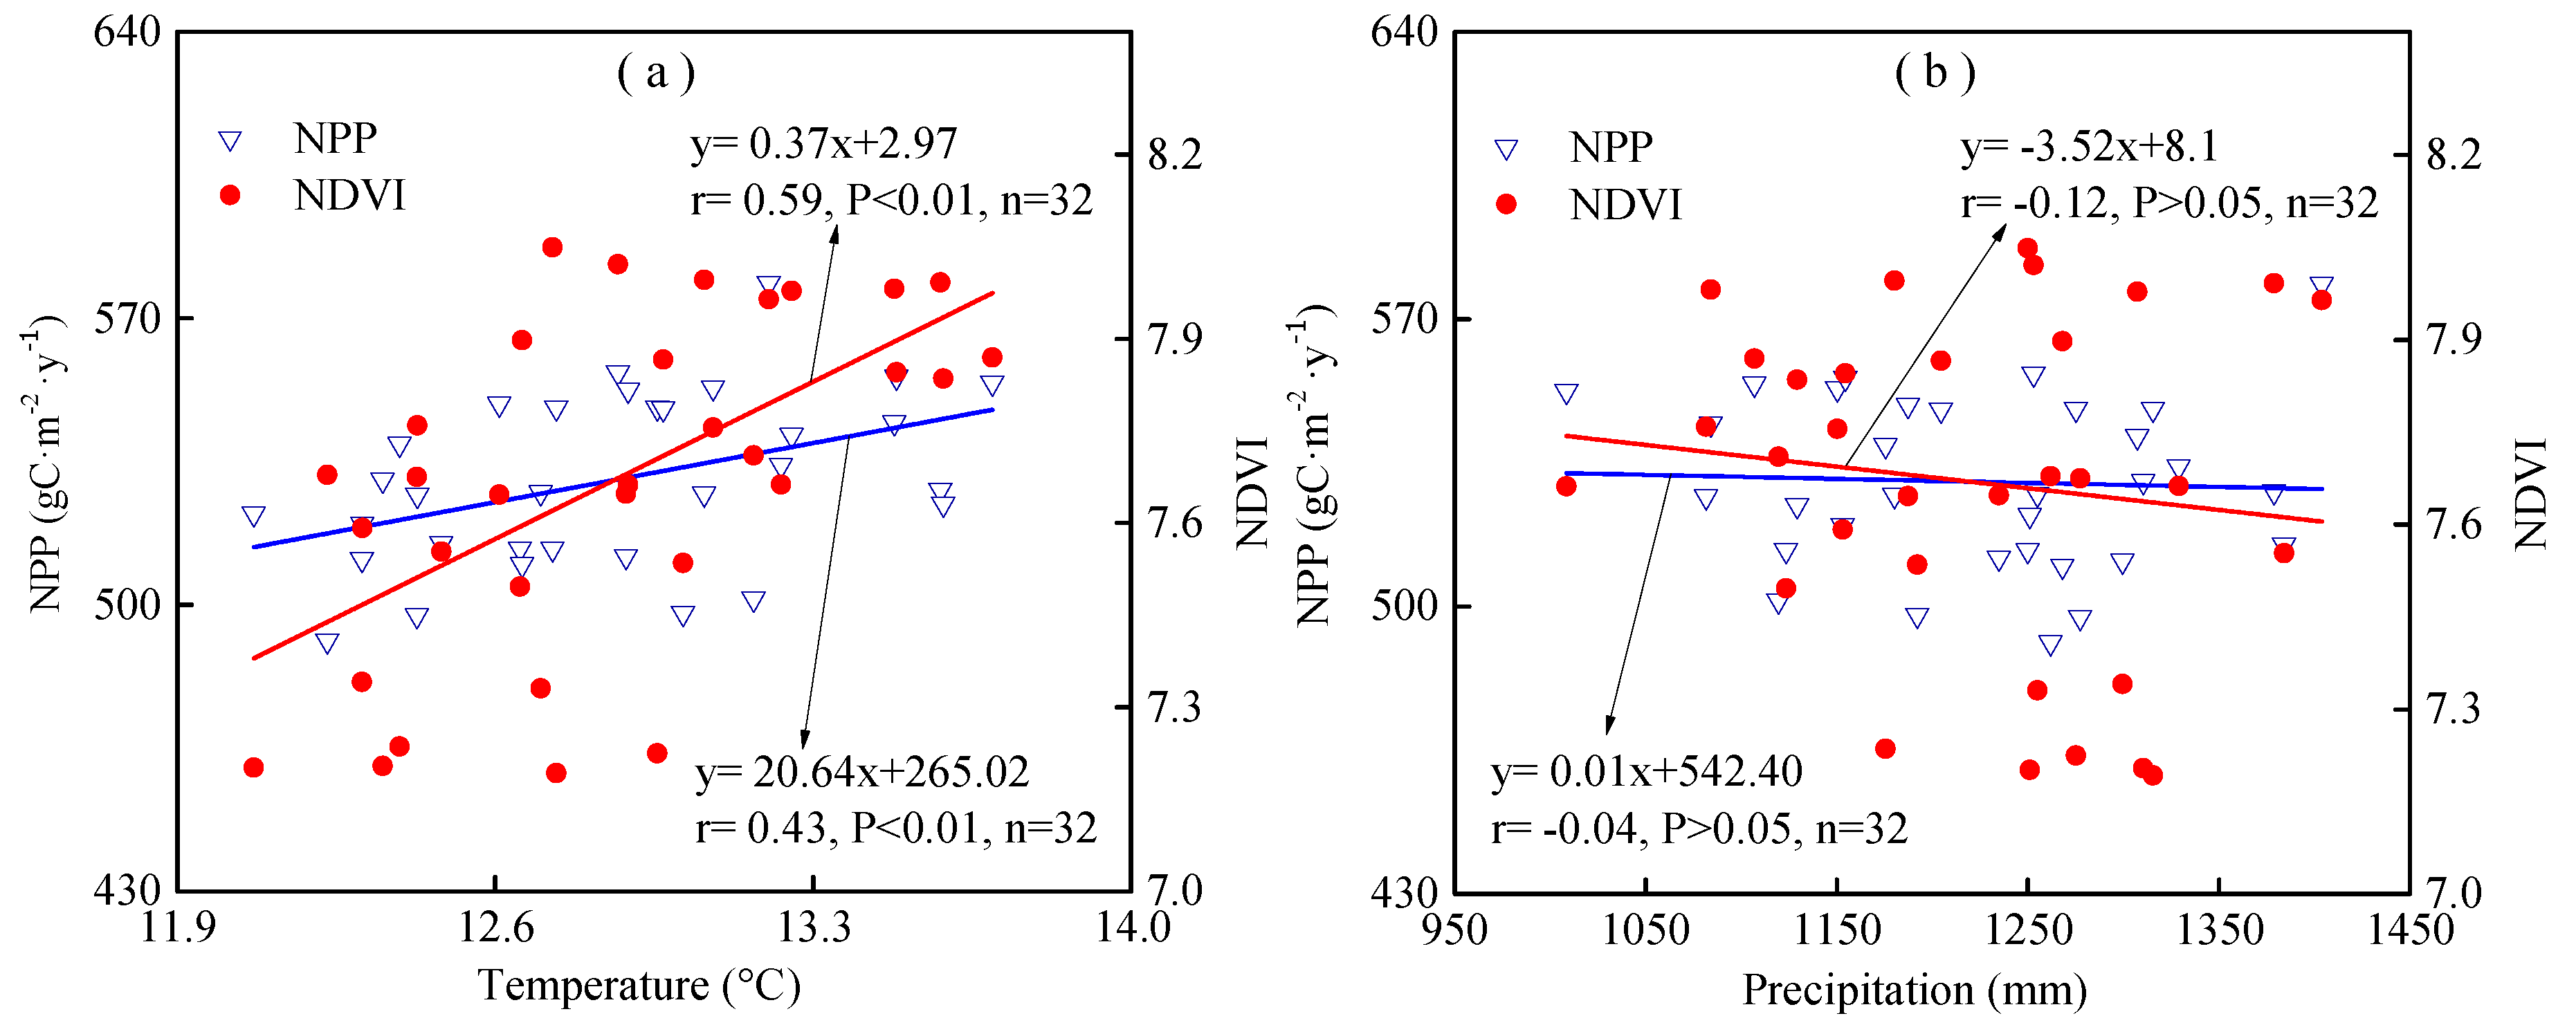
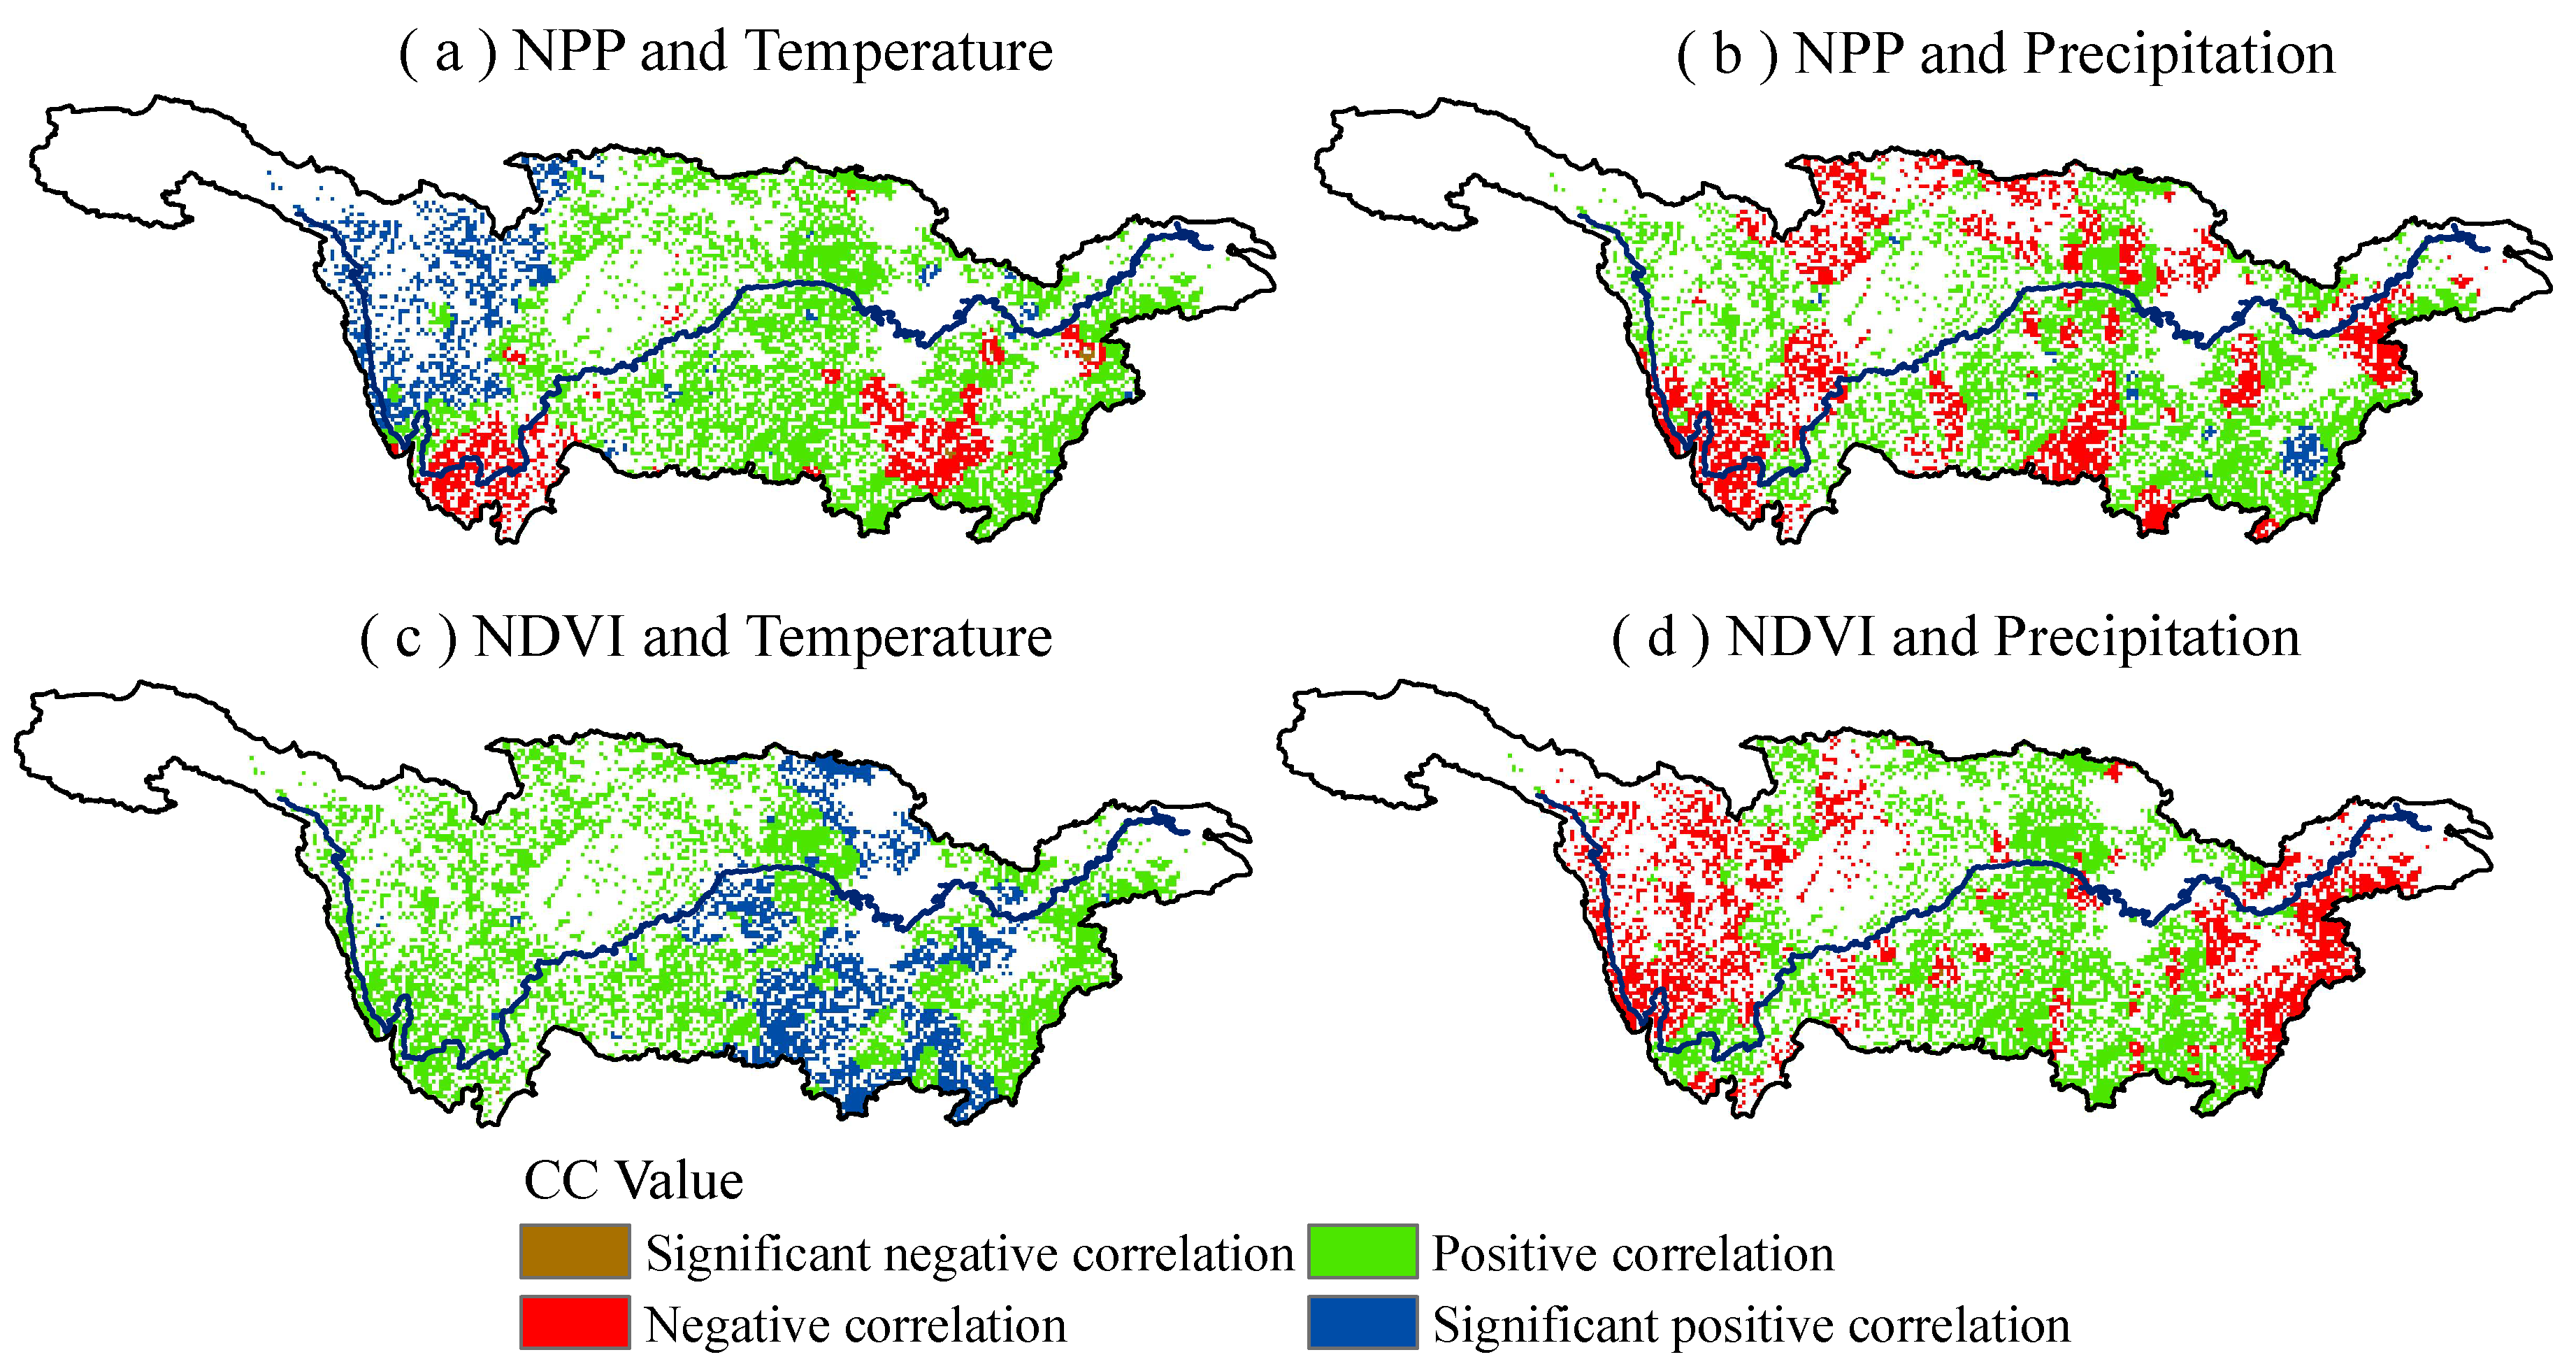
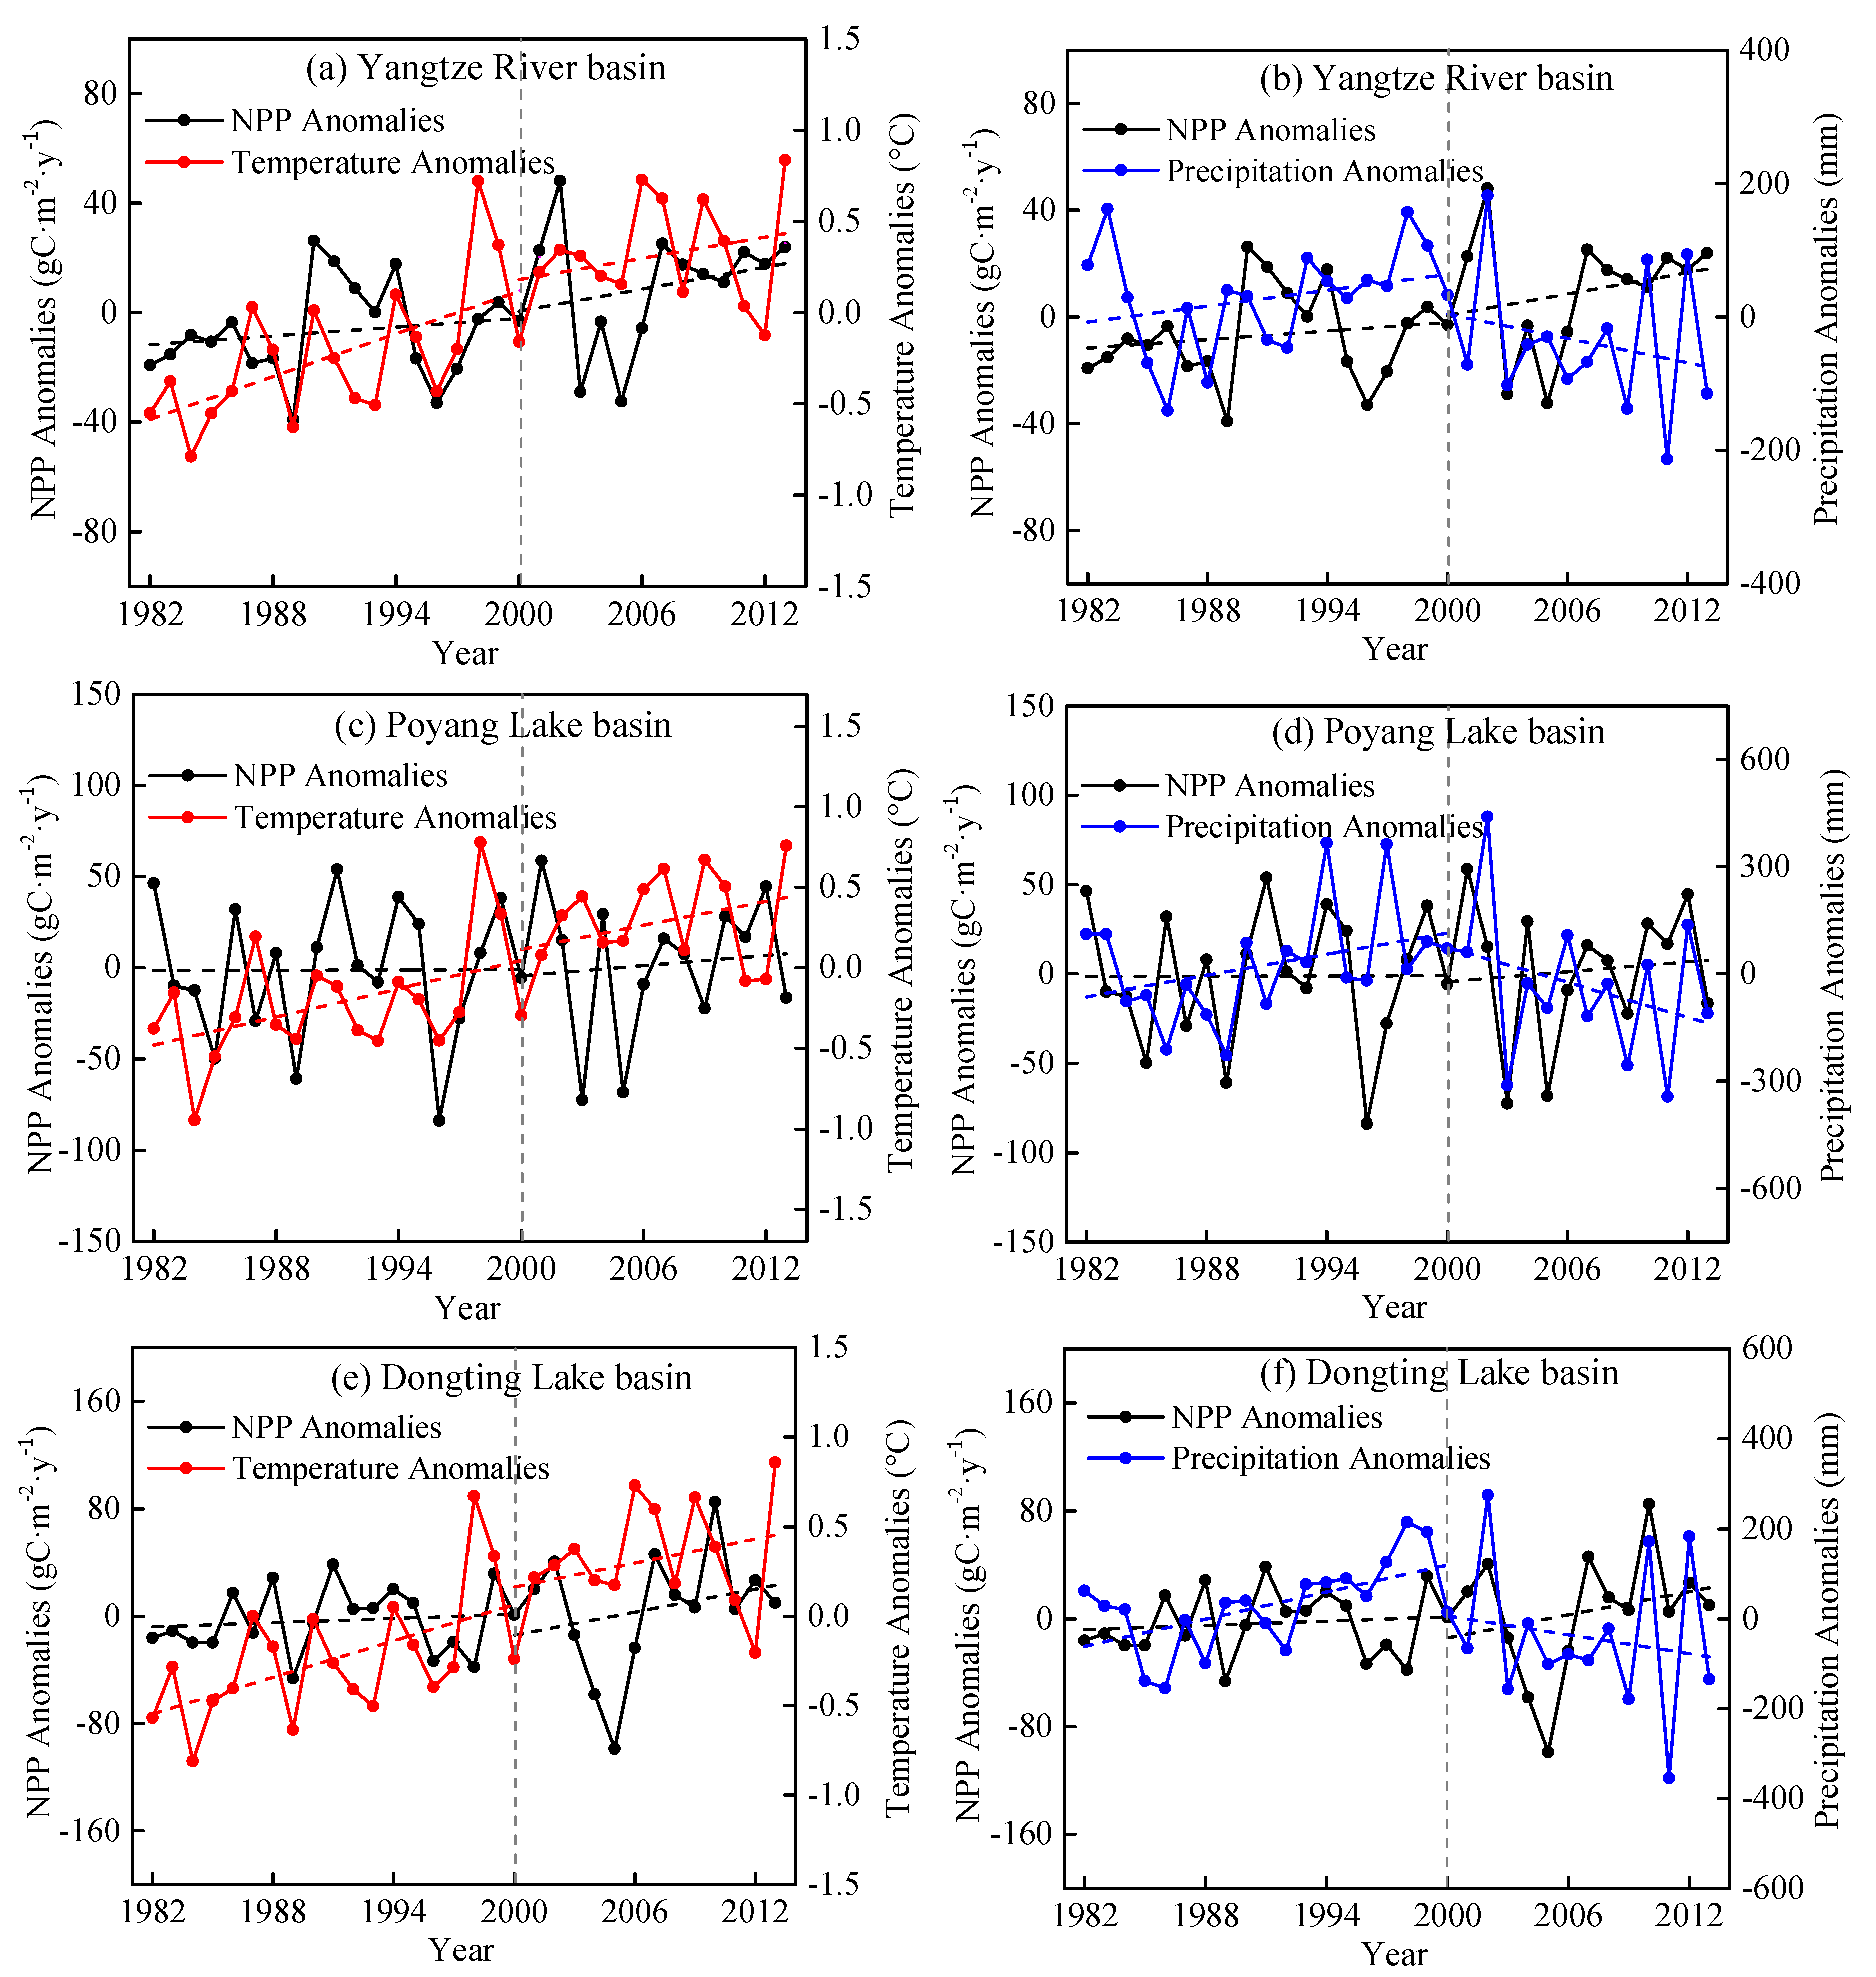
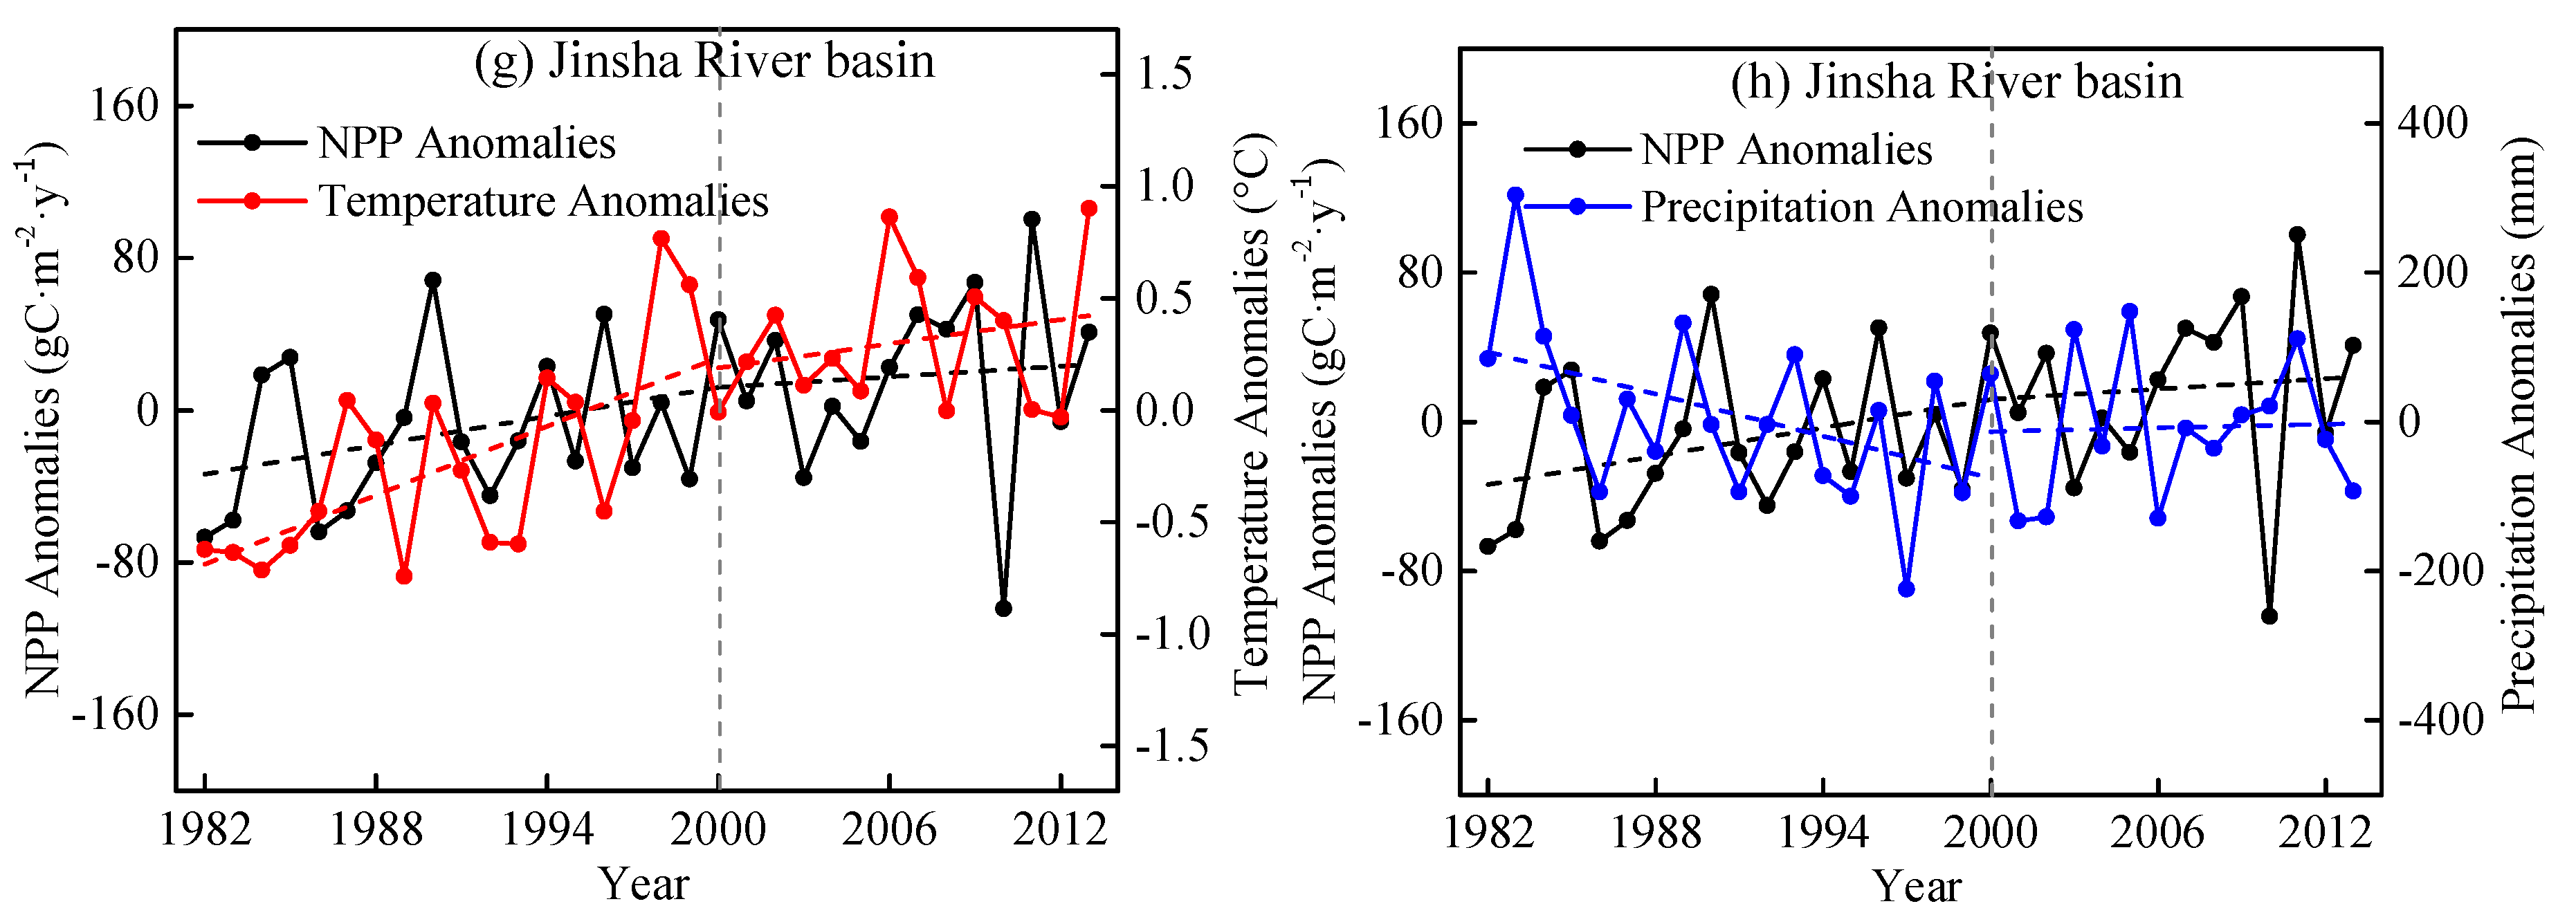
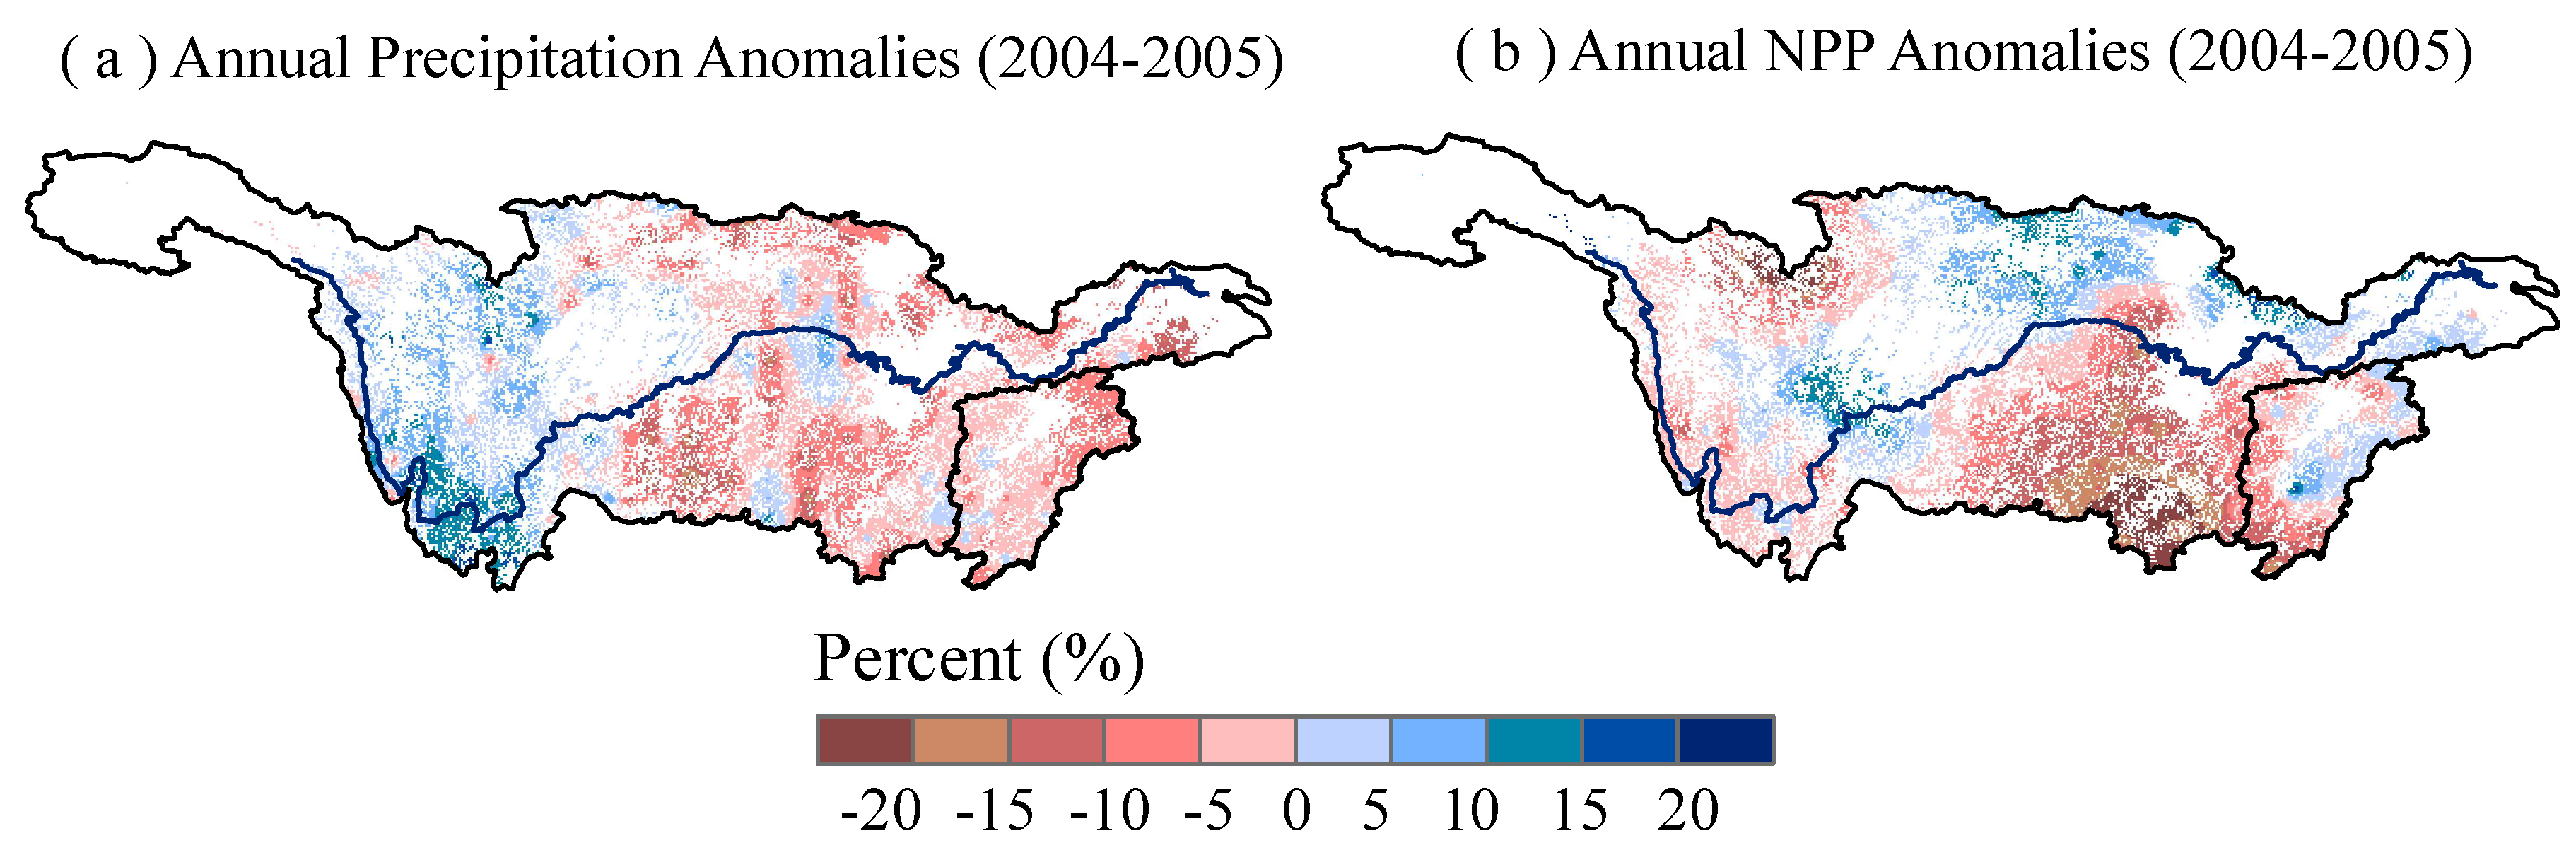
By performing a comparative analysis of temperature and precipitation for the past 30 years, we concluded that the forest NPP and NDVI in the Yangtze River basin were sensitive to climate changes. Positive correlations can be found between the forest NPP (NDVI) and temperature in most of the study area. The forest NPP and NDVI with the annual precipitation revealed the positive correlations in around 58% of the study area. Moreover, large-scale drought event in the years 2004–2005 has led the NPP to obviously decrease in the middle and lower Yangtze River basin.
(3)
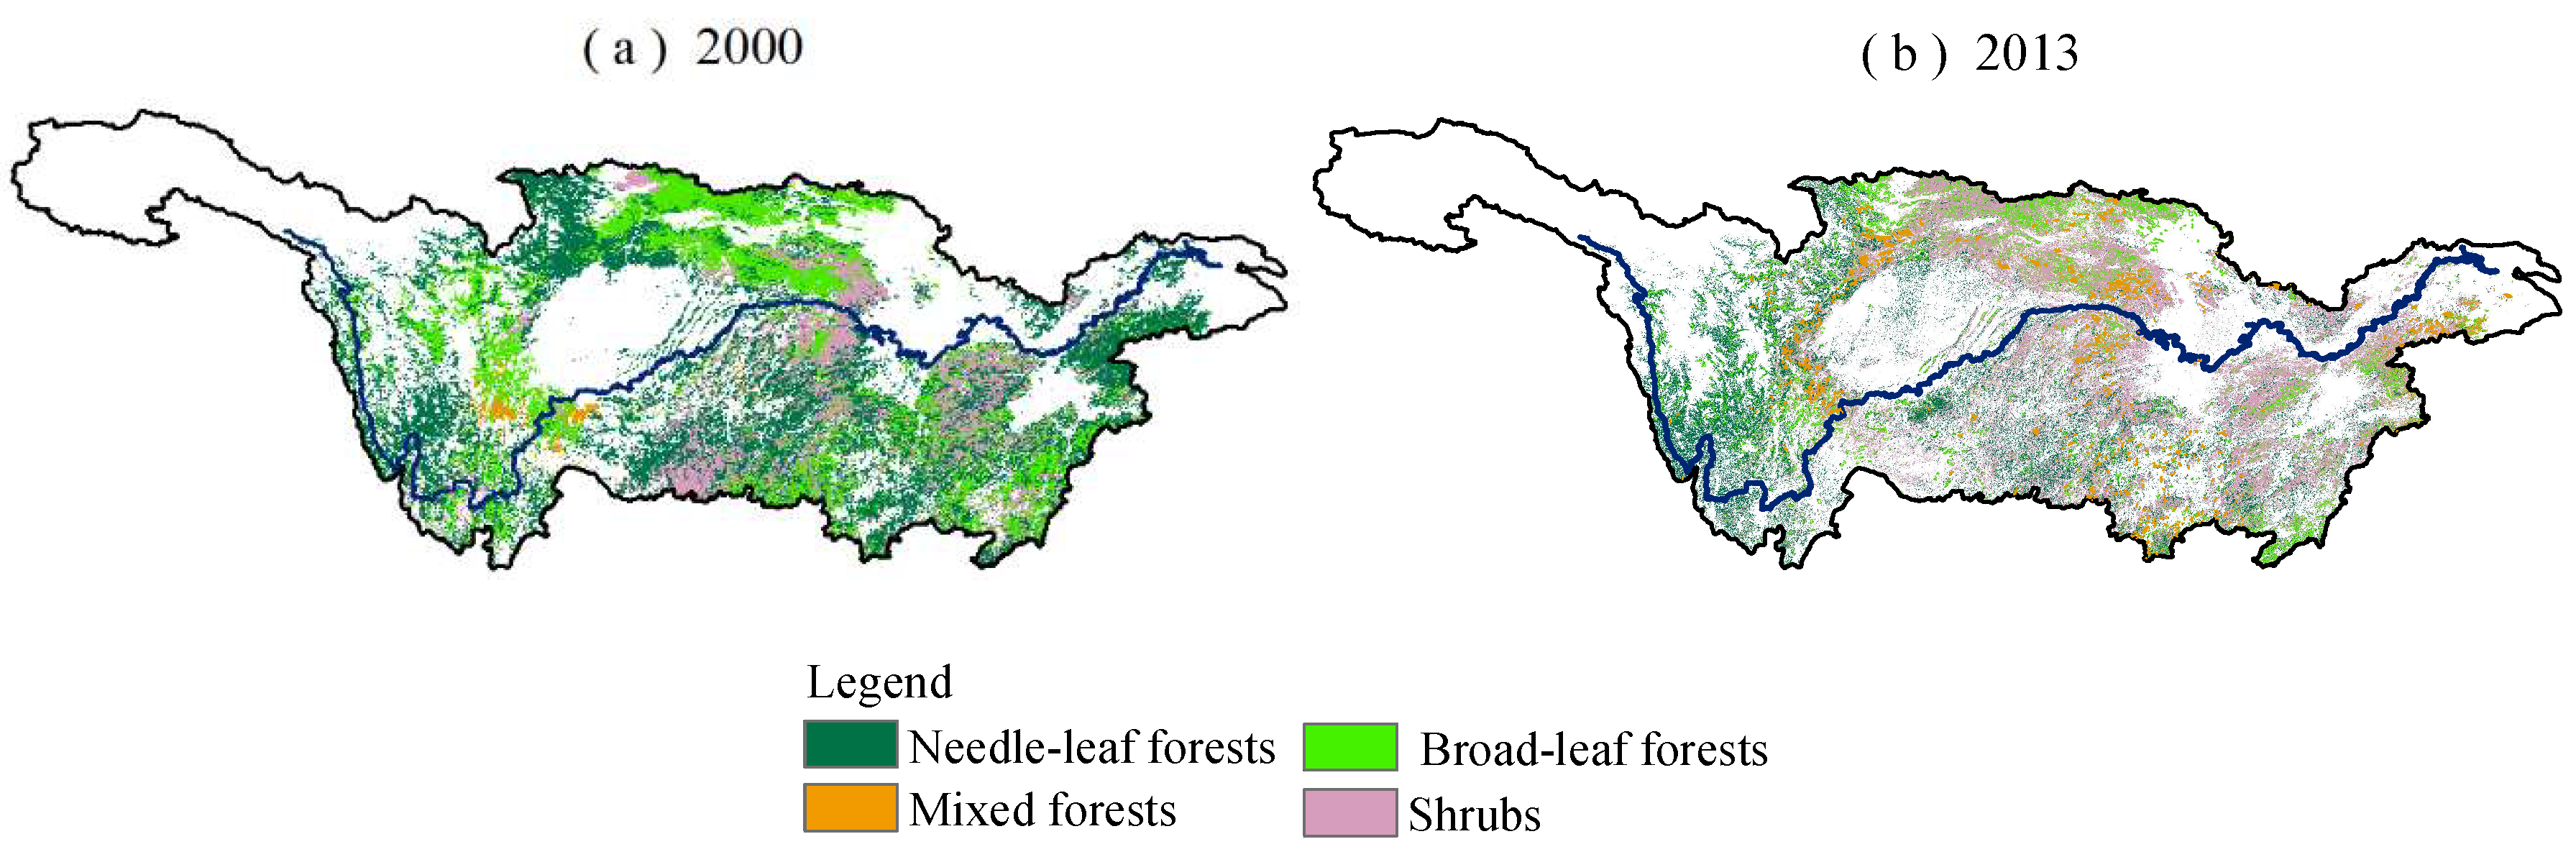
Major ecological projects have played a positive role in improving forest coverage and forest protection. The increase in forest areas from the year of 2000 to 2010 was larger than that from 1990 to 2000. The forest areas in the Yangtze River basin increased by 1409 km2 from 2000 to 2010. Although the forest NPP increased during the past 30 years, the increasing rate for the NDVI was higher than that of NPP, especially after the year 2000.
Human activity and climate change have had complex and interactive effects on terrestrial NPP and NDVI. The manifestations of these two forces have typically been lumped together. Therefore, the joint impacts of climate change and human activities on vegetation should be the subject of future research.

Author Contributions

Z.Z. provided the datasets including the required supporting software needed for the analyses; J.C., S.J., X.C. and C.-Y.X. cooperated in designing and improving the concept of the research project and related processes; F.Z., R.K., B.Z. and J.T. conducted the data processing and analysis. All the authors participated actively in preparing and reviewing the manuscript.

Funding

This paper is financially supported by National Natural Science Foundation of China (Grant No. 91747203 and 41171020) and Distinguished Young Scholars Fund of Nanjing Forestry University (NLJQ2015-01). The project supported by the Six Talent Peaks project in Jiangsu Province (Grant no. 2015-JY-017) and the Priority Academic Program Development of Jiangsu Higher Education Institutions (PAPD).

Acknowledgments

We would like to thank the National Climate Centre in Beijing for providing valuable climate datasets. We want to thank the editor and reviewers for their valuable advices and suggestions that helped us improve this manuscript.

Conflicts of Interest

The authors declare no conflict of interest.

References

  1. Pan, Y.; Birdsey, R.A.; Phillips, O.L.; Jackson, R.B. The Structure, Distribution, and Biomass of the World’s Forests. Annu. Rev. Ecol. Evol. Syst. 2013, 44, 593–622. [Google Scholar] [CrossRef]
  2. Pan, Y.; Birdsey, R.A.; Fang, J.; Houghton, R.; Kauppi, P.E.; Kurz, W.A.; Phillips, O.L.; Shvidenko, A.; Lewis, S.L.; Canadell, J.G.; et al. A Large and Persistent Carbon Sink in the World’s Forests. Science 2011, 333, 988–993. [Google Scholar] [CrossRef] [PubMed]
  3. Zhao, M.; Running, S.W. Drought-induced reduction in global terrestrial net primary production from 2000 through 2009. Science 2010, 329, 940–943. [Google Scholar] [CrossRef] [PubMed]
  4. Xu, D.; Li, C.; Song, X.; Ren, H. The dynamics of desertification in the farming-pastoral region of North China over the past 10 years and their relationship to climate change and human activity. Catena 2014, 123, 11–22. [Google Scholar] [CrossRef]
  5. Erşahin, S.; Bilgili, B.C.; Dikmen, U.; Ercanli, I. Net Primary Productivity of Anatolian Forests in Relation to Climate, 2000–2010. For. Sci. 2016, 62, 698–709. [Google Scholar] [CrossRef]
  6. Kimball, J.S.; Zhao, M.; McDonald, K.C.; Running, S.W. Satellite Remote Sensing of Terrestrial Net Primary Production for the Pan-Arctic Basin and Alaska. Mitig. Adapt. Strat. Glob. Chang. 2006, 11, 783–804. [Google Scholar] [CrossRef]
  7. Wang, H.; Liu, G.; Li, Z.; Ye, X.; Wang, M.; Gong, L. Impacts of climate change on net primary productivity in arid and semiarid regions of China. Chin. Geogr. Sci. 2016, 26, 35–47. [Google Scholar] [CrossRef]
  8. Exbrayat, J.; Liu, Y.Y.; Williams, M. Impact of deforestation and climate on the Amazon Basin’s above-ground biomass during 1993–2012. Sci. Rep. 2017, 7, 15615. [Google Scholar] [CrossRef] [PubMed]
  9. Rafique, R.; Zhao, F.; de Jong, R.; Zeng, N.; Asrar, G. Global and Regional Variability and Change in Terrestrial Ecosystems Net Primary Production and NDVI: A Model-Data Comparison. Remote Sens. 2016, 8, 177. [Google Scholar] [CrossRef]
  10. Li, H.; Chen, J.; Tong, C. Comparison of NPP estimation by remote sensing-based parametric model and ecological processed model over forest at regional scale. In Proceedings of the 2014 3rd International Workshop on Earth Observation and Remote Sensing Applications (EORSA), Changsha, China, 11–14 June 2014; pp. 318–322. [Google Scholar]
  11. Jiang, C.; Wu, Z.F.; Cheng, J.; Yu, Q.; Rao, X.Q. Impacts of urbanization on net primary productivity in the Pearl River Delta, China. Int. J. Plant Prod. 2015, 9, 581–598. [Google Scholar]
  12. Tang, F.D.; Han, S.J.; Zhang, J.H. Carbon dynamics of broad-leaved Korean pine forest in Changbai Mountains and its response to climate change. Chin. J. Plant Ecol. 2009, 20, 1285–1292. [Google Scholar]
  13. Babst, F.; Poulter, B.; Trouet, V.; Tan, K.; Neuwirth, B.; Wilson, R.; Carrer, M.; Grabner, M.; Tegel, W.; Levanic, T. Site- and species-specific responses of forest growth to climate across the European continent. Glob. Ecol. Biogeogr. 2013, 22, 706–717. [Google Scholar] [CrossRef]
  14. Xu, X.; Tan, Y.; Yang, G.; Li, H.; Su, W. Impacts of China’s Three Gorges Dam Project on net primary productivity in the reservoir area. Sci. Total Environ. 2011, 409, 4656–4662. [Google Scholar] [CrossRef] [PubMed]
  15. Rao, P.; Jiang, W.; Hou, Y.; Chen, Z.; Jia, K. Dynamic Change Analysis of Surface Water in the Yangtze River Basin Based on MODIS Products. Remote Sens. 2018, 10, 1025. [Google Scholar] [CrossRef]
  16. Sun, G.D. Simulation of potential vegetation distribution and estimation of carbon flux in China from 1981 to 1998 with LPJ dynamic global vegetation model. Climatic. Environ. Res. 2009, 14, 341–351. [Google Scholar]
  17. Sitch, S.; Smith, B.; Prentice, I.C.; Arneth, A.; Bondeau, A.; Cramer, W.; Kaplan, J.O.; Levis, S.; Lucht, W.; Sykes, M.T.; et al. Evaluation of ecosystem dynamics, plant geography and terrestrial carbon cycling in the LPJ dynamic global vegetation model. Glob. Chang. Biol. 2003, 9, 161–185. [Google Scholar] [CrossRef]
  18. Chang, J.; Tian, J.; Zhang, Z.; Chen, X.; Chen, Y.; Chen, S.; Duan, Z. Changes of Grassland Rain Use Efficiency and NDVI in Northwestern China from 1982 to 2013 and Its Response to Climate Change. Water 2018, 10, 1689. [Google Scholar] [CrossRef]
  19. Zhang, F.; Ju, W.; Shen, S.; Wang, S.; Yu, G.; Han, S. Variations of Terrestrial Net Primary Productivity in East Asia. Terr. Atmos. Ocean. Sci. 2012, 23, 425–437. [Google Scholar] [CrossRef]
  20. Chen, T.; Peng, L.; Liu, S.; Wang, Q. Spatio-temporal pattern of net primary productivity in Hengduan Mountains area, China: Impacts of climate change and human activities. Chin. Geogr. Sci. 2017, 27, 948–962. [Google Scholar] [CrossRef]
  21. Zhou, W.; Sun, Z.; Li, J.; Gang, C.; Zhang, C. Desertification dynamic and the relative roles of climate change and human activities in desertification in the Heihe River Basin based on NPP. J. Arid Land 2013, 5, 465–479. [Google Scholar] [CrossRef] [Green Version]
  22. Yang, H.; Mu, S.; Li, J. Effects of ecological restoration projects on land use and land cover change and its influences on territorial NPP in Xinjiang, China. Catena 2014, 115, 85–95. [Google Scholar] [CrossRef]
  23. Zhang, Y.; Song, C.; Zhang, K.; Cheng, X.; Band, L.E.; Zhang, Q. Effects of land use/land cover and climate changes on terrestrial net primary productivity in the Yangtze River Basin, China, from 2001 to 2010. J. Geophys. Res. Biogeosci. 2014, 119, 1092–1109. [Google Scholar] [CrossRef]
  24. Wu, Y.; WU, Z.; Yu, S. Quantitative assessment of the impacts of human activities on net primary productivity. Chin. J. Plant Ecol. 2017, 28, 2535–2544. [Google Scholar]
  25. Tian, J.; Chang, J.; Zhang, Z.; Wang, Y.; Wu, Y.; Jiang, T. Influence of Three Gorges Dam on Downstream Low Flow. Water 2019, 11, 65. [Google Scholar] [CrossRef]
  26. Piao, S.; Cui, M.; Chen, A.; Wang, X.; Ciais, P.; Liu, J.; Tang, Y. Altitude and temperature dependence of change in the spring vegetation green-up date from 1982 to 2006 in the Qinghai-Xizang Plateau. Agric. For. Meteorol. 2011, 151, 1599–1608. [Google Scholar] [CrossRef]
  27. Ni, J. Net primary productivity in forests of China: Scaling-up of national inventory data and comparison with model predictions. For. Ecol. Manag. 2003, 176, 485–495. [Google Scholar] [CrossRef]
  28. Sitch, S.; Brovkin, V.; von Bloh, W.; van Vuuren, D.; Eickhout, B.; Ganopolski, A. Impacts of future land cover changes on atmospheric CO2 and climate. Glob. Biogeochrm. Cycles 2005, 19. [Google Scholar] [CrossRef]
  29. Beer, C.; Lucht, W.; Gerten, D.; Thonicke, K.; Schmullius, C. Effects of soil freezing and thawing on vegetation carbon density in Siberia: A modeling analysis with the Lund-Potsdam-Jena Dynamic Global Vegetation Model (LPJ-DGVM). Glob. Biogeochem. Cycles 2007, 2. [Google Scholar] [CrossRef]
  30. Prentice, I.C.; Cramer, W.; Harrison, S.P.; Leemans, R.; Monserud, R.A.; Solomon, A.M. Special Paper: A Global Biome Model Based on Plant Physiology and Dominance, Soil Properties and Climate. J. Biogeogr. 1992, 19, 117–134. [Google Scholar] [CrossRef]
  31. Sun, G.; Mu, M. Understanding variations and seasonal characteristics of net primary production under two types of climate change scenarios in China using the LPJ model. Clim. Chang. 2013, 120, 755–769. [Google Scholar] [CrossRef]
  32. Yin, Y.; Ma, D.; Wu, S. Climate change risk to forests in China associated with warming. Sci. Rep. 2018, 8, 1–13. [Google Scholar] [CrossRef] [PubMed]
  33. Liu, R.; Li, N.; Su, H.; Sang, W. Simulation and Analysis on future carbon balance of three deciduous forests in Beijing mountain area warm temperate zone of China. J. Plant Ecol. 2009, 33, 516–534. [Google Scholar]
  34. Xu, C.Y. Statistical Analysis of Parameters and Residuals of a Conceptual Water Balance Model-Methodology and Case Study. Water 2001, 15, 75–92. [Google Scholar]
  35. Zhang, Z.; Chang, J.; Xu, C.; Zhou, Y.; Wu, Y.; Chen, X.; Jiang, S.; Duan, Z. The response of lake area and vegetation cover variations to climate change over the Qinghai-Tibetan Plateau during the past 30 years. Sci. Total Environ. 2018, 635, 443–451. [Google Scholar] [CrossRef]
  36. Ke, J.H.; Piao, S.L.; Fang, J.Y. NPP and its spatio-temporal patterns in the Yangtze River watershed. Acta Phytoecol. Sin. 2003, 27, 764–770. [Google Scholar]
  37. Fensholt, R.; Rasmussen, K. Analysis of trends in the Sahelian ‘rain-use efficiency’ using GIMMS NDVI, RFE and GPCP rainfall data. Remote Sens. Environ. 2011, 115, 438–451. [Google Scholar] [CrossRef]
  38. Mariappan, N. Net Primary Productivity Estimation of Eastern Ghats using Multispectral MODIS Data. Int. J. Geom. Geosci. 2010, 1, 406–413. [Google Scholar]
  39. Zhang, Z.; Chen, X.; Xu, C.; Hong, Y.; Hardy, J.; Sun, Z. Examining the influence of river–lake interaction on the drought and water resources in the Poyang Lake basin. J. Hydrol. 2015, 522, 510–521. [Google Scholar] [CrossRef]
  40. Zhang, Y.; Song, C.; Zhang, K.; Cheng, X.; Zhang, Q. Spatial-temporal variability of terrestrial vegetation productivity in the Yangtze River Basin during 2000–2009. J. Plant Ecol. 2014, 7, 10–23. [Google Scholar] [CrossRef]
  41. Wu, Z.; Wu, J.; Liu, J.; He, B.; Lei, T.; Wang, Q. Increasing terrestrial vegetation activity of ecological restoration program in the Beijing–Tianjin Sand Source Region of China. Ecol. Eng. 2013, 52, 37–50. [Google Scholar] [CrossRef]
  42. Huang, L.; Xiao, T.; Zhao, Z.; Sun, C.; Liu, J.; Shao, Q.; Fan, J.; Wang, J. Effects of grassland restoration programs on ecosystems in arid and semiarid China. J. Environ. Manag. 2013, 117, 268–275. [Google Scholar] [CrossRef] [PubMed]
  43. Hasenauer, H.; Petritsch, R.; Zhao, M.; Boisvenue, C.; Running, S.W. Reconciling satellite with ground data to estimate forest productivity at national scales. For. Ecol. Manag. 2012, 276, 196–208. [Google Scholar] [CrossRef]
  44. Potter, C.; Klooster, S.; Genovese, V. Net primary production of terrestrial ecosystems from 2000 to 2009. Clim. Chang. 2012, 115, 365–378. [Google Scholar] [CrossRef] [Green Version]
  45. Gang, C.; Zhou, W.; Li, J.; Chen, Y.; Mu, S.; Ren, J.; Chen, J.; Groisman, P.Y. Assessing the spatiotemporal variation in distribution, extent and NPP of terrestrial ecosystems in response to climate change from 1911 to 2000. PLoS ONE 2013, 8, e80394. [Google Scholar] [CrossRef]
  46. Liu, H.; Zhang, M.; Lin, Z. Relative importance of climate changes at different time scales on net primary productivity—A case study of the Karst area of northwest Guangxi, China. Environ. Monit. Assess. 2017, 189, 539. [Google Scholar] [CrossRef]
  47. Wang, J.; Meng, J.J.; Cai, Y.L. Assessing vegetation dynamics impacted by climate change in the southwestern karst region of China with AVHRR NDVI and AVHRR NPP time-series. Environ. Geol. 2008, 54, 1185–1195. [Google Scholar] [CrossRef]
  48. Fang, S.; Yan, J.; Che, M.; Zhu, Y.; Liu, Z.; Pei, H.; Zhang, H.; Xu, G.; Lin, X. Climate change and the ecological responses in Xinjiang, China: Model simulations and data analyses. Quat. Int. 2013, 311, 108–116. [Google Scholar] [CrossRef]
  49. Li, X.; Wang, H.; Zhou, S.; Sun, B.; Gao, Z. Did ecological engineering projects have a significant effect on large-scale vegetation restoration in Beijing-Tianjin Sand Source Region, China? A remote sensing approach. Geogr. Sci. 2016, 26, 216–228. [Google Scholar] [CrossRef] [Green Version]
  50. Moraes, E.C.; Franchito, S.H.; Rao, V.B. Amazonian Deforestation: Impact of Global Warming on the Energy Balance and Climate. J. Appl. Meteorol. Clim. 2013, 52, 521–530. [Google Scholar] [CrossRef] [Green Version]
  51. Lu, F.; Hu, H.; Sun, W.; Zhu, J.; Liu, G.; Zhou, W.; Zhang, Q.; Shi, P.; Liu, X.; Wu, X.; et al. Effects of national ecological restoration projects on carbon sequestration in China from 2001 to 2010. Proc. Natl. Acad. Sci. USA 2018, 115, 4039–4044. [Google Scholar] [CrossRef] [Green Version]
  52. Guo, Z.; Hu, H.; Li, P.; Li, N.; Fang, J. Spatio-temporal changes in biomass carbon sinks in China’s forests from 1977 to 2008. Sci. China Life Sci. 2013, 56, 661–671. [Google Scholar] [CrossRef] [PubMed]
  53. Fang, J.; Guo, Z.; Hu, H.; Kato, T.; Muraoka, H.; Son, Y. Forest biomass carbon sinks in East Asia, with special reference to the relative contributions of forest expansion and forest growth. Glob. Chang. Biol. 2014, 20, 2019–2030. [Google Scholar] [CrossRef] [PubMed]
  54. Fang, L.; Huimin, Y.; Fengxue, G.; Zhongen, N.; Mei, H. Net Primary Productivity Increased on the Loess Plateau Following Implementation of the Grain to Green Program. J. Res. Ecol. 2017, 8, 413–421. [Google Scholar] [CrossRef]
Figure 1. Location of the observed meteorological station and NPP (Net Primary Productivity) sites over the Yangtze River basin and the forest distribution map in the year 2000.
Remotesensing 11 01451 g001
Figure 2. Spatial distribution of annual mean NPP in Yangtze River basin in 2000 and 2010.
Remotesensing 11 01451 g002
Figure 3. Comparison of the annual mean forest NPP and NDVI in the Yangtze River basin during the periods of 1982–2000 and 2001–2013.
Remotesensing 11 01451 g003
Figure 4. Changing trends of annual mean forest NPP and NDVI in the Yangtze River basin during the period 1982–2013.
Remotesensing 11 01451 g004
Figure 5. The annual mean forest NPP (a) and accumulated NDVI (b) in the Yangtze River basin during the period 1982–2013.
Remotesensing 11 01451 g005
Figure 6. Correlation among the annual mean forest NPP and NDVI with temperature (a) and precipitation (b) in the Yangtze River basin during the period 1982–2013.
Remotesensing 11 01451 g006
Figure 7. Spatial patterns of the correlation among the accumulated forest NPP and NDVI with climate factors in the Yangtze River basin during the period 1982–2013.
Remotesensing 11 01451 g007
Figure 8. Average annual temperature, precipitation and forest NPP in the Yangtze River basin during the period 1982–2013.
Remotesensing 11 01451 g008aRemotesensing 11 01451 g008b
Figure 9. Comparison of the annual mean forest NPP and precipitation anomalies for the extreme drought event (compared to 1982–2013) in the Yangtze River basin during the period 2004–2005.
Remotesensing 11 01451 g009
Figure 10. Forest vegetation types in 2000 (a) and 2013 (b).
Remotesensing 11 01451 g010
Table 1. Comparison of forest NPP simulated by LPJ model with that from the observation sites in Yangtze River basin.
SitesLongitude (Degree)Latitude (Degree)Period (Year)Observed (gC·m−2·y−1)Simulated (gC·m−2·y−1)
1Qianyanzhou115.0526.732003–2008487.52521.39
2Huitong109.7526.832008–2009268.5350.56
3Ningxiang112.5728.332013–2013428.8453.84
4Anji119.6730.472011–2013585.4534.82
5Anqing117.0330.52005–2007506.1508.51
6Badong110.3831.031961–1990735578.37
7Fangxian101.7232.051961–1990540573.72
8Shennongjia110.6731.751961–1990549538.93
9Yonghexiang104331961–1990551580.9
10Baiyu98.8331.231961–1990550564.13
11Maerkangxian102.2231.921961–1990618606.6
12Jiuzhailinchang103.933.281961–1990573588.75
13Longkangxiang104.233.231961–1990597579.16
14Xingshan110.7331.221961–1990376447.08
15Songtao109.1828.171961–1990778620.31
16Tongzi106.828.131961–1990768585.9
17Zhongdianxian99.727.81961–1990730661.74
Table 2. Comparison of mean annual forest NPP from the LPJ model with that of other data (unit: gC·m−2·y−1).
DataPeriodBroad-Leaf ForestsNeedle-Leaf ForestsMixed ForestsShrubs
LPJ1982–2013543.66548.01538.75532.47
MODIS [23]2000–20091463 ± 247.05633 ± 199.4631 ± 191.2489 ± 271.8
CASA [36]1982–1999633.66295.46286.64
AVIM2 [23]2000–2000469 249625561
Table 3. Characteristics of the forest ecological projects in the Yangtze River basin.
CodeEcological ProjectsStart TimeDistribution
1Natural Forest Resources Protection 2000Middle and upper reaches
2Yangtze River Shelter Forest1989entire Yangtze
3Returning Farmland to Forest1999entire Yangtze
Table 4. The land-use in the Yangtze River basin (Area, unit: km2; Percent, unit: %).
YearForestsCroplandsGrasslandsBarrenWatersUrban
1990727,907507,194414,78858,35850,68424,051
1995732,503499,127426,11649,96948,73026,475
2000726,616502,204416,11358,46751,24428,277
2005727,692497,125415,43358,11652,68831,871
2010728,025493,487414,92758,28552,97135,235
2000 minus 1990−1291−49901,3251095604226
Percent−0.18−0.980.320.191.1017.57
2010 minus 20001409−8717−1186−18217276958
Percent0.19−1.74−0.29−0.313.3724.61

