Coral Reef Change Detection in Remote Pacific Islands Using Support Vector Machine Classifiers


1
Computational and Data Sciences Graduate Program, Schmid College of Science and Technology, Chapman University, Orange, CA 92866, USA
2
Center of Excellence in Earth Systems Modeling & Observations, Chapman University, Orange, CA 92866, USA
3
Schmid College of Science and Technology, Chapman University, Orange, CA 92866, USA
4
Department of Environmental Sciences, Faculty of Science, Alexandria University, Moharem Bek, Alexandria 21522, Egypt
5
Machine Learning and Assistive Technology Lab (MLAT), Chapman University, Orange, CA 92866, USA
*
Author to whom correspondence should be addressed.
Remote Sens. 2019, 11(13), 1525; https://0-doi-org.brum.beds.ac.uk/10.3390/rs11131525
Submission received: 13 May 2019
/
Revised: 18 June 2019
/
Accepted: 24 June 2019
/
Published: 27 June 2019
(This article belongs to the Section Coral Reefs Remote Sensing)
Abstract
:Despite the abundance of research on coral reef change detection, few studies have been conducted to assess the spatial generalization principles of a live coral cover classifier trained using remote sensing data from multiple locations. The aim of this study is to develop a machine learning classifier for coral dominated benthic cover-type class (CDBCTC) based on ground truth observations and Landsat images, evaluate the performance of this classifier when tested against new data, then deploy the classifier to perform CDBCTC change analysis of multiple locations. The proposed framework includes image calibration, support vector machine (SVM) training and tuning, statistical assessment of model accuracy, and temporal pixel-based image differencing. Validation of the methodology was performed by cross-validation and train/test split using ground truth observations of benthic cover from four different reefs. These four locations (Palmyra Atoll, Kingman Reef, Baker Island Atoll, and Howland Island) as well as two additional locations (Kiritimati Island and Tabuaeran Island) were then evaluated for CDBCTC change detection. The in-situ training accuracy against ground truth observations for Palmyra Atoll, Kingman Reef, Baker Island Atoll, and Howland Island were 87.9%, 85.7%, 69.2%, and 82.1% respectively. The classifier attained generalized accuracy scores of 78.8%, 81.0%, 65.4%, and 67.9% for the respective locations when trained using ground truth observations from neighboring reefs and tested against the local ground truth observations of each reef. The classifier was trained using the consolidated ground truth data of all four sites and attained a cross-validated accuracy of 75.3%. The CDBCTC change detection analysis showed a decrease in CDBCTC of 32% at Palmyra Atoll, 25% at Kingman Reef, 40% at Baker Island Atoll, 25% at Howland Island, 35% at Tabuaeran Island, and 43% at Kiritimati Island. This research establishes a methodology for developing a robust classifier and the associated Controlled Parameter Cross-Validation (CPCV) process for evaluating how well the model will generalize to new data. It is an important step for improving the scientific understanding of temporal change within coral reefs around the globe.
1. Introduction
Coral reefs are among the most critical ecosystems in the world due to the role that they play in maintaining biodiversity and sustaining the lifecycle of so many marine species. Unfortunately, many large-scale mass mortality events associated with coral bleaching have been documented. These bleaching events are driven by a variety of anthropogenic and environmental influences [1,2,3,4,5,6,7,8,9].
A significant amount of previous research has been conducted to analyze coral reefs using remote sensing data [10,11,12,13,14]. These studies include leveraging multispectral sensors [15], hyperspectral sensors [16], and comparisons between the two [17]. In addition, studies have been conducted using satellites with a wide range of spatial resolutions from medium resolution Landsat based research [18,19] to high-resolution Sentinel-2 based research [20,21]. It has been shown that classifiers based on higher resolution platforms typically attain a greater degree of accuracy, often by more than 10%, than lower resolution satellites [22]. This is due to the reduced within pixel mixing of benthic cover types when attempting to classify highly heterogeneous ecosystems such as coral reefs [23]. More recently, an object-based approach to coral cover detection has been explored [24] for geomorphological mapping and benthic community discrimination [25,26,27]. While the object-based approach is promising yielding accuracies greater than 90%, they do rely upon high-resolution imagery. It has been shown that the pixel-based approach yields no significant difference from the object-based approach when applied to medium-resolution satellites such as Landsat [28,29]. The recent advancements in satellite technology have allowed high-resolution imagery to be readily available from multiple platforms. However, while these platforms show great promise for analyzing the state of benthic habitats currently and in the recent past, they lack the history for a longer-term perspective on change. Yet, the Landsat platform provides a rich inventory of historical images albeit at medium-scale resolution. What is more, the quality of the data provided by missions has been proven to be appropriate for temporal analysis [30,31,32,33,34,35,36,37,38,39].
Technological advancements in remote sensing satellites have produced an extensive archive of images which are being used increasingly for scientific research on surface cover and cover change detection. The foremost example of this large historical archive of remote sensing images used for scientific research is the Landsat program which has been in operation since 1972 [40]. Due to the rich history and open source nature of Landsat, this platform has been used in the majority of change detection analysis [9] to detect the decline of coral habitats through temporal analysis even over extended time periods of 18 years or more [41]. Researchers suggest that historic Landsat imagery is the best available data source for studies of historic changes in environments [42]. However, the majority of Landsat images have no corresponding ground truth data on which a classifier can be trained to identify cover. Therefore, each of these studies have been conducted using the well known and well studied convention of training a supervised classifier on the Landsat imagery captured within the same time period as the ground truth observations were made then applying that classifier temporally to historical images [40]. This methodology is known as signature extension [32,33], or signature generalization [30,31] and since the 1970s studies have been conducted exploring the methodology as applied to Landsat data [32,34] using both individual Landsat satellites [43] as well as extended analysis over multiple Landsat satellites [44]. The scope of these temporal cover change detection studies vary from seagrass and coral reefs to forest and crop land [45]. Many studies have been conducted to validate this approach. Specifically, it has been established that there is no statistical difference (p = 0.303) between changes in coral habitat areas as observed by the Coral Reef Evaluation and Monitoring Project (CREMP) and change detection analysis conducted using a combination of Landsat missions [41]. Additional validation studies demonstrated that change analysis conducted based on Landsat 5, Landsat 7, and Landsat 8 was accurate with an overall accuracy of 88.9% ± 1.0% and a kappa coefficient of 0.86 [46]. This study expands upon the previous limited scope analyses by applying a classifier to two new sites [47,48,49,50,51]. Therefore, in addition to training a classifier and performing change detection analysis for each of four previously unanalyzed sites (Palmyra Atoll, Kingman Reef, Howland Island, and Baker Island Atoll), this study leveraged a robust classifier longitudinally applied to two additional sites (Tabuaeran Island and Kiritimati Island) enabling them to be evaluated for CDBCTC change detection as well. The validation of this methodology was conducted by isolating the ground truth observations of each location as test data (i.e., the target site). Ground truth data from the three neighboring sites (i.e., training sites) were used to train a classifier the performance of which was evaluated against the ground truth data of the target, test site. This procedure was repeated for each of the four locations for which ground truth data was available. A consolidated classifier was then trained using ground truth observations from all four sites and validated using cross-validation.
The objectives of this study are: (1) to propose a new methodology for training a CDBCTC classifier, (2) evaluate the effectiveness of this classifier to generalize to new data, and (3) leverage the robust classifier to conduct CDBCTC change detection. To conduct the study, we selected four remote Pacific Island reefs for which benthic cover ground truth observations were available and obtained the related Landsat images captured within six months of the observation dates for each location. The reefs analyzed in this research have not been the subject of previous remote sensing studies for widespread change detection analysis.
This paper begins with a discussion of the materials and methods used in the study. The section begins with a brief review of the data used followed by a per site description of the geomorphology and concludes with an explanation of the preprocessing steps taken to correct the remote sensing images. Following the Materials and Methods section is an analysis of the per site performance evaluation of the algorithm and a quantitative assessment of the algorithm trained using the combined information from all sites with ground truth observations and applied longitudinally to the two new locations. This is followed by the temporal change detection analysis for each site. The Discussion section of the paper includes an evaluation of the challenges and benefits of the methodology presented in the study as well as a proposal for future work on the subject. The paper concludes with a discussion of the resulting outcomes and conclusions from this research.
2. Materials and Methods
2.1. Satelite Data Used
Remote sensing data from Landsat-8 Operational Land Imager (OLI) and Landsat 7 Enhanced Thematic Mapper (ETM) with 30-m spatial resolution were used for this analysis. Landsat 7 was launched on 15 April 1999 and the subsequent Landsat 8 satellite was launched on 11 February 2013. Both Landsat 7 and Landsat 8 have a 16-day revisit cycle and capture scenes that are approximately 170 km north–south by 183 km east-west. Landsat 8 consist of nine spectral bands while Landsat 7 consists of seven. Due to their water column penetration properties, the visible bands from each scene were used as inputs to calculate the depth invariant indices (DII) on which the classifier was trained. On the Landsat 8 remote sensing platform, the visible bands used were Band 2 (0.45–0.51), Band 3 (0.53–0.59) and Band 4 (0.64–0.67). The coastal aerosol band was excluded from this analysis despite its water penetrating properties because there is no corresponding Landsat 7 band capturing light in the same wavelength range. The Landsat 7 visible bands used for this analysis were Band 1 (0.45–0.52), Band 2 (0.52–0.60), and Band 3 (0.63–0.69). The near infrared (NIR) band was also leveraged to identify areas of full wavelength absorption for water masking. Landsat 8 images captured within six months of the ground truth observation date were selected for all sites in which ground truth data was available [52,53]. Table 1 provides detailed information regarding the accuracy of the data with respect to the ground truth observation periods and associated image capture dates. Landsat 7 images of the same sites captured at least 12 years before the Landsat 8 images were also obtained for temporal change analysis. All Landsat images obtained were categorized Tier 1 data products radiometrically calibrated and orthorectified using ground control points and digital elevation model (DEM) data to Level-1 Precision and Terrain (L1TP). The data were determined to have well-characterized radiometry within image-to-image tolerances of ≤12-m radial root mean square error (RMSE) [54,55]. L1TP products are the highest quality Level-1 products produced by Landsat and considered suitable for pixel-level time series analysis [30,31,32,33,34,35,36,37,38,39]. Landsat 8 data processing includes radiometric calibration and systematic geometric correction. Calibration is undertaken every orbit and cross-calibration is performed with multiple other remote sensing platforms including Sentinel-2 and Landsat-7. In addition, on 29–30 March 2013 Landsat 8 was positioned directly under the Landsat 7 satellite for near-coincident data collection and calibration activities [56]. During this event, the two satellites were cross-calibrated by comparison of near-simultaneous sensor observations [57].
Two additional sites (Tabuaeran Island and Kiritimati Island) were also selected for longitudinal analysis using the classifier. These two additional sites are large and contain small amounts of human population. Tabuaeran Island has never been the subject of a coral classification and change detection analysis. Specific sites within the Kiritimati Island area of interest were recently studied for changes in reef structural complexity before and after a two year period [58], however, there has never been a large-scale mapping of the location using remote satellite imagery nor has a long-term (>10 years) analysis been conducted at the site. All remote sensing images with no more than 10% cloud cover across the scene were reviewed. Each scene was visually inspected by a researcher to identify which was most appropriate for each site considering the location of disturbances including cloud cover and cloud shadows in the area of interest within the scene. Table 2 displays for each site the Landsat Path-Row, Landsat 8 OLI and Landsat 7 ETM scene capture data, area of interest total size, and total number of ground truth observations.
2.2. Ground Truth Data Used for Training and Validation
Ground truth observations for CDBCTC were obtained from the National Oceanic and Atmospheric Administration (NOAA) as part of the National Coral Reef Monitoring Program (NCRMP) [54]. This effort identified 39 islands and atolls across the U.S. Pacific territories (including Palmyra Atoll, Kingman Reef, Baker Island Atoll, and Howland Island) as part of a large scale, rapid ecological assessment (REA) of reef environments [59]. Within each reef location, a stratified random sampling of survey sites were selected to capture as wide a domain of the environment as possible based on reef zones (backreef, forereef, protected slope, and lagoon), depth zone (shallow, mid, and deep), and when applicable sector (i.e., section of coastline with broadly similar habitat, exposure, and and/or management status). The sampled site locations were selected prior to each survey mission using geographic information system (GIS) substrate and strata maps maintained by NOAA Ecosystem Sciences Division (ESD). These substrate and strata maps were created using information from the National Centers for Coastal Ocean Science (NCCOS), reef zones, and geomorphologic structures digitized from IKONOS satellite imagery and nautical charts, bathymetric data from the NOAA ESD-affiliated Pacific Islands Benthic Habitat Mapping Center, University of Hawai’i at Manoa, and prior knowledge gained from previous visits to the locations. Observation sites were preloaded into GPS units as waypoints for experienced [59] divers to survey. At each site, a 30 m gray polyester transect line was laid across the substratum with markings at 7.5, 15, and 22.5 m indicating each diver’s observation point and the edges of their survey plots. Divers estimated the percentage cover by type including hard coral and recorded the observations on a data collection sheet [60]. Validation of estimates were performed through photo-quadrat images capturing the benthic habitat at 1 m intervals across the 30 m transect of the observation site. The images were annotated using CoralNet [61,62], a deep convolutional neural network computer vision tool, in order to produce a highly consistent evaluation of percent cover, frequency of occurrence, benthic community taxonomic composition and relative generic richness. It has been shown that even experienced divers tend to underestimate hard coral cover (by −3%), and encrusting algae (−2.3%) and overestimate fleshy macroalgae (6.5%) [63]. CoralNet can effectively identify coral cover in images with 89.7% accuracy (Cohen’s kappa) [62] and provides an unbiased evaluation of the benthic habitats across locations therefore the information captured via photo-quadrat was relied on for training and validation CDBCTC in this study. In total, 8825 images characterizing the benthic cover of 308 sites were captured and analyzed across the four island locations [54]. The benthic cover observations for the 308 sites was then classified as CDBCTC if the majority of images captured at a site were identified as coral cover. The appropriate pixel values for the observation site were then matched using the GPS survey coordinates and the geometrically calibrated Landsat 8 images. Of the 308 sites, 162 could be clearly be assigned as the ground truth observation for benthic cover within a pixel of the 30-m resolution Landsat data.
2.3. Sites
The six sites used for this study where chosen based on the locations of known coral reefs in the Pacific Ocean and relative proximity to each other. Palmyra Atoll and Kingman Reef are both located in the Northern Line Island chain with Kingman Reef only 69 km northwest of Palmyra Atoll. Both locations can be observed within the same Landsat scene. Palmyra Atoll is characterized by elongated terraces that extend 3 to 5 km to the east and west. The depths of these terraces range from 7 to 25 m [64]. The northern-most reef in the Line Island chain is Kingman Reef. This triangular atoll extends 9 km north to south and 18 km east to west [65]. A deeper reef (>20 m) extends along the western terrace and the southern and northern sections consist of shallow reefs (<2 m). The lagoon is mostly deep (>30 m) and contains large patch reefs with a diameter of 50–200 m, 2–10 m under the surface. Images of both Palmyra Atoll and Kingman Reef can be found in Figure 1.
Howland Island and Baker Island Atoll are both low reef, outlier islands of the Phoenix Island Archipelago. Baker Island Atoll is characterized by steep reef slopes to the west, north, and south which drop to substantial depths [66]. To the east, the island consists of spur and groove geomorphic features and oligotrophic waters off reef terraces [67]. Howland Island is 66 km northwest of Baker Island Atoll. Although closer in proximity to each other than Kingman Reef and Palmyra Atoll, these two locations reside within the extent of two separate Landsat scenes. Due to each islands’ proximity to the equator, they are subjected to the westward-flowing Southern Equatorial Current at the surface while the strong eastward-flowing Equatorial Undercurrent flows below. The result is a nutrient-rich topographic upwelling on the western sides of each island [68]. The waters around Howland Island descend to great depths just off the coast with a narrow, shallow fringing reef surrounding the island. The eastern side of the island is abrupt and covered with coral rubble due to erosion caused by waves and strong trade winds. The western portion of the island is low and sandy [69]. Images of these two islands can be found in Figure 1.
Tabuaeran Island (also called Fanning Island) and Kiritimati Island (also called Christmas Island) are both raised coral atolls. Images of these two islands can be found in Figure 1. The land area of Tabuaeran Island covers less than 34 km2 and has a population of approximately 2000 [70]. The lagoon of Tabuaeran Island is shallow (<15 m) and spans an area of 110. There is a single deep pass to the west through which 95% of the lagoon/ocean water exchange occurs [71] as well as two shallow (<1 m) passes to the southeast and north [70]. This geomorphology results in clear water in the vicinity of the deep pass and turbid water at the north and south basins of the lagoon. As a result, much of the coral within the lagoon is located in deeper pools near the primary inlet [72] and are comprised of coral fauna that is unique from the surrounding reef. The eastern portion of the island is characterized by a broad shelf that extends seaward for several hundred meters [72]. Kiritimati Island’s land mass covers 363 km2 making it the largest coral atoll in the world [73]. The lagoon is large covering 328 km2. The eastern end of the lagoon is comprised of several hundred smaller landlocked lagoons [74]. The island population has been increasing and in 2015 it was reported that 6447 inhabitants were living on the island [75]. A narrow reef flat runs around most of the island and sand plains occur to the northwest and southeast. Both Tabuaeran Island and Kiritimati Island encounter southeast trade winds for much of the year resulting in a relatively arid environment and highly variable precipitation [72,76].
2.4. Methodology
Each location required preprocessing including application of cloud and land masks, atmospheric correction, and water column correction. First, both the Landsat 7 and Landsat 8 image for each location was preprocessed for analysis. This included applying a water mask, cloud/fill pixel mask, and sun glint correction. The dark-pixel subtraction method was applied to correct for atmospheric contributions [77,78,79]. Finally, the preprocessing steps concluded with a calculation of the per pixel DII for water column correction. Each of the four initial sites for which ground truth observations were available were subjected to these preprocessing steps. The resulting DII values were used as the inputs to train our machine learning classifiers the output of which was the probability that a pixel belonged to the coral class.
The processing steps applied to each of the training locations are detailed in Figure 2 and to the two islands with no ground truth in Figure 3.
2.4.1. Cloud Mask
The initial preprocessing step included masking pixels obscured by clouds and their shadows. The Landsat images were selected from scenes with less than 10% cloud cover to minimize cloud and obstructions particularly in the coral reef areas of interest within each scene. However, given the locations of our sites and recency requirement to the time period of observation data, some amount of cloud cover was unavoidable. As a result, a cloud and pixel quality mask applied to both the initial state image and final state image of each scene. This was performed by leveraging the Landsat 7 and Landsat 8 product quality band (BQA) [79,80]. Furthermore, when conducting the change detection analysis step, both the initial state image mask and final state image mask were applied to both images of each scene. This important step was performed in order to isolate the change in coral population apart from the confounding effects of differences in quality between the two images.
2.4.2. Land Mask
The next preprocessing step was to prepare a mask for land pixels. The Landsat near infrared (NIR) band captures light between 0.851 and 0.0879 µm. Light in the wavelength range does not penetrate water making it an ideal candidate for delineating water from land [81]. The mask was developed by applying a threshold to the NIR band pixel values. Plots were created for each area of interest and inspected to identify the most appropriate cutoff for the mask.
2.4.3. Atmospheric Correction and Water Column Correction
Atmospheric and water surface properties account for 90% of at sensor reflectance in the visual bands [82]. Therefore, atmospheric correction was performed to remove this interference via the dark pixel subtraction method [83]. An area of deep-water (>50 m) in which visible wavelengths have fully attenuated was selected from within each scene [84]. Under the assumption that the atmospheric and water surface conditions are uniform across the scene, the mean deep-water radiance at sensor was leveraged to correct for the effect of atmospheric and surface reflectance interferences [84,85,86,87]. Due to the full attenuation of visible light, signal received from the deep-water area of interest is comprised of atmospheric radiance and surface reflectance. This allows the impact of these factors to be isolated for correction [88]. Two standard deviations are subtracted from mean radiance at sensor to account for possible sensor noise [89].
The intensity of visible light decreases exponentially as it penetrates water. The attenuation rate is wavelength-dependent and severely impacts the study of ocean habitats using remote sensing data [18]. Remote sensing imagery that contains several water-penetrating (visible) bands can be leveraged for water column correction [79]. Shorter-wavelength light will attenuate less rapidly than longer-wavelength light. As a result, at sensor the spectral radiances are comprised of both depth and the composition of the subsurface strata. This represents a confounding influence that can create a material shift in the subsurface reflectance. Therefore, it is advantageous to remove the influence of variable depth in the study of benthic features [85]. In this study, the well-known and broadly used water column correction method developed by Lyzenga [90,91,92,93,94] was applied to each image. Accordingly, if the radiance at sensor in band i () is expressed as:
where the following are represented:
- : the mean deep-water radiance in band i
- : a constant for band i accounting for atmospheric effects and water surface reflection
- : the bottom reflectance
- : a geometric factor to account for path length through water (set to two for a two-flow model)
- : depth
Applying natural logarithms and rearranging Equation (1) generates an atmospherically corrected radiance for band i that varies linearly according to depth [84]:
Similarly, the equation can be applied to band j:
Equation (2) can be rearranged to determine the bottom reflectance :
Yet equation (4) presents us with three unknown variables. Namely, the constant, the coefficient of attenuation, and depth (, , and respectively). The method of Lyzenga leverages the ratio of attenuation coefficients between each pair of bands thereby avoiding the need to calculate estimates of for each band directly [90,91]. The ratio of attenuation between bands i and j can be determined using the following equation:
where
and is the variance of band i and is the covariance between bands i and j. Therefore, using these equations, the DII can be calculated for any given scene without any external references to additional data.
2.4.4. SVM Site Application, Validation, and Change Analysis
In the analysis of Palmyra Island Atoll, Kingman Reef, Howland Island Atoll, and Baker Island, the preprocessing steps were followed by training of a Support Vector Machine (SVM) classifier [95] against each of the Landsat 8 images and evaluation of results using ground truth data. An SVM classifier was used due to its superior generalization properties and high performance even in small datasets. SVMs attempt to separate classes based on a maximum-margin hyperplane. As a result, particularly in low dimensions, the algorithm actually only relies on a fraction of the ground truth data. These points, called the support vectors, are the observations that are closest to the maximum-margin hyperplane. Tuning of the cost hyperparameter enables control over the tradeoff between in-situ accuracy and spatial generalization. Section 4.1 identifies several additional classifiers that were evaluated. Beginning with these four locations for which ground truth observation data was available, we trained an SVM classifier on the three Landsat 8 DII (DIIblue,green, DIIblue,red, DIIgreen,red) values to predict if the area corresponding to the DII pixel value was observed as part of the CDBCTC during the ground truth surveys or not. Tuning of the algorithm was performed using cross-validation. A radial basis function kernel outperformed other kernel methods and the optimal cost (regularization) and gamma (influence) parameters were determined for each site based on optimal accuracy and generalization criteria. Once the optimal hyperparameters for the SVM algorithm were obtained, the algorithm was applied to determine the posterior probability of each pixel within the Landsat 8 area of interest for each of the four locations. A map of the posterior probability that each pixel contained coral was produced and the final class for each pixel was determined by thresholding the posterior probability at 50%. This threshold value maximized the classification accuracy compared to the ground truth observations. The SVM classifier was then applied to the applicable, preprocessed Landsat 7 scene for each location. Posterior probability and predicted class maps were then produced for each of the Landsat 7 scenes as well. The Landsat 7 CDBCTC’s and Landsat 8 CDBCTC’s pixel class maps were then co-registered and a per pixel comparison of the predicted class was made for all pixels in each area of interest of each scene in order to determine the change in CDBCTC between two points in time.
The analysis of the four initial sites was followed by analysis of two more remote locations (Tabuaeran Island and Kiritimati Island). These unique locations were selected on the basis that they have never been the subjects of CDBCTC change detection analysis that maps the entire ecosystem using remote satellite imagery [58]. A SVM classifier was trained using the combined inputs (truth labels and DII values calculated from the corresponding Landsat 8 scene) from all four sites therefore enabling the resulting algorithm to more adeptly generalize beyond site specific biases of previous in-situ analysis [96]. Validation of this approach was performed in two different ways. First, the accuracy of the model trained on the consolidated data was assessed through cross-validation. While this methodology enabled an overview of the model performance it does not fully account for the location-based bias. Specifically, training the SVM algorithm on a sampling from all sites will incorporate some amount of site-based bias into the resulting mode. While this evaluation method represents an improvement to historical in-situ analysis, it is not a full analysis of the generalization properties of the classifier. Therefore, an additional evaluation procedure was deployed to test the ability of the classifier to generalize to each location independently. This second method of evaluation was performed by iteratively selecting the ground truth observations from one of the four island locations to withhold as test cases. A model was then trained on the ground truth data from the remaining three sites. Finally, the resulting trained classifier was applied to predict the CDBCTC classification of the ground truth observations from the remaining location that was withheld from training as test data. The result of this Controlled Parameter Cross-Validation (CPCV) method is a more accurate evaluation of the generalization properties of the machine learning algorithm when applied to new data. In this way, the CPCV process controls for much of the location based-bias of in-situ analysis and therefore is a more accurate assessment of the SVM classifier performance. Table 5 summarizes the results of this test procedure.
Using the consolidated ground truth observations from all the available sites enabled a more diverse set of inputs to train the machine learning algorithm. As a result, the classifier produced was capable of generalizing more effectively to additional sites [96]. The algorithm was tuned using cross-validation and the optimal model selected for application to Tabuaeran Island and Kiritimati Island areas of interest. Landsat 8 scenes from 2014 and Landsat 7 scenes from 2000 and 2002 were obtained and preprocessed. The trained classifier was then applied to these sites longitudinally using the model trained across the consolidated truth data from Palmyra Atoll, Kingman Reef, Baker Island Atoll, and Howland Island. The per pixel posterior probability map was created and the final classification of each pixel determined using a 50% threshold. Change detection analysis was then conducted by comparing the initial and final classification of each pixel. Implementation and analysis were performed using the open source R programming language and environment for statistical computing [97].
3. Results
3.1. Classicication Accruacy by Site
The preprocessed DII values were used to train SVM models [98,99] for each of Palmyra Island, Kingman Island, Baker Island Atoll, and Howland Island. In this manner, the DII values represent the features of the SVM model and the corresponding observed benthic cover type the response (e.g., live coral or not). The posterior probability for each pixel containing CDBCTC was computed and a mapping of these posterior probabilities was developed for each location. A threshold was then applied to the probabilities in order to identify the most likely class and mapped for reference. Contextual validation was performed by comparing the resulting maps of predicted probabilities against the known geomorphology of each site. Finally, the trained SVM algorithm was applied to the initial state Landsat 7 image for each location and the same posterior probability and predicted class maps were generated.
The Palmyra Atoll site contained a total of 82 unique ground truth observations. 66 of these observations were in unobscured pixels for which valid DII data could be precisely identified by pixel location matching the recorded GPS coordinates. The SVM model trained on this data correctly classified 87.9% of the ground truth observations within the area of interest. This model was further evaluated using precision and recall as common and well-known statistical measures for type I and type II errors. Precision measures the impact of type I error and therefore is an evaluation of the classifier’s ability to be exact. Recall measures the impact of type II error and therefore is an evaluation of how completely the classifier retrieves information. The Palmyra Atoll model obtained a precision of 0.837 and recall of 1.000. Another common measure of the effectiveness of a classifier is the harmonic mean of precision and recall, known as the F-measure. The F-measure of the SVM classifier trained and tuned against the Palmyra Atoll site data was 0.911. Specificity is a measure of the classifier’s capacity for differentiating between true negative observation data. As applied to the Palmyra Atoll site, the SVM classifier obtained a specificity of 0.680.
The Kingman Reef area of interest contained 57 ground truth observations for which 42 valid pixel values were unobscured. The classifier trained on this data yielded an overall accuracy of 85.7%. The resulting precision was measured at 0.824 and recall was measured at 1.000. This was an indicated that the model was committing type I errors but no type II errors. The model obtained an overall F-measure of 0.903 and specificity of 0.571.
There were 26 bottom type observations for the Baker Island Atoll site all of which had corresponding pixel values that were valid. The SVM model trained on this data obtained an accuracy of 69.2%. This lower accuracy is likely due to the inherent limitations of the observation data and mixing of bottom types within the pixels due to unique coral fauna and geomorphology. The model yielded a precision and recall of 0.706 and 0.800, respectively. The F-measure was calculated at 0.750 while specificity was observed at 0.546.
The Howland Atoll site area of interest contained 30 observations for which 28 valid pixels were obtained. The SVM model trained on this data yielded an accuracy of 82.1%. The resulting precision and recall were measured to be 0.813 and 0.867, respectively which indicates that the model is robust to both type I and type II errors. Furthermore, the classifier yielded an F-measure of 0.839 and specificity of 0.769.
3.2. Consolidated Model Robust to Site-Specific Bias
Once the classifier for each site was trained and deployed, a combined classifier was built using the consolidated information of all valid observation data from the four sites (Palmyra Atoll, Kingman Reef, Baker Island Atoll, and Howland Island). Combining the inputs from all sites enabled the development of an algorithm more robust to site-specific bias. The limitation or elimination of this bias allowed the resulting model to more effectively generalize to other sites for which the training sites were representative. Without the benefit of site-specific bias, the resulting accuracy is likely to suffer because the classifier no longer had the benefit of accounting for local conditions and geomorphology in training. However, the resulting algorithm did gain the benefit of being robust to these site-specific conditions and therefore could be applied to additional sites. When the SVM algorithm was applied to the consolidated observations of all sites it yielded an accuracy of 75.3%. The resulting precision was 0.740 and recall was 0.919. Specificity was measured to be 0.492 and the F-measure was 0.820. These figures are detailed in Table 3. Table 4 identifies the confusion matrices for each site. As expected, the classifier did not obtain as high an accuracy when assessed using the CPCV method. As discussed in the Materials and Methods section, this was a result of the further isolation and reduction of site-specific bias during the training of the algorithm. The CPCV method resulted in an accuracy of 78.8% when tested against the Palmyra Atoll ground truth data. This corresponds to a precision of 0.776, recall of 0.927, and specificity of 0.560. The F-measure was 0.844. The Kingman Reef site evaluated using the CPCV process obtained an accuracy of 81.0%, precision of 0.776, recall of 0.927, and specificity of 0.560. The corresponding F-measure was calculated at 0.867. The Baker Island Atoll and Howland Island results from the CPCV method show a decrease in accuracy to 65.4% and 67.9%, respectively. This decrease is related to the distance between the majority of the ground truth observations (i.e., Palmyra Atoll and Kingman Reef). This geographic distance resulted in ground truth observations that do not represent the test site as well due to differences in marine species, environmental conditions, and geomorphology. Baker Island Atoll and Howland Island were disproportionately impacted by this due to disproportionate representation in the ground truth observations. Some stratified random sampling of the locations was performed during CPCV assessment to control for this disproportionate representation, however, data size constraints limited the extent to which sampling methods could be applied. The Baker Island Atoll assessment yielded a precision of 0.750, recall of 0.600, and specificity of 0.769. The Howland Island test produced a precision of 0.750, recall of 0.600, and specificity of 0.769. The CPCV procedure obtained an F-measure of 0.769 and 0.667 for Baker Island Atoll and Howland Island, respectively. The assessment of the SVM classifier trained on the consolidated ground truth observations from all sites yielded an accuracy of 75.3%. The corresponding precision was 0.740, recall was 0.919, and specificity was 0.492. The F-measure was calculated as 0.820. These figures are summarized in Table 5. Figure 4 contains the receiver operating characteristic (ROC) curve for the classifier resulting from the model developed using the consolidated site data. This is a common visualization is used to evaluate the overall performance of a classifier. It plots the model’s recall (true positive rate) as a function of (false positive rate) [100]. An additional classifier diagnostic measure related to the ROC curve is the area under the ROC curve (AUC). The AUC resulting from the combined classifier was 0.778.
3.3. Change Detection Analysis
3.3.1. Palmyra Atoll
The baseline image of the Palmyra Atoll site used for the change detection analysis in this study was captured in 2001 and contained 24,092 pixels identified as coral, which corresponds to approximately 21.68 km2. In 2015 the same location contained 16,410 coral pixels or approximately 14.77 km2 of CDBCTC. This represents a 31.9% difference in CDBCTC over the 14-year period. Of the coral pixels in 2001, 9850 (8.87 km2) became algae by 2015. Furthermore, in 2001 52.8% of the area surveyed was identified as coral compared to 35.9% in 2015. A minor amount of area (4.8% of pixels) that was algae in the earlier image was determined to be coral in the second image. See Figure 5 for the Palmyra Atoll posterior probability map for 2001 (top) and 2015 (bottom). Figure 6 maps the CDBCTC change when the 2001 initial state classification map is compared to the 2015 final state classification map. Table 6 depicts the per class results of the temporal change detection analysis.
3.3.2. Kingman Reef
The Kingman Reef site revealed some of the smallest reductions in CDBCTC areas between the two points in time of the locations surveyed. The initial image of this location was captured in 2002. 33,294 coral pixels were identified as containing CDBCTC in the initial class image which corresponds to approximately 29.96 km2. The final status image was captured in 2015 and when analyzed revealed 24,860 pixels with CDBCTC (22.37 km2). This represents a 25.3% net decrease during the 14-year period between the image capture dates. 85.1% of valid, shallow area the initial state image contained coral while 63.5% of the final image contained coral. Figure 7 represents the mapping of Kingman Reef posterior probabilities for each pixel belonging to the coral class both for 2001 (top) and 2015 (bottom). Figure 8 maps the CDBCTC change when the 2001 initial state classification map is compared to the 2015 final state classification map. Table 6 is a summary of the results of the change detection analysis between the initial state image and final state image.
3.3.3. Baker Island Atoll
The second largest percentage decrease in coral between the initial and final state images was observed at the Baker Island Atoll site. The image of the scene used to identify the initial state of CDBCTC at the site was obtained in 2002 and the final image was obtained in 2014 representing a 13-year observation period. Initially 465 pixels or 0.42 km2 were classified as coral compared to 280 or 0.25 km2 in the final image. This corresponds to a 39.8% net decrease during the observed period. Furthermore, 22.0% of the shallow, valid pixels in the initial image were classified as coral compared to 13.3% in the final image. Figure 9 represents the mapping of posterior probabilities for each pixel belonging to the coral class for Baker Island Atoll beginning with 2002 (top) and the final class in 2014 (bottom). Figure 10 maps the CDBCTC change when the 2002 initial state classification map is compared to the 2014 final state classification map. Table 6 contains a summary of the change detection analysis for the Baker Island Atoll site.
3.3.4. Howland Island
Howland Island was the smallest area of interest analyzed. During the 14-years between the initial state image and final state image this area incurred the smallest decrease in coral of all sites analyzed. The initial scene was capture by Landsat 7 in 2001 and was found to contain 252 coral pixels (0.23 km2). The final state image was captured by Landsat 8 in 2015 and contained 188 coral pixels (0.17 km2). This represents a 25.4% decrease over the observed time period. 21.5% of the initial image was classified as CDBCTC while 16.0% of the final image was classified as coral. Figure 11 displays the posterior probabilities for each pixel belonging to the coral class for 2001 (top) and 2015 (bottom). Figure 12 maps the CDBCTC change when the 2001 initial state classification map is compared to the 2015 final state classification map. The results of the change detection analysis are detailed in Table 6.
3.3.5. Tabuaeran Island
Tabuaeran Island represented the largest site evaluated for coral change detection. The initial image of this site was captured in 2000 and the final image was captured in 2014. The 13-year observation period yielded a 35.2% reduction in CDBCTC within the area of interest. The initial state image contained 5089 coral pixels or 4.58 km2. The final state image contained 3298 coral pixels or 2.97 km2. While the area of interest for this site was somewhat large (94,731 pixels) the actual CDBCTC within the site was somewhat small. Within the initial image 5.4% of the area contained live CDBCTC while only 3.5% of the final image represented coral. The posterior probability maps for 2000 (top) and 2014 (bottom) are detailed in Figure 13. Figure 14 maps the CDBCTC change when the 2000 initial state classification map is compared to the 2014 final state classification map. The results of the temporal change detection analysis can be viewed in Table 6.
3.3.6. Kiritimati Island
The largest decrease in CDBCTC between the initial observation date and final observation date was observed in the Kiritimati Island location. In this location there was a net decrease in CDBCTC of 42.7% between the initial state image captured in 2002 and the final state image captured in 2014. The initial image contained 29,303 pixels with CDBCTC (26.37 km2) while the final image contained 16,804 pixels with CDBCTC (15.12 km2). Furthermore, CDBCTC covered 19.0% of the initial image and only 11.0% of the final image. This site was also the largest area of interest analyzed covering 153,408 valid, shallow water pixels. The posterior probability mapping for Kiritimati Island for 2002 (left) and 2014 (right) can be found in Figure 15. Figure 16 maps the CDBCTC change when the 2002 initial state classification map is compared to the 2014 final state classification map. Table 6 contains the results of the change detection analysis for Kiritimati Island.
4. Discussion
4.1. Methodology Benefits and Challenges
The methodology presented in this study revealed a significant decrease in CDBCTC of multiple coral reef sites in the Pacific Ocean. This was shown using change detection analysis as applied to six different locations comparing an initial state image to a final state image with a 12- to 14-year timespan between the two. The methodology leveraged a robust SVM classifier to evaluate each site. The benefit of the SVM classifier over other classifiers such as LDA, QDA, and regression with regularization (ℓ1 and ℓ2 penalty) is the ability for the algorithm to be trained even with limited data as well as the ability for the algorithm to efficiently generalize. These traits are a result of the model design. Specifically, the algorithm fits a maximal-margin hyperplane to separate the dependent feature classes. The exact placement of this hyperplane is based on the observations that are closest to the classifier decision boundary called the support vectors. The maximal-margin enables the trained model to efficiently generalize and the support vectors delineating the maximal-margin enables the model to be trained on a small amount of ground truth observations in a low dimensional feature space. As a result, the SVM model tends to generalize to new data more effectively than other classifiers. Table 7 summarizes the classification accuracy of several alternative learning algorithms.
The primary benefit of the approach proposed in this paper is the ability for a machine learning classifier trained on ground truth observations in several locations to generalize to additional locations. This capability was demonstrated through the CPCV process, which yielded up to 81% accuracy when tested against ground truth observations from a location that was withheld from the model training set. This is due to the reduction in site-specific bias such as local geomorphology, environmental condition, and unique coral fauna enabled by training based on ground truth data from multiple sites. Specifically, training based on a wider domain of ground truth observations which span multiple locations allows for a broader array of locations to be effectively represented. The implications of this is an expanded breadth of CDBCTC classification beyond isolated in-situ analysis. This is a powerful tool that should be leveraged to reduce the cost of monitoring the health of our coral reefs while expanding the coverage of coral reef monitoring. The natural evolution of in-situ change detection analysis to change detection analysis at scale will rely on the concept of generalizing a robust classifier longitudinally and the CPCV assessment as asserted in this research.
The primary challenge of the proposed method is that, while the classifier can generalize more effectively, its overall accuracy is lower than in-situ models. In-situ analysis based on Landsat data generally obtain accuracies of up to 80% or higher [85]. The robust, consolidated model developed in this research did not achieve as high of an accuracy. This is a natural result when the location-based bias of in-situ analysis are stripped away. Rather, the model can generalize more appropriately to additional sites as a direct result of averting biases such as local geomorphology and ecology. In-situ analyses incorporate this bias into the training of their predictors, and therefore yield higher accuracies but cannot generalize to new locations.
An additional challenge of the proposed method is that it relies upon medium resolution Landsat data. While the Landsat missions have proven to be an excellent data source for long-term temporal change analysis [30,31,32,33,34,35,36,37,38,39], the comparatively low resolution represents a challenge to accuracy benthic cover classification. The 30-m resolution of the Landsat platform means that highly heterogeneous environments such as coral reefs are difficult to classify due to the degree of within pixel mixing. Alternative higher resolution satellite platforms such as Sentinel-2 can be used to obtain benthic cover classification accuracies greater than studies based on Landsat images often showing as much as a 10% improvement [22]. In addition, new approaches based on high-resolution imagery show promising results. Most recently, research on object-based classification using high-resolution imagery from QuickBird and WorldView-2 have obtained classification accuracies over 90% [23]. However, it has been shown that these same methods deliver similar results to pixel based benthic cover classification when applied to medium resolution images such as those produced by the Landsat missions [28,29]. Furthermore, the deployment of high-resolution remote sensing platforms is constrained by the progression of technological advances. As a result, these high-resolution platforms are more a recent development compared to the rich history provided by Landsat and any long-term (>10 years) evaluation of CDBCTC change necessitates that the research be conducted using Landsat imagery. Similarly, the lack of a coastal aerosol band on missions prior to Landsat 8 is an unfortunate challenge given the water column penetrating properties of light in this channel.
4.2. Future Research
Future work is required to evaluate the extent to which the spectral signature of coral can generalize. As seen in this study, the accuracy of the classifier deteriorated as the distance between the primary training sites and test site grew. This was observed in the lower CPCV accuracies on the Howland Island and Baker Island Atoll test sites. The extent of this distance dependent deterioration in accuracy needs to be understood and a possible correction for this proposed. Furthermore, the breadth of this research can be expanded. If this work expands upon previous in-situ analysis, future work can expand on the results of this study by broadening the scope through measurement of more sites. In addition, research needs to be done to evaluate how well this method can generalize to reefs in different oceans across the world. Extending the method to such a degree will enable a large-scale global survey of CDBCTC and the associated change over time. Furthermore, on 6 January 2009 the Pacific Remote Islands Marine National Monument was established by the United States of America [101]. This is the largest fully protected marine area in the world and encompasses Palmyra Atoll, Kingman Reef, Baker Island Atoll, and Howland Island. A further analysis comparing these reefs before and after this event can identify the environmental impact of this governmental policy and inform future policy decisions.
5. Conclusions
This study measured the differences in CDBCTC areas between two points in time of six remote Pacific Island sites over the past 12 to 14 years. This was achieved by building a classifier for each of four locations (Palmyra Atoll, Kingman Reef, Baker Island Atoll, and Howland Island), applying the classifier to the initial state image (captured between 2000 and 2002) and final state image (captured between 2014 and 2015), then conducting a per-pixel change detection analysis. The SVM algorithm as applied to these four sites achieved a classification accuracy as high as 87.9% (Palmyra Atoll site). When applied to Kingman Reef, Baker Island Atoll, and Howland Island the model achieved accuracies of 85.7%, 69.23%, and 82.1% respectively. The results of the change detection analysis revealed an overall negative difference in CDBCTC between two points in time in these sites by as much as 38.8%. Within the Palmyra Atoll area of interest, a reduction in the CDBCTC area between 2001 and 2015 of 31.9% was observed. This represents a net reduction in CDBCTC of 6.91 km2 of coral. The Kingman Reef site and Howland Island sites incurred the least severe reduction in CDBCTC by percentage. However, these sites still incurred more than a 20% reduction in CDBCTC. Within Kingman Reef a reduction in CDBCTC of 25.3% was observed or 7.59 km2. Similarly, within the Howland Island site CDBCTC area decreased by 25.0% or 0.06 km2. CDBCTC coverage within the Baker Island Atoll area of interest decreasedby 39.8% or 0.17 km2. Further analysis was conducted of two additional sites, Tabuaeran Island and Kiritimati Island. These sites were analyzed by developing a SVM classifier using the combined observation data from all four sites. Because this consolidated model was trained using information drawn from multiple sites, it is more robust to site-specific biases that in-situ models rely on. This methodology was validated using a CPCV process of training a model using the combined ground truth data from three sites and applying it to the third. In this way, the CPCV assessment is an indication of how well the SVM classifier can generalize to data from new sites. The results of the CPCV assessment showed that the SVM classifier obtained an accuracy of 78.8% when tested against the Palmyra Atoll ground truth observations, 81.0% when tested against the Kingman Reef ground truth observations, 65.4% when tested against the Baker Island Atoll ground truth observations, and 67.9% when tested against the Howland Island ground truth observations. An SVM classifier was created using the consolidated ground truth data from all four sites and evaluated using cross-validation. The resulting algorithm correctly classified 75.3% across all ground truth observations across the four training sites. This consolidated classifier was then deployed to conduct a change detection analysis on the Tabuaeran Island and Kiritimati Island sites. The analysis revealed a 35.2% reduction in CDBCTC at Tabuaeran Island (1.61 km2) when the 2000 initial state image was compared to the 2014 final state image. Kiritimati Island incurred the largest reduction in CDBCTC coverage of all sites included in this study. In this location the analysis revealed a reduction in CDBCTC areas coverage of 11.25 km2 or 42.7%.
Author Contributions
J.J.G. developed the implementation, performed the analysis, and prepared written versions of the manuscript to the corresponding author for review. H.E.-A. led the research study and developed the idea and plan of work. He was involved throughout the entire process of data collection, study, manuscript authoring, and drafting. E.L. reviewed the implementation code, contributed technical input with respect to programming and data, and contributed to manuscript preparation. T.P. provided useful input and assisted with the logical flow of the manuscript. All authors read and approved the final manuscript.
Funding
This research received no additional funding.
Acknowledgments
The authors would like to acknowledge the use of the Samueli Laboratory in Computational Sciences in the Schmid College of Science and Technology, Chapman University, in data processing and analysis. Furthermore, the authors would like to acknowledge the support of Microsoft Corporation and Amgen Inc.
Conflicts of Interest
The authors declare no conflict of interest.
References
- Aronson, R.B.; Precht, W.F. White-Band Disease and the Changing Face of Caribbean Coral Reefs. Hydrobiologia 2001, 460, 25–38. [Google Scholar] [CrossRef]
- Glynn, P.W. Coral Reef Bleaching: Ecological Perspectives. Coral Reefs 1993, 12, 1–17. [Google Scholar] [CrossRef]
- McManus, J.W.; Reyes, R.B., Jr.; Nañola, C.L., Jr. Effects of Some Destructive Fishing Methods on Coral Cover and Potential Rates of Recovery. Environ. Manag. 1997, 21, 69–78. [Google Scholar] [CrossRef]
- Pennisi, E. Survey confirms coral reefs are in peril. Science 2002, 297, 1622b–1623b. [Google Scholar] [CrossRef] [PubMed]
- Burke, L.; Reytar, K.; Spalding, M.; Perry, A. Reefs at Risk Revisited; World Resources Institute: Washington, DC, USA, 2011; p. 114. [Google Scholar]
- Mora, C.A. A clear human footprint in the coral reefs of the Caribbean. Proc. R. Soc. Lond. B Biol. Sci. 2008, 275, 767–773. [Google Scholar] [CrossRef] [PubMed] [Green Version]
- Hoegh-Guldberg, O.; Mumby, J.P.; Hooten, J.A.; Steneck, S.R.; Greenfield, P.; Gomez, E. Coral reefs under rapid climate change and ocean acidification. Science 2007, 281, 1737–1742. [Google Scholar] [CrossRef] [PubMed]
- Pandolfi, J.M.; Bradbury, R.H.; Sala, E.; Hughes, T.P.; Bjorndal, K.A.; Cooke, R.G.; McArdle, D.; McClenachan, L.; Newman, M.J.H.; Paredes, G.; et al. Global trajectories of the long-term decline of coral reef ecosystems. Science 2003, 201, 955–958. [Google Scholar] [CrossRef]
- Hedley, J.C.; Roelfsema, I.; Chollett, A.; Harborne, S.; Heron, S.; Weeks, W.; Skirving, A.; Strong, C.; Eakin, T.; Christensen, V.; et al. Remote sensing of coral reefs for monitoring and management: A review. Remote Sens. 2016, 8, 118. [Google Scholar] [CrossRef]
- Atkinson, J.M.; Lucey, P.G.; Taylor, G.J.; Porter, J.; Dollar, S.; Andre, S. CRESPO: Coral Reef Ecosystem Spectro-Photometric Observatory, Concept Study Report to the University Earth System Science Program National Aeronautics and Space Administration; University of Hawaii: Honolulu, HI, USA, 2001. [Google Scholar]
- Hochberg, E.J.; Atkinson, M.J. Capabilities of Remote Sensors to Classify Coral, Algae, and Sand as Pure and Mixed Spectra. Remote Sens. Environ. 2003, 85, 174–189. [Google Scholar] [CrossRef]
- Kutser, T.; Dekker, A.G.; Skirving, W. Modeling Spectral Discrimination of Great Barrier Reef Benthic Communities by Remote Sensing Instruments. Limnol. Oceanogr. 2003, 48, 497–510. [Google Scholar] [CrossRef]
- Mumby, P.J.; Green, E.P.; Edwards, A.J.; Clark, C.D. The cost-effectiveness of remote sensing for tropical coastal resources assessment and management. J. Environ. Manag. 1999, 55, 157–166. [Google Scholar] [CrossRef]
- Yamano, H. Multispectral Applications. In Coral Reef Remote Sensing: A Guide for Multi-Level Sensing Mapping and Assessment; Goodman, J., Purkis, S., Phinn, S.R., Eds.; Springer: Berlin, Germany, 2013; pp. 51–78. [Google Scholar]
- Capolsini, P.; Andréfouët, S.; Rion, C.; Payri, C. A comparison of Landsat ETM+, SPOT HRV, IKONOS, ASTER, and airborne MASTER data for coral reef habitat mapping in South Pacific islands. Can. J. Remote Sens. 2007, 29, 187–200. [Google Scholar] [CrossRef]
- Kobryn, H.T.; Wouters, K.; Beckley, L.E.; Heege, T. Ningaloo reef: Shallow marine habitats mapped using a hyperspectral sensor. PLoS ONE 2013, 8, e70105. [Google Scholar] [CrossRef] [PubMed]
- Phinn, S.R.; Hochberg, E.; Roelfsema, C.M. Airborne photography, multispectral and hyperspectral remote sensing on coral reefs. In Coral Reef Remote Sensing; Goodman, J.A., Phinn, S.R., Purkis, S., Eds.; Springer: Berlin, Germany, 2013; pp. 3–25. [Google Scholar]
- Vanderstraete, T.; Goossens, R.; Ghabour, T.K. Coral Reef Habitat Mapping in The Red Sea (Hurghada, Egypt) Based on Remote Sensing. Earsel Eproc. 2004, 3, 191–207. [Google Scholar]
- El-Askary, H.; El-Mawla, S.H.A.; Li, J.; El-Hattab, M.M.; El-Raey, M. Change detection of coral reef habitat using Landsat-5 TM, Landsat 7 ETM+ and Landsat 8 OLI data in the Red Sea. Int. J. Remote Sens. 2014, 35, 2327–2346. [Google Scholar]
- Traganos, D.; Aggarwal, B.; Poursanidis, D.; Topouzelis, K.; Chrysoulakis, N.; Reinartz, P. Towards Global-Scale Seagrass Mapping and Monitoring Using Sentinel-2 on Google Earth Engine: The Case Study of the Aegean and Ionian Seas. Remote Sens. 2018, 10, 1227. [Google Scholar] [CrossRef]
- Traganos, D.; Poursanidis, D.; Aggarwal, B.; Chrysoulakis, N.; Reinartz, P. Estimating Satellite-Derived Bathymetry (SDB) with the Google Earth Engine and Sentinel-2. Remote Sens. 2018, 10, 859. [Google Scholar] [CrossRef]
- Hedley, J.D.; Roelfsema, C.; Brando, V.; Giardino, C.; Kutser, T.; Phinn, S.; Mumby, P.J.; Barrilero, O.; Laporte, J.; Koetz, B. Coral reef applications of Sentinel-2: Coverage, characteristics, bathymetry and benthic mapping with comparison to Landsat 8. Remote Sens. Environ. 2018, 216, 598–614. [Google Scholar] [CrossRef]
- Zhou, Z.; Ma, L.; Fu, T.; Zhang, G.; Yao, M.; Li, M. Change Detection in Coral Reef Environment Using High-Resolution Images: Comparison of Object-Based and Pixel-Based Paradigms. ISPRS Int. J. Geo-Inf. 2018, 7, 441. [Google Scholar] [CrossRef]
- Blaschke, T. Object based image analysis for remote sensing. ISPRS J. Photogramm. 2010, 65, 2–16. [Google Scholar] [CrossRef] [Green Version]
- Leon, J.; Woodroffe, C.D. Improving the synoptic mapping of coral reef geomorphology using object-based image analysis. Int. J. Geogr. Inf. Sci. 2011, 25, 949–969. [Google Scholar] [CrossRef]
- Phinn, S.R.; Roelfsema, C.M.; Mumby, P.J. Multi-scale, object-based image analysis for mapping geomorphic and ecological zones on coral reefs. Int. J. Remote Sens. 2012, 33, 3768–3797. [Google Scholar] [CrossRef]
- Roelfsema, C.; Phinn, S.; Jupiter, S.; Comley, J.; Albert, S. Mapping coral reefs at reef to reef-system scales, 10s–1000s km2, using object-based image analysis. Int. J. Remote Sens. 2013, 34, 6367–6388. [Google Scholar] [CrossRef]
- Dingle Robertson, L.; King, D.J. Comparison of pixel- and object-based classification in land cover change mapping. Int. J. Remote Sens. 2011, 32, 1505–1529. [Google Scholar] [CrossRef]
- Duro, D.C.; Franklin, S.E.; Dubé, M.G. A comparison of pixel-based and object-based image analysis with selected machine learning algorithms for the classification of agricultural landscapes using SPOT-5 HRG imagery. Remote Sens. Environ. 2012, 118, 259–272. [Google Scholar] [CrossRef]
- Pax-Lenney, M.; Woodcock, C.E.; Macomber, S.A.; Gopal, S.; Song, C. Forest mapping with a generalized classifier and Landsat TM data. Remote Sens. Environ. 2001, 77, 241–250. [Google Scholar] [CrossRef]
- Woodcock, C.E.; Macomber, S.A.; Pax-Lenney, M.; Cohen, W.B. Monitoring large areas for forest change using Landsat: Generalization across space, time and Landsat sensors. Remote Sens. Environ. 2001, 78, 194–203. [Google Scholar] [CrossRef] [Green Version]
- Quirein, J.A.; Trichel, M.C. Acreage estimation, feature selection, and signature extension dependent upon the maximum likelihood decision rule. In Proceedings of the Symposium on Machine Classification of Remotely Sensed Data, Purdue University, West Lafayette, IN, USA, 3–5 June 1975; pp. 26–39. Available online: www.lars.purdue.edu/home/references/sym_1975/1975_2A-26.pdf (accessed on 9 April 2019).
- Olthof, I.; Butson, C.; Fraser, R. Signature extension through space for northern landcover classification: A comparison of radiometric correction methods. Remote Sens. Environ. 2005, 95, 290–302. [Google Scholar] [CrossRef]
- Bauer, M.E.; Cipra, J.E.; Anuta, P.E.; Etheridge, J.B. Identification and area estimation of agricultural crops by computer classification of Landsat MSS data. Remote Sens. Environ. 1979, 8, 77–92. [Google Scholar] [CrossRef]
- Hall, F.G.; Strebel, D.E.; Nickeson, J.E.; Goetz, S.J. Radiometric rectification: Toward a common radiometric response among multidate, multisensor images. Remote Sens. Environ. 1991, 35, 11–27. [Google Scholar] [CrossRef]
- Pax-Lenney, M.; Woodcock, C.E. Monitoring agricultural lands in Egypt with multitemporal Landsat TM imagery: How many images are needed? Remote Sens. Environ. 1997, 59, 522–529. [Google Scholar] [CrossRef]
- Congalton, R.G.; Green, K. Assessing the Accuracy of Remotely Sensed Data: Principles and Practices; CRC/Lewis Press: Boca Raton, FL, USA, 1999; 137p. [Google Scholar]
- Langley, S.K.; Cheshire, H.M.; Humes, K.S. A comparison of single date and multitemporal satellite image classifications in a semi-arid grassland. J. Arid Environ. 2001, 49, 401–411. [Google Scholar] [CrossRef]
- Van Niel, T.G.; McVicar, T.R. Determining temporal windows for crop discrimination with remote sensing: A case study in south-eastern Australia. Comput. Electron. Agric. 2004, 45, 91–108. [Google Scholar] [CrossRef]
- Laborte, A.G.; Maunahan, A.A.; Hijmans, R.J. Spectral Signature Generalization and Expansion Can Improve the Accuracy of Satellite Image Classification. PLoS ONE 2010, 5, e10516. [Google Scholar] [CrossRef] [PubMed]
- Palandro, D.A.; Andréfouët, S.; Hu, C.; Hallock, P.; Muller-Karger, F.; Dustan, P.; Callahan, M.K.; Kranenburg, C.; Beaver, C.R. Quantification of two decades of shallow-water coral reef habitat decline in the Florida Keys National Marine Sanctuary using Landsat data (1984–2002). Remote Sens. Environ. 2008, 112, 3388–3399. [Google Scholar] [CrossRef]
- Knudby, A.; Newman, C.; Shaghude, Y.; Muhando, C. Simple and effective monitoring of historic changes in nearshore environments using the free archive of Landsat imagery. Int. J. Appl. Earth Obs. Geoinform. 2010, 12S, S116–S122. [Google Scholar] [CrossRef]
- Andréfouët, S.; Muller-Karger, F.E.; Hochberg, E.J.; Hu, C.; Carder, K.L. Change detection in shallow coral reef environments using Landsat 7/ETM+ data. Remote Sens. Environ. 2001, 78, 150–162. [Google Scholar] [CrossRef]
- Lyons, M.; Roelfsema, C.; Phinn, S. Towards understanding temporal and spatial dynamics of seagrass landscapes using time-series remote sensing. Estuar. Cloastal Shelf Sci. 2013, 120, 42–53. [Google Scholar] [CrossRef]
- Li, W.; El-Askary, H.; Qurban, M.; Li, J.; ManiKandan, K.; Piechota, T. Using multi-indices approach to quantify mangrave changes over the Western Arabian Gulf along Saudi Arabia coast. Ecol. Indic. 2019, 102, 734–745. [Google Scholar] [CrossRef]
- Wang, Z.; Yao, W.; Tang, Q.; Liu, L.; Xiao, P.; Kong, X.; Zhang, P.; Shi, F.; Wang, Y. Continuous Change Detection of Forest/Grassland and Cropland in the Loess Plateau of China Using All Available Landsat Data. Remote Sens. 2018, 10, 1775. [Google Scholar] [CrossRef]
- Spalding, M.D.; Brown, B.E. Warm-water coral reefs and climate change. Science 2015, 350, 769–771. [Google Scholar] [CrossRef] [PubMed]
- Baker, A.C.; Glynn, P.W.; Riegl, B. Climate change and coral reef bleaching: An ecological assessment of long-term impacts, recovery trends and future outlook. Estuar. Coast. Shelf Sci. 2008, 80, 435–471. [Google Scholar] [CrossRef]
- Hughes, T.P.; Kerry, J.T.; Alvarez-Noriega, M.; Alvarez-Romero, J.G.; Anderson, K.D.; Baird, A.H.; Babcock, R.C.; Beger, M.; Bellwood, D.R.; Berkelmans, R.; et al. Global warming and recurrent mass bleaching of corals. Nature 2017, 543, 373–377. [Google Scholar] [CrossRef] [PubMed]
- Hughes, T.P.; Anderson, K.D.; Connolly, S.R.; Heron, S.F.; Kerry, J.T.; Lough, J.M.; Baird, A.H.; Baum, J.K.; Berumen, M.L.; Bridge, T.C.; et al. Spatial and temporal patterns of mass bleaching of corals in the Anthropocene. Science 2018, 359, 80–83. [Google Scholar] [CrossRef] [PubMed] [Green Version]
- Pandolfi, J.M.; Connolly, S.R.; Marshall, D.J.; Cohen, A.L. Projecting coral reef futures under global warming and ocean acidification. Science 2011, 333, 418–422. [Google Scholar] [CrossRef] [PubMed]
- Coral Reef Ecosystem Program; Pacific Islands Fisheries Science Center. National Coral Reef Monitoring Program: Benthic Cover Derived from Analysis of Benthic Images Collected during Stratified Random Surveys (StRS) across the Pacific Remote Island Areas since 2014. NOAA’s National Center for Environmental Information, 2016. Available online: https://inport.nmfs.noaa.gov/inport/item/36157 (accessed on 15 May 2018).
- Pacific Island Benthic Habitat Mapping Center. Palmyra Atoll. NOAA’s National Center for Environmental Information, 2018. Available online: http://www.soest.hawaii.edu/pibhmc/cms/ (accessed on 12 May 2018).
- Landsat Project Science Office, Landsat 7 (L7) Data Users Handbook Updated: June 2018. Available online: https://www.usgs.gov/media/files/landsat-7-data-users-handbook (accessed on 15 January 2019).
- Landsat Project Science Office, Landsat 8 (L8) Data Users Handbook Updated: October 2018. Available online: https://www.usgs.gov/media/files/landsat-8-data-users-handbook (accessed on 15 January 2019).
- Landsat Data Continuity Mission Underfly with Landsat 7. USGS. Available online: https://www.usgs.gov/land-resources/nli/landsat/landsat-data-continuity-mission-underfly-landsat-7 (accessed on 15 April 2019).
- Roy, D.P.; Wulder, M.; Loveland, T.; Woodcock, C.; Allen, R.; Anderson, M.; Zhu, Z. Landsat-8: Science and product vision for terrestrial global change research. Remote Sens. Environ. 2014, 145, 154–172. [Google Scholar] [CrossRef] [Green Version]
- Magel, J.; Burns, J.; Gates, R.; Baum, J. Effects of bleaching-associated mass coral mortality on reef structural complexity across a gradient of local disturbances. Sci. Rep. 2019. [Google Scholar] [CrossRef]
- NOAA Rapid Ecological Assessment (REA) Survey Methodology: #3 Benthic Habitat Surveys Coral Reef Ecosystem Program (CREP). Available online: https://www.pifsc.noaa.gov/cred/survey_methods/fish_surveys/spc_benthic_method_training_2016_final_draft.pdf accessed (accessed on 7 April 2018).
- Heenan, A.; Williams, I.D.; Acoba, T.; DesRochers, A.; Kosaki, R.K.; Kanemura, T.; Nadon, M.O.; Brainard, R.E. Long-term monitoring of coral reef fish assemblages in the Western central pacific. Sci. Data 2017, 4, 170176. [Google Scholar] [CrossRef] [Green Version]
- Beijbom, O.; Edmunds, P.J.; Kline, D.I.; Mitchell, G.B.; Kriegman, D. Automated Annotation of Coral Reef Survey Images. In Proceedings of the IEEE Conference on Computer Vision and Pattern Recognition (CVPR), Providence, RI, USA, 16–21 June 2012. [Google Scholar]
- Beijbom, O.; Edmunds, P.J.; Roelfsema, C.; Smith, J.; Kline, D.I.; Neal, B.; Dunlap, M.J.; Moriarty, V.; Fan, T.-Y.; Tan, C.-J.; et al. Towards automated annotation of benthic survey images: variability of human experts and operational modes of automation. PLoS ONE 2015, 10, e0130312. [Google Scholar] [CrossRef]
- McCoy, K.; Williams, I.; Heenan, A. A Comparison of Rapid Visual Assessments and Photo-Quadrat Analyses to Monitor Coral Reef Habitats. NOAA Pac. Isl. Fish. Sci. Cent. PIFSC Data Rep. 2015, DR-150-11. [Google Scholar] [CrossRef]
- Palmyra Atoll National Wildlife Refuge. Ramsar Site Information Services. 2018. Available online: https://www.fws.gov/refuge/Palmyra_Atoll/ (accessed on 15 May 2018).
- Office of Insular Affairs, Department of the Interior. Kingman Reef; Office of Insular Affairs, Department of the Interior: Washington, DC, USA, 2009.
- Pacific Remote Islands National Wildlife Refuge Complex. Baker Island National Wildlife Refuge: Draft Comprehensive Conservation Plan and Environmental Assessment; Pacific Remote Islands National Wildlife Refuge Complex: Washington, DC, USA, 2007. [Google Scholar]
- Maragos, J.; Miller, J.; Gove, J.; Mundy, B.; Friedlander, A.M.; Godwin, S.; Musburger, C.; Timmers, M.; Tsuda, R.; Vroom, P.; et al. US coral reefs in the Line and Phoenix Islands, central Pacific Ocean: History, geology, oceanography and biology. In Coral Reefs of the USA Coral Reefs of the World 1; Riegl, B.M., Dodge, R.E., Eds.; Springer: New York, NY, USA, 2008; pp. 595–641. [Google Scholar]
- Miller, J.; Maragos, J.; Brainard, R.; Vroom, P.S.; Godwin, S.; Hoeke, R.K.; Aeby, G.S.; Moffitt, R.; Lammers, M.; Gove, J.; et al. The state of Coral Reef Ecosystems of the Pacific Remote Island Areas. In The State of Coral Reef Ecosystems of the United States and Pacific Freely Associated States; Waddell, J.E., Clarke, A.M., Eds.; NOAA Technical Memorandum NOS; NCCOS: Silver Spring, MD, USA; pp. 353–386.
- Pacific Remote Islands National Wildlife Refuge Complex. Howland Island National Wildlife Refuge: Draft Comprehensive Conservation Plan and Environmental Assessment; Pacific Remote Islands National Wildlife Refuge Complex: Washington, DC, USA, 2007. [Google Scholar]
- Tabuaeran. Office of Te Beretitent—Republic of Kiribati Island Report Series. 2012. Available online: http://www.climate.gov.ki/wp-content/uploads/2013/01/21_TABUAERAN-revised-2012.pdf (accessed on 27 January 2019).
- Gallagher, B.; Shimada, K.; Gonzalez, F.; Stroup, E. Tides and Currents in Fanning Atoll Lagoon. Pac. Sci. 1971, 25, 191–205. [Google Scholar]
- Maragos, J. Reef Corals of Fanning Island. Pac. Sci. 1974, 28, 247–255. [Google Scholar]
- Kiritimati. Office of Te Beretitent—Republic of Kiribati Island Report Series 2012. Available online: http://www.climate.gov.ki/wp-content/uploads/2013/01/20_KIRITIMATI-revised-2012.pdf (accessed on 27 January 2019).
- Lovell, E.; Kirata, T.; Tekinaiti, T. Status Report for Kiribati’s Coral Reefs; Centre IRD de Nouméa: Nouméa, New Caledonia, 2002. [Google Scholar]
- Report on the Kiribati 2010 Census of Population and Housing Vol 1. Basic Information and Tables; National Statistics Office Ministry of Finance and Economic Planning: Bairiki, Tarawa, 2010.
- Anderson, A.; Wallin, P.; Martinsson-Wallin, H.; Fankhauser, B.; Hope, G. Towards a First Prehistory of Kiritimati (Christmas) Island, Republic of Kiribati. J. Polyn. Soc. 2000, 109, 273–294. [Google Scholar]
- Matsunaga, T.; Hoyano, A.; Mizukami, Y. Monitoring of Coral Reefs on Ishigaki Island in Japan Using Multitemporal Remote Sensing Data. Hyperspectral Remote Sens. Ocean 2001, 4154, 212–222. [Google Scholar] [CrossRef]
- Edwards, A. Applications of Satellite and Airborne Image Data to Coastal Management; UNESCO: Paris, France, 1999. [Google Scholar]
- Maritorena, S. Remote Sensing of the Water Attenuation in Coral Reefs: A Case Study in French Polynesia. Int. J. Remote Sens. 1996, 17, 155–166. [Google Scholar] [CrossRef]
- Roy, D.P.; Borak, J.S.; Devadiga, S.; Wolfe, R.E.; Zheng, M.; Descloitres, J. The MODIS Land product quality assessment approach. Remote Sens. Environ. 2002, 83, 62–76. [Google Scholar] [CrossRef]
- Ackerman, S.A.; Strabala, K.I.; Menzel, W.P.; Frey, R.A.; Moeller, C.C.; Gumley, L.E. Discriminating clear sky from clouds with MODIS. J. Geophys. Res. 1998, 103, 32141–32157. [Google Scholar] [CrossRef]
- Manavalan, P.; Sathyanath, P.; Rajegowda, G.L. Digital image analysis techniques to estimate waterspreadfor capacity evaluations of reservoirs. Photogramm. Eng. Remote Sens. 1993, 59, 1389–1395. [Google Scholar]
- Gitelson, A.A.; Ya Kondratyev, K. Optical models of mesotrophic and eutrophic water bodies. Int. J. Remote Sens. 1991, 12, 373–385. [Google Scholar] [CrossRef]
- Chavez, P.S., Jr. Image-Based Atmospheric Corrections—Revisited and Improved. Photogramm. Eng. Remote Sens. 1996, 62, 1025–1036. [Google Scholar]
- Green, E.P.; Mumby, P.J.; Edwards, A.J.; Clark, C.D. Remote Sensing Handbook for Tropical Coastal Management; Edwards, A.J., Ed.; UNESCO: Paris, France, 2000. [Google Scholar]
- Tassan, S. Modified Lyzenga’s method for macroalgae detection in water with non-uniform composition. Int. J. Remote Sens. 1996, 17, 1601–1607. [Google Scholar] [CrossRef]
- Gordon, H.R.; Morel, A. Remote Assessment of Ocean Color for Interpretation of Satellite Visible Imagery; Springer: New York, NY, USA, 1983. [Google Scholar]
- Chavez, P.S., Jr. An improved dark-object subtraction technique for atmospheric scattering correction for multispectral data. Remote Sens. Environ. 1988, 24, 459–479. [Google Scholar] [CrossRef]
- Armstrong, R.A. Remote sensing of submerged vegetation canopies for biomass estimation. Int. J. Remote Sens. 1993, 14, 621–627. [Google Scholar] [CrossRef]
- Lyzenga, D. Remote Sensing of Bottom Reflectance and Water Attenuation Parameters in Shallow Water Using Aircraft and Landsat Data. Int. J. Remote Sens. 1981, 2, 71–82. [Google Scholar] [CrossRef]
- Lyzenga, D. Passive remote sensing techniques for mapping water depth and bottom features. Appl. Opt. 1978, 17, 379–383. [Google Scholar] [CrossRef] [PubMed]
- Paredes, J.M.; Spero, R.E. Water depth mapping from passive remote sensing data under a generalized ratio assumption. Appl. Opt. 1983, 22, 1134–1135. [Google Scholar] [CrossRef] [PubMed]
- Green, E.P.; Mumby, P.J.; Edwards, A.J.; Clark, C.D. A review of remote sensing for the assessment and management of tropical costal resources. Coast. Manag. 1996, 24, 1–40. [Google Scholar] [CrossRef]
- Gould, R.W.; Arnone, R.A., Jr.; Sydor, M. Absorption, Scattering, and Remote Sensing Reflectance Relationships in Coastal Waters: Testing a New Inversion Algorithm. J. Costal Res. 2001, 17, 328–341. [Google Scholar]
- Meyer, D.; Dimitriadou, E.; Hornik, K.; Weingessel, A.; Leisch, F. e1071: Misc Functions of the Department of Statistics, Probability Theory Group (Formerly: E1071), TU Wien. Package Version 1.7-1. 2019. Available online: https://github.com/cran/e1071/blob/master/R/svm.R (accessed on 31 March 2019).
- Gapper, J.; El-Askary, H.; Linstead, E.; Piechota, T. Evaluation of Spatial Generalization Characteristics of a Robust Classifier as Applied to Coral Reef Habitats in Remote Islands of the Pacific Ocean. Remote Sens. 2018, 10, 1774. [Google Scholar] [CrossRef]
- Core Team R: A Language and Environment for Statistical Computing. R Foundation for Statistical Computing: Vienna, Austria, 2016. Available online: https://www.R-project.org/ (accessed on 15 May 2018).
- Hastie, T.; Tibshirani, R.; Friedman, J. The Elements of Statistical Learning: Data Mining, Inference and Prediction, 2nd ed.; Springer: New York, NY, USA, 2009; pp. 106–111. [Google Scholar]
- James, G.; Witten, D.; Hastie, T.; Tibshirani, R. An Introduction to Statistical Learning with Applications in R, 1st ed.; Springer: New York, NY, USA, 2013; pp. 337–366. [Google Scholar]
- Provost, F.; Fawcett, T. Data Science for Business What You Need to Know About Data Mining and Data-Analytic Thinking, 1st ed.; O’Reilly: Sebastopol, CA, USA, 2013; pp. 219–222. [Google Scholar]
- Presidential Proclamation 8336: Establishment of the Pacific Remote Islands Marine National Monument. Weekly Comp. Pres. Docs. 12 January 2009. Available online: www.presidentialdocuments.gov (accessed on 4 April 2019).
Figure 1.
The relative location of each of the six sites (1) Palmyra Atoll, (2) Kingman Reef, (3) Baker Island Atoll, (4) Howland Island, (5) Tabuaeran Island, and (6) Kiritimati Island.
Figure 1.
The relative location of each of the six sites (1) Palmyra Atoll, (2) Kingman Reef, (3) Baker Island Atoll, (4) Howland Island, (5) Tabuaeran Island, and (6) Kiritimati Island.

Figure 2.
Support vector machine (SVM) classifier training and change analysis process flow for Palmyra Atoll, Kingman Reef, Baker Island Atoll, and Howland Island.
Figure 2.
Support vector machine (SVM) classifier training and change analysis process flow for Palmyra Atoll, Kingman Reef, Baker Island Atoll, and Howland Island.

Figure 3.
Robust SVM Classifier training and change analysis process flow for Tabuaeran Island and Kiritimati Island.
Figure 3.
Robust SVM Classifier training and change analysis process flow for Tabuaeran Island and Kiritimati Island.

Figure 4.
Performance evaluation of the combined classifier using Receiver Operating Characteristic (ROC) Curve and Area Under Curve (AUC = 0.778).
Figure 4.
Performance evaluation of the combined classifier using Receiver Operating Characteristic (ROC) Curve and Area Under Curve (AUC = 0.778).

Figure 5.
Posterior probability map for the Palmyra Atoll area of interest (top, 2001 and bottom, 2015).
Figure 5.
Posterior probability map for the Palmyra Atoll area of interest (top, 2001 and bottom, 2015).

Figure 6.
Difference in predicted class membership map for the Palmyra Atoll area of interest for 2001 initial state compared to 2015 final state.
Figure 6.
Difference in predicted class membership map for the Palmyra Atoll area of interest for 2001 initial state compared to 2015 final state.

Figure 7.
Posterior probability map for the Kingman Reef area of interest (top, 2001 and bottom, 2015).
Figure 7.
Posterior probability map for the Kingman Reef area of interest (top, 2001 and bottom, 2015).

Figure 8.
Difference in predicted class membership map for the Kingman Reef area of interest for 2001 initial state compared to 2015 final state.
Figure 8.
Difference in predicted class membership map for the Kingman Reef area of interest for 2001 initial state compared to 2015 final state.

Figure 9.
Posterior probability map for the Baker Island Atoll area of interest (top, 2002 and bottom, 2014).
Figure 9.
Posterior probability map for the Baker Island Atoll area of interest (top, 2002 and bottom, 2014).

Figure 10.
Difference in predicted class membership map for the Palmyra Atoll area of interest for 2002 initial state compared to 2014 final state.
Figure 10.
Difference in predicted class membership map for the Palmyra Atoll area of interest for 2002 initial state compared to 2014 final state.

Figure 11.
Posterior probability map for the Howland Island area of interest (top, 2001 and bottom, 2015).
Figure 11.
Posterior probability map for the Howland Island area of interest (top, 2001 and bottom, 2015).

Figure 12.
Difference in predicted class membership map for the Howland Island area of interest for 2001 initial state compared to 2015 final state.
Figure 12.
Difference in predicted class membership map for the Howland Island area of interest for 2001 initial state compared to 2015 final state.

Figure 13.
Posterior probability map for the Tabuaeran Island area of interest (top, 2000 and bottom, 2014).
Figure 13.
Posterior probability map for the Tabuaeran Island area of interest (top, 2000 and bottom, 2014).

Figure 14.
Difference in predicted class membership map for the Tabuaeran Island area of interest for 2000 initial state compared to 2014 final state.
Figure 14.
Difference in predicted class membership map for the Tabuaeran Island area of interest for 2000 initial state compared to 2014 final state.

Figure 15.
Posterior probability map for the Kiritimati Island area of interest (left, 2002 and right, 2014).
Figure 15.
Posterior probability map for the Kiritimati Island area of interest (left, 2002 and right, 2014).

Figure 16.
Difference in predicted class membership map for the Kiritimati Island area of interest for 2002 initial state compared to 2014 final state.
Figure 16.
Difference in predicted class membership map for the Kiritimati Island area of interest for 2002 initial state compared to 2014 final state.


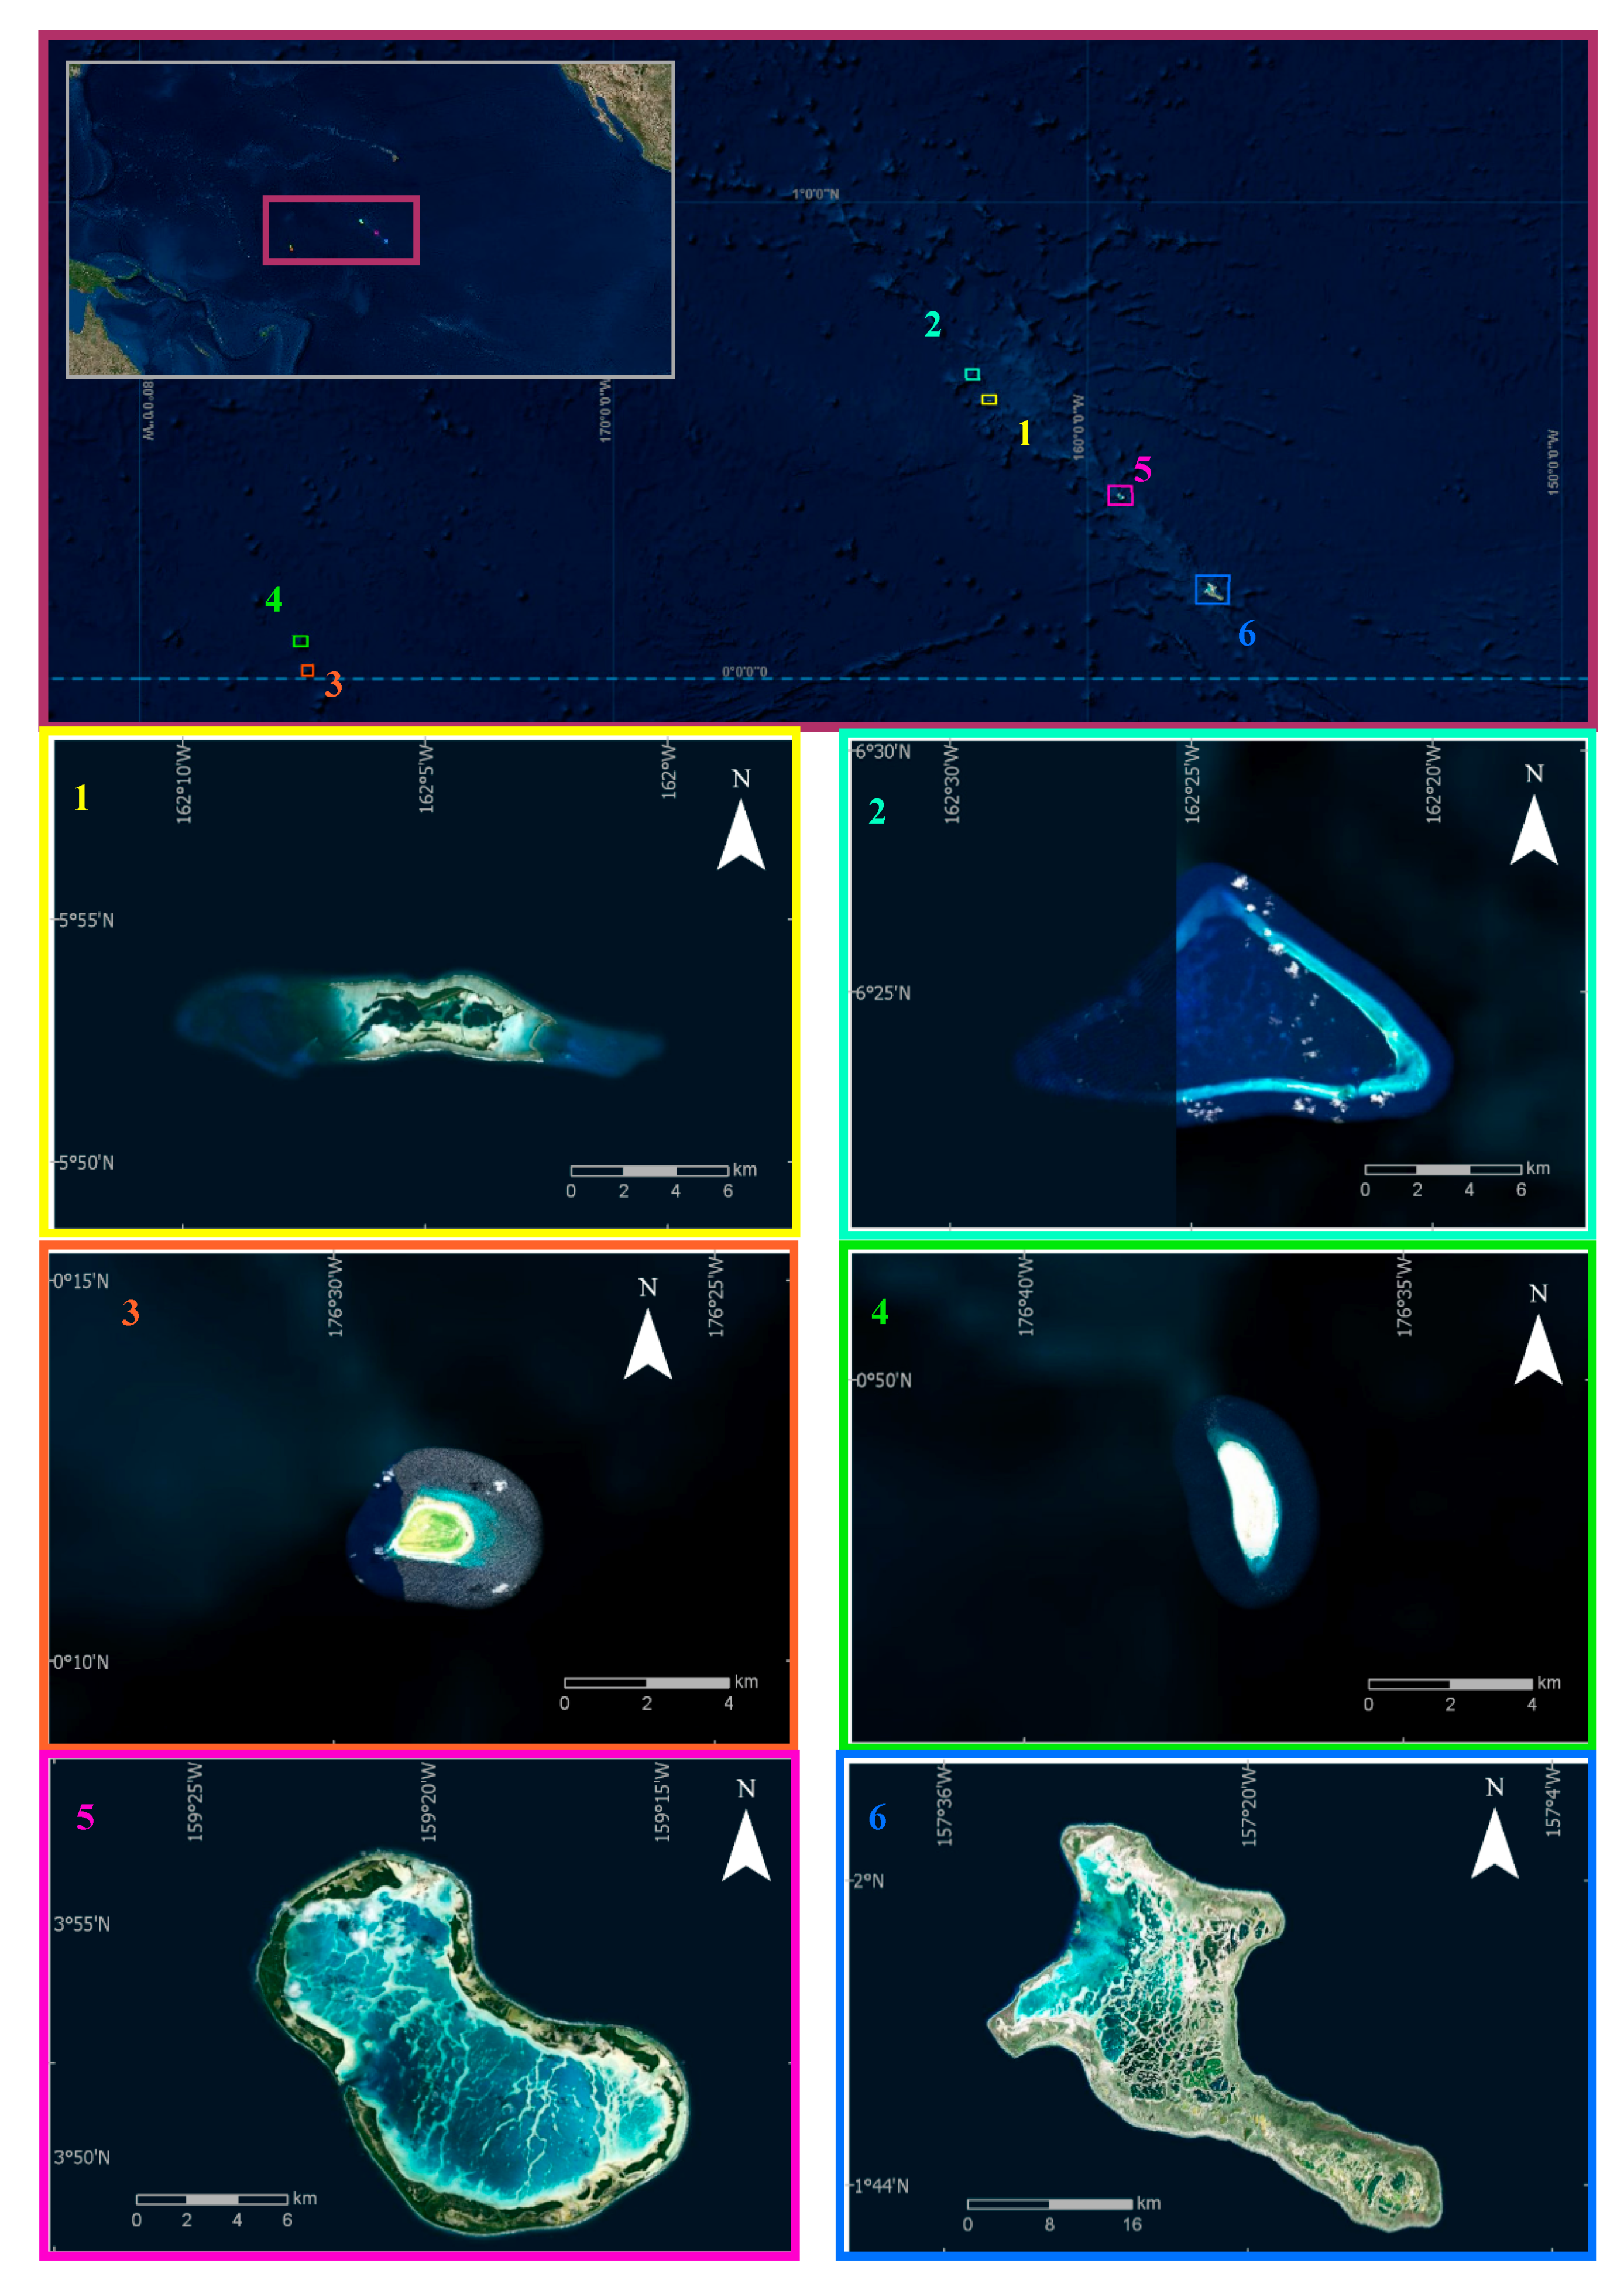
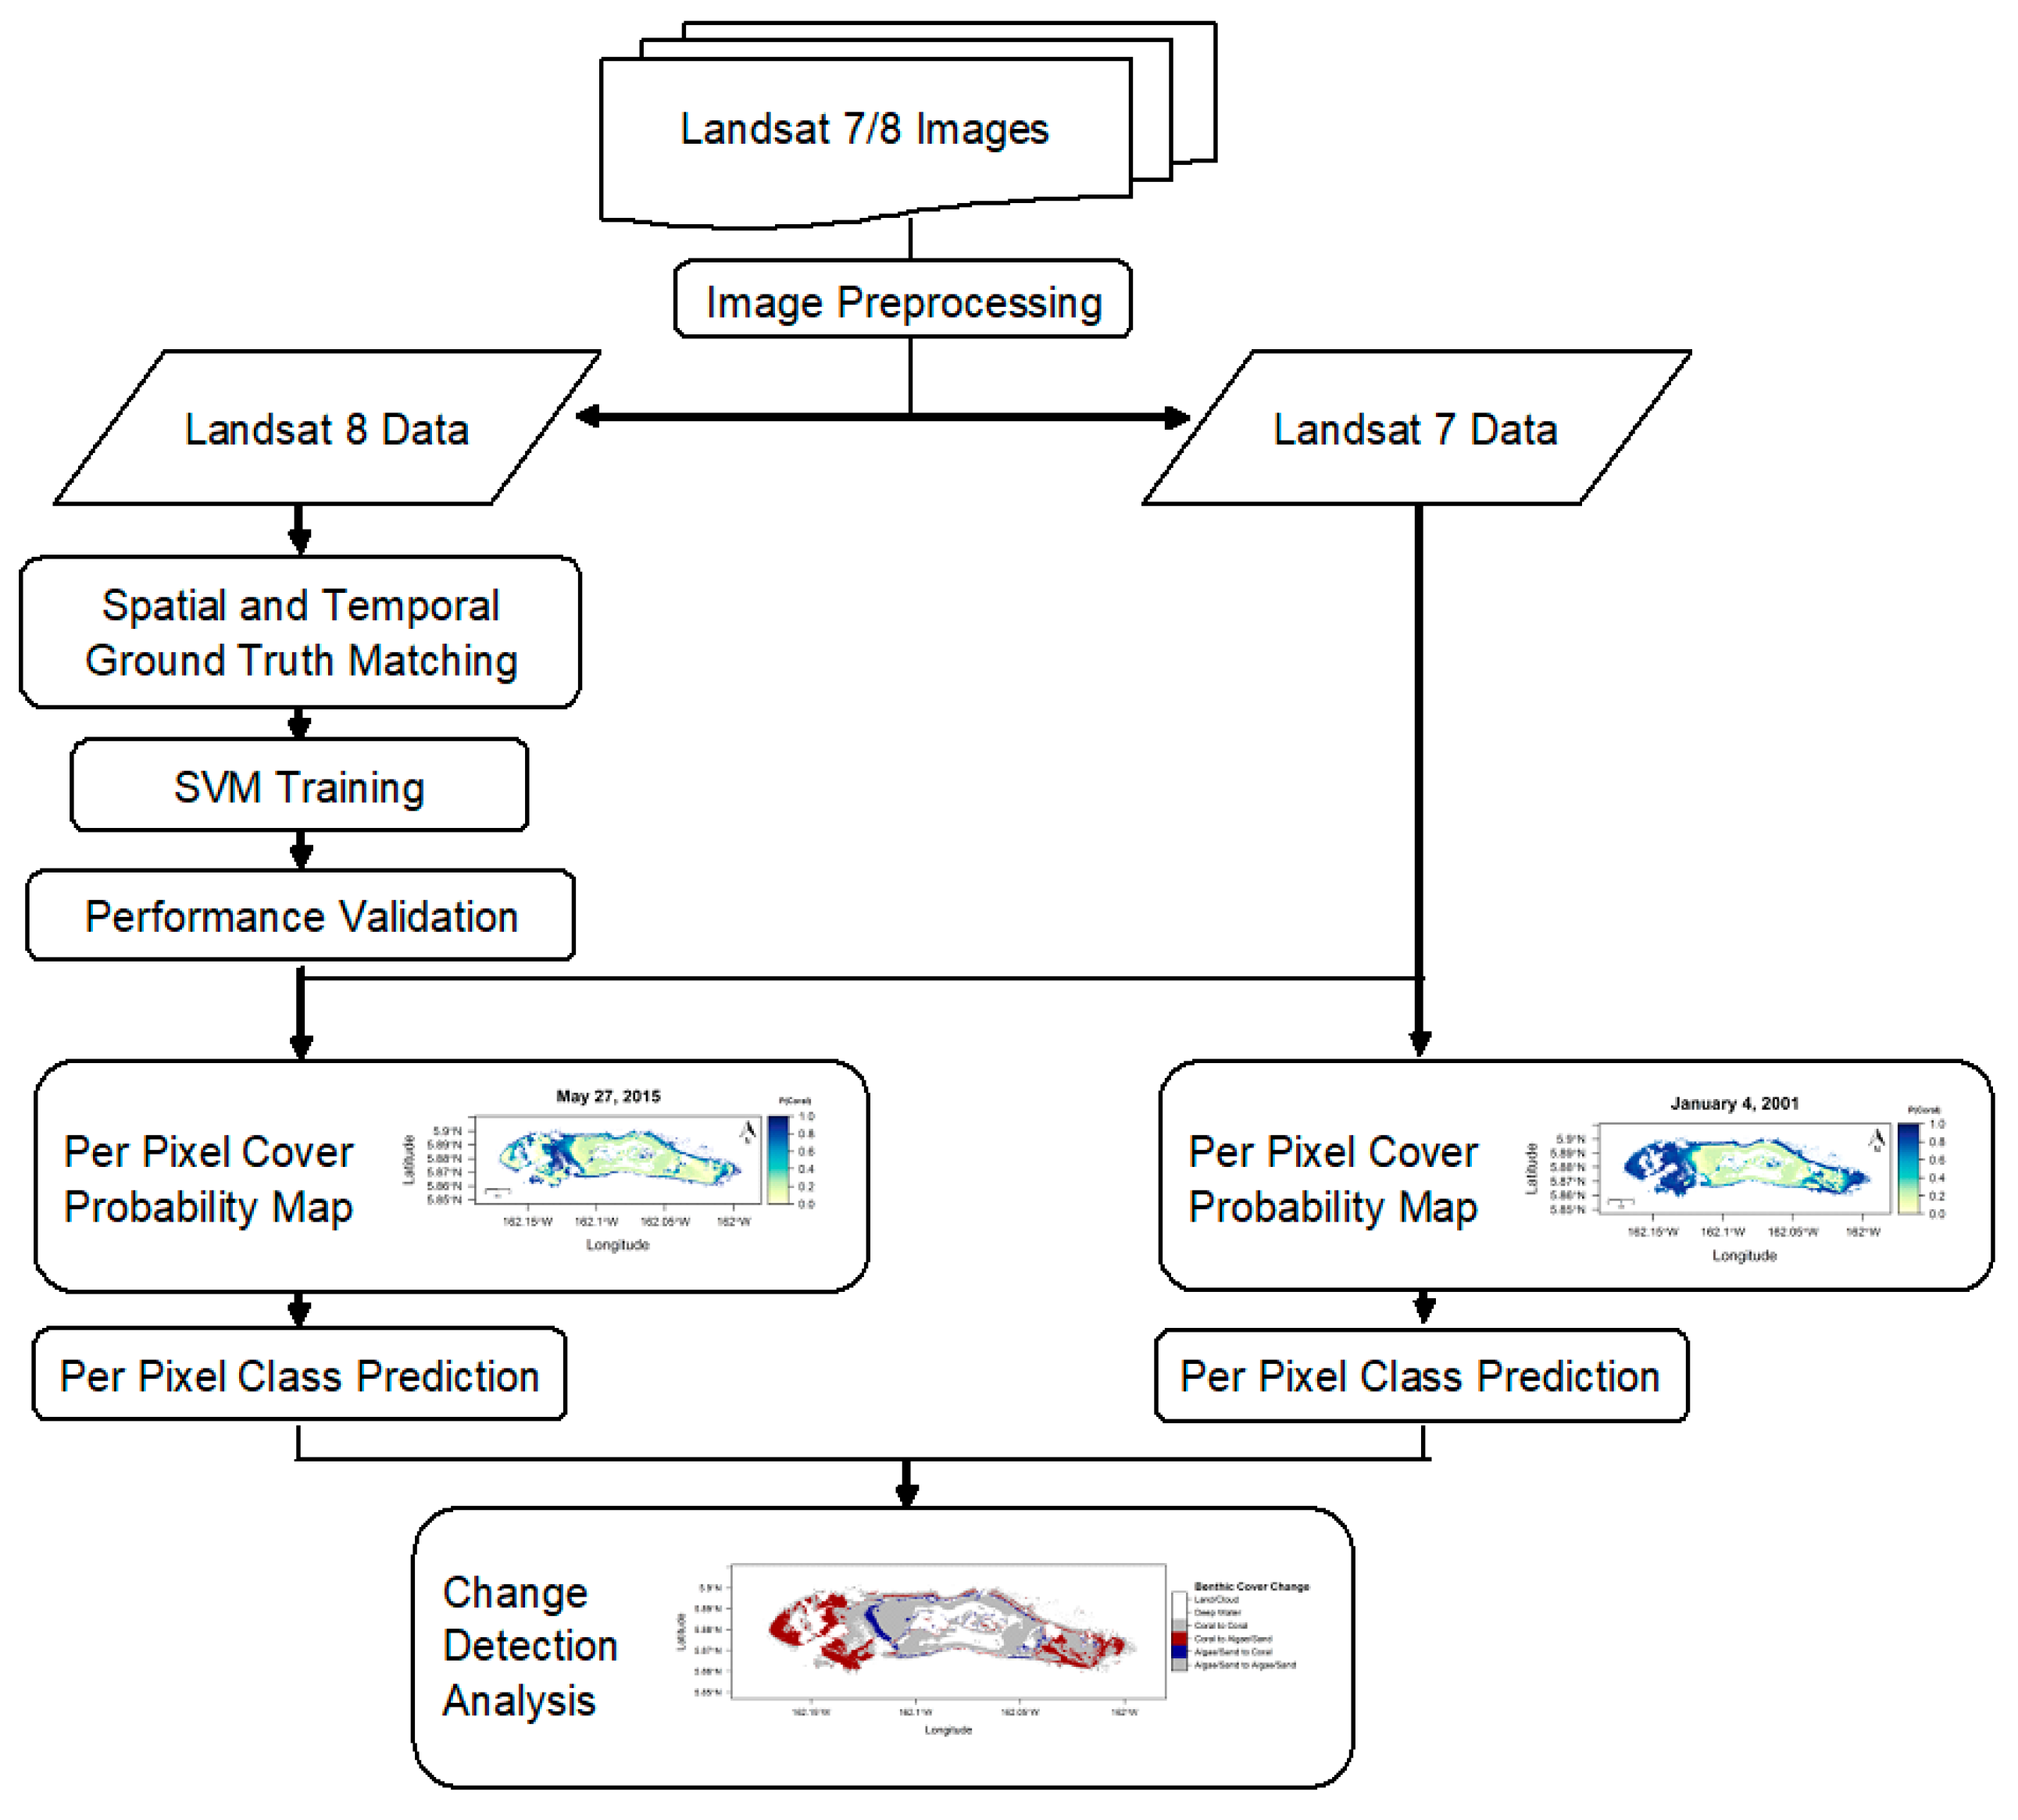
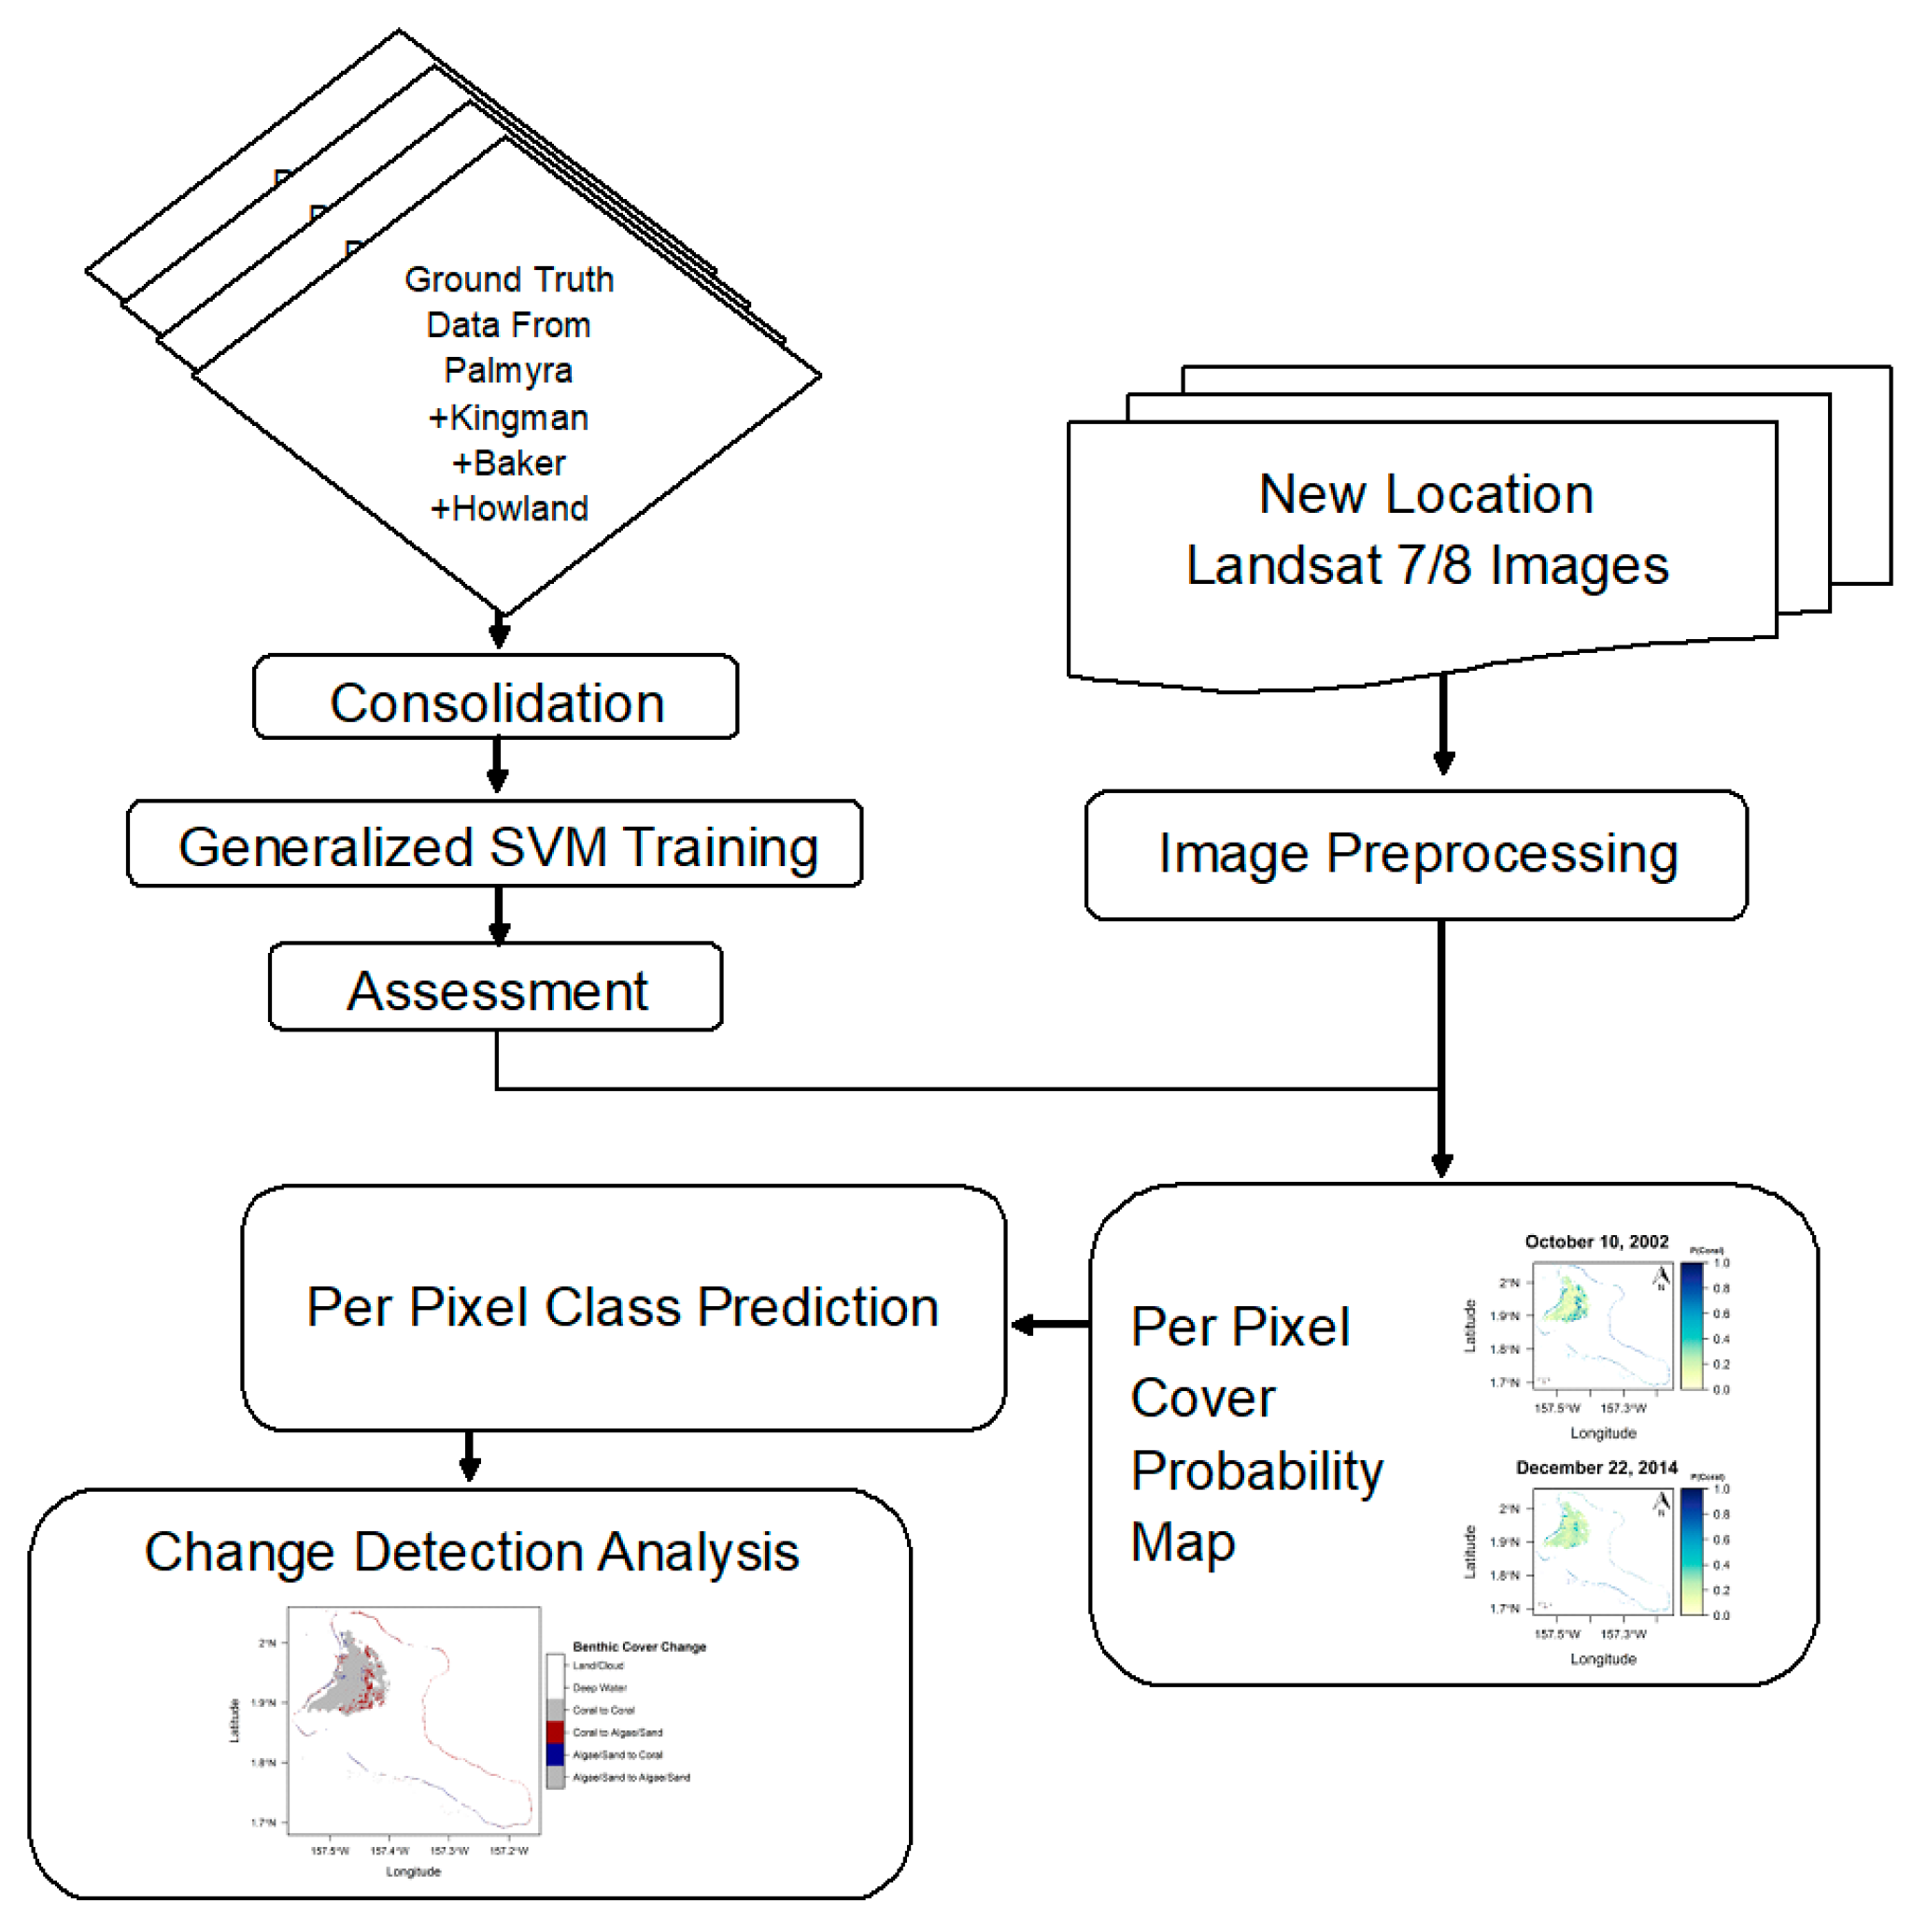
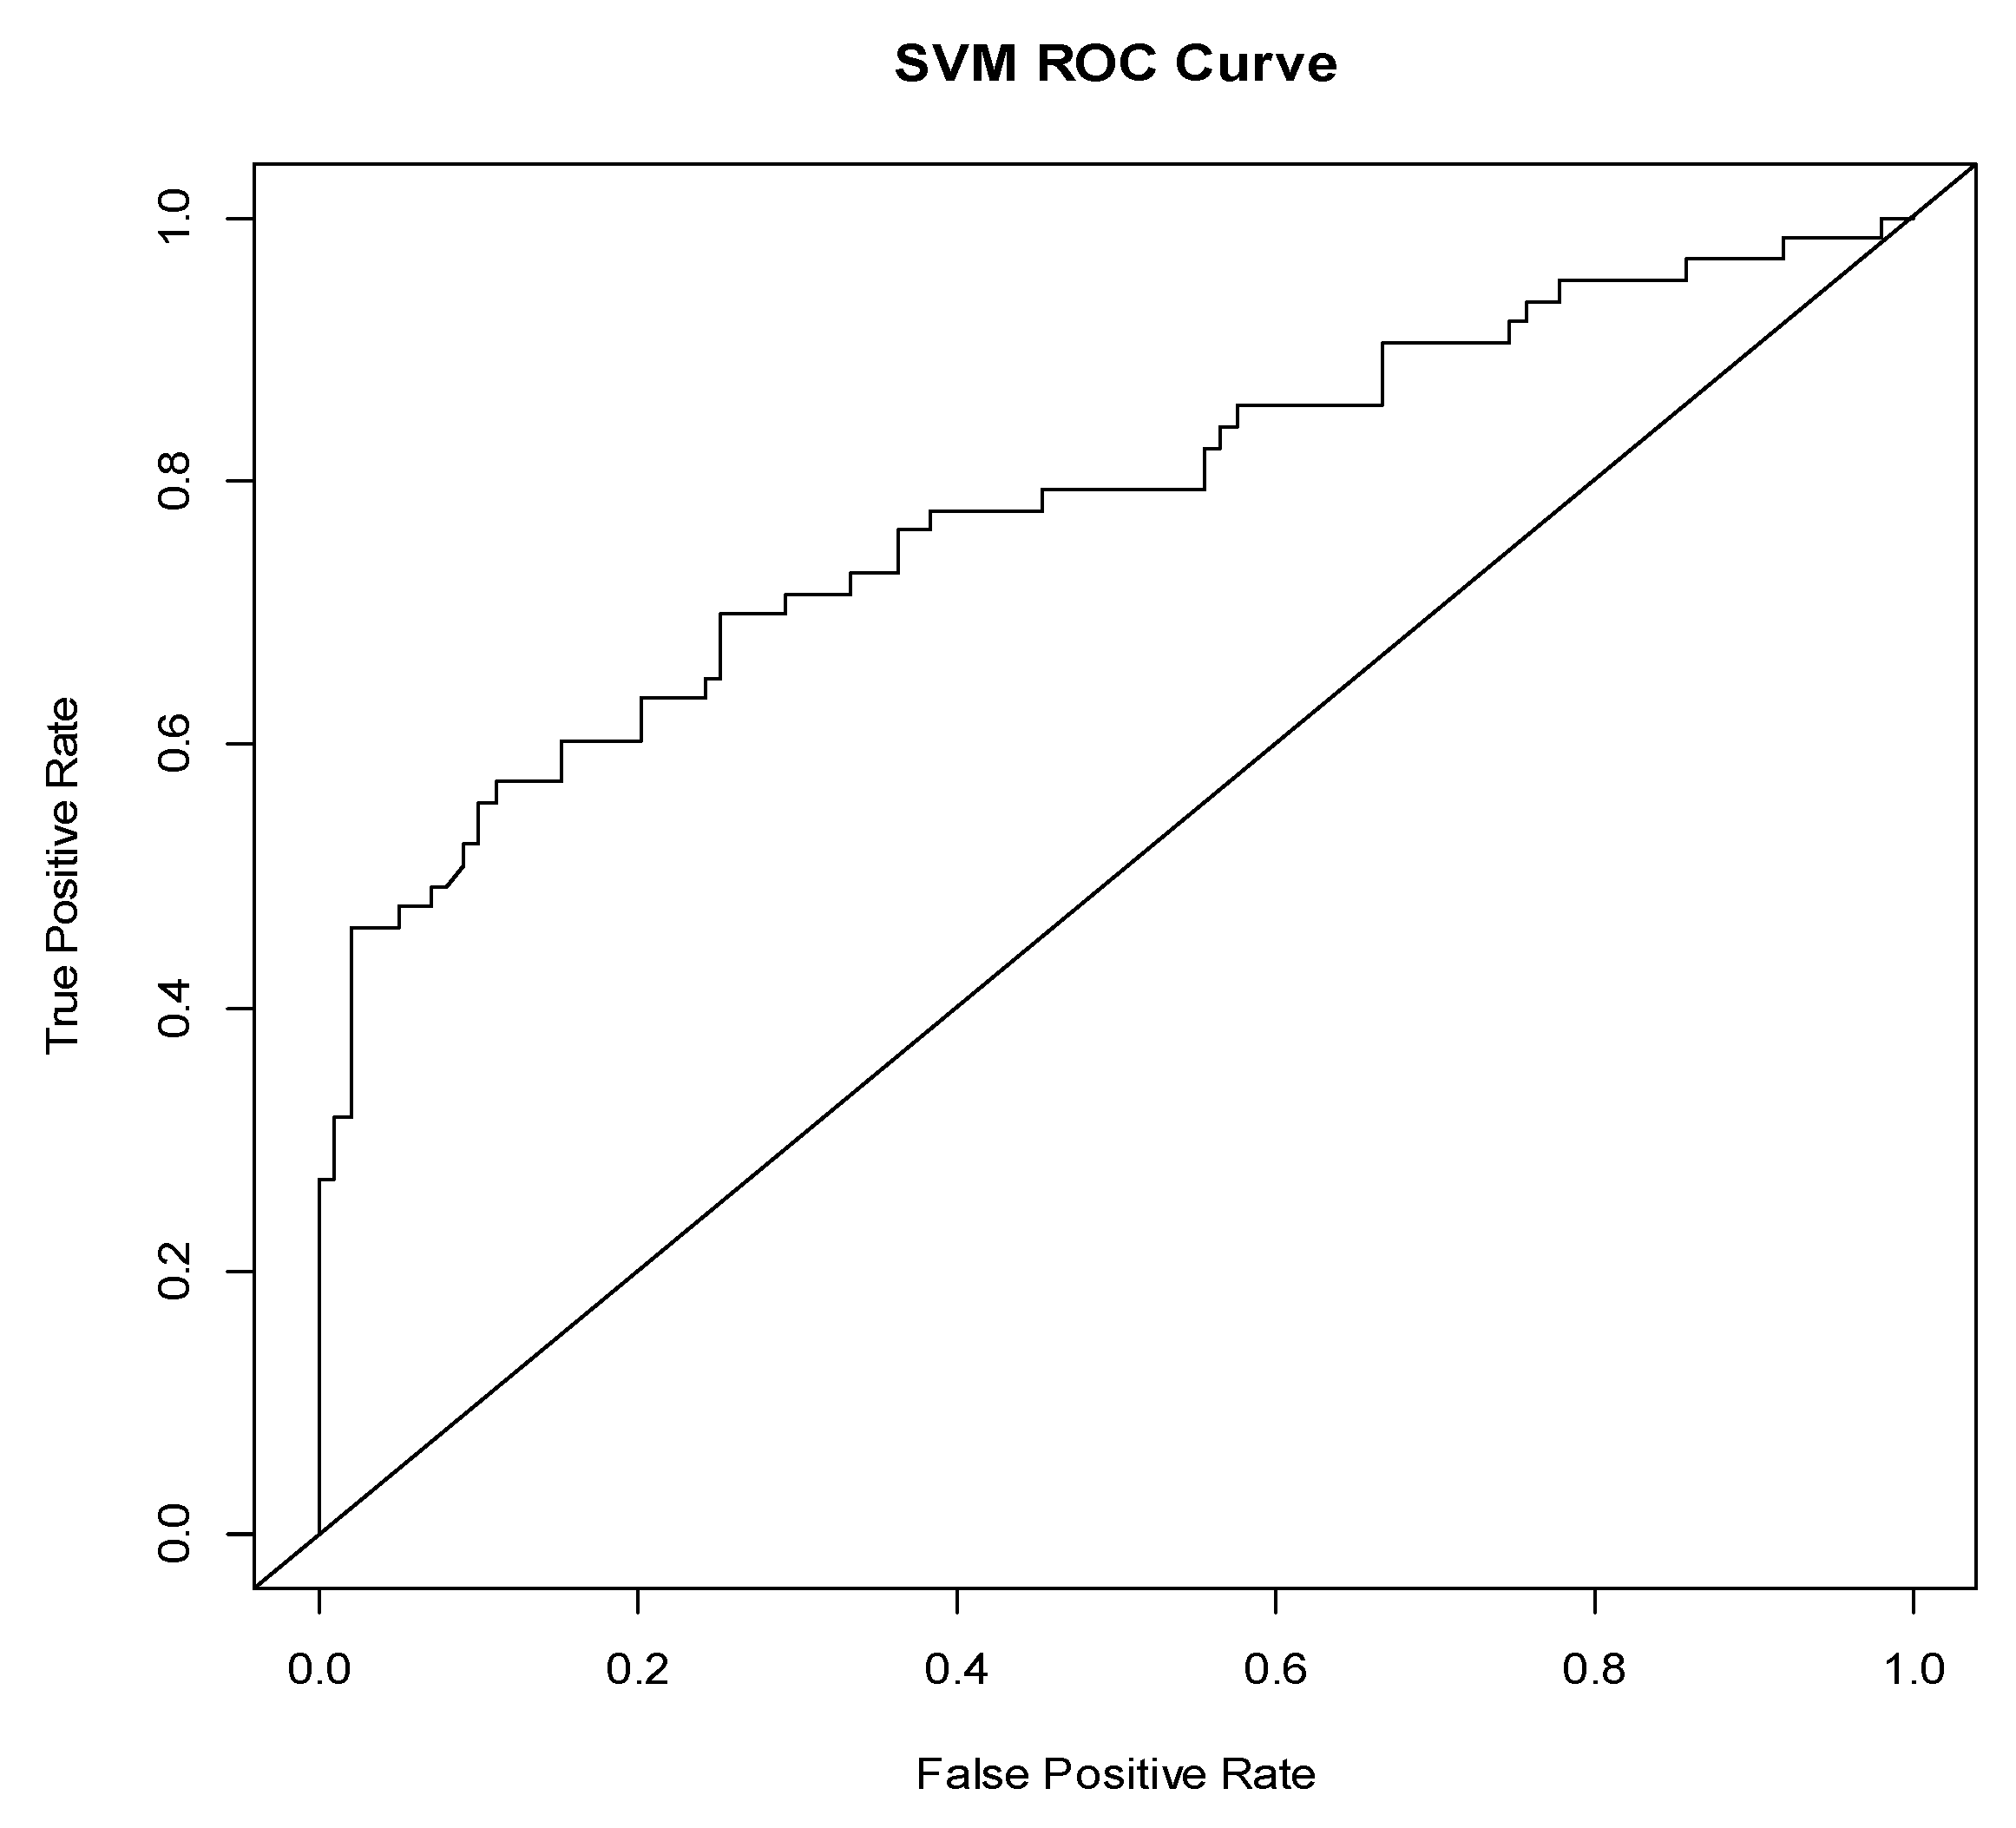
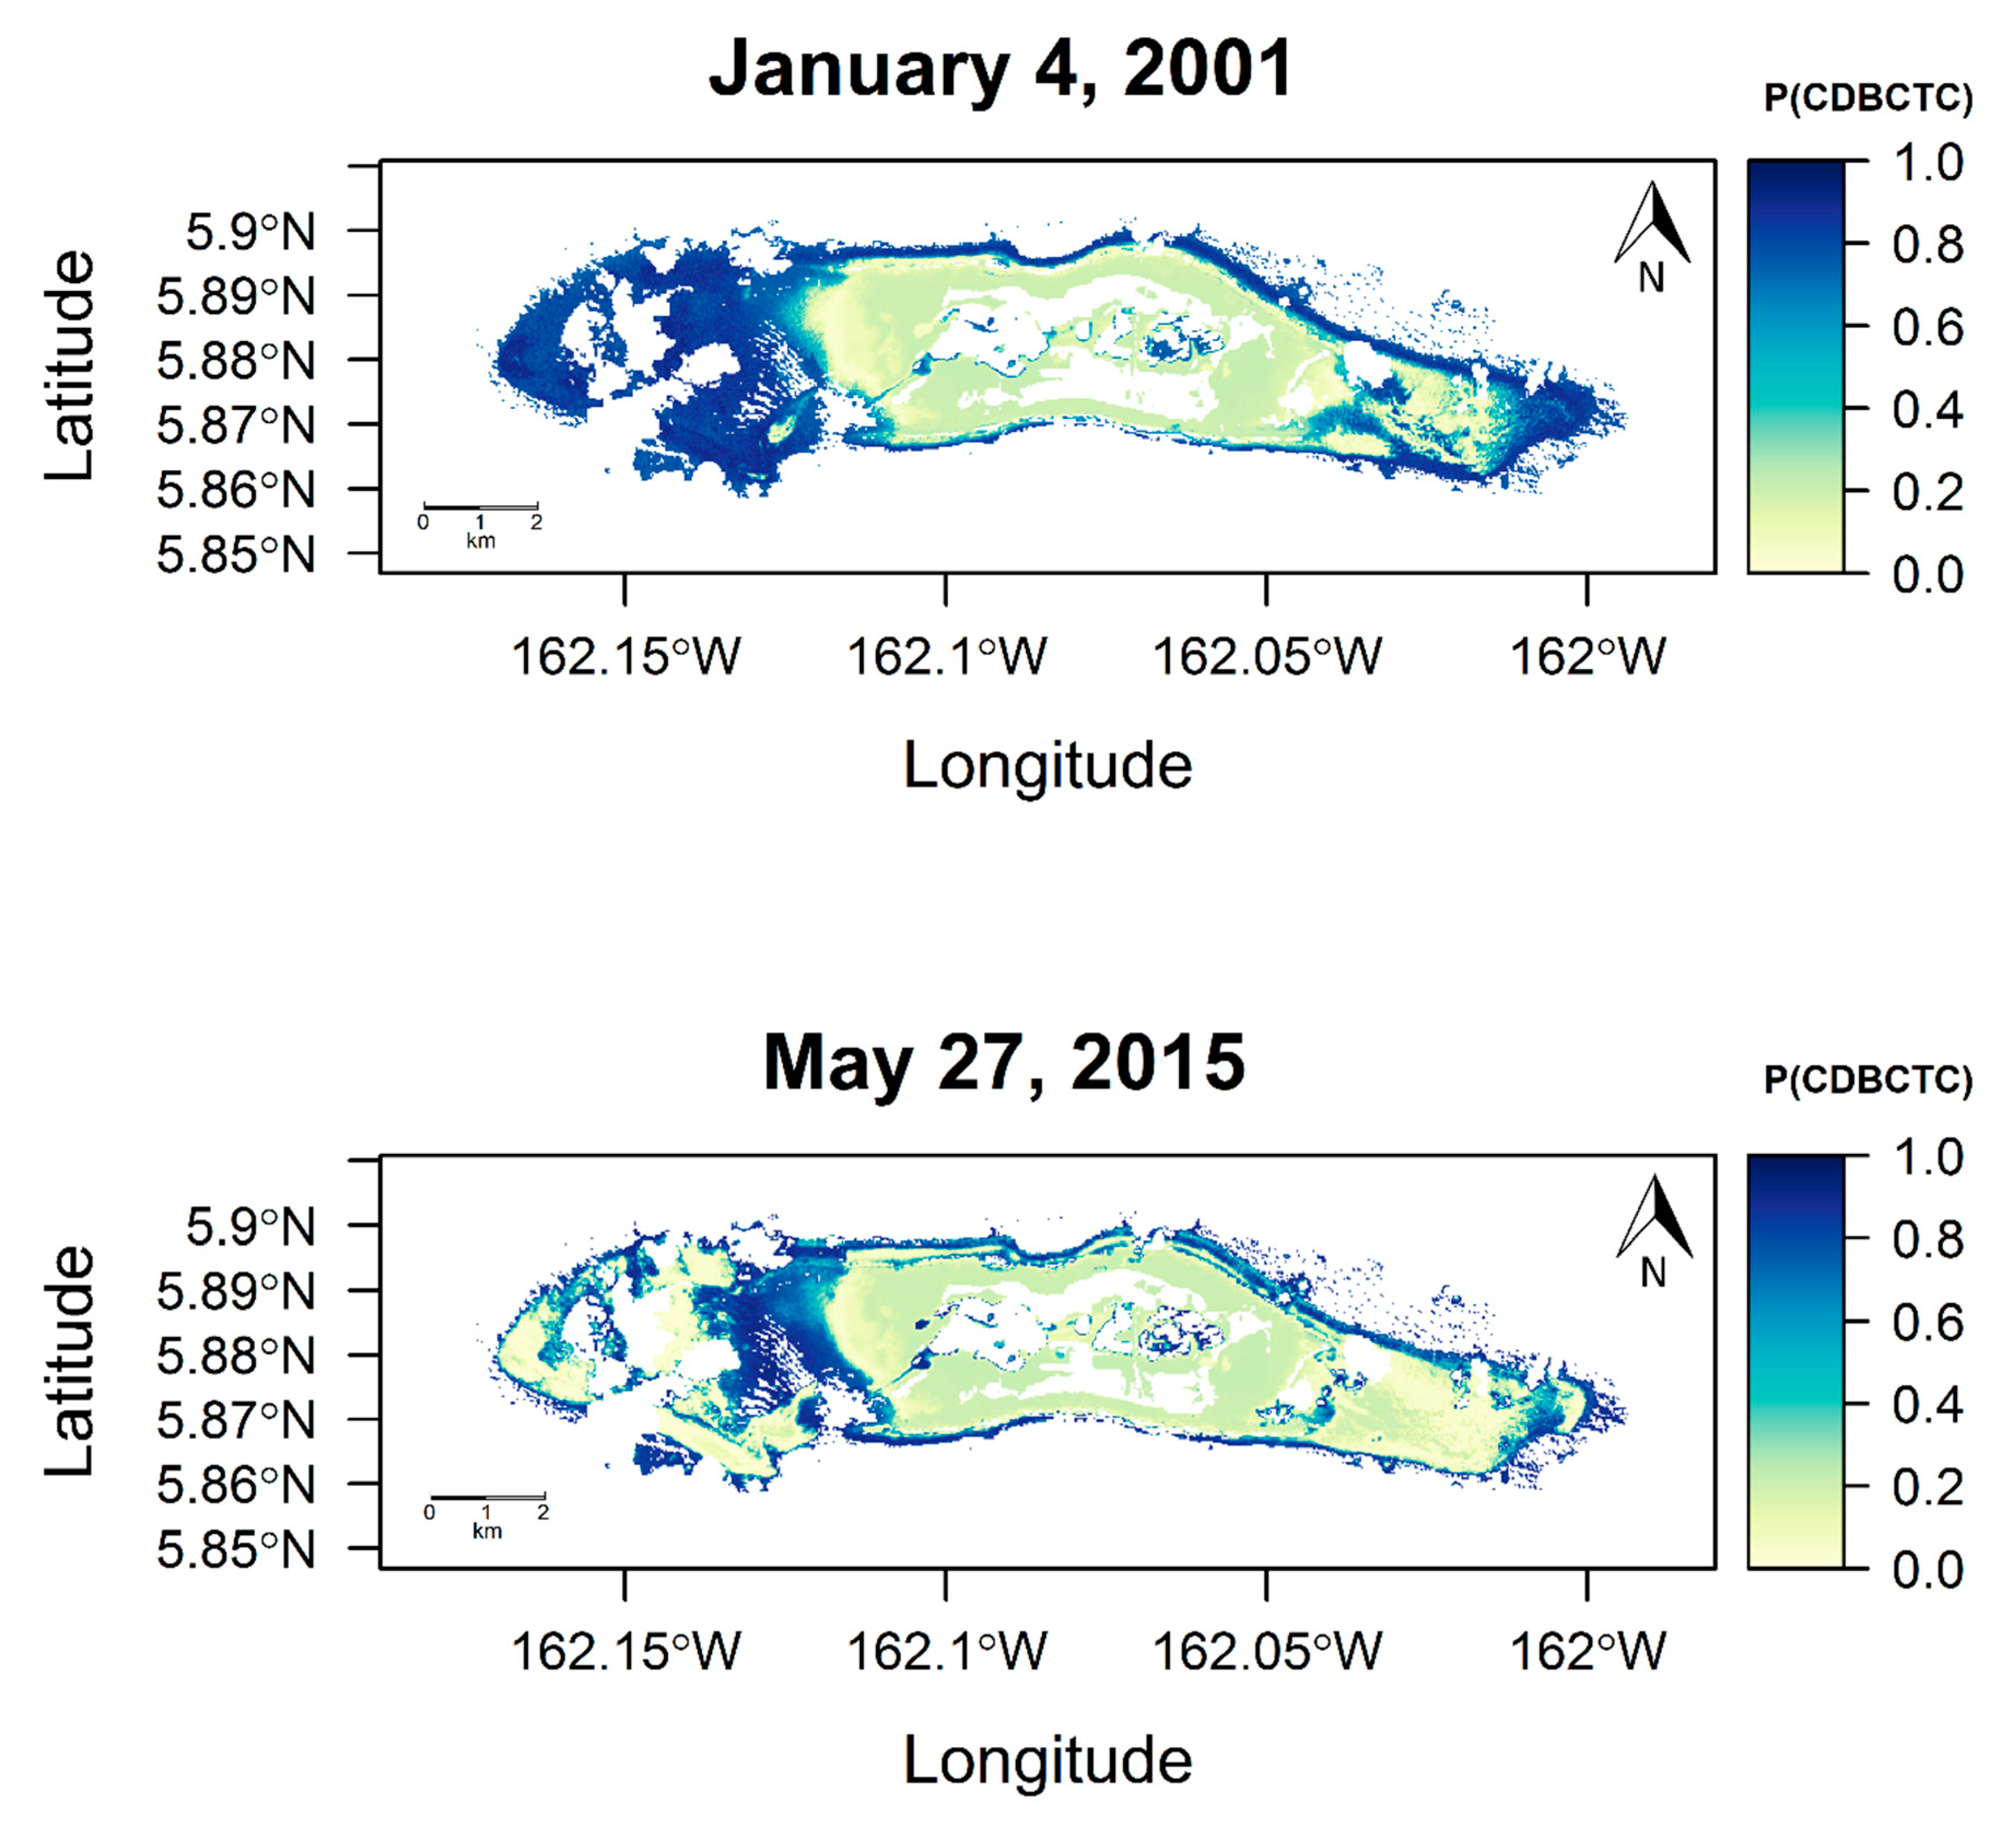
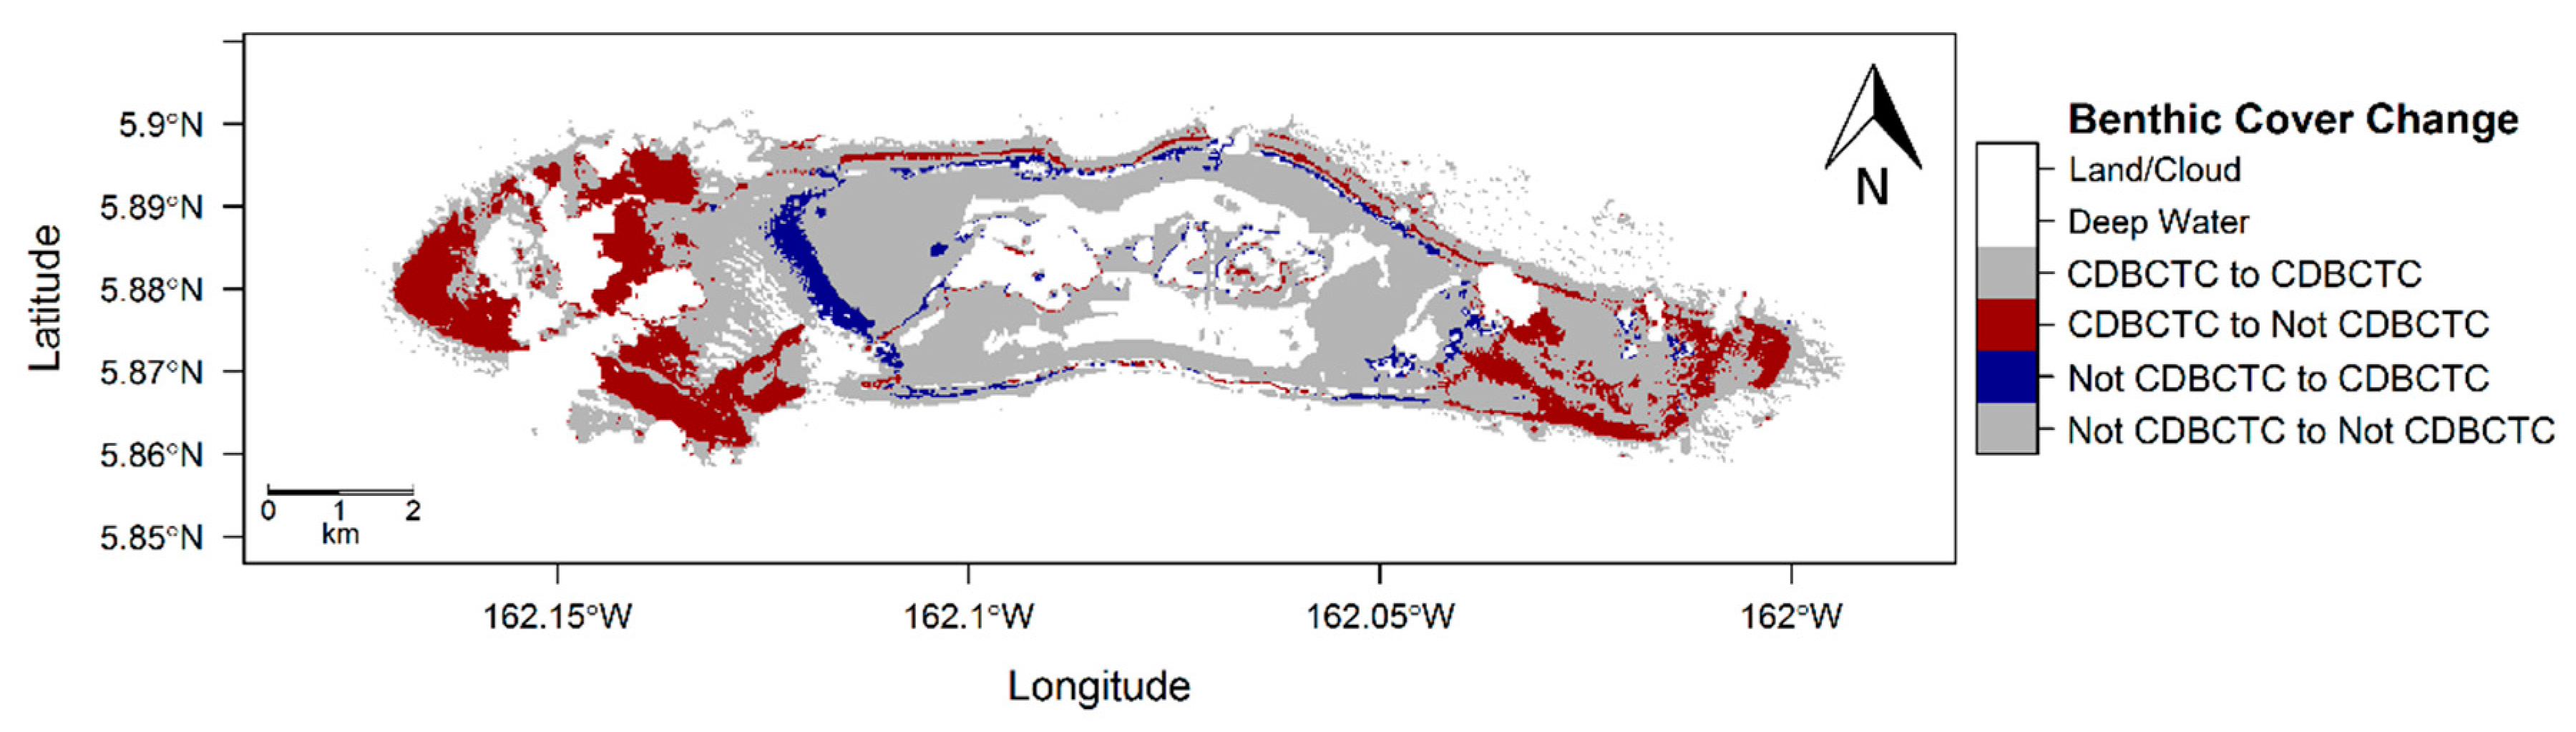
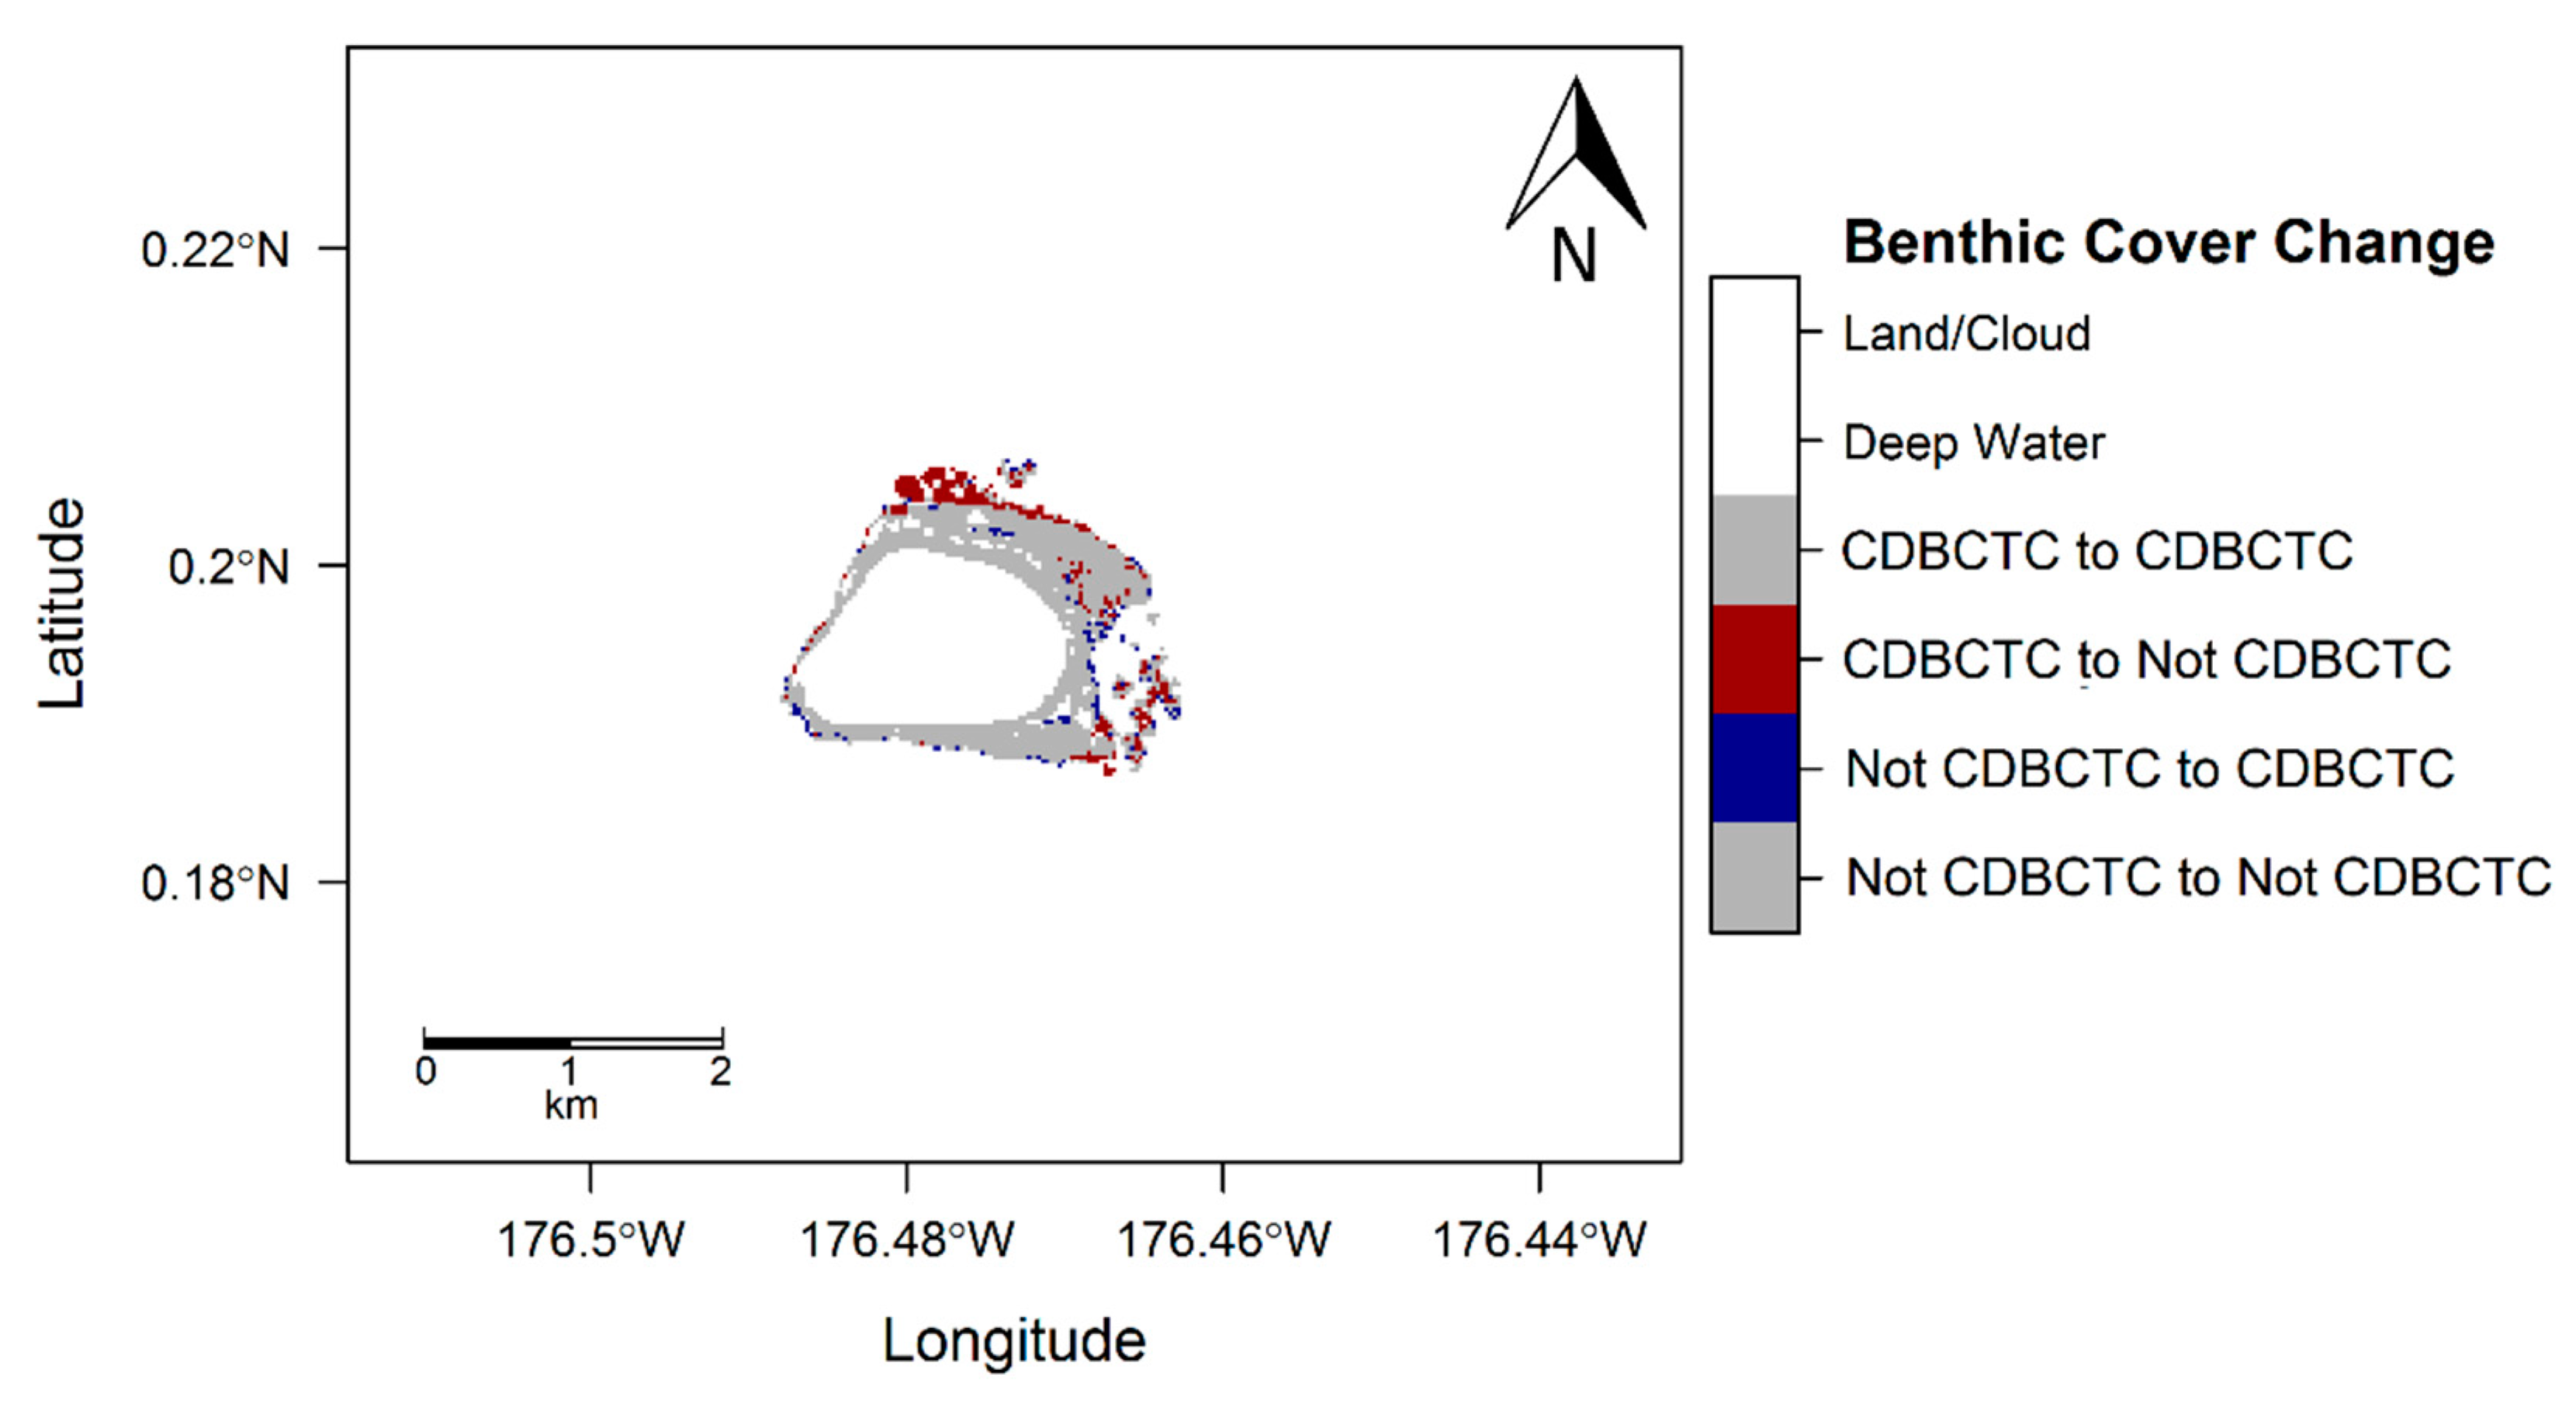
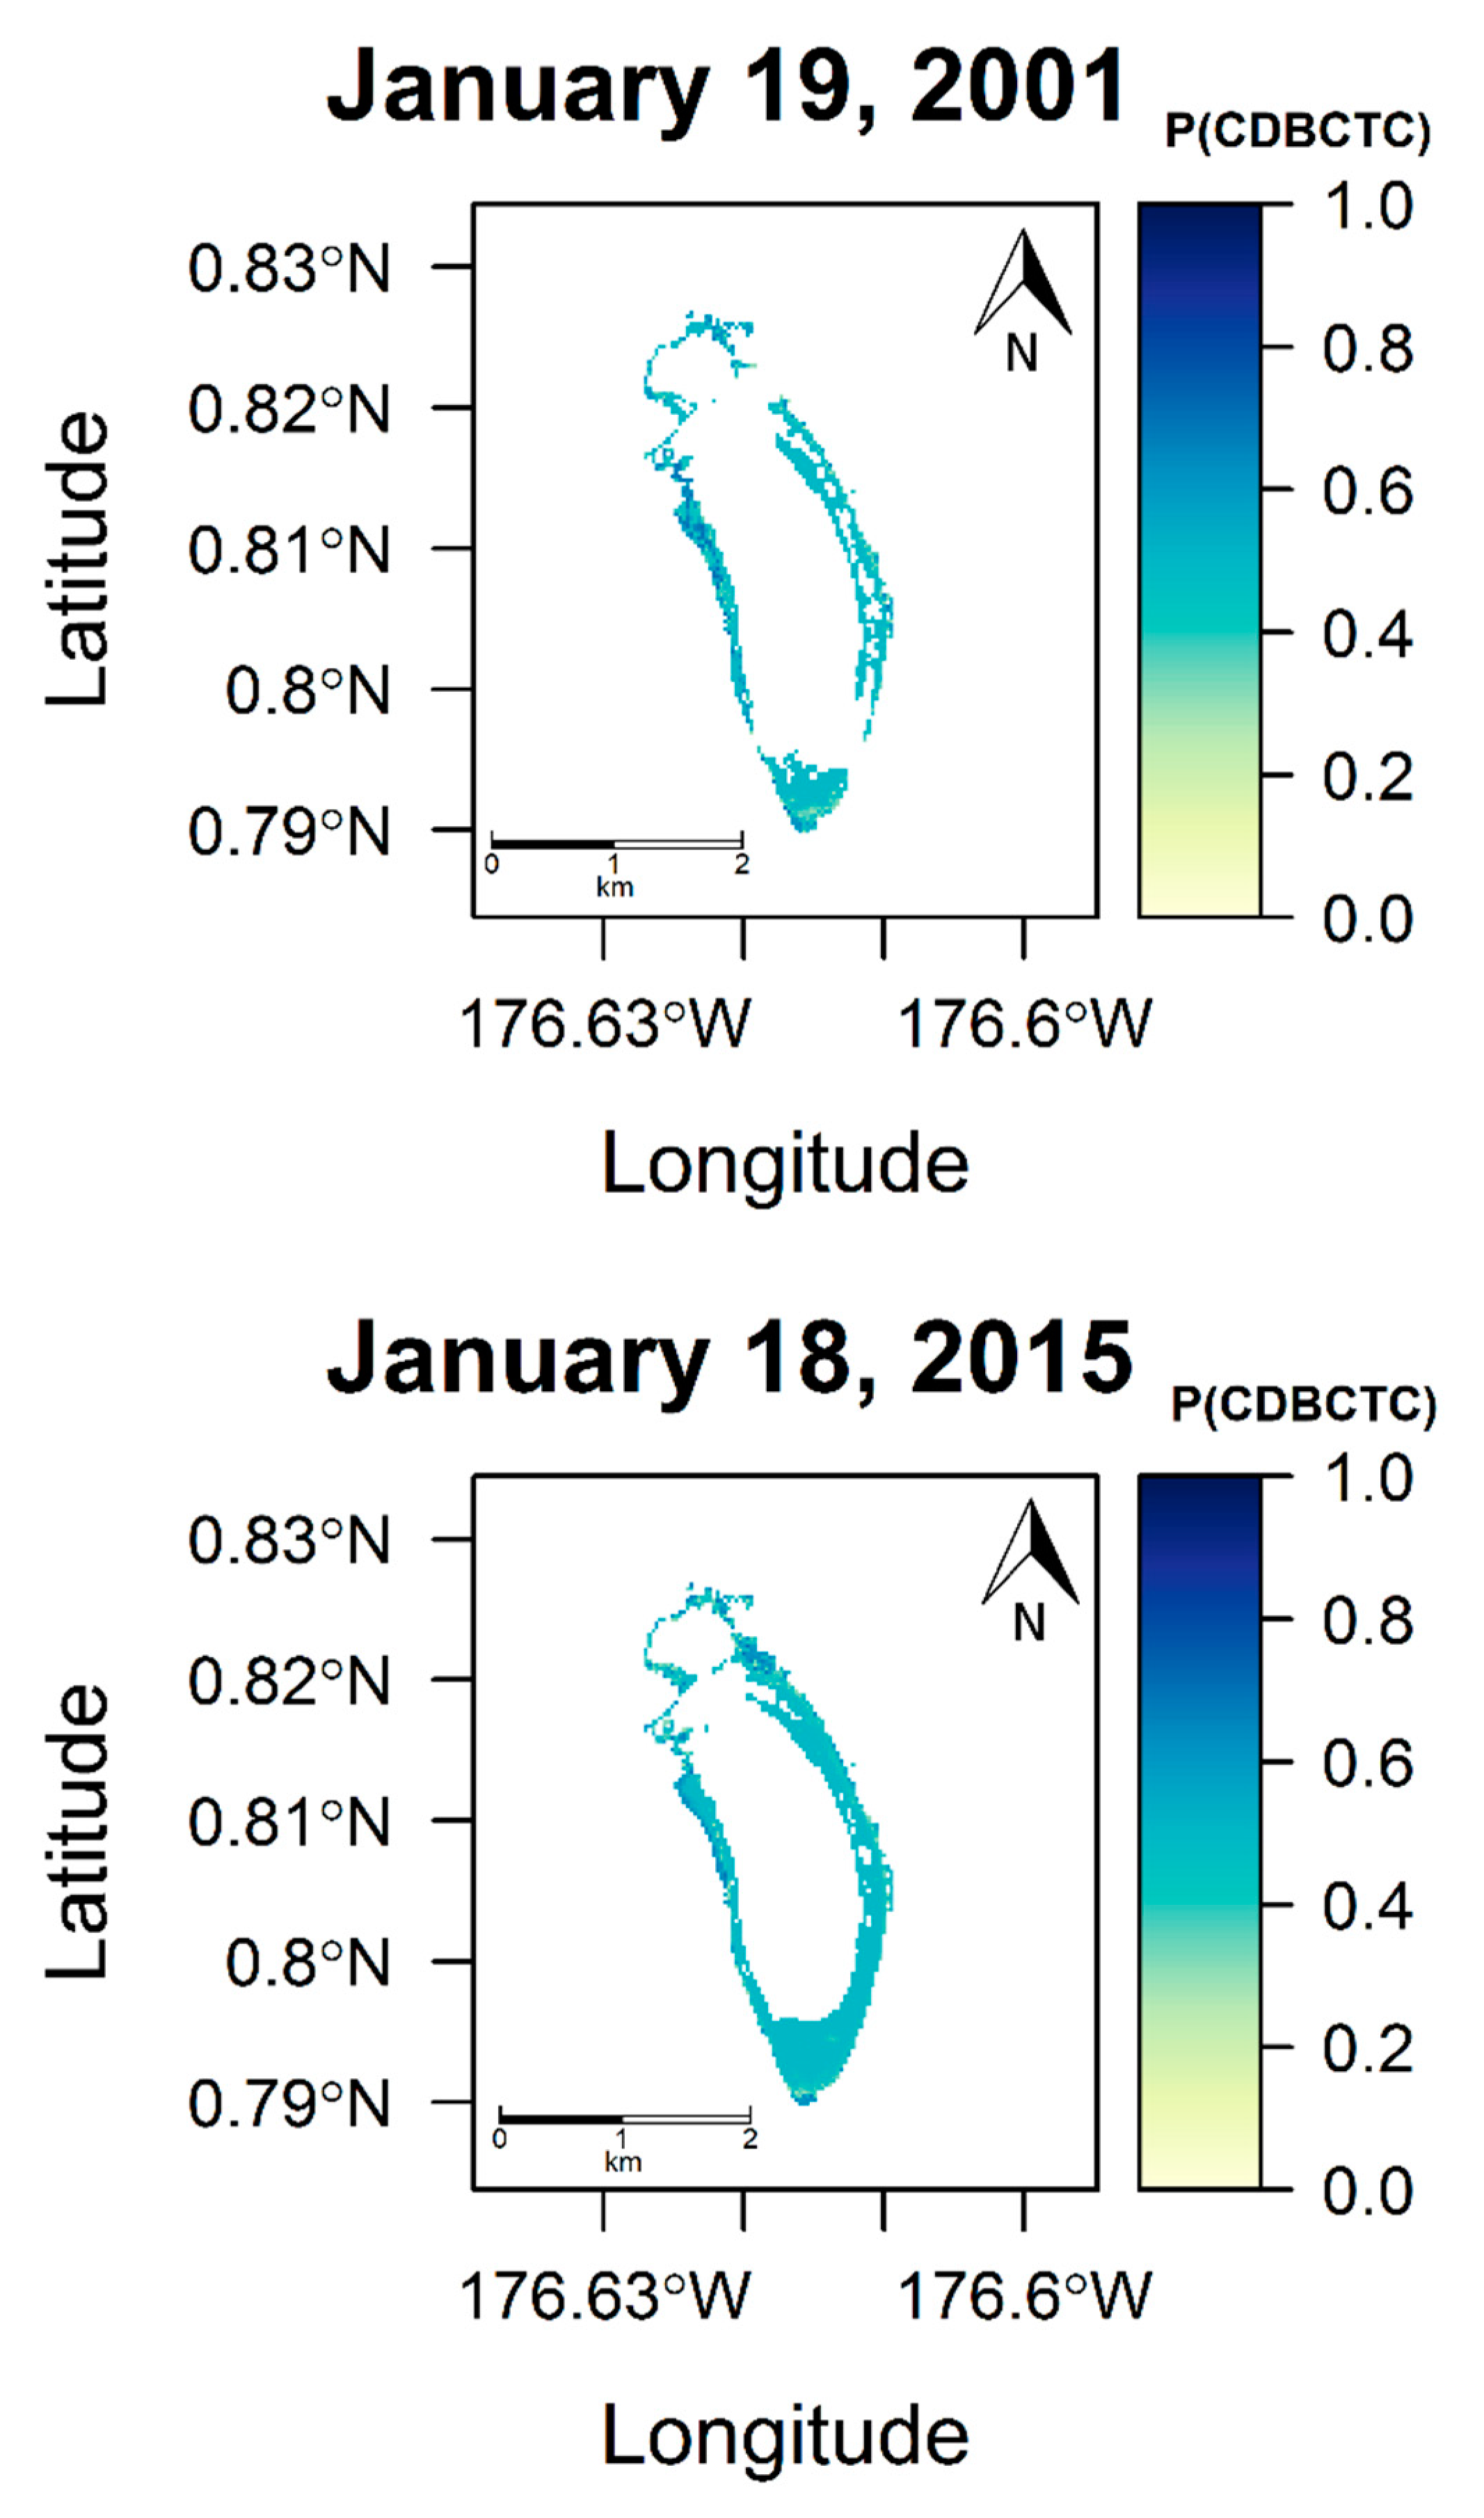
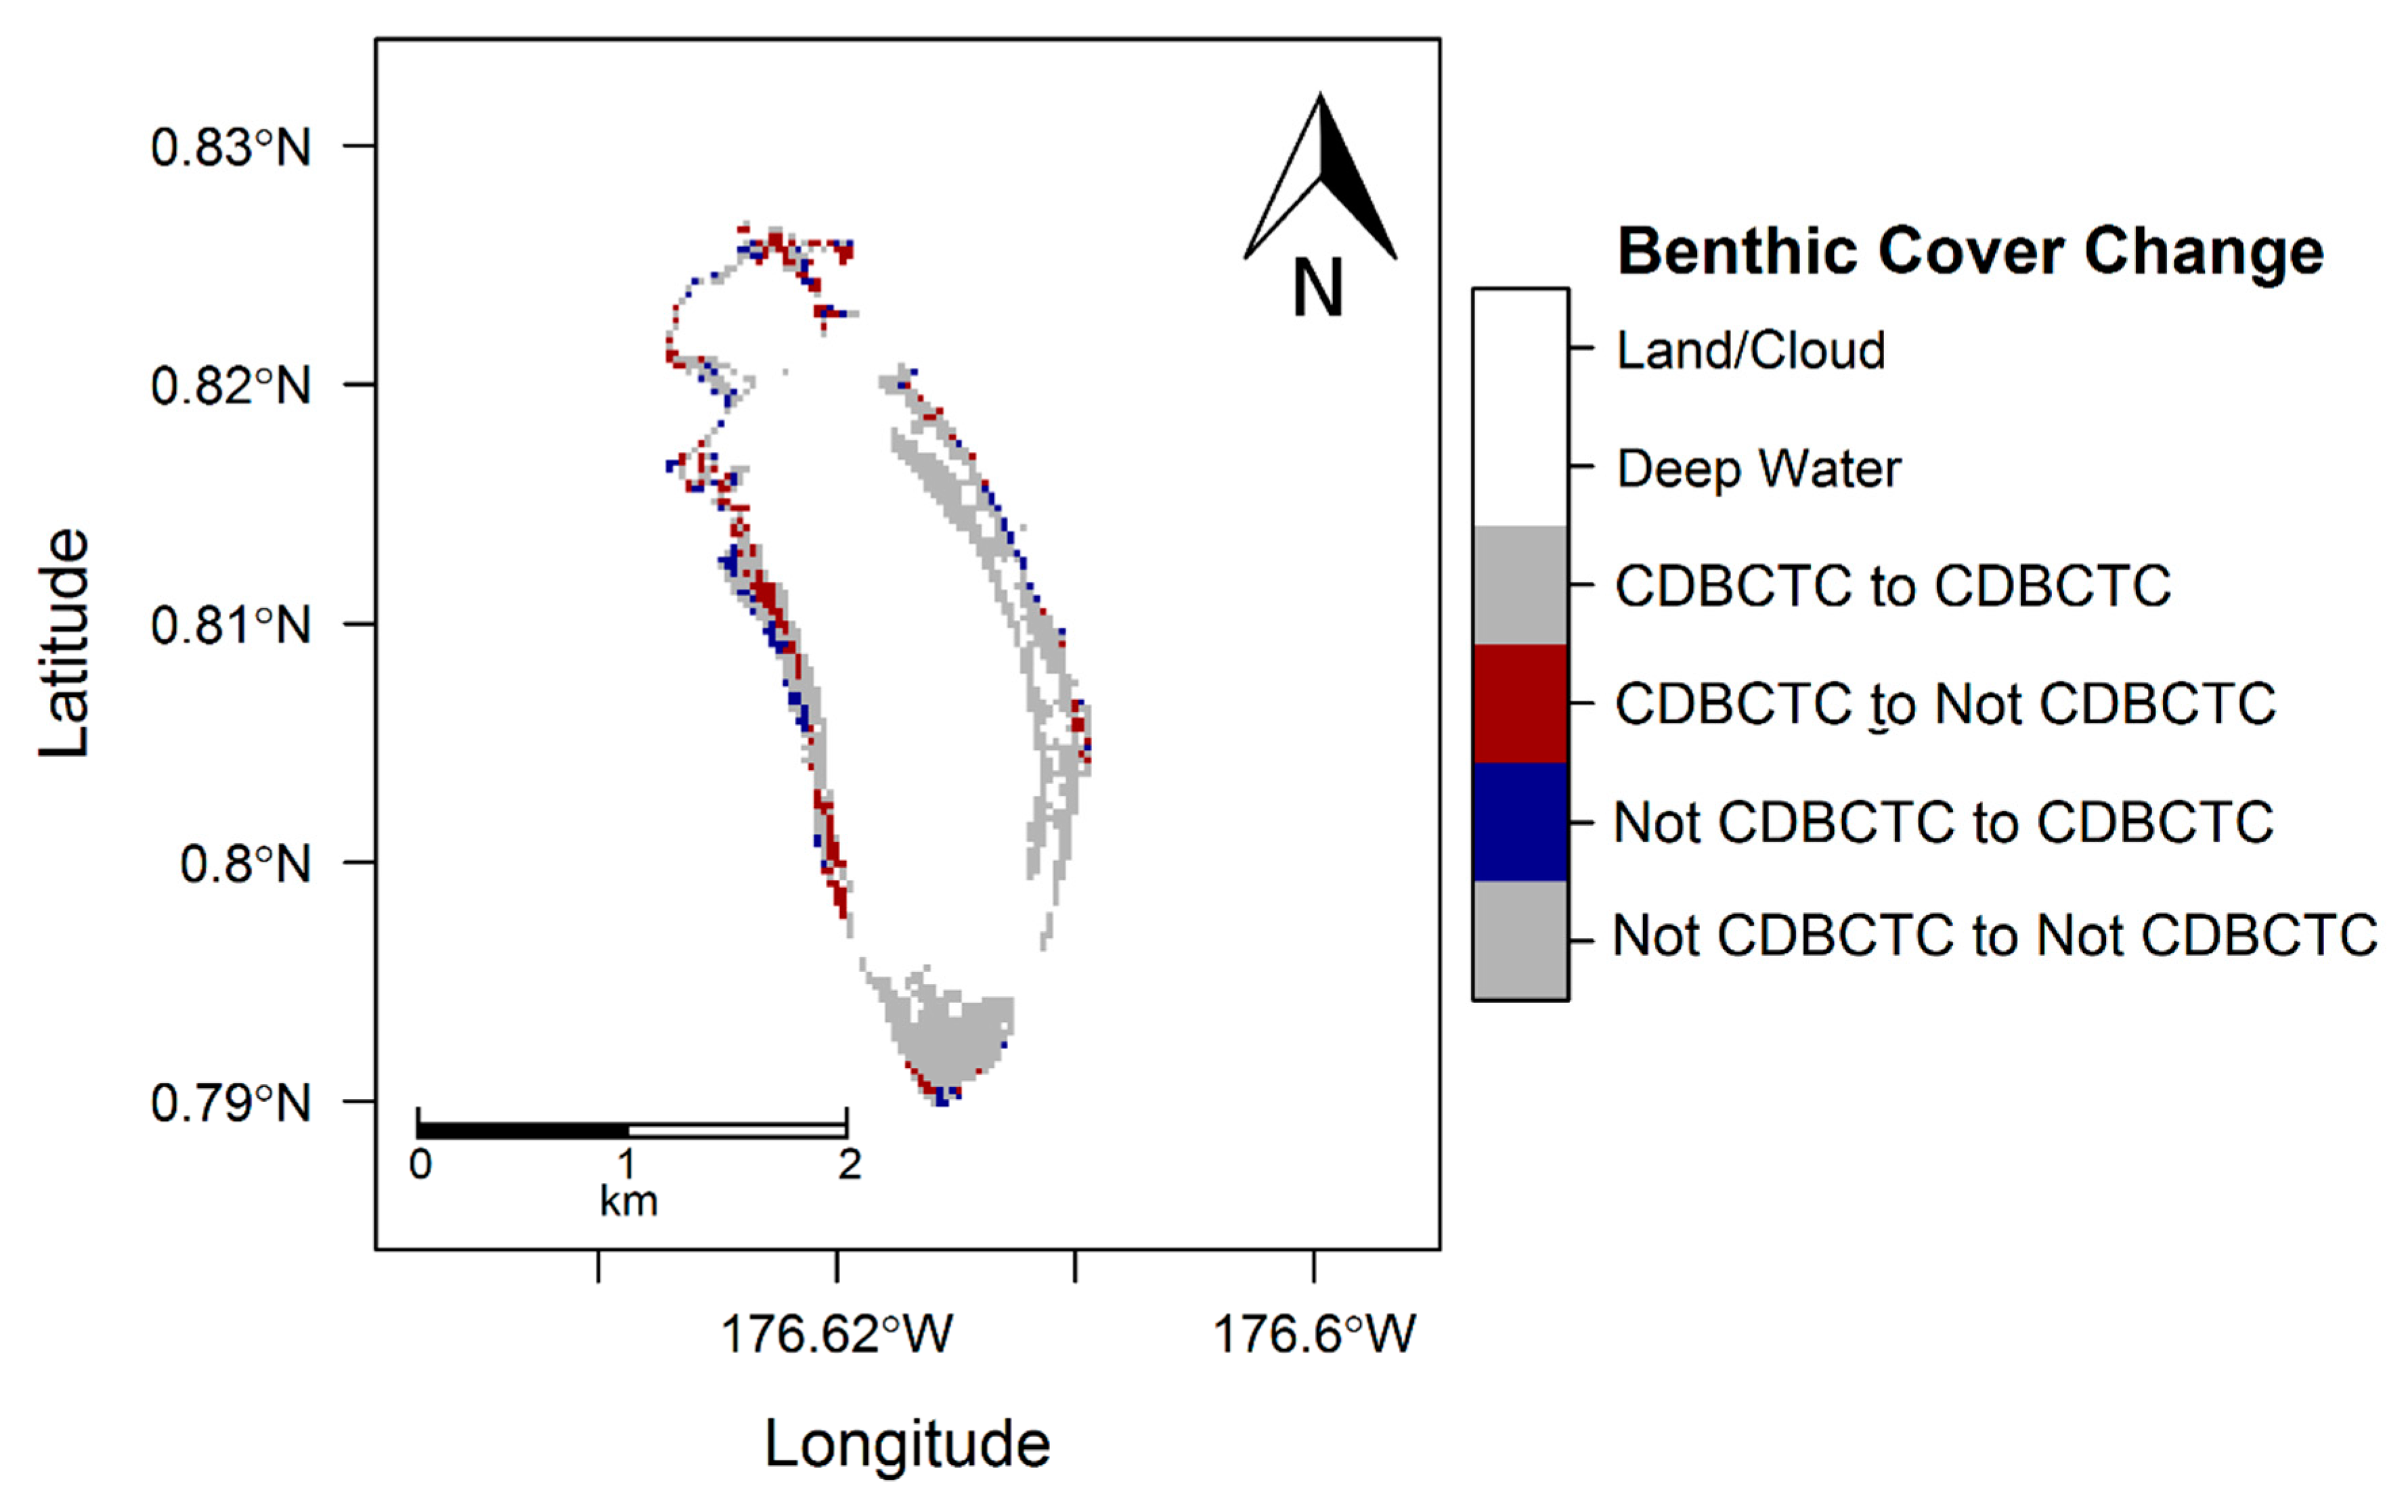
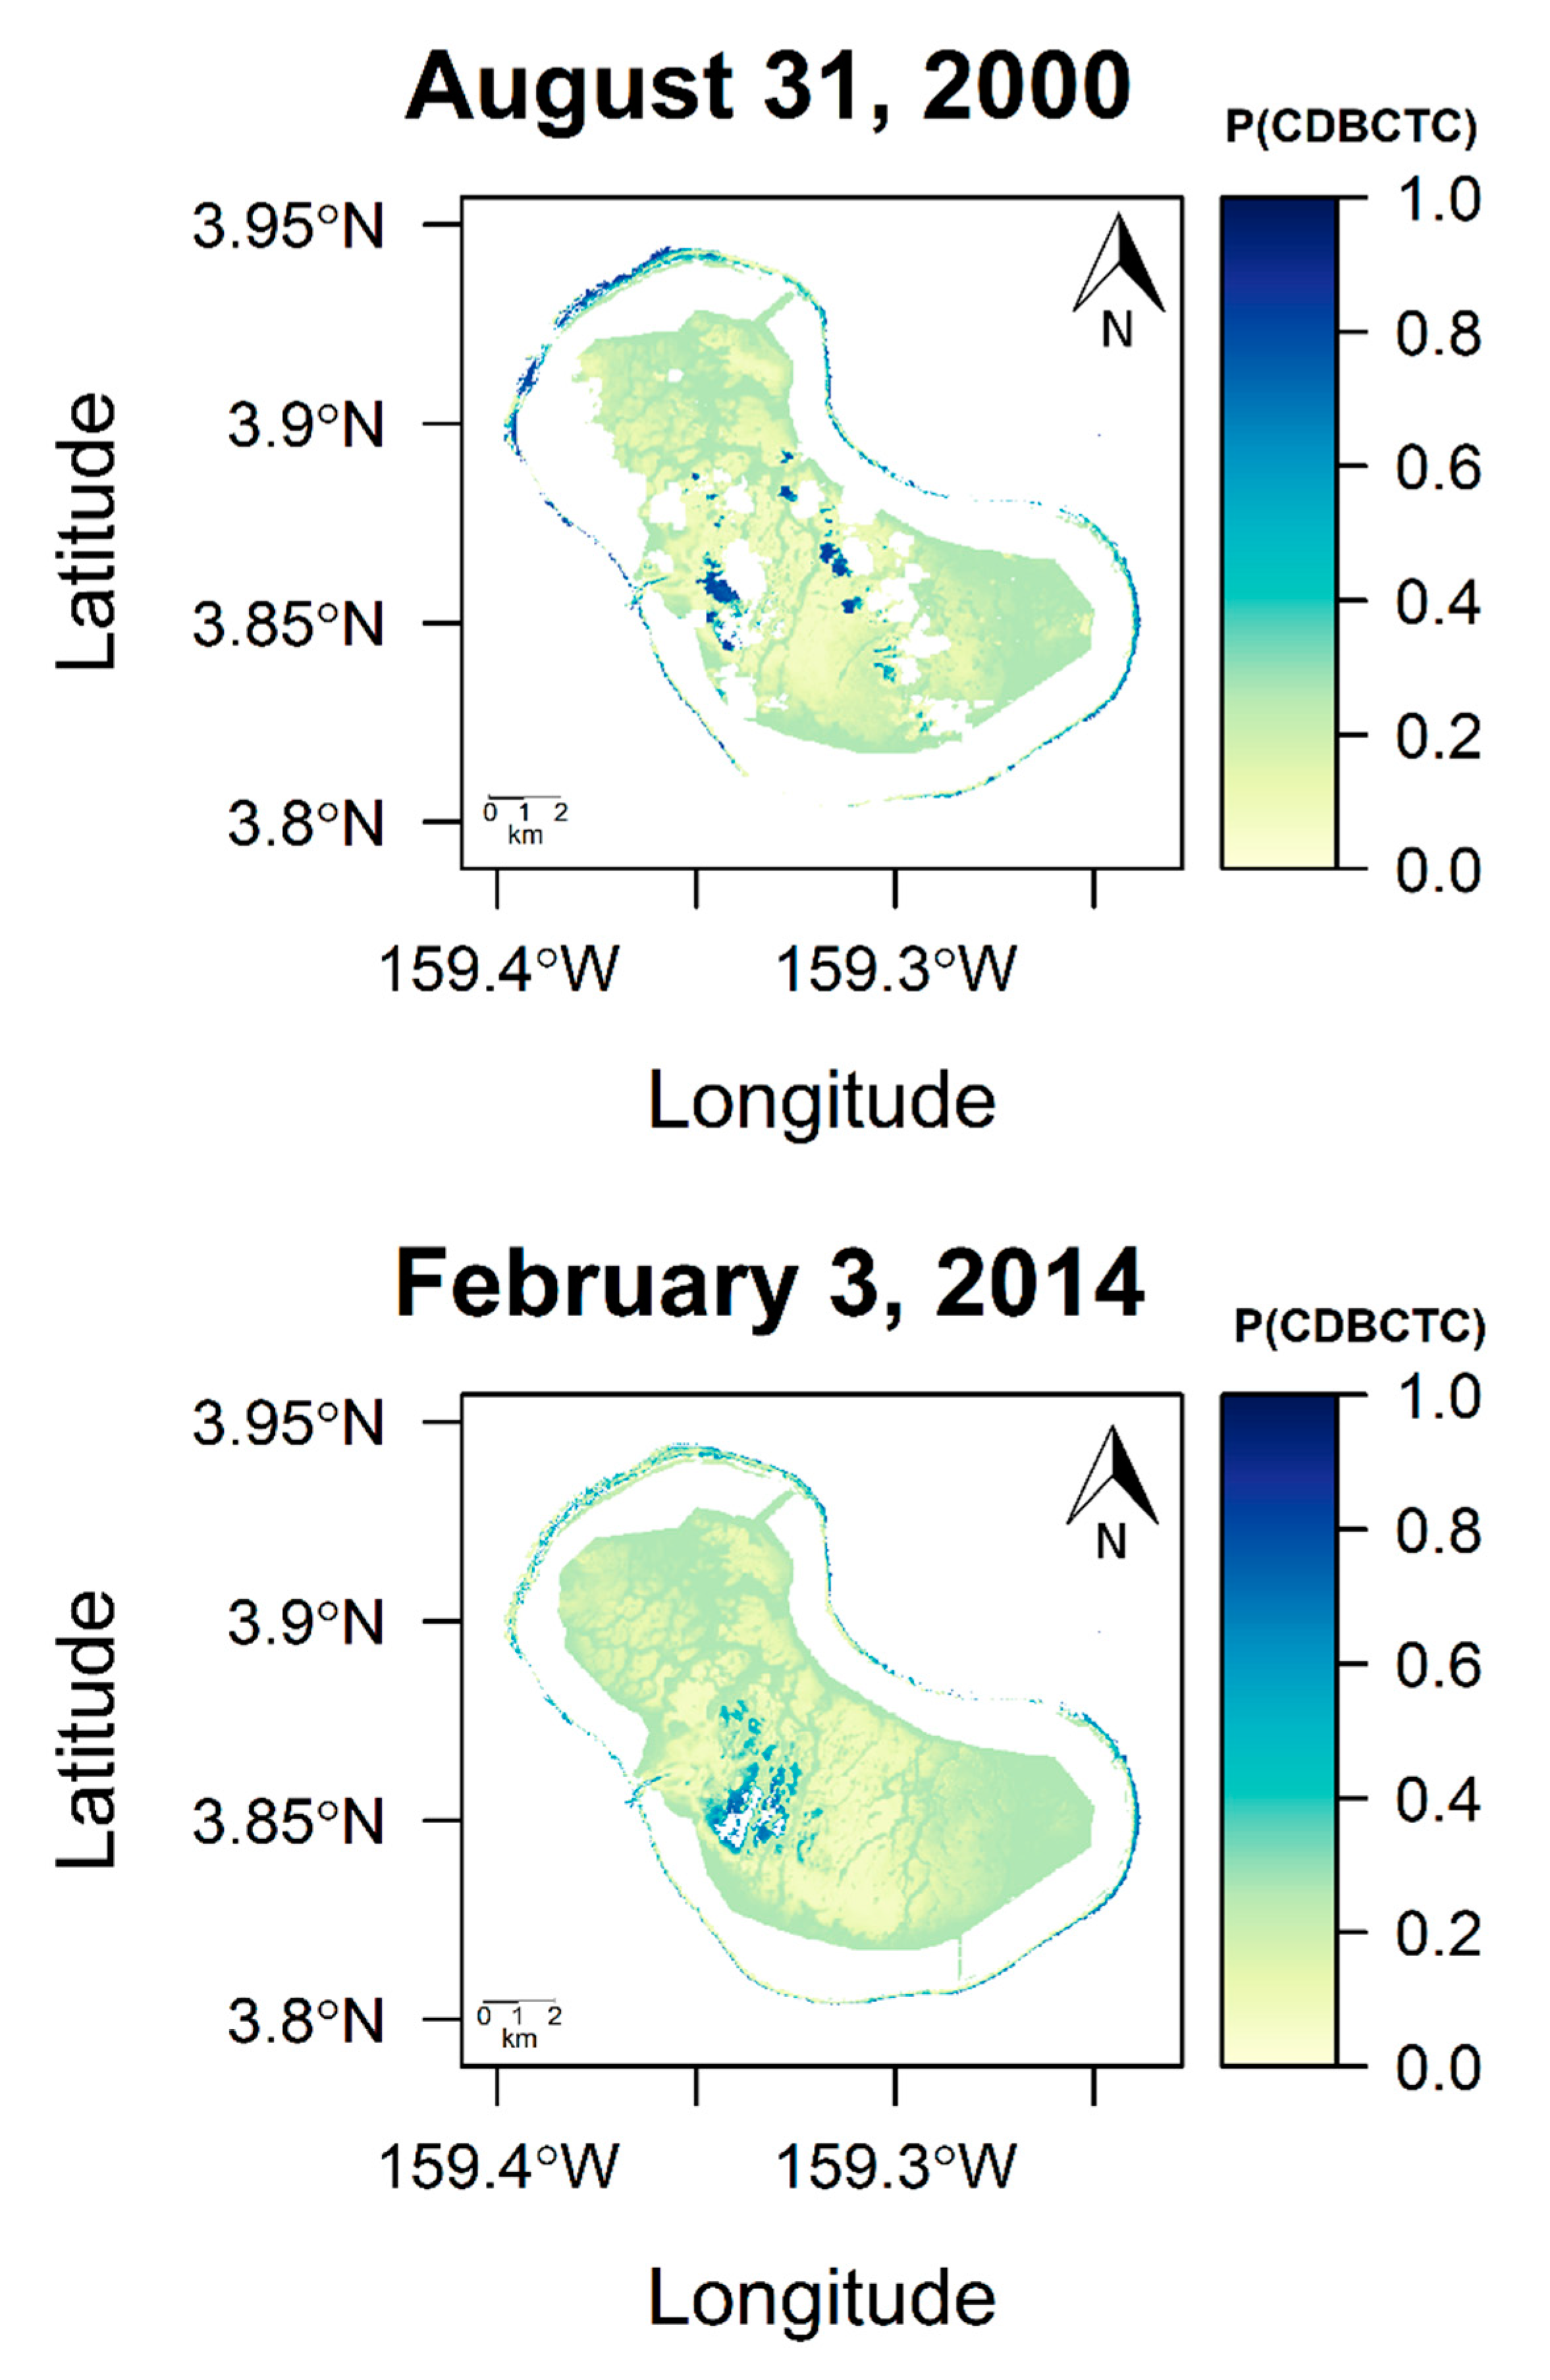
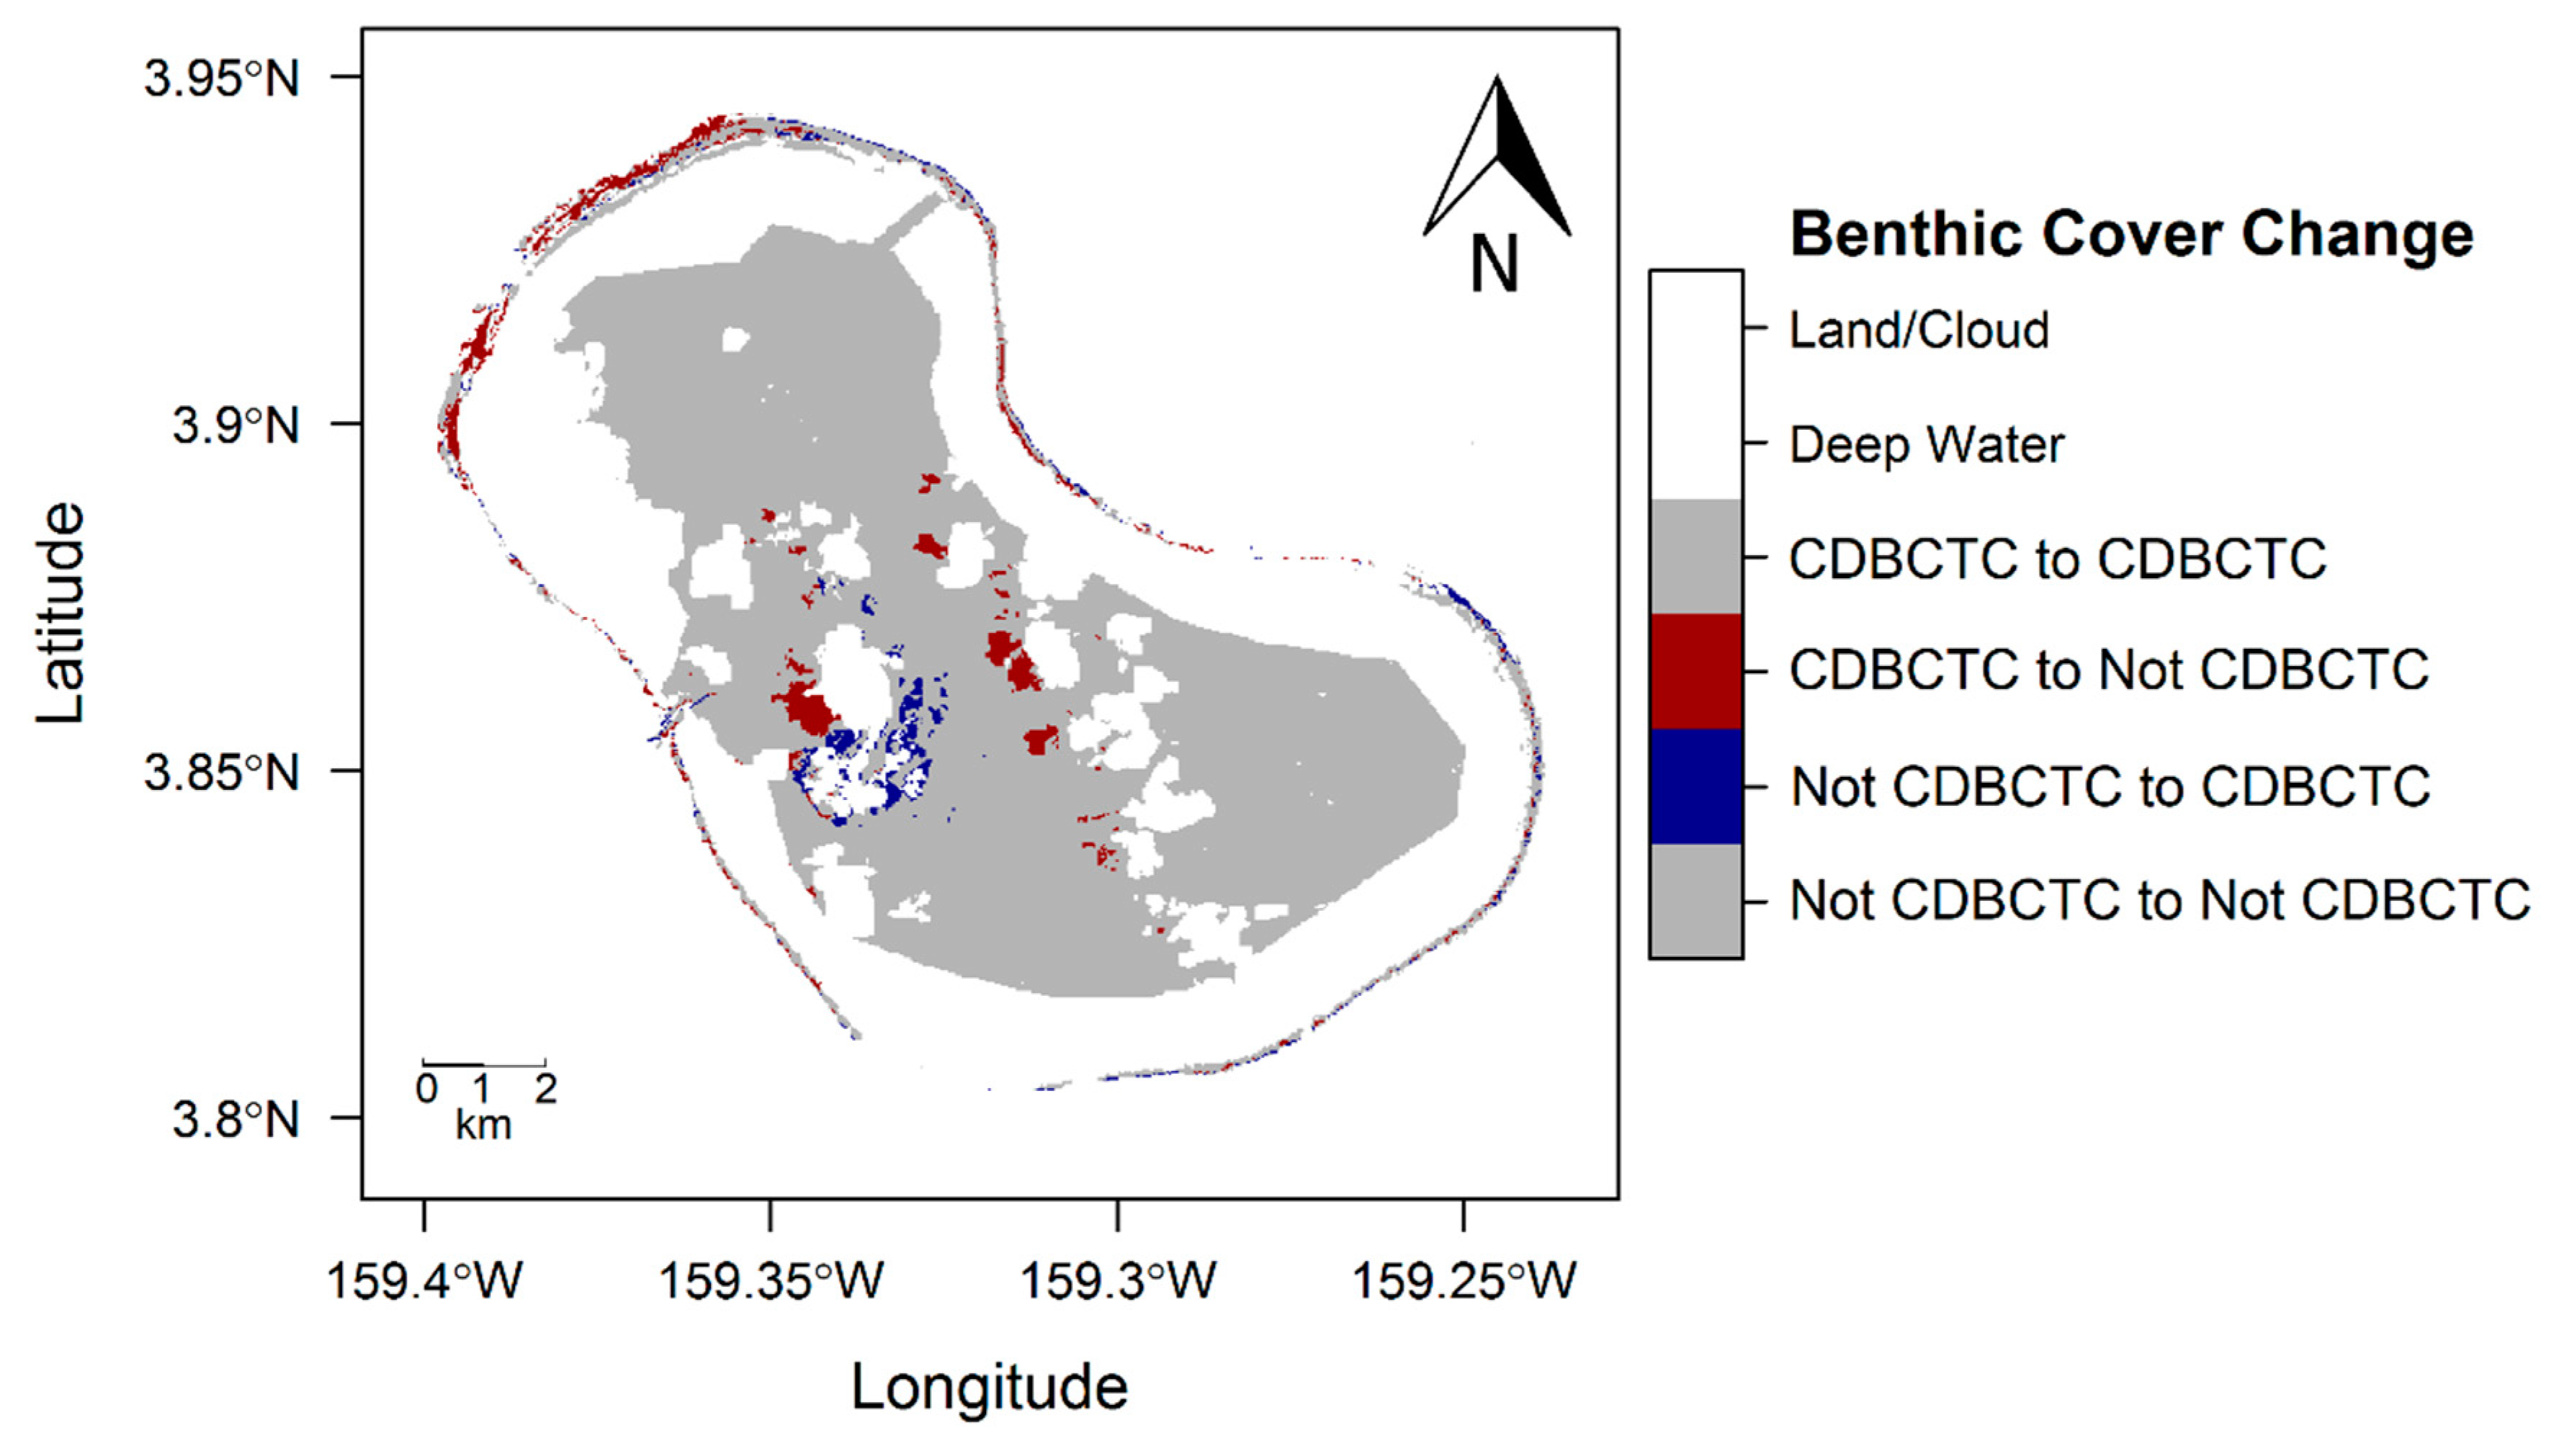
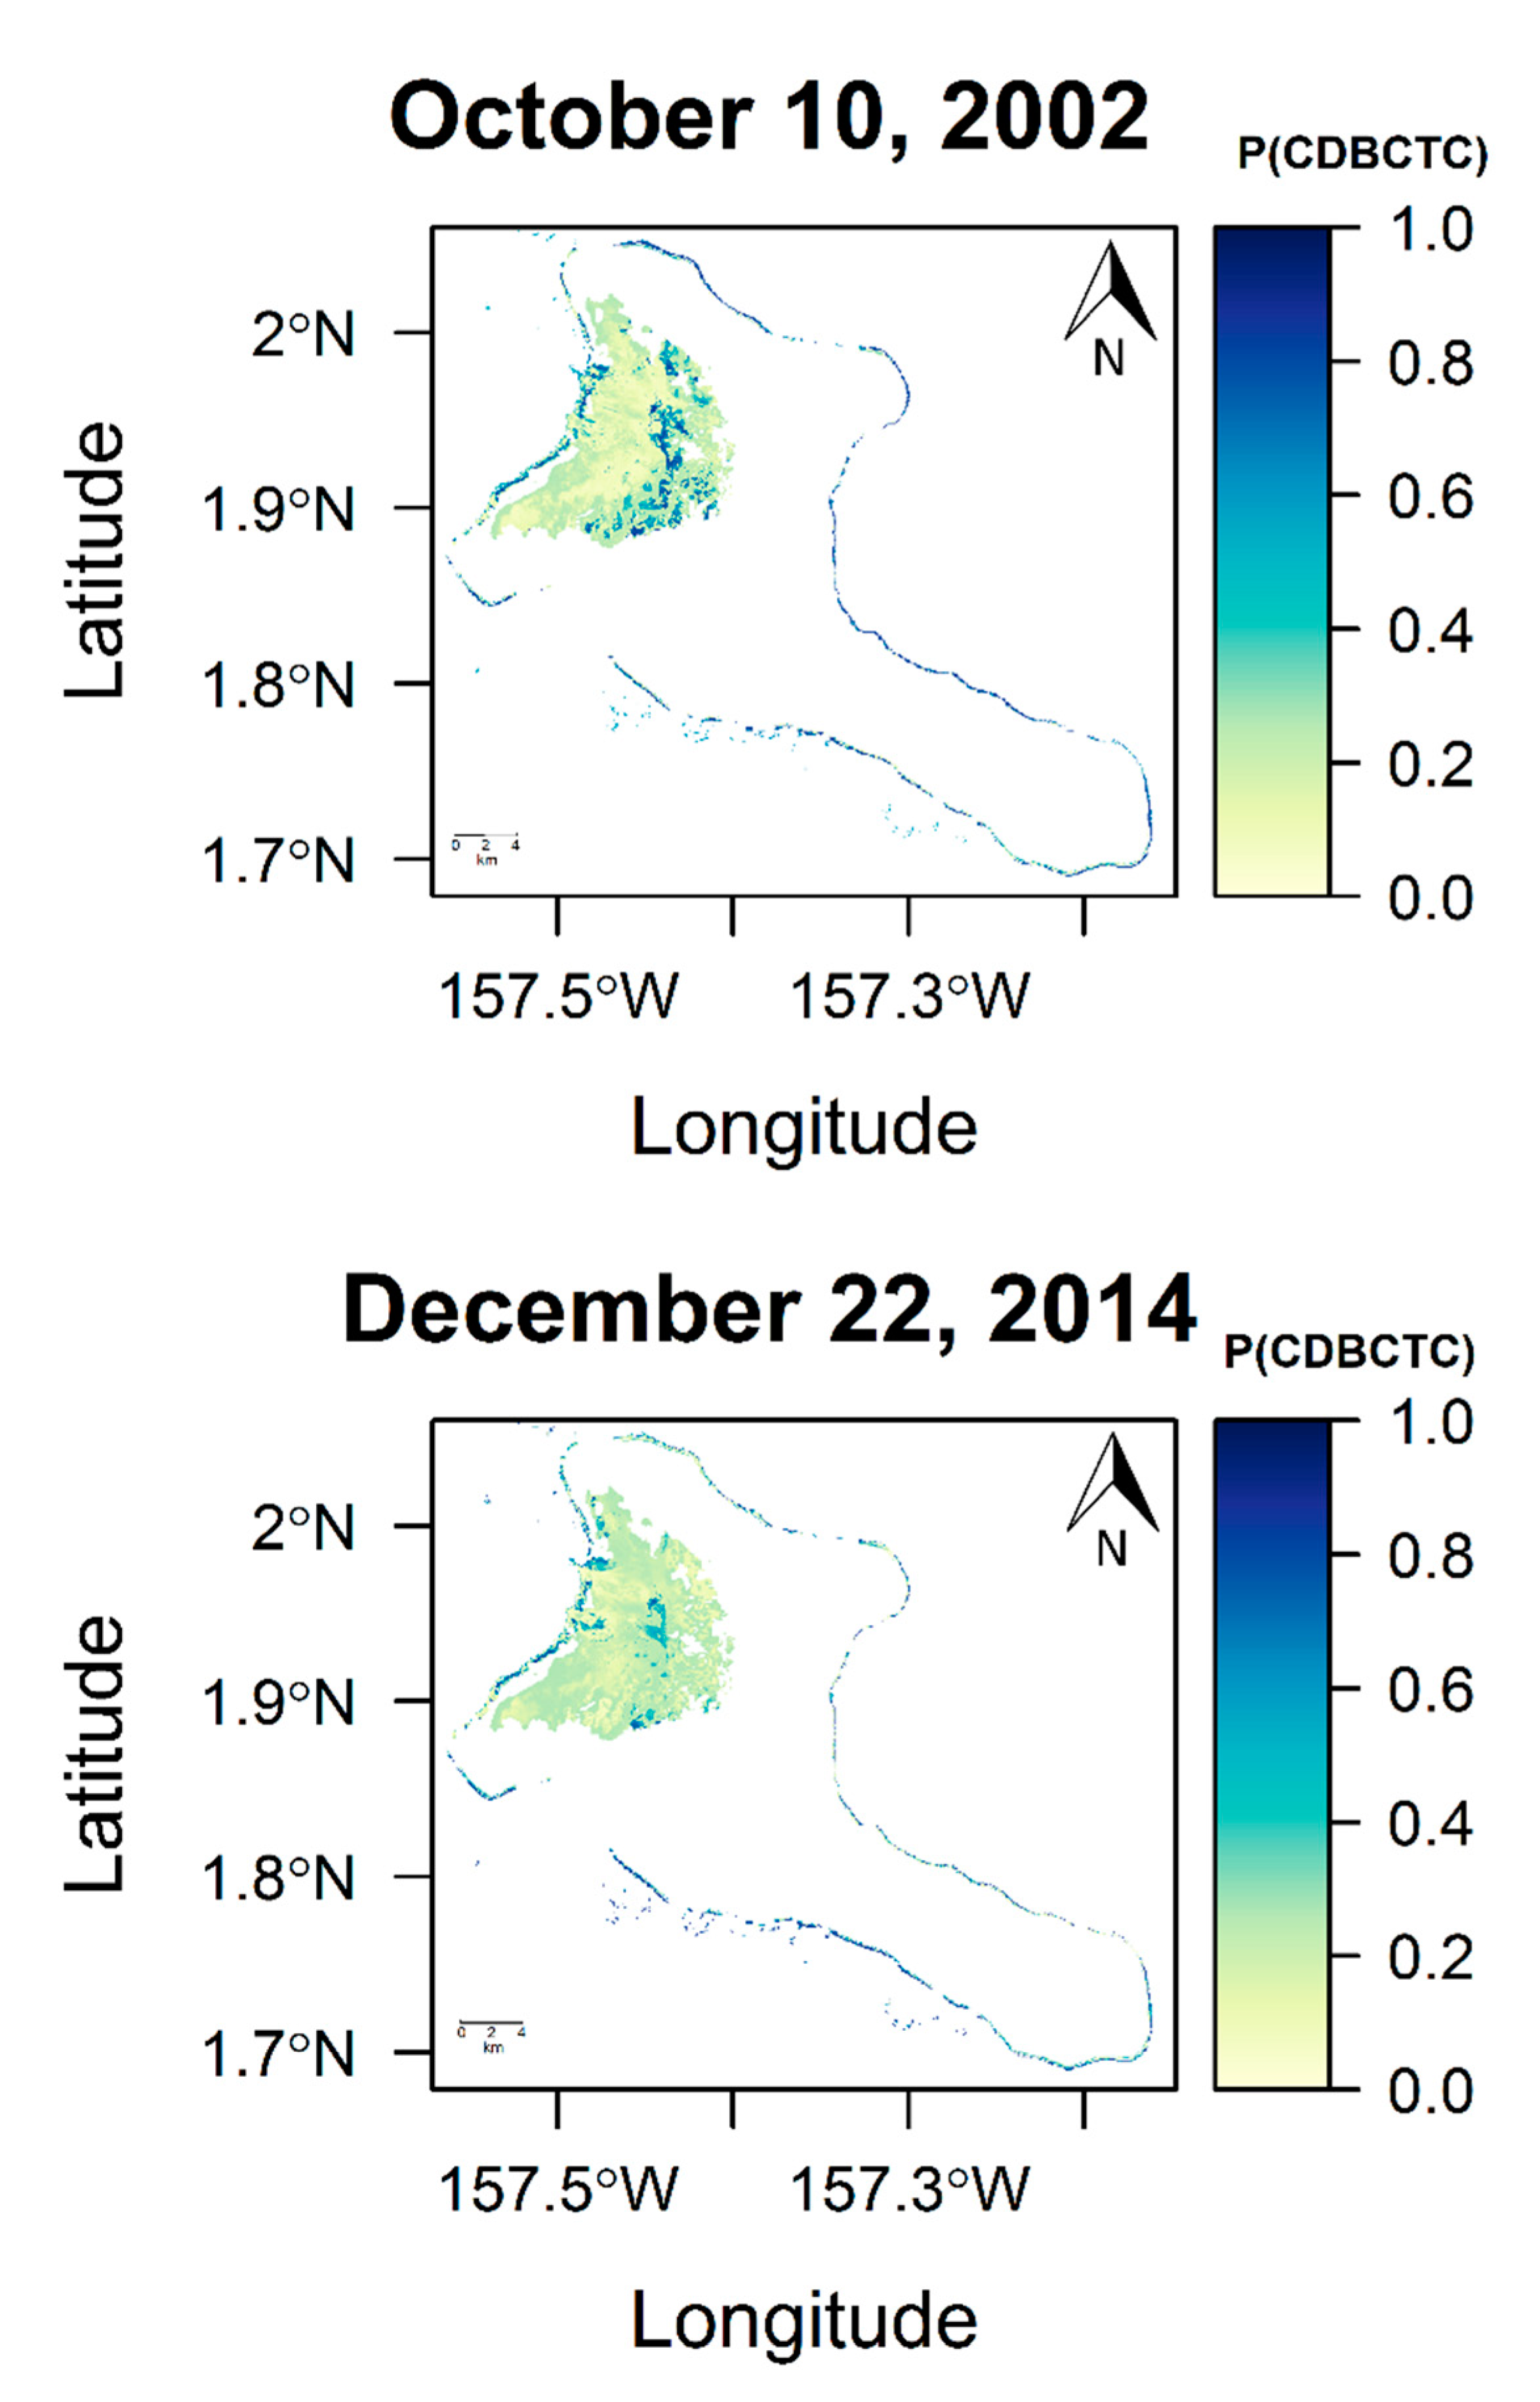
Table 1.
Satellite and ground truth data accuacy assessment.
| Site | Ground Truth Observation Period | Landsat 8 Image Capture Date | Difference |
|---|---|---|---|
| Palmyra Atoll | 4/15/15–4/22/15 | 5/27/15 | <2 months |
| Kingman Reef | 4/24/15–4/28/15 | 5/27/15 | <2 months |
| Baker Island Atoll | 2/8/15–2/11/15 | 8/20/14 | <6 months |
| Howland Island | 2/3/15–2/7/15 | 1/18/15 | <1 month |
Table 2.
Satellite Data Summary.
| Site (Figure 1) | Path/Row | Site | Latitude-Longitude | Final State Scene Capture Date | Initial State Scene Capture Date | Area of Interest Size | Number of Ground Truth Observations |
|---|---|---|---|---|---|---|---|
| 1 | 065/056 | Palmyra Atoll | 5°52′N 162°6′W | 5/27/2015 | 1/4/2001 | 22 × 7-km | 82 |
| 2 | 065/056 | Kingman Reef | 6°23′N 162°25′W | 5/27/2015 | 1/4/2001 | 19 × 11-km | 57 |
| 3 | 073/060 | Baker Island Atoll | 0°12′N 176°29′W | 8/20/2014 | 1/15/2002 | 9 × 8-km | 26 |
| 4 | 074/059 | Howland Island | 0°48′N 176°37′W | 1/18/2015 | 1/19/2001 | 5 × 5-km | 30 |
| 5 | 063/057 | Tabuaeran Island | 3°51′N 159°21′W | 2/3/2014 | 8/31/2000 | 20 × 18-km | NA |
| 6 | 061/059 | Kiritimati Island | 1°40′N 158°30′W | 12/22/2014 | 10/10/2002 | 47 × 42-km | NA |
Table 3.
SVM classifier performance assessment by site.
| Palmyra Atoll | Kingman Reef | Baker Island Atoll | Howland Island | |
|---|---|---|---|---|
| Accuracy | 87.9% | 85.7% | 69.2% | 82.1% |
| Precision | 0.837 | 0.824 | 0.706 | 0.813 |
| Recall | 1.000 | 1.000 | 0.800 | 0.867 |
| Specificity | 0.680 | 0.571 | 0.546 | 0.769 |
| F-measure | 0.911 | 0.903 | 0.750 | 0.839 |
Table 4.
Confusion matrix by site and the consolidated sodel.
| Ground Truth Labels | |||
|---|---|---|---|
| Coral | Not Coral | ||
| Predicted Class | Palmyra Atoll | ||
| Coral | 41 | 8 | |
| Not Coral | 0 | 17 | |
| Kingman Reef | |||
| Coral | 28 | 6 | |
| Not Coral | 0 | 8 | |
| Baker Island Atoll | |||
| Coral | 12 | 5 | |
| Not Coral | 3 | 6 | |
| Howland Island | |||
| Coral | 13 | 3 | |
| Not Coral | 2 | 10 | |
| Consolidated Sites | |||
| Coral | 91 | 32 | |
| Not Coral | 8 | 31 | |
Table 5.
Controlled Parameter Cross-Validation (CPCV) procedure results by site.
| Palmyra Atoll | Kingman Reef | Baker Island Atoll | Howland Island | Consolidated Sites | |
|---|---|---|---|---|---|
| Accuracy | 78.8% | 81.0% | 65.4% | 67.9% | 75.3% |
| Precision | 0.776 | 0.813 | 0.625 | 0.750 | 0.740 |
| Recall | 0.927 | 0.929 | 1.000 | 0.600 | 0.919 |
| Specificity | 0.560 | 0.571 | 0.182 | 0.769 | 0.492 |
| F-measure | 0.844 | 0.867 | 0.769 | 0.667 | 0.820 |
Table 6.
Change Detection Analysis by Site.
| Initial Class (Pixel Count) | Initial Class | ||||
|---|---|---|---|---|---|
| Coral | Not Coral | Coral | Not Coral | ||
| Final Class | Palmyra Atoll | Palmyra Atoll | |||
| Coral | 14,242 | 2168 | 12.82 | 1.95 | |
| Not Coral | 9850 | 19,395 | 8.87 | 17.46 | |
| Kingman Reef | Kingman Reef | ||||
| Coral | 23,642 | 1218 | 21.28 | 1.10 | |
| Not Coral | 9652 | 4627 | 8.69 | 4.16 | |
| Baker Island Atoll | Baker Island Atoll | ||||
| Coral | 154 | 126 | 0.14 | 0.11 | |
| Not Coral | 311 | 1520 | 0.28 | 1.37 | |
| Howland Island | Howland Island | ||||
| Coral | 94 | 94 | 0.08 | 0.08 | |
| Not Coral | 158 | 828 | 0.14 | 0.75 | |
| Tabuaeran Island | Tabuaeran Island | ||||
| Coral | 1544 | 1754 | 1.39 | 1.58 | |
| Not Coral | 3545 | 87,888 | 3.19 | 79.10 | |
| Kiritimati Island | Kiritimati Island | ||||
| Coral | 13,290 | 3514 | 11.96 | 3.16 | |
| Not Coral | 16,013 | 120,105 | 14.41 | 108.53 | |
Table 7.
Classification accuracy of select additional learning algorithms.
| Palmyra Atoll | Kingman Reef | Baker Island Atoll | Howland Island | Consolidated Sites | |
|---|---|---|---|---|---|
| LASSO Regression | 67.7% | 68.3% | 56.0% | 51.9% | 64.6% |
| Ridge Regression | 67.7% | 68.3% | 56.0% | 51.9% | 64.6% |
| Logistic Regression | 78.5% | 82.3% | 61.5% | 71.4% | 72.7% |
| QDA | 76.9% | 78.0% | 61.5% | 64.3% | 73.3% |
© 2019 by the authors. Licensee MDPI, Basel, Switzerland. This article is an open access article distributed under the terms and conditions of the Creative Commons Attribution (CC BY) license (http://creativecommons.org/licenses/by/4.0/).
Share and Cite
MDPI and ACS Style
Gapper, J.J.; El-Askary, H.; Linstead, E.; Piechota, T. Coral Reef Change Detection in Remote Pacific Islands Using Support Vector Machine Classifiers. Remote Sens. 2019, 11, 1525. https://0-doi-org.brum.beds.ac.uk/10.3390/rs11131525
AMA Style
Gapper JJ, El-Askary H, Linstead E, Piechota T. Coral Reef Change Detection in Remote Pacific Islands Using Support Vector Machine Classifiers. Remote Sensing. 2019; 11(13):1525. https://0-doi-org.brum.beds.ac.uk/10.3390/rs11131525
Chicago/Turabian StyleGapper, Justin J., Hesham El-Askary, Erik Linstead, and Thomas Piechota. 2019. "Coral Reef Change Detection in Remote Pacific Islands Using Support Vector Machine Classifiers" Remote Sensing 11, no. 13: 1525. https://0-doi-org.brum.beds.ac.uk/10.3390/rs11131525
Note that from the first issue of 2016, this journal uses article numbers instead of page numbers. See further details here.