Assimilating Soil Moisture Retrieved from Sentinel-1 and Sentinel-2 Data into WOFOST Model to Improve Winter Wheat Yield Estimation

 , , ,
, , ,
Abstract
:
1. Introduction
2. Materials and Methods
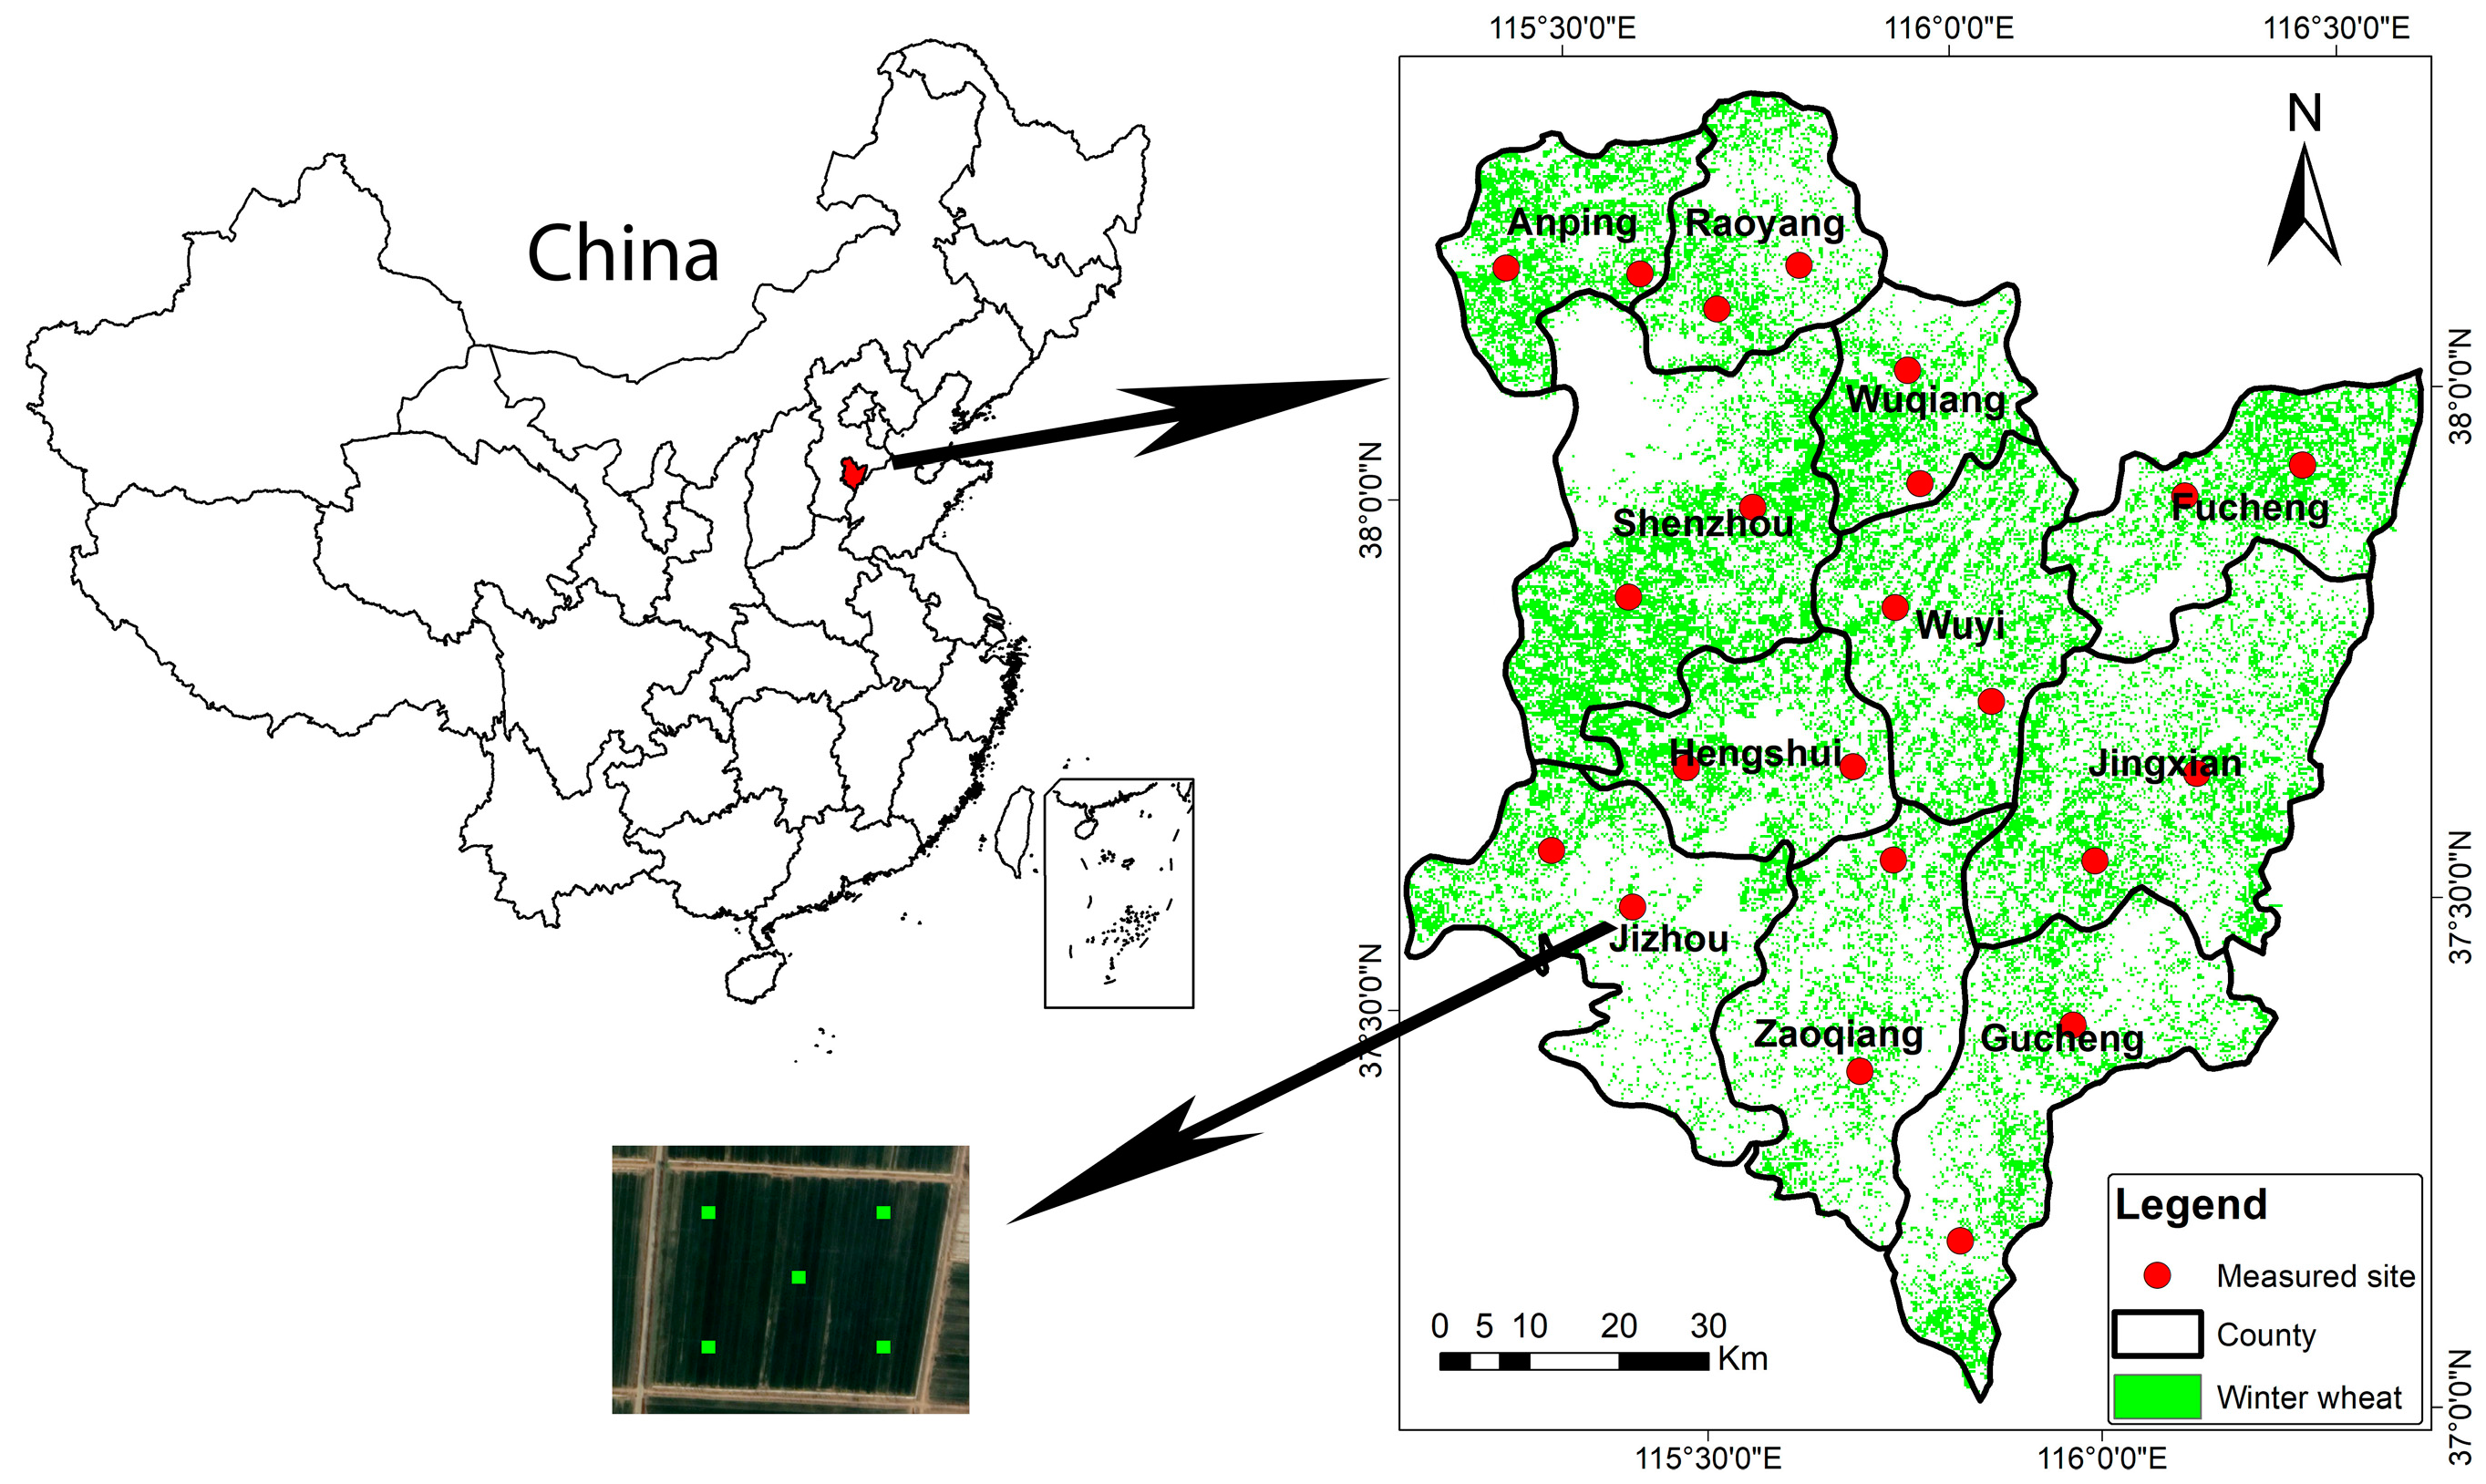
2.1. Study Area
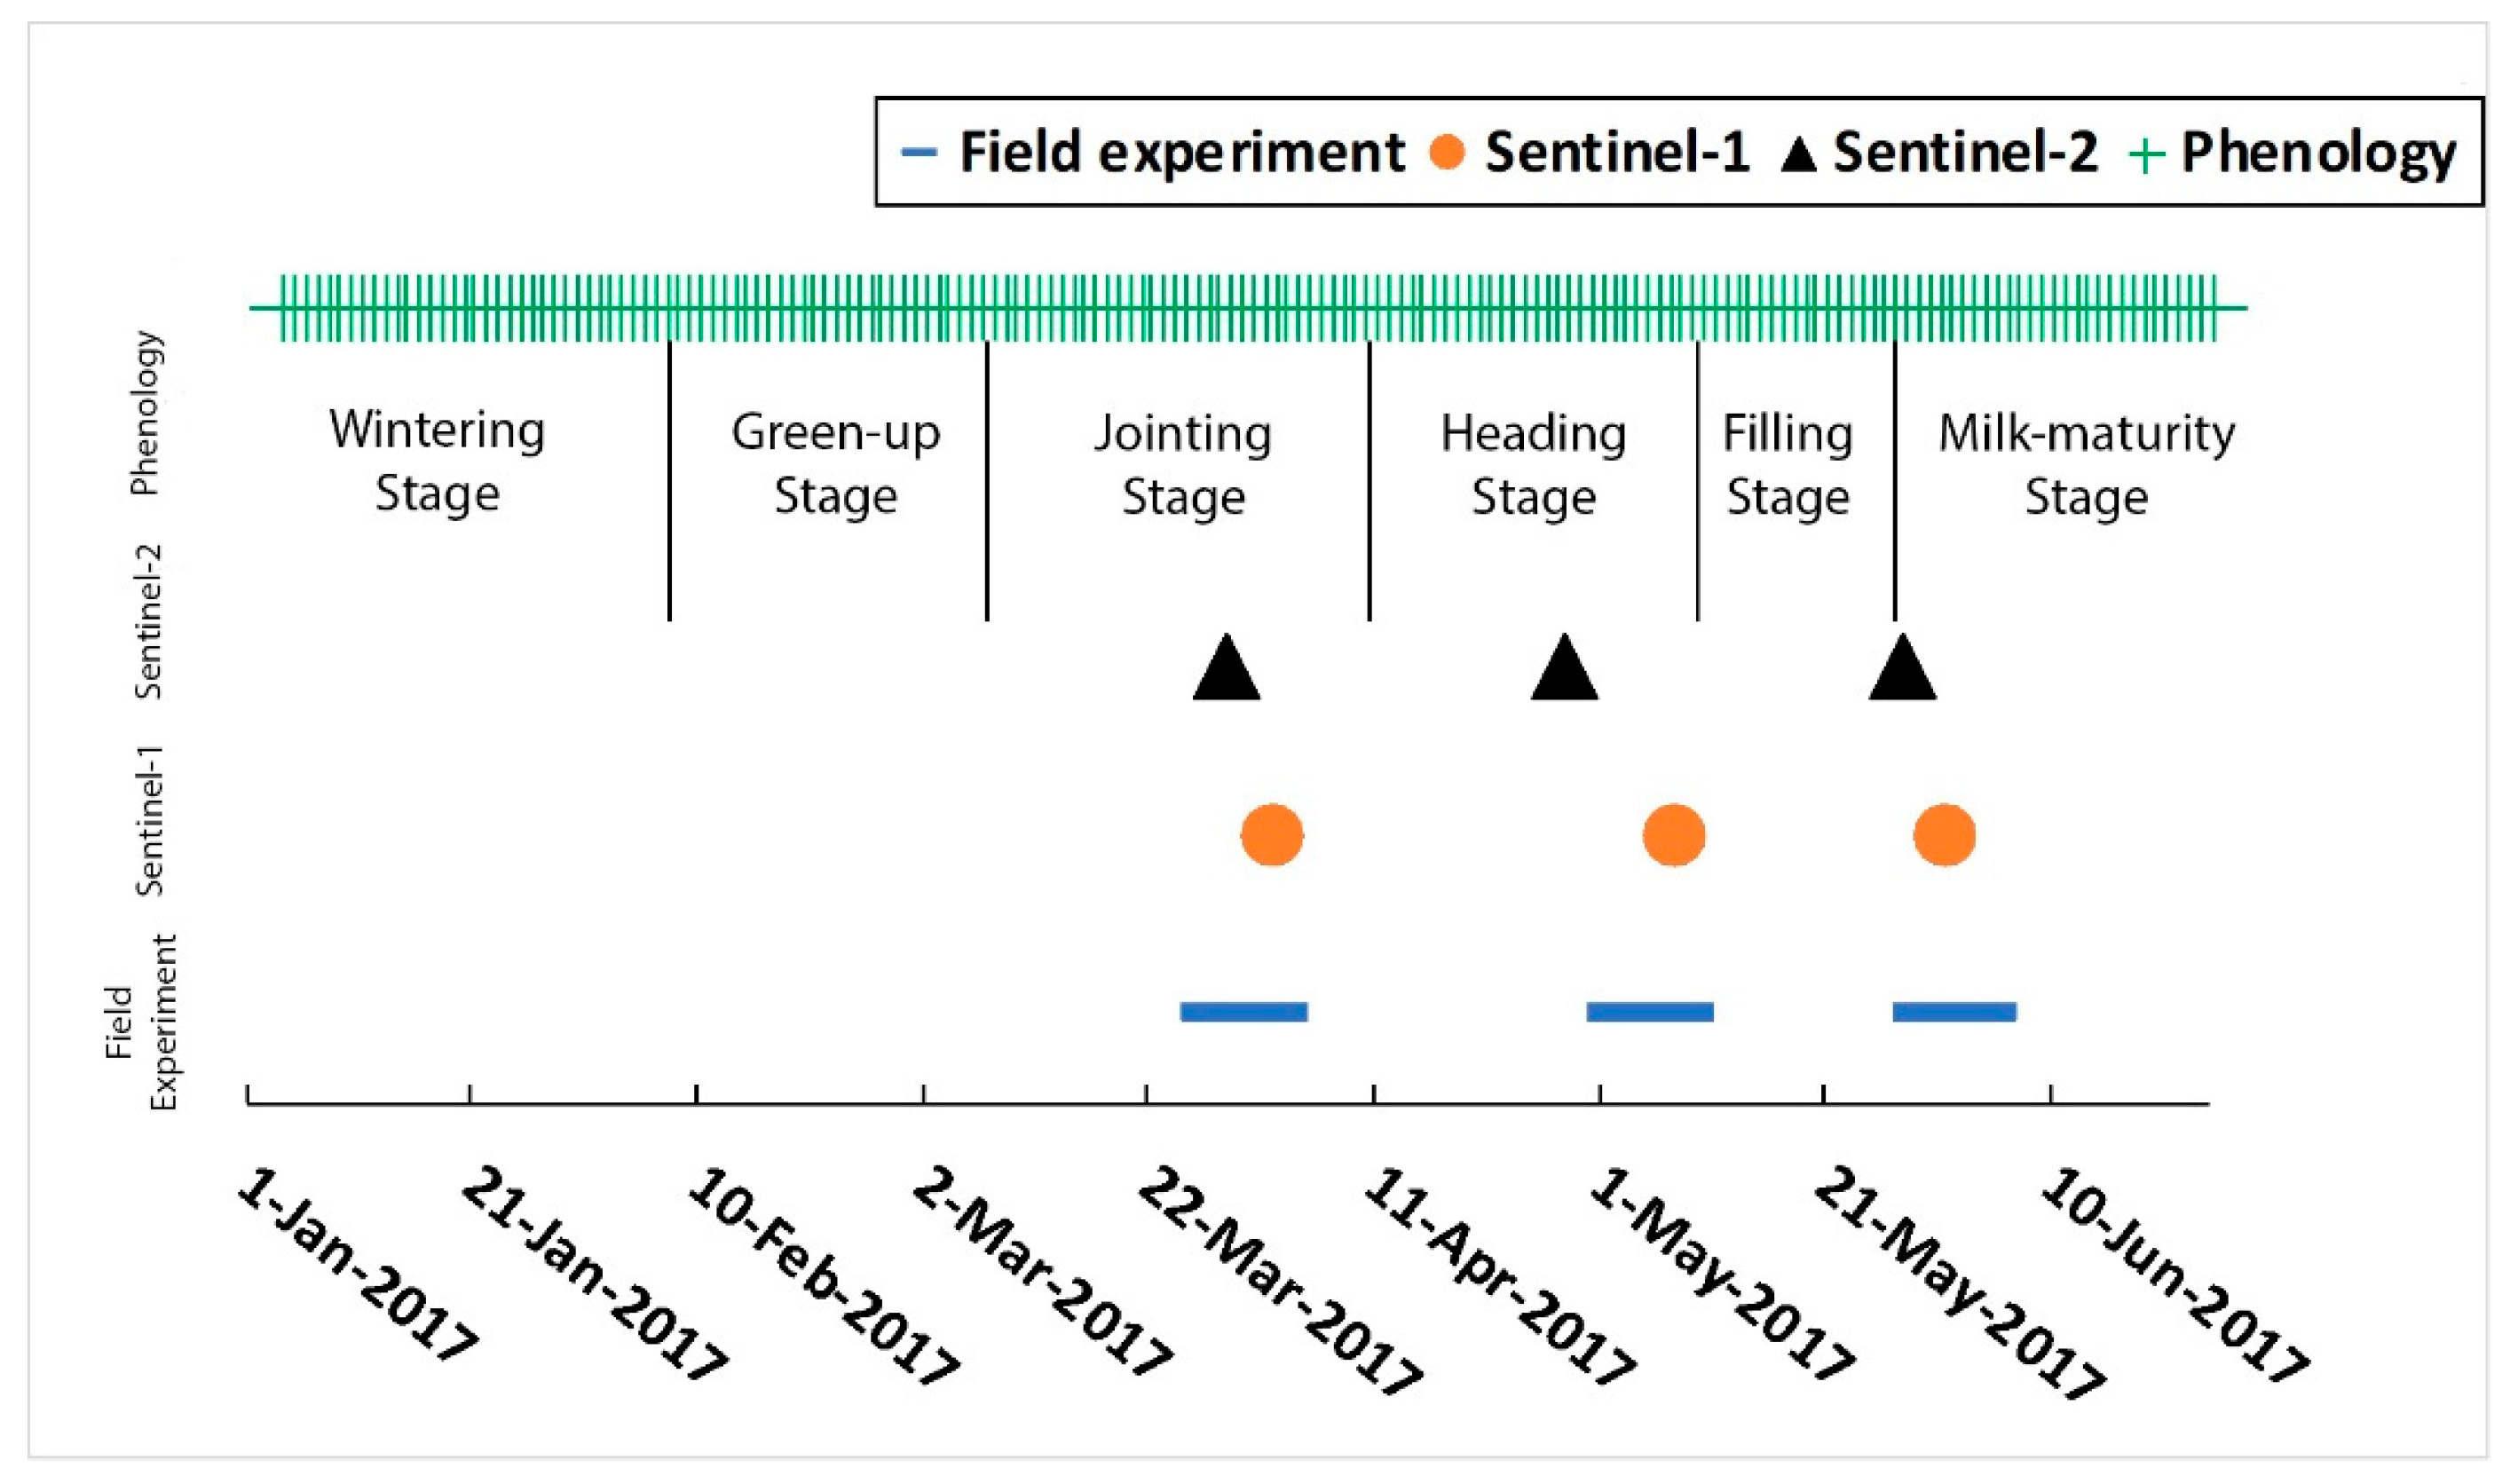
2.2. Data
2.3. Water Cloud Model
2.4. WOFOST Model
2.5. The Ensemble Kalman Filter
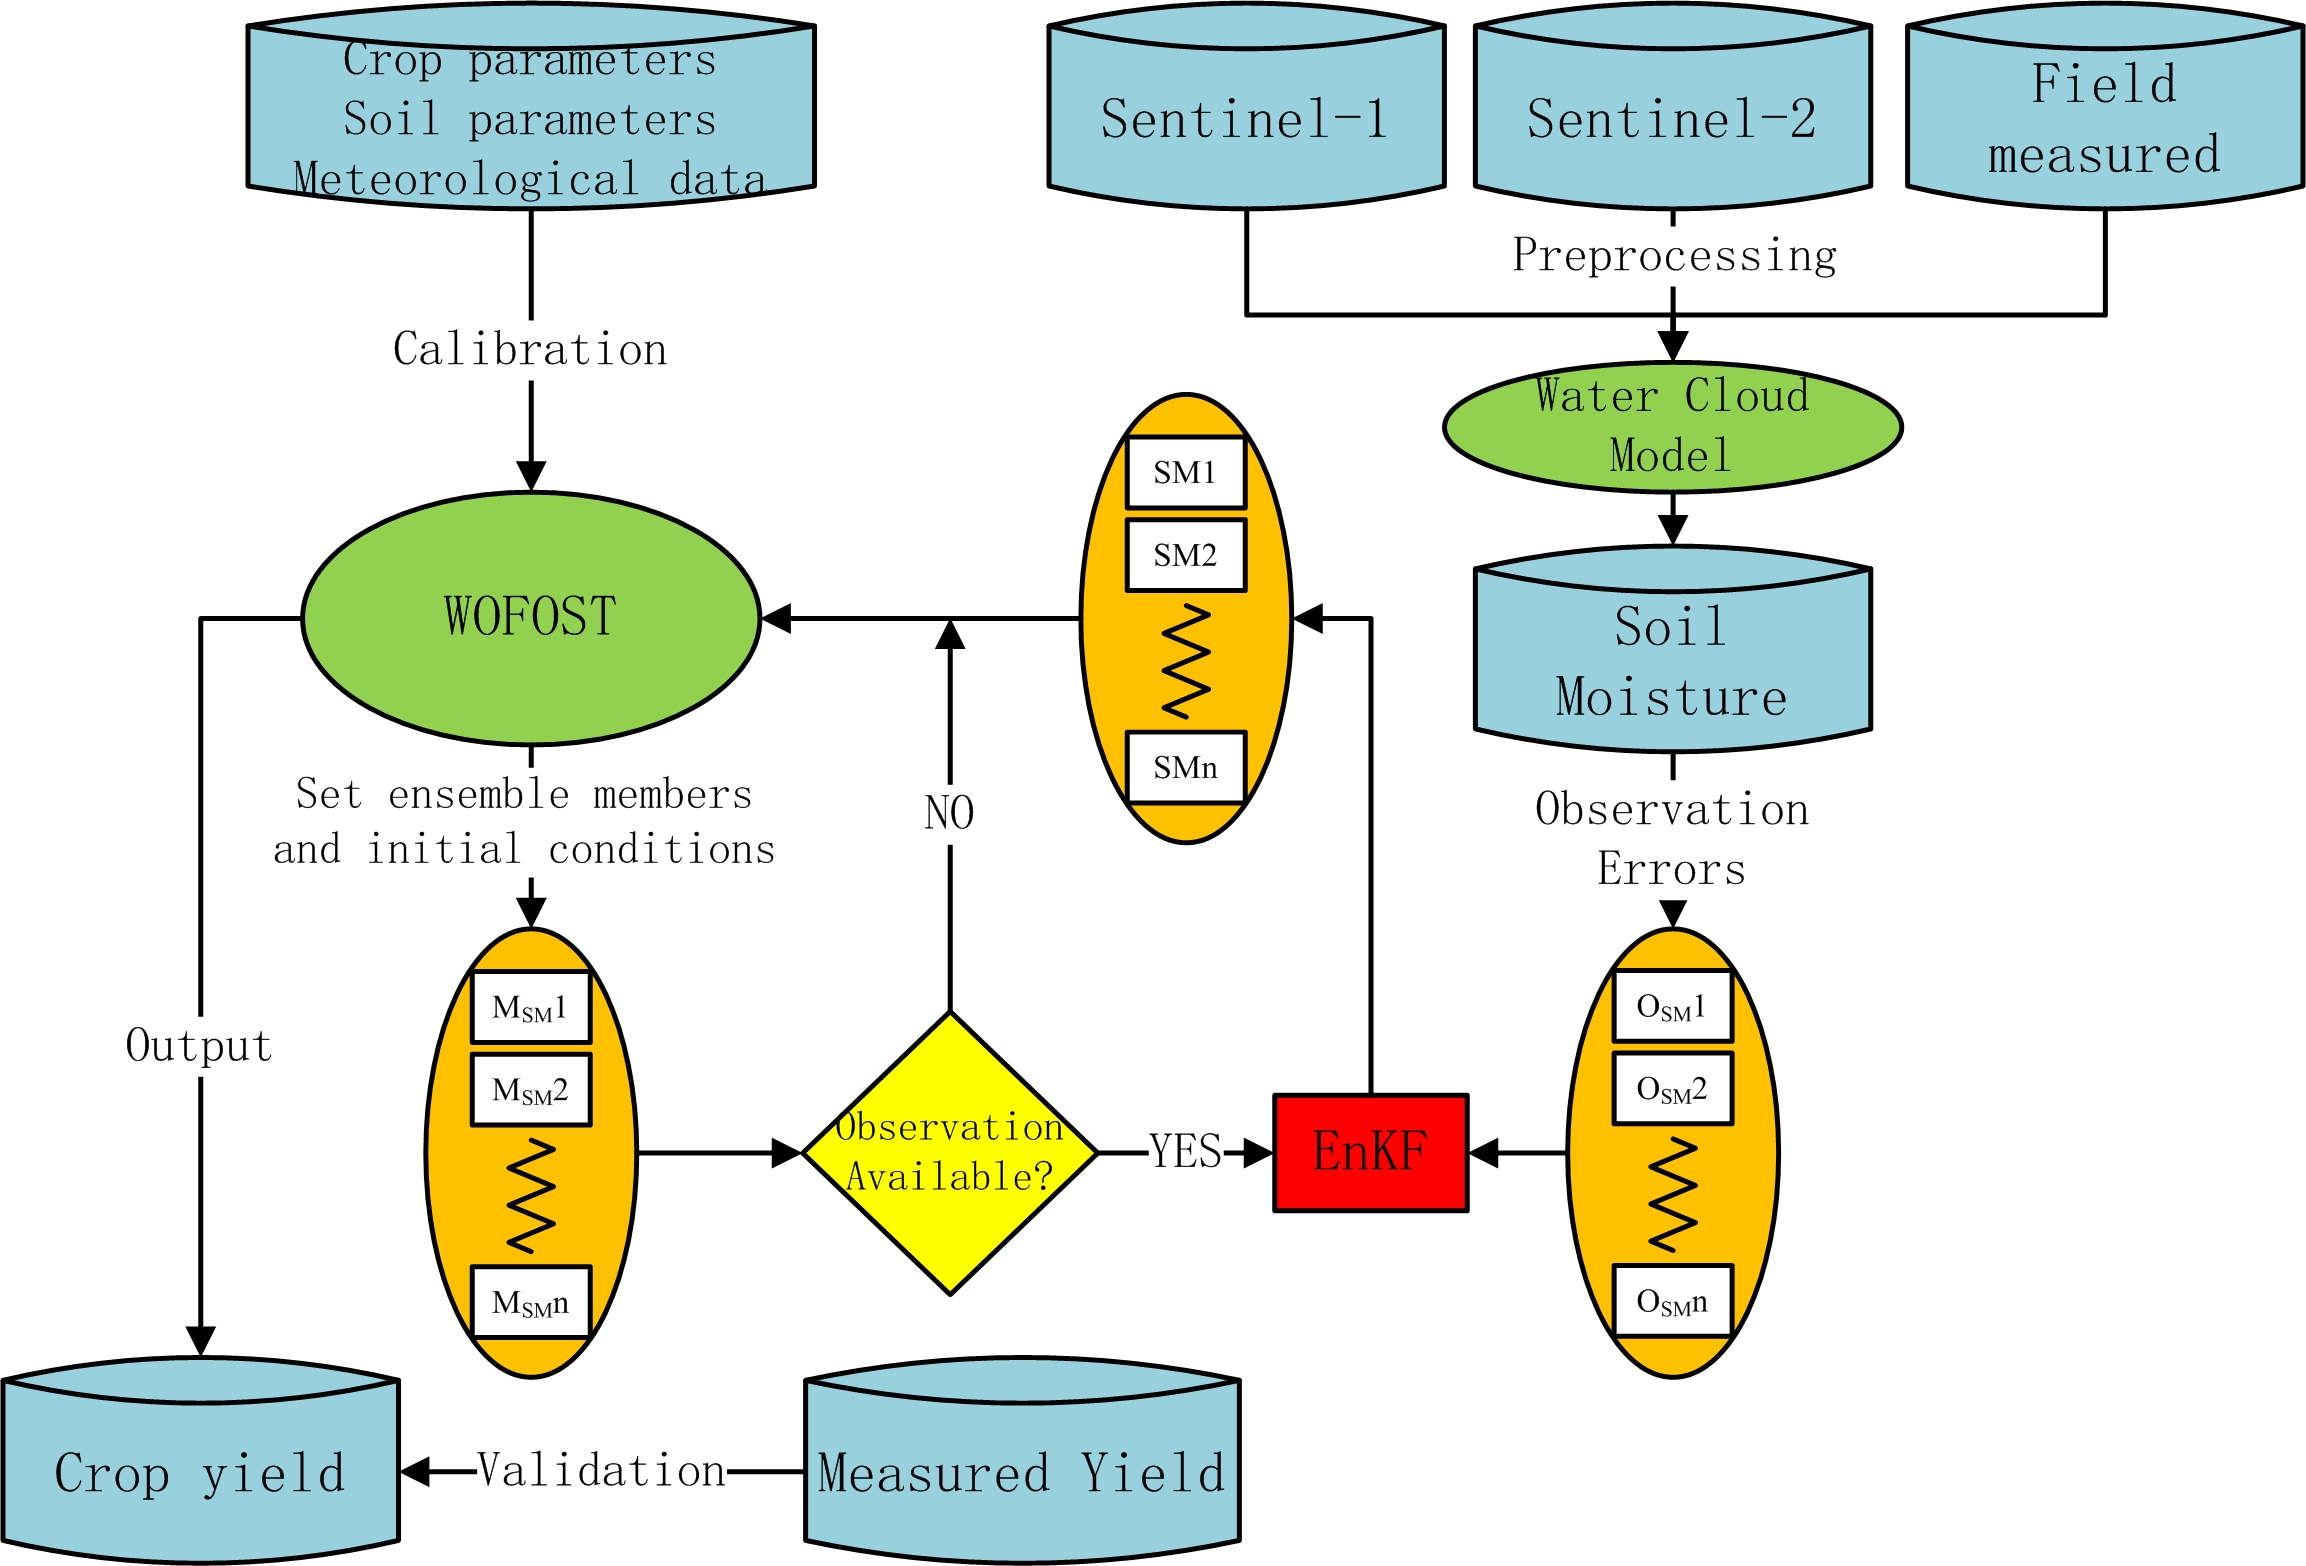
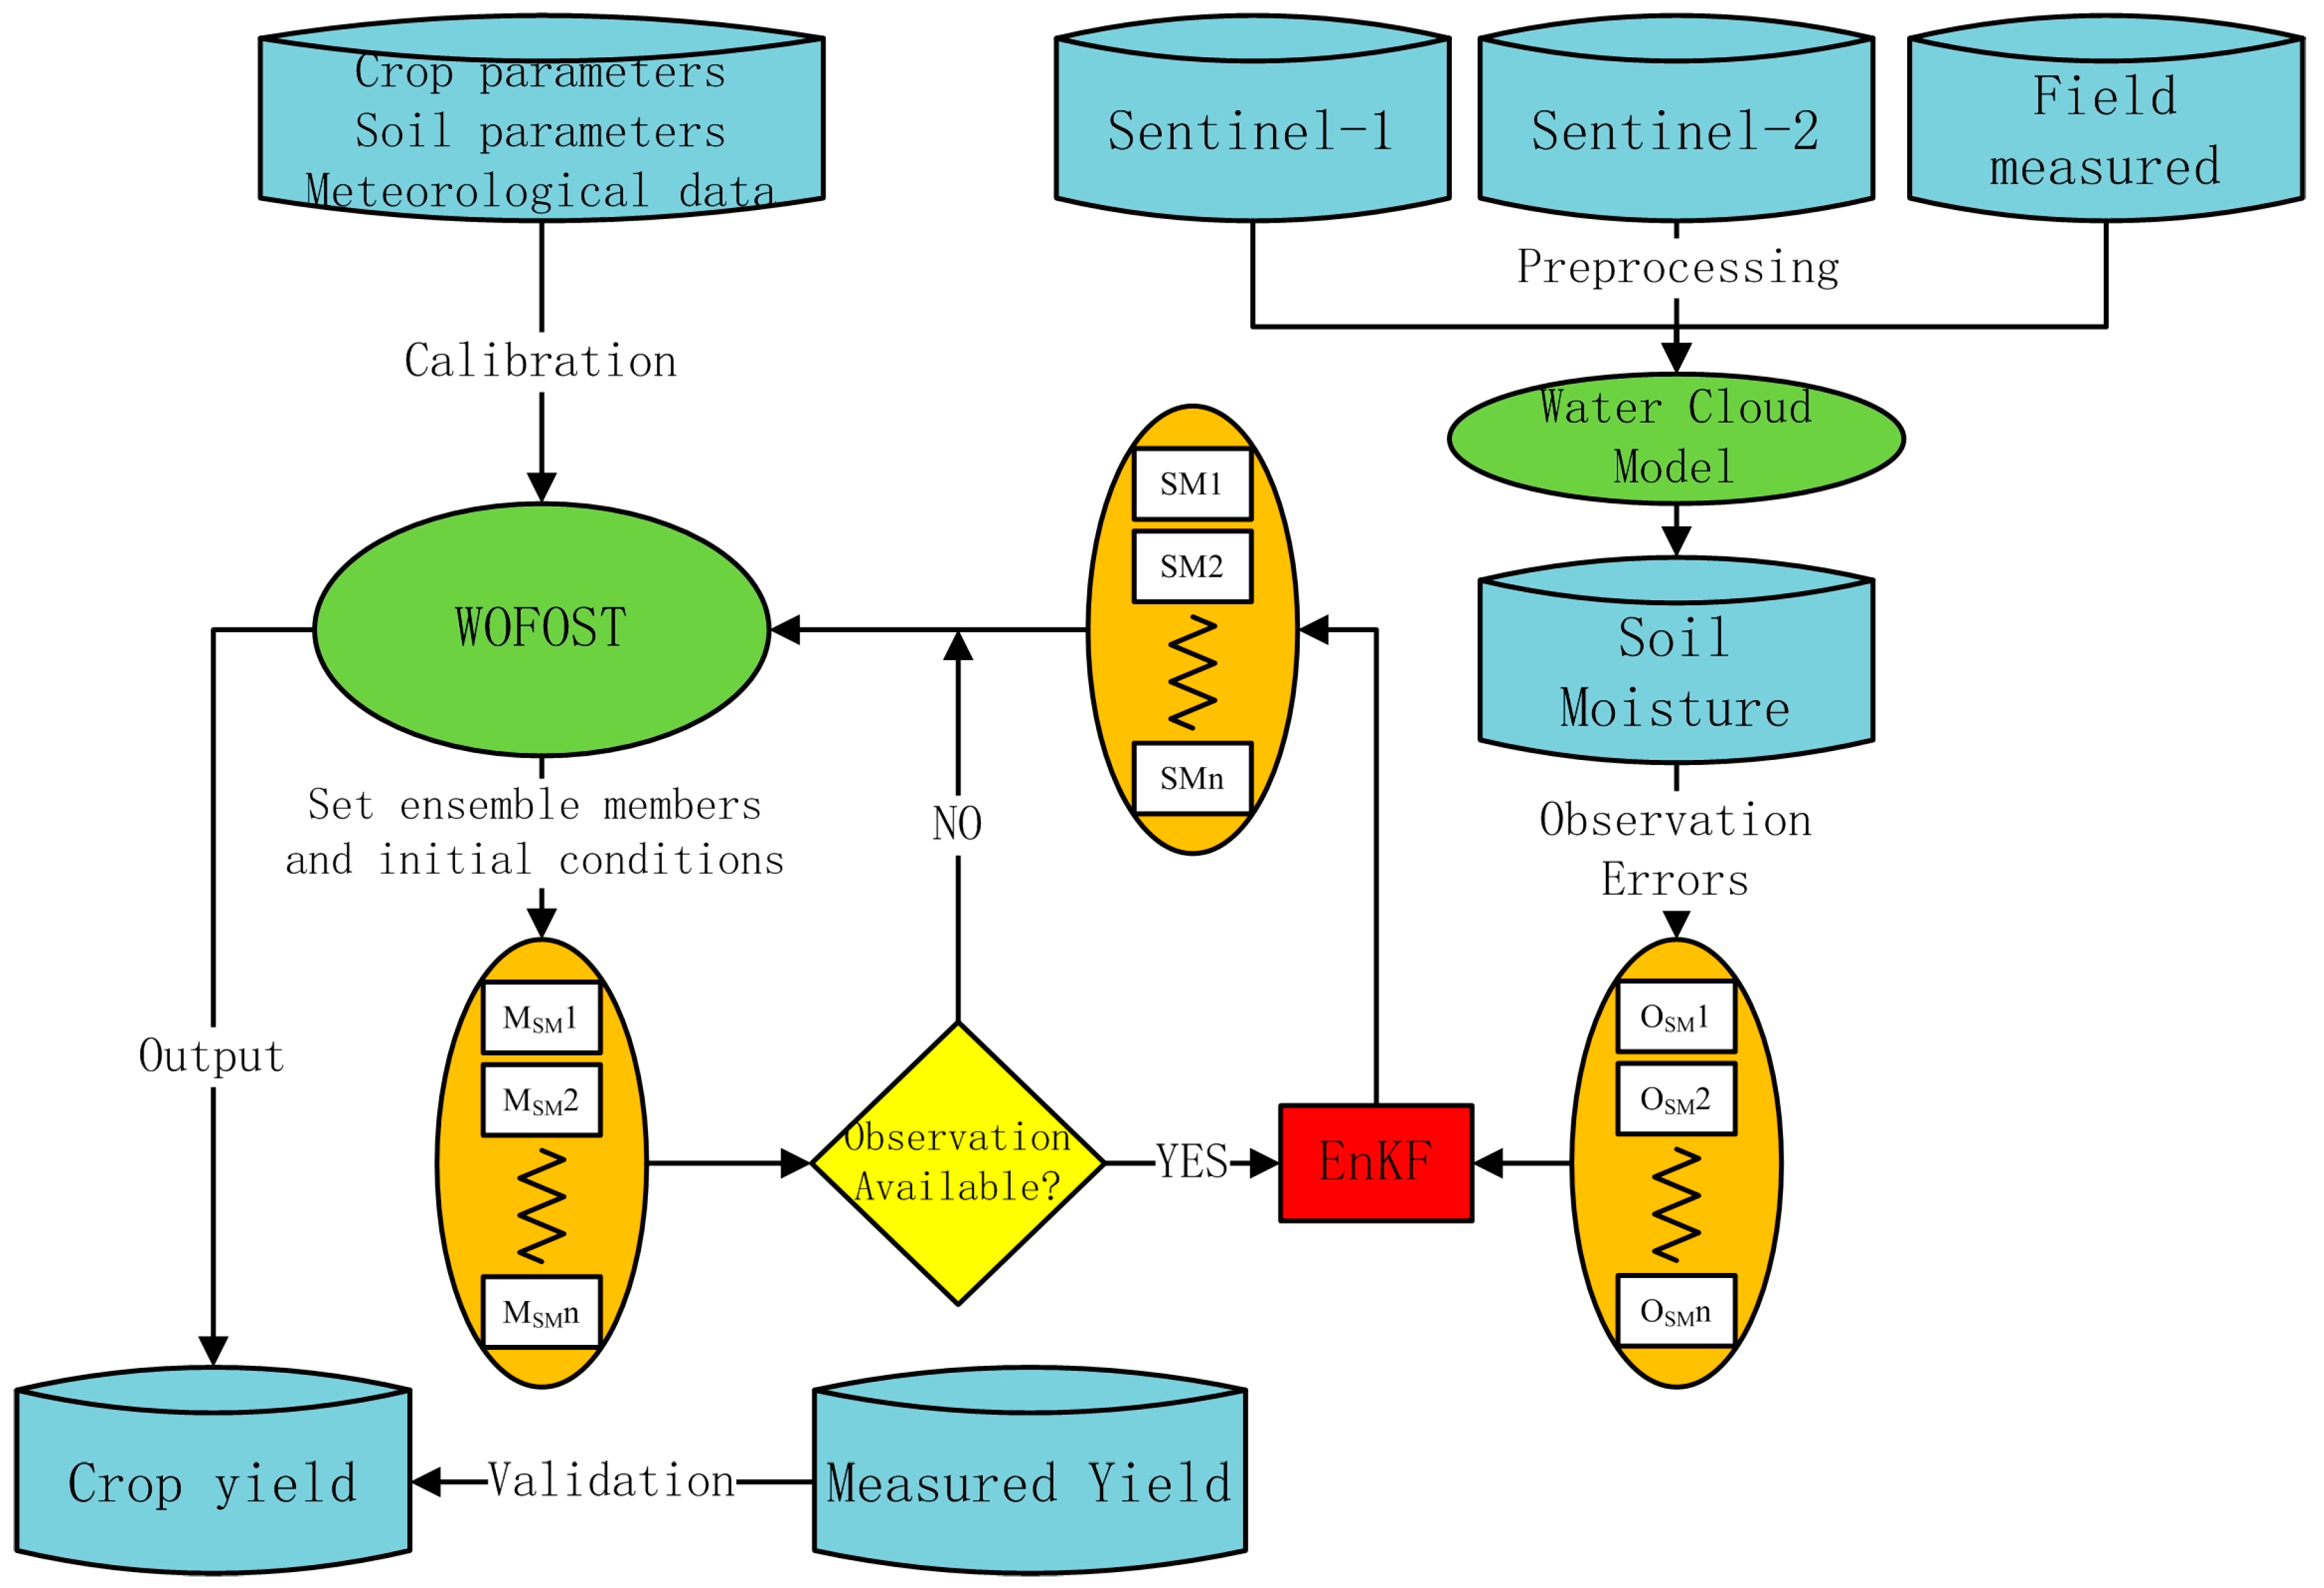
2.6. Crop Modeling-Data Assimilation Framework
3. Results
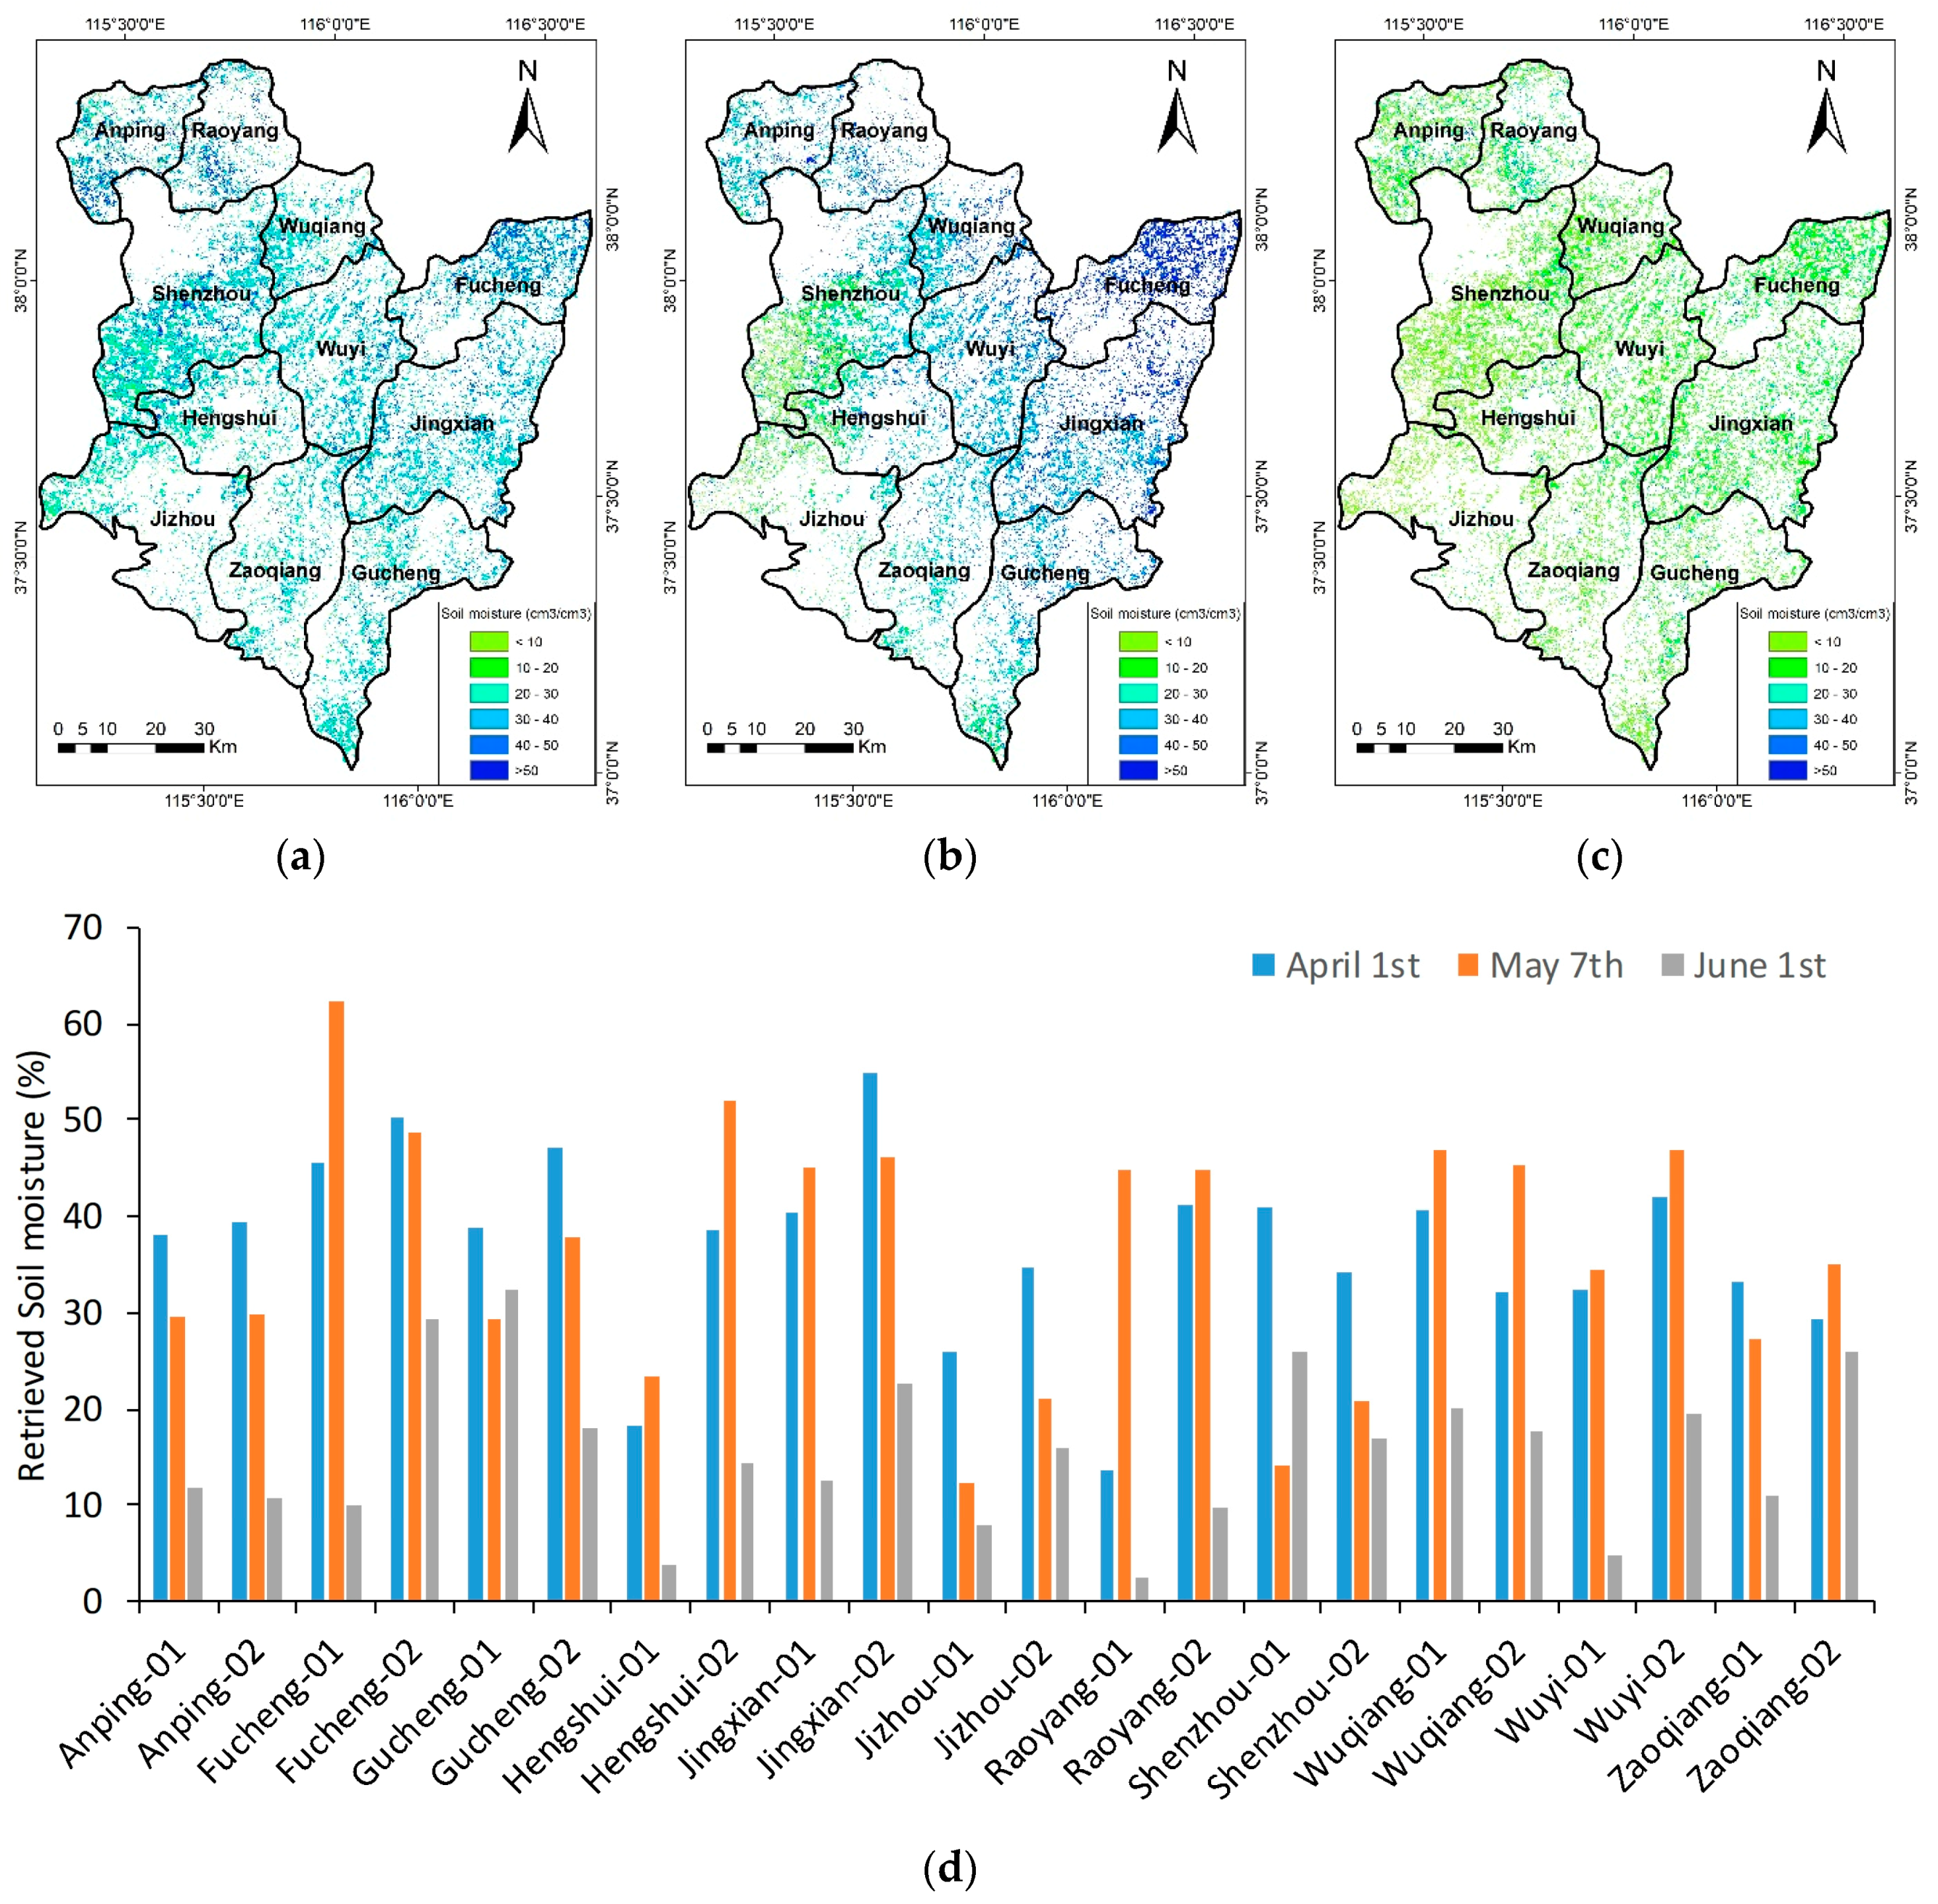
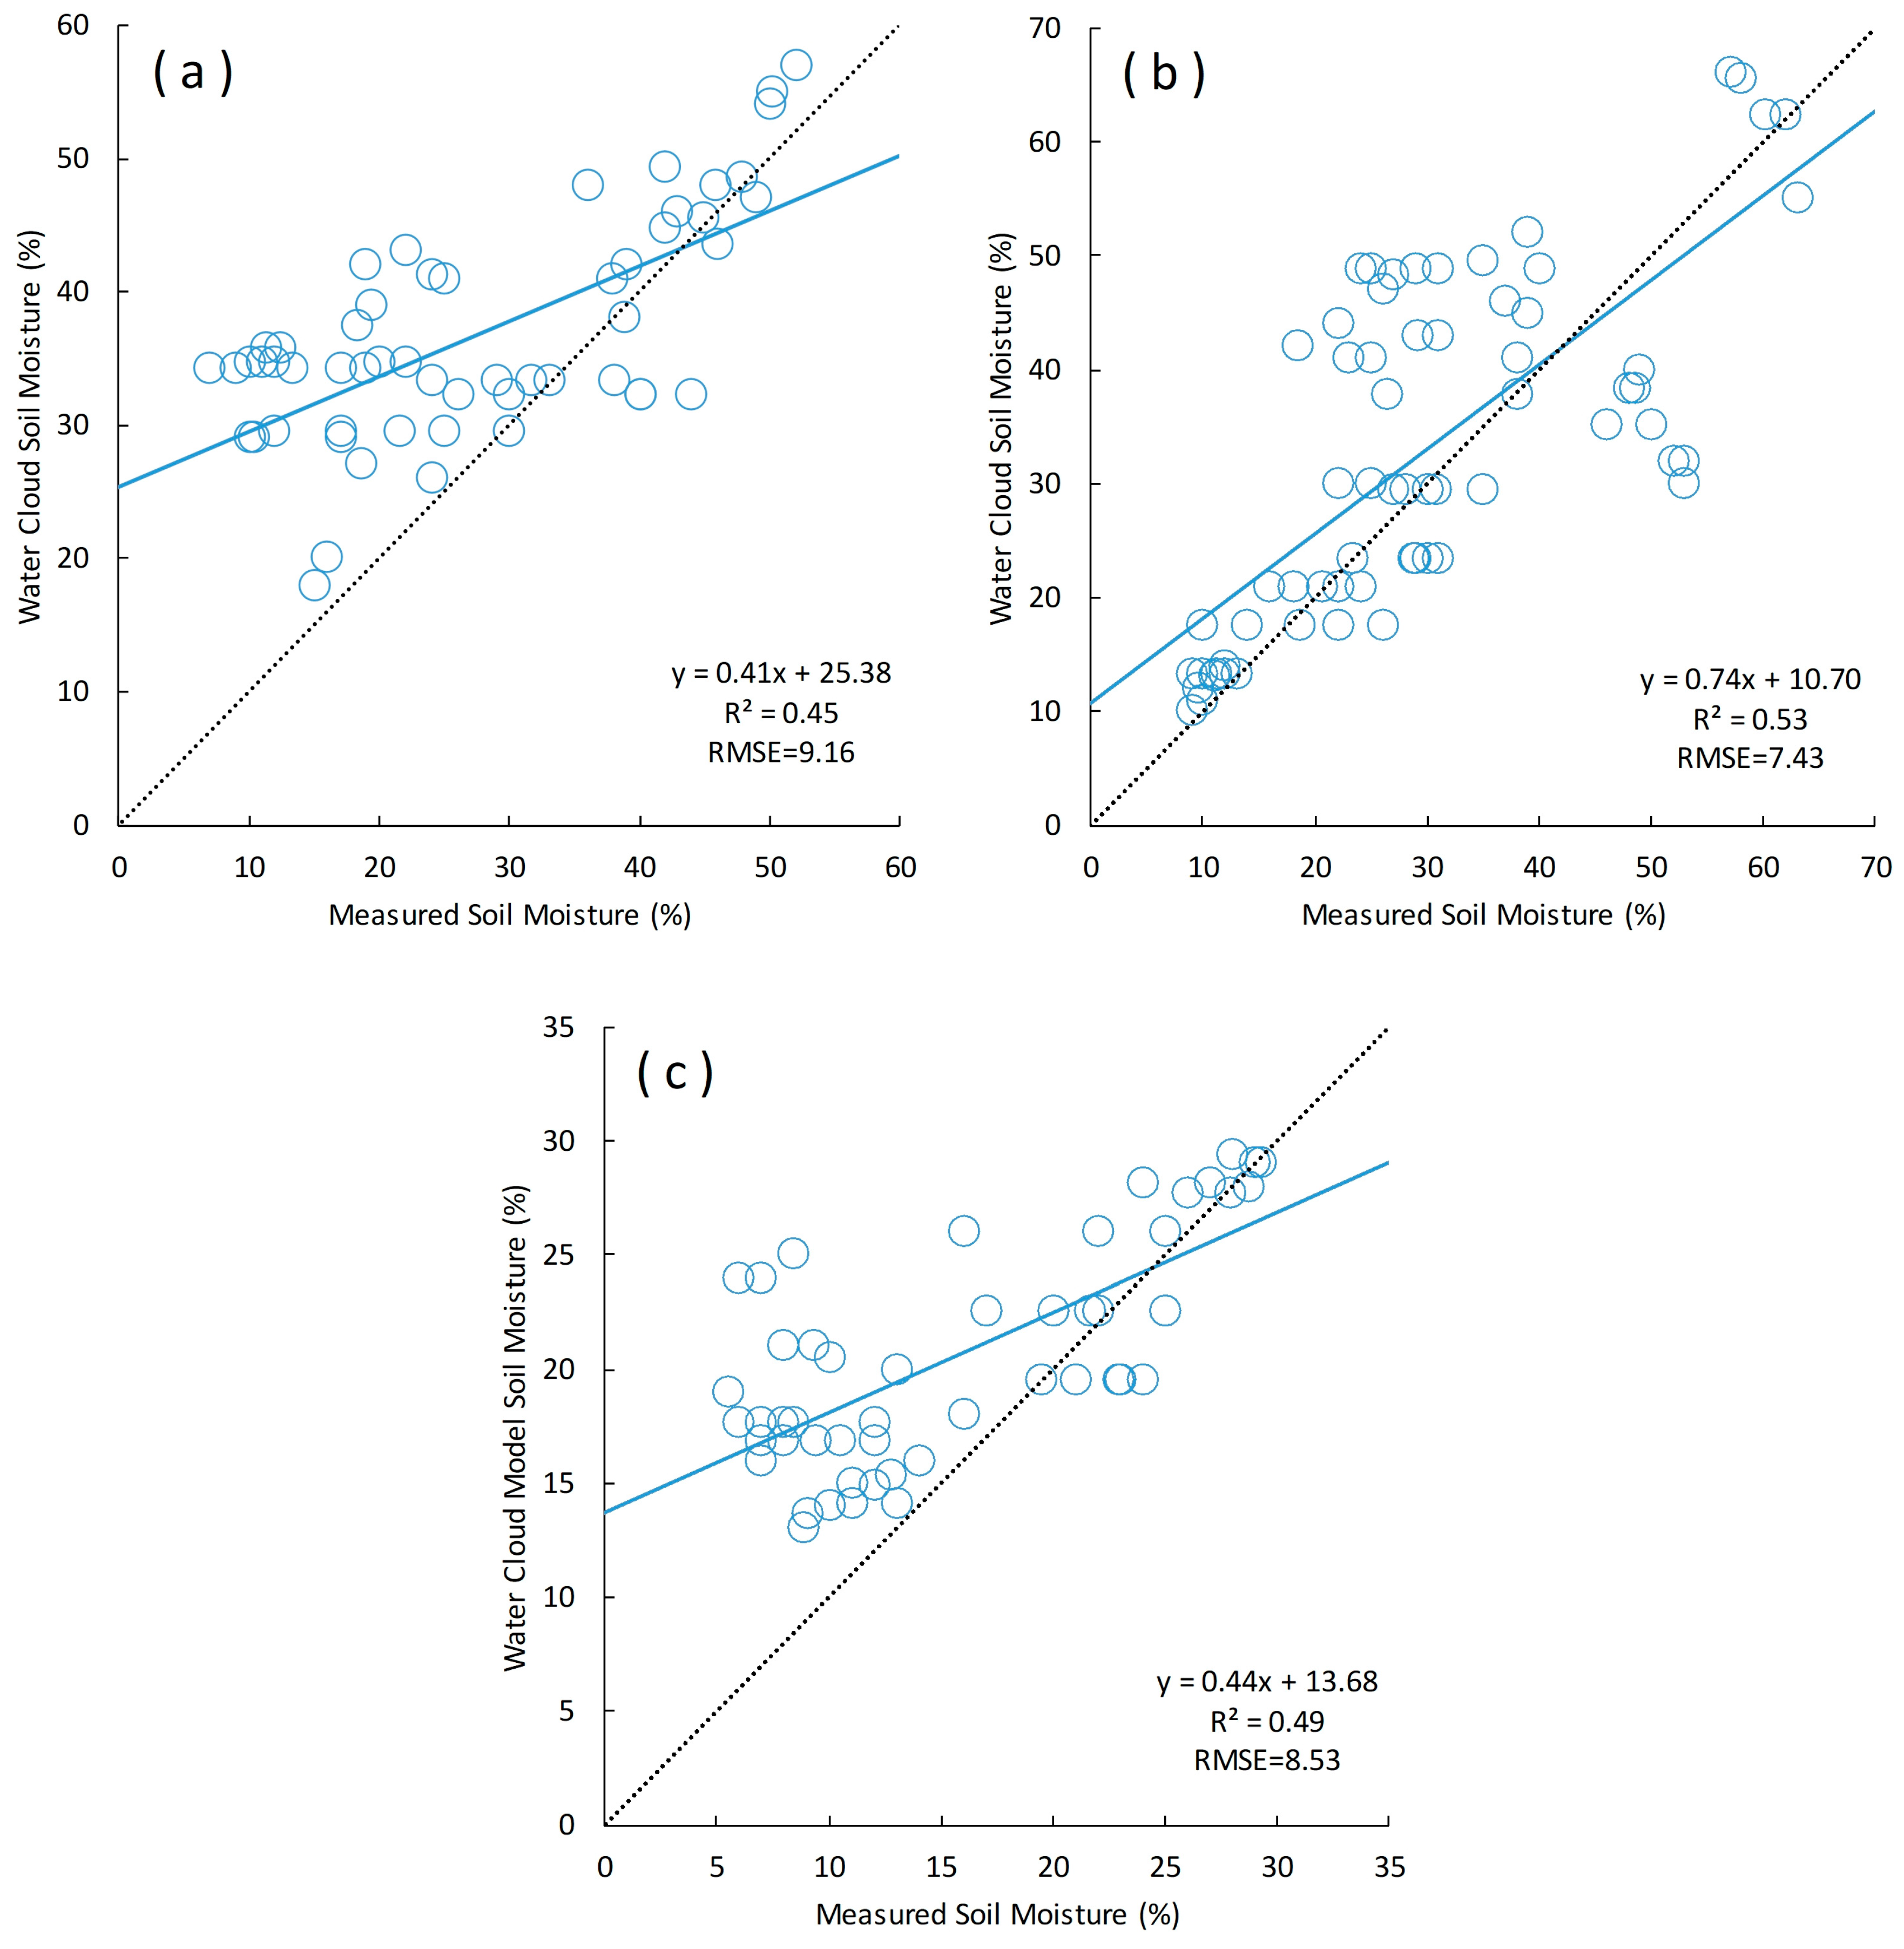
3.1. Spatial-Temporal Dynamics of Soil Moisture from Inversion of the Water Cloud Model
3.2. Simulation of Soil Moisture with the Water-Limited Mode of the WOFOST Model
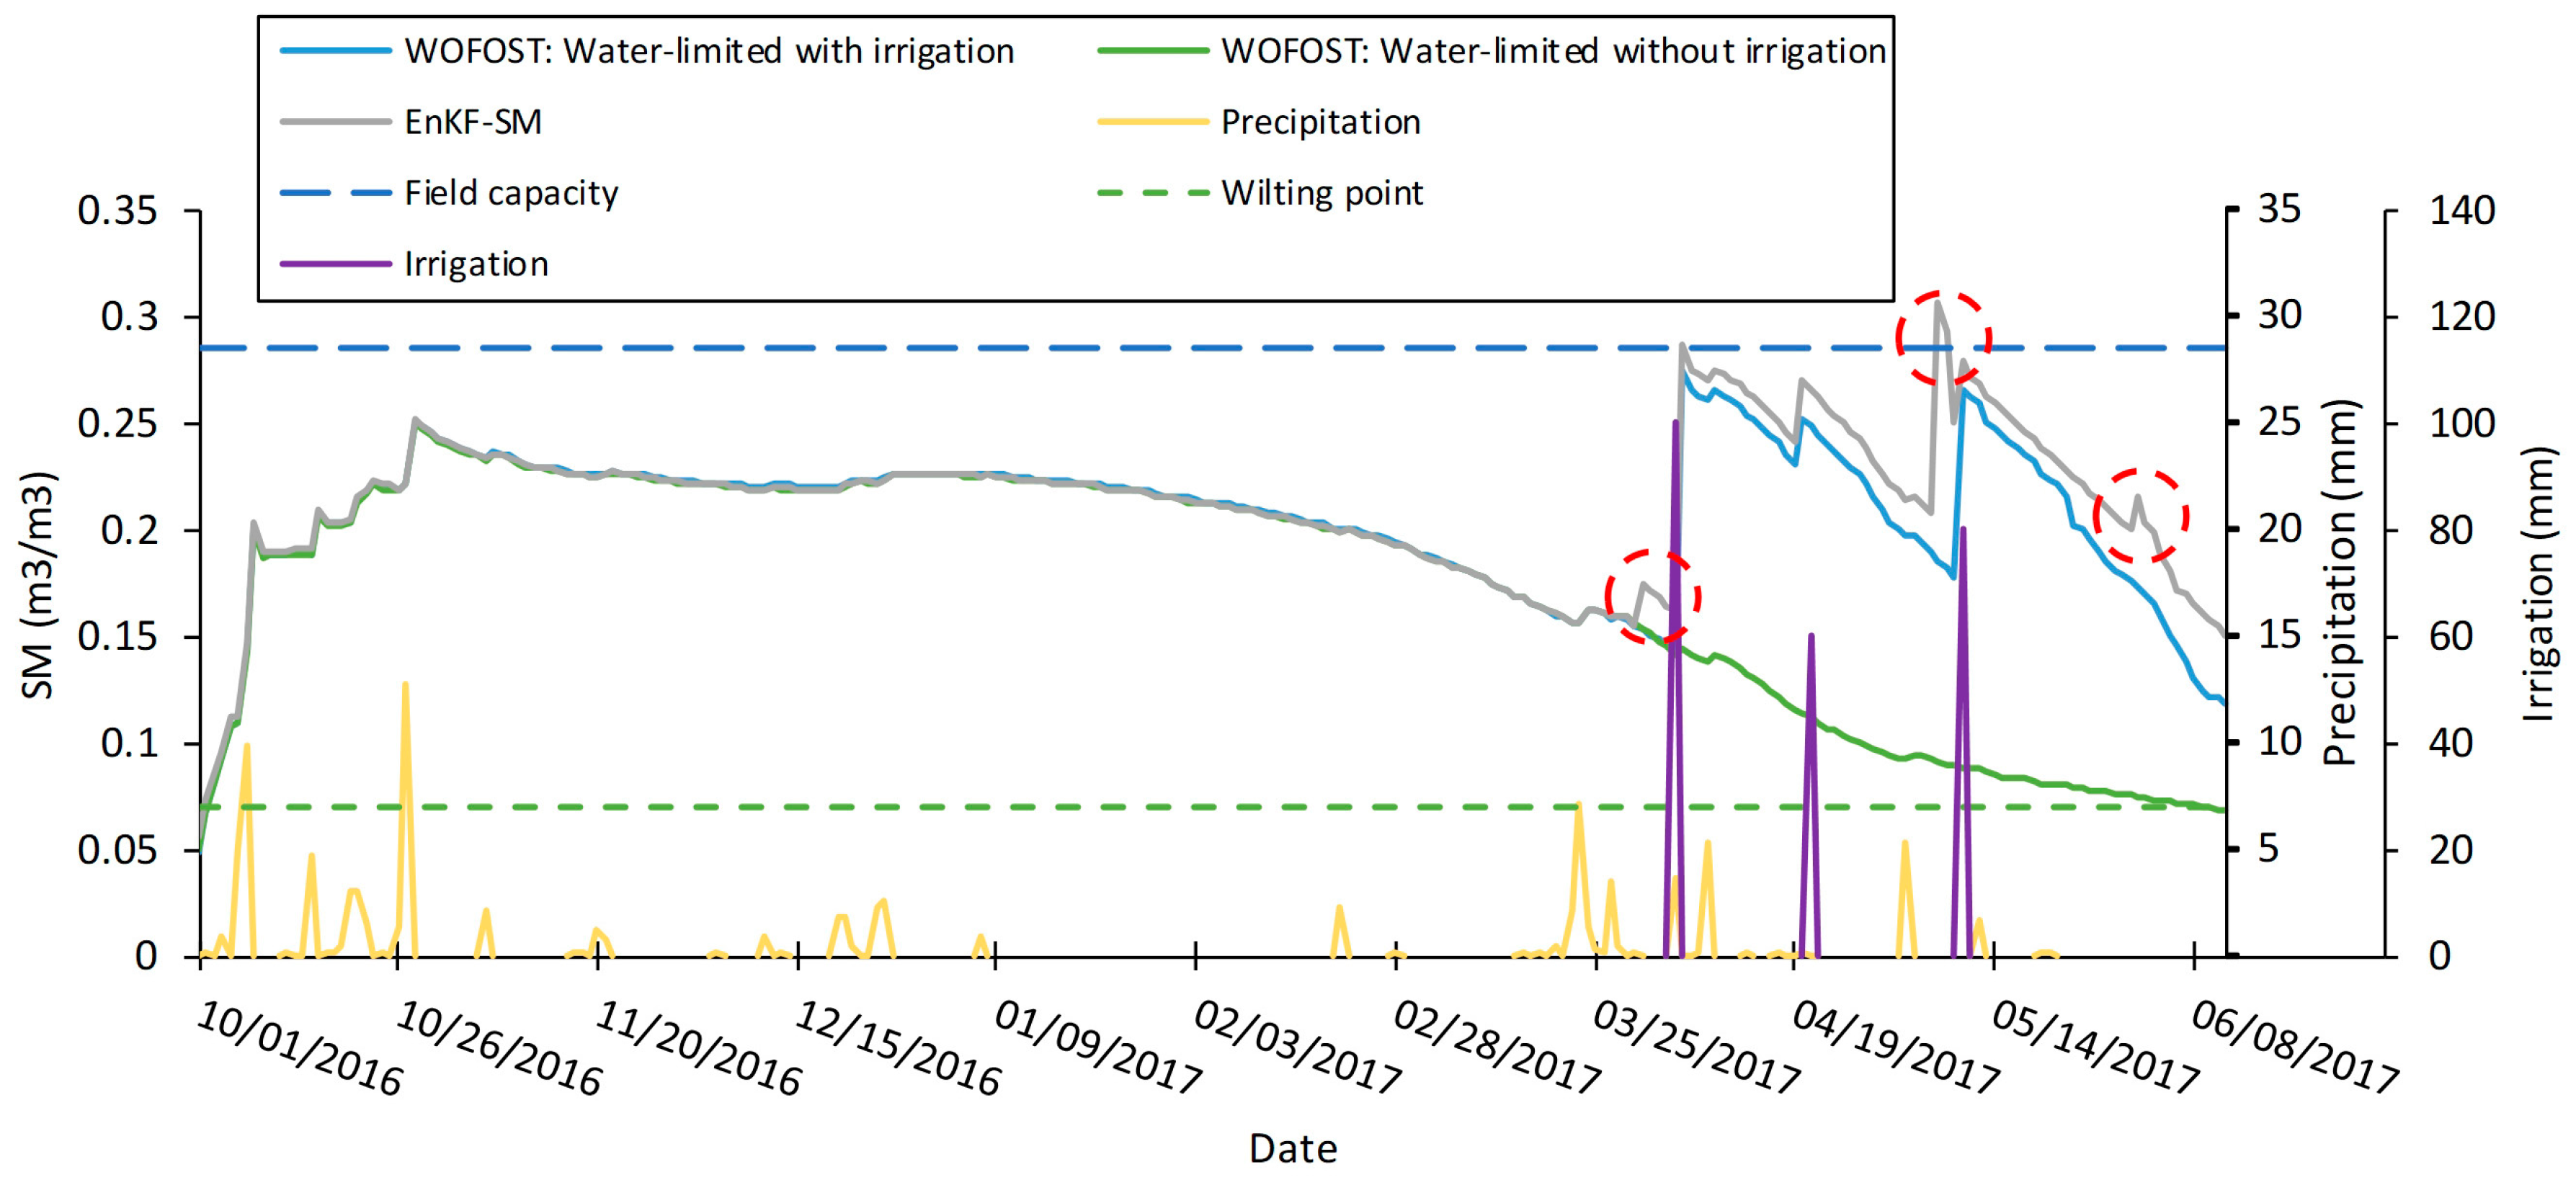
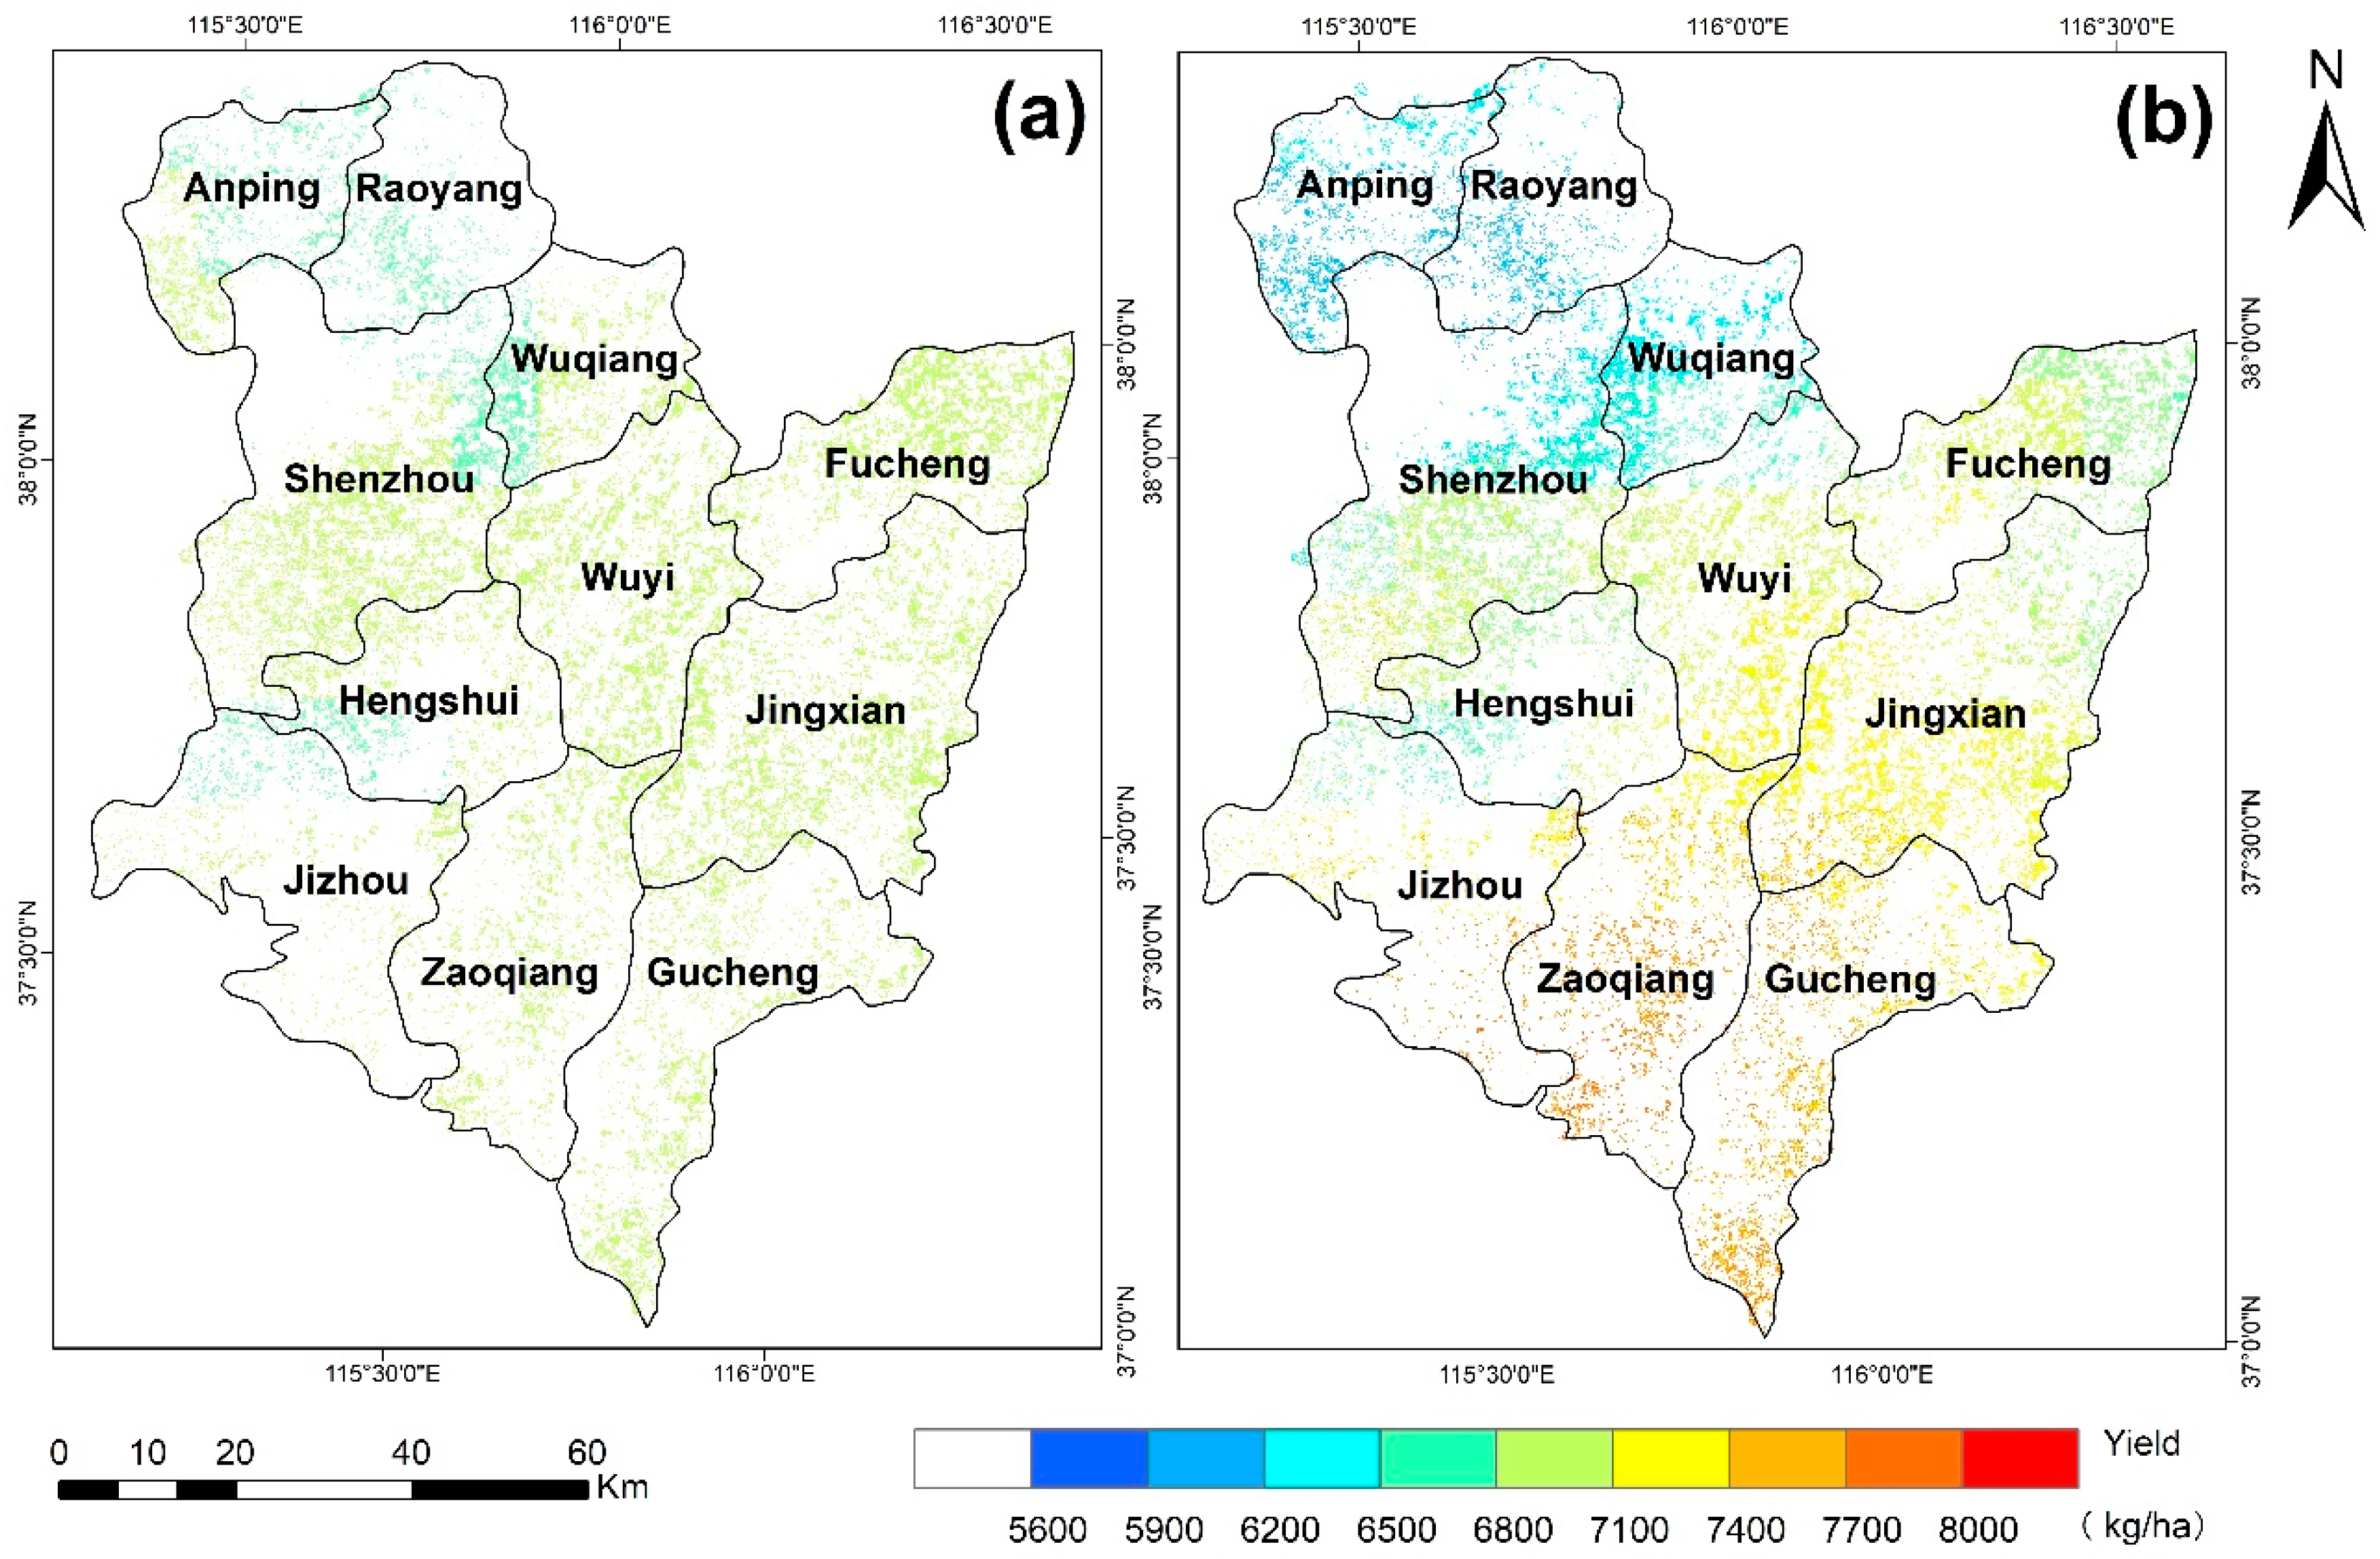
3.3. Assimilation of Soil Moisture with the WOFOST Model Using the EnKF algorithm
4. Discussion
4.1. Uncertainties of this Study
4.2. Future Work
5. Conclusions
- First, SM retrieval results demonstrated that it is feasible to retrieve soil moisture content with the water cloud model by combining remotely sensed Sentinel-1 and Sentinel-2 data. Results showed an acceptable accuracy on three dates where R2 was 0.45, 0.53, and 0.49, respectively, and RMSE was 9.16%, 7.43%, and 8.53%, respectively.
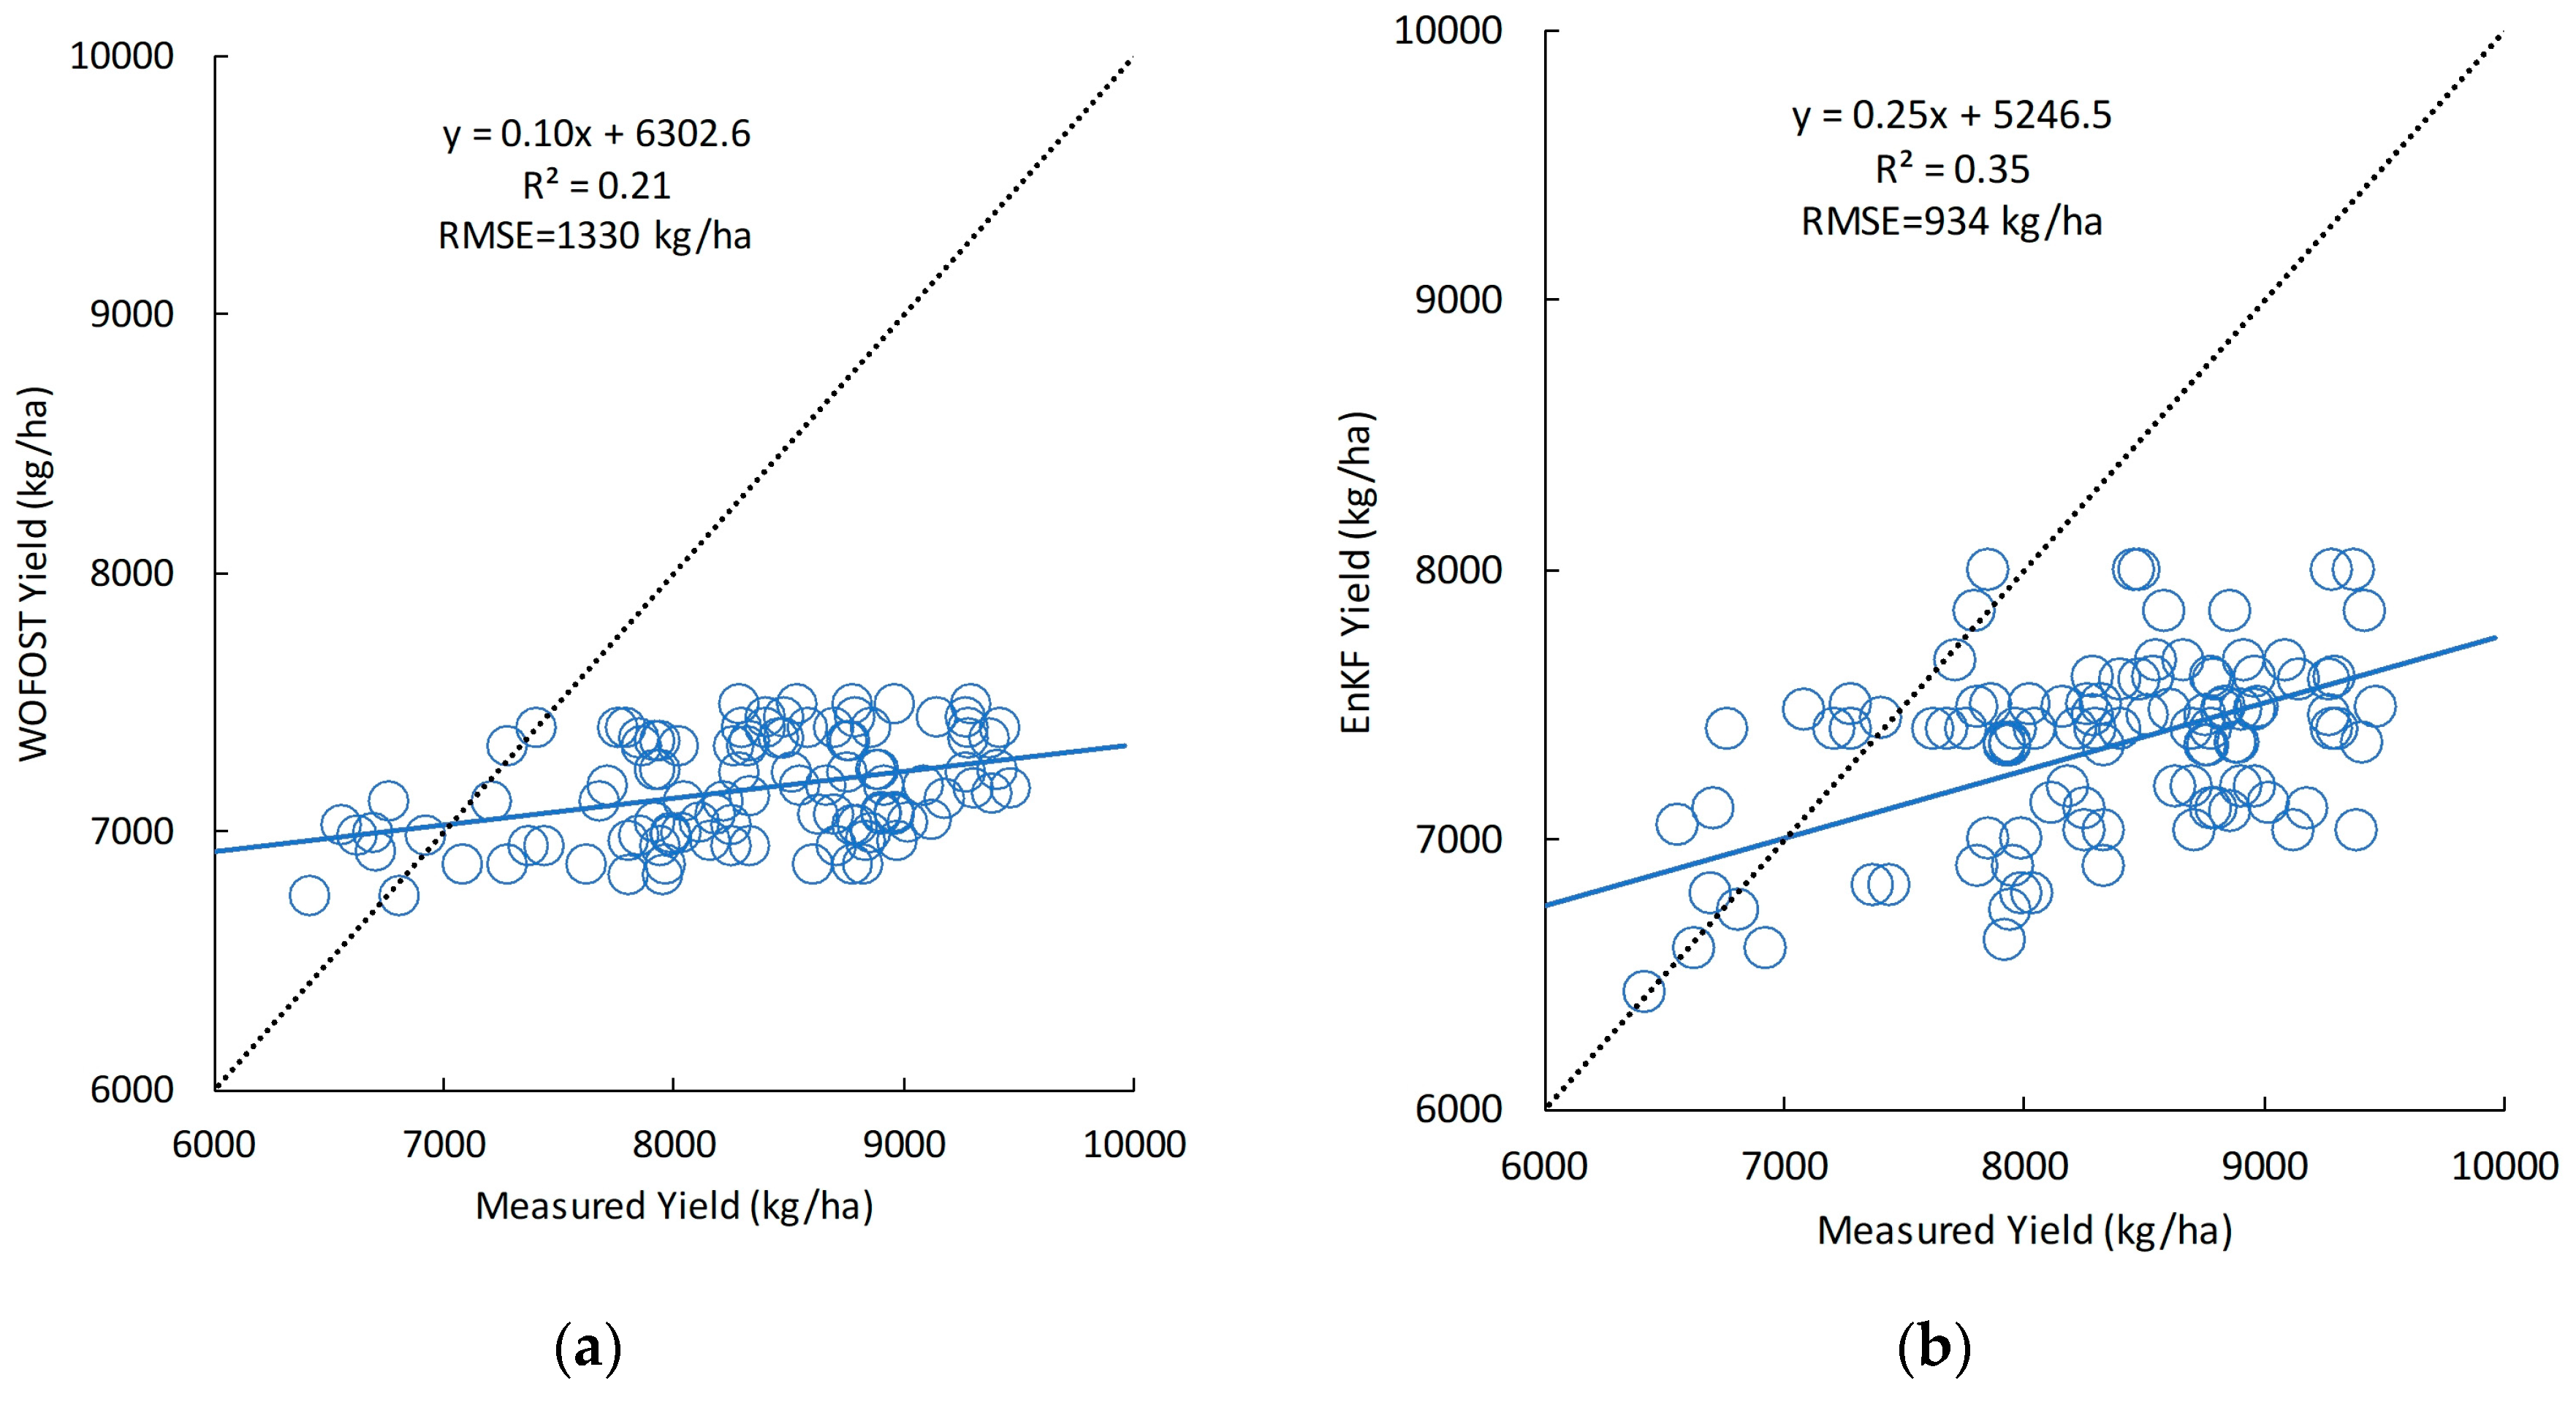
- Second, the assimilation results indicated that, with assimilation of the SM in the WOFOST water-limited mode, the winter wheat yield estimation achieved a higher accuracy, with R2 = 0.35 and RMSE = 934 kg/ha, than that without assimilation, with R2 = 0.21 and RMSE = 1330 kg/ha. Consequently, our results highlight the usefulness and ability of assimilating SM, which was retrieved by combining Sentinel-1 C-band SAR and Sentinel-2 MSI optical data into the WOFOST model to improve regional winter wheat yield estimations.
Supplementary Materials
Author Contributions
Funding
Acknowledgments
Conflicts of Interest
References
- Huang, J.; Sedano, F.; Huang, Y.; Ma, H.; Li, X.; Liang, S.; Tian, L.; Zhang, X.; Fan, J.; Wu, W. Assimilating a synthetic Kalman filter leaf area index series into the WOFOST model to improve regional winter wheat yield estimation. Agric. For. Meteorol. 2016, 216, 188–202. [Google Scholar] [CrossRef]
- Huang, J.; Ma, H.; Su, W.; Zhang, X.; Huang, Y.; Fan, J.; Wu, W. Jointly assimilating MODIS LAI and et products into the swap model for winter wheat yield estimation. IEEE J. Sel. Top. Appl. Earth Obs. Remote Sens. 2015, 8, 1–12. [Google Scholar] [CrossRef]
- Xie, Y.; Wang, P.; Sun, H.; Zhang, S.; Li, L. Assimilation of leaf area index and surface soil moisture with the ceres-wheat model for winter wheat yield estimation using a particle filter algorithm. IEEE J. Sel. Top. Appl. Earth Obs. Remote Sens. 2017, 10, 1–14. [Google Scholar] [CrossRef]
- de Wit, A.J.W.; van Diepen, C.A. Crop model data assimilation with the Ensemble Kalman filter for improving regional crop yield forecasts. Agric. For. Meteorol. 2007, 146, 38–56. [Google Scholar] [CrossRef]
- Cheng, Z.; Meng, J.; Shang, J.; Liu, J.; Qiao, Y.; Qian, B.; Jing, Q.; Dong, T. Improving soil available nutrient estimation by integrating modified WOFOST model and time-series earth observations. IEEE Trans. Geosci. Remote Sens. 2018. [Google Scholar] [CrossRef]
- Mathieu, P.-P.; O’Neill, A. Data assimilation: From photon counts to Earth System forecasts. Remote Sens. Environ. 2008, 112, 1258–1267. [Google Scholar] [CrossRef]
- De Wit, A.; Duveiller, G.; Defourny, P. Estimating regional winter wheat yield with WOFOST through the assimilation of green area index retrieved from MODIS observations. Agric. For. Meteorol. 2012, 164, 39–52. [Google Scholar] [CrossRef]
- Veloso, A.; Mermoz, S.; Bouvet, A.; Le Toan, T.; Planells, M.; Dejoux, J.-F.; Ceschia, E. Understanding the temporal behavior of crops using Sentinel-1 and Sentinel-2-like data for agricultural applications. Remote Sens. Environ. 2017, 199, 415–426. [Google Scholar] [CrossRef]
- Charoenhirunyingyos, S.; Honda, K.; Kamthonkiat, D.; Ines, A.V.M. Soil hydraulic parameters estimated from satellite information through data assimilation. Int. J. Remote Sens. 2011, 32, 8033–8051. [Google Scholar] [CrossRef]
- Bai, X.; He, B. Potential of Dubois model for soil moisture retrieval in prairie areas using SAR and optical data. Int. J. Remote Sens. 2015, 36, 5737–5753. [Google Scholar] [CrossRef]
- Kornelsen, K.C.; Coulibaly, P. Advances in soil moisture retrieval from synthetic aperture radar and hydrological applications. J. Hydrol. 2013, 476, 460–489. [Google Scholar] [CrossRef]
- Fang, B.; Lakshmi, V. Soil moisture at watershed scale: Remote sensing techniques. J. Hydrol. 2014, 516, 258–272. [Google Scholar] [CrossRef]
- Tao, L.; Wang, G.; Chen, W.; Chen, X.; Li, J.; Cai, Q. Soil moisture retrieval from SAR and optical data using a combined model. IEEE J. Sel. Top. Appl. Earth Obs. Remote Sens. 2019, 12, 637–647. [Google Scholar] [CrossRef]
- Bracaglia, M.; Ferrazzoli, P.; Guerriero, L. A fully polarimetric multiple scattering model for crops. Remote Sens. Environ. 1995, 54, 170–179. [Google Scholar] [CrossRef]
- Ulaby, F.T.; Sarabandi, K.; McDonald, K.; Whitt, M.; Dobson, M.C. Michigan microwave canopy scattering model. Int. J. Remote Sens. 1990, 11, 1223–1253. [Google Scholar] [CrossRef]
- Attema, E.P.W.; Ulaby, F.T. Vegetation modeled as a water cloud. Radio Sci. 1978, 13, 357–364. [Google Scholar] [CrossRef]
- Bindlish, R.; Barros, A.P. Parameterization of vegetation backscatter in radar-based, soil moisture estimation. Remote Sens. Environ. 2011, 76, 130–137. [Google Scholar] [CrossRef]
- Svoray, T.; Shoshany, M. Herbaceous biomass retrieval in habitats of complex composition: A model merging SAR images with unmixed Landsat TM data. IEEE Trans. Geosci. Remote Sens. 2003, 41, 1592–1601. [Google Scholar] [CrossRef]
- Kseneman, M.; Gleich, D.; Cucej, Ž. Soil moisture estimation using high-resolution spotlight TerraSAR-X data. IEEE Geosci. Remote Sens. Lett. 2011, 8, 686–690. [Google Scholar] [CrossRef]
- Kseneman, M.; Gleich, D. Soil moisture estimation from X-band data using Tikhonov regularization and neural net. IEEE Trans. Geosci. Remote Sens. 2013, 51, 3885–3898. [Google Scholar] [CrossRef]
- Kweon, S.-K.; Oh, Y. A modified water-cloud model with leaf angle parameters for microwave backscattering from agricultural fields. IEEE Trans. Geosci. Remote Sens. 2015, 53, 2802–2809. [Google Scholar] [CrossRef]
- Quan, X.; He, B.; Li, X. A Bayesian network-based method to alleviate the ill-posed inverse problem: A case study on leaf area index and canopy water content retrieval. IEEE Trans. Geosci. Remote Sens. 2015, 53, 1–11. [Google Scholar] [CrossRef]
- Bai, X.; He, B.; Li, X.; Zeng, J.; Wang, X.; Wang, Z.; Zeng, Y.; Su, Z. First assessment of sentinel-1a data for surface soil moisture estimations using a coupled water cloud model and advanced integral equation model over the Tibetan plateau. Remote Sens. 2017, 9, 714. [Google Scholar] [CrossRef]
- Petropoulos, G.P.; Ireland, G.; Barrett, B. Surface soil moisture retrievals from remote sensing: Current status, products & future trends. Phys. Chem. Earth Parts A/B/C 2015, 83, 36–56. [Google Scholar]
- Ines, A.V.; Das, N.N.; Hansen, J.W.; Njoku, E.G. Assimilation of remotely sensed soil moisture and vegetation with a crop simulation model for maize yield prediction. Remote Sens. Environ. 2013, 138, 149–164. [Google Scholar] [CrossRef] [Green Version]
- Chakrabarti, S.; Bongiovanni, T.; Judge, J.; Zotarelli, L.; Bayer, C. Assimilation of SMOS soil moisture for quantifying drought impacts on crop yield in agricultural regions. IEEE J. Sel. Top. Appl. Earth Obs. Remote Sens. 2014, 7, 3867–3879. [Google Scholar] [CrossRef]
- Wu, K.; Huang, R.J. The sustainable evaluations, the development potentialities and the countermeasures of water and land resources use in the Huang-Huai-Hai plain. Sci. Geogr. Sin. 2001, 5, 390–395. [Google Scholar] [CrossRef]
- Jiang, Z.; Chen, Z.; Chen, J.; Liu, J.; Ren, J.; Li, Z.; Sun, L.; Li, H. Application of crop model data assimilation with a particle filter for estimating regional winter wheat yields. IEEE J. Sel. Top. Appl. Earth Obs. Remote Sens. 2014, 7, 4422–4431. [Google Scholar] [CrossRef]
- Pan, H.; Chen, Z.; Ren, J.; Li, H.; Wu, S. Modeling winter wheat leaf area index and canopy water content with three different approaches using Sentinel-2 multispectral instrument data. IEEE J. Sel. Top. Appl. Earth Obs. Remote Sens. 2018, 22, 482–492. [Google Scholar] [CrossRef]
- Ma, H.; Huang, J.; Zhu, D.; Liu, J.; Su, W.; Zhang, C.; Fan, J. Estimating regional winter wheat yield by assimilation of time series of HJ-1 CCD NDVI into WOFOST–ACRM model with Ensemble Kalman Filter. Math. Comput. Model. 2013, 58, 759–770. [Google Scholar] [CrossRef]
- Huang, J.; Tian, L.; Liang, S.; Ma, H.; Becker-Reshef, I.; Huang, Y.; Su, W.; Zhang, X.; Zhu, D.; Wu, W. Improving winter wheat yield estimation by assimilation of the leaf area index from Landsat TM and MODIS data into the WOFOST model. Agric. For. Meteorol. 2015, 204, 106–121. [Google Scholar] [CrossRef] [Green Version]
- Louis, J.; Debaecker, V.; Pflug, B.; Main-Knorn, M. Sentinel-2 Sen2Cor: L2A processor for users. In Proceedings of the Living Planet Symposium, Prague, Czech Republic, 9–13 May 2016. [Google Scholar]
- Graham, A.J.; Harris, R. Extracting biophysical parameters from remotely sensed radar data: a review of the water cloud model. Prog. Phys. Geogr. Earth Environ. 2003, 27, 217–229. [Google Scholar] [CrossRef]
- Xu, H.; Steven, M.D.; Jaggard, K.W. Monitoring leaf area of sugar beet using ERS-1 SAR data. Int. J. Remote Sens. 1996, 17, 3401–3410. [Google Scholar] [CrossRef]
- Diepen, C.A.; Wolf, J.; Keulen, H.; Rappoldt, C. Wofost: A simulation model of crop production. Soil Use Manag. 2010, 5, 16–24. [Google Scholar] [CrossRef]
- Van Ittersum, M.; Leffelaar, P.; Van Keulen, H.; Kropff, M.; Bastiaans, L.; Goudriaan, J.; Van Ittersum, M.; Kropff, M. On approaches and applications of the Wageningen crop models. Eur. J. Agron. 2003, 18, 201–234. [Google Scholar] [CrossRef]
- Eweys, O.A.; Elwan, A.A.; Borham, T.I. Integrating WOFOST and Noah LSM for modeling maize production and soil moisture with sensitivity analysis, in the east of The Netherlands. Field Crop. Res. 2017, 210, 147–161. [Google Scholar] [CrossRef]
- Saxton, K.E.; Rawls, W.J. Soil water characteristic estimates by texture and organic matter for hydrologic solutions. Soil Sci. Soc. Am. J. 2006, 70, 1569. [Google Scholar] [CrossRef]
- Evensen, G. Sequential data assimilation with a nonlinear quasi-geostrophic model using Monte Carlo methods to forecast error statistics. J. Geophys. Res. Space Phys. 1994, 99, 10143. [Google Scholar] [CrossRef]
- Burgers, G.; Van Leeuwen, P.J.; Evensen, G. Analysis scheme in the ensemble Kalman filter. Mon. Weather. Rev. 1998, 126, 1719–1724. [Google Scholar] [CrossRef]
- Evensen, G. The ensemble Kalman filter: Theoretical formulation and practical implementation. Ocean Dyn. 2003, 53, 343–367. [Google Scholar] [CrossRef]
- Evensen, G. Data Assimilation: The Ensemble Kalman Filter; Springer: Berlin, Germany, 2009; ISBN 978-3-642-03710-8. [Google Scholar]
- Katzfuss, M.; Stroud, J.R.; Wikle, C.K. Understanding the ensemble Kalman filter. Am. Stat. 2016, 70, 350–357. [Google Scholar] [CrossRef]
- Wang, J.; Li, X.; Lu, L.; Fang, F. Estimating near future regional corn yields by integrating multi-source observations into a crop growth model. Eur. J. Agron. 2013, 49, 126–140. [Google Scholar] [CrossRef]
- Huang, J.; Zhuo, W.; Li, Y.; Huang, R.; Sedano, F.; Su, W.; Dong, J.; Tian, L.; Huang, Y.; Zhu, D.; et al. Comparison of three remotely sensed drought indices for assessing the impact of drought on winter wheat yield. Int. J. Digit. Earth 2018, 3, 1–23. [Google Scholar] [CrossRef]
- Betbeder, J.; Fieuzal, R.; Baup, F. Assimilation of LAI and dry biomass data from optical and SAR images into an agro-meteorological model to estimate soybean yield. IEEE J. Sel. Top. Appl. Earth Obs. Remote Sens. 2016, 9, 1–14. [Google Scholar] [CrossRef]
- Dente, L.; Satalino, G.; Mattia, F.; Rinaldi, M. Assimilation of leaf area index derived from ASAR and MERIS data into CERES-Wheat model to map wheat yield. Remote Sens. Environ. 2008, 112, 1395–1407. [Google Scholar] [CrossRef]
- Prévot, L.; Chauki, H.; Troufleau, D.; Weiss, M.; Baret, F.; Brisson, N. Assimilating optical and radar data into the STICS crop model for wheat. Agronomie 2003, 23, 297–303. [Google Scholar] [CrossRef] [Green Version]
- Li, Y.; Zhou, Q.; Zhou, J.; Zhang, G.; Chen, C.; Wang, J. Assimilating remote sensing information into a coupled hydrology-crop growth model to estimate regional maize yield in arid regions. Ecol. Model. 2014, 291, 15–27. [Google Scholar] [CrossRef]
- Bolten, J.D.; Crow, W.T.; Zhan, X.; Jackson, T.J.; Reynolds, C.A. Evaluating the utility of remotely sensed soil moisture retrievals for operational agricultural drought monitoring. IEEE J. Sel. Top. Appl. Earth Obs. Remote Sens. 2010, 3, 57–66. [Google Scholar] [CrossRef]
- Le Toan, T.; Laur, H.; Mougin, E.; Lopes, A. Multitemporal and dual-polarization observations of agricultural vegetation covers by X-band SAR images. IEEE Trans. Geosci. Remote Sens. 1989, 27, 709–718. [Google Scholar] [CrossRef]
- Han, X.; Li, X. An evaluation of the nonlinear/non-Gaussian filters for the sequential data assimilation. Remote Sens. Environ. 2008, 112, 1434–1449. [Google Scholar] [CrossRef]
- Kepert, J.D. Covariance localisation and balance in an ensemble Kalman filter. Q. J. R. Meteorol. Soc. 2009, 135, 1157–1176. [Google Scholar] [CrossRef]
- Eitzinger, J.; Trnka, M.; Hösch, J.; Zalud, Z.; Dubrovský, M. Comparison of CERES, WOFOST and SWAP models in simulating soil water content during growing season under different soil conditions. Ecol. Model. 2004, 171, 223–246. [Google Scholar] [CrossRef]
- Huang, J.; Ma, H.; Sedano, F.; Lewis, P.; Liang, S.; Wu, Q.; Su, W.; Zhang, X.; Zhu, D. Evaluation of regional estimates of winter wheat yield by assimilating three remotely sensed reflectance datasets into the coupled WOFOST–PROSAIL model. Eur. J. Agron. 2019, 102, 1–13. [Google Scholar] [CrossRef]
- Huang, J.; Gómez-Dans, J.; Huang, H.; Ma, H.; Wu, Q.; Lewis, P.; Liang, S.; Chen, Z.; Xue, J.; Wu, Y.; et al. Assimilation of remote sensing into crop growth models: Current status and perspectives. Agric. For. Meteorol. 2019, 276, 1–16. [Google Scholar] [CrossRef]


| Date | A | B | C | D |
|---|---|---|---|---|
| 1 April | −7.12 | −1.56 | 0.02 | −5.71 |
| 7 May | −1.28 | −2.83 | 0.0015 | −0.91 |
| 1 June | −23.37 | −3.57 | 0.06 | −6.84 |
© 2019 by the authors. Licensee MDPI, Basel, Switzerland. This article is an open access article distributed under the terms and conditions of the Creative Commons Attribution (CC BY) license (http://creativecommons.org/licenses/by/4.0/).
Share and Cite
Zhuo, W.; Huang, J.; Li, L.; Zhang, X.; Ma, H.; Gao, X.; Huang, H.; Xu, B.; Xiao, X. Assimilating Soil Moisture Retrieved from Sentinel-1 and Sentinel-2 Data into WOFOST Model to Improve Winter Wheat Yield Estimation. Remote Sens. 2019, 11, 1618. https://0-doi-org.brum.beds.ac.uk/10.3390/rs11131618
Zhuo W, Huang J, Li L, Zhang X, Ma H, Gao X, Huang H, Xu B, Xiao X. Assimilating Soil Moisture Retrieved from Sentinel-1 and Sentinel-2 Data into WOFOST Model to Improve Winter Wheat Yield Estimation. Remote Sensing. 2019; 11(13):1618. https://0-doi-org.brum.beds.ac.uk/10.3390/rs11131618
Chicago/Turabian StyleZhuo, Wen, Jianxi Huang, Li Li, Xiaodong Zhang, Hongyuan Ma, Xinran Gao, Hai Huang, Baodong Xu, and Xiangming Xiao. 2019. "Assimilating Soil Moisture Retrieved from Sentinel-1 and Sentinel-2 Data into WOFOST Model to Improve Winter Wheat Yield Estimation" Remote Sensing 11, no. 13: 1618. https://0-doi-org.brum.beds.ac.uk/10.3390/rs11131618