Article

Evaluation of Bayesian Multimodel Estimation in Surface Incident Shortwave Radiation Simulation over High Latitude Areas

1
State Key Laboratory of Remote Sensing Science, Faculty of Geographical Science, Beijing Normal University, Beijing 100875, China
2
Beijing Engineering Research Center for Global Land Remote Sensing Products, Institute of Remote Sensing, Science and Engineering, Faculty of Geographical Science, Beijing Normal University, Beijing 100875, China
3
Nicholas School of the Environment, Duke University, Durham, NC 27708, USA
*
Author to whom correspondence should be addressed.
Remote Sens. 2019, 11(15), 1776; https://0-doi-org.brum.beds.ac.uk/10.3390/rs11151776
Submission received: 13 June 2019 / Revised: 24 July 2019 / Accepted: 26 July 2019 / Published: 29 July 2019
(This article belongs to the Special Issue Remote Sensing of Land Surface Radiation Budget)

Abstract

:
Surface incident shortwave radiation (SSR) is crucial for understanding the Earth’s climate change issues. Simulations from general circulation models (GCMs) are one of the most practical ways to produce long-term global SSR products. Although previous studies have comprehensively assessed the performance of the GCMs in simulating SSR globally or regionally, studies assessing the performance of these models over high-latitude areas are sparse. This study evaluated and intercompared the SSR simulations of 48 GCMs participating in the fifth phase of the Coupled Model Intercomparison Project (CMIP5) using quality-controlled SSR surface measurements at 44 radiation sites from three observation networks (GC-NET, BSRN, and GEBA) and the SSR retrievals from the Clouds and the Earth’s Radiant Energy System, Energy Balanced and Filled (CERES EBAF) data set over high-latitude areas from 2000 to 2005. Furthermore, this study evaluated the performance of the SSR estimations of two multimodel ensemble methods, i.e., the simple model averaging (SMA) and the Bayesian model averaging (BMA) methods. The seasonal performance of the SSR estimations of individual GCMs, the SMA method, and the BMA method were also intercompared. The evaluation results indicated that there were large deficiencies in the performance of the individual GCMs in simulating SSR, and these GCM SSR simulations did not show a tendency to overestimate the SSR over high-latitude areas. Moreover, the ensemble SSR estimations generated by the SMA and BMA methods were superior to all individual GCM SSR simulations over high-latitude areas, and the estimations of the BMA method were the best compared to individual GCM simulations and the SMA method-based estimations. Compared to the CERES EBAF SSR retrievals, the uncertainties of the SSR estimations of the GCMs, the SMA method, and the BMA method are relatively large during summer.

Graphical Abstract

1. Introduction

Surface incident shortwave radiation (SSR) is not only an important parameter in many atmospheric, oceanic, and land process models [1], but also a critical ingredient in energy exchanges between the Earth’s surface and the atmosphere [2]. It also plays an important role in the hydrological and carbon cycles [3,4,5] and ultimately influences the Earth’s climate. Therefore, knowing the spatial distribution and temporal evolution of SSR is essential for improving our understanding of the Earth’s climate and climate change.
SSR is usually obtained through four methods: surface measurements, satellite retrievals, reanalysis products, and general circulation models (GCMs) simulations [6]. GCMs have become an important tool for producing spatially and temporally continuous long-term global products of energy balance components. Many studies have investigated the performance of SSR simulations from the GCMs at both global and regional scales [7,8,9,10,11]. For instance, Ma et al. [9] found that the biases of the global average SSR simulations varied from 4.8 W m−2 to 11.9 W m−2 among the 48 fifth phase of Coupled Model Intercomparison Project (CMIP5) models compared to the ground observations from 446 stations during 2000–2005. In addition, the CMIP5-simulated multimodel mean SSR using the simple model averaging (SMA) method had a bias value of 2.6 W m−2 compared with the SSR retrievals from the Clouds and the Earth’s Radiant Energy System, Energy Balanced And Filled (CERES EBAF) over the globe, 4.7 W m−2 and 1.7 W m−2 over land and oceans, respectively. Wild et al. [10] evaluated 43 CMIP5 models with SSR observations at ground sites during 2000–2004 from the Global Energy Balance Archive (GEBA) and Baseline Surface Radiation Network (BSRN) networks. The root mean squared errors (RMSEs) of the annual average SSR ranged from 18.3 W m−2 to 35.2 W m−2 among the GCMs with respect to the 760 GEBA sites. These studies indicated that large uncertainties in the simulated SSR exist among the GCMs, and GCMs exhibit systematic bias, i.e., the simulated SSR values are usually greater than the observed values. It was also found that the differences in physical basis, parameterization schemes, and coupling schemes were the major reason for various uncertainties in climate change [12].
Although previous studies have comprehensively assessed the performance of GCMs in simulating SSR globally or regionally, studies assessing the performance of these GCMs over high-latitude areas are sparse. Compared with low-latitude regions, high-latitude areas are most vulnerable to global warming and thus experience more dramatic environmental changes [13]. The dramatic changes of environment in high-latitude areas may cause changes in cloud and surface albedo, and may further disturb the surface radiation budget [14]. In addition, the remote sensing surface radiation retrieval methods are also very problematic in high-latitude areas [15], likely because it is hard to distinguish between the snow/ice and cloud, which widely cover high-latitude areas and are hard to be accurately estimated under the cloud retrieval schemes [13,16].
Different GCMs have their own strengths and weaknesses when simulating the SSR [17]. The multimodel ensemble (MME) methods are able to postprocess the GCM simulations with equal or unequal weights. It is found that a SMA method is able to perform better than any individual GCM in estimating climatic and energy budget variables [12,18,19,20]. In addition to the traditional SMA method, more sophisticated MME methods are proposed wherein the participating single models are given different weights [19,20,21,22,23]. In general, the sophisticated MME methods perform better than the SMA method [19,20,21,24,25].
Among the sophisticated MME methods, the Bayesian model averaging (BMA) method is one of the most promising methods [12]. Based on Bayesian inference, the statistical postprocessing method can not only provide an expectation but also a probability density function (PDF) of any quantity of interest based on the training data [12]. This advantage makes the BMA method a widely used postprocessing method in various essential climate variable estimations and predictions, such as global surface air temperature predictions [20] and hydrological predictions [26]. Studies have found that the BMA method produces more accurate and reliable outputs than the individual GCMs and other MME methods [19,24,25]. However, the BMA method is still rarely used in SSR estimation.
This study evaluated the SSR simulations from 48 CMIP5 models using the quality-controlled surface observations between 2000 and 2005 from 21 Greenland Climate Network (GC-NET) sites, 5 BSRN sites, and 18 GEBA sites in the high-latitude areas (>60°) and compared these SSR simulations with the SSR satellite retrievals from CERES EBAF, which have the most accurate SSR retrievals among satellite-based products [6]. We evaluated the SSR simulations and intercompared the performance of both the SMA and BMA methods for estimating the SSR in high-latitude areas. The seasonal performance of the outputs from individual GCMs, the SMA method, and the BMA method were also intercompared.
This paper is organized as follows. The SSR data used in this study are described in Section 2. The methodology for the evaluation is given in Section 3. The results are analyzed in Section 4, and the study is concluded and discussed in Section 5.

2. Data

Three kinds of SSR data are used in this study: CMIP5 simulations, ground measurements, and satellite retrievals. The details of these data sets are described in the following subsections.

2.1. CMIP5 GCMs

The CMIP5 in the IPCC’s Fifth Assessment Report (IPCC AR5) provides simulations from a number of GCMs developed and maintained by different institutions around the world [17]. These data have been organized by the Program for Climate Model Diagnosis and Intercomparison (PCMDI) for the IPCC AR5. Compared to the third phase of the Coupled Model Intercomparison Project (CMIP3) in the fourth IPCC assessment report (IPCC AR4), the GCMs in IPCC AR5 have many improved model types, with more interactive components, including aerosols, dynamic vegetation, atmospheric physics and carbon and hydrological cycles [24]. Most dynamic, physical, and chemical algorithms were also improved in the IPCC AR5 models [10,11].
At the time of this study, 48 GCM simulations of SSR were available. We selected the “r1i1p1” ensemble and the “historical” experiment, which was aimed at accurately reconstructing the climate evolution of the 20th century by considering all major natural and anthropogenic forcing factors, such as changes in atmospheric greenhouse gases, aerosol loadings (tropospheric and stratospheric volcanic), solar output, and land use [11]. Most historical and r1i1p1 simulations in CMIP5 were run for the period from 1850 to 2005.
The spatial resolution of the 48 CMIP5 GCMs used in this study varies from 0.56° × 0.56° to 3.75° × 3.75°. Detailed information on the 48 CMIP5 GCMs, host institutions, countries, and spatial resolutions, is summarized in Table 1.

2.2. Ground Measurements

Ground observations of SSR over high-latitude areas used to evaluate SSR estimates stem from three networks: BSRN (five sites) [27], GC-NET (21 sites) [28], and GEBA (18 sites) [29]. Figure 1 shows the geographical distributions of the observation sites used in this study.
The BSRN was operational in the early 1990s and was established by the World Climate Research Programme (WCRP) to provide radiation measurements of high accuracy and high temporal resolution at a limited number of sites in various climate zones [30]. The SSR measurement instruments at BSRN sites are calibrated every six months and regularly maintain a SSR uncertainty of less than 5% [27]. To improve data continuity, the SSR was measured by two parallel observation systems [27]. At present, the BSRN project has archived more than 60 sites covering a wide latitude range from 89.98° S to 82.49° N and a wide longitude range from 156.61° W to 169.69° E [2].
The GC-NET consists of more than 20 automatic weather stations (AWSs) mainly distributed in the accumulation areas of ice sheets. GC-NET AWSs are equipped with various factory-calibrated instruments to measure surface energy and mass balance components [31]. By 2013, all the AWS have gone through a rigorous data quality control process to reduce interference from the typical problems experienced by unattended weather stations, such as station tilt, low cosine responses at large solar zenith angles, riming on sensor domes, and sensor overheating [32]. The GC-NET provides hourly radiation observations with instruments located between 0.1 and 5 m above the surface, depending on the local accumulation rates and tower heights.
The GEBA is a database maintained at ETH Zurich (Switzerland) for the central storage of worldwide measured energy fluxes at the Earth’s surface [33,34]. The current version (2017) contains 2500 worldwide locations with an average of approximately 500,000 monthly entries of various surface energy balance components [33]. Thus, the SSR is the most widely measured quantity in the GEBA. The GEBA has undergone substantial changes in terms of available data, data access, and internet appearance and has been widely used to evaluate the SSR estimates from satellite observations, reanalysis data, and GCMs [6].
Since the BSRN and the GC-NET only provide instantaneous values of the SSR, critical quality control procedures were applied to estimate the monthly SSR observations from the instantaneous values of the surface measurements from the GC-NET and the BSRN. First, the daily mean SSR were obtained by integrating the instantaneous values in a day which has at least 80 percent valid observed values. The missing data were estimated via the simple linear interpolation method. Then, the monthly values were calculated by averaging the available daily values within the month. If daily mean SSR data were missing for more than 10 days in one month, the monthly SSR data were excluded from the evaluation.
The CERES EBAF SSR products begin in 2000, and most CMIP5 GCMs SSR simulations end in 2005. Therefore, the study period is the overlap: 2000–2005. A subset of the 21 GC-NET sites, five BSRN sites, and 18 GEBA sites at high-latitude areas, which provides at least 10 months of records within the period of 2000–2005, was used in this study. Detailed information of the sites used in this study, including their latitudes, longitudes, and elevations, is summarized in Table 2.

2.3. CERES EBAF SSR Retrievals

The distribution of the radiation ground sites is widespread as shown in Figure 1, but gaps remain particularly over the Antarctic continent and the high-latitude oceans. Thus, this study also evaluated the SSR estimations from the MME methods and individual GCMs by comparing them with the satellite SSR retrievals, which can provide globally gridded values of the SSR. The monthly mean satellite derived SSR retrievals with a spatial resolution of 1° × 1° from the CERES EBAF product (Ed 4.0), which has been reported to be more accurate than other gridded SSR products [2,9,35], are used in this study.
The CERES EBAF retrieves shortwave fluxes based on TOA radiance observations from the passive Terra, Aqua, and Suomi-National Polar-Orbiting Partnership satellites [36]. Moreover, the surface irradiances are adjusted using radiative kernels in the retrieval algorithm of the CERES EBAF. The surface irradiance adjustment process is composed of bias correction and a Lagrange multiplier [37]. In the bias correction process, the bias in the temperature and the specific humidity between 200 and 500 h Pa is corrected based on observations incorporated from the atmospheric infrared sounder (AIRS), which is on board the MODIS-Aqua satellite. The bias in the cloud fraction (CF) is corrected based on the observations from the Cloud–Aerosol Lidar and Infrared Pathfinder Satellite Observations (CALIPSO) and CloudSat. In the Lagrange multiplier process, errors in the surface, cloud, and atmospheric properties are corrected. Over the high-latitude areas, the cloud properties are derived from the Terra and Aqua reflectance data using one of two retrieval algorithms depending on the existence of snow and ice [36,38]. To reduce the error in the surface irradiances and to increase the consistency in the TOA irradiances, surface irradiances are constrained using the CERES-derived TOA irradiance [39].

3. Methods

3.1. Bayesian Model Averaging (BMA) Method

The BMA method provides a way to combine different models to a multimodel and is a promising method for calibrating ensembles in forecasts [40]. Standard statistical analysis (e.g., regression analysis), proceeds conditionally on one assumed statistical model, which may be selected from among several possible competing models. Other models can also provide different results but with different uncertainties. BMA [41,42] overcomes the problem by conditioning, not on a single/best model, but on the entire ensemble of statistical models considered. To better take advantage of the GCM simulations and obtain more reliable results, we used the BMA method to combine 48 GCM SSR simulations.
In the BMA method, the output is a PDF, which is a weighted average of the conditional PDFs, weighted by their posterior model probabilities. We denote the quantity to be forecasted by y . The law of total probability gives the combined forecast PDF of the quantity y by:
p ( y | y T ) = i = 1 K p ( y | X i , y T ) p ( X i | y T )
where p ( y | X i , y T ) is the forecast PDF based on model X i alone, estimated from the training data y T , and K is the number of models using to be combined. p ( X i | y T ) denotes the posterior probability of model X i is the best given the training data, reflecting how well model X i matches the training data. According to the Bayesian theory, this term is computed by:
p ( X i | y T ) = p ( y T | X i ) p ( X i ) j = 1 K p ( y T | X j ) p ( X j )
The initial value of p ( X i ) can be assigned based on the previous knowledge of the model performance. In this study, uniform prior is assigned p ( X i ) = 1 K . Thus, Equation (2) can be further simplified and rewritten as:
p ( X i | y T ) = p ( y T | X i ) j = 1 K p ( y T | X j )
Because BMA method assumes that the model forecasts are unbiased, the bias-correction methods should be applied in advance. The linear regression method is applied for each GCM SSR simulations:
f i = a i + b i · y i
where f i denotes the bias-corrected forecast for model X i and y i is the forecast of the variable from model X i . Unique coefficients a i and b i for each model X i are determined through least squares approximation, with the observations in the training period as the dependent variable and the forecasts as the explanatory variables.
Considering the application of BMA method to bias-corrected forecast f i , Equation (1) can be rewritten as:
p ( y | f 1 , , f K , y T ) = i = 1 K w i p i ( y | f i , y T )
where w i = p ( X i | y T ) is the BMA weight for model X i computed from the training data and reflects the relative performance of model X i on the training period. The BMA weights are nonnegative and add up to 1. The conditional probabilities p i ( y | f i , y T ) can be interpreted as the conditional PDF of y conditional on f i and training data y T . These conditional PDFs are assumed to be normally distributed for computational convenience as:
y | ( f i , y T ) N ( a i + b i y i , σ 2 )
where the coefficients a i and b i are calculated from the bias-correction procedure described above. This means that the BMA predictive distribution becomes a weighted sum of normal distributions, with equal variance and centered at the bias-corrected forecast. A deterministic forecast can be obtained using the conditional expectation of y given the forecasts:
E [ y | ( f 1 , , f K , y T ) ] = i = 1 K w i ( a i + b i f i )
The BMA weights and the variance are estimated by the maximum likelihood [43] from the training dataset. For given parameters to be estimated, the likelihood function is defined as the probability of the training data and is viewed as a function of the parameters. The BMA weights and variance are used to maximize this function, that is, the parameter values for which the observations were most likely to have been observed. It is convenient to maximize the log-likelihood function rather than the likelihood function itself. Following the recommendation of Raftery et al. [44], we use the expectation maximization (EM) algorithm [45] to maximize the log-likelihood function. In brief, the EM algorithm is iterative and alternates between the E (or expectation) step and the M (or maximization) step. More detailed description of the BMA method is provided by Raftery et al. [44].
In this study, the SSR ground observations over six years (2000–2005) from 44 stations spread across high-latitude areas were randomly selected as the training (22 stations) and testing (22 stations) data for the BMA analysis.

3.2. Statistical Measures

3.2.1. Normalized RMSE

To evaluate the performance of the SSR estimations from individual GCMs and the MME methods, the bias between simulations and reference data, the corresponding RMSE and correlation coefficient (R) were calculated. These three statistics can quantify the similarity between the simulations and the reference data.
To compare the RMSE of each GCM SSR simulation more intuitively, the average RMSEs were normalized following [46]. The normalization results are called nRMSEs, which are defined as follows:
n R M S E = R M S E R M S E m R M S E m
where RMSEm, the “typical” GCM error, is defined as the median of RMSE values. We use the median rather than the average value here to prevent GCMs with unusually large errors (outliers) from unduly affecting the results. The nRMSE is a measure of how well a GCM (with respect to particular surface observations) compares with the typical GCM error. If nRMSE > 0, then the GCM is inferior to the typical GCM (the GCM whose RMSE is determined as RMSEm); the greater the nRMSE value is, the worse the GCM. Conversely, if nRMSE < 0, then the GCM is better than the typical GCM; the smaller the nRMSE value (greater than −1), the better the GCM.

3.2.2. Nash–Sutcliffe Efficiency

The performance of the SSR estimations from the GCMs, the SMA method, and the BMA method was also evaluated by the Nash–Sutcliffe efficiency (NSE), which reflects how close the plot of the model simulation versus observed data is to the 1:1 line. The NSE is calculated as follows:
N S E = 1 i = 1 n ( O i M i ) 2 i = 1 n ( O i O ¯ ) 2
where O i and M i are the observed and estimated SSR, respectively. n is the size of data. O ¯ is the average value of the observed SSR. The NSE can range from to 1, with higher values indicating better agreement.

4. Results and Analysis

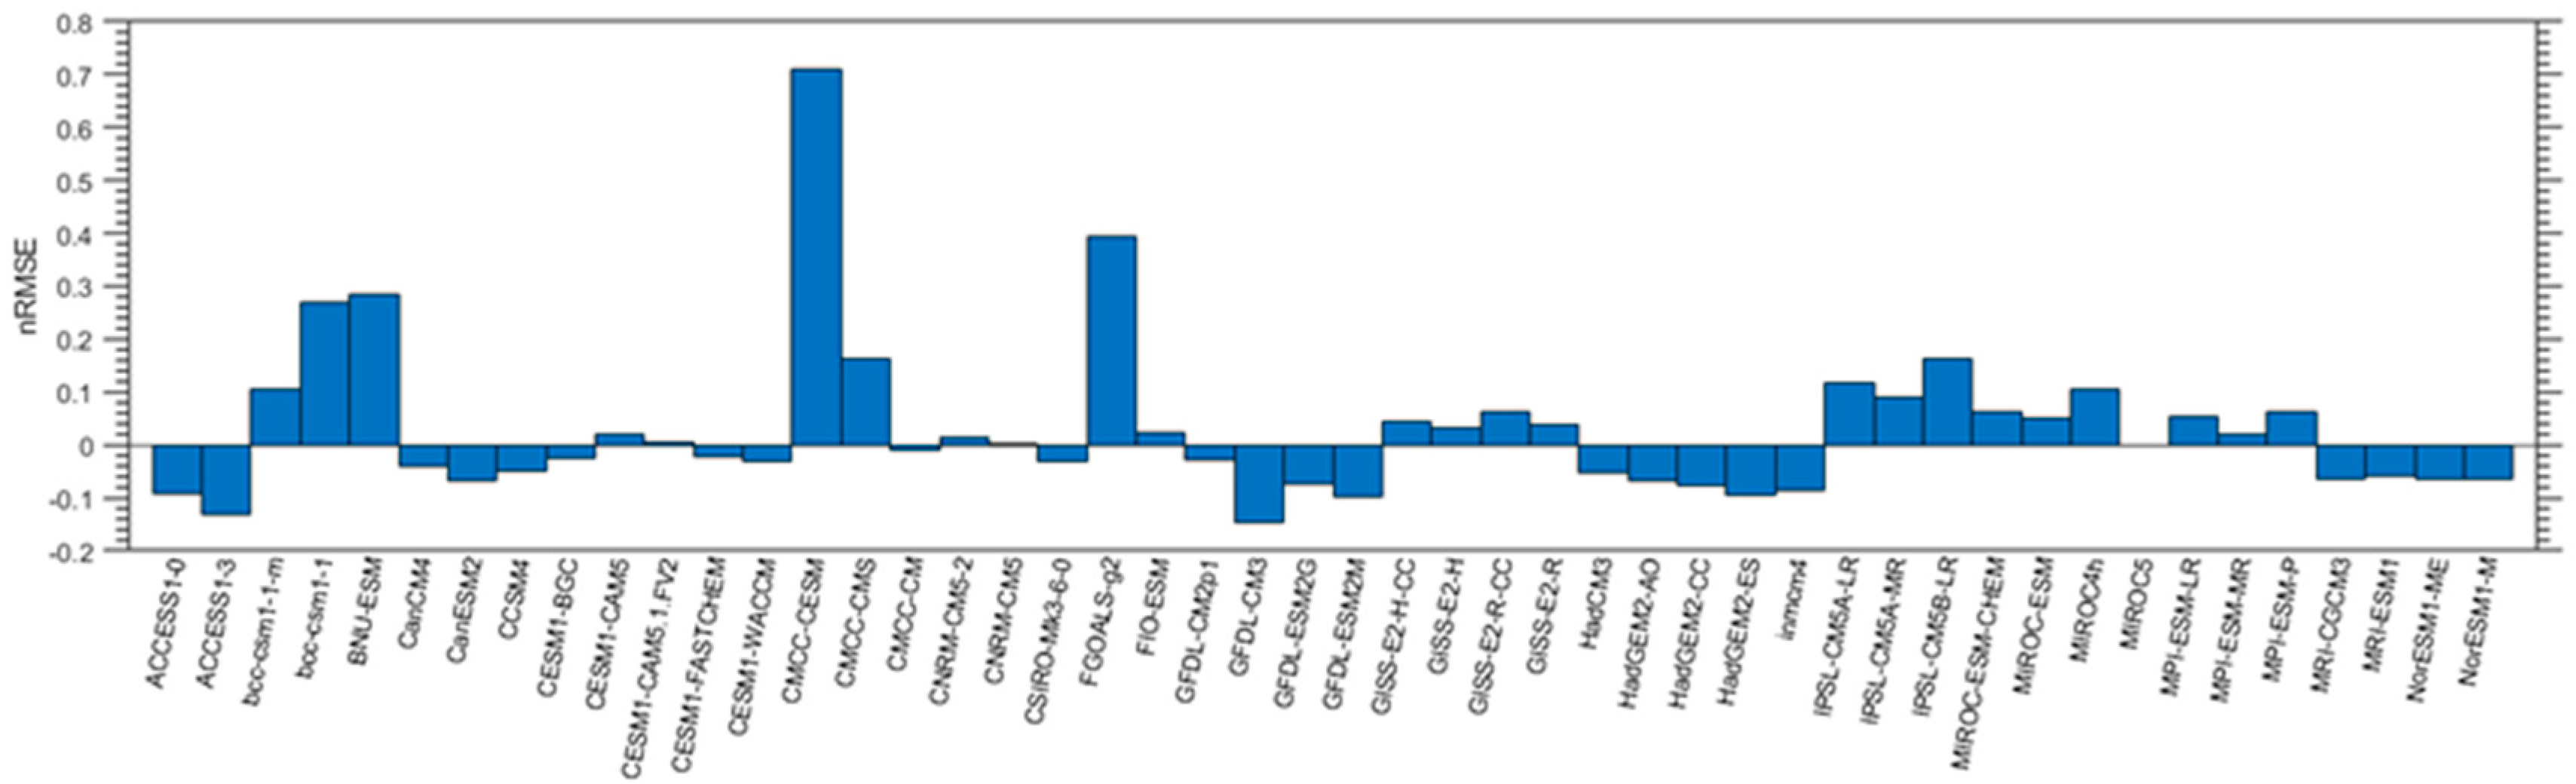
4.1. Evaluating CMIP5 GCMs SSR Simulations with Ground Measurements

The simulated SSR values on the original grid scale were directly compared with the ground SSR observations within the grid cells. Before evaluation, all the GCM SSR simulations were re-projected into a 1° × 1° spatial resolution using bilinear interpolation since they have different spatial resolutions. This study chose 44 sites from three networks with more than ten months of available SSR data between 2000 and 2005. Four statistical parameters were used to evaluate the individual GCM: R, RMSE, bias, and nRMSE. All the calculations were performed based on the monthly averages of the six year (2000–2005) time series.
The calculation results of the bias, RMSE and R for the 48 GCM SSR simulations were labeled on the scatter plots (Figure 2), and the bias, RMSE, and R histograms for the 48 GCM SSR simulations are shown in Figure 3. The biases in the GCM SSR simulations compared with the ground observations for all sites vary from −30 W m−2 to 15 W m−2 and only slightly more than half (only 26 GCMs) of the GCMs overestimate the SSR. Overall, the GCMs do not show an obvious tendency to overestimate the SSR over high-latitude areas. The absolute bias values of 28 GCM simulations are within 5 W m−2. The biases of 11 GCMs SSR simulations range from 5 to 15 W m−2. The biases of 9 GCM SSR simulations are less than −5 W m−2. The MIROC4h SSR simulations have the largest positive bias of 13.23 W m−2, followed by the GISS-E2-R-CC and GISS-E2-R SSR simulations, which have approximately the same bias values. Among the GCMs that underestimate the SSR when compared to the ground observations, the CMCC-CESM SSR simulations have the largest negative bias of approximately −28.98 W m−2, the largest RMSE and the smallest R. The underestimation of SSR over high-latitude areas may be due to an overestimation of the total cloud cover in this region [9,47].
Figure 2 also illustrates that most GCM SSR simulations result in an RMSE in the range of 20–50 W m−2 and a large R above 0.90. Figure 3b,c illustrates that most of the GCM (36 GCMs) SSR simulations have RMSEs between 25 and 30 W m−2 and R above 0.965, respectively. Among the 48 GCMs, the CMCC-CESM SSR simulations yield the maximum RMSE of 48.75 W m−2, followed by the FGOALS-g2 SSR simulations with a RMSE of 38.86 W m−2. The GFDL-CM3 SSR simulations has the smallest RMSE of 23.74 W m−2, followed by the ACCESS 1.3 SSR simulations with a RMSE of 24.18 W m−2. GCMs with higher spatial resolutions did not always have a lower RMSE than those with lower spatial resolutions (such as FGOALS-g2).
To further assess the influence of the radiation ground site selections and the quality of the measurements on the evaluation of the SSR simulations over high-latitude areas, this study repeated the above analysis with the sites from GEBA, BSRN, and GC-NET, respectively. The RMSEs at the BSRN sites for the individual GCM SSR simulations range from 15 to 40 W m−2. These RMSEs are typically smaller than those from the GEBA and the GC-Net sites. However, the absolute bias values averaged over the five BSRN sites for most GCM SSR simulations are not smaller than the absolute average bias values from the 18 GEBA and 21 GC-NET sites. The SSR is underestimated by the 48 GCMs for the BSRN sites by 1.23 W m−2, which is close to the average bias for the GC-NET sites (−0.97 W m−2), while the average bias for the GEBA sites is 1.62 W m−2. The R at the BSRN sites for the individual GCM SSR simulations are typically larger than those at the GEBA and the GC-Net sites. Meanwhile, the R averaged over the 18 GEBA sites for most GCMs SSR simulations are typically smaller than the average R for the five BSRN and 21 GC-NET sites.
To compare the RMSEs of each GCM SSR simulation more intuitively, the RMSEm and the nRMSEs were also calculated. In this analysis, the RMSEm was approximately 27.88 W m−2. As shown in Figure 4, the GCMs SSR simulations with negative nRMSEs are all greater than −0.2, which illustrates that their RMSE are only slightly smaller than the RMSEm. The RMSE of the GCM SSR simulations with positive nRMSEs are obviously larger than RMSEm. Among the GCM SSR simulations with negative nRMSEs, the GFDL-CM3 SSR simulations have the smallest nRMSE of −0.15, followed by the ACCESS1.3 (−0.13) and GFDL-ESM2M (−0.10) SSR simulations. Among the GCMs with positive nRMSEs, the CMCC-CESM SSR simulations have the largest nRMSE of 0.71, followed by the FGOALS-g2 (0.39) and BNU-ESM (0.28) SSR simulations.

4.2. Evaluating the MME Method Results with the Ground Measurements and the CERES EBAF Retrievals

This study used the SMA and BMA methods to generate higher accuracy SSR estimations by combining 48 GCMs SSR simulations. Figure 5 shows the weights of the individual GCMs calculated by the BMA method. The weights vary across GCMs. The greatest contributor to the SSR ensemble is the GFDL-ESM2G which has the largest weight (0.0272), more than 30% larger than the priori weight (0.0208), followed by GFDL-ESM2M (0.0259), CESM1-CAM5.1.FV2 (0.0254), and HadCM3 (0.0250). The weight of FGOALS-g2 is only 0.0123, which is about 40% lower than the priori weight, because of its relatively poor performance.
Based on Figure 6, obvious and expected improvements in R occur for the results of the BMA method; specifically, the bias is 0.10 W m−2 and the RMSE is 16.79 W m−2, which are lower than those of the SMA method. Although Figure 6 shows that the estimations from the BMA and SMA methods have clear advantages over the CERES EBAF retrievals in reducing the biases, the estimations of the two methods neither reduce the RMSE nor increase the R compared with the CERES EBAF retrievals.
The SSR estimations from the SMA and BMA methods were also compared with the CERES EBAF SSR retrievals over high-latitude areas as shown in Figure 7. Bilinear interpolations are applied, to make the spatial resolution of these gridded GCM SSR simulations with different spatial resolutions consistent with that of the CERES EBAF SSR retrievals with a 1° × 1° spatial resolution.
Figure 7a,b shows the geographical distribution of the differences between the BMA results and the CERES EBAF retrievals and between the SMA results and the CERES EBAF retrievals from 2000 to 2005, respectively. There are obvious geographical patterns in the differences over high-latitude areas, which may be attributed to the uncertainties in the representation of the cloud microphysical processes in the GCMs. From Figure 7a, the BMA estimations commonly show positive biases over inland Antarctica, the seas around Antarctica, and the seas of the Arctic Ocean (the Greenland Sea, the Labrador Sea, and the Barents Sea). However, negative biases are found in many other regions, particularly in the high-latitude areas of Eurasia and North America, the central part of the Arctic Ocean, much of Greenland, and the coast of Antarctica. The largest negative bias is found in Iceland, up to −36.67 W m−2, and the largest positive bias is found in eastern seas near Antarctica, up to 26.70 W m−2.
To directly compare the geographical distribution of the SMA results and the BMA results, we calculate the different SSR values between the SMA results and the BMA results (Figure 7c). The geographical differences between the BMA results and the SMA results are much more distinct than the statistical calculation results (Figure 6). From Figure 7c, relative to the SMA results, the BMA results yield lower SSR over almost all the high-latitude areas, except Greenland and coastal areas of Antarctica. Grids with large SSR differences are concentrated in the coastal regions of Antarctica and Greenland, Europe, and Iceland and the seas around them. This geographical dissimilarity is mainly attributed to the differences weights assigned by the BMA method to different GCM SSR simulations, and the BMA results are more accurate than the SMA results.
Figure 8 and Figure 9 show the seasonal geographical distributions of the differences between the BMA results and the CERES EBAF retrievals and between the SMA results and the CERES EBAF retrievals over high-latitude areas, respectively. It is obvious that the differences are typically larger over high-latitude areas during local spring (MAM in the Northern Hemisphere and SON in the Southern Hemisphere) when the sea ice begins to melt in summer (JJA in the Northern Hemisphere and DJF in the Southern Hemisphere). During local fall (SON in the Northern Hemisphere and MAM in the Southern Hemisphere) and winter (DJF in the Northern Hemisphere and JJA in the Southern Hemisphere), the situation is the opposite. Since the SMA and BMA difference results have similar seasonal geographical distributions, this study only analyses the results of the BMA method (Figure 8).
During spring in the Northern Hemisphere, the BMA method tends to overestimate the SSR over the Norwegian Sea, the Danish Strait, and the Davis Strait, and underestimate the SSR over the land and the central Arctic Ocean compared with the CERES EBAF. In the Southern Hemisphere, the SSR is overestimated over the Weddell Sea and the Ross Sea, and over the coastal areas of the Antarctic continent. During summer, the underestimation of the SSR is the most prominent over the central Arctic region, with local positive biases presented around the ocean near Greenland and the Canadian Arctic Archipelago and the ocean and land near the Bering Strait. The ocean near Greenland and the land of Eurasia and North America shows a widespread overestimation.
Figure 8c,g shows the differences in the SSR between the BMA results and the CERES EBAF during fall. In the Northern Hemisphere, the central Arctic Ocean, Europe, Iceland, Alaska, and coast of Greenland are the areas with the most obvious underestimations. In the Southern Hemisphere, the south Atlantic and the Bellingshausen Sea show a large underestimation, while the rest of the ocean typically shows a large overestimation. The coast of Antarctica shows a large underestimation, while the central and eastern areas of Antarctica show a large overestimation. As shown in Figure 8d, the underestimation of the SSR during winter occurs primarily over the coasts. The BMA results over coasts are approximately 5 W m−2 and 20 W m−2 lower than the CERES EBAF retrievals in the Northern Hemisphere and the Southern Hemisphere, respectively. The overestimation of the SSR over ocean is approximately 5 W m−2 and 20 W m−2 larger than the CERES EBAF retrievals in the Northern Hemisphere and the Southern Hemisphere, respectively.
To further investigate the precision differences of the SSR estimates in the bright (spring and summer) and dark (fall and winter) seasons, we also compared the seasonal geographical distribution of the normalized differences between the MME results and the CERES EBAF retrievals from 2000 to 2005. The normalized values were obtained by the SSR estimates divided by the mean SSR for the respective season. It was found that the normalized differences between the MME results and CERES EBAF retrievals were smaller than those for the unnormalized differences in both the Northern and the Southern Hemispheres in each season, but such differences between the bright and dark seasons were still obvious. This large seasonal discrepancy indicated that the GCM SSR simulations exhibited different precision in the bright and dark seasons.

4.3. Comparing and Evaluating the GCM Simulations and the MME Results with the CERES EBAF Retrievals

It has been reported that some of the CMIP5 GCMs have large biases when simulating cloud water and ice paths compared to satellite retrievals [36], and clouds can have a significant influence on the SSR simulation. To understand the differences between the GCMs and the CERES EBAF in estimating the SSR over high-latitude areas, this study calculated the bias, RMSE, R, and NSE values of each GCM simulations compared with the CERES EBAF retrievals, as shown in Figure 10 and Figure 11. In addition, this study also used Taylor diagrams (Figure 12 and Figure 13) to show the gaps among the SSR outputs from the individual GCMs, the SMA method and the BMA method and the CERES EBAF.
In the Northern Hemisphere, as shown in Figure 10a, most of the GCM SSR simulations exhibit relatively greater RMSE values in boreal summer than those in other seasons. A total of 39 out of 48 GCM SSR simulations show an underestimation tendency compared with ground measurements in summer (JJA). The possible reason may be that the GCMs have difficulties in capturing the insulating effect of clouds, since cloud properties represented by GCM SSR estimation models are one of the most important factors in regulating the estimated SSR. The SSR simulations from BMA method have the smallest RMSE values compared to any SSR estimates from individual GCM and the SMA method. Figure 10b shows that the absolute bias values of GCM SSR simulations are relatively smaller in fall (SON) and winter (DJF), but greater in summer (JJA). Figure 10c illustrates the R values of the SSR estimates. It is obvious that the R values for each GCM and the MME method are relatively small in summer (JJA). As shown in Figure 10d, all the NSE values of SSR estimates are greater than zero, except the BNU-ESM (−0.17) and CMCC-CESM (−0.87). The NSE values of the SSR estimations from individual GCMs, the SMA method, and the BMA method in spring (MAM), fall (SON), and winter (DJF) are greater than those in summer (JJA). Among the individual GCM SSR simulations, the NSE values of GFDL-CM3 (0.94), HadGEM2-CC (0.77), inmcm4(0.95), and GISS-E2-R-CC (0.97) SSR simulations are the greatest ones in local spring, summer, fall, and winter, respectively.
In the Southern Hemisphere, as shown in Figure 11a, the SSR evaluation results are similar to those in the Northern Hemisphere in the local spring, fall, and winter seasons. The biases shown in Figure 11b indicate that the underestimation tendency in the Northern Hemisphere does not exist in Southern Hemisphere. As shown in Figure 11c, the R values of the SSR estimates are greater than those in Northern Hemisphere, especially in summer. In both Northern and Southern Hemispheres, the BMA method SSR simulations have greater NSE values than any individual GCM and the SMA method SSR simulations.
In both the Hemispheres, the Taylor diagrams (Figure 12 and Figure 13) show that the MME methods generally have better performance in simulating the SSR than the individual GCMs, except in local winter. According to these figures, it is obvious that the distribution of the spots is relatively scattered in local summer. It indicates that the differences in uncertainty of GCM SSR simulations are greater in local summer than in other seasons for both Northern and Southern Hemispheres. Additionally, the performance of the CERES EBAF SSR retrievals is not always the best among the SSR estimations from individual GCMs, SMA method, and BMA method in four seasons (Figure 12 and Figure 13). Therefore, we conclude that the BMA method exhibited relatively better performance in simulating SSR compared to individual GCMs and the SMA method.

5. Discussion

In this study, we evaluated the SSR simulations and intercompared the performance of both the SMA and BMA methods for estimating the SSR in high-latitude areas using quality-controlled surface observations at 44 sites from three SSR observation networks (BSRN, GC-NET, and GEBA) and the CERES EBAF SSR retrievals from 2000 to 2005.
The evaluation results indicated that the precision of each GCM SSR simulations were quite different and GCMs with higher spatial resolutions did not guarantee better performance in simulating SSR. Relative to ground observations, the bias, RMSE, and R values of the SSR simulations ranged from −30 W m−2 to 15 W m−2, 20 W m−2 to 50 W m−2 and 0.94 to 0.99, respectively. Previous studies showed that the GCM SSR simulations exhibit a tendency toward excessive SSR at the Earth’s surface [11]. However, the validation results indicated that the GCM SSR simulations did not show an obvious tendency to overestimate the SSR over high-latitude areas in this study. Only slightly more than half of the GCMs (26 out of the 48 GCMs) overestimated the SSR over high-latitude areas when compared with the ground observations, although some discrepancies between the current GCM SSR simulations and ground measurements still existed over high-latitude areas. Cloud and aerosol properties represented by the GCMs are two important factors in regulating the estimated SSR [9]. The GCMs have been reported to overestimate aerosol optical thickness [48] and total cloud cover over high-latitude areas [9,36,47]. Thus, the excessive total cloud cover and aerosol optical thickness possibly contribute to the offset of the overestimation of the SSR in many of the GCMs. More data including the parameters related to cloud and aerosol are needed to conduct further investigation over high-latitude areas.
Besides cloud and aerosols, measurement errors, such as instrument replacement and drift and spatial representativeness of ground measurements were also potential error sources of SSR evaluations. For example, the monthly representation errors at the surface sites with respect to their 1° surroundings are on average 3.7% (4 W m−2) [49]. The GCMs have different spatial resolution that varies from 0.56° × 0.56° to 3.75° × 3.75° which might cause certain biases for the SSR evaluation.
The function of the BMA method for the improvements of the SSR estimations was estimated based on the change in statistical calculations and Taylor diagrams. The performance of the BMA method was superior to that of any single GCM in simulating the SSR over high-latitude areas, especially during summer. Our results also showed that the use of different weights obtained by the BMA method for each GCM based on its performance can be a good alternative to the SMA method. The BMA simulations were also compared with the CERES EBAF retrievals, and there were noteworthy geographical patterns in the differences between them over high-latitude areas.
Generally, the MME methods where the GCM weights are determined by the GCMs prior performance performs better than the SMA method, e.g., [24,50,51,52,53,54]. Some studies have also obtained similar estimates generated by different MME methods (e.g., [24,55]), which partially reflects the alleged “equifinality” in which different combinations of GCM weights produce identical fit to the ground measurements. The performance of BMA method may be influenced by the training sample sizes. Although the advantage of BMA method was not apparent in this study, the BMA method provides a new option to generate more accurate SSR simulations through the entire ensemble of the model first considered.

Author Contributions

Conceptualization, X.Z.; data curation, W.Z.; supervision, X.Z. and W.L.; writing—original draft, W.Z.; writing—review and editing, X.Z., W.L., N.H., Y.W., K.J., Y.Y., and J.C.

Funding

This research was funded in part by the National Key Research and Development Program of China under Grants 2017YFA0603002 and 2016YFA0600102, in part by the National Natural Science Foundation of China under Grant 41571340.

Acknowledgments

CERES-EBAF data were obtained through the NASA Langley Research Center CERES ordering tool at http://ceres.larc.nasa.gov/. CMIP5 GCM SSR simulations were downloaded from http://cmip-pcmdi.llnl.gov/cmip5/. The in situ SSR data collected at the GC-NET, BSRN, and GEBA station in the high latitude areas are available at http://cires1.colorado.edu/science/groups/steffen/gcnet/, http://bsrn.awi.de/, and http://www.geba.ethz.ch/, respectively. The authors would like to thank the anonymous reviewers and editors for their valuable suggestions.

Conflicts of Interest

The authors declare no conflict of interest.

References

  1. Wu, H.R.; Zhang, X.T.; Liang, S.L.; Yang, H.; Zhou, G.Q. Estimation of clear-sky land surface longwave radiation from MODIS data products by merging multiple models. J. Geophys. Res. Atmos. 2012, 117. [Google Scholar] [CrossRef]
  2. Zhang, X.T.; Liang, S.L.; Wang, G.X.; Yao, Y.J.; Jiang, B.; Cheng, J. Evaluation of the reanalysis surface incident shortwave radiation products from NCEP, ECMWF, GSFC, and JMA using satellite and surface observations. Remote Sens. 2016, 8, 225. [Google Scholar] [CrossRef]
  3. Mercado, L.M.; Bellouin, N.; Sitch, S.; Boucher, O.; Huntingford, C.; Wild, M.; Cox, P.M. Impact of changes in diffuse radiation on the global land carbon sink. Nature 2009, 458, 1014–1017. [Google Scholar] [CrossRef] [Green Version]
  4. Gupta, S.K.; Ritchey, N.A.; Wilber, A.C.; Whitlock, C.H.; Gibson, G.G.; Stackhouse, P.W. A climatology of surface radiation budget derived from satellite data. J. Clim. 1999, 12, 2691–2710. [Google Scholar] [CrossRef]
  5. Ramanathan, V.; Crutzen, P.J.; Kiehl, J.T.; Rosenfeld, D. Aerosols, climate, and the hydrological cycle. Science 2001, 294, 2119–2124. [Google Scholar] [CrossRef] [PubMed]
  6. Zhang, X.T.; Liang, S.L.; Wild, M.; Jiang, B. Analysis of surface incident shortwave radiation from four satellite products. Remote Sens. Environ. 2015, 165, 186–202. [Google Scholar] [CrossRef]
  7. Abadi, A.M.; Oglesby, R.; Rowe, C.; Mawalagedara, R. Evaluation of GCMs historical simulations of monthly and seasonal climatology over Bolivia. Clim. Dyn. 2018, 51, 733–754. [Google Scholar] [CrossRef]
  8. Seiler, C.; Hutjes, R.W.A.; Kabat, P. Likely ranges of climate change in Bolivia. J. Appl. Meteor. Climatol. 2013, 52, 1303–1317. [Google Scholar] [CrossRef]
  9. Ma, Q.; Wang, K.C.; Wild, M. Impact of geolocations of validation data on the evaluation of surface incident shortwave radiation from Earth System Models. J. Geophys. Res. Atmos. 2015, 120, 6825–6844. [Google Scholar] [CrossRef] [Green Version]
  10. Wild, M.; Folini, D.; Hakuba, M.Z.; Schaer, C.; Seneviratne, S.I.; Kato, S.; Rutan, D.A.; Ammann, C.; Wood, E.F.; Koenig-Langlo, G. The energy balance over land and oceans: An assessment based on direct observations and CMIP5 climate models. Clim. Dyn. 2015, 44, 3393–3429. [Google Scholar] [CrossRef]
  11. Wild, M.; Folini, D.; Schar, C.; Loeb, N.; Dutton, E.G.; Konig-Langlo, G. The global energy balance from a surface perspective. Clim. Dyn. 2013, 40, 3107–3134. [Google Scholar] [CrossRef]
  12. Fang, M.; Li, X. Application of Bayesian model averaging in the reconstruction of past climate change using PMIP3/CMIP5 multimodel ensemble simulations. J. Clim. 2016, 29, 175–189. [Google Scholar] [CrossRef]
  13. Riihela, A.; Laine, V.; Manninen, T.; Palo, T.; Vihma, L. Validation of the Climate-SAF surface broadband albedo product: Comparisons with in situ observations over Greenland and the ice-covered Arctic Ocean. Remote Sens. Environ. 2010, 114, 2779–2790. [Google Scholar] [CrossRef]
  14. Boeke, R.C.; Taylor, P.C. Evaluation of the Arctic surface radiation budget in CMIP5 models. J. Geophys. Res. Atmos. 2016, 121, 8525–8548. [Google Scholar] [CrossRef]
  15. Frouin, R.; Franz, B.A.; Werdell, P.J. The SeaWiFS PAR product. NASA Tech. Memo. SeaWIFS Postlaunch Tech. Rep. Ser. 2003, 46–50. [Google Scholar]
  16. Riihela, A.; Key, J.R.; Meirink, J.F.; Munneke, P.K.; Palo, T.; Karlsson, K.G. An intercomparison and validation of satellite-based surface radiative energy flux estimates over the Arctic. J. Geophys. Res. Atmos. 2017, 122, 4829–4848. [Google Scholar] [CrossRef]
  17. Taylor, K.E.; Stouffer, R.J.; Meehl, G.A. An overview of CMIP5 and the experiment design. Bull. Am. Meteorol. Soc. 2012, 93, 485–498. [Google Scholar] [CrossRef]
  18. Chen, Y.; Yuan, W.P.; Xia, J.Z.; Fisher, J.B.; Dong, W.J.; Zhang, X.T.; Liang, S.L.; Ye, A.Z.; Cai, W.W.; Feng, J.M. Using Bayesian model averaging to estimate terrestrial evapotranspiration in China. J. Hydrol. 2015, 528, 537–549. [Google Scholar] [CrossRef]
  19. Yao, Y.J.; Liang, S.L.; Li, X.L.; Hong, Y.; Fisher, J.B.; Zhang, N.N.; Chen, J.Q.; Cheng, J.; Zhao, S.H.; Zhang, X.T.; et al. Bayesian multimodel estimation of global terrestrial latent heat flux from eddy covariance, meteorological, and satellite observations. J. Geophys. Res. Atmos. 2014, 119, 4521–4545. [Google Scholar] [CrossRef]
  20. Miao, C.Y.; Duan, Q.Y.; Sun, Q.H.; Li, J.D. Evaluation and application of Bayesian multi-model estimation in temperature simulations. Prog. Phys. Geogr. 2013, 37, 727–744. [Google Scholar] [CrossRef]
  21. Doblas-Reyes, F.J.; Hagedorn, R.; Palmer, T.N. The rationale behind the success of multi-model ensembles in seasonal forecasting—II. Calibration and combination. Tellus A 2005, 57, 234–252. [Google Scholar] [CrossRef]
  22. Stephenson, D.B.; Coelho, C.A.S.; Doblas-Reyes, F.J.; Balmaseda, M. Forecast assimilation: A unified framework for the combination of multi-model weather and climate predictions. Tellus A 2005, 57, 253–264. [Google Scholar] [CrossRef]
  23. Demirel, M.C.; Moradkhani, H. Assessing the impact of CMIP5 climate multi-modeling on estimating the precipitation seasonality and timing. Clim. Chang. 2016, 135, 357–372. [Google Scholar] [CrossRef]
  24. Miao, C.Y.; Duan, Q.Y.; Sun, Q.H.; Huang, Y.; Kong, D.X.; Yang, T.T.; Ye, A.Z.; Di, Z.H.; Gong, W. Assessment of CMIP5 climate models and projected temperature changes over Northern Eurasia. Environ. Res. Lett. 2014, 9. [Google Scholar] [CrossRef]
  25. Sun, Q.H.; Miao, C.Y.; Duan, Q.Y. Extreme climate events and agricultural climate indices in China: CMIP5 model evaluation and projections. Int. J. Climatol. 2016, 36, 43–61. [Google Scholar] [CrossRef]
  26. Ajami, N.K.; Duan, Q.Y.; Sorooshian, S. An integrated hydrologic Bayesian multimodel combination framework: Confronting input, parameter, and model structural uncertainty in hydrologic prediction. Water Resour. Res. 2007, 43. [Google Scholar] [CrossRef]
  27. Ohmura, A.; Dutton, E.G.; Forgan, B.; Frohlich, C.; Gilgen, H.; Hegner, H.; Heimo, A.; Konig-Langlo, G.; McArthur, B.; Muller, G.; et al. Baseline Surface Radiation Network (BSRN/WCRP): New precision radiometry for climate research. Bull. Am. Meteorol. Soc. 1998, 79, 2115–2136. [Google Scholar] [CrossRef]
  28. Steffen, K.; Box, J.E.; Abdalati, W. Greenland Climate Network: GC-Net, CRREL 96–27 Special Report on Glaciers, Ice Sheets and Volcanoes; Colbeck, S.C., Ed.; Trib. To M. Meier; Greenland Climate Network: Boulder, CO, USA, 1996. [Google Scholar]
  29. Gilgen, H.; Wild, M.; Ohmura, A. Means and trends of shortwave irradiance at the surface estimated from global energy balance archive data. J. Clim. 1998, 11, 2042–2061. [Google Scholar] [CrossRef]
  30. Feng, F.; Wang, K.C. Merging satellite retrievals and reanalyses to produce global long-term and consistent surface incident solar radiation datasets. Remote Sens. 2018, 10, 115. [Google Scholar] [CrossRef]
  31. Box, J.E.; Steffen, K. Sublimation on the Greenland ice sheet from automated weather station observations. J. Geophys. Res. Atmos. 2001, 106, 33965–33981. [Google Scholar] [CrossRef]
  32. Wang, W.S.; Zender, C.S.; van As, D.; Miller, N.B. Spatial distribution of melt season cloud radiative effects over Greenland: Evaluating satellite observations, reanalyses, and model simulations against in situ measurements. J. Geophys. Res. Atmos. 2019, 124, 57–71. [Google Scholar] [CrossRef]
  33. Wild, M.; Ohmura, A.; Schar, C.; Muller, G.; Folini, D.; Schwarz, M.; Hakuba, M.Z.; Sanchez-Lorenzo, A. The Global Energy Balance Archive (GEBA) version 2017: A database for worldwide measured surface energy fluxes. Earth Syst. Sci. Data 2017, 9, 601–613. [Google Scholar] [CrossRef]
  34. Gilgen, H.; Ohmura, A. The global energy balance archive. Bull. Am. Meteorol. Soc. 1999, 80, 831–850. [Google Scholar] [CrossRef]
  35. Rahimikhoob, A.; Behbahani, S.M.R.; Banihabib, M.E. Comparative study of statistical and artificial neural network’s methodologies for deriving global solar radiation from NOAA satellite images. Int. J. Climatol. 2013, 33, 480–486. [Google Scholar] [CrossRef]
  36. Lenaerts, J.T.M.; Van Tricht, K.; Lhermitte, S.; L’Ecuyer, T.S. Polar clouds and radiation in satellite observations, reanalyses, and climate models. Geophys. Res. Lett. 2017, 44, 3355–3364. [Google Scholar] [CrossRef]
  37. Kato, S.; Rose, F.G.; Rutan, D.A.; Thorsen, T.J.; Loeb, N.G.; Doelling, D.R.; Huang, X.L.; Smith, W.L.; Su, W.Y.; Ham, S.H. Surface irradiances of edition 4.0 clouds and the earth’s radiant energy system (CERES) energy balanced and filled (EBAF) data product. J. Clim. 2018, 31, 4501–4527. [Google Scholar] [CrossRef]
  38. Minnis, P.; Sun-Mack, S.; Young, D.F.; Heck, P.W.; Garber, D.P.; Chen, Y.; Spangenberg, D.A.; Arduini, R.F.; Trepte, Q.Z.; Smith, W.L.; et al. CERES Edition-2 cloud property retrievals using TRMM VIRS and Terra and Aqua MODIS data—Part I: Algorithms. IEEE Trans. Geosci. Remote Sens. 2011, 49, 4374–4400. [Google Scholar] [CrossRef]
  39. Kato, S.; Loeb, N.G.; Rose, F.G.; Doelling, D.R.; Rutan, D.A.; Caldwell, T.E.; Yu, L.S.; Weller, R.A. Surface irradiances consistent with CERES-derived top-of-atmosphere shortwave and longwave irradiances. J. Clim. 2013, 26, 2719–2740. [Google Scholar] [CrossRef]
  40. Wilson, L.J.; Beauregard, S.; Raftery, A.E.; Verret, R. Calibrated surface temperature forecasts from the Canadian ensemble prediction system using Bayesian model averaging. Mon. Weather Rev. 2007, 135, 1364–1385. [Google Scholar] [CrossRef]
  41. Leamer, E.E. Regression selection strategies and priors. J. Am. Stat. Assoc. 1978, 73, 580–587. [Google Scholar] [CrossRef]
  42. Kass, R.E.; Raftery, A.E. Bayes factors. J. Am. Stat. Assoc. 1995, 90, 773–795. [Google Scholar] [CrossRef]
  43. Fisher, R.A. On the mathematical foundations of theoretical statistics. Philos. Trans. R. Soc. Lond. A 1922, 222, 309–368. [Google Scholar] [CrossRef] [Green Version]
  44. Raftery, A.E.; Gneiting, T.; Balabdaoui, F.; Polakowski, M. Using Bayesian model averaging to calibrate forecast ensembles. Mon. Weather Rev. 2005, 133, 1155–1174. [Google Scholar] [CrossRef]
  45. Dempster, A.P.; Laird, N.M.; Rubin, D.B. Maximum likelihood from incomplete data via the EM algorithm. J. R. Stat. Soc. Series B 1977, 39, 1–38. [Google Scholar] [CrossRef]
  46. Gleckler, P.J.; Taylor, K.E.; Doutriaux, C. Performance metrics for climate models. J. Geophys. Res. Atmos. 2008, 113. [Google Scholar] [CrossRef]
  47. Li, J.L.F.; Waliser, D.E.; Stephens, G.; Lee, S.; L’Ecuyer, T.; Kato, S.; Loeb, N.; Ma, H.Y. Characterizing and understanding radiation budget biases in CMIP3/CMIP5 GCMs, contemporary GCM, and reanalysis. J. Geophys. Res. Atmos. 2013, 118, 8166–8184. [Google Scholar] [CrossRef]
  48. Glantz, P.; Bourassa, A.; Herber, A.; Iversen, T.; Karlsson, J.; Kirkevag, A.; Maturilli, M.; Seland, O.; Stebel, K.; Struthers, H.; et al. Remote sensing of aerosols in the Arctic for an evaluation of global climate model simulations. J. Geophys. Res. Atmos. 2014, 119, 20. [Google Scholar] [CrossRef]
  49. Hakuba, M.Z.; Folini, D.; Sanchez-Lorenzo, A.; Wild, M. Spatial representativeness of ground-based solar radiation measurements. J. Geophys. Res. Atmos. 2013, 118, 8585–8597. [Google Scholar] [CrossRef] [Green Version]
  50. Min, S.K.; Hense, A. A Bayesian approach to climate model evaluation and multi-model averaging with an application to global mean surface temperatures from IPCC AR4 coupled climate models. Geophys. Res. Lett. 2006, 33, 5. [Google Scholar] [CrossRef]
  51. Sloughter, J.M.; Raftery, A.E.; Gneiting, T.; Fraley, C. Probabilistic quantitative precipitation forecasting using Bayesian model averaging. Mon. Weather Rev. 2007, 135, 3209–3220. [Google Scholar] [CrossRef]
  52. Wang, Q.J.; Schepen, A.; Robertson, D.E. Merging seasonal rainfall forecasts from multiple statistical models through Bayesian model averaging. J. Clim. 2012, 25, 5524–5537. [Google Scholar] [CrossRef]
  53. Yang, T.; Hao, X.B.; Shao, Q.X.; Xu, C.Y.; Zhao, C.Y.; Chen, X.; Wang, W.G. Multi-model ensemble projections in temperature and precipitation extremes of the Tibetan Plateau in the 21st century. Glob. Planet. Chang. 2012, 80–81, 1–13. [Google Scholar] [CrossRef]
  54. Zhang, X.S.; Srinivasan, R.; Bosch, D. Calibration and uncertainty analysis of the SWAT model using genetic algorithms and Bayesian model averaging. J. Hydrol. 2009, 374, 307–317. [Google Scholar] [CrossRef]
  55. Duan, Q.Y.; Phillips, T.J. Bayesian estimation of local signal and noise in multimodel simulations of climate change. J. Geophys. Res. Atmos. 2010, 115. [Google Scholar] [CrossRef]
Figure 1. Geographical distributions of the observation sites (44 sites in total) used in this study from Baseline Surface Radiation Network (BSRN) (5 sites in blue dots), Greenland Climate Network (GC-NET) (21 sites in green triangles), and Global Energy Balance Archive (GEBA) (18 sites in pink asterisks).
Remotesensing 11 01776 g001
Figure 2. Scatterplots of the monthly surface incident shortwave radiation (SSR) observations from 44 sites (red dots: surface observations from BSRN sites, black dots: surface observations from GC-NET sites, blue dots: surface observations from GEBA) and individual general circulation models (GCMs) simulations from 2000 to 2005 (in units of W m−2).
Remotesensing 11 01776 g002
Figure 3. Bias (a), root mean squared errors (RMSE) (a) and R (c) histograms for monthly SSR simulations from 48 GCMs.
Remotesensing 11 01776 g003
Figure 4. Normalized root mean squared errors (nRMSEs) of monthly SSR estimated from GCMs from 2000 to 2005.
Remotesensing 11 01776 g004
Figure 5. Relative weights of 48 GCMs calculated by the Bayesian model averaging (BMA) method.
Remotesensing 11 01776 g005
Figure 6. Evaluation of monthly SSR estimated from the Clouds and the Earth’s Radiant Energy System, Energy Balanced and Filled (CERES EBAF), simple model averaging (SMA) method, and BMA method from 2000 to 2005 (in units of W m−2).
Remotesensing 11 01776 g006
Figure 7. Geographical distribution of the different values (a) between the BMA results and the CERES EBAF retrievals, (b) between the SMA results and the CERES EBAF retrievals, and (c) between the SMA results and the BMA results from 2000 to 2005 (in units of W m−2). The results shown in (c) is 1–2 orders of magnitude smaller than those in (a) and (b).
Remotesensing 11 01776 g007
Figure 8. Seasonal geographical distribution of the different values between the BMA results and the CERES EBAF retrievals from 2000 to 2005; (ad) and (eh) are in local spring, summer, fall, and winter in the Southern and Northern Hemispheres, respectively (in units of W m−2).
Remotesensing 11 01776 g008
Figure 9. Seasonal geographical distribution of the different values between the SMA results and the CERES EBAF retrievals from 2000 to 2005. (ad) and (eh) are in local spring, summer, fall, and winter in the South and Northern Hemispheres, respectively (in units of W m−2).
Remotesensing 11 01776 g009
Figure 10. Seasonal statistical results of the SSR simulations from 48 GCMs in CMIP5 with the CERES EBAF retrievals from 2000 to 2005 in the Northern Hemisphere. (a) RMSE, (b) Bias, (c) R, (d) NSE (in units of W m−2).
Remotesensing 11 01776 g010
Figure 11. Seasonal statistical results of the SSR simulations from 48 GCMs in CMIP5 with the CERES EBAF retrievals from 2000 to 2005 in the Southern Hemisphere. (a) RMSE, (b) Bias, (c) R, (d) NSE (in units of W m−2).
Remotesensing 11 01776 g011
Figure 12. Taylor diagram of the estimations from the SMA method, the BMA method, the CERES EBAF, and the 48 GCMs over high-latitude areas from 2000 to 2005 in the Northern Hemisphere. The SMA method, the BMA method, the CERES EBAF, and the 48 GCMs are represented by purple, green, blue, and black dots, respectively. (a) Spring, (b) Summer, (c) fall, (d) winter.
Remotesensing 11 01776 g012
Figure 13. Taylor diagram of the estimations from the SMA method, the BMA method, the CERES EBAF, and the 48 GCMs over high-latitude areas from 2000 to 2005 in the Southern Hemisphere. The SMA method, the BMA method, the CERES EBAF, and the 48 GCMs are represented by purple, green, blue, and black dots, respectively. (a) Spring, (b) summer, (c) fall, (d) winter.
Remotesensing 11 01776 g013
Table 1. Detailed information of the Coupled Model Intercomparison Project (CMIP5) general circulation models (GCMs) used in this study.
IDModel NameInstitute IDCountryResolution
1ACCESS1.0CSIRO-BOMAustralia1.88° × 1.24°
2ACCESS1.3CSIRO-BOMAustralia1.88° × 1.24°
3BCC-CSM1.1(m)BCCChina1.13° × 1.13°
4BCC-CSM1.1BCCChina2.81° × 2.81°
5BNU-ESMGCESSChina2.81° × 2.81°
6CanCM4CCCMACanada2.81° × 2.81°
7CanESM2CCCMACanada2.81° × 2.81°
8CCSM4NCARUSA1.25° × 0.94°
9CESM1-BGCNSF-DOE-NCARUSA1.25° × 0.94°
10CESM1-CAM5NSF-DOE-NCARUSA1.25° × 0.94°
11CESM1-CAM5.1.FV2NSF-DOE-NCARUSA2.50° × 1.88°
12CESM1-FASTCHEMNSF-DOE-NCARUSA1.25° × 0.94°
13CESM1-WACCMNSF-DOE-NCARUSA2.50° × 1.88°
14CMCC-CESMCMCCItaly3.75° × 3.75°
15CMCC-CMSCMCCItaly1.88° × 1.88°
16CMCC-CMCMCCItaly0.75° × 0.75°
17CNRM-CM5.2CNRM-CERFACSFrance1.41° × 1.41°
18CNRM-CM5CNRM-CERFACSFrance1.41° × 1.41°
19CSIRO-Mk3.6.0CSIRO-QCCCEAustralia1.88° × 1.88°
20FGOALS-g2LASG-CESSChina2.81° × 3.00°
21FIO-ESMFIOChina2.81° × 2.81°
22GFDL-CM2p1NOAA GFDLUSA2.50° × 2.00°
23GFDL-CM3NOAA GFDLUSA2.50° × 2.00°
24GFDL-ESM2GNOAA GFDLUSA2.50° × 2.00°
25GFDL-ESM2MNOAA GFDLUSA2.50° × 2.00°
26GISS-E2-H-CCNOAA GISSUSA2.50° × 2.00°
27GISS-E2-HNOAA GISSUSA2.50° × 2.00°
28GISS-E2-R-CCNOAA GISSUSA2.50° × 2.00°
29GISS-E2-RNOAA GISSUSA2.50° × 2.00°
30HadCM3MOHCUK3.75° × 3.47°
31HadGEM2-AONIMR/KMAKorea/UK1.88° × 1.24°
32HadGEM2-CCMOHCUK1.88° × 1.24°
33HadGEM2-ESMOHCUK1.88° × 1.24°
34INM-CM4UNMRussia2.00° × 1.50°
35IPSL-CM5A-LRIPSLFrance3.75° × 1.88°
36IPSL-CM5A-MRIPSLFrance2.50° × 1.26°
37IPSL-CM5B-LRIPSLFrance3.75° × 1.88°
38MIROC-ESM-CHEMMIROCJapan2.81° × 2.81°
39MIROC-ESMMIROCJapan2.81° × 2.81°
40MIROC4hMIROCJapan0.56° × 0.56°
41MIROC5MIROCJapan1.41° × 1.41°
42MPI-ESM-LRMPI-MGermany1.88° × 1.88°
43MPI-ESM-MRMPI-MGermany1.88° × 1.88°
44MPI-ESM-PMPI-MGermany1.88° × 1.88°
45MPI-CGCM3MRIJapan1.13° × 1.13°
46MPI-ESM1NCCNorway1.13° × 1.13°
47NorESM1-MENCCNorway2.50° × 1.88°
48NorESM1-MNCCNorway2.50° × 1.88°
Table 2. Detailed information of the sites from GC-NET, BSRN, and GEBA used in this study.
NetworkSite NameLatitude (°)Longitude (°)Elevation (m)
GC-NETSwiss Camp69.57 N49.32 W1149
GC-NETCrawford Pt.69.88 N46.99 W2022
GC-NETNASA-U73.84 N49.50 W2369
GC-NETGITS77.14 N61.04 W1887
GC-NETHumboldt78.53 N56.83 W1995
GC-NETSummit72.58 N38.51 W3254
GC-NETTUNU-N78.02 N33.99 W2113
GC-NETDYE-266.48 N46.28 W2165
GC-NETJAR69.50 N49.68 W962
GC-NETSaddle66.00 N44.50 W2559
GC-NETSouth Dome63.15 N44.82 W2922
GC-NETNASA-E75.00 N30.00 W2631
GC-NETCP269.88 N46.99 W1990
GC-NETNGRIP75.31 N42.33 W2950
GC-NETNASA-SE66.48 N42.50 W2425
GC-NETKAR69.70 N33.00 W2579
GC-NETJAR269.42 N50.06 W568
GC-NETJAR369.39 N50.31 W283
GC-NETAurora67.15 N47.29 W1798
GC-NETPetermann Gl.80.68 N60.23 W37
GC-NETPeterMann ELA80.09 N58.07 W965
BSRNBarrow71.32 N156.61 E8
BSRNGeorg von Neumayer70.65 S8.25 W42
BSRNNy-Ålesund78.93 N11.93 E11
BSRNSouth Pole89.98 S24.80 W2800
BSRNSyowa69.01 S39.59 E18
GEBAOimyakon63.27 N143.15 E726
GEBAVanavara60.33 N102.26 E259
GEBAVerkhoyansk67.55 N133.38 E137
GEBAYakutsk62.08 N129.75 E103
GEBABergen60.40 N5.32 E45
GEBABorlaenge60.43 N15.50 E153
GEBAHelsinki-Airport60.32 N24.97 E53
GEBAJokioinen60.82 N23.50 E104
GEBAJyvaskyla-Airpt.62.40 N25.68 E141
GEBAKiruna67.85 N20.23 E505
GEBALerwick60.13 N1.18 W82
GEBALulea65.55 N22.13 E16
GEBAOestersund63.18 N14.50 E876
GEBAReykjavik64.13 N21.90 W52
GEBASodankyla67.37 N26.65 E178
GEBAUmea63.82 N20.25 E10
GEBAUtsjoki, Kevo69.75 N27.03 E107
GEBAResolute74.72 N94.98 W67

