Planar Block Adjustment for China’s Land Regions with LuoJia1-01 Nighttime Light Imagery
by
 , ,
, ,
Xin Li
1, 
Taoyang Wang
1,*,
Guo Zhang
2,
Boyang Jiang
1,
Peng Jia
3,
Zhuxi Zhang
4 and
Yuan Zhao
5 1
School of Remote Sensing and Information Engineering, Wuhan University, Wuhan 430079, China
2
State Key Laboratory of Information Engineering in Surveying, Mapping and Remote Sensing, Wuhan University, Wuhan 430079, China
3
China Satellite Navigation Office, Beijing 100034, China
4
National Transportation Preparation Office, Beijing 100036, China
5
China Academy of Space Technology, Beijing 100094, China
*
Author to whom correspondence should be addressed.
Remote Sens. 2019, 11(18), 2097; https://0-doi-org.brum.beds.ac.uk/10.3390/rs11182097
Submission received: 1 August 2019
/
Revised: 25 August 2019
/
Accepted: 5 September 2019
/
Published: 8 September 2019
Abstract
:The Luojia1-01 satellite provides high-resolution, high-sensitivity nighttime light data at a resolution of 130 m. To effectively use the Luojia1-01 nighttime light data for global applications, the problems of relative and absolute positioning accuracy should be solved. This paper proposes a high accuracy regional geometric processing method of nighttime light imagery. We utilized a nighttime light image matching algorithm to obtain tie points, which are used in the planar block adjustment with ground control points. Then, orthorectification of all images is implemented. Finally, we obtain the nighttime light map of China by mosaicking all the nighttime light orthoimages. According to the experimental results for 275 Luojia1-01 images, the root mean square error of the tie points is 0.983 pixels and the root mean square error of independent checkpoints is 195.491 m (less than 1.5 pixels) after the planar block adjustment. The experimental results prove the validity and feasibility of the proposed method.
1. Introduction
The Luojia 1-01 satellite was launched at 12:13 on 2 June 2018 [1]. It is the first Chinese professional nighttime remote-sensing satellite and was jointly developed by Wuhan University and Chang Guang Satellite Technology Co., Ltd. The spatial resolution of the satellite (130 m) is superior to those of the Defense Meteorological Satellite Program’s Operational Linescan System (DMSP/OLS) (2.7 km) and the Suomi National Polar-Orbiting Partnership Visible Infrared Imaging Radiometer Suite (NPP/VIIRS) (740 m). Luojia 1-01 is located in a 645-km solar synchronous orbit, and it provides high radiometric quantization (15 bits) with a swath of 250 km. It can guarantee that global nighttime light image acquisition can be completed within 15 days. In addition, the nighttime light data are continuously updated by Luojia 1-01 satellite and all imagery is provided to users for free. Users can download data after registration at http://www.hbeos.org.cn/.
From the introduction of the Nightsat mission concept, it can be concluded that 50 to 100 m resolution would be necessary to retain the primary night-time lights features present in urban and rural environments [2]. The representation of nighttime light distribution and intensity information based on remote sensing is closely related to human socio-economic development. Nighttime light data have been widely used for urban expansion analysis [3,4,5,6,7], humanitarian disaster evaluation [8,9,10], economic evaluation [11,12,13,14,15,16,17,18,19], investigation of artificial light pollution [20,21,22,23], carbon emission analysis [24], and information extraction [25,26,27,28] and have become one of the important datasets for socio-economic parameter space simulation.
To achieve better application results, the geometric and radiation quality of Luojia1-01 nighttime light imagery must be guaranteed. The geometric and radiation quality of each Luojia1-01 image has been greatly improved with on-orbit calibration [29,30]. However, this is not enough for regional coverage of imaging products. Therefore, the focus of this paper is on the relative geometric accuracy between night-light images and the absolute geometric accuracy of the overall image, this is especially important for high-resolution nighttime light images.
So far, most experts and scholars have conducted research and performed experiments using different daytime imagery datasets for regional geometry processing. Zhang presented an approach for block adjustment with sparse ground control points (GCPs) by using SPOT-5 high-resolution stereoscopic imagery [31], and the results showed that by using a small number of GCPs, an accuracy of 5–9 m in the planimetric view and 2–3 m in the height direction could be achieved. The Ziyuan-3 (ZY-3) satellite is China’s first civilian high-resolution three-dimensional mapping satellite, which can measure and produce 1:50,000 scale topographic maps. Using ZY-3 satellite images, Pan, Shen, and Zhang [32,33,34,35] performed related experiments to carry out block adjustment. Wang [36] proposed a planar block adjustment method to improve the targeting accuracy of images under conditions of weak convergence geometry in the block adjustment for satellite images. Yang carried out the integrated processing of large-scale ZY-3 satellite images based on virtual control points [37], and the experimental results indicated that the presented method could effectively improve the geometric accuracies of ZY-3 satellite images.
The procedures for generating nighttime light map involve a series of filtering steps to eliminate stray light, lightning, biomass burning, gas flares, high energy particle, detections, atmospheric glow surrounding bright sources, and background noise [38]. As for geolocation, the DMSP/OLS and NPP/VIIRS geolocation algorithm estimates the latitude and longitude of pixel centers based on the geodetic subtrack of the satellite orbit, satellite altitude, OLS scan angle equations, an Earth sea-level model, and digital terrain data [39].
In summary, we find that there is less research on region geometric processing for nighttime light images. Therefore, a high accuracy regional geometric processing method of nighttime light imagery is proposed. The cloud-free nighttime light imagery is acquired by preprocessing, and then the geolocation algorithm is processed. The first step is to obtain sufficient reliable tie points (TPs) by the nighttime light image-matching. Then, planar block adjustment and orthorectification are carried out. Finally, we completed the Luojia1-01 nighttime light map of China by mosaic.
2. Materials and Methods
In this study, first, the cloud-free Luojia 1-01 nighttime light data covering China are collected. Second TPs are obtained by nighttime light image matching algorithm, and planar block adjustment with GCPs is carried out for the images. Third, Luojia 1-01 nighttime light map of China with high geometric accuracy is obtained. The flow chart is shown in Figure 1.
2.1. Preprocessing
2.1.1. Image Selection
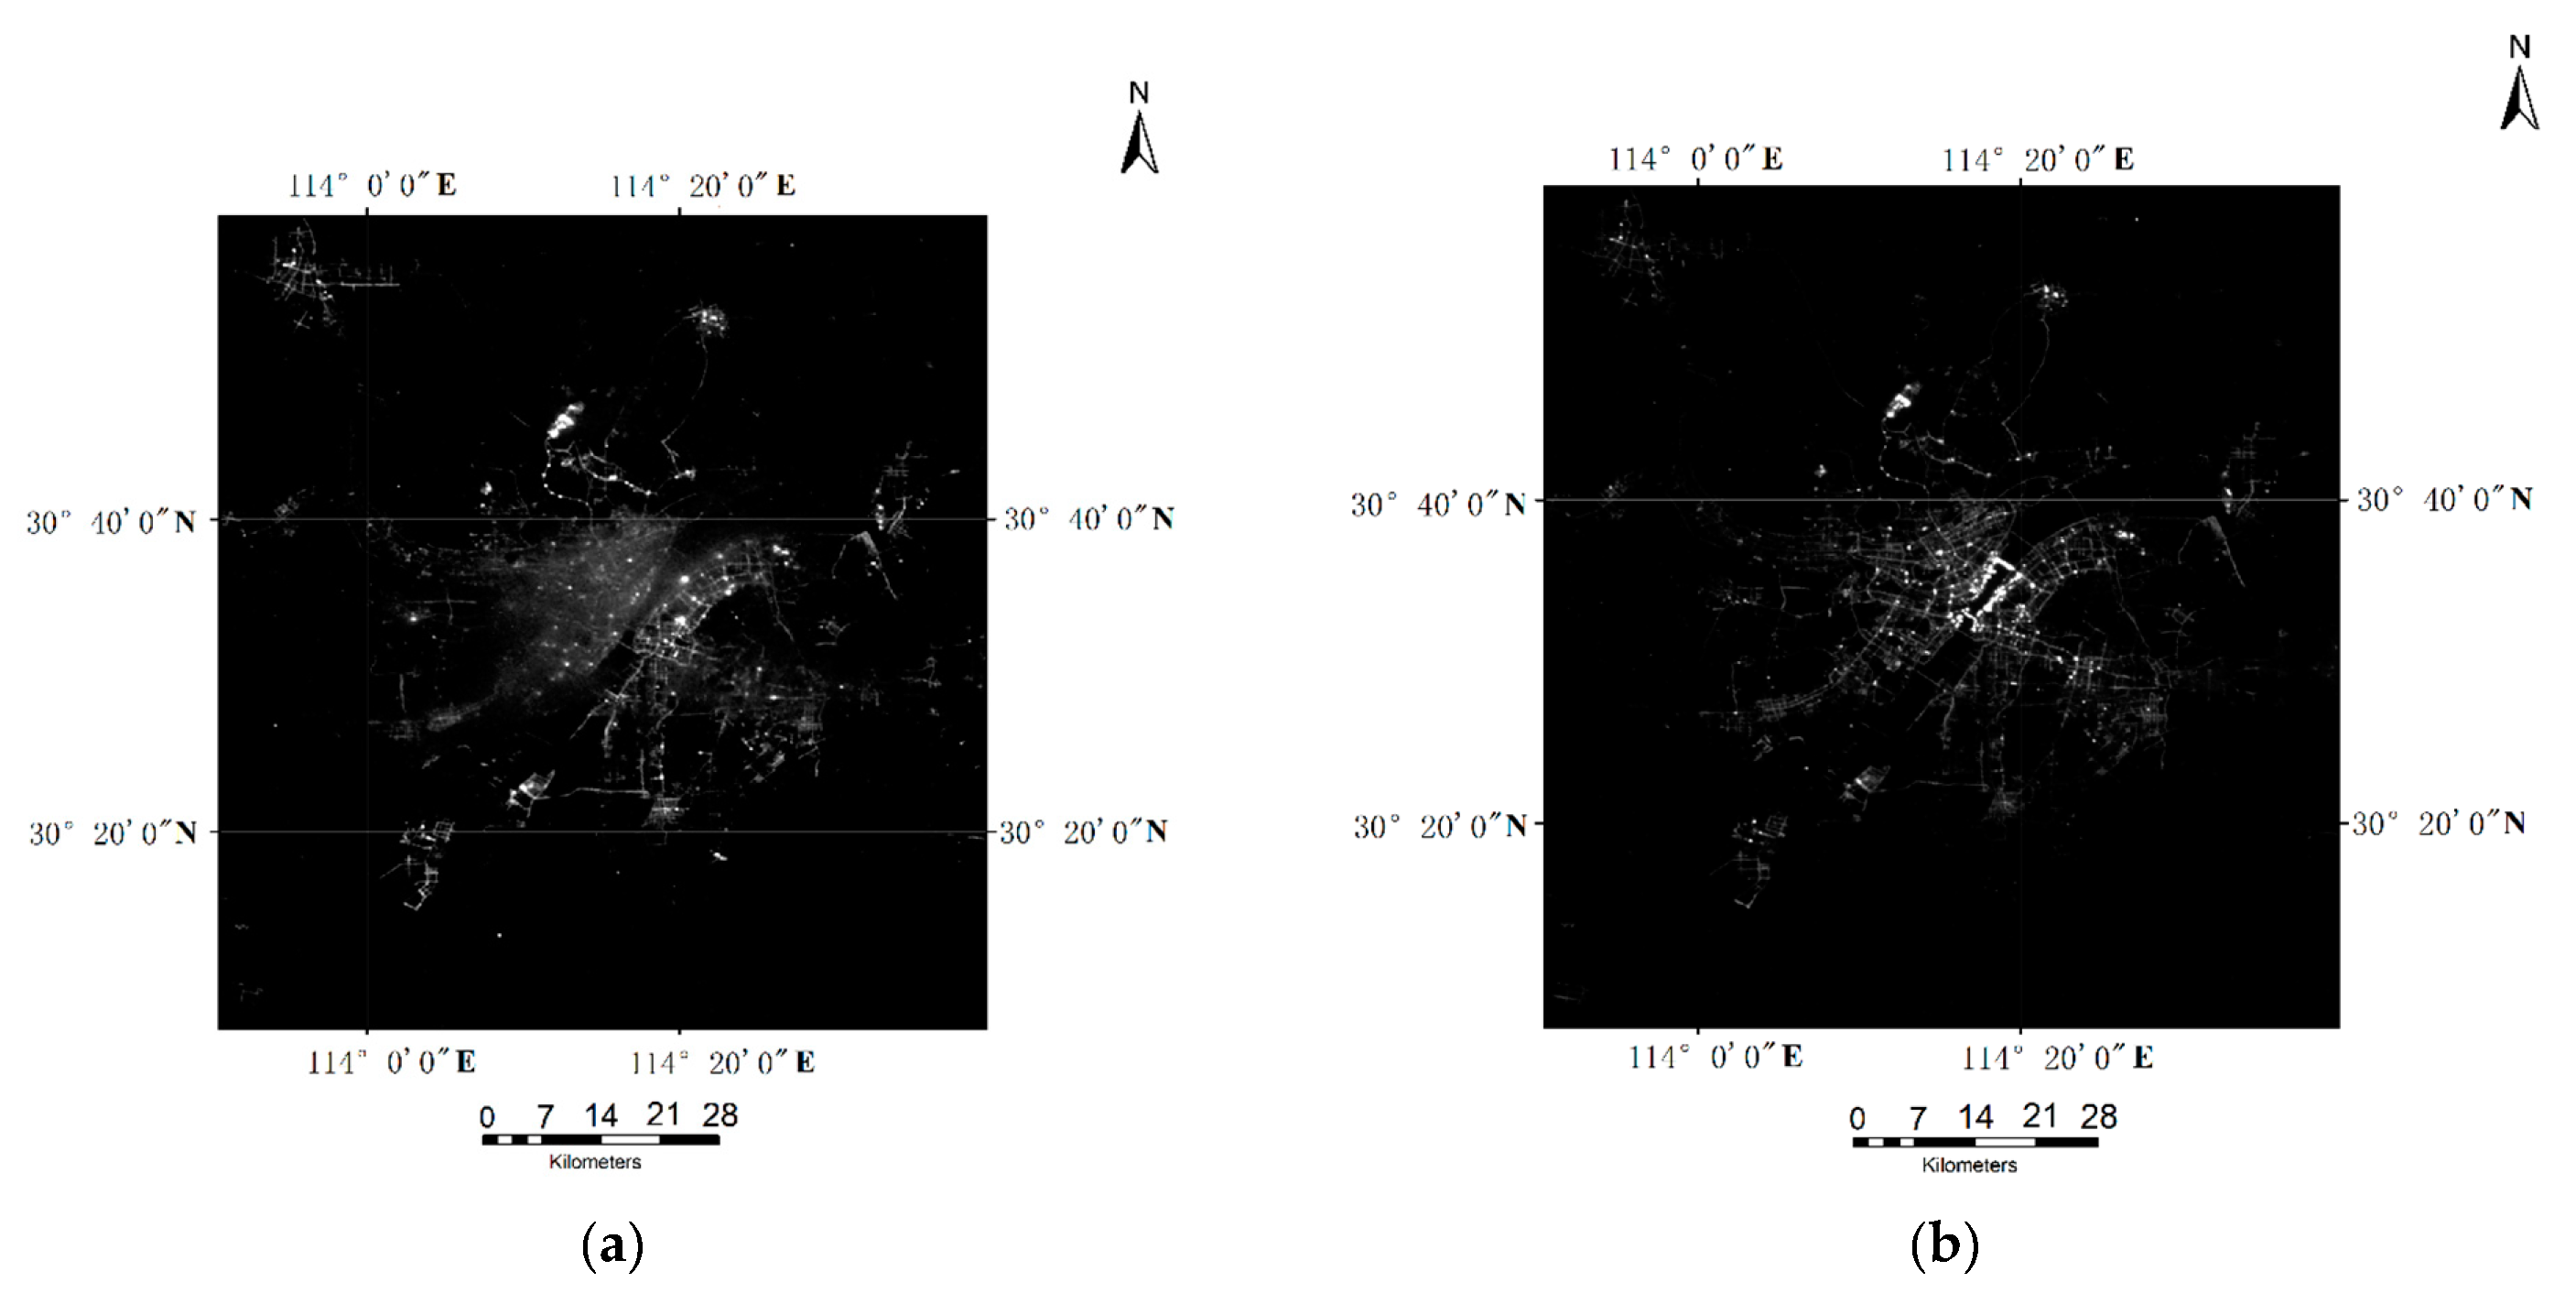
The July to October time period was selected based on the completeness of the archive during this time period, and the overlapping degree of one-track data by Luojia1-01 was about 80%. In order to reduce data volume, data extraction was carried out to ensure the overlapping degree was about 20%. At the same time, the cloud-contaminated data were excluded by manual screening to ensure nighttime light images were cloud-free. As shown in Figure 2a, the cloud-contaminated image is blurred, which cannot accurately obtain the ground lighting information.
2.1.2. Removal of Stray Light
From the perspective of satellite design, Luojia1-01 has a consistent overpass time of the ascending node at 22:30 in Beijing time. This time slot would permit the observation of the relative maximum extent of lighting in regions where lights may be gradually turned off as midnight approaches. In addition, according to the characteristics of satellite platform orbit and the incident law of stray light, the satellite designed a special-shaped baffle to further eliminate the stray light from the sun [40].
Based on the acquired optical satellite products of the same period as guidance, we excluded the radiation anomalies caused by biomass burning. Meanwhile, the non-electric light information generated by the full moon could also be compared and excluded by this guidance product.
2.2. Nighttime Light Image Matching
After data preprocessing, the acquired cloud-free Luojia1-01 nighttime light imagery was automatically matched to obtain TPs. The following is the image matching process.
2.2.1. Extract Feature Points
In this study, the scale-invariant feature transform operator based on a multi-scale space was used to match the nighttime light imagery. The Gaussian function and original image were convoluted to obtain the scale-space of the image, and the Gaussian pyramid was constructed based on the following equation:
where represents Gaussian function with a scale of ; m and n are the dimensions of the Gaussian template, represents the coordinates of the image point. The smaller the value of σ, the more obvious are the detail features of the image.
In the above formula, is expressed as a scale space, and its scale parameter is . represents the original image. And * represents a convolution operation.
According to Equation (1), the difference operation was performed at different scales to obtain the differential Gaussian pyramid (DoG) image. Further, pixel-by-pixel comparison was performed for each DoG image. The extreme points obtained by comparison were the feature points that needed to be acquired.
Here and represent the number of Gaussian pyramid image layers of different layers, where is smaller than the number of Gauss layers. The DoG was constructed on the basis of the Gaussian pyramid.
After the feature points were acquired, positioning and orientation processing were performed to ensure the movement, scaling, and rotation invariance of the feature points. Next, a descriptor of the feature points was established to ensure that the feature points were robust to changes in light and viewing angles.
2.2.2. Acquisition of Matching Point Pairs
The obtained feature points contained many erroneous matching points, which needed to be deleted. In this study, a two-layer image feature point matching algorithm was adopted, where the two layers were rough and precise matching. Rough matching is an inter-matching algorithm that determines a matching point pair by using the Euclidean distance between the reference image and the registered image. Precise matching is used to eliminate error matching point pairs in rough matching by using the random sample consensus (RANSAC) algorithm.
Considering that the conventional RANSAC algorithm [41] requires a large number of iterations, the optimal value may not be obtained if an iteration threshold is set. Therefore, the distance α = [MIN, θ*MAX] was selected as the iteration threshold for matching point pair screening by calculating the maximum value MAX and minimum value MIN of the matching distance between the reference image and the registered image. Here, θ is the scaling factor between 0 and 1, the number of matching point pairs is positively correlated with θ, and the false matching rate is negatively correlated with θ. After experimental verification, the maximum matching distance based on the mismatching threshold was identified. Hence, the maximum matching distance α = θ*MAX was used to eliminate the mismatched pairs. After the distance α was determined, the threshold of the rough matching was determined, and the matching point pair was selected based on the distance, and finally, the precise matching was performed by the RANSAC algorithm.
2.3. Planar Block Adjustment
When the angle of intersection between satellite images participating in the block adjustment is small (less than 10°), the satellite images are generally known to have weak convergence geometry between adjacent images [36]. Therefore, the traditional stereo block adjustment method cannot be applied directly.
In response to this problem, we propose the planar block adjustment method, which only calculates the orientation compensation parameters of the satellite image and the ground planar coordinates of the TPs. The elevation value of the TPs is interpolated using a digital elevation model (DEM). This method ensures the stability and accuracy of the adjustment solution. The detailed planar block adjustment technical flowchart is presented in Figure 3.
In Figure 3, GCPs are the control point files, TPs are the tie points acquired by nighttime light image matching, and rational polynomial coefficients (RPCs) represent the orientation parameter files. GCPs, TPs, and RPCs are used as input data. The final adjustment result are the compensation parameters, which are given as an output file. The following sections provide a detailed description of planar block adjustment.
2.3.1. Mathematical Model of Planar Block Adjustment
Rational function model (RFM) was chosen as the geometric model of planar block adjustment. The RFM establishes the relationship between ground coordinates (latitude, longitude, height) and corresponding pixel coordinates (line, sample) [42]. The general form is:
where (, ) are the measured line and sample coordinates of the nth image point, corresponding to the ground point with object space coordinates (, , ), which are the variables of a polynomial (i = 1, 2, 3, 4) whose degree should not exceed three. For example, the form of the polynomial p1 is:
where ( = 1,2,3,4, = 0,1 …,19) are RPCs. Based on Equation (4), we can rewrite to get the following formula:
The affine transformation model is widely used for system error compensation based on image compensation. A minimum of three GCPs are needed to solve the parameters for six unknowns. The two offset parameters, and , can be solved for using only one GCP, which can compensate most of the errors. The offset and drift parameters can be solved by using two GCPs simultaneously:
where and are parameters of affine transformation, and are image compensation parameters.
According to Equations (4)–(6), the parameters of affine transformation should be set as unknowns. Based on the RFM, the image orientation error equation for ground control points is:
The error equation is written in the matrix form as
where is the residual of the observed value of sample and line for coordinate of image point, is the correction value of the system error compensation, represents the correction value of coordinate of ground point. and are coefficient matrices that are matrices of partial derivatives of the unknowns. Because the elevation is obtained by interpolating the DEM, height-related items all should be set to 0 and elevation values are omitted from the following formulas:
The specific form given by:
where (, , , ) are regularized proportionality coefficients [43], () are the nth ground point with object space coordinates ; (i = 1, 2, 3, 4) are polynomial refer to Equation (4).
Note that , where is the line and sample coordinates of the image point on the image, which can be calculated by approximating the unknown number.
After the end of each adjustment iteration, the new coordinate of ground point of the TPs is obtained. At this time, the DEM is added as an elevation constraint, and the elevation value Z of the ground point is interpolated by the DEM. Then, the elevation value Z obtained from the DEM is added to the adjustment system together with the planar coordinates (X, Y) for the next iteration calculation until the adjustment result converges.
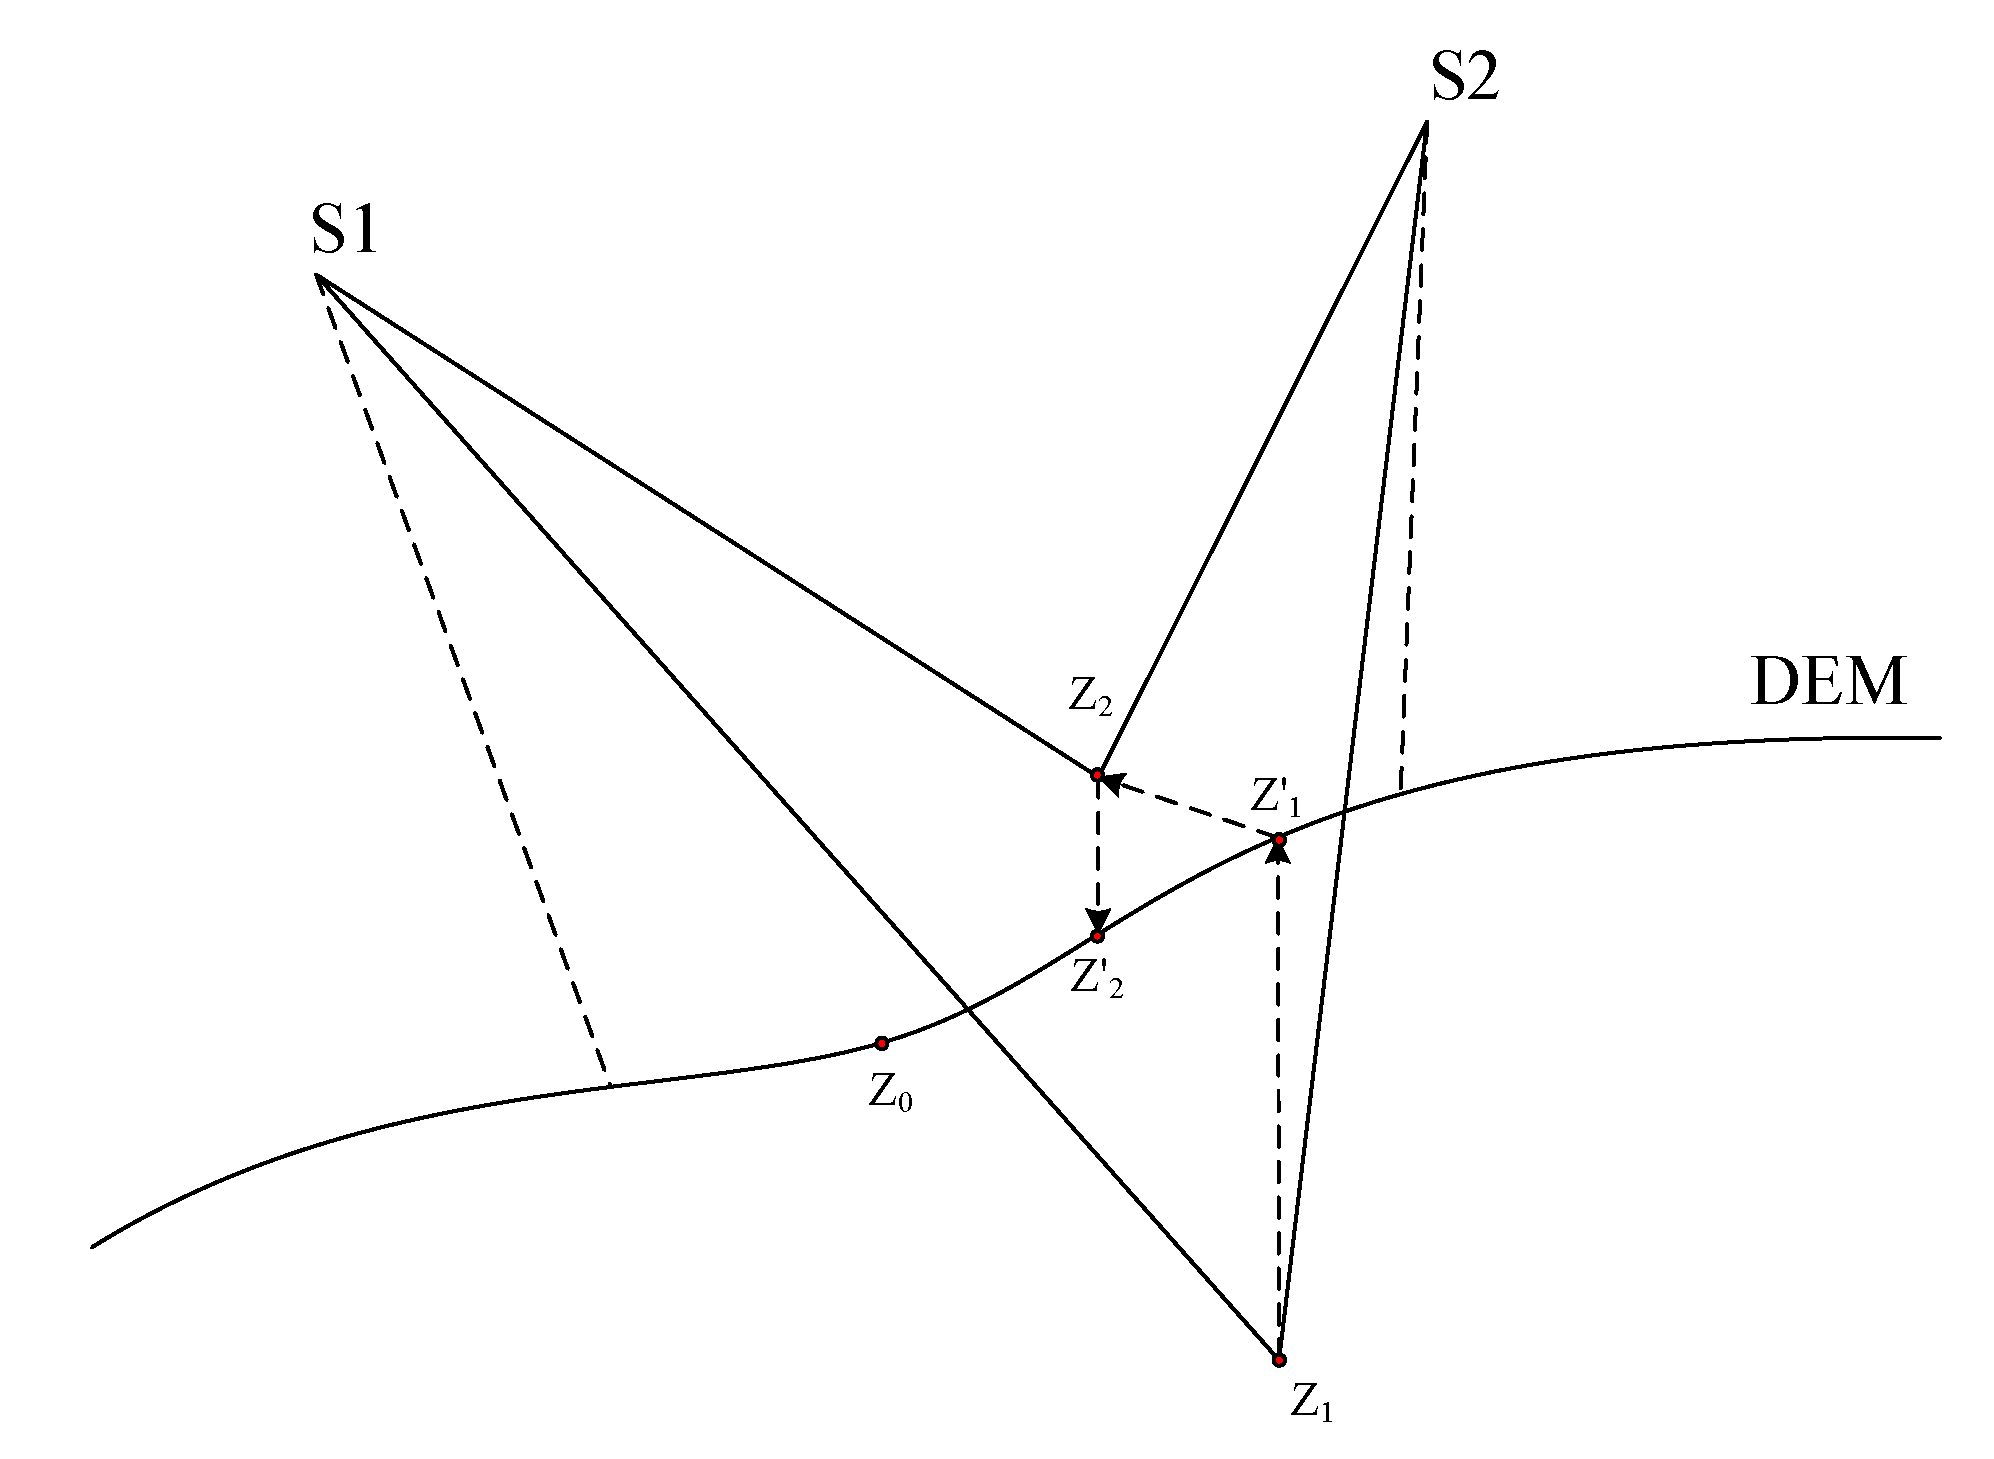
Referring to Figure 4, S1 and S2 are a pair of TPs of the same name point. In adjustment calculation, we took the average elevation value Z0 corresponding to the two points as the initial value and obtained the compensation amount of elevation after adjustment. Then, the initial elevation value Z0 was compensated to obtain Z1. Due to the weak convergence geometry of Luojia 1-01 nighttime light imagery, the elevation error caused by Z1 was amplified, and the adjustment result could not be converged. Therefore, the new elevation value Z’1 was obtained based on DEM interpolation to replace Z1 in the next adjustment iteration calculation. In this way, the new interpolated elevation value Z’2 was obtained, and the iterative calculation continued until the adjustment convergence.
2.3.2. Solution of Large-Scale Adjustment Equation
We normalized the error equation and limit the data to [−1, 1], so as to ensure the convenience and stability of the solution of the error equation. After that, we solved the equation to obtain the correction parameters and update the image affine transformation coefficients. The equation uses an iterative solver called the spectral correction iterative method to estimate the correction parameters and coordinate of ground point. The specific process is as follows.
Two error equations can be established for each image point. When the number of image points is found to be sufficient, a law equation can be formed according to the principle of least squares adjustment:
Now, is added to both sides of the above equation:
where is the same unit matrix as . Because both sides of the equation contain unknown parameters , it only can be solved by an iterative method, whose iteration formula is:
Next, is substituted by the above equation and is solved. Then, are iteratively solved. The iteration terminates when the difference between the corrections of two iterative cycles is less than the specified threshold, in which case we obtain the corrected parameters and corrections of coordinate of ground point.
The algorithm continuously updates the coordinate of ground point and image orientation parameters via the iterative process until the translation parameters in the orientation parameters of the image are smaller than the threshold set to finish the iterative adjustment. The RPC model is refined by using the affine transformation compensation coefficients.
3. Experiments and Analysis
3.1. Experimental Design
In order to carry out the planar block adjustment with LuoJia1-01 nighttime light imagery, some related experimental designs and data acquisition work needed to be prepared. First, TPs of images needed to be obtained by automatic matching. Second, GCPs on nighttime light images needed to be collected. Third, relevant parameters of Chinese test areas were listed. The accuracy of adjustment of free network and control network needed to be verified, respectively.
3.1.1. Test Area for TPs Matching of Nighttime Light Imagery
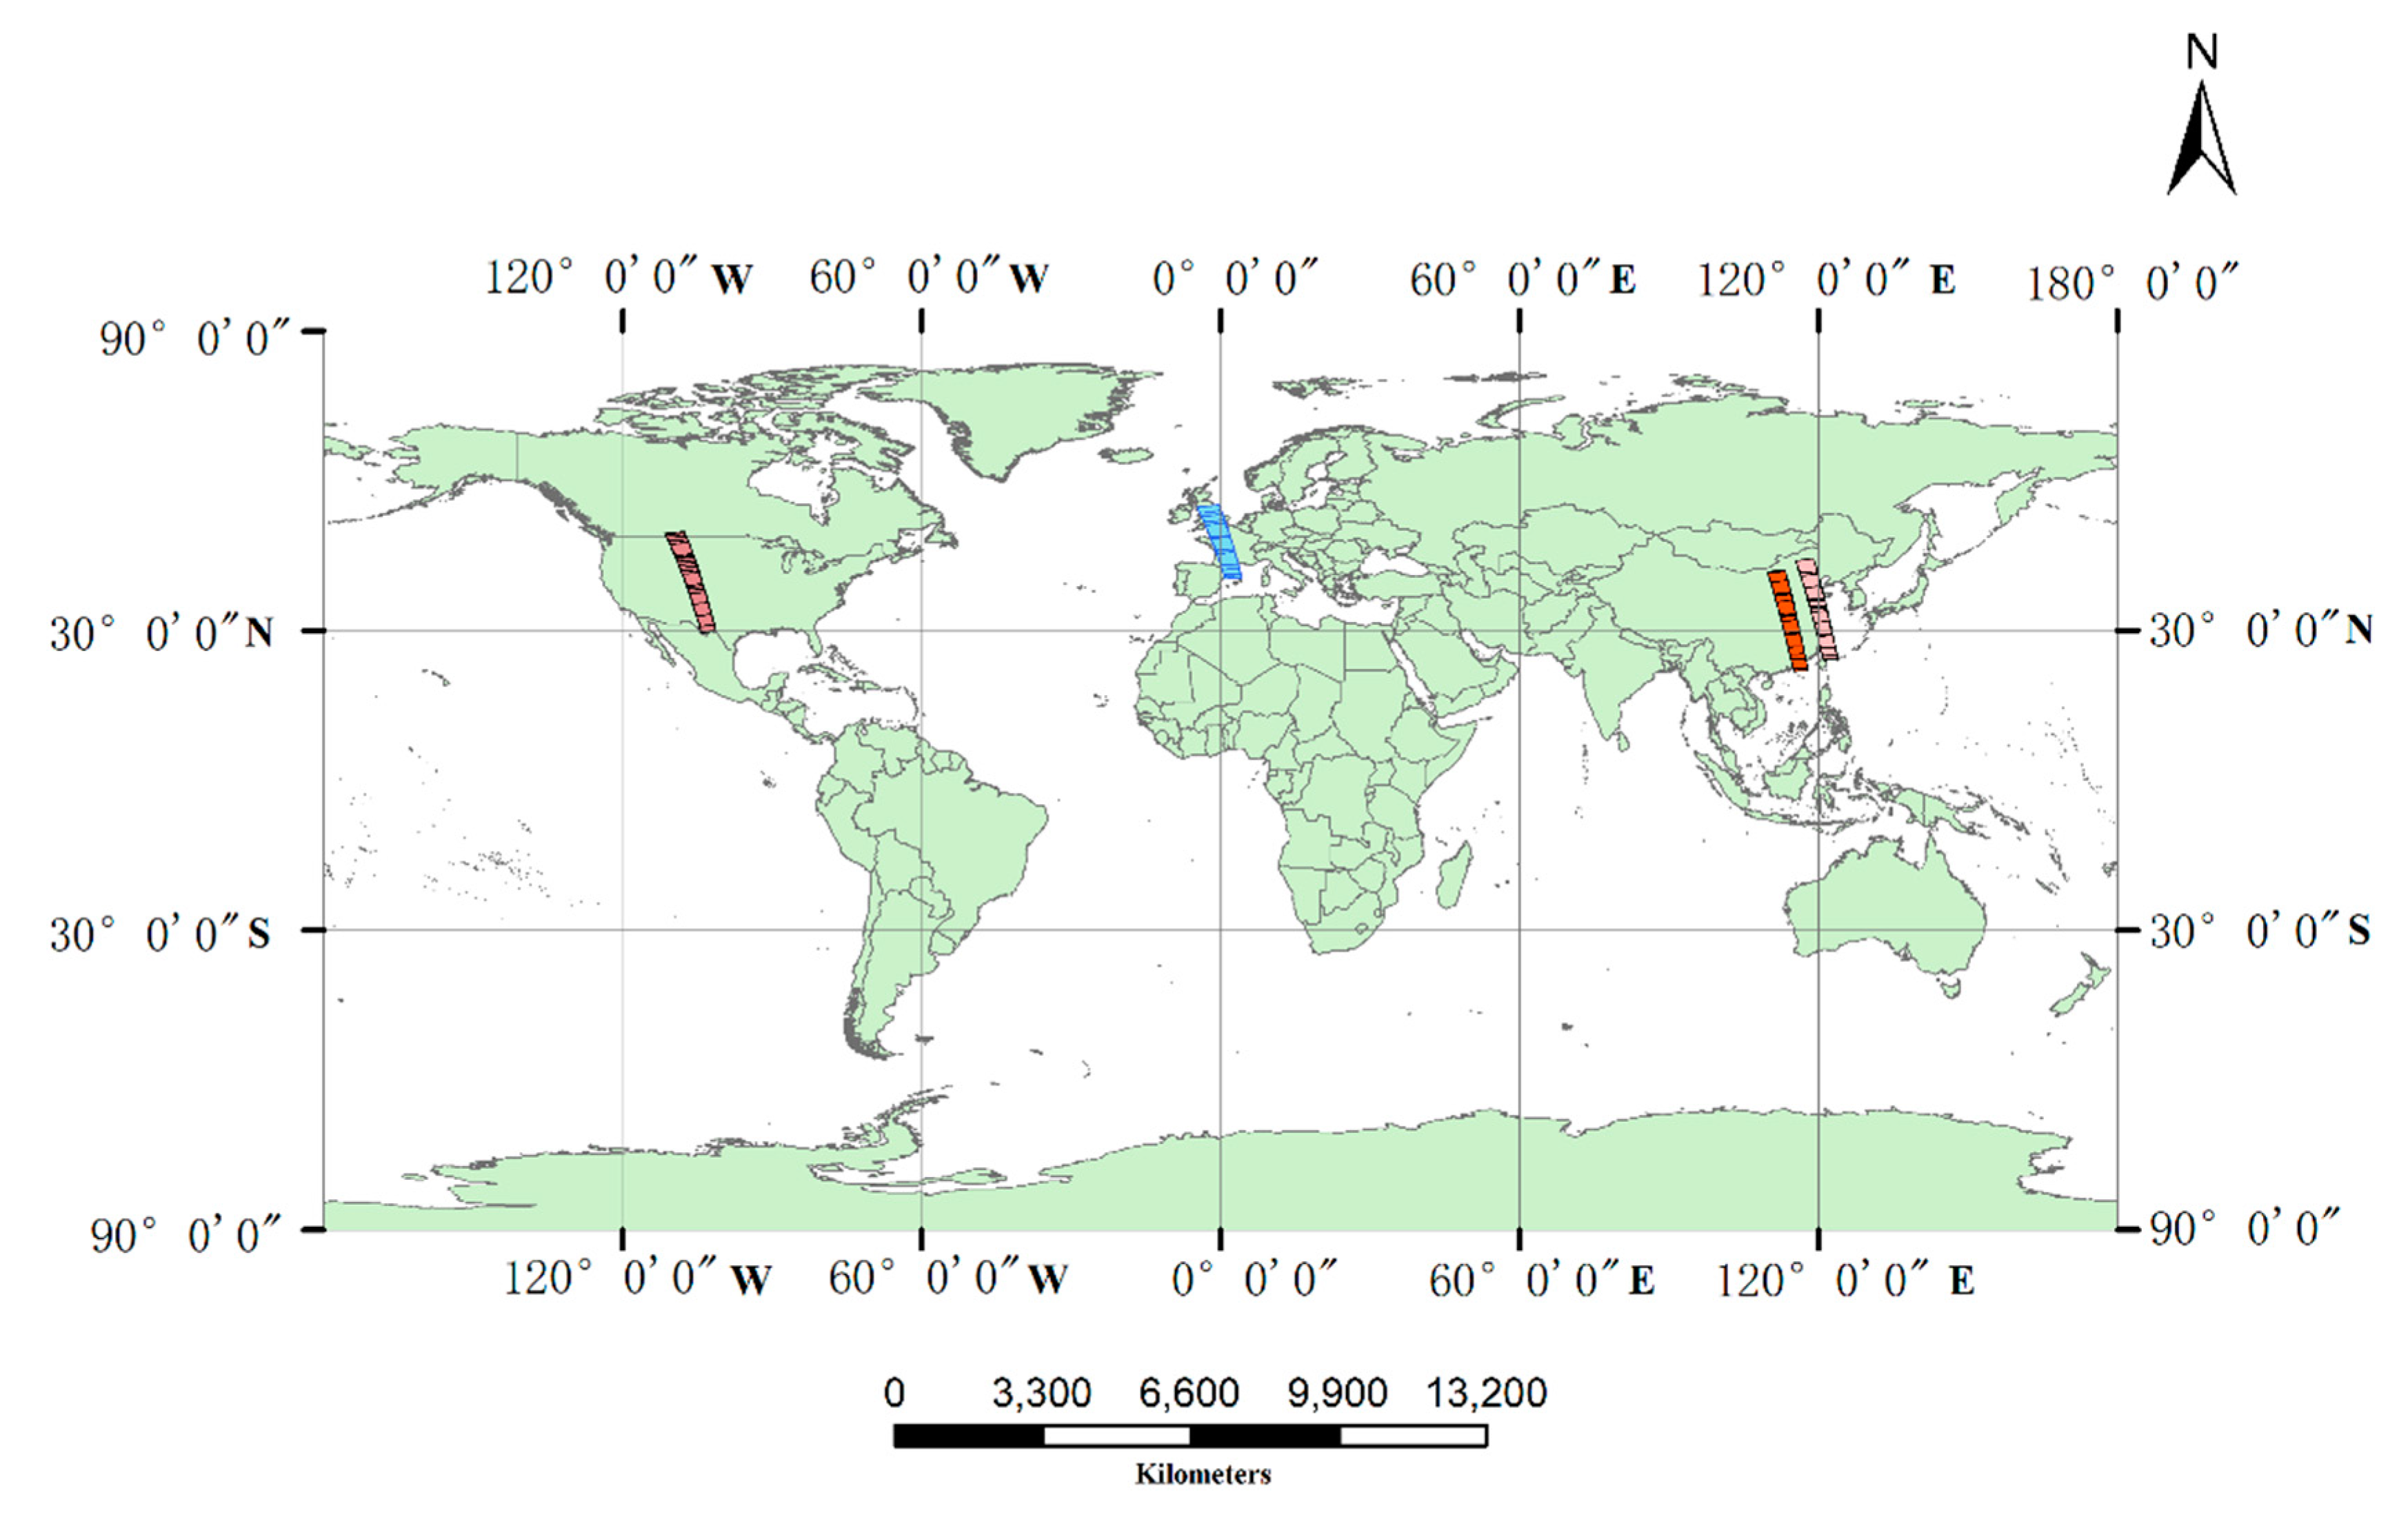
According to the nighttime light image matching algorithm, the four-track data of the Luojia1-01 images covering North America, Europe, and Asia were selected randomly to perform matching experiments and the robustness and matching accuracy of the algorithm are assessed. Figure 5 shows the distribution of the four-track data.
Track 1: The coordinates of the upper left corner of this track data are (−111.309, 49.252), the coordinates of the lower right corner are (−101.384, 30.118), and the imaging time is 2018.6.10. It covers the city to the north to Opheim in the United States, and the most south to Dryden in the United States;
Track 2: The coordinates of the upper left corner of this track data are (−4.578, 54.573), the coordinates of the lower right corner are (4.023, 41.498), and the imaging time is 2018.6.20. It covers the city north to Carlisle, England, and the most south to Barcelona in Spain;
Track 3: The coordinates of the upper left corner of this track data are (109.742, 41.778), the coordinates of the lower right corner are (117.762, 22.004), and the imaging time is 2018.6.14. It covers the city north to Hohhot, China, and most south to Shantou, China;
Track 4: The coordinates of the upper left corner of this track data are (115.405, 43.969), the coordinates of the lower right corner are (124.091, 24.695), and the imaging time is 2018.6.27. It covers the city to the north to Xilin Gol League in China, the most south to Taiwan, Yilan County in China.
3.1.2. GCPs Selection for Nighttime Light Imagery
According to the light information on the nighttime light imagery, we selected GCPs on Google Earth. Compared with the optical satellite images in Google Earth, nighttime light imagery has fewer features, so the selection of GCPs should follow the basic principles: GCPs cannot be chosen in the region with large relief. GCPs cannot be selected in unlit areas. There is little night light information in the desert and mountainous areas of western China, so GCPs are relatively less distributed in these areas. Road intersections should be the priority. Figure 6 shows the selection example of one GCP.
3.1.3. China’s Test Area Parameters
Based on the method proposed in this paper, a block adjustment experiment was performed on the Luojia1-01 nighttime light imagery of the entire Chinese land area. The relevant parameters of the specific test area are listed in Table 1.
A total of 275 Luojia 1-01 nighttime images were used to develop Chinese national orthorectification map. Then, we carried out the following two sets of adjustment experiments according to different control conditions.
- Experiment 1: Free network adjustment. All the 58 points were selected as independent checkpoints (ICPs) and no GCPs. The planar block adjustment used SRTM-DEM 30 m grid as the elevation constraint.
- Experiment 2: Control network adjustment. Twenty-five points were selected as GCPs while 33 points were selected as ICPs. The planar block adjustment used SRTM-DEM 30 m grid as the elevation constraint.
3.2. Nighttime Light Image Matching Experiment
The purpose of nighttime light image matching is to automatically capture the TPs between images. Experiment verification was carried out according to Section 2.3.2. The matching effect of Luojia 1-01 nighttime light images is displayed in Figure 7.
The TPs were obtained based on the matching algorithm and then the block adjustment was performed to verify the matching accuracy with the four-track data. Table 2 lists the TPs verification adjustment results.
From Table 2 and Figure 7, it can be seen that the nighttime light image-matching algorithm is reliable. The experimental results of image matching show that the matching points are sufficient, and the distribution is relatively uniform. At the same time, according to the experimental results of the four-track data listed in Table 2, the root mean square error (RMSE) of the TPs is better than one pixel, which can meet the accuracy for the nighttime light images mosaic.
3.3. Planar Block Adjustment with Luojia 1-01 Nighttime Light Imagery
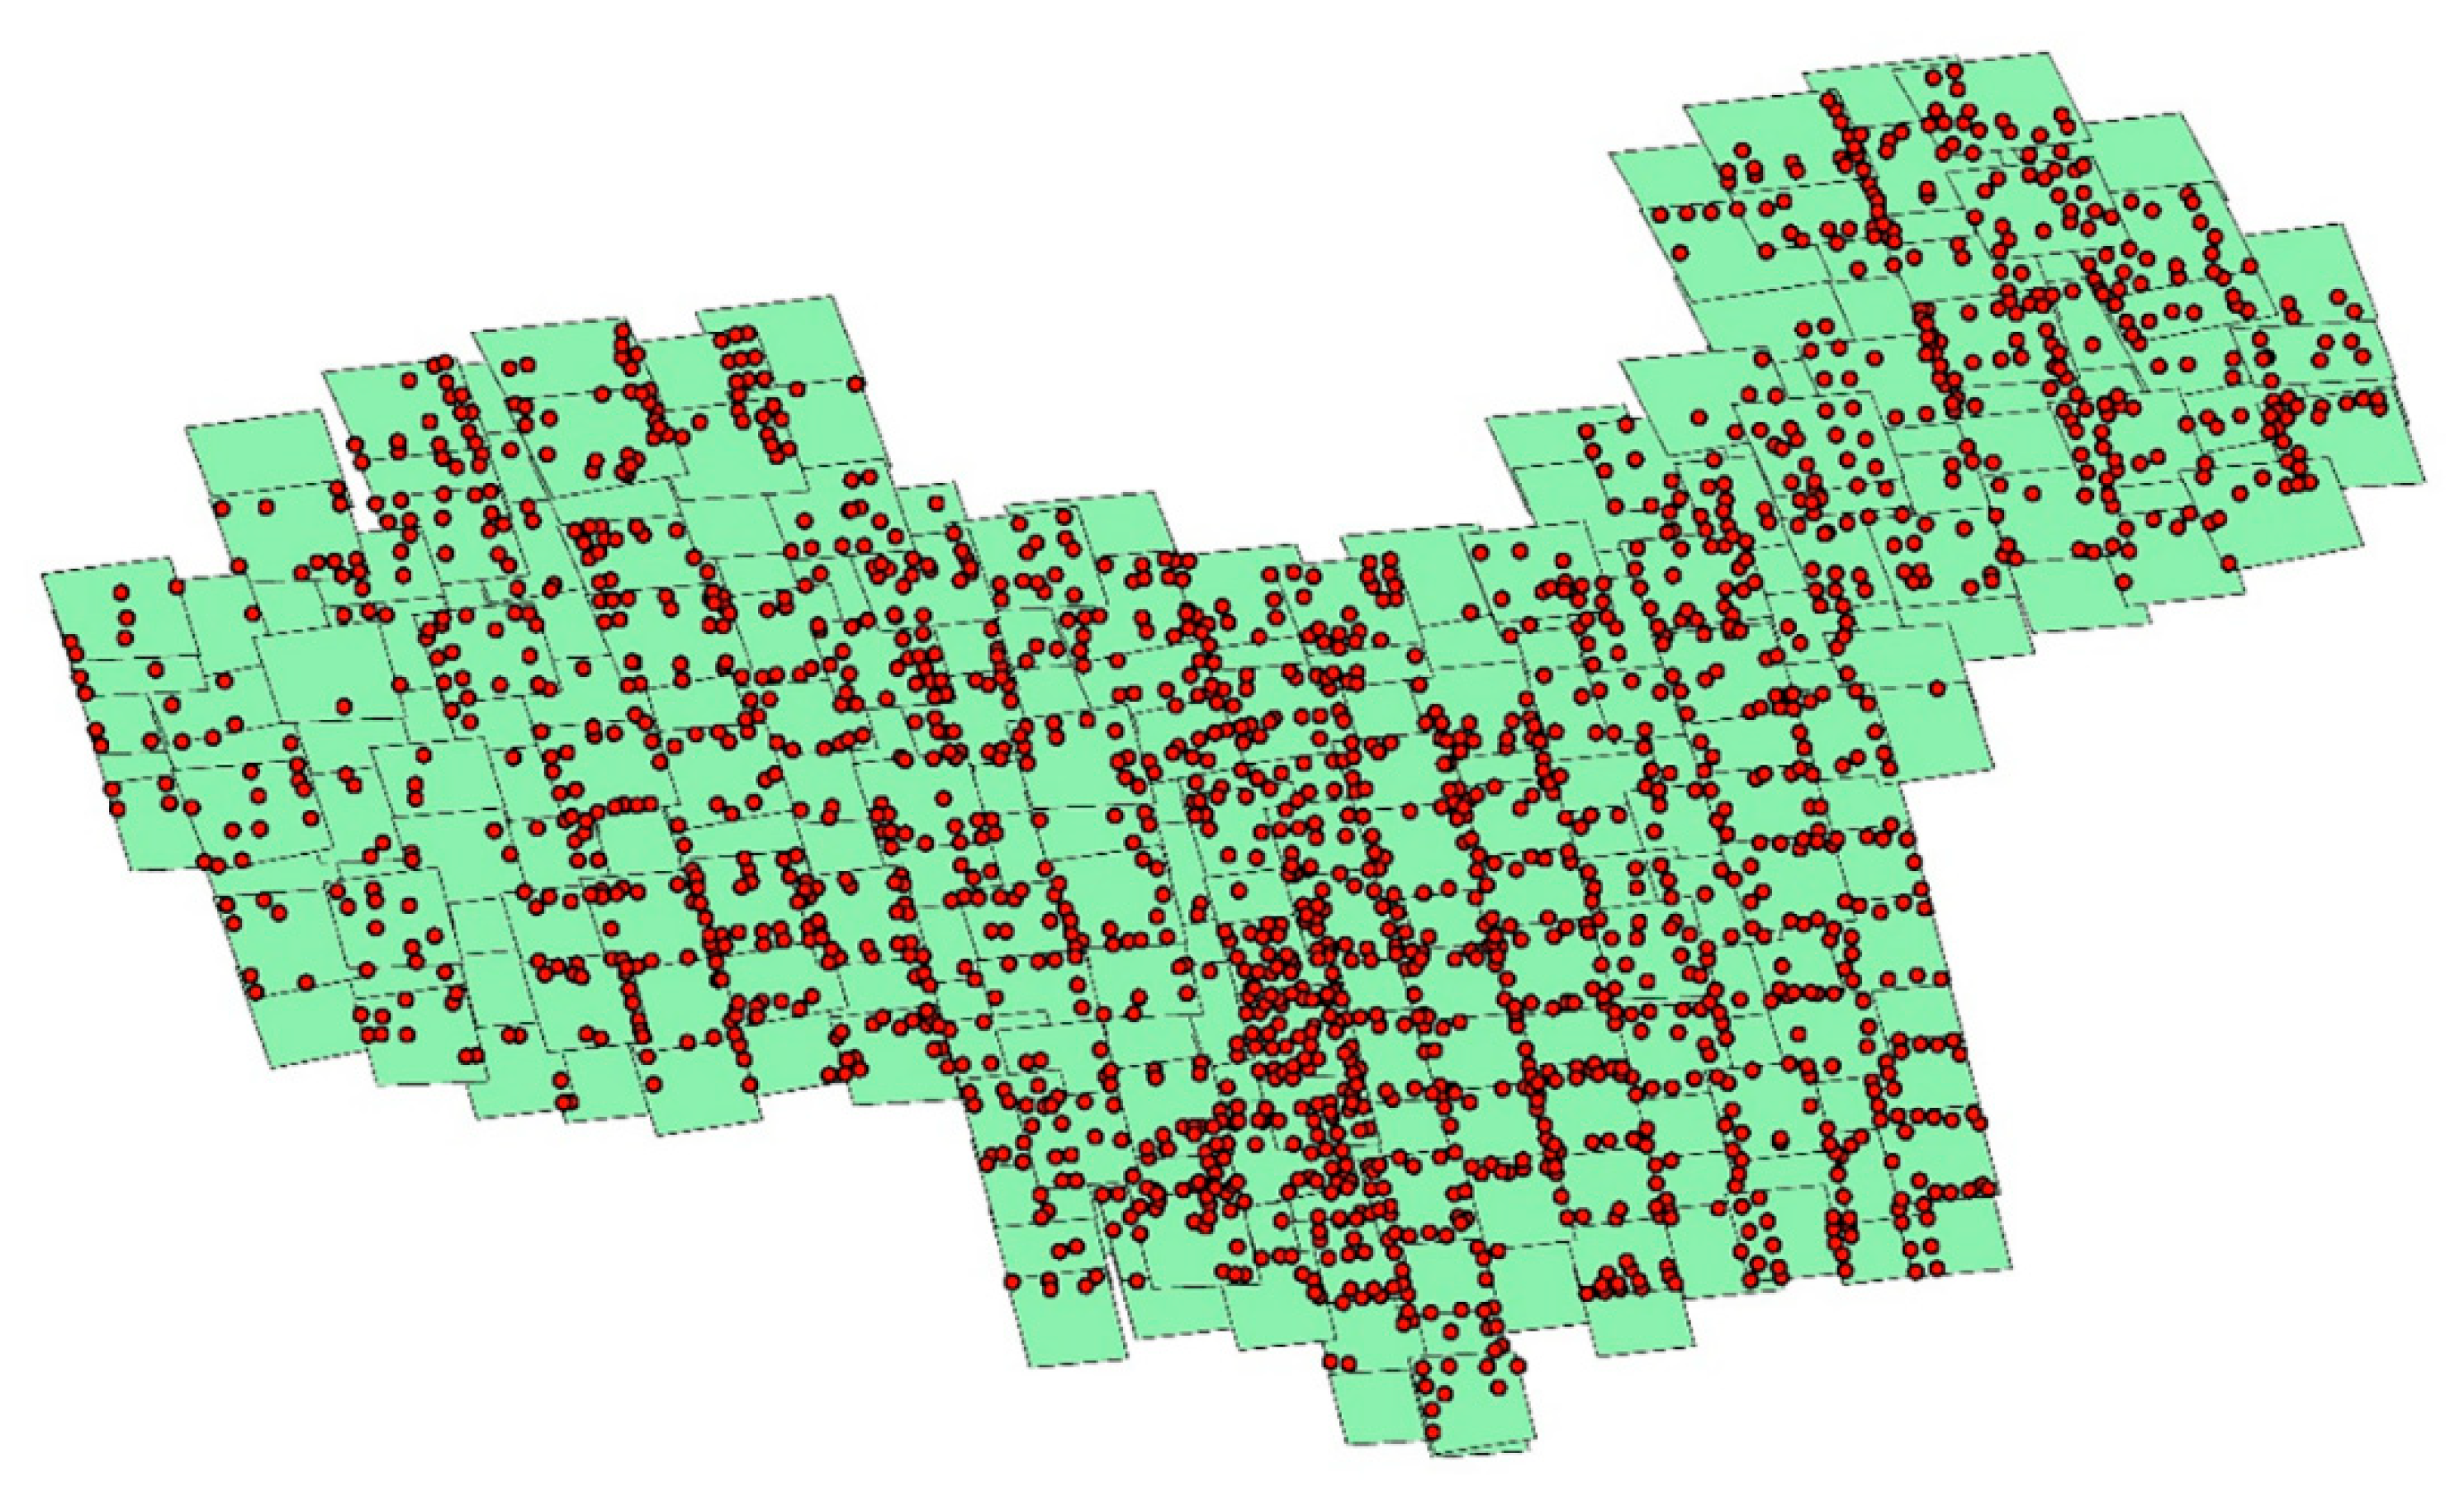
The plane block adjustment test was performed on the full coverage of the Luojia1-01 image data using the test scheme described in Section 3.1.3. The GCPs, ICPs, TPs, and image distribution maps are shown in Figure 8 and Figure 9.
The ICPs’ residuals obtained with GCPs and without GCPs for the test area can be clearly seen in Table 3 and Table 4. As shown in Figure 10 and Figure 11, the systematic errors of Luojia1-01 images are well eliminated.
The result of the free network adjustment indicates that there are obvious systematic errors of the ICPs from the residual map, as shown in Figure 10. The size and direction of residual errors are consistent. The result of the control network adjustment indicates that the checkpoint error after the block adjustment is about 1.5 pixels. The absolute positioning accuracy of the image is effectively improved from 683.386 to 195.491 m. Then the orthorectification is generated based on the refined RPCs [43]. The effect of the edge of the orthophoto is shown in Figure 12.
Through the control network adjustment, the significant improvements of relative and absolute positioning accuracy of the Luojia1-01 nighttime light imagery have been made. Finally, the Luojia1-01 nighttime light map of China is completed. The display effect is shown in Figure 13.
Nighttime light imagery cannot obtain features and geomorphological information unlike the imagery obtained by optical satellites. However, the public can enjoy beautiful night scenes through nighttime remote-sensing images, and researchers can analyze and invert from nighttime light imagery to serve various applications.
According to the experimental results, the relative positioning accuracy is better than one pixel, and the absolute positioning accuracy reaches 1.5 pixels after planar block adjustment with GCPs. The high relative positioning accuracy can ensure the high spatial consistency of mosaic images, and there will be no obvious gap at the edges of adjacent images. On the other hand, high absolute positioning accuracy is also very important. Time series analysis based on multitemporal night-light images needs high absolute positioning accuracy to ensure a unified geospatial benchmark.
The TPs were obtained through the nighttime light image matching algorithm in this paper, but it was found that there were still a few mismatching points in the subsequent adjustment verification. In the following studies on geometric processing of nighttime light imagery, we will further study on improving the automatic matching of nighttime light images to obtain high-accuracy TPs. Therefore, the absolute positioning accuracy can be improved by introducing high-accuracy GCPs in the process of planar block adjustment.
4. Conclusions
Through the nighttime light image geometric processing method proposed in this paper, a high accuracy geometric processing method is carried out for China’s land regions with LuoJia1-01 Nighttime light imagery. We carried out nighttime light image matching and planar block adjustment. Finally, the absolute positioning accuracy of the image reached about 1.5 pixels, which was improved from 700 to 195 m, while the relative positioning accuracy is better than one pixel. In the end, we completed the nighttime light map of China by mosaic. According to the experimental results, the proposed geometry processing method effectively eliminates the systematic geometric positioning error and ensures the geometric positioning consistency between adjacent images. In addition, the experimental results verify the feasibility of the planar block adjustment method based on the RPC model for nighttime light remote sensing image processing. The large-scale adjustment method proposed in this paper achieves an efficient and robust block adjustment of massive data. The Luojia 1-01 nighttime light imagery provides better visualization effects, radiometric quantization, and positioning accuracy, it can be widely used for urban expansion analysis, economic evaluation, disaster assessment, and carbon emissions at global or regional scales.
Author Contributions
Conceptualization, G.Z.; methodology, T.W. and X.L.; validation, X.L., and B.J.; writing—original draft preparation, X.L., Z.Z., P.J. and Y.Z.; writing—review and editing, X.L., T.W.
Funding
This research was supported by the Key research and development program of the Ministry of Science and Technology (2018YFB0504905, 2016YFB0500801), Quality improvement of Chinese satellite data and comprehensive application demonstration of Geology and mineral resources, National Natural Science Foundation of China (Grant No. 41601490), China Postdoctoral Science Foundation (Grant No. 2015M582276), Hubei Provincial Natural Science Foundation of China (Grant No. 2015CFB330), Open Research Fund of the State Key Laboratory of Information Engineering in Surveying, Mapping, and Remote Sensing (Grant No. 15E02), Open Research Fund of the State Key Laboratory of Geo-information Engineering (Grant No.SKLGIE2015-Z-3-1), Fundamental Research Funds for the Central University (Grant No. 2042016kf0163), Special Fund for High-Resolution Images Surveying and Mapping Application, the Open Foundation of Key Laboratory of Precise Engineering and Industry Surveying of National Administration of Surveying, Mapping and Geoinformation (Grant No. PF2017-4).
Acknowledgments
We give thanks to the research team at Wuhan University for freely providing the LuoJia1-01 nighttime light imagery. Furthermore, the authors would like to thank the reviewers for their helpful comments.
Conflicts of Interest
The authors declare no conflict of interest.
References
- Guo, H. Luojia1 Scientific experimental satellite. Satell. Appl. 2018, 7, 70. [Google Scholar]
- Elvidge, C.D.; Cinzano, P.; Pettit, D.R.; Arvesen, J.; Sutton, P.; Small, C.; Nemani, R.; Longcore, T.; Rich, C.; Safran, J.; et al. The Nightsat mission concept. Int. J. Remote Sens. 2007, 28, 2645–2670. [Google Scholar] [CrossRef]
- Zhang, L.; Peng, J.; Liu, Y.; Wu, J. Coupling ecosystem services supply and human ecological demand to identify landscape ecological security pattern: A case study in Beijing–Tianjin–Hebei region, china. Urban Ecosyst. 2017, 20, 701–714. [Google Scholar] [CrossRef]
- Liu, X.; Liang, X.; Li, X.; Xu, X.; Ou, J.; Chen, Y.; Li, S.; Wang, S.; Pei, F. A future land use simulation model (flus) for simulating multiple land use scenarios by coupling human and natural effects. Landsc. Urban Plan. 2017, 168, 94–116. [Google Scholar] [CrossRef]
- Inkoom, J.N.; Nyarko, B.K.; Antwi, K.B. Explicit modeling of spatial growth patterns in shama, ghana: An agent-based approach. J. Geovis. Spat. Anal. 2017, 1, 7. [Google Scholar] [CrossRef]
- Chen, Y.; Li, X.; Liu, X.; Ai, B.; Li, S. Capturing the varying effects of driving forces over time for the simulation of urban growth by using survival analysis and cellular automata. Landsc. Urban Plan. 2016, 152, 59–71. [Google Scholar] [CrossRef]
- Chen, Y.; Li, X.; Liu, X.; Ai, B. Modeling urban land-use dynamics in a fast developing city using the modified logistic cellular automaton with a patch-based simulation strategy. Int. J. Geogr. Inf. Sci. 2014, 28, 234–255. [Google Scholar] [CrossRef]
- Li, D.R.; Li, X. Use of night-time light remote sensing in humanitarian disaster evaluation. Chin. J. Nat. 2018, 3, 169–176. [Google Scholar]
- Li, X.; Chen, F.; Chen, X. Satellite-observed nighttime light variation as evidence for global armed conflicts. IEEE J. Sel. Top. Appl. Earth Obs. Remote Sens. 2013, 6, 2302–2315. [Google Scholar] [CrossRef]
- Li, X.; LI, D. Can night-time light images play a role in evaluating the Syrian Crisis? Int. J. Remote Sens. 2014, 35, 6648–6661. [Google Scholar] [CrossRef]
- Chen, X.; Nordhaus, W.D. Using luminosity data as a proxy for economic statistics. Proc. Natl. Acad. Sci. USA 2011, 108, 8589–8594. [Google Scholar] [CrossRef] [PubMed] [Green Version]
- Henderson, J.V.; Storeygard, A.; Weil, D.N. Measuring economic growth from outer space. Am. Econ. Rev. 2012, 102, 994–1028. [Google Scholar] [CrossRef] [PubMed]
- Li, X.; Chen, X.; Zhao, Y.; Xu, J.; Chen, F.; Li, H. Automatic intercalibration of nighttime light imagery using robust regression. Remote Sens. Lett. 2013, 4, 45–54. [Google Scholar] [CrossRef]
- Li, X.; Xu, H.; Chen, X.; Li, C. Potential of npp-viirs nighttime light imagery for modeling the regional economy of china. Remote Sens. 2013, 5, 3057–3081. [Google Scholar] [CrossRef]
- Xu, H.; Yang, H.; Li, X.; Jin, H.; Li, D. Multi-scale measurement of regional inequality in mainland china during 2005–2010 using dmsp/ols night light imagery and population density grid data. Sustainability 2015, 7, 13469–13499. [Google Scholar] [CrossRef]
- Li, D.R.; Yu, H.R.; Li, X. The Spatial-Temporal Pattern Analysis of City Development in Countries along the Belt and Road Initiative Based on Nighttime Light Data. Geomat. Inf. Sci. Wuhan Univ. 2017, 42, 711–720. [Google Scholar]
- Wang, T.Y.; Zhang, G.; Li, P.R.; Li, F.T.; Guo, X.Y. Analysis on the Driving Factors of Urban Expansion Policy Based on DMSP/OLS Remote Sensing Image. Acta Geod. Cartogr. Sin. 2018, 47, 1466–1473. [Google Scholar]
- Zhang, G.; Guo, X.; Li, D.; Jiang, B. Evaluating the Potential of LJ1-01 Nighttime Light Data for Modeling Socio-Economic Parameters. Sensors 2019, 19, 1465. [Google Scholar] [CrossRef]
- Li, D.R.; Li, X. Applications of Night-time Light Remote Sensing in Evaluating of Socioeconomic Development. J. Macro-Qual. Res. 2015, 3, 1–8. [Google Scholar]
- Falchi, F.; Cinzano, P.; Duriscoe, D.; Kyba, C.C.M.; Elvidge, C.D.; Baugh, K.; Portnov, B.A.; Rybnikova, N.A.; Furgoni, R. The new world atlas of artificial night sky brightness. Sci. Adv. 2016, 2, e1600377. [Google Scholar] [CrossRef]
- Kyba, C.C.M.; Kuester, T.; Miguel, A.S.D.; Baugh, K.; Jechow, A.; Hölker, F.; Bennie, J.; Elvidge, C.D.; Gaston, K.J.; Guanter, L. Artificially lit surface of Earth at night increasing in radiance and extent. Sci. Adv. 2017, 3, e1701528. [Google Scholar] [CrossRef] [PubMed] [Green Version]
- Hänel, A.; Posch, T.; Ribas, S.J.; Aubé, M.; Duriscoe, D.; Jechow, A.; Kollath, Z.; Lolkema, D.E.; Moore, C.; Schmidt, N.; et al. Measuring night sky brightness: Methods and challenges. J. Quant. Spectrosc. Radiat. Transf. 2018, 205, 278–290. [Google Scholar] [CrossRef]
- Jiang, W.; He, G.; Long, T.; Guo, H.; Yin, R.; Leng, W.; Liu, H.; Wang, G. Potentiality of Using Luojia 1-01 Nighttime Light Imagery to Investigate Artificial Light Pollution. Sensors 2018, 18, 2900. [Google Scholar] [CrossRef] [PubMed]
- Shi, K.; Chen, Y.; Yu, B.; Xu, T.; Chen, Z.; Liu, R.; Li, L.; Wu, J. Modeling spatiotemporal CO2 (carbon dioxide) emission dynamics in China from DMSP-OLS nighttime stable light data using panel data analysis. Appl. Energy 2016, 168, 523–533. [Google Scholar] [CrossRef]
- Yu, B.; Tang, M.; Wu, Q.; Yang, C.; Deng, S.; Shi, K.; Peng, C.; Wu, J.; Chen, Z. Urban built-up area extraction from log-transformed npp-viirs nighttime light composite data. IEEE Geosci. Remote Sens. Lett. 2018, 15, 1279–1283. [Google Scholar] [CrossRef]
- Li, X.; Zhao, L.; Li, D.; Xu, H. Mapping Urban Extent Using Luojia1-01 Nighttime Light Imagery. Sensors 2018, 18, 3665. [Google Scholar] [CrossRef] [PubMed]
- Xue, X.; Yu, Z.; Zhu, S.; Zheng, Q.; Weston, M.; Wang, K.; Gan, M.; Xu, H. Delineating Urban Boundaries Using Landsat 8 Multispectral Data and VIIRS Nighttime Light Data. Remote Sens. 2018, 10, 799. [Google Scholar] [CrossRef]
- Liu, A.; Wei, Y.; Yu, B.; Song, W. Estimation of Cargo Handling Capacity of Coastal Ports in China Based on Panel Model and DMSP-OLS Nighttime Light Data. Remote Sens. 2019, 11, 582. [Google Scholar] [CrossRef]
- Zhang, G.; Wang, J.; Jiang, Y.; Zhou, P.; Zhao, Y.; Xu, Y. On-Orbit Geometric Calibration and Validation of Luojia 1-01 Night-Light Satellite. Remote Sens. 2019, 11, 264. [Google Scholar] [CrossRef]
- Zhang, G.; Li, L.; Jiang, Y.; Shen, X.; Li, D. On-Orbit Relative Radiometric Calibration of the Night-Time Sensor of the LuoJia1-01 Satellite. Sensors 2018, 18, 4225. [Google Scholar] [CrossRef]
- Zhang, L.; Zhang, J.X.; Chen, X.Y.; An, H. Block-Adjustment with SPOT-5 imagery and sparse GCPs based on RFM. Acta Geod. Cartogr. Sin. 2009, 38, 302–310. [Google Scholar]
- Pan, H.B.; Tao, C.; Zou, Z.R. Precise georeferencing using the rigorous sensor model and rational function model for ZiYuan-3 strip scenes with minimum control. ISPRS J. Photogramm. Remote Sens. 2016, 119, 259–266. [Google Scholar] [CrossRef]
- Pan, H.B. Geolocation error tracking of ZY-3 three line cameras. ISPRS J. Photogramm. Remote Sens. 2017, 123, 62–74. [Google Scholar] [CrossRef]
- Shen, X.; Liu, B.; Li, Q.Q. Correcting bias in the rational polynomial coefficients of satellite imagery using thin-plate smoothing splines. ISPRS J. Photogramm. Remote Sens. 2017, 125, 125–131. [Google Scholar] [CrossRef]
- Zhang, Y.; Zheng, M.; Xiong, J.; Lu, Y.; Xiong, X. On-Orbit Geometric Calibration of ZY-3 Three-Line Array Imagery with Multistrip Data Sets. IEEE Trans. Geosci. Remote Sens. 2014, 52, 224–234. [Google Scholar] [CrossRef]
- Taoyang, W.A.; Guo, Z.H.; Deren, L.I.; Wanshou, J.I.; Xinming, T.A.; Xue, L.I. Comparison between plane and stereo block adjustment for ZY-3 satellite images. Acta Geod. Cartogr. Sin. 2014, 43, 389–395. [Google Scholar]
- Yang, B.; Wang, M.; Xu, W.; Li, D.R.; Gong, J.Y.; Pi, Y.D. Large-scale block adjustment without use of ground control points based on the compensation of geometric calibration for ZY-3 images. ISPRS J. Photogramm. Remote Sens. 2017, 134, 1–14. [Google Scholar] [CrossRef]
- Elvidge, C.D.; Baugh, K.; Zhizhin, M.; Hsu, F.C.; Ghosh, T. VIIRS night-time lights. Int. J. Remote Sens. 2017, 38, 5860–5879. [Google Scholar] [CrossRef]
- Elvidge, C.D.; Baugh, K.E.; Kihn, E.A.; Kroehl, H.W.; Davis, E.R. Mapping city lights with nighttime data from the DMSP Operational Linescan System. Photogramm. Eng. Remote Sens. 1997, 63, 727–734. [Google Scholar]
- Zhong, X.; Su, Z.; Zhang, G.; Chen, Z.; Meng, Y.; Li, D.; Liu, Y. Analysis and Reduction of Solar Stray Light in the Nighttime Imaging Camera of Luojia-1 Satellite. Sensors 2019, 19, 1130. [Google Scholar] [CrossRef]
- Fischler, M.A.; Bolles, R.C. Random Sample Consensus: A Paradigm for Model Fitting with Applications to Image Analysis and Automated Cartography. Commun. ACM Read. Comput. Vis. 1987, 24, 726–740. [Google Scholar]
- Li, D.R.; Zhang, G.; Jiang, W.S. SPOT-5 HRS Satellite Imagery Block Adjustment Without GCPS or with Single GCP. Geomat. Inf. Sci. Wuhan Univ. 2006, 31, 377–381. [Google Scholar]
- Zhang, G. Rectification for High Resolution Remote Sensing Image under Lack of Ground Control Points; Wuhan University: Wuhan, China, 2005. [Google Scholar]
Figure 1.
Geometry processing technology flow chart of Luojia1-01 nighttime light imagery.

Figure 2.
City lights of Wuhan by Luojia1-01. (a) Cloud-contaminated, (b) cloud-free.

Figure 3.
Planar block adjustment technical flowchart.

Figure 4.
Digital elevation model (DEM) elevation constraint.

Figure 5.
Nighttime light image distribution.

Figure 6.
Comparison of GCPs selection in Luojia1-01 and Google earth. The area is Beihai City, China. (a) The imaging time of Lujia1-01 nighttime light imagery is 2018.9.5, (b) the imaging time of optical image on Google Earth is 2018.6.8.
Figure 6.
Comparison of GCPs selection in Luojia1-01 and Google earth. The area is Beihai City, China. (a) The imaging time of Lujia1-01 nighttime light imagery is 2018.9.5, (b) the imaging time of optical image on Google Earth is 2018.6.8.

Figure 7.
Luojia1-01 nighttime light image matching effects. The red circles in (a) and (b) represent the global display of matching effects. The blue dots in (c) and (d) are details displayed for a pair of matching points.
Figure 7.
Luojia1-01 nighttime light image matching effects. The red circles in (a) and (b) represent the global display of matching effects. The blue dots in (c) and (d) are details displayed for a pair of matching points.

Figure 8.
Ground control point (GCP) and independent checkpoint (ICP) distribution map of China’s test area.
Figure 8.
Ground control point (GCP) and independent checkpoint (ICP) distribution map of China’s test area.

Figure 9.
Reliable tie points (TPs) distribution map of China’s test area.

Figure 10.
Residual errors of free network adjustment.

Figure 11.
Residual errors of control network adjustment.

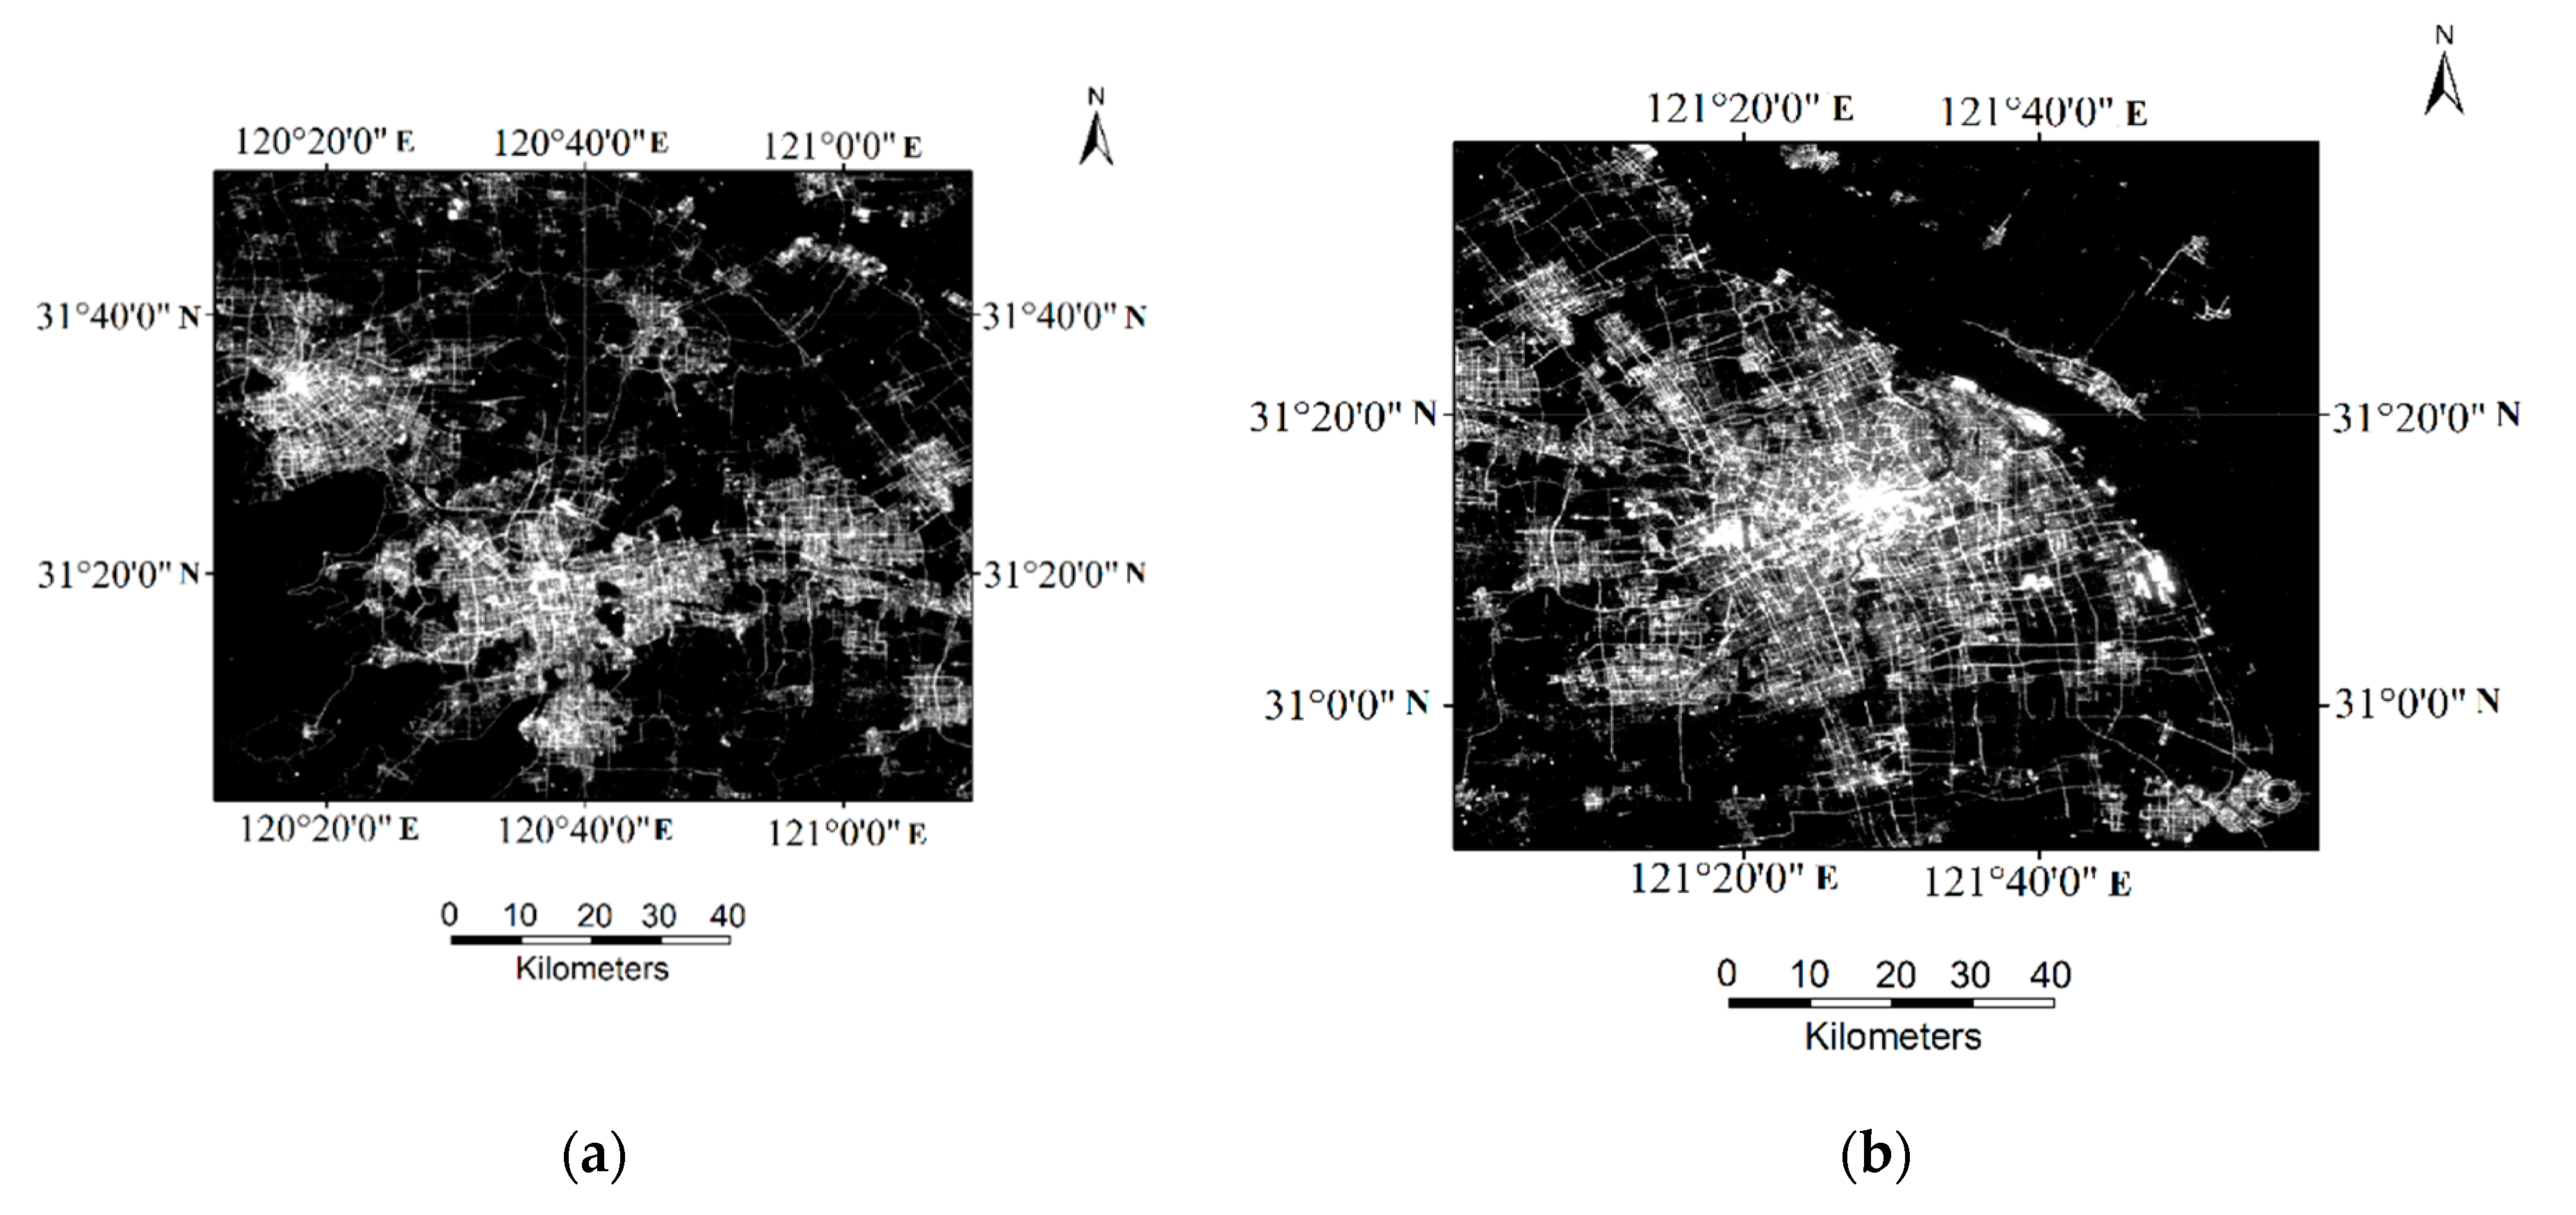
Figure 12.
Schematic diagram of joints of orthophotos. (a)The area is Suzhou, China, (b) the area is Shanghai, China, (c) the area is Tianjin, China, (d) the area is Pearl River Delta, China.
Figure 12.
Schematic diagram of joints of orthophotos. (a)The area is Suzhou, China, (b) the area is Shanghai, China, (c) the area is Tianjin, China, (d) the area is Pearl River Delta, China.


Figure 13.
Nighttime light map of China using Luojia1-01 images. The yellow box in the lower right corner shows a schematic view of the South China Sea.
Figure 13.
Nighttime light map of China using Luojia1-01 images. The yellow box in the lower right corner shows a schematic view of the South China Sea.


Table 1.
Basic parameters of test area.
| Item | Parameter |
|---|---|
| Nominal resolution (m) | 130 |
| Width of image (km) | 250 |
| Number of orbits | 26 |
| Number of images | 275 |
| Number of GCPs/ICPs | 58 |
| Test area (km2) | 9,634,057 |
Table 2.
Accuracy of block adjustment for Luojia1-01 images using TPs.
| Test Area | Images | TPs (num) | Max Errors of TPs (Pixel) | RMS Errors of TPs (Pixel) | ||||
|---|---|---|---|---|---|---|---|---|
| x | y | Planar | x | y | Planar | |||
| Track 1 | 59 | 1095 | 2.910 | −2.797 | 2.911 | 0.679 | 0.603 | 0.909 |
| Track 2 | 59 | 1896 | −2.193 | −2.746 | 3.514 | 0.645 | 0.517 | 0.827 |
| Track 3 | 58 | 1991 | 2.211 | −2.141 | 2.211 | 0.604 | 0.693 | 0.919 |
| Track 4 | 41 | 1863 | −2.712 | −2.604 | 2.840 | 0.577 | 0.639 | 0.861 |
Table 3.
Accuracy of block adjustment for Luojia1-01 images using TPs.
| Test Area | GCPs | ICPs | Max Errors of TPs (Pixel) | RMS Errors of TPs (Pixel) | ||||
|---|---|---|---|---|---|---|---|---|
| x | y | Planar | x | y | Planar | |||
| China | 0 | 58 | 2.399 | 2.385 | 2.448 | 0.418 | 0.427 | 0.598 |
| 25 | 33 | 4.125 | 4.762 | 5.419 | 0.684 | 0.707 | 0.983 | |
Table 4.
Checkpoints accuracy of block adjustment for Luojia1-01 images.
| Test Area | GCPs | ICPs | Type of Error | Max Errors of ICPs | RMS Errors of ICPs | ||||
|---|---|---|---|---|---|---|---|---|---|
| x | y | Planar | x | y | Planar | ||||
| China | 0 | 58 | Object (m) | 1043.391 | 1704.824 | 1939.699 | 395.503 | 558.723 | 683.386 |
| 25 | 33 | 247.713 | 285.730 | 310.087 | 130.063 | 145.946 | 195.491 | ||
| 0 | 58 | Image (pixel) | −14.151 | −10.522 | −17.634 | 4.593 | 3.865 | 6.003 | |
| 25 | 33 | −2.105 | 2.058 | −2.944 | 1.127 | 1.091 | 1.569 | ||
© 2019 by the authors. Licensee MDPI, Basel, Switzerland. This article is an open access article distributed under the terms and conditions of the Creative Commons Attribution (CC BY) license (http://creativecommons.org/licenses/by/4.0/).
Share and Cite
MDPI and ACS Style
Li, X.; Wang, T.; Zhang, G.; Jiang, B.; Jia, P.; Zhang, Z.; Zhao, Y. Planar Block Adjustment for China’s Land Regions with LuoJia1-01 Nighttime Light Imagery. Remote Sens. 2019, 11, 2097. https://0-doi-org.brum.beds.ac.uk/10.3390/rs11182097
AMA Style
Li X, Wang T, Zhang G, Jiang B, Jia P, Zhang Z, Zhao Y. Planar Block Adjustment for China’s Land Regions with LuoJia1-01 Nighttime Light Imagery. Remote Sensing. 2019; 11(18):2097. https://0-doi-org.brum.beds.ac.uk/10.3390/rs11182097
Chicago/Turabian StyleLi, Xin, Taoyang Wang, Guo Zhang, Boyang Jiang, Peng Jia, Zhuxi Zhang, and Yuan Zhao. 2019. "Planar Block Adjustment for China’s Land Regions with LuoJia1-01 Nighttime Light Imagery" Remote Sensing 11, no. 18: 2097. https://0-doi-org.brum.beds.ac.uk/10.3390/rs11182097
Note that from the first issue of 2016, this journal uses article numbers instead of page numbers. See further details here.