Article

Concept Development and Risk Reduction for MISTiC Winds, A Micro-Satellite Constellation Approach for Vertically Resolved Wind and IR Sounding Observations in the Troposphere

1
BAE Systems, P.O. Box 868, Nashua, NH 03061, USA
2
Jet Propulsion Laboratory, Pasadena, CA 91109, USA
3
NASA Goddard Space Flight Center, Greenbelt, MD 02771, USA
4
University of Massachusetts Lowell, Lowell, MA 01854, USA
*
Author to whom correspondence should be addressed.
Remote Sens. 2019, 11(18), 2169; https://0-doi-org.brum.beds.ac.uk/10.3390/rs11182169
Submission received: 28 July 2019 / Revised: 11 September 2019 / Accepted: 12 September 2019 / Published: 18 September 2019
(This article belongs to the Special Issue Satellite-Derived Wind Observations)

Abstract

:
MISTiC Winds is an instrument and constellation mission approach to simultaneously observe the global thermodynamic state and the vertically resolved horizontal wind field in the troposphere from LEO SSO. The instrument is a wide-field imaging spectrometer operated in the 4.05–5.75 μm range, with the spectral resolution, sampling, radiometric sensitivity, and stability needed to provide temperature and water vapor soundings of the atmosphere, with 1 km vertical resolution in the troposphere-comparable to those of NASA’s atmospheric infrared sounder (AIRS). These instruments have much higher spatial resolution (<3 km at nadir) and finer spatial sampling than current hyperspectral sounders, allowing a sequence of such observations from several micro-satellites in an orbital plane with short time separation, from which atmospheric motion vector (AMV) winds are derived. AMVs for both cloud-motion and water vapor-motion, derived from hyperspectral imagery, will have improved velocity resolution relative to AMVs obtained from multi-spectral instruments operating in GEO. MISTiC’s extraordinarily small size, low mass (<15 kg), and minimal cooling requirements can be accommodated aboard an ESPA-class microsatellite. Low fabrication and launch costs enable this constellation to provide more frequent atmospheric observations than current-generation sounders provide, at much lower mission cost. Key technology and observation method risks have been reduced through recent laboratory and airborne (NASA ER2) testing funded under NASA’s Instrument Incubator Program and BAE Systems IR&D, and through an observing system simulation experiment performed by NASA GMAO. This approach would provide a valuable new capability for the study of the processes driving high-impact weather events, and critical high-resolution observations needed for future numerical weather prediction.

Graphical Abstract

(Not export controlled per ES-C4ISR-073019-0179, Approved for Public Release; Unlimited Distribution)

1. Introduction

1.1. Overview

To specify the current thermodynamic state of the atmosphere and to predict its future state, one must know the flow field in addition to the mass field [1]. The latent heat present in the water vapor field is one of the most dominant forms of energy storage in the atmosphere. Transport of this stored energy by the three-dimensional wind field is one of the most fundamental processes driving our weather, and is a key element in both the water and energy cycles [1].
Observations of the thermodynamic state of the atmosphere from low earth orbit (LEO) using infrared (IR) and microwave spectral sounding methods have enabled significant advances in our understanding of atmospheric processes [2]. These observations currently have a stronger impact on global numerical weather forecast model accuracy than any other type of observation [3] (p.307). However, it has long been recognized that more accurate, vertically resolved, wind field observations in the troposphere would provide a further significant improvement in our ability to characterize the processes that lead to high impact weather events and more generally, improve weather forecast accuracy [4].
The horizontal wind field has been observed from space since the introduction of the geostationary weather satellite in the 1960s using the method of atmospheric motion vectors (AMVs) [1]. This method has been refined substantially over the years, and is currently employed operationally using the observations from multi-spectral meteorological imagers worldwide. AMVs provide an important positive impact on numerical weather prediction (NWP) [5]. However, their full impact on NWP has been constrained by the limitations on height assignment accuracy inherent in multi-spectral meteorological imaging observations [6].
Over the years, several approaches that would provide vertically resolved wind field observations have been advanced, including Doppler wind light detection and ranging (LIDAR or DWL) [4], and geostationary hyperspectral infrared sounders (GEO hyperspectral) [7], with sufficient spatial resolution to enable motion-vector wind observations. Each of these approaches has received substantial investment, and technical progress has been made, but the cost of these approaches remains very high. Hundreds of millions of dollars were spent on GEO hyperspectral sounding developments during the last few decades, but these efforts in the US were halted prior to fully developing and launching an instrument. Space-based Doppler wind LIDAR has been under development for an even longer period than has hyperspectral IR sounding. After two decades of development, a single vector component/single curtain DWL [8] was recently launched by the European Space Agency and is undergoing check-out at a very high overall program cost of more than $550M.
The National Research Council (NRC), in the recently released Decadal Survey for Earth Sciences [3] (p. 10, p. 138), highlighted once again the importance of vertically resolved tropospheric winds as well as the need for thermodynamic vertical profiles at higher spatial resolution, vertical resolution, and observation tempo. The purpose of this paper is to present a new observation approach, MISTiC® Winds (Midwave Infrared Sounding of Temperature and Humidity in a Constellation for Winds), which is highly responsive to the observation needs identified by the NRC, and to contemporary fiscal constraints. MISTiC Winds would employ miniature infrared hyperspectral sounders in a LEO microsatellite constellation that will provide vertically resolved wind velocity observations using hyperspectral and imaging methods, together with more frequent, higher spatial resolution soundings of the troposphere, at much lower cost than DWL and GEO hyperspectral implementations. A preliminary and partial presentation of MISTiC Winds was given previously [9,10,11].
The remainder of this paper is organized in the following way. Section 1.2 will briefly review the historical background of hyperspectral infrared sounding, previous attempts to bring this capability to geostationary orbit, and multispectral imaging methods for motion vector winds. Section 2 will describe the MISTiC Winds instrument and mission requirements, the observations currently provided by the program of record, and NASA and NOAA’s earlier GEO hyperspectral efforts. Section 3 will present the key results of work to reduce the risks associated with the MISTiC Winds approach, including a description of key technology risk reduction development and testing activities, and high-altitude airborne demonstrations of the observation method. Section 4 presents an analysis of MISTiC Winds requirements, their derivation, their feasibility, and planned observation capability in the context of NASA needs. A summary is presented in Section 5.

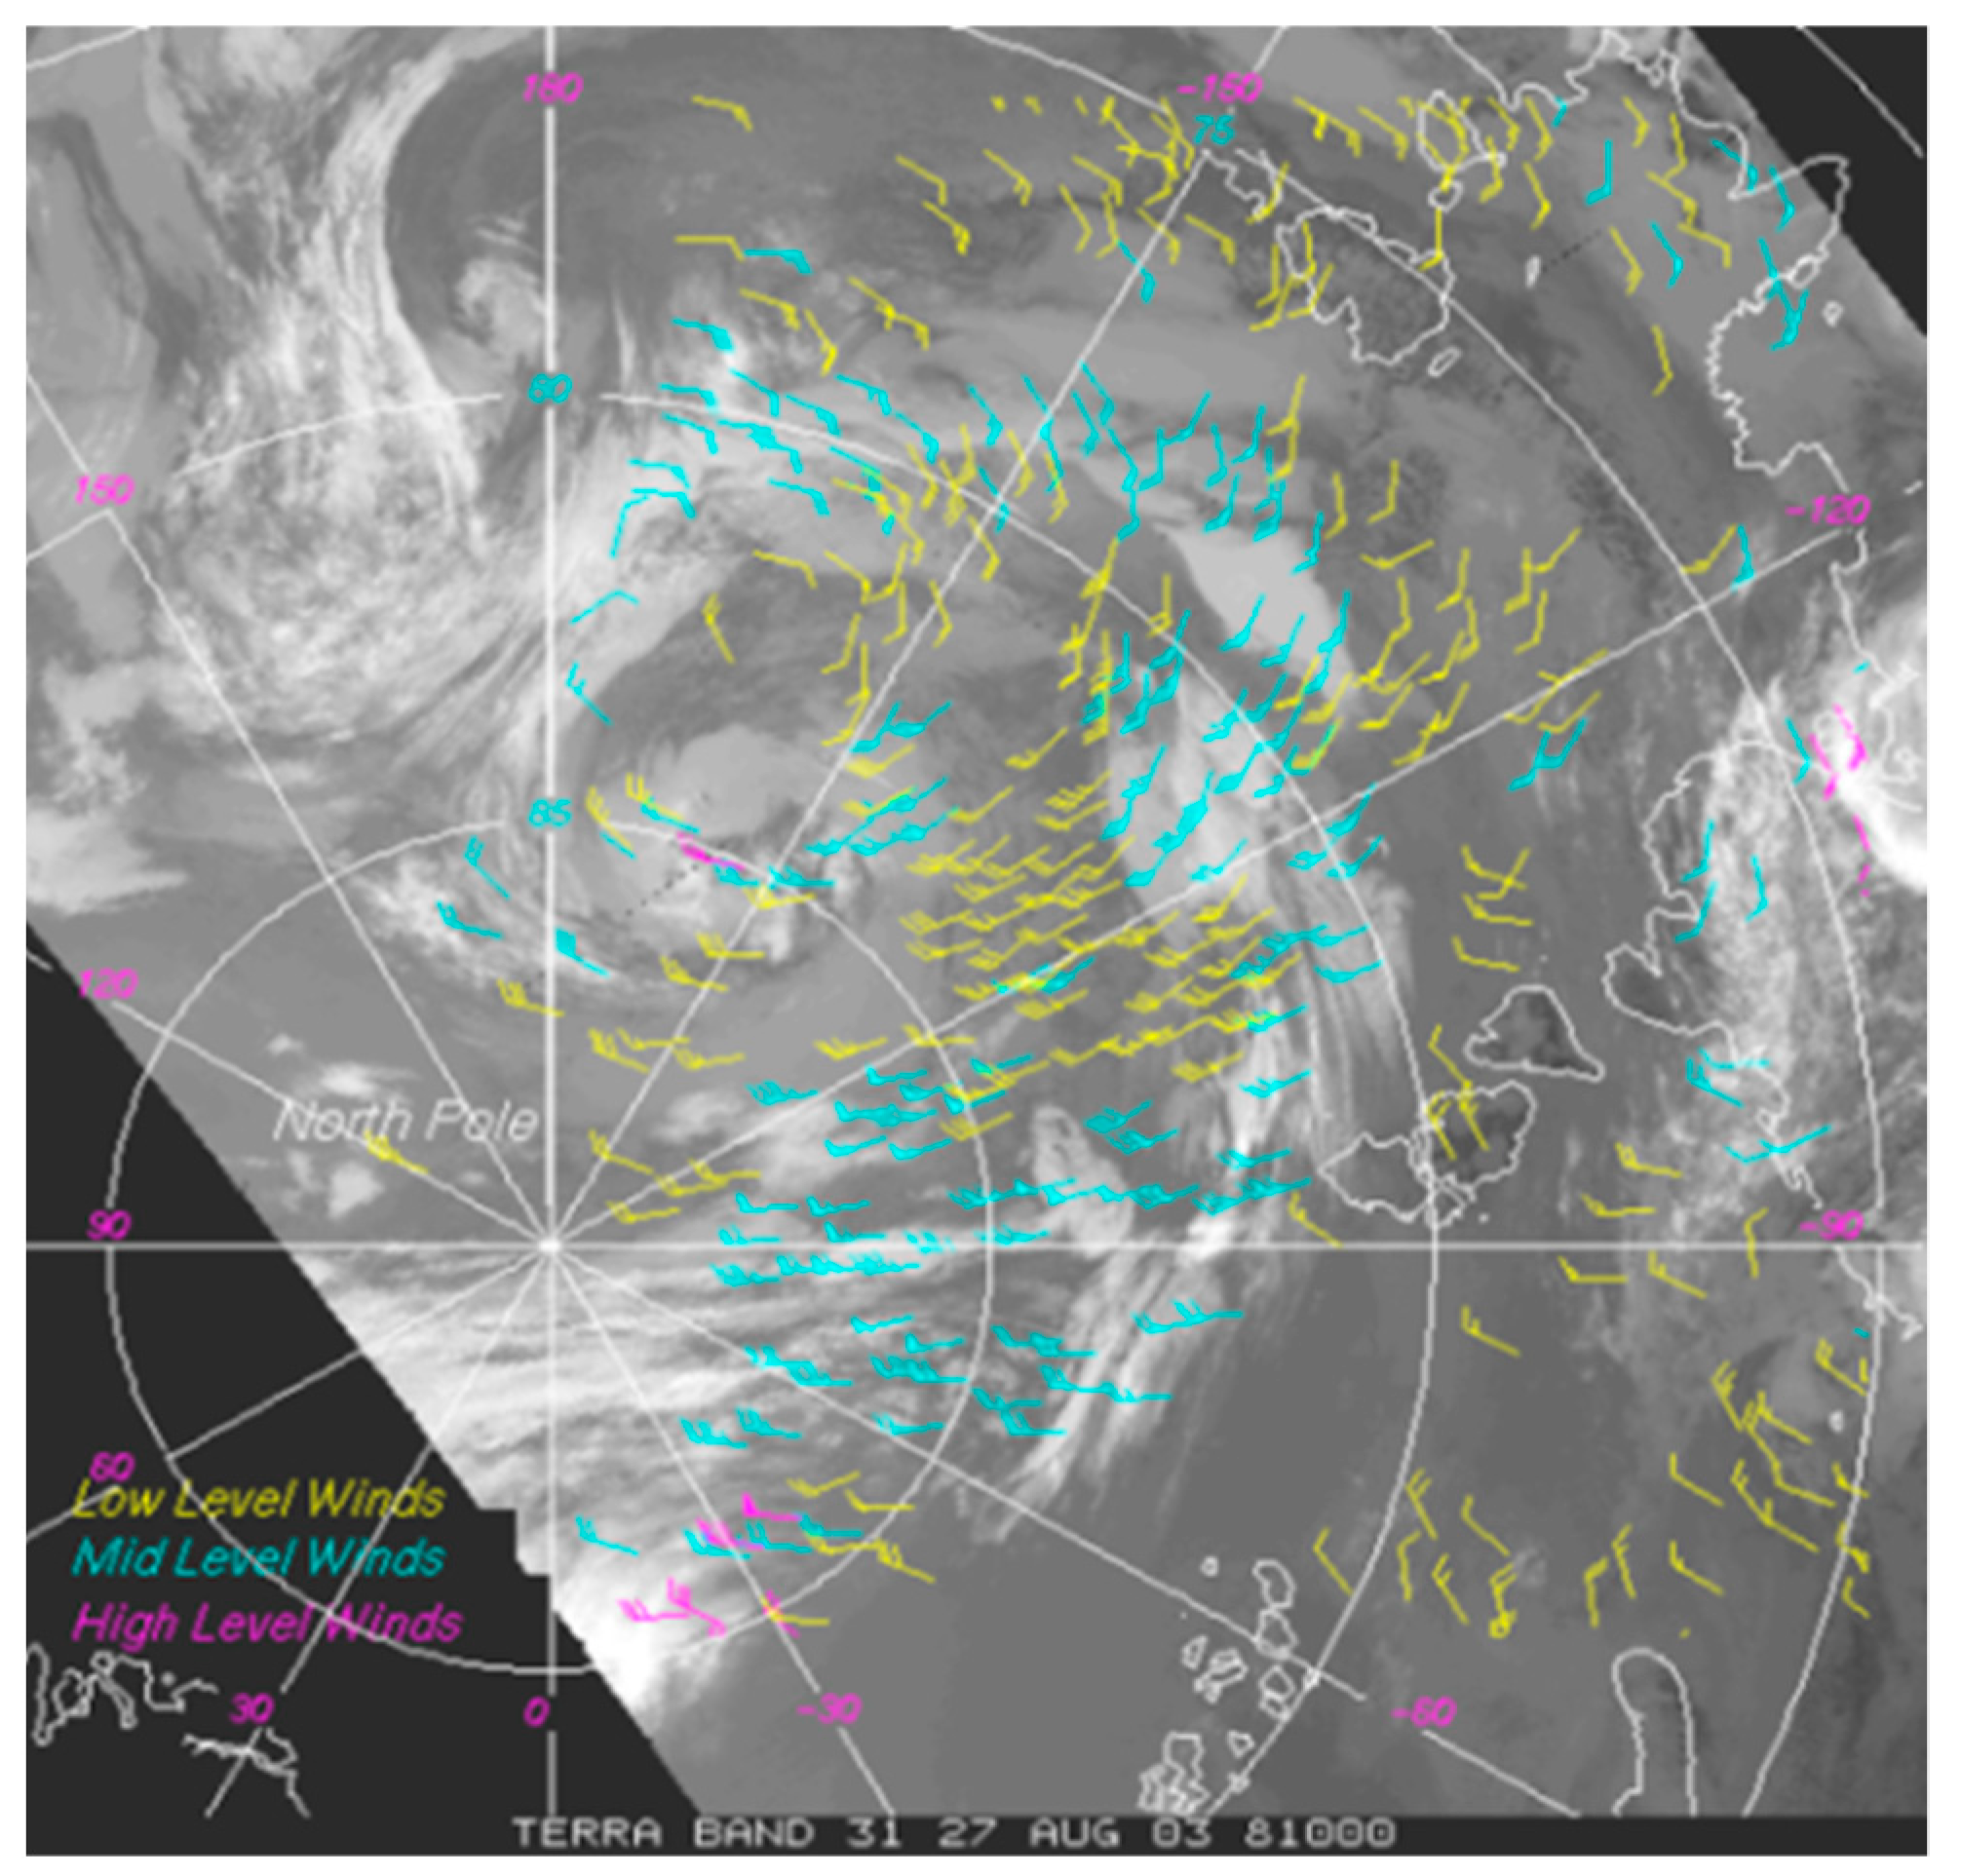
1.2. Historical Background for IR Sounding and Atmospheric Motion Vector Winds

The concept for using infrared radiance spectra to measure the vertical profile of atmospheric temperature and water vapor (infrared sounding) was first advanced by Kaplan et al. [12] in 1959. Hyperspectral infrared sounding of the temperature and moisture vertical profiles have been performed from space since the NASA atmospheric infrared sounder (AIRS) instrument was launched aboard Aqua in 2002. NASA’s AIRS instrument [13], built by BAE Systems, provided the first on-orbit demonstration of Kaplan’s method implemented with hyperspectral IR radiances. Weather and climate research based on AIRS data have made significant contributions to our understanding of the earth system [2]. Observations from AIRS and other LEO hyperspectral sounders, the infrared atmospheric interferometer sounder (IASI) and cross-track infrared sounder (CrIS), have since become some of the most important inputs into global operational numerical weather models [14,15,16]. A recent Forecast Sensitivity Observation Impact assessment by the UK Met Office [3] (p.307) ranks IR sounders as having the most significant beneficial impact of any observation in reducing the 24-h global forecast error. However, while continued incremental improvements are likely, the relative infrequency of these LEO sounding observations and the relatively large size of IR sounder spatial IFOV (now comparable to the grid spacing of global NWP models) will constrain further improvements.
Horizontal wind fields using AMVs have been derived from observations of geostationary meteorological multispectral imaging instruments (GEO MET Imagers) since the introduction of the operational geostationary weather satellite in the 1970s and ‘80s [1,17], (now the Geostationary Operational Satellite System) and are currently being provided for the US, operationally, by the GOES 16 and GOES 17 imagers and by the nearly identical Himawari instruments. GEO MET imager-based wind observations provide a positive impact to the numerical weather prediction (NWP) models, although not with as significant an impact as those provided by IR and microwave sounding.
AMVs are determined from observing the horizontal displacement of a feature in either the 2D water vapor field, or the cloud field, over a known time interval. This feature velocity, identified with the wind velocity, must be assigned a height in the atmosphere to be used in NWP, and different operational centers deriving AMVs have different methods for this height assignment. The two leading wind-velocity error terms for GEO MET Imagers are the errors in the vertical height assignment (in the presence of wind shear) and errors in the relative position change of the tracked feature, also referred to as a tracking error. The GOES ABI (advanced baseline imager) improves the accuracy of the feature tracking term relative to prior geostationary imagers, by moving from the 4 km resolution of prior GOES imagers to 2 km for the IR channels in ABI at nadir. However, the height assignment error term has a basic cause linked to a fundamental design attribute of multi-spectral imagers, the spectral channel bandwidth generally employed, which varies from 0.5 to 1.0 micrometers for IR window and water vapor channels. For water vapor channels, these bandwidths are broad enough that they include many atmospheric absorption or emission lines for water vapor, with a broad range of line strengths. As a consequence, the vertical contribution functions for such channels are very broad, extending over much of the troposphere, and accurate feature height assignment is difficult. In current instruments, these bands were chosen to emphasize higher-level water vapor and avoid surface emission. One consequence of this choice is that these wind observations are primarily weighted high in the troposphere. Cloud motion vectors are observed using atmospheric window channels. In the thermal infrared, cloud brightness temperature could indicate the cloud pressure height, but only if the vertical temperature profile was also known. In the absence of temperature profile knowledge, various approaches to height assignment have been developed, but these have shortcomings. Channel brightness temperature could also be an indicator of height for water vapor motion-vector wind tracers, but determining the height from the radiance requires knowledge of both the temperature and water vapor concentration vertical profiles.
As a result of this missing information, the AMV wind speed error associated with current multispectral imager observations remains relatively large. For the GOES 16 imager, errors near 5–6 m/s rms relative to radiosondes (near 500 hPa) are reported [18], which is approximately 2–3× larger than the wind speed error needed by NWP models [19]. An additional concern presented by the multi-spectral imaging approach for AMVs is that these wind observations are not well distributed vertically through the troposphere. Cloud motion vector winds (which, of course, require the presence of clouds for an observation) are primarily located in the lower troposphere, well below 600 hPa, whereas moisture-motion-vector winds are primarily located in the upper troposphere, above 400 hPa [18]. Very few wind observations are available near 500 hPa, where observing system simulation experiments (OSSEs) show that wind observations would have the greatest impact on weather forecast accuracy [19].
Hyperspectral infrared sounding has an inherent capacity to provide pressure-height information for the image-features observed (through the retrieved vertical profiles) that has long been recognized as beneficial for AMVs, and wind retrieval approaches employing hyperspectral techniques have been developed [20,21]. The challenge has been to provide the hyperspectral sounding observations themselves at a temporal and spatial resolution that would support wind observations-affordably.
In the US, NASA initially selected the geosynchronous imaging Fourier transform spectrometer (GIFTS), a GEO hyperspectral IR sounder, under its New Millennium Program, with plans for higher temporal rate IR soundings as well as hyperspectral AMV winds [7]. However, GIFTS was canceled, with the projected total program cost relative to the mission cost cap cited as an important factor. NOAA thoroughly evaluated the possibility of including a hyperspectral IR sounder (that would have supported hyperspectral AMVs) in the GOES-R series, supporting instrument concept development, trade studies, and technology risk reduction efforts through the Formulation Phase Program. However, NOAA determined that the cost and risk were too high in light of GOES-R budget constraints [22]. The indefinite deferral by NOAA’s GOES Program of hyperspectral observation methods, even though they have been shown to provide significant weather forecast impact, was one of the primary motivations for the development of MISTiC Winds. MISTiC Winds addresses both of these AMV wind velocity error terms, (height assignment error and tracking error) in mission implementation that is much lower in cost, more flexible, and more resilient than providing these observations from a GOES-R class IR sounder. MISTiC Winds does this while providing a measurement of the vertical temperature and moisture profile of the troposphere at unprecedented spatial resolution and refresh rate.
The approach to vertically resolved wind observations has long been envisioned as a Doppler Wind LIDAR. However, MISTiC Winds may provide tropospheric wind measurements with vertical resolution sufficient for many purposes, at a substantially lower cost and under a wide range of conditions. MISTiC Winds observations may also provide a highly effective complement to a DWL, extending the impact of the more accurate vertical profiling achievable with a LIDAR over a narrow spatial field to the broader spatial field that a mapping observation such as MISTiC Winds would provide.
A recent OSSE performed by NASA’s Global Modeling and Assimilation Office (GMAO) [23] simulating MISTiC observations of vertically resolved winds and IR hyperspectral radiances has shown significant weather forecast impact from both the assimilated wind and radiance observations. Experimental evidence of weather forecast improvement from retrieved wind observations derived using hyperspectral sounding methods has recently emerged from the AIRS Polar Winds observing system experiments [24], where these satellite-derived moisture motion-vector winds have been shown to have the largest impact of any other observation in the data-sparse polar region. These improvements were achieved, even with the disadvantages of a relatively large AIRS footprint (15 km at nadir) and the relatively long (~100 min) period between observations available with polar-crossing LEO sun-synchronous orbit satellites.

2. Materials and Methods

The development of every new instrument and mission approach is a balancing act at some level, and this is especially true for MISTiC Winds. We seek to combine the most essential aspects of infrared sounding requirements and instrument design with the most essential aspects of meteorological imagers designed to obtain the image sequences with the fidelity needed to track the wind-driven features to provide new observation capability that will enable significant advances weather process understanding and weather forecast accuracy improvements. We seek to accomplish this in an era defined by expanding observation needs but flat to declining budgets for new observations, but also one in which there will be a rich international operational system of systems for weather remote sensing observations that this new capability should complement, but need not replicate. These considerations strongly drive requirements and design choices.

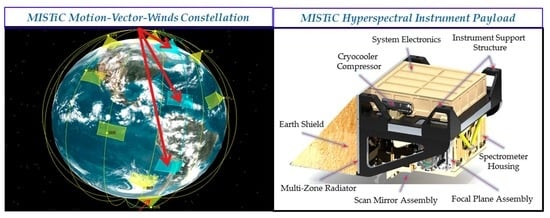
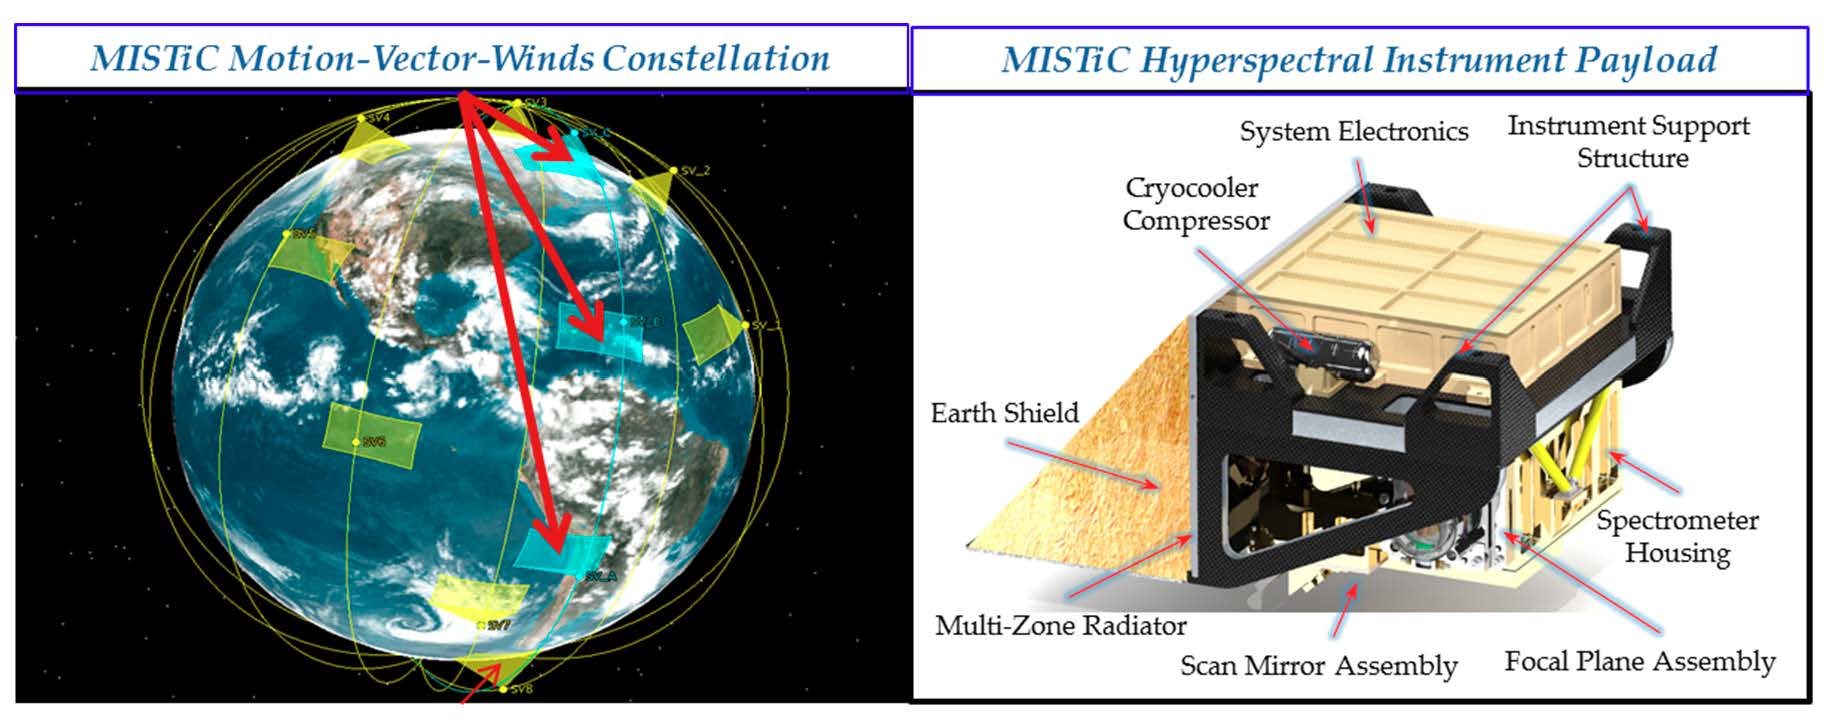
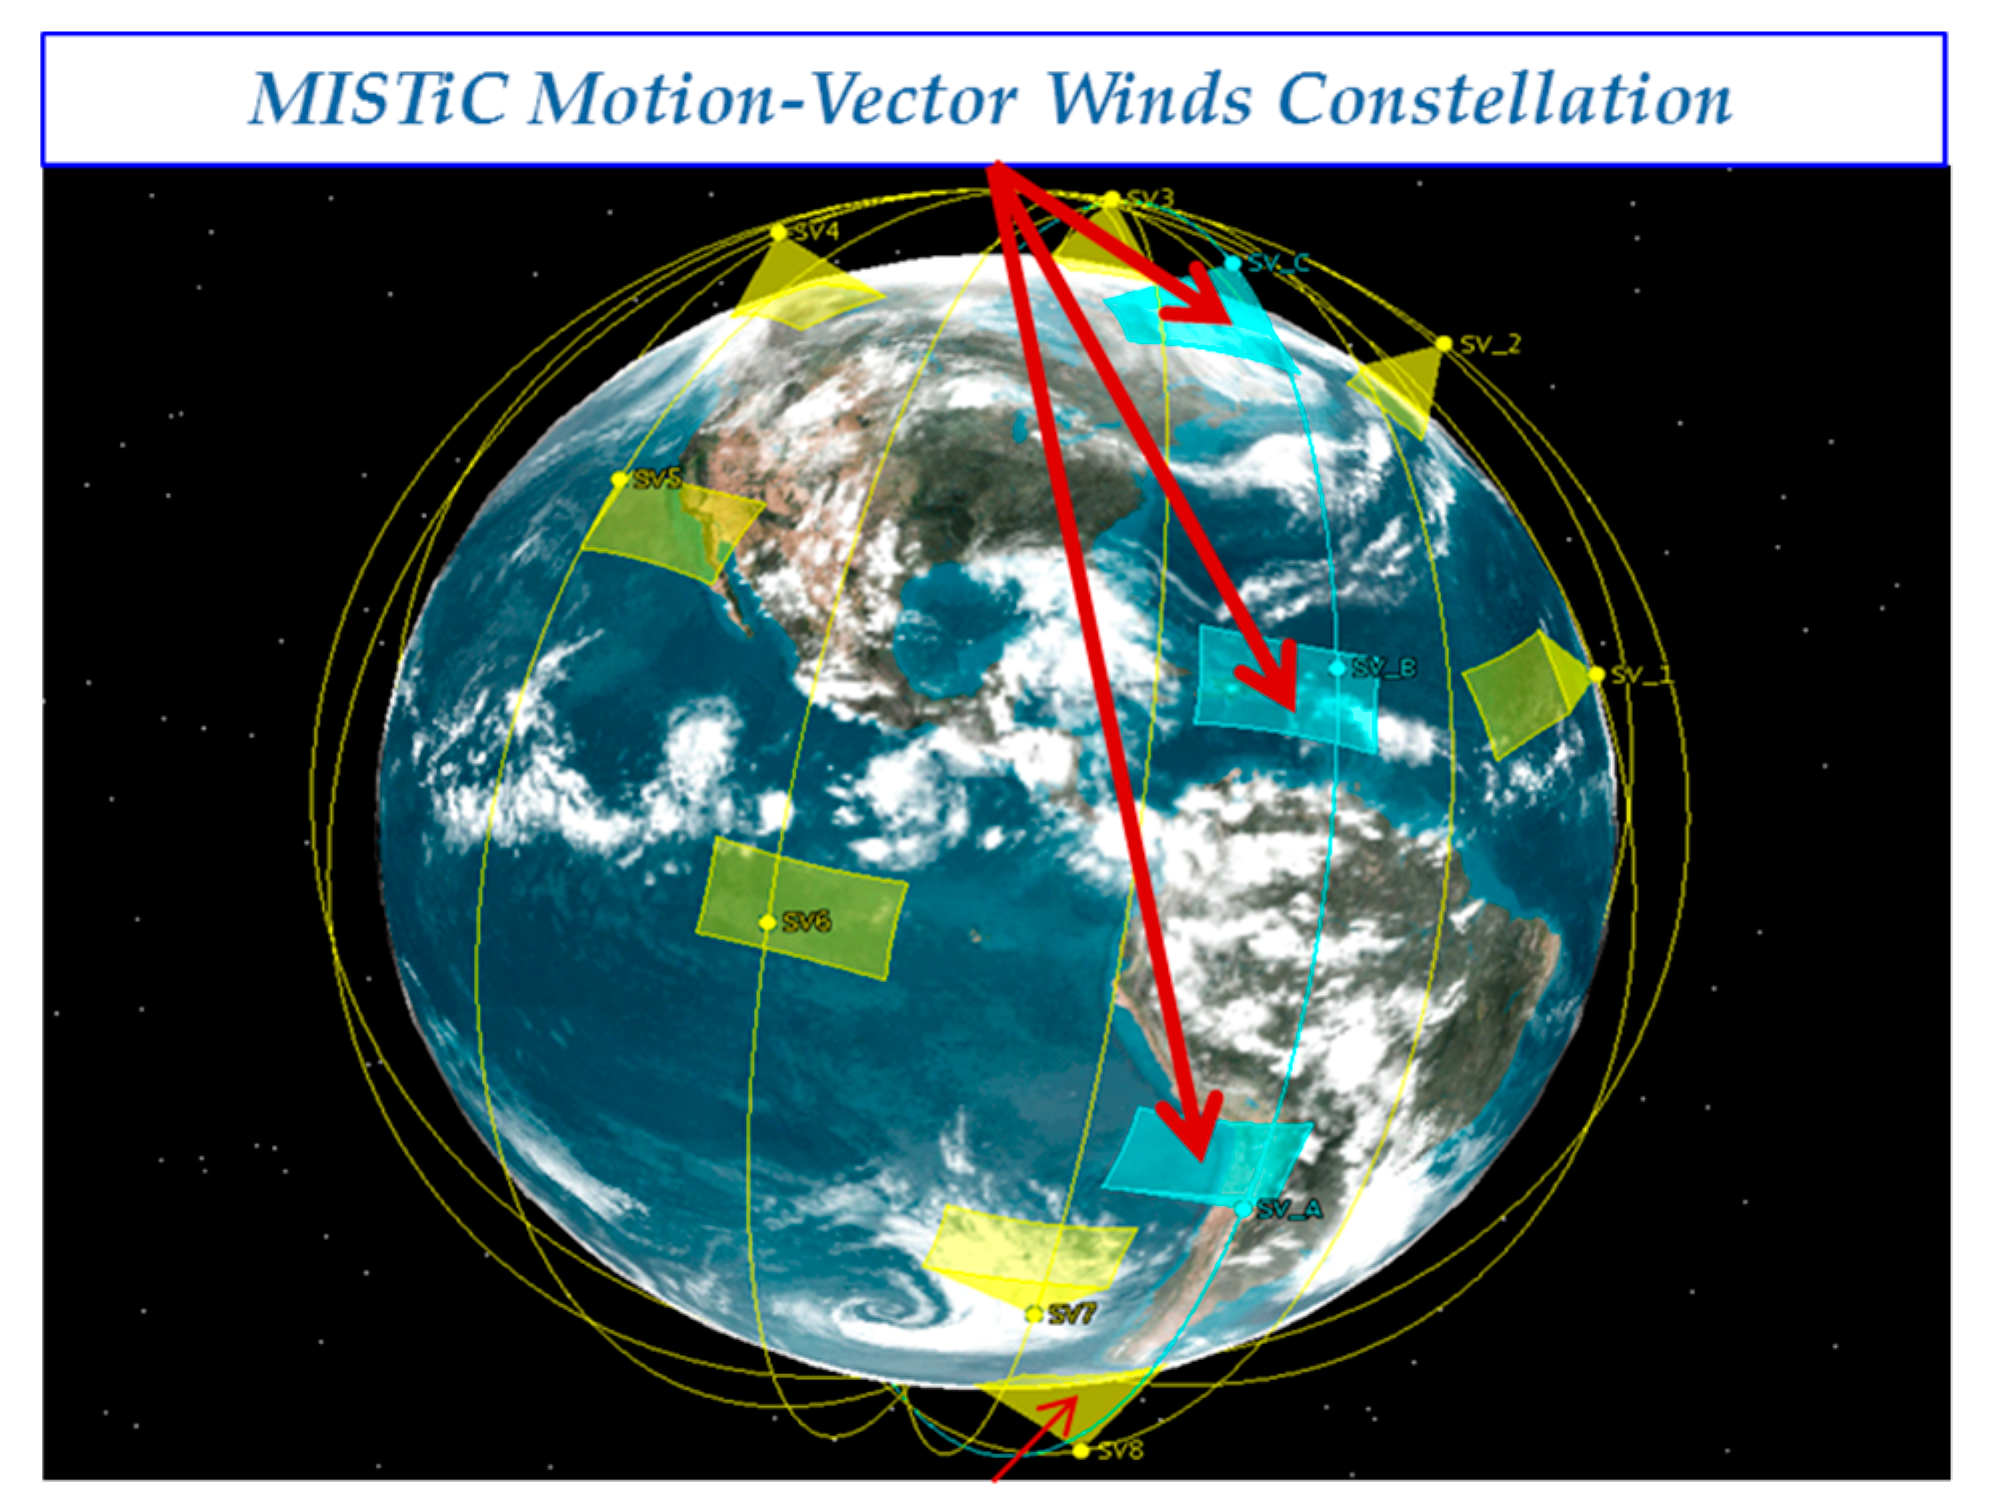
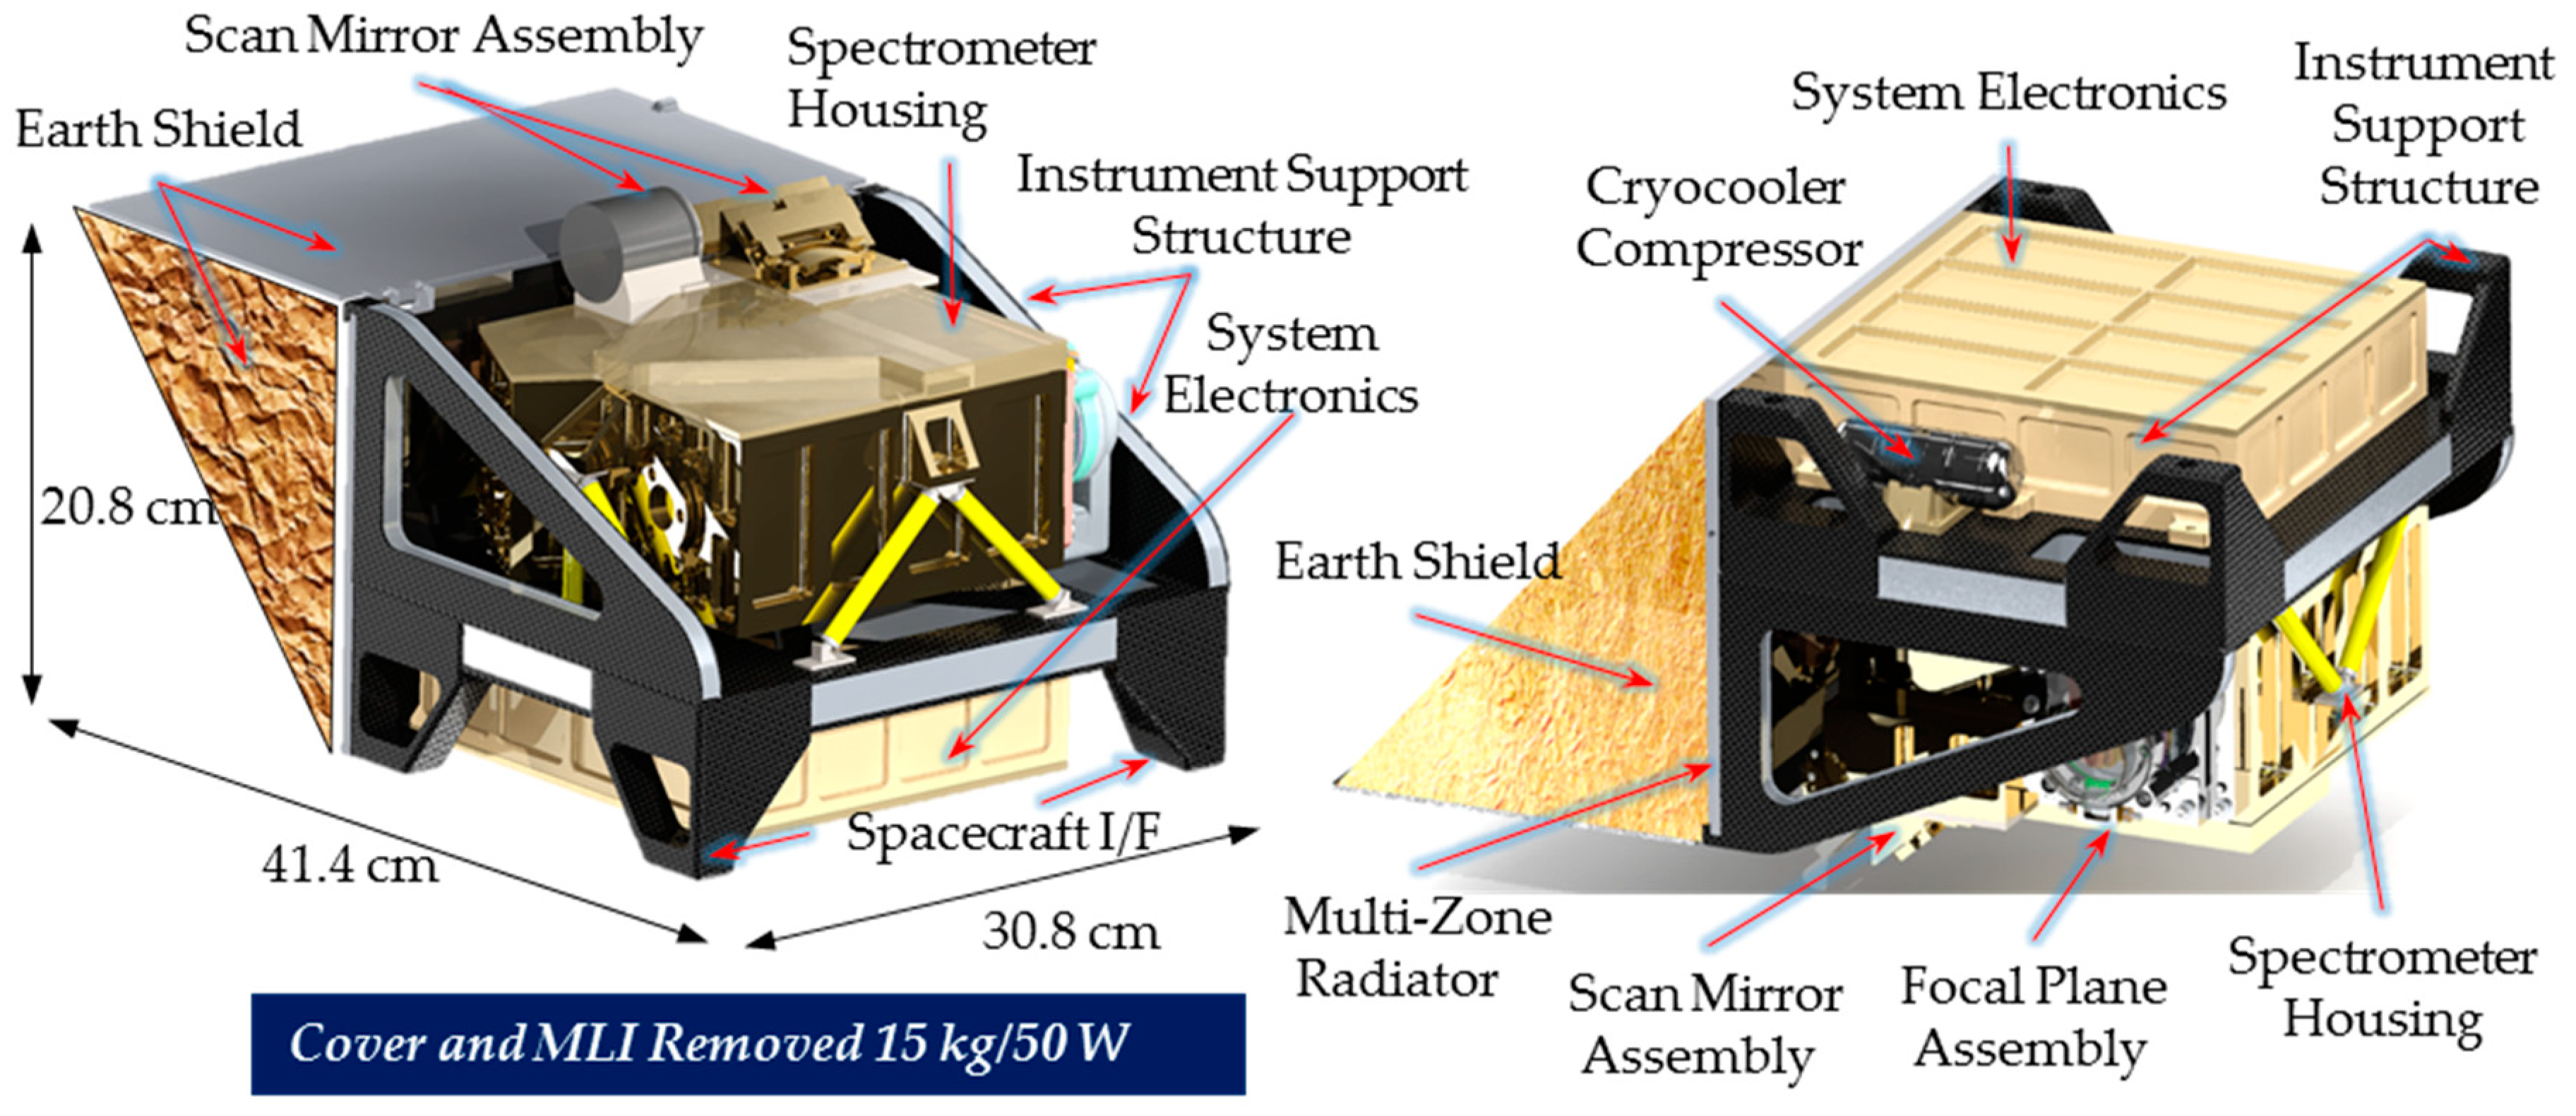
2.1. MISTiC Winds Observing Concept, Requirements, and MISTiC Instrument Concept

One of the central ideas behind MISTiC Winds is the use of a constellation of micro-satellites, each hosting a miniature infrared spectral sounding instrument, to enable much more frequent observations of the three-dimensional atmosphere than a single instrument in LEO could provide. A constellation concept for these observation employs groups of three satellites in a (nearly) common orbital plane, with nodal crossing times separated by a short interval-nominally 10 min. One such wind-triplet group is shown, in blue, in Figure 1. Each group of three instruments observes a motion-vector wind triplet of hyperspectral images, analogous to three sequential images of a region by a GEO met-imager such as GOES, that are currently used to derive AMVs. In Figure 1, the light blue rectangles indicate the approximate ground-projection of the hypercube, which is acquired as the slit image of a spectrometer is scanned in a direction perpendicular to the polar orbital track (an alternative mission possibility, more frequent IR sounding, but without wind observations was also considered, and its orbits are shown in Figure 1 in goldenrod, but not discussed further).
AMV winds, such as those shown in Figure 2, represent the current derived product, with horizontal wind speed and direction being determined from tracer observations in three radiance images. In the hyperspectral AMV case, the feature tracked would either be a cloud or a geometric feature of the retrieved water vapor field. Hyperspectral AMVs will build on methods developed for multispectral AMVs, but will feature more layers, with better vertical resolution than available from current multispectral imager-derived AMVs.
A potentially more powerful, but more data-intensive wind retrieval method borrowed from the computer vision community, Optical Flow, is currently being developed by several groups [21] for use in wind field retrieval from meteorological imaging sensors. This paper will focus on the hyper-spectral extension of the current AMV method, but MISTiC observations are ideally suited for an Optical Flow-based retrieval method as well. Six MISTiC satellites in this constellation type would provide vertically-resolved wind velocity measurement, globally, with a refresh rate of six hours, together with high spatial resolution vertical temperature and moisture soundings of the troposphere at the same six-hour refresh rate as one example.
Each MISTiC instrument would collect a series of hyper-cubes as it progresses along the orbital track. A MISTiC hypercube includes 480 along-track spatial samples, more than 1000 spatial samples cross-track, and 580 spectral samples. The vertically resolved tropospheric wind is obtained through higher-level data processing of the hyperspectral image data, using methods drawn from both IR sounding and feature-tracking AMV methods, or optical flow methods, using data from all three hyper-cubes provided by the satellite triplet.
The MISTiC instrument is a dispersive imaging spectrometer, which combines features of BAE Systems’ airborne and ground-based hyperspectral imaging systems developed for the Department of Defense, with spectral resolution, range, spectral calibration stability, and spectral knowledge requirements derived from the NASA AIRS instrument requirements and GOES-R Hyperspectral Environmental Suite (HES) infrared sounding requirements. A detailed physical model view of this instrument is shown in Figure 3. The instrument will be carried aboard an ESPA-class micro-satellite in polar sun-synchronous orbit.
Key design elements of the instrument are identified in Figure 3. An internal scan mirror scans the slit-image field of view across the surface of the earth from east to west as the satellite progresses through the orbit. Like AIRS, the instrument will periodically observe both deep space, and an on-board blackbody source to provide the data used to calibrate the raw radiances, correcting for detector non-uniformity effects. Sensitive spectrometers operating in this portion of the infrared band require cooling for both the spectrometer optics and the detector array. The MISTiC spectrometer is passively cooled by using radiator panels that reject heat to space. A sun-synchronous orbit (SSO) with appropriate nodal crossing times is used so that the spacecraft and instrument are always provided with a surface for this passive radiator that is shielded from solar illumination and earth emission, without requiring spacecraft attitude adjustments. The detector is actively cooled using a miniature pulse-tube cryo-cooler to ensure both sufficient on-orbit life and to minimize vibration-induced spectral observation errors.
The overarching design goal adopted for MISTiC Winds is to provide high-quality observations of proven scientific and meteorological value, while making dramatic reductions in size, mass, power, and cost for the instruments. This goal is pursued in a comprehensive and balanced way that includes:
Tailoring requirements for the 3D winds and temperature/humidity sounding to emphasize observations from the troposphere, by adapting infrared resolving power, infrared spectral range, while minimizing instrument size, mass, power, and overall space segment cost.
Using innovative instrument opto-mechanical and thermal design methods and adopting AIRS-proven orbit and passive spectrometer cooling to minimize instrument electrical power.
Leveraging advanced instrument technology and the rapidly developing and increasingly capable CubeSat and microsat-satellite technology base including miniature coolers.
As mentioned above, relocating hyperspectral IR observations originally envisioned for GEO to a LEO constellation that can provide comparable refresh rates would provide a major reduction in required resources. A second critical requirements adjustment is to constrain spectral coverage range and resolution to those attributes needed to observe the troposphere. This choice emerges from a system-of-systems perspective, which recognizes that thermodynamic soundings of the stratosphere will be provided operationally by other sounders, allowing MISTiC Winds observations to focus on the troposphere. MISTiC spectral band selection leverage scientific and algorithmic advances of the AIRS Science Team, which uses portions of this band for vertical temperature sounding, and whose retrieval algorithms have mastered the challenges posed by non-local thermal equilibrium and surface reflectance in this band [25].
Figure 4 is an example spectrum from an IASI overpass that illustrates the planned spectral range for MISTiC observations, and key atmospheric features within this range. It includes spectral radiances strongly influenced by CO2 emission in the troposphere (near 2385 cm−1) from which the vertical temperature profile is extracted, and radiances strongly influenced by atmospheric moisture fields (between 1750 and 2000 cm−1), that, together with the temperature profile, can be used to extract vertical moisture profile. This range also includes channels strongly influenced by clouds and aerosols, and by the trace gases CO, and N2O in the free troposphere. In Figure 4, the R and P branches of the CO2 emission dominated region centered on 2385 cm−1 that are used for retrieval of the temperature profile are indicated by A. A very high transmission “super window” channel, which has utility in observing aerosols is indicated by B. Relatively high brightness channels near C are dominated by surface and boundary-layer water vapor emission. Spectral channels, such as D, are more sensitive to lower troposphere water vapor emission. Lower brightness channels, such as those indicated by E and F, are more sensitive to mid-troposphere and upper troposphere water vapor emission respectively. G indicates the spectral coverage range for the airborne MISTiC instrument. H indicates the spectral coverage range for the planned space instrument (1750 cm−1 to 2450 cm−1). As detailed in Appendix A, the airborne unit employed an off-the-shelf detector array with a nominal cutoff above 1850 cm−1. However, employing large-area spatial averaging allowed a demonstration of the spectrometer down to approximately 1830 cm−1 with the airborne unit.
The adopted spectral range specifically excludes the very long-wave spectral channels also dominated by CO2 emission, for to include these would dramatically increase the required electrical power, instrument size, and exceed the accommodation capacity of an ESPA-class microsatellite. AIRS algorithms have advanced to the point where the temperature profile retrieval employs the shorter-wavelength CO2 emission channels to retrieve troposphere temperature, with the long-wave channels supporting cloud-clearing and the retrieval of stratospheric temperature [25]. By mission design, observation of stratospheric temperature is not essential for MISTiC, since these variables will be well-observed by the NASA/NOAA Joint Polar Satellite System (JPSS) and EUMETSAT IASI instruments for decades to come.
An important requirement consideration for MISTiC is the selection of the lower frequency limit (upper wavelength limit) of the spectral range. This requirement strongly influences the retrievable information content and data quality for the moisture profile in the upper troposphere, and also strongly influences the size, and power demands of the instrument, due to the exponential dependencies of detector characteristics on bandgap and temperature.
Under the NASA Instrument Incubator Program (IIP), the impact on retrieved layer RMS error for both the temperature and water vapor concentration was evaluated for different values of the lower-frequency band limit, ranging from 1950 down to 1650 cm−1. For this study, “truth” was selected to be a set of AIRS instrument retrieved temperature and moisture vertical profiles collected for cloud-free footprints over the Pacific Ocean, and retrieved using the AIRS Version 6 algorithm, which includes channels from the full spectral range of AIRS, including those in the very long wavelength infrared (VLWIR). A regression method was used by the NASA GSFC Sounder Research Team to perform this trade-study analysis. Spectral resolving power of 700:1 was used for the MISTiC spectral response function in this study.
The key results of this trade study are shown in Figure 5. One conclusion is that reasonably accurate temperature vertical profiles can be provided up to a pressure-height of 200 hPa, using just the CO2 emission band centered on 4.3 μm (2383 cm−1). A second key result is that a lower limit of 1750 cm−1 is sufficient to provide a water vapor concentration retrieval of sufficient accuracy in the troposphere. While a lower-limit of 1650 cm−1 would provide slightly better water vapor retrievals, it would also drive out the lower-frequency detector spectral cutoff wavelength, and drive up the required instrument cooling power. A higher spectral cutoff such as 1950 cm−1 would degrade water vapor concentration measurement accuracy in the mid-troposphere.
Overall, the major benefit of this mission-specific tailoring is a reduction in spectral channel count by a factor of 3× to 4× for MISTiC relative to current hyperspectral sounders, and the exclusion of the most resource-intensive channels from the instrument. It has also since been recognized that the temperature vertical profile can be accurately retrieved with slightly coarser spectral resolution than used for AIRS, (adopting the effective spectral resolution of CrIS), and this fact has been taken into account in the selection of MISTiC Winds spectral resolution and sampling requirements.
The combination of requirements choices, design, and the use of contemporary technology in MISTiC Winds allow tremendous reductions in instrument size. Figure 6 shows the NASA AIRS instrument, together with the MISTiC instrument concept at the same scale. The GOES-R HES Formulation Phase studies yielded GEO sounder instrument designs from three industry teams, each with size much larger than AIRS, and very much larger than the set of three MISTiC instruments needed to perform a (triplet) hyperspectral AMV observation.
Key MISTiC instrument requirements developed under the IIP are shown in Table 1. These are followed by the key MISTiC Winds Level 2 data product requirements for vertically resolved wind, temperature, and water vapor observation capability in Table 2, also developed under the IIP.
The AIRS and MISTiC requirements for temperature and water vapor sounding, while similar, are not identical. The difference in vertical coverage was noted above. A requirement area where MISTiC provides considerably higher performance than current IR sounders is in the area of spatial resolution and sampling density. MISTiC is optimized to provide accurate motion-vector wind observations, which requires high spectral resolution, high spatial resolution, and appropriate spatial sampling.
The vertically resolved winds observation uses a constellation approach, and therefore requires a system-of-systems requirements framework involving instrument requirements, spacecraft requirements, and ground-processing requirements. MISTiC Winds targets both cloud and moisture-field motion. Key requirements developed under the IIP that relate to the vertically resolved vector wind observations and thermodynamic vertical profile are shown in Table 2. The purpose of these requirements is to guide the design of both the instrument and the constellation. One of the key requirements, listed first in Table 2, is the wind speed uncertainty. This requirement is assumed to include errors due to height assignment in the presence of wind shear (up to 20 m/s, as indicated in the table) well as errors in wind tracer position change. The requirements for wind vector and thermodynamic vertical profile errors are assumed to be relative to the actual atmosphere, rather than to radiosondes. The feasibility of these requirements and connections to radiosonde observations will be discussed in Section 4.

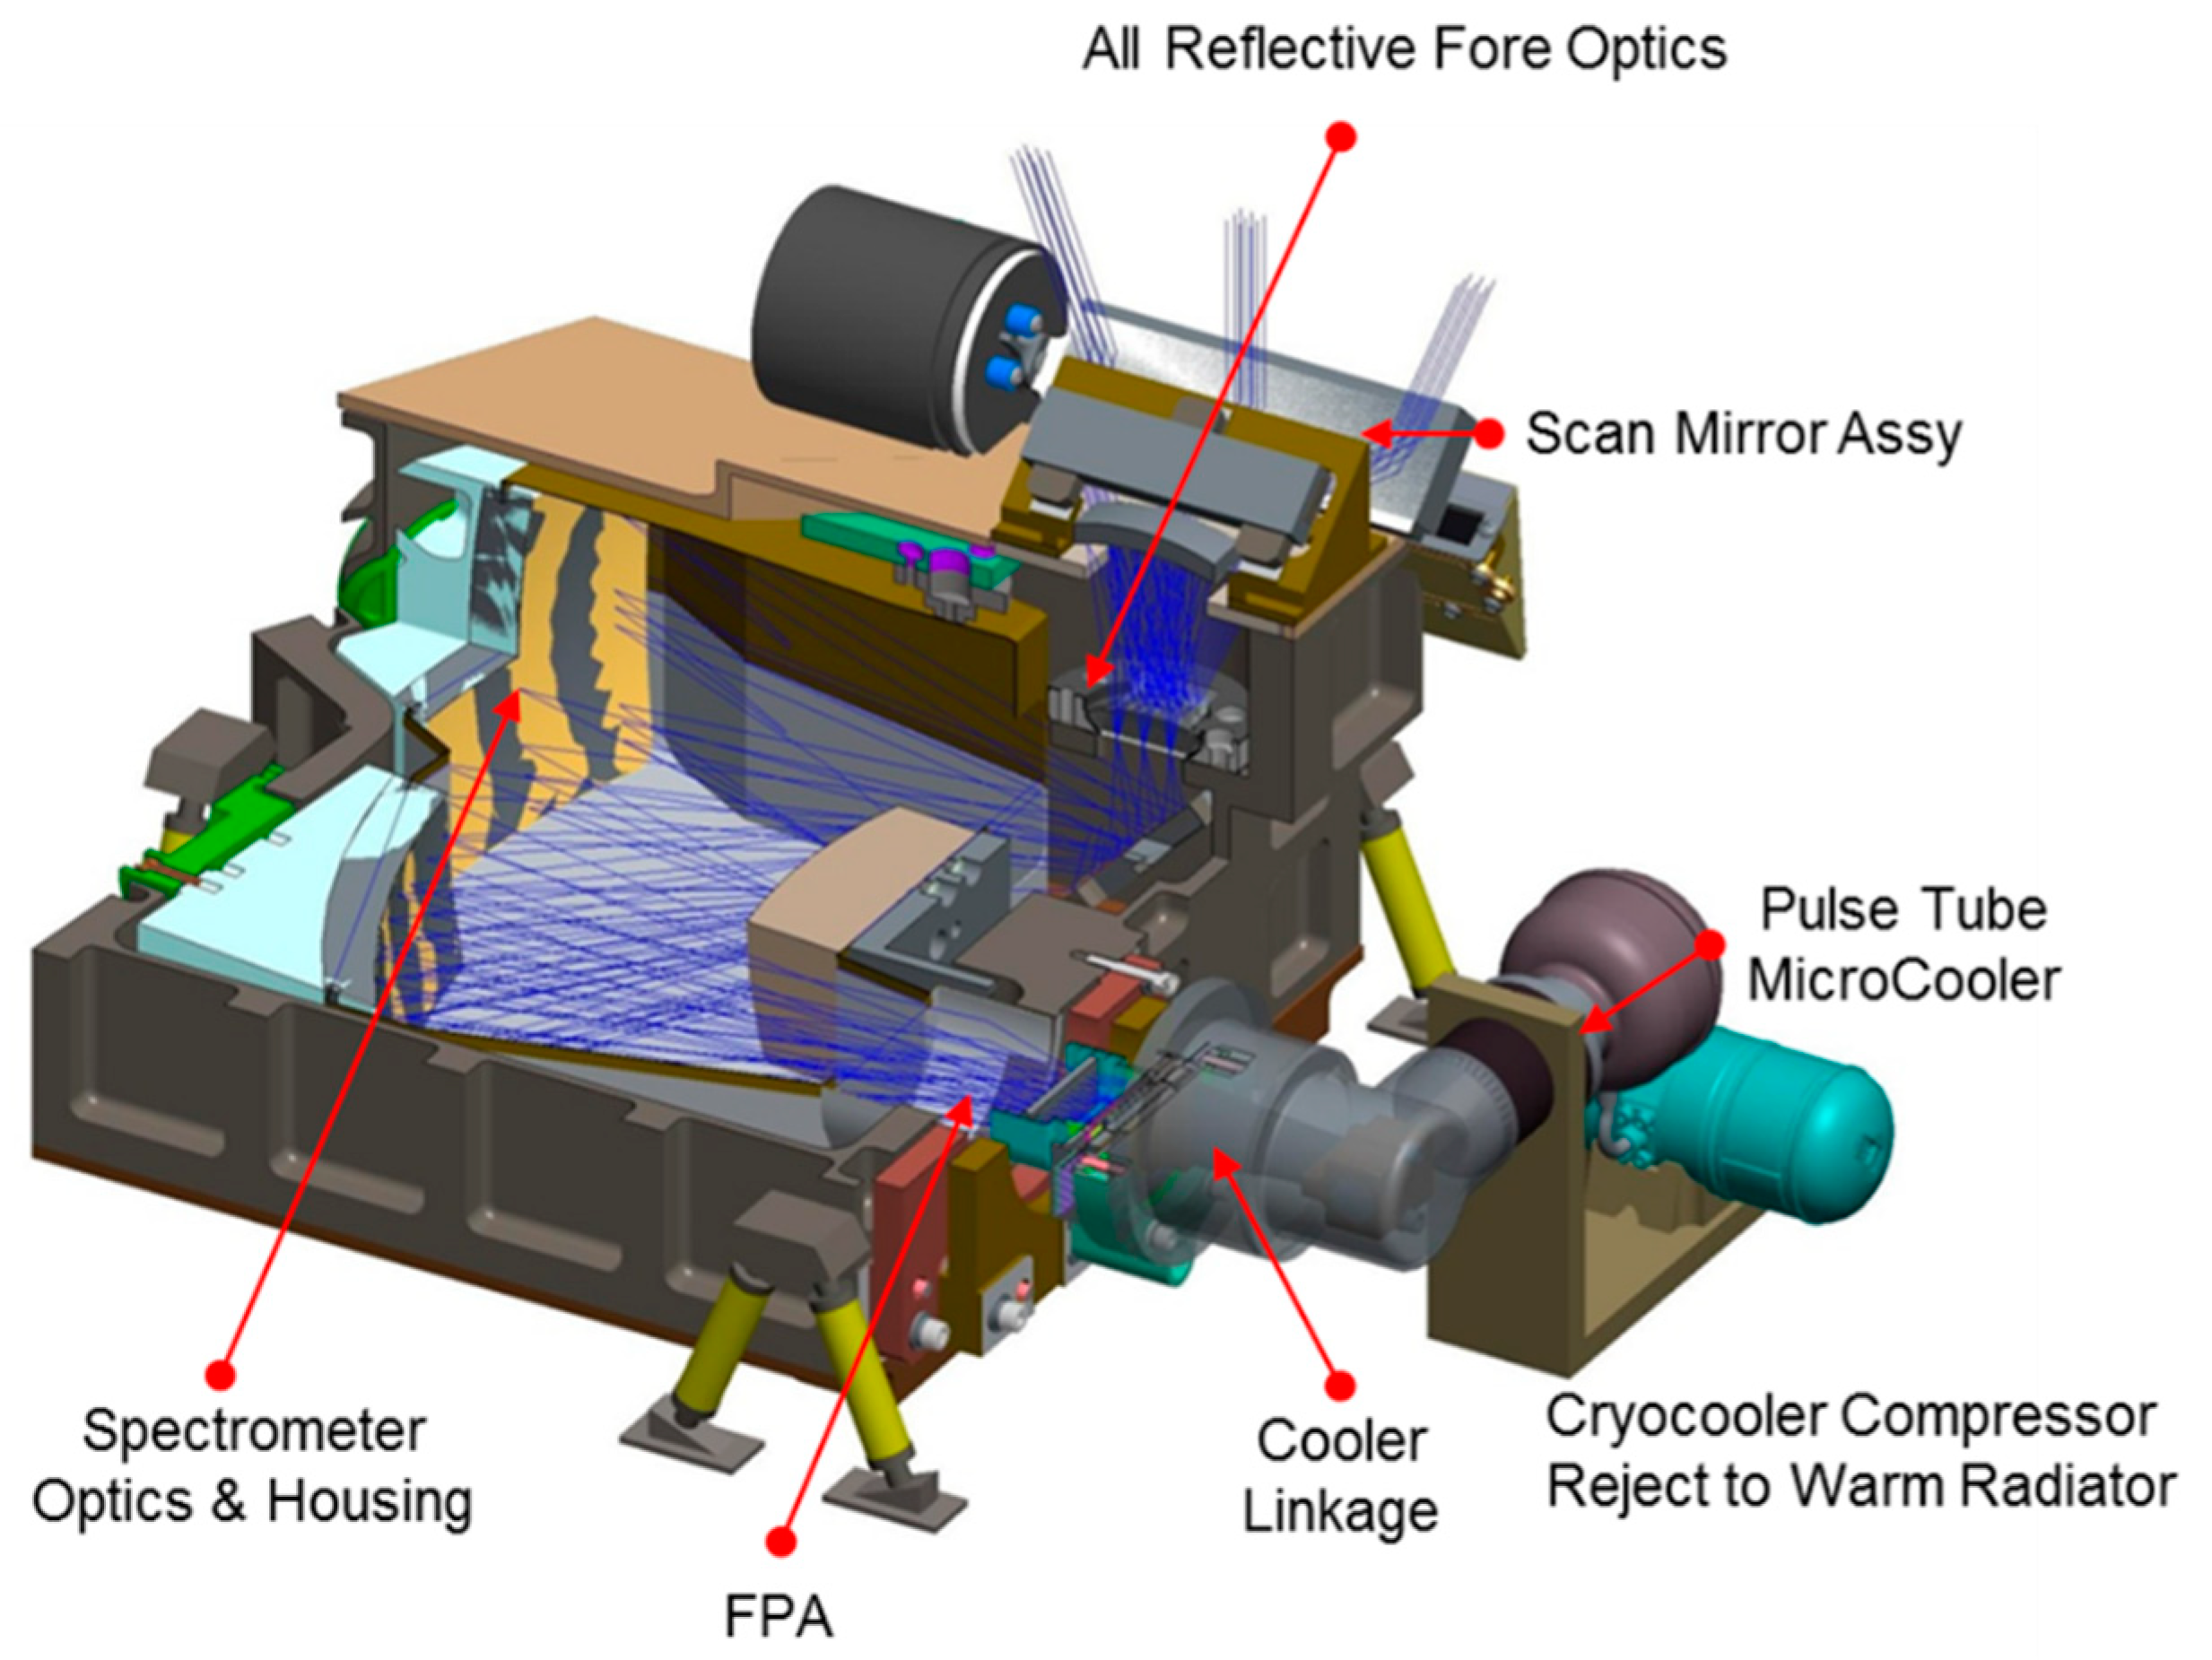
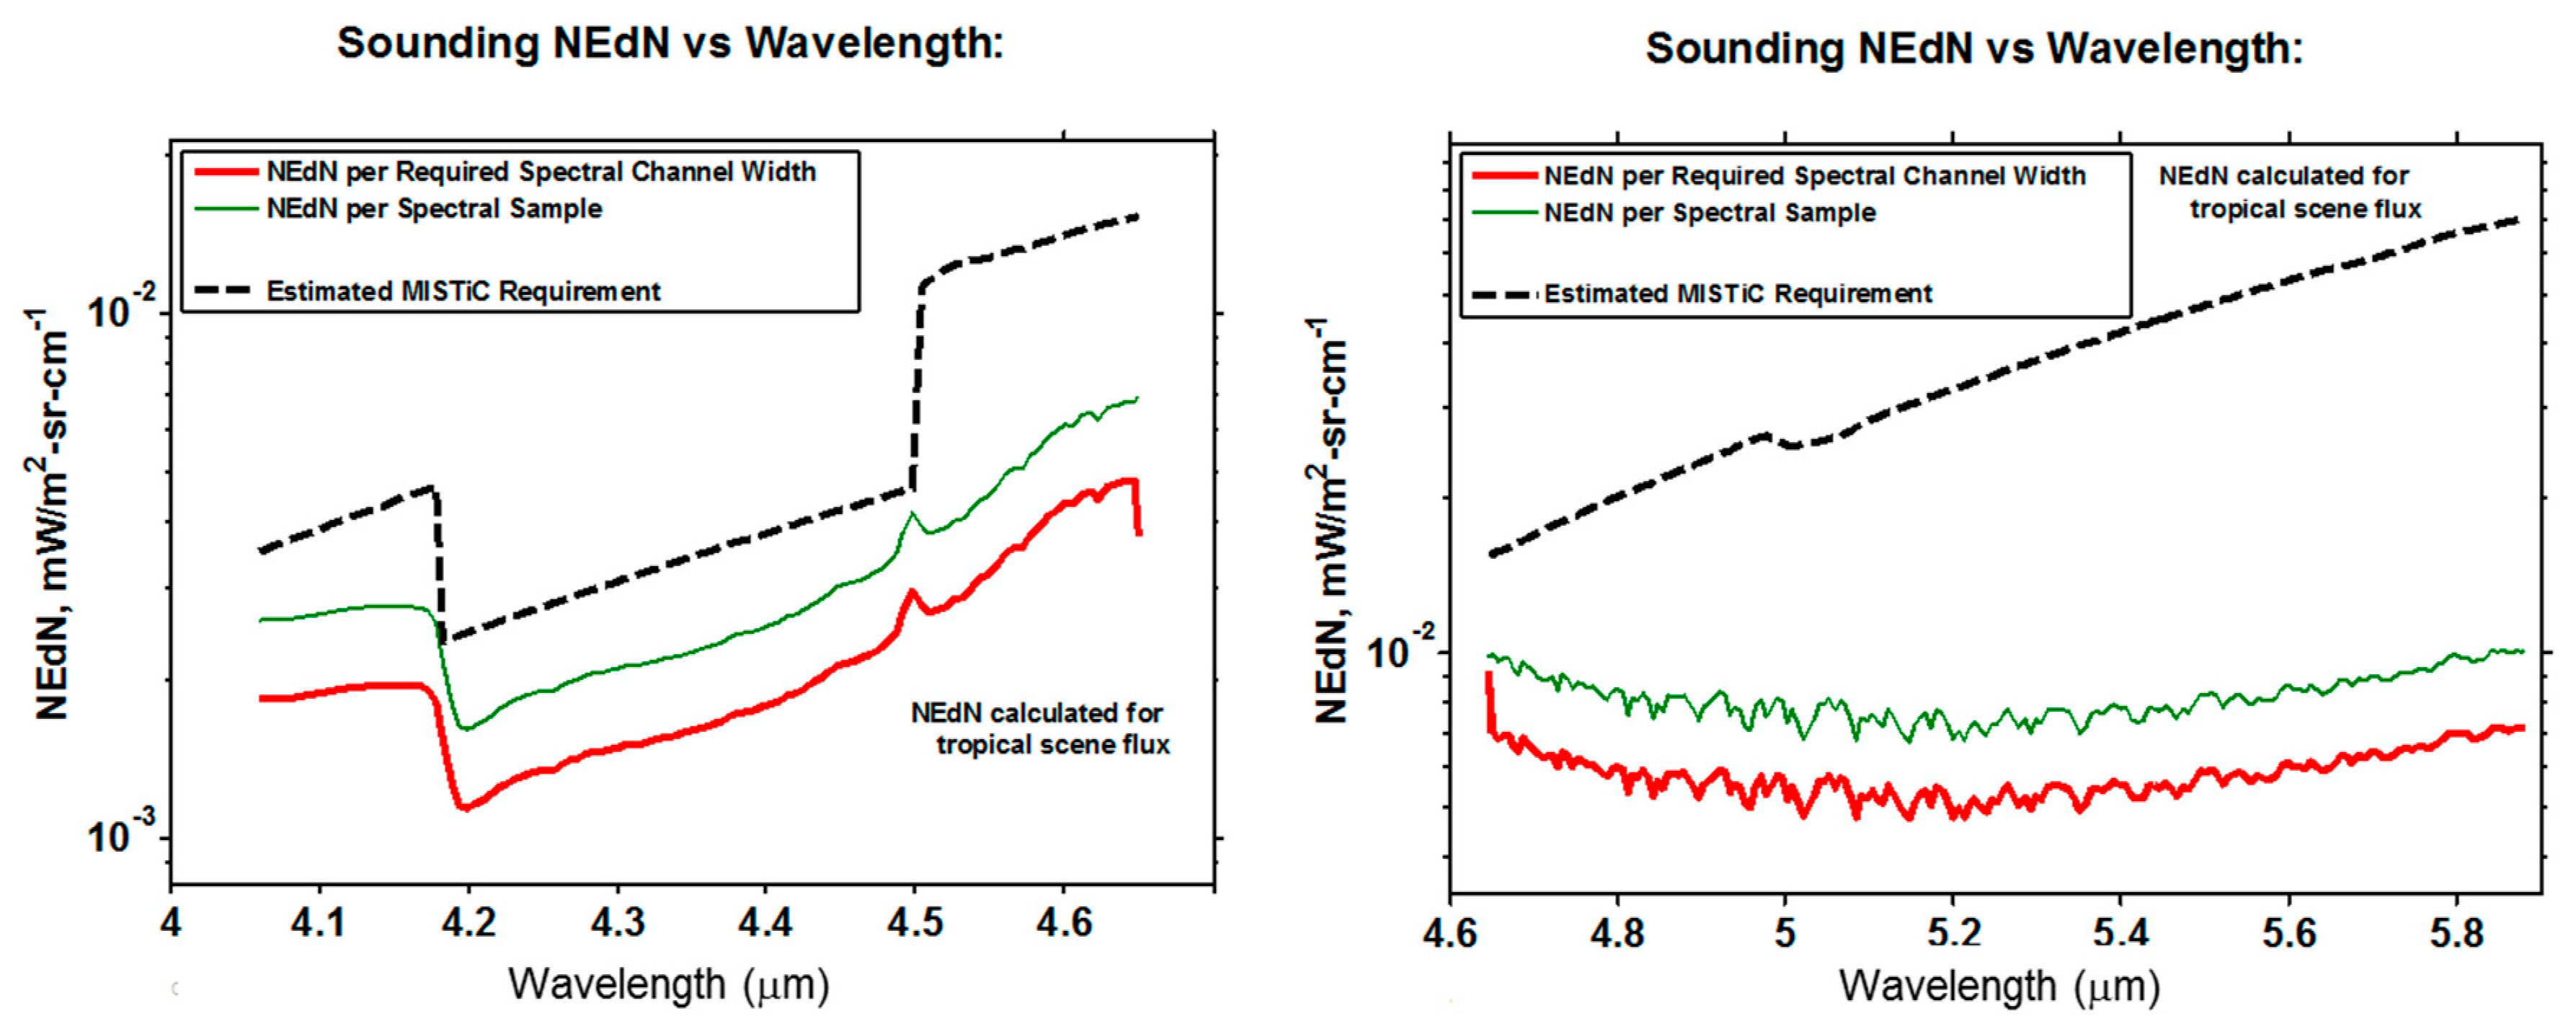
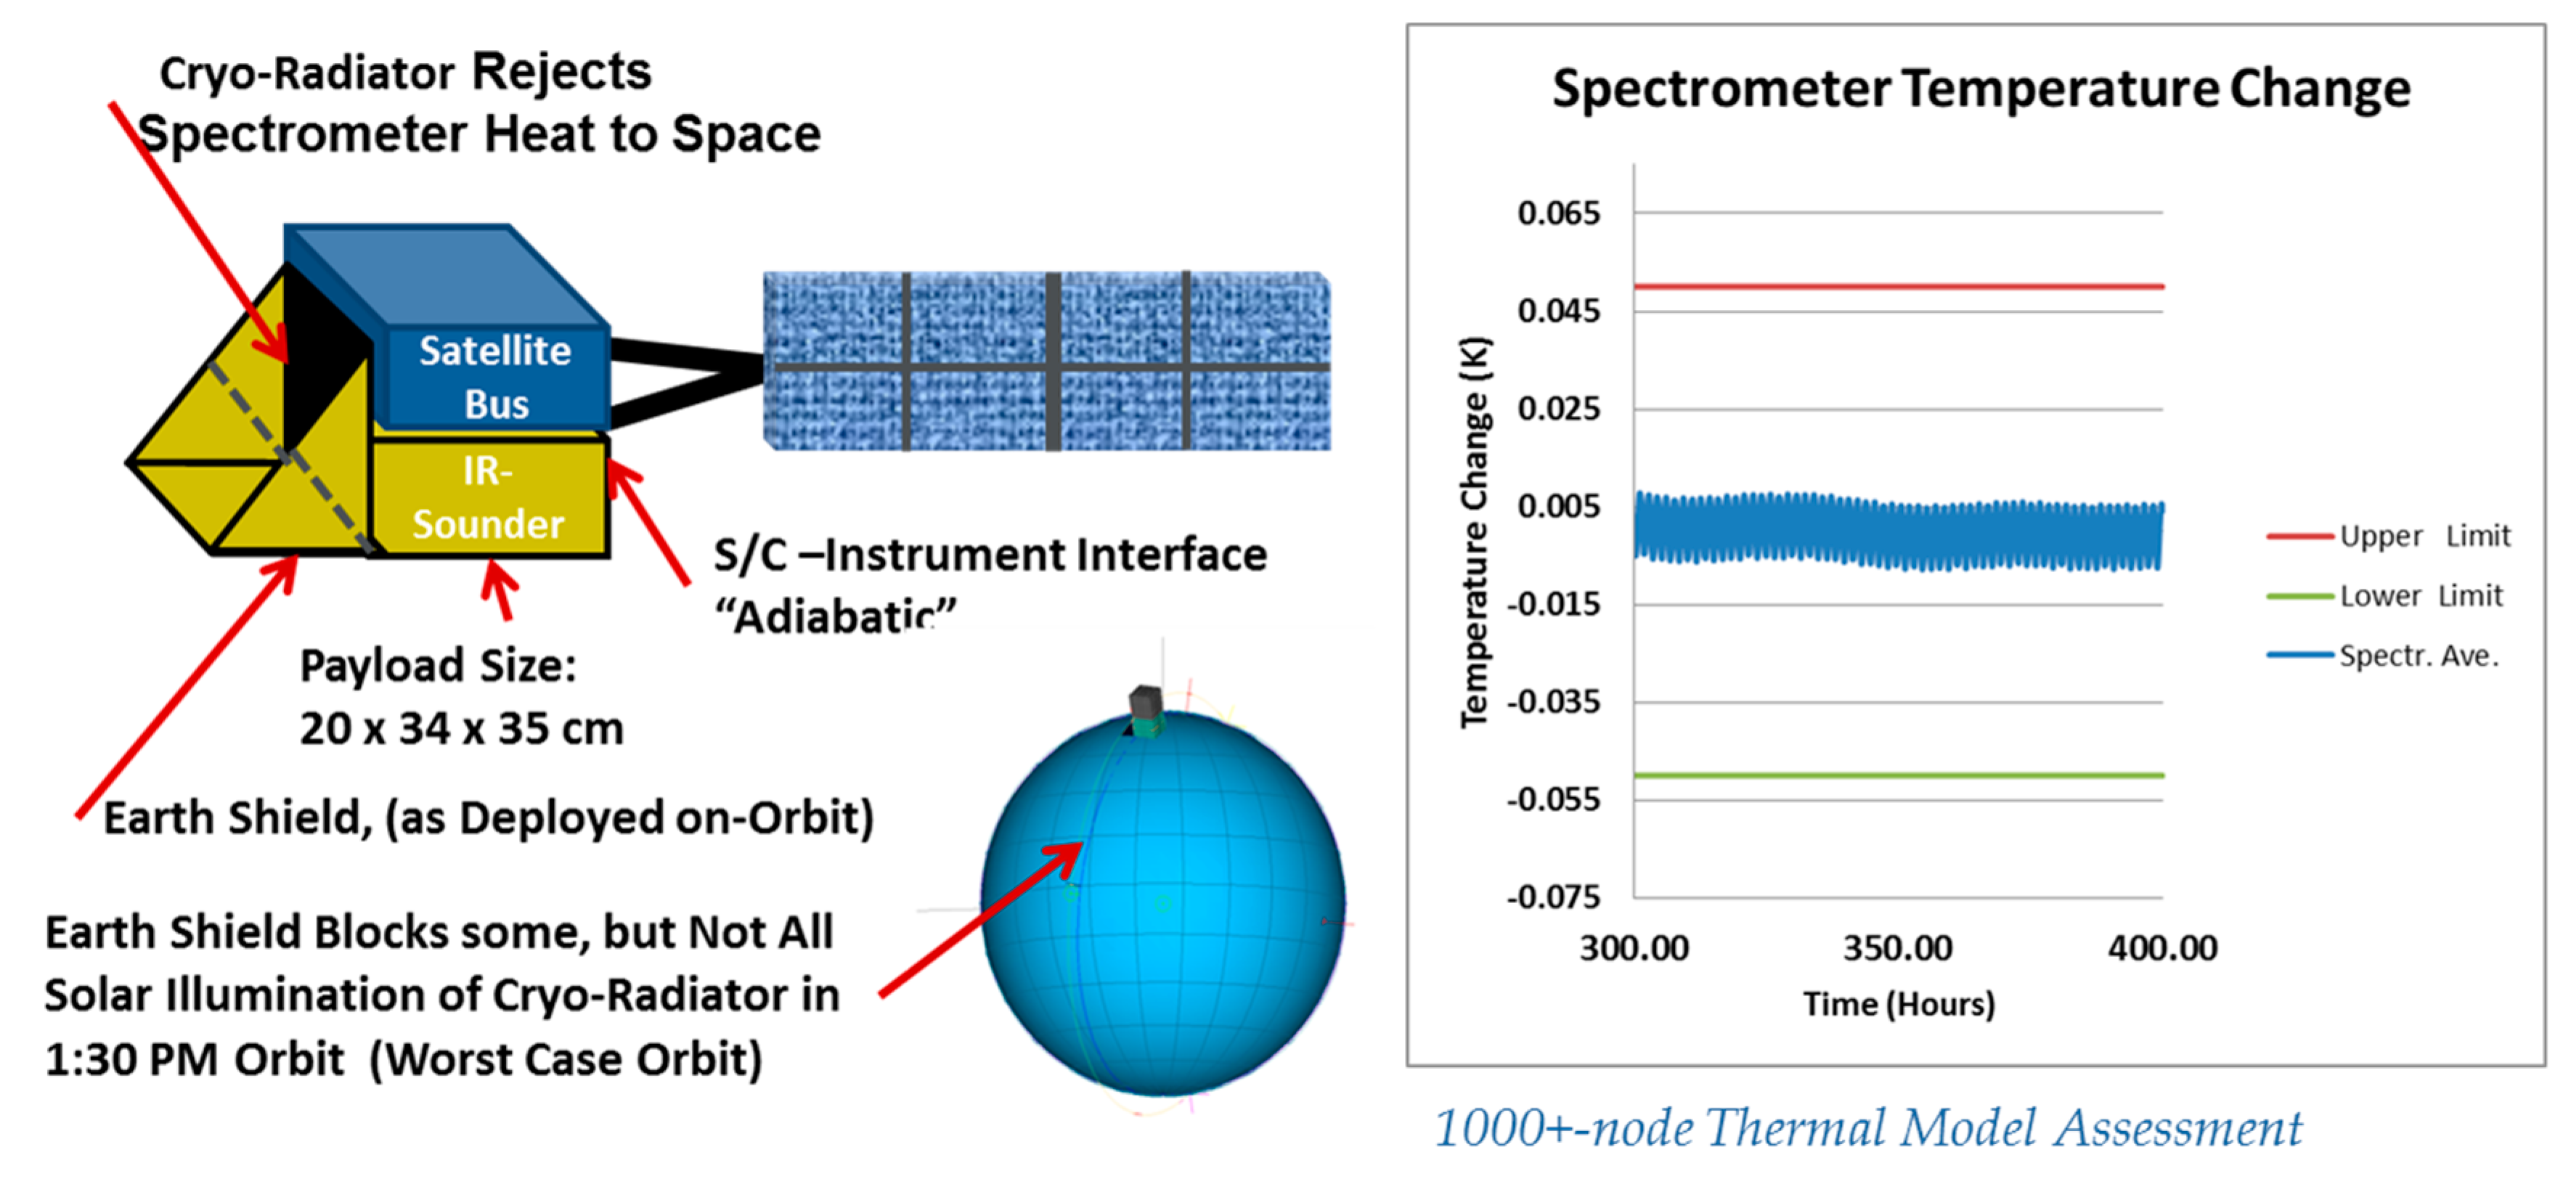
2.2. MISTiC Instrument Design and Sensitivity Performance

The core of the instrument is a field-imaging dispersive infrared spectrometer, shown in cut-away in Figure 7. A small scan mirror directs scene radiation into a small imaging optical assembly that focuses the light on the entrance slit of the spectrometer. The spectrometer optics disperse the light, pass it through optical filters, and present it to a 640×480 format infrared focal plane array. This array is cooled by an active cooler to reduce noise and detector dark currents.
The spectrometer optical assembly’s largest dimension is approximately 20 cm. The overall instrument assembly has a volume of approximately 12 U (1 U = 10 × 10 × 10 cm) and is compatible with hosting by an ESPA-class micro-satellite spacecraft with a combined (payload + spacecraft) size of approximately one cubic foot, or about 33 × 33 × 33 cm (stowed for launch). Total instrument power requirements are approximately 50 W (continuously), and total instrument payload mass is less than 15 kg, consistent with a total spacecraft mass of less than 50 kg.
BAE’s detailed radiometric performance model, adapted from models proven on AIRS and updated for GOES-R HES, has been used to estimate noise-equivalent spectral radiance (NESR) performance of the MISTiC instrument, and compare it to requirements originally developed by NASA and NOAA for GOES-R HES. MISTiC sensitivity estimates show solid performance margin against these NESR requirements. These estimates are shown for each spectral sub-band in Figure 8.
In addition to radiometric sensitivity, a key requirement for an IR sounding instrument is the stability and knowledge of its spectral calibration. AIRS has provided outstanding spectral calibration stability, a primary goal for its thermal design. Microsatellites cannot supply large amounts of electrical power. In order to minimize on-orbit power demand by the MISTiC instrument, passive radiative cooling is used for its IR spectrometer, as was done for AIRS. However, in order to be efficient, the passive cryo-radiator must have a relatively clear view to deep space, and this is best accomplished in a sun-synchronous orbit, with the additional constraint that the host spacecraft not have any structure within the cryo-radiator field of view.
An additional challenge for MISTiC, and precision measurements generally aboard a micro-satellite, is that the thermal environment is quite variable over the orbit, yet the spacecraft and instrument resources available to manage these challenges are severely constrained. This challenge was assessed through thermal modeling under the IIP, and key results are summarized in Figure 9.
For MISTiC, the worst-case thermal condition is encountered by constellation members in the sun-synchronous 1:30 orbit. The spacecraft passes into and out of the earth’s shadow during the orbit. A small spacecraft lacks a large heat capacity, so its temperature-response to changing solar illumination can be quite pronounced. Special thermal design measures for MISTiC, including an adiabatic interface with the spacecraft, are employed to stabilize the spectrometer warm interface temperature, further stabilizing spectral calibration. With these measures in place, detailed thermal modeling shows that the spectrometer temperature variation over the orbit, presented in Figure 9, is very small, and consistent with MISTiC requirements for spectral calibration stability.

2.3. Constellation, and Launch Considerations

The MISTiC instrument payload has been specifically designed to be compatible with the ESPA-class microsatellites that have emerging over the last few years. The target payload mass of <15 kg, and target payload operating-power demand of <50 W are consistent with these spacecraft, even for configurations in which solar panels are not allowed to be in the view of one (the anti-sun) instrument face. Instrument physical dimensions, shown in Figure 3, together with host spacecraft are consistent with the size and configuration requirements of ESPA-class craft. The mass, power, and size accommodation needs have been verified through detailed physical layout, opto-mechanical design, and electronics design studies under the NASA Instrument Incubator Program.
Relative to most micro-satellite payloads, MISTiC Winds would provide a very rich set of environmental observations, but these bring a higher data rate requirement as well. In continuous operation, the instrument generates about 5 Mbits/sec, following lossless onboard data compression. One option for relaying the data to the ground would employ X-band RF transmission to two ground stations, one in each polar region, with a maximum data latency of ~50 min. A lower-latency approach would employ an S-band up-link to a GEO communications satellite such as NASA TDRS, followed by downlink. In light of the substantial commercial investment in small satellite LEO networks being developed by several companies, communication options for MISTiC Winds are expected to increase substantially in the next few years.

3. Results

The key technical risks related to providing the MISTiC Winds observation capability relate to providing accurate, precise hyper-spectral radiometry within the limited resources of a micro-satellite, with instrumentation based on technology suitable for the LEO space environment. Several steps have been taken under the effort reported here to reduce the technology risks associated with the MISTiC instrument payload. These include the fabrication of a flight-like or brass-board infrared imaging spectrometer optical assembly-including the reduction to practice of the innovative elements in its optical design, key performance tests of the spectrometer, and the high-energy proton total-dose testing of the selected infrared focal plane array detector. Key results from this instrument risk reduction work, as well as some instrument hardware adaptations needed for the airborne demonstration, are reported in Appendix A. In addition to the instrument hardware risks, the hyperspectral method for vertically resolved wind observation itself has had only limited demonstration prior to this work. To further reduce risks associated with the MISTiC Winds observation method, airborne observations using an instrument incorporating this spectrometer, and flown aboard a NASA ER2 were performed, with comparisons to independent observations of the wind, temperature, and moisture fields. Example results for these tests are provided below.

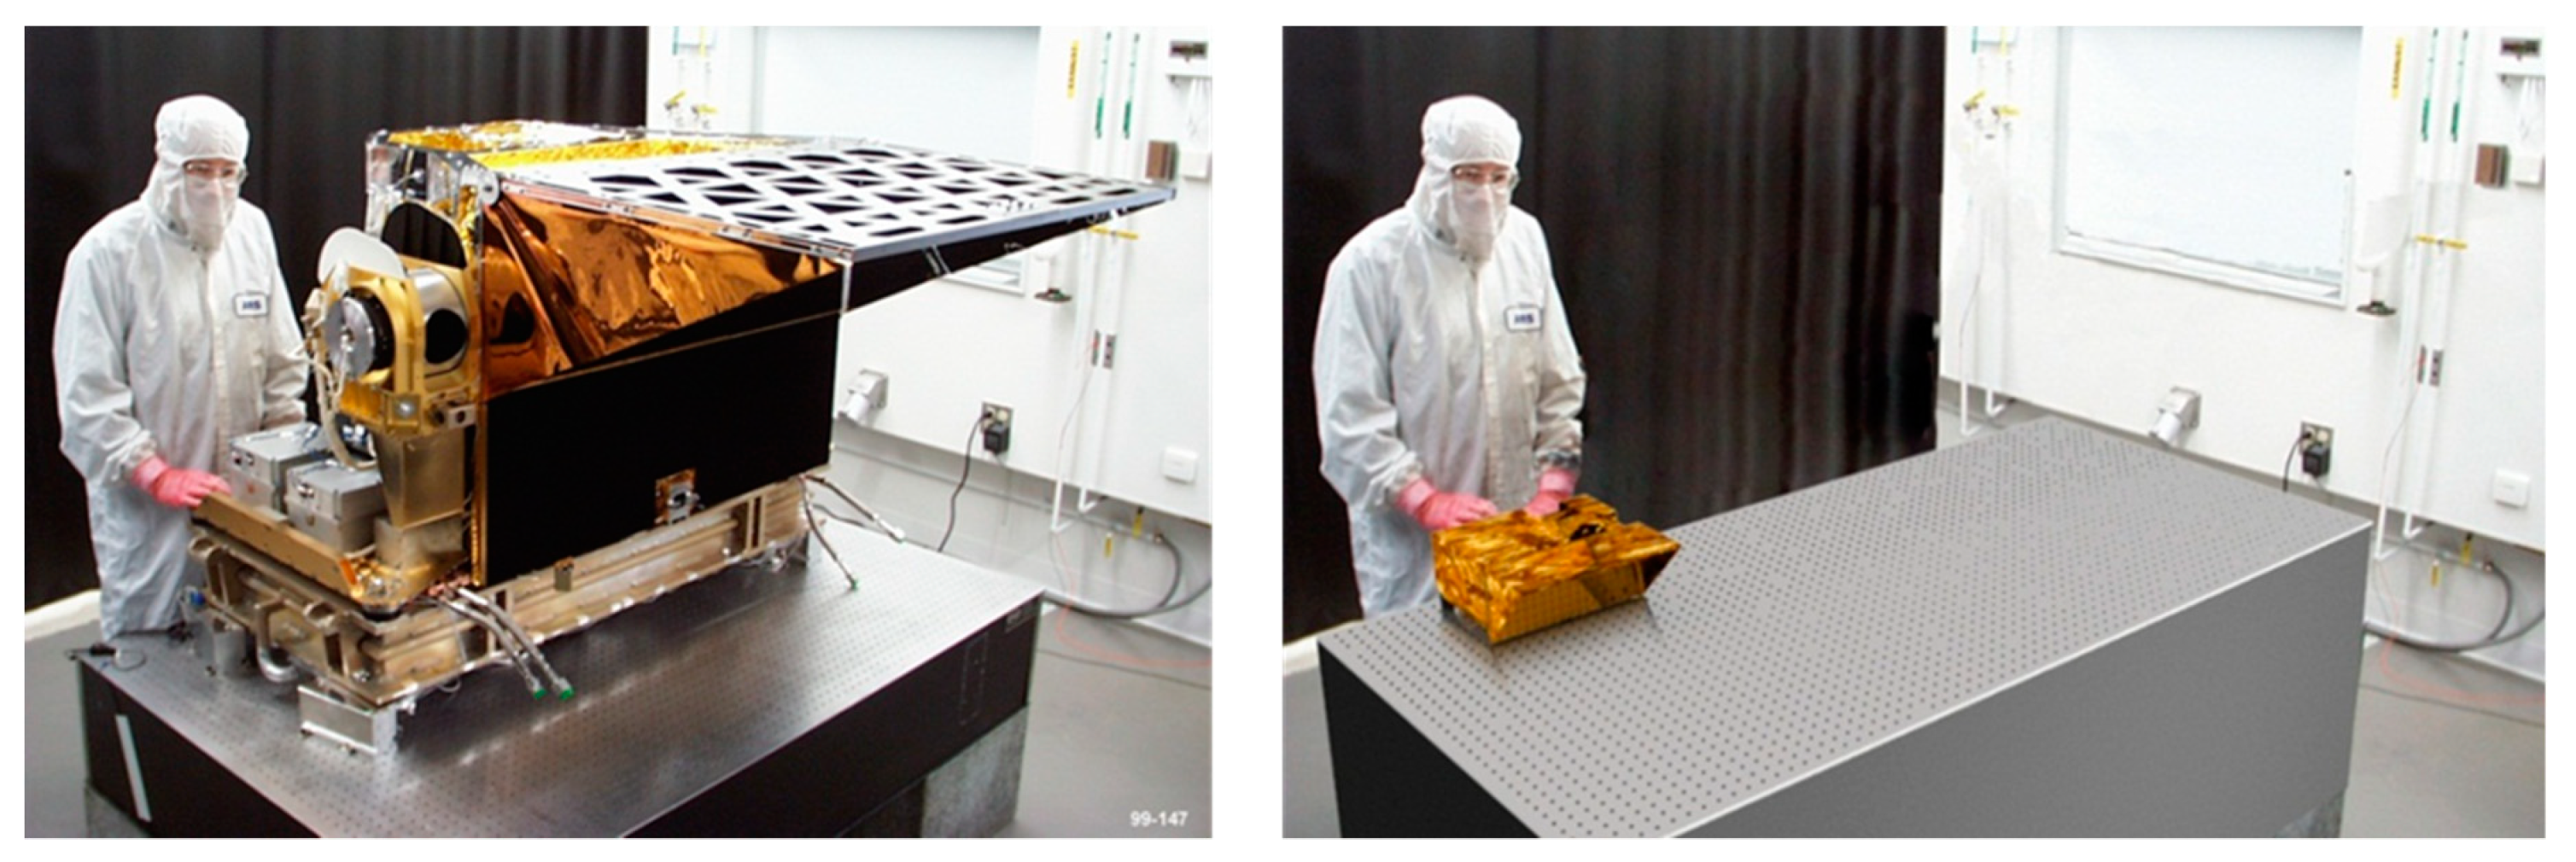
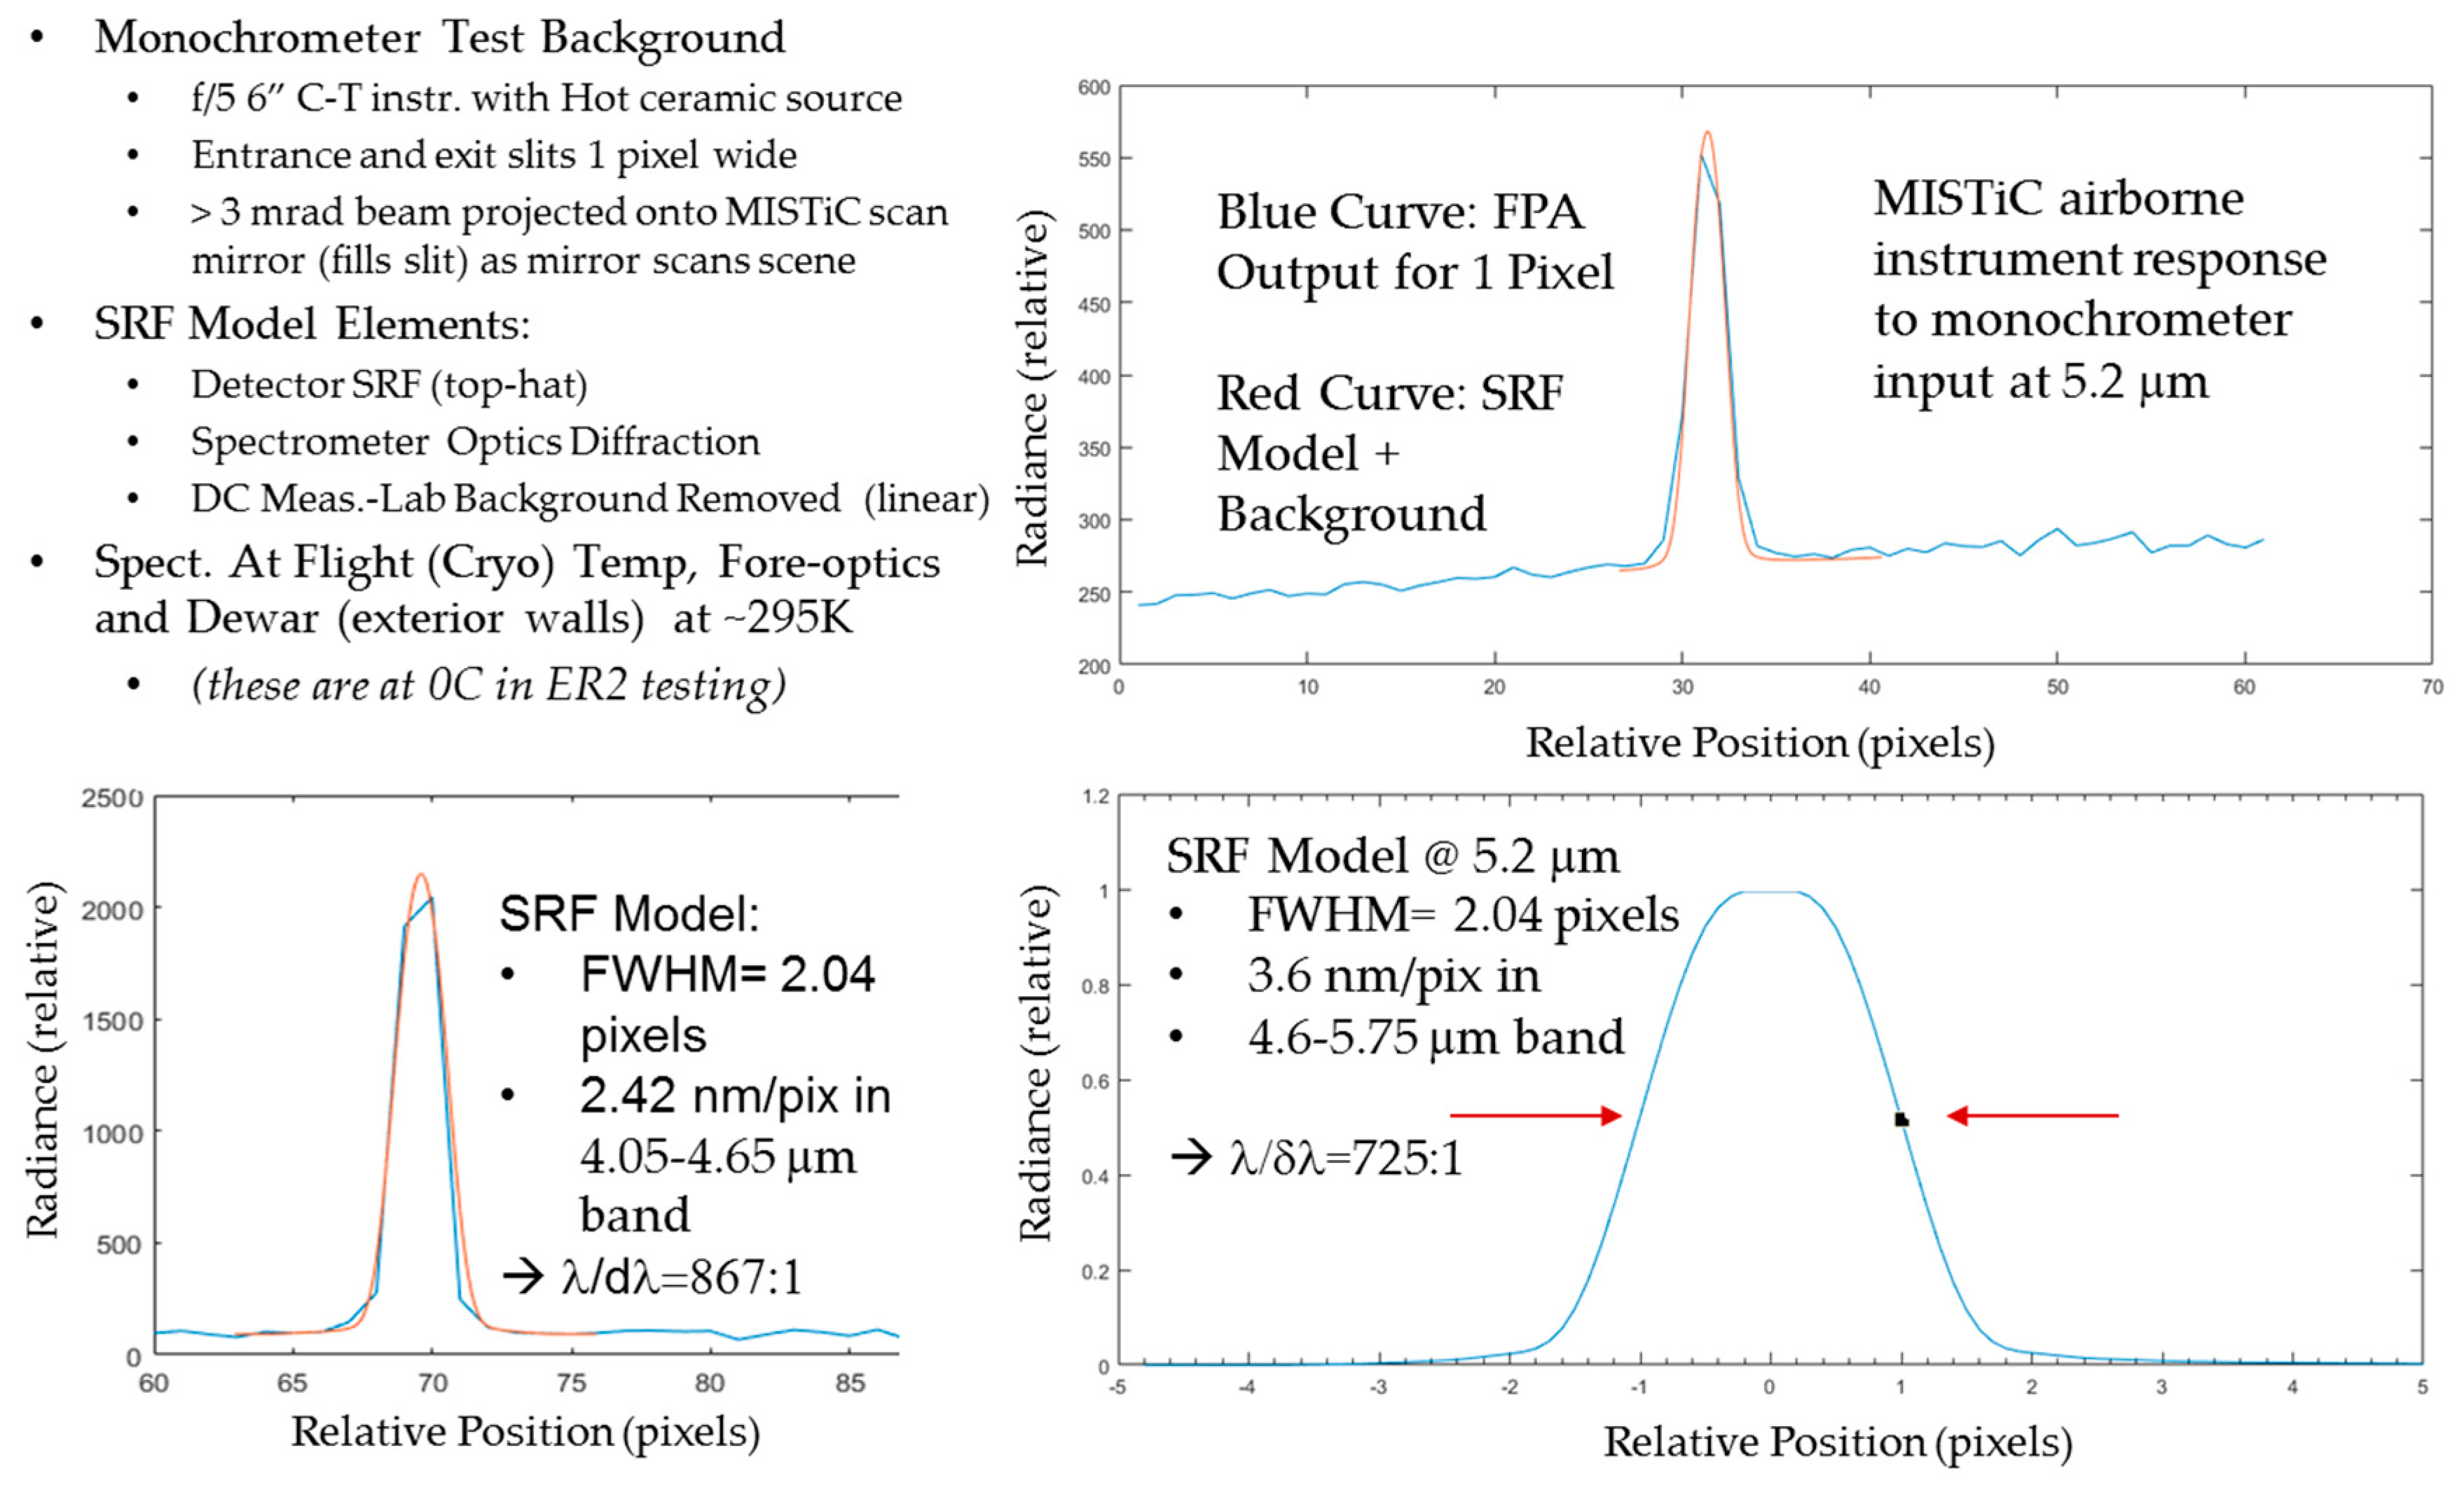
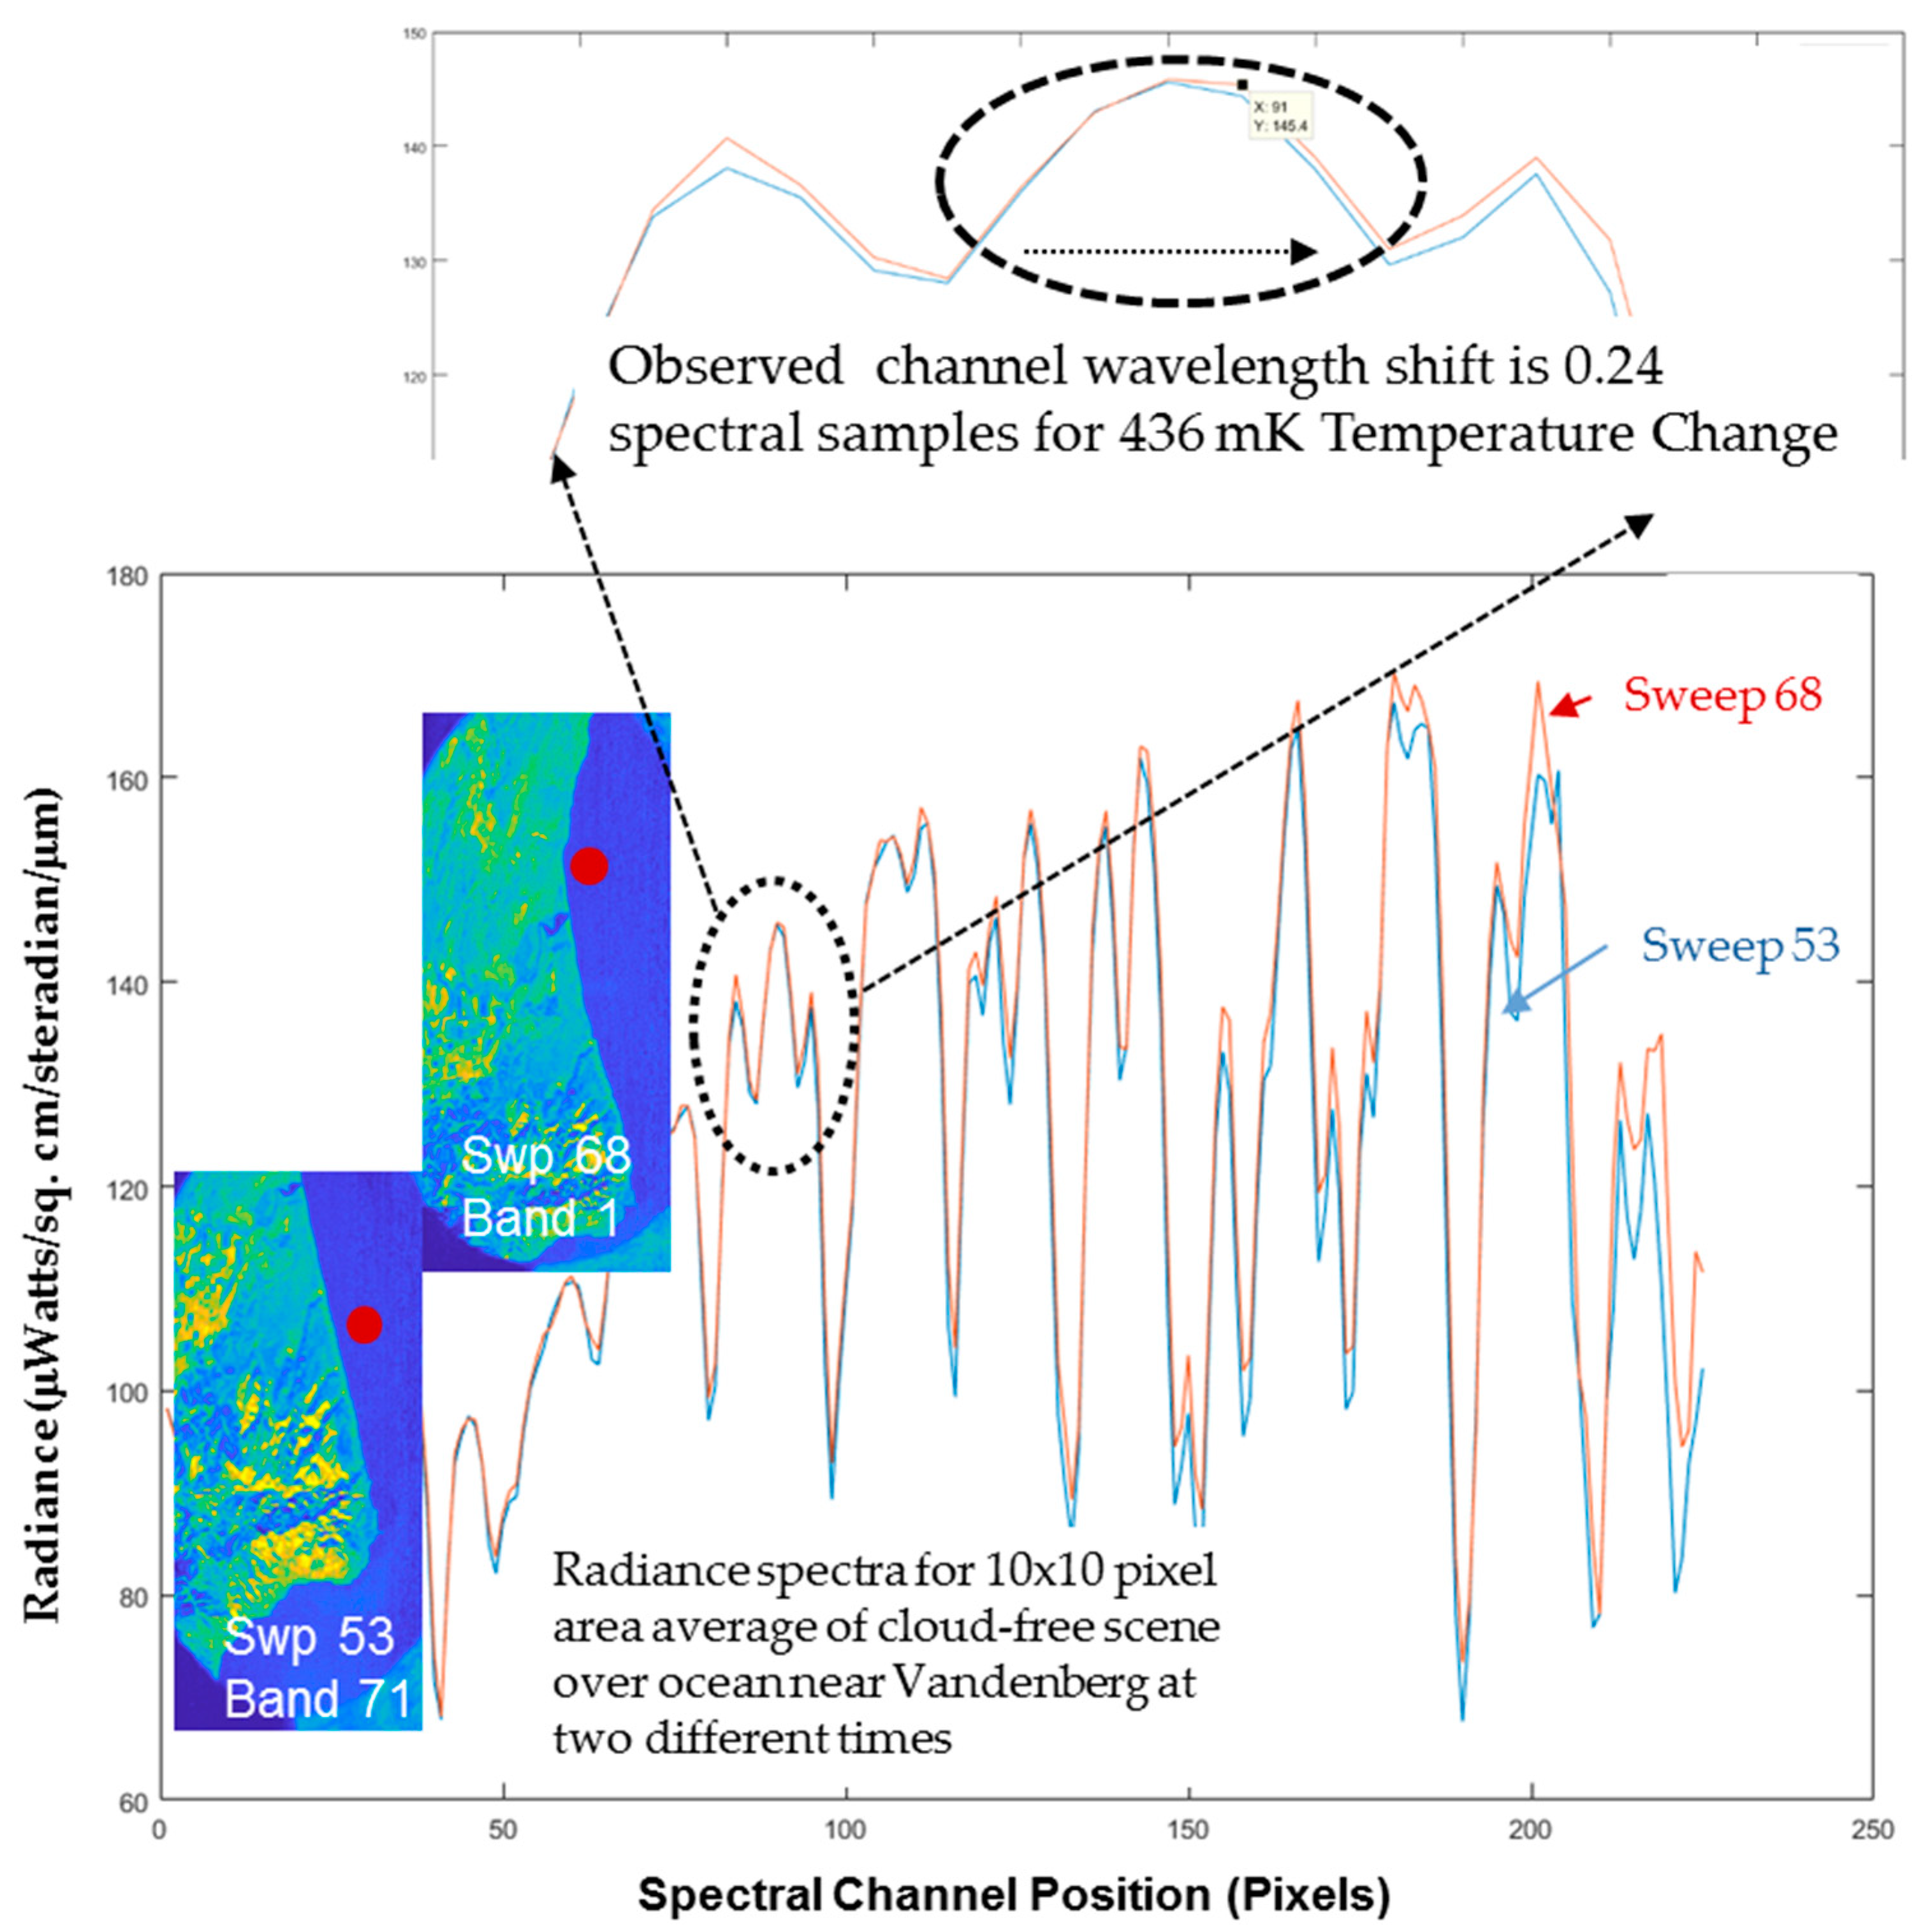
MISTiC Airborne Instrument Observations from the NASA ER2

Airborne versions hyperspectral IR sounding instruments have been used many times as part of validation campaigns for AIRS [26] and for other IR sounders. In anticipation of a NASA GIFTS Program, the NPOESS atmospheric sounder testbed instrument (NAST) was used to make hyperspectral observations from an ER2 during repeat-pass observations of a moisture field from which motion vector wind observations were derived [20], with a repeat-period of approximately 45 min. However, the specific use of repeat-pass flight trajectories with an air platform to simulate space-borne acquisition of a sequence of images from which to derive AMVs with image repeat periods of 10–20 min appropriate for changing cloud formations do not appear to have been reported previously. A key benefit of repeat-pass imagery on this time scale is that the primary changes between images are due to the translational motion of both clouds and moisture features as they move with the wind (advection), rather than due to changes in the spatial distribution (shape) of the features themselves. A second practical benefit is that the probability of observing an atmospheric feature on multiple passes from the relatively low vantage point of an aircraft platform is much higher if the time-separations used are not too large. Some atmospheric observations using this airborne instrument on the ER2 are described below. The path shown for this flight is shown in Figure 10. More details on the airborne observation demonstration flight on 4 December, including methods, weather conditions, and a comparison with an IASI satellite observation are provided in Appendix B.
An example of the types of airborne MISTiC observations made using the repeat-pass hyperspectral imaging/sounding method for cloud AMV identification, together with approximately co-located observations from a radiosonde launched from the Edwards AFB during the ER2 overflight on 4 December are shown in Figure 11, Figure 12, Figure 13, Figure 14 and Figure 15. In Figure 11, two MISTiC “window-band” radiance images taken at the latitude and longitude positions listed in the text in Figure 11 at times separated by approximately 1000 s. The images shown in Figure 11 have brightness temperature contrast selected to highlight the separation of the thermal emission of clouds, which is much lower than that from that of the surface. Common points in the cloud field in the two images were identified using a manual process for this airborne test. An involved but straight forward geometric construction is used to determine the absolute position of the common point of the selected cloud in each image, using the platform (3D) position, velocity, and heading, relative (angular) position of the cloud within each image, and airborne instrument design parameters (pixel size, focal length). The specific position and angle data for each image are listed in the image text at left. The AMV angle and speed were determined from the difference in absolution cloud positions, and the time at which the cloud was seen in each image. Additional information on this airborne observation approach is provided in Appendix B. One practical challenge in the airborne repeat-pass imaging is that at the timing of collection of each image was not synchronized with the platform position as it moved around the orbit several times, as shown in Figure 10. In this case, even a stationary feature appears in different relative positions in the two images. Another practical challenge is that the wind direction and speed were far from ideal for observing a feature twice. The cloud features were at the northern-most edge in the first image, and the southern-most edge of the second.
A cloud (circled in red the figure) was one of several common points identified and located in both of the two images (in this case, given the wind direction and speed, most of the clouds in the field are seen in only one of the two images.) As shown in Figure 10, the ER2 ground track is essentially the same for the two images, but the nadir points of the images are offset in the along-track direction.
A cloud motion wind vector is determined from the angular position of the cloud in each of the images along with the instrument’s GPS-position and IMU attitude data collected by the instrument during each overpass, and a rough height estimate. The upper two panels in Figure 12 show the wind speed and direction from the lower-altitude portion of the radiosonde profile collected during the MISTiC overpass period. The cloud-feature-based wind speed and direction obtained from the data in Figure 11 are indicated in red in Figure 12. These wind-speed and wind angle estimates agree to within 2.5 m/s and five degrees azimuth, if the cloud lies just below the pronounced temperature inversion near 2500 m (AGL) apparent in the lower-left panel of Figure 12. This height for the cloud is physically sensible, and also consistent with the cloud top radiance range (corrected for cloud reflectance at that wavelength) observed by MISTiC in this spectral window, as shown in Figure 13 and indicated by the red dashed arrows in temperature profile in Figure 12.
Figure 13 also shows spectra for areas both in and near this cloud. The image in this figure is a small portion of a single spectral channel image for a spectral channel near 5 μm, lying near one local minimum in spectral radiance, indicating somewhat stronger water vapor absorption and re-emission at a lower temperature for some areas surrounding the cloud. On physical grounds, a water vapor field surrounding this low-level cloud is expected. There is also evidence of a lower-level water vapor field in the radiosonde data, shown in the lower right quadrant of Figure 12. The vertical position of this water vapor field is consistent with being trapped by the same temperature inversion that trapped the clouds observed in Figure 12.
Images of the same scene, but for spectral channels near 4.894, 4.952, 5.017, and 5.079 μm, are shown in Figure 14. The infrared brightness for these channels is progressively lower, indicating that these channels are weighted higher in the atmosphere. The images show a broad region of higher water vapor concentration extending over much of the image, in addition to the moisture field around the lower-level clouds. Figure 15 shows infrared radiance spectra in the MISTiC water vapor band for regions both inside and outside of this moisture field, showing lower infrared radiances, especially for the radiance minima at longer wavelengths-features which indicate that this moisture field is higher in the atmosphere. Figure 15 shows the water vapor from the same Edwards 4 December sounding whose data were shown in Figure 12, but with an expanded altitude scale, together with the water vapor retrieval from the nearest cloud-free AIRS sounding less than one hour later.
These both show the presence of a higher-level water vapor field, near 560 hPa over the Edwards AFB area, consistent with what was observed in the MISTiC images shown in Figure 15.
As noted previously, due to the cost constraints under the IIP, the airborne version of the MISTiC instrument employed a previously produced version of the IRFPA, which does not have the full spectra range planned for the MISTiC spectrometer and its custom-grown HgCdTe composition for the detector array. Specifically, it lacks the full spectral channel set needed to fully retrieve the water vapor features at 500 hPa and at higher altitudes. However, as shown in Figure 4, the full MISTiC spectral channel set, with the planned lower wavenumber limit of 1750 cm−1 includes the channels needed to retrieve both the temperature and water vapor through the troposphere, with layer accuracies comparable to AIRS, and would be expected to support water vapor retrievals similar to those provided from AIRS in Figure 16.

4. Discussion

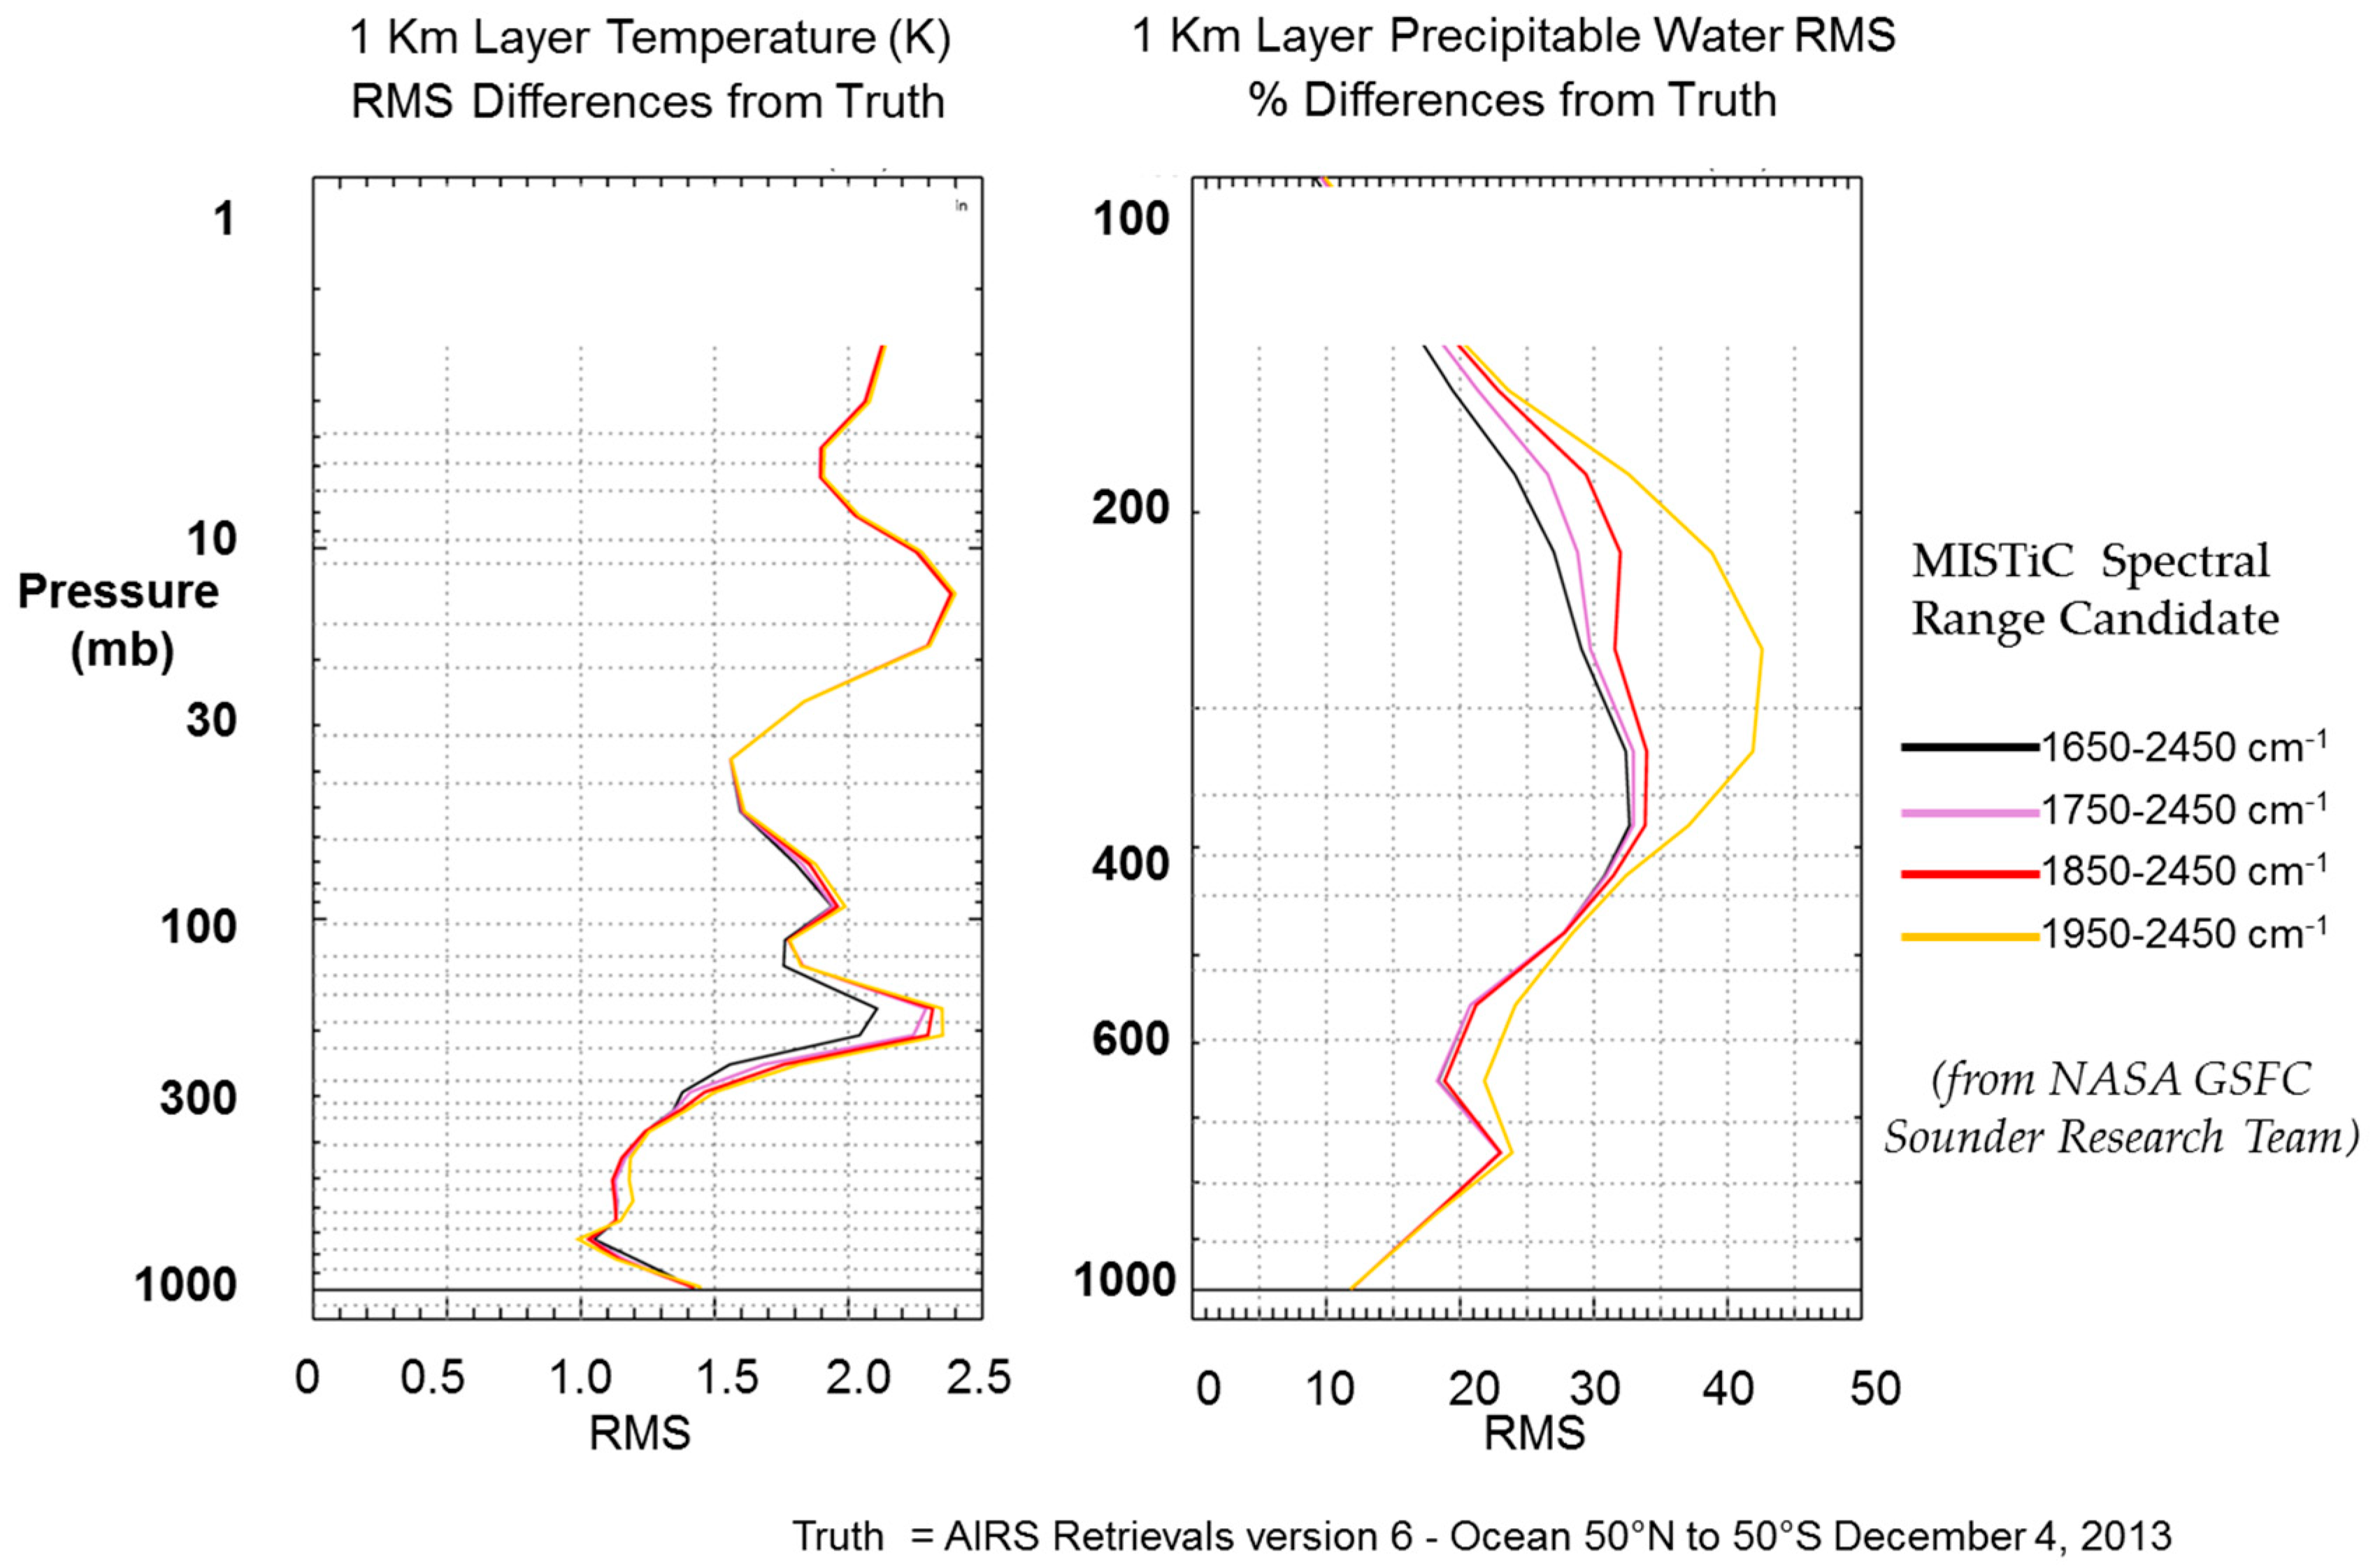
4.1. Discussion of MISTiC Winds Requirements and Their Relation to Other Instrument Requirements

MISTiC Winds provides an opportunity to develop the requirements and design for a remote sensing capability that are fundamentally driven by the specific needs of the vertically resolved wind observation. This situation differs from the historical case with GOES or especially for AIRS, where the instrument requirements did not explicitly address the needs of wind observation, and where the capabilities of the resulting instrument were adapted to wind observations after the fact. Two questions that arise in the present case relate to requirements sufficiency and requirements feasibility. The driving requirements of wind speed accuracy are considered from both the sufficiency and feasibility perspectives.
The LAWS Program previously identified wind speed uncertainty requirements for a future Doppler Wind LIDAR as 2 m/s for the lower troposphere (0–3 km) and 3 m/s for the upper troposphere (3–15 km) [4]. These are also the values more recently identified by the World Meteorological Organization [27] (requirement IDs 383 and 385 in the OSCAR database) as breakthrough values for the horizontal wind uncertainties for the lower and upper troposphere, respectively, based on weather forecast impact for high-resolution regional and global NWP. More recently, the NASA Weather Focus Area Workshop in 2015 [28] identified a wind speed observation requirement of 2 m/s rms uncertainty for the remote sensing of vertically resolved wind field during its deliberations, as sufficient for advancements in weather remote sensing research and weather forecast improvement (although specific numerical requirements of this type were not included in the final report of this workshop). The wind speed uncertainty requirement adopted for MISTiC Winds, shown in Table 2, is informed by these requirements.
The MISTiC OSSE [23] has shown that vertically resolved observations provide significant weather forecast impact. OSSEs can provide constraints on the accuracy that must be provided in order for these new observations to have the desired impact on forecast accuracy. Within this MISTiC OSSE, the total wind speed uncertainty employed was approximately 5 m/s rms. However, this included both the observation errors and errors associated with the 3DVAR data assimilation, so the allowed contribution from observation errors would again be in the 2–3 m/s range, consistent with Table 2. An updated MISTiC OSSE may provide more specific constraints on observation error requirements. Finally, a <2 m/s wind speed observation uncertainty was reported to be an important aspect of more recent DWL OSSEs [19,29].
Requirements feasibility can be assessed by considering the implications of the requirements in light of physical or cost constraints. Under the MISTiC Winds IIP, an initial partitioning of the 2 m/s wind speed error requirement was performed, and this partitioning includes flow-down requirements for the error due to tracked feature height assignment (<1.5 m/s) and errors in horizontal feature tracking (<1 m/s) as leading terms in the error budget. These errors are resumed to be un-correlated.
The AMV height assignment error contribution to wind speed error is only significant in the presence of significant wind-shear. To support an initial assessment, a wind speed difference of 20 m/s, between the 850 and 200 hPa pressure levels is assumed as a reference case, with the further assumption of linear wind speed change with pressure height. Under these assumptions, a 30 hPa feature height assignment error (see Table 2) would yield a 1.5 m/s wind speed error. Infrared spectral sounding vertical resolution in the troposphere is approximately 100 hPa. The AIRS moisture retrieval shown in Figure 16 provides a good illustration of this, in comparison with the moisture vertical profile obtained from the near-by radiosonde shown in Figure 15. The radiosonde shows a sharply defined higher-concentration water vapor layer (in dew-point temperature) over a range of approximately 80 hPa in pressure height, centered near 560 hPa. The AIRS retrieved water vapor profile is somewhat broadened, but it is still sufficiently sharp so that the position of the peak water vapor concentration can reasonably be located to a precision of 30 hPa. The pressure height of the peak in water vapor concentration obtained in the AIRS retrieval is in good agreement with the radiosonde. The vertical resolution of water vapor retrievals obtainable from MISTiC is expected to be similar to those obtained by AIRS, as shown in by trade-study results in Figure 5. Full-scale development of this observing system would include a deeper exploration of this capability, for a variety of thermodynamic and wind speed profiles so that these requirements and feasibility assessments can be refined.
Although the above example discussed the feasibility of height assignment improvements for water vapor tracers, hyperspectral observation should improve cloud AMV height assignment also. It enables this improvement in two ways: By providing access to the observed local temperature vertical profile co-located with the AMV feature, and by providing access to highly transparent narrow spectral channels for the brightness temperature measurements that are more accurate than those using the broader multi-spectral imagers.
To ensure that feature tracking error portion of the total wind-speed error remains small (within a 1 m/s allocation), the current levels of image-sequence quality provided by GOES 16 ABI and its sister instruments on Himawari 8 and 9 are also needed for MISTiC. In this feature-tracking application, image quality is driven most strongly by two attributes-ground sampling distance (GSD) and the spatial oversampling ratio. The GOES ABI instruments provide ~2 km GSD at nadir for thermal IR bands, and approximately 3.5 km at edge of scan. MISTiC is designed to have a 1.4 km GSD cross-track at nadir, and also approximately 3.5 km at edge of its scan. GOES ABI requirements (as have those for all prior GOES instruments) also called for sufficient spatial over-sampling (i.e., the ratio of the spatial point spread function FWHM to the sampling distance). For feature-tracking through a sequence of images ( as is done for AMVs or for image loops from GOES), it is important that the tracked features do not change in apparent size, shape, or centroid, as the feature it moves from image to image, as such changes will cause a wind velocity observation errors. The MISTiC spatial over-sampling ratio is approximately 1.5:1 along-track-similar to GOES 16 ABI, and more than 2:1 in the along-scan direction. Feature position change-tracking to half the GSD, or finer, is enabled under such sampling conditions, and feature brightness fluctuations are minimized. In addition, MISTiC Winds observes feature position changes with two separate instruments on different platforms in order to measure feature velocity. However, the attitude knowledge provided by contemporary micro-satellite-compatible star trackers and ephemeris knowledge are sufficiently accurate, therefore, these potential error terms in AMV tracer velocity are quite small. These considerations, together with the radiometric sensitivity requirements identified in Table 1 and shown in Figure 8 should be sufficient to support the <1 m/s tracking error capability for both cloud field and water vapor tracer features, for the planned observation separation period of 10 min.
Optical Flow methods are under consideration by several groups, as a tracking method potentially capable of improvements in the density and accuracy of passive wind observations. However, large-displacement optical flow estimation algorithms assume a relatively high degree of grey value constancy, gradient constancy, and image smoothness in the image data from image to image. These image quality attributes need to be ensured for these wind retrieval methods as well, and in order to accomplish this, the spatial resolution and spatial over-sampling considerations described above for AMV tracking with MISTiC are essentially the same as those needed to support optical flow-based wind field retrieval methods.
Spatial resolving power is directly related to the potential density of AMVs that can be observed and tracked. Useful water vapor tracers may be as small as the spatial response function of the instrument. For MISTiC, the SRF FWHM is between one and two GSDs, and the entry in Table 2 relates to the number of SRF-scale targets that could be tracked. Cloud AMVs require more spatial information to ensure that the same cloud is being tracked between images, and so the potential density of cloud AMVs is much smaller, as shown in Table 2. The actual density of AMVs depends on the specific atmospheric conditions. In the future, Optical Flow methods may allow a higher density of tracking points in both cloud and clear conditions.
Validation of current AMV observation methods widely employs comparisons with radiosonde observations as “truth”, and validation of the MISTiC Winds observation method would employ this approach as well. However, there are additional error terms that arise in this comparison, that are due to potential errors in the radiosonde data, and to the displacements in either space or time between radiosonde observations. One important difference will be the simultaneous observation of the vertical thermodynamic field profiles both by the MISTiC Winds system, and independently by the radiosondes, which should improve the ability to understand the causes of differences between radiosonde and satellite-derived wind observations.
The GOES-ABI-like image sequence requirements adopted for MISTiC differ in important ways from the traditional way IR sounder spatial response attributes are specified. IR sounders are envisioned as providing spatially un-correlated, independent “soundings” of the atmosphere. Such sounding instruments are designed so that the individual ground footprints (and atmospheric columns) observed do not overlap. In some sounding instrument designs such as IASI, there is a substantial gap between spatial samples. In image-quality terms though, the images such instruments produce are significantly under-sampled spatially. While spatial under-sampling is fully acceptable for single-frame sounding observations, spatial under-sampling is not desirable at all for image-sequence tracking or optical flow estimation, due to the radiance and radiance gradient errors it introduces.
The finer spatial resolution of MISTiC relative to current hyperspectral sounders, although selected in order to support AMV wind observations, will also provide benefits for observing the spatial structure of the atmospheric fields. This capability will enable a larger fraction of cloud-free observations than current operational sounders observe, along with an improved capability to observe multi-level moisture field gradients.
The most significant spectral range difference between the requirements proposed for MISTiC and those of hyperspectral sounders currently in orbit is that MISTiC spectral range does not include the longwave infrared (LWIR) atmospheric window or very longwave (VLWIR) CO2 emission-dominated regions of the infrared spectrum. If it did, the size, mass, and power accommodation needs of the instrument would approximately triple, requiring a substantially larger spacecraft host. The MISTiC spectral range includes 4.3 μm (2390 cm−1) region channels, which are in the range used by the AIRS science team algorithms for retrieving the temperature vertical profile. The moisture-band channels used for MISTiC come from the shorter wavelength side of the atmospheric moisture band-as was planned for the NASA GIFTS instrument. These channels provide the same function for moisture sounding as those on the long wave side of the moisture band used by AIRS.
The functionally similar temperature-sounding spectral channel range near 15.4 μm (650 cm−1) in AIRS have somewhat broader vertical weighting functions, but are valuable for sounding the stratosphere, and (when used together with the 4.3 μm region channels) for identification of partly cloudy footprints, and for the creation of cloud-cleared radiance products. For MISTiC, improved cloud observations, enabled by its 5x higher spatial resolution, will at least partially compensate for the lost ability to use spectral cloud-clearing methods with the VLWIR band. Moreover, by mission design—MISTiC requirements are selected to support tropospheric winds and sounding—not stratospheric sounding. Operational IR sounders will continue providing stratospheric soundings in the VLWIR band for decades to come, so MISTiC will not plan to replicate this capability. Finally, radiance forward-modeling challenges in the 4.3 μm region that limited its use by earlier sounder teams have been addressed within the contemporary forward model used by the AIRS science team.

4.2. Significance of MISTiC Winds for Weather Research

While tremendous advances have been made during the last two decades on space-based observations of the mass field with infrared and microwave sounders, the tropospheric wind vertical profile remains the number one un-met observation needed to advance weather forecasting [24]. MISTiC Winds will observe the vertical wind profile in the troposphere, as well as the moisture and temperature vertical profiles simultaneously, with unprecedented spatial coverage, spatial resolution, and temporal refresh rate. The most recent NAS Decadal Survey [3] (p. 11) identified atmospheric winds as a targeted observable, specifically citing the need for “3D Winds in the troposphere/PBL for transport of pollutants/carbon/aerosol and water vapor, wind energy, cloud dynamics and convection, and large scale circulation.” The MISTiC spectral range also includes channels that provide observation of nitrous oxide and carbon monoxide pollutants in the free troposphere, as well as some highly transparent (super-window) channels useful in observing aerosols. When combined with MISTiC ‘s vertically resolved wind observations, the atmospheric transport of these materials can also be observed. The planetary boundary layer (PBL) has also been identified in the Decadal Survey as a targeted observable. PBL observations are recognized as challenging, and are placed in an incubation stage by the NRC. However, hyperspectral infrared sounding observations are noted as among the essential techniques that will be needed for PBL studies. While the vertical resolution needed for PBL characterization is a challenge for traditional vertical profile retrieval approaches, differential approaches (on-line/off-line methods) together with infrared skin-temperature observations should be effective in important situations, including over-ocean observations, where the surface emissivity is well characterized [30]. The substantially higher spatial resolution of MISTiC observations relative to other infrared sounders would be particularly valuable in supporting studies of the lower troposphere and PBL in partly cloudy fields. The relatively higher frequency of observation, and potentially even the short-burst hyperspectral snap-shot sequence (10-min sampling) of the scene observed by each element in a wind triplet could provide valuable insight into PBL evolution.
The MISTiC Winds combination of observations is expected to be particularly advantageous for improved NWP. The differential equations solved numerically to provide a weather forecast constitute an initial-value problem, which requires initial conditions provided by atmospheric observations for solution. Assimilated MISTiC Winds observations would provide valuable constraints on both the initial atmospheric state, and its first time-derivative. The value of this approach for weather forecast accuracy improvement has been demonstrated through an OSSE performed by NASA’s Global Modeling and Assimilation Office evaluating the MISTiC observations on a global weather forecast [23]. This simulation showed significant potential for weather forecast improvement from the new MISTiC observations, with the vertically resolved wind observations being most significant, but with significant improvement also provided by assimilating IR radiances. Of particular note are the Forecast Sensitivity of Observation Impact (FSOI), where the MISTIC vertically resolved water vapor motion and cloud motion vector wind observations of a MISTiC constellation showed the largest impact on the 24-h forecast of any other observation. When Himawari-sized errors are included for the wind observations in the GMAO OSSE system’s 3D-Var assimilation, the MISTiC FSOI impact remains very high-comparable with the impact of the full microwave sounder constellation. An update to this MISTiC OSSE is currently under way at the Jet Propulsion Laboratory, using a more representative error model for hyperspectral AMV winds. These initial OSSEs were performed at GMAO using the 7 km GEOS5 Nature Run with a ¼ degree Forecast Model, a ½ degree Analysis model, and 3D-Var assimilation with Himawari-sized errors in wind speed. It is expected that the fine temporal and spatial scale observations MISTiC Winds will provide will have an even greater impact on forecast accuracy for the fine-grid convection-permitting NWP models being developed.

4.3. Differences in Observed Spectral Resolving Power for the Airborne and Laboratory cases

Spectral observations from the MISTiC airborne instrument during the ER2 flights demonstrated somewhat lower spectral contrast than expected from the instrument design, based on comparison with observations from IASI and based on analysis using radiance forward models informed by the atmospheric vertical temperature and moisture profiles provided by radiosondes. In contrast, the laboratory measurements of the brass-board spectrometer, described in Appendix A, show a spectral resolving power in very close agreement with design expectations. Additional information on this difference and its most likely cause are provided in Appendix B.

5. Conclusions

A new space-borne weather remote sensing approach, MISTiC Winds, employing miniature infrared spectral imaging sounders in a microsatellite-hosted constellation is described in this paper. This observation approach would provide individual high-resolution infrared spectral soundings in a dense array, with image quality characteristics of spatial sampling, spatial resolution, and sensitivity that enable high-quality atmospheric feature tracking. These attributes, together with the small size of these instruments enable a small number of them to be deployed in a common orbital plane in LEO short with time-separation, providing a feature-track wind observation, with the improved feature height assignment accuracy provided by hyperspectral infrared sounding. The vertically resolved tropospheric wind observations enabled by MISTiC Winds are directly responsive to the need identified by the National Academy in its 2018 Decadal Survey for Earth Sciences and identified as a targeted observable. Such observations would enable research for an improved understanding of key atmospheric processes, especially for severe weather, and improved numerical weather prediction.
This proposed observation builds on the experience of the NASA AIRS Program, as well as the requirements, design, and technology developments of the NASA GIFTS Program and the NASA/NOAA GOES-R HES Formulation Phase Program. The specific requirements, mission concept, and instrument design concept were developed under the NASA Instrument Incubator Program and BAE Systems internal funding. A program of critical risk reduction testing was also completed. Specific accomplishments under these efforts include:
Development of key instrument and mission requirements, observing system architecture and instrument detailed concept design tailored to focus on dynamic weather characterization in the troposphere with miniature instruments in a constellation:
Cloud and water vapor motion vector winds with rms wind-speed errors <2 m/s at 6+ levels in the troposphere,
High-resolution IR soundings of temperature and vertically resolved moisture gradients in the troposphere,
15 kg/50 W instrument is 60x smaller in volume, 10x lower mass, and 4x lower power demand than NASA’s AIRS instrument,
Performance of critical technology risk reduction through laboratory and airborne testing:
APD-mode 640x480 IRFPA with Proton total dose tolerance for four-year LEO mission life demonstrated,
Ultra-low distortion brass-board IR spectrometer assembly demonstrates >700:1 spectral resolving power and high spectral calibration temperature stability (dλ/dT <2.5% of spectral response function FWHM per 100 mK),
Conducted several airborne observation demonstration flights on ER2 (~30 h) multi-pass observations over land sites in southern California, and over the nearby ocean,
Analyzed the airborne data to show vertically resolved moisture gradients, and hyperspectral cloud AMVs matching radiosonde wind speed observations to within 2.5 m/s under challenging high wind-shear conditions.

Author Contributions

Conceptualization, K.M. and J.P.; Formal analysis, K.M.; Investigation, J.P., H.A., J.S., D.B., C.G., M.J. and S.F.; Project administration, D.B.; Software, S.F.; Writing—original draft, K.M.

Funding

The financial support of this work by the NASA Earth Science Technology Office, under grants NNX14AG86G and 80NSSC18K0568, overseen by NASA Earth Science Technology Office by Mr Parminder Ghuman and Ms Pamella Millar is gratefully acknowledged.

Acknowledgments

Significant contributions to the design, fabrication, alignment, and calibration of the airborne instrument used for data acquisition for this work were provided by BAE Systems staff members Jacinto Malabuyoc, Shawn Reven, Steven Tate, Bernard Sacco, and Daniel Engheben. Dr John Blaisdell at NASA GSFC provided IR retrieval analysis for the spectral cutoff trade studies, and for correlations between AIRS observations and the airborne observations reported here. Dr Supriya Chakrabarti of the University of Massachusetts at Lowell provided supervision and guidance for Mr Fingerman, one of his students and later a staff member at the university. The authors are grateful for all of these contributions.

Conflicts of Interest

The authors declare no conflict of interest.

Appendix A

These risk reduction efforts were highly cost-constrained, and adapted to allow instrument testing in air rather than vacuum. These constraints had several impacts on the airborne test. An off-the shelf engineering-grade focal plane array detector (FPA) was employed, with a shorter spectral cutoff wavelength than planned for the space version of the instrument. This reduced spectral range is shown in Figure 4. The off-the-shelf FPA spectral cutoff limited the spectral coverage of the airborne instrument somewhat. Even so, the reduced spectral coverage still allowed the acquisition of hyperspectral imagery for much of the spectral range, but limited the potential to perform full retrievals of the moisture and temperature vertical profile from the airborne spectra. FPA and spectrometer cooling were both performed by separate active cryo-coolers rather than a pulse-tube cryo-cooler planned for the space instrument FPA and passive radiative cooling for the spectrometer. The spectrometer was cooled to the planned operating temperature during the ground and airborne tests, but is isolated within a vacuum vessel in the airborne test. This configuration introduced additional optical interfaces for the airborne version that are not present in the space instrument design. The FPA is inside a detector/dewar assembly in the airborne instrument, introducing an additional window not present in the space instrument design. Scaled versions of the infrared blackbody calibration sources are used, but a large infrared-transparent window exposed on one surface to the stratosphere during flight lies outside of the infrared radiance calibration loop in the airborne instrument. While the spectrometer optics design is nearly identical to the final space design, the fore-optics that focus the scene onto the entrance slit were not. COTS electronics and a rugged air-cooled computer were employed for off-FPA digital functions rather than the space electronics design. Finally, the thermal environment of the ER2 superpod is highly variable during flight, and its behavior is not documented. Ultimately, this thermal uncertainty led to fore-optics that were in-focus during ground testing, but were much colder than anticipated and somewhat out of focus during flight. This focus error introduced some degradation of spectral resolving power in the airborne data. However, even with these limitations and challenges, the key risk-reduction tests and demonstrations for MISTiC Winds were successfully accomplished.

A1. Radiation Testing of the Avalanche Photodiode Array and Readout IC

One of the design methods used in MISTiC Winds to simultaneously provide high-quality hyperspectral IR sounding and imaging from a miniature spacecraft is to employ cooled mid-wave IR (MWIR) focal plane arrays operating at a relatively high temperature. The APDIS Avalanche Photodiode (APD)-Mode HgCdTe FPA, developed by DRS [31], and shown in Figure A1, has been used effectively in operational airborne hyperspectral imaging applications by BAE Systems over the last several years. This FPA employs an HgCdTe APD array that raises detector signal to the point where simple-and compact pre-amplifiers within the small (25 micrometers) unit cells of the FPA manage the signal effectively, even for low radiance channels. However, neither the HgCdTe avalanche photo-diode array nor the APDIS ROIC has been used in space.
Figure A1. APDIS IR Focal Plane Array.
Remotesensing 11 02169 g0a1
To mitigate this risk, total-dose radiation tolerance testing for the APDIS FPA was performed under the MISTiC Winds IIP by the Infrared Radiation Effects Lab (IRREL), based in Albuquerque, NM in August of 2015. Total-dose tolerance was evaluated by characterizing the changes in the FPA characteristics introduced by 68 MeV proton irradiation provided by an accelerator on the campus of the University of California at Davis. FPA radiometric characteristics (responsivity, broadband noise, and 1/f noise) and Readout IC current and voltage characteristics were evaluated prior to irradiation, and then following a series of six escalating radiation dose increments, while holding the FPA at its planned operating temperature (below 90 K), while at the bias voltages planned for operation. Table A1 shows some representative results from this test.
The key results of this total-dose testing are the following:
ROIC characteristics were essentially unchanged up to 70 krad accumulated dose-the highest used in this test,
Detector dark current and broadband noise increased with dose-but at a rate acceptable for the projected four-to-five-year mission-life for a MISTiC instrument. The FPA noise remained below the instrument flow-down requirement through a dose of 20 krads (Si), and
Only modest increases in 1/f noise were observed, and these only at relatively high APD gains (higher than planned for MISTiC operation), and at higher proton doses (above 20 krads).
Table A1. FPA dark current change with total dose for HgCdTe 640x480-Format APD-Mode IR FPA (key environmental test-raising TRL to 5).
Total Ionizing Dose (krad(Si))Median Pixel Dark Current (A)
Pre-Rad1.3 × 10−15
11.26 × 10⁻¹⁵
51.82 × 10⁻¹⁵
153.5 × 10⁻¹⁵
256.3 × 10⁻¹⁵
358.0 × 10⁻¹⁵
7016.0 × 10−15
Specifically, array-average dark current is shown, both prior to radiation, and following the accumulated dose shown in the table. The proton radiation total-dose flow-down requirement for dark current (5 fA/diode) was only exceeded at a total dose between 15 and 25 krads. This level of total-dose tolerance meets the anticipated mission requirements for MISTiC Winds. Additionally, a large fraction of the total-dose damage introduced into cryogenically operated HgCdTe photodiodes anneals out when the diodes returned to room temperature.

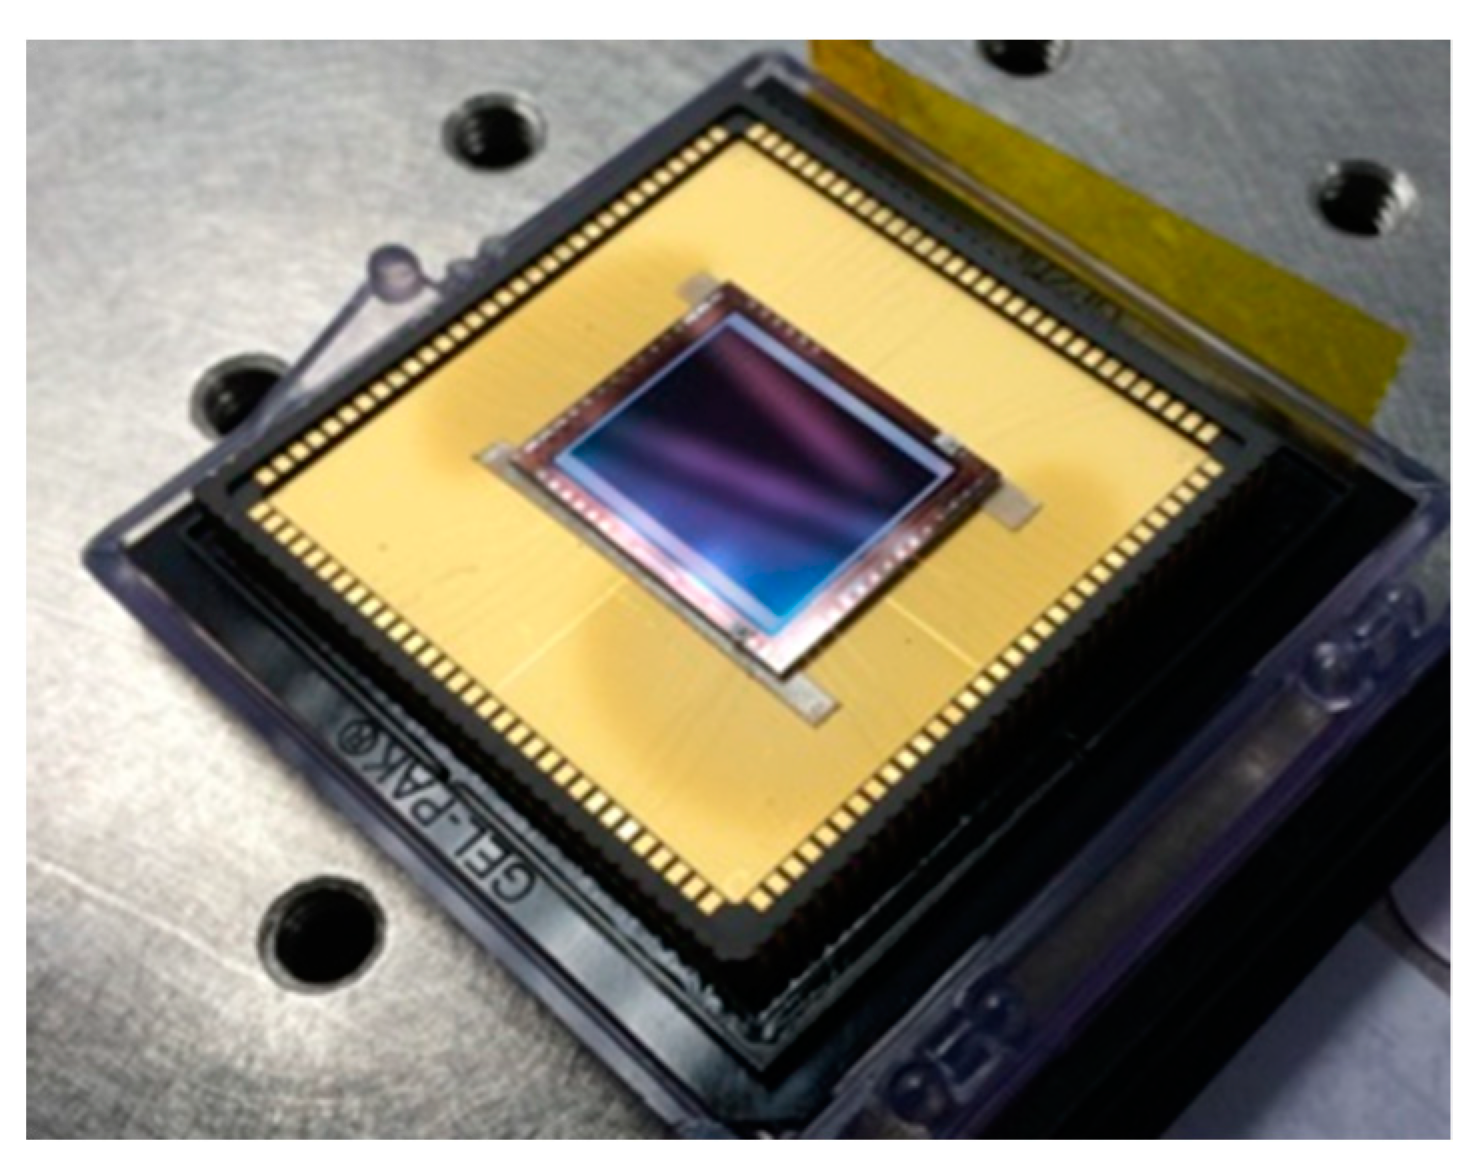
A2. Spectrometer Fabrication, Integration, and Key Ground-based Performances Tests

The flight-like (brass-board) MISTiC spectrometer optical assembly was fabricated and was integrated with the detector/dewar assembly at BAE Systems. In addition to the spectrometer opto-mechanical assembly and the FPA itself, the onboard radiometric calibration sources and scan-mirror assembly are nearly identical to those in the planned space instrument implementation. Integration of the ground/airborne version of the instrument is shown at right in Figure A2.
Figure A2. NASA ER2 Platform (right), and MISTiC airborne demonstration instrument (left).
Remotesensing 11 02169 g0a2
Several aspects of the instrument design, alignment, and spectrometric performance were assessed during ground testing. The precise geometrical alignment between the entrance slit, grating, and FPA was performed during instrument integration. Once aligned, the geometric distortion, including spectrometer optical field geometric distortions referred to as “smile” and “keystone” distortions as well as residual angular misalignment of slit, grating, and the photodiode array. The residual distortions were found to be low, providing common spectral channel sampling (within 5% of predicted spectral response function (SRF) full-width-half-maximum (FWHM) across the slit field), and a suitably low level of spatial/spectral miss-registration (5% of GSD). The spectral resolving power of the instrument was assessed in ground testing, with the spectrometer assembly cooled to its planned operating temperature. The observed and modeled outputs of the monochrometer test for spectral channels near 4.2 and 5.3 μm are shown in Figure A3. The observed FWHM of the SRF was within 2% of the designed value. The different portions of the spectral range employ different diffractive orders of the grating-with order 2 being used for the wavelengths longer than 4.65 μm, and grating order 3 used for shorter wavelengths. The ratio of the SRF FWHM-to-spectral sampling interval was greater than 2:1 (oversampling) for all spectral channels.
In addition to spectral resolving power, critical performance attributes of moderate-resolution dispersive spectrometers employed for infrared sounding include the knowledge and stability of the spectral calibration. Following AIRS, spectral calibration knowledge-to a few parts in 100,000 of the channel wavelength is needed. Again following the practice of AIRS, the absolute spectral calibration will be established for selected cloud-free scenes using a vicarious calibration approach that uses the observed wavelength of a selection of known, stable atmospheric spectral features. In this way, the spectral calibration knowledge requirement flows directly to a spectral calibration stability requirement which, in turn, flows directly to a spectrometer temperature stability requirement, since thermally induced distortions of the spectrometer are the dominant driver of spectral calibration shift. For MISTiC, a spectral calibration stability requirement of 5% of the SRF led to the establishment of an initial temperature stability requirement of <100 mK over the orbit.
Figure A3. Monochrometer testing of the MISTiC spectral response function shows spectral resolving power meeting MISTiC requirements at the operating temperatures planned for space operation.
Remotesensing 11 02169 g0a3
This drove the overall instrument thermal requirements and design of the space instrument. Detailed thermal modeling of the space-borne spectrometer shows a spectrometer temperature stability estimate of 30 mK, 6σ over the orbit. The assumed orbit is sun-synchronous, and for most nodal crossing times, the spacecraft move in and out of solar illumination with a ~100-min period.
Airborne tests of the spectrometer imagery, (described in more detail below) also provided an experimental opportunity to evaluate the temperature sensitivity of the spectral calibration for the MISTiC spectrometer optical assembly. Figure A4 shows spectra taken over a particular (cloud-free) ocean scene off the California coast near Vandenberg AFB, at two different times, but for the same cross-track position. Analysis of the spectral shape change for high spectral contrast features shows that the spectral calibration shifted by 25% of the MISTiC spectral sample spacing, or approximately 0.9 nm in the Water Vapor Band, for airborne spectrometer temperature change of 375 mK. This test shows that the temperature-induced change of the MISTiC spectrometer spectral calibration is <2.5% of the SRF for each 100 mK of spectrometer temperature change. This is a factor of 2x better (less sensitive) than the flow-down requirement identified above. It should be noted that the dynamic thermal environment in the ER2 superpod was considerably more challenging than that expected for spectrometer in the space instrument. However, even with that challenge in the airborne test condition, the MISTiC spectrometer provided sufficient spectral calibration stability to allow multi-pass spectral imaging observations of the spectral features of wind-tracer targets, supporting that key objective of the airborne tests.

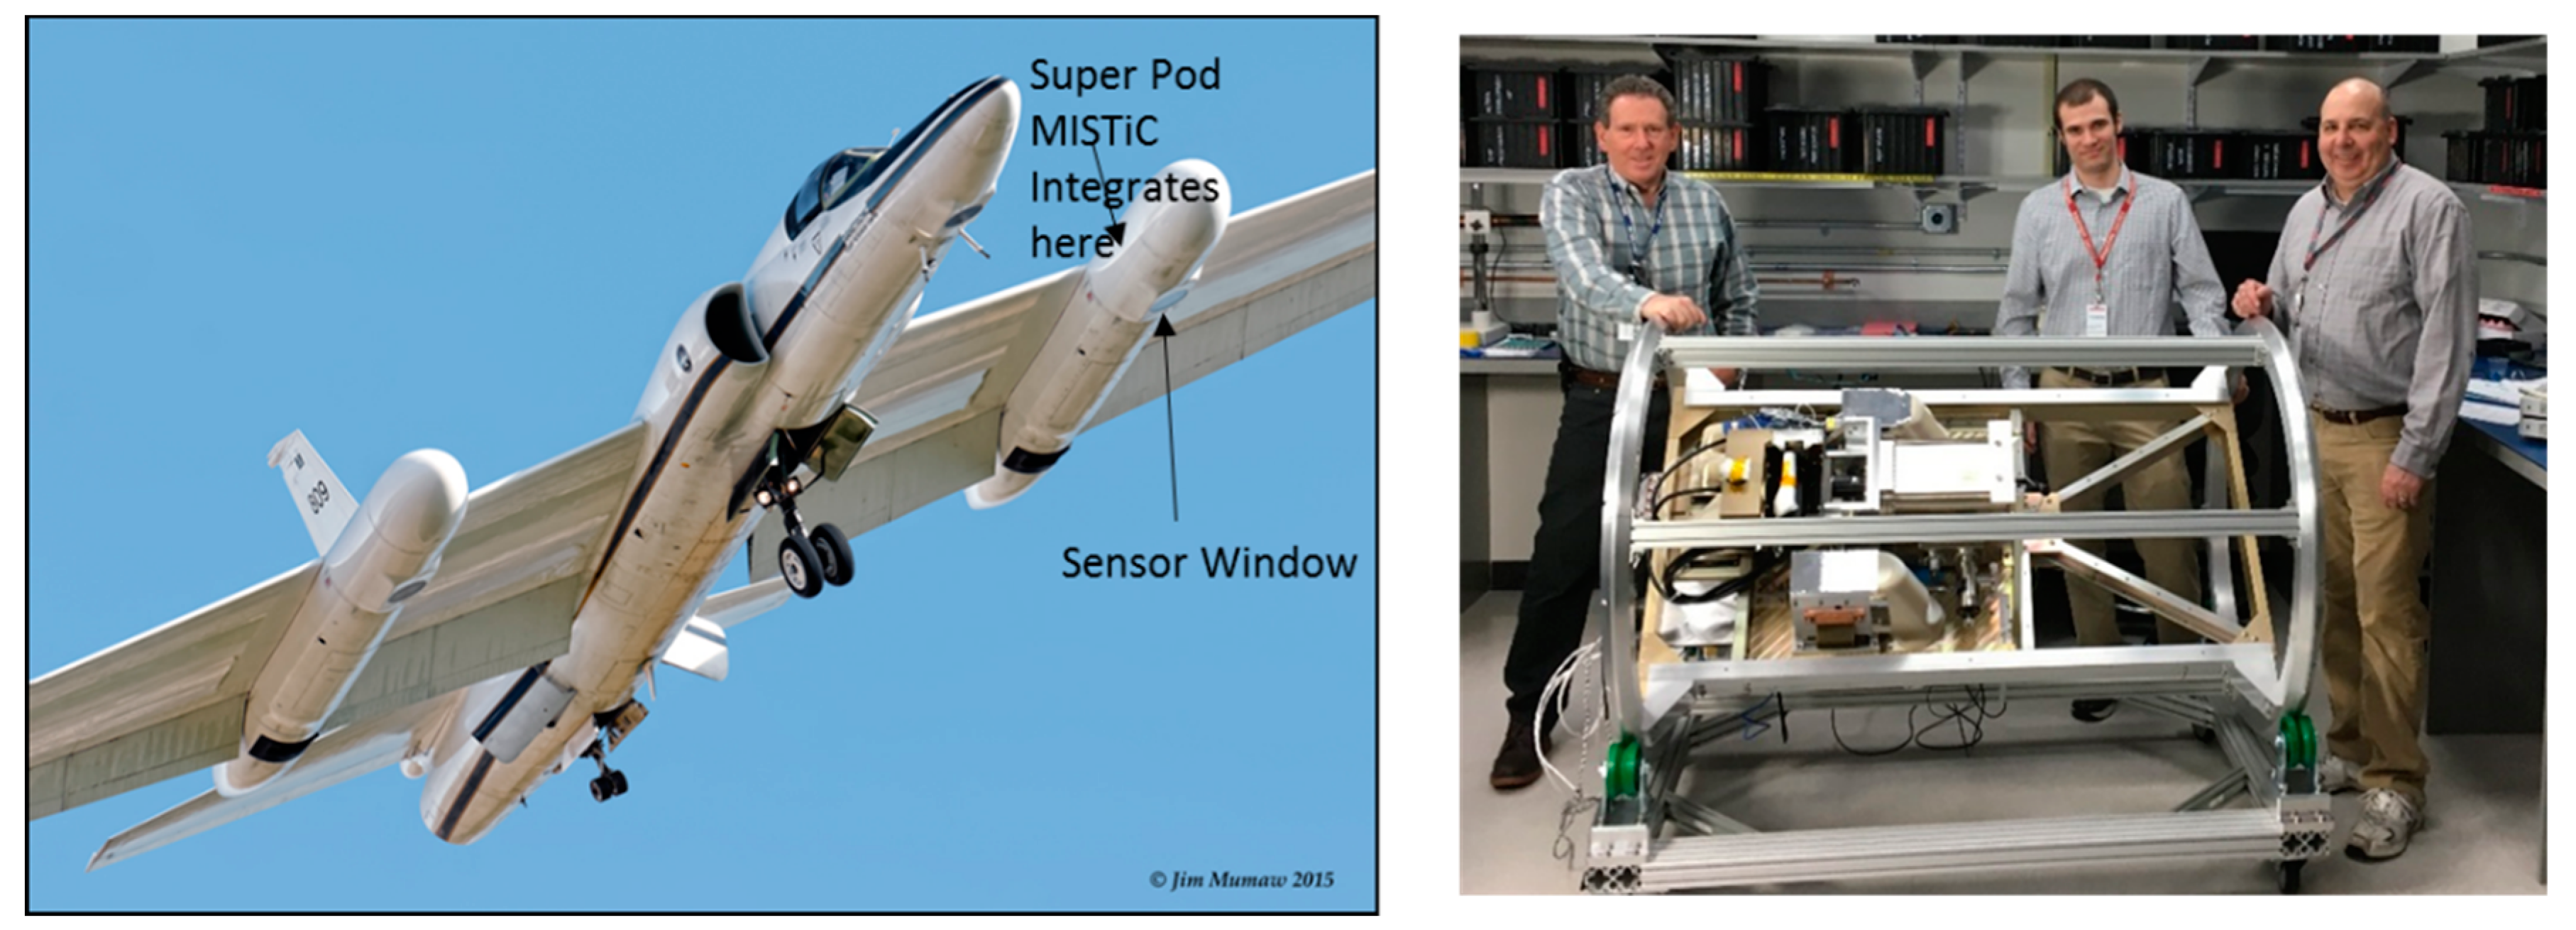
A3. Airborne Instrumentation Integration and Spectrometer Characterization

Figure A2 shows the airborne payload placement on the air platform (left). In the airborne implementation, the instrument is positioned within the fore-body section of a NASA ER2 superpod. The airborne instrument includes: The IR spectrometer assembly, mechanical coolers for both the spectrometer and IR focal plane array detector, a detector array interface and control electronics, a scan mirror, two miniature IR calibration sources, a GPS/IMU, overall instrument telemetry, command, and control electronics (under LabView control), and a nitrogen gas purging arrangement for the space between the instrument and the ER2 window.
Figure A4. Airborne repeat-pass spectral imaging observations over the Pacific provided a test of the temperature sensitivity of the spectral calibration. The observed shift of <0.05 spectral samples per 100 mK is 2× better (less) than the required temperature sensitivity of spectral calibration needed to maintain spectral calibration stability on-orbit.
Remotesensing 11 02169 g0a4
The spectrometer optical design covers the full spectral range shown in Figure 4, and this assembly represents a high-fidelity brass-board implementation of the spaceflight spectrometer. In order to minimize cost for the airborne instrument and as noted above, an off-the-shelf version of the IR FPA was included. The infrared detector array on this off-the-shelf FPA has useful spectral response over much, but not all, of the range shown in Figure 4. The airborne instrument also includes rugged commercial-grade electronics. In some ways, the airborne instrument requires more power and mass resources to accommodate than the space instrument. The airborne instrument houses the cooled spectrometer within a rugged vacuum vessel, and employs a tactical military-grade cryo-cooler to cool the spectrometer. The optics preceding the spectrometer have a different focal length than that used for the space instrument to partially compensate for the difference in altitude between the space and airborne observations. The spectrometer, scan mirror, and radiometric calibration sources are inside of a sealed ZnSe window (the superpod window-which is not shown in Figure A2) that is required to keep the superpod pressurized (at 4 psi) even while the ER2 is flying in the stratosphere at much lower pressures. The raw scene image data are radiometrically calibrated by using a two-point method employing radiance from black-body cavity sources at two temperatures to develop correction coefficients for the raw scene data. One complication introduced into the radiometric calibration of the airborne hyperspectral image data is that the superpod window is not inside the calibration loop. The effects on the scene radiance through-window attenuation and window self-emission are addressed through the use of in-flight window temperature data and spectral transmission data obtained during ground-tests.

Appendix B

This appendix includes a more detailed discussion of the observation demonstration flight, the approach for simulating the motion-vector wind observations on the ER2.

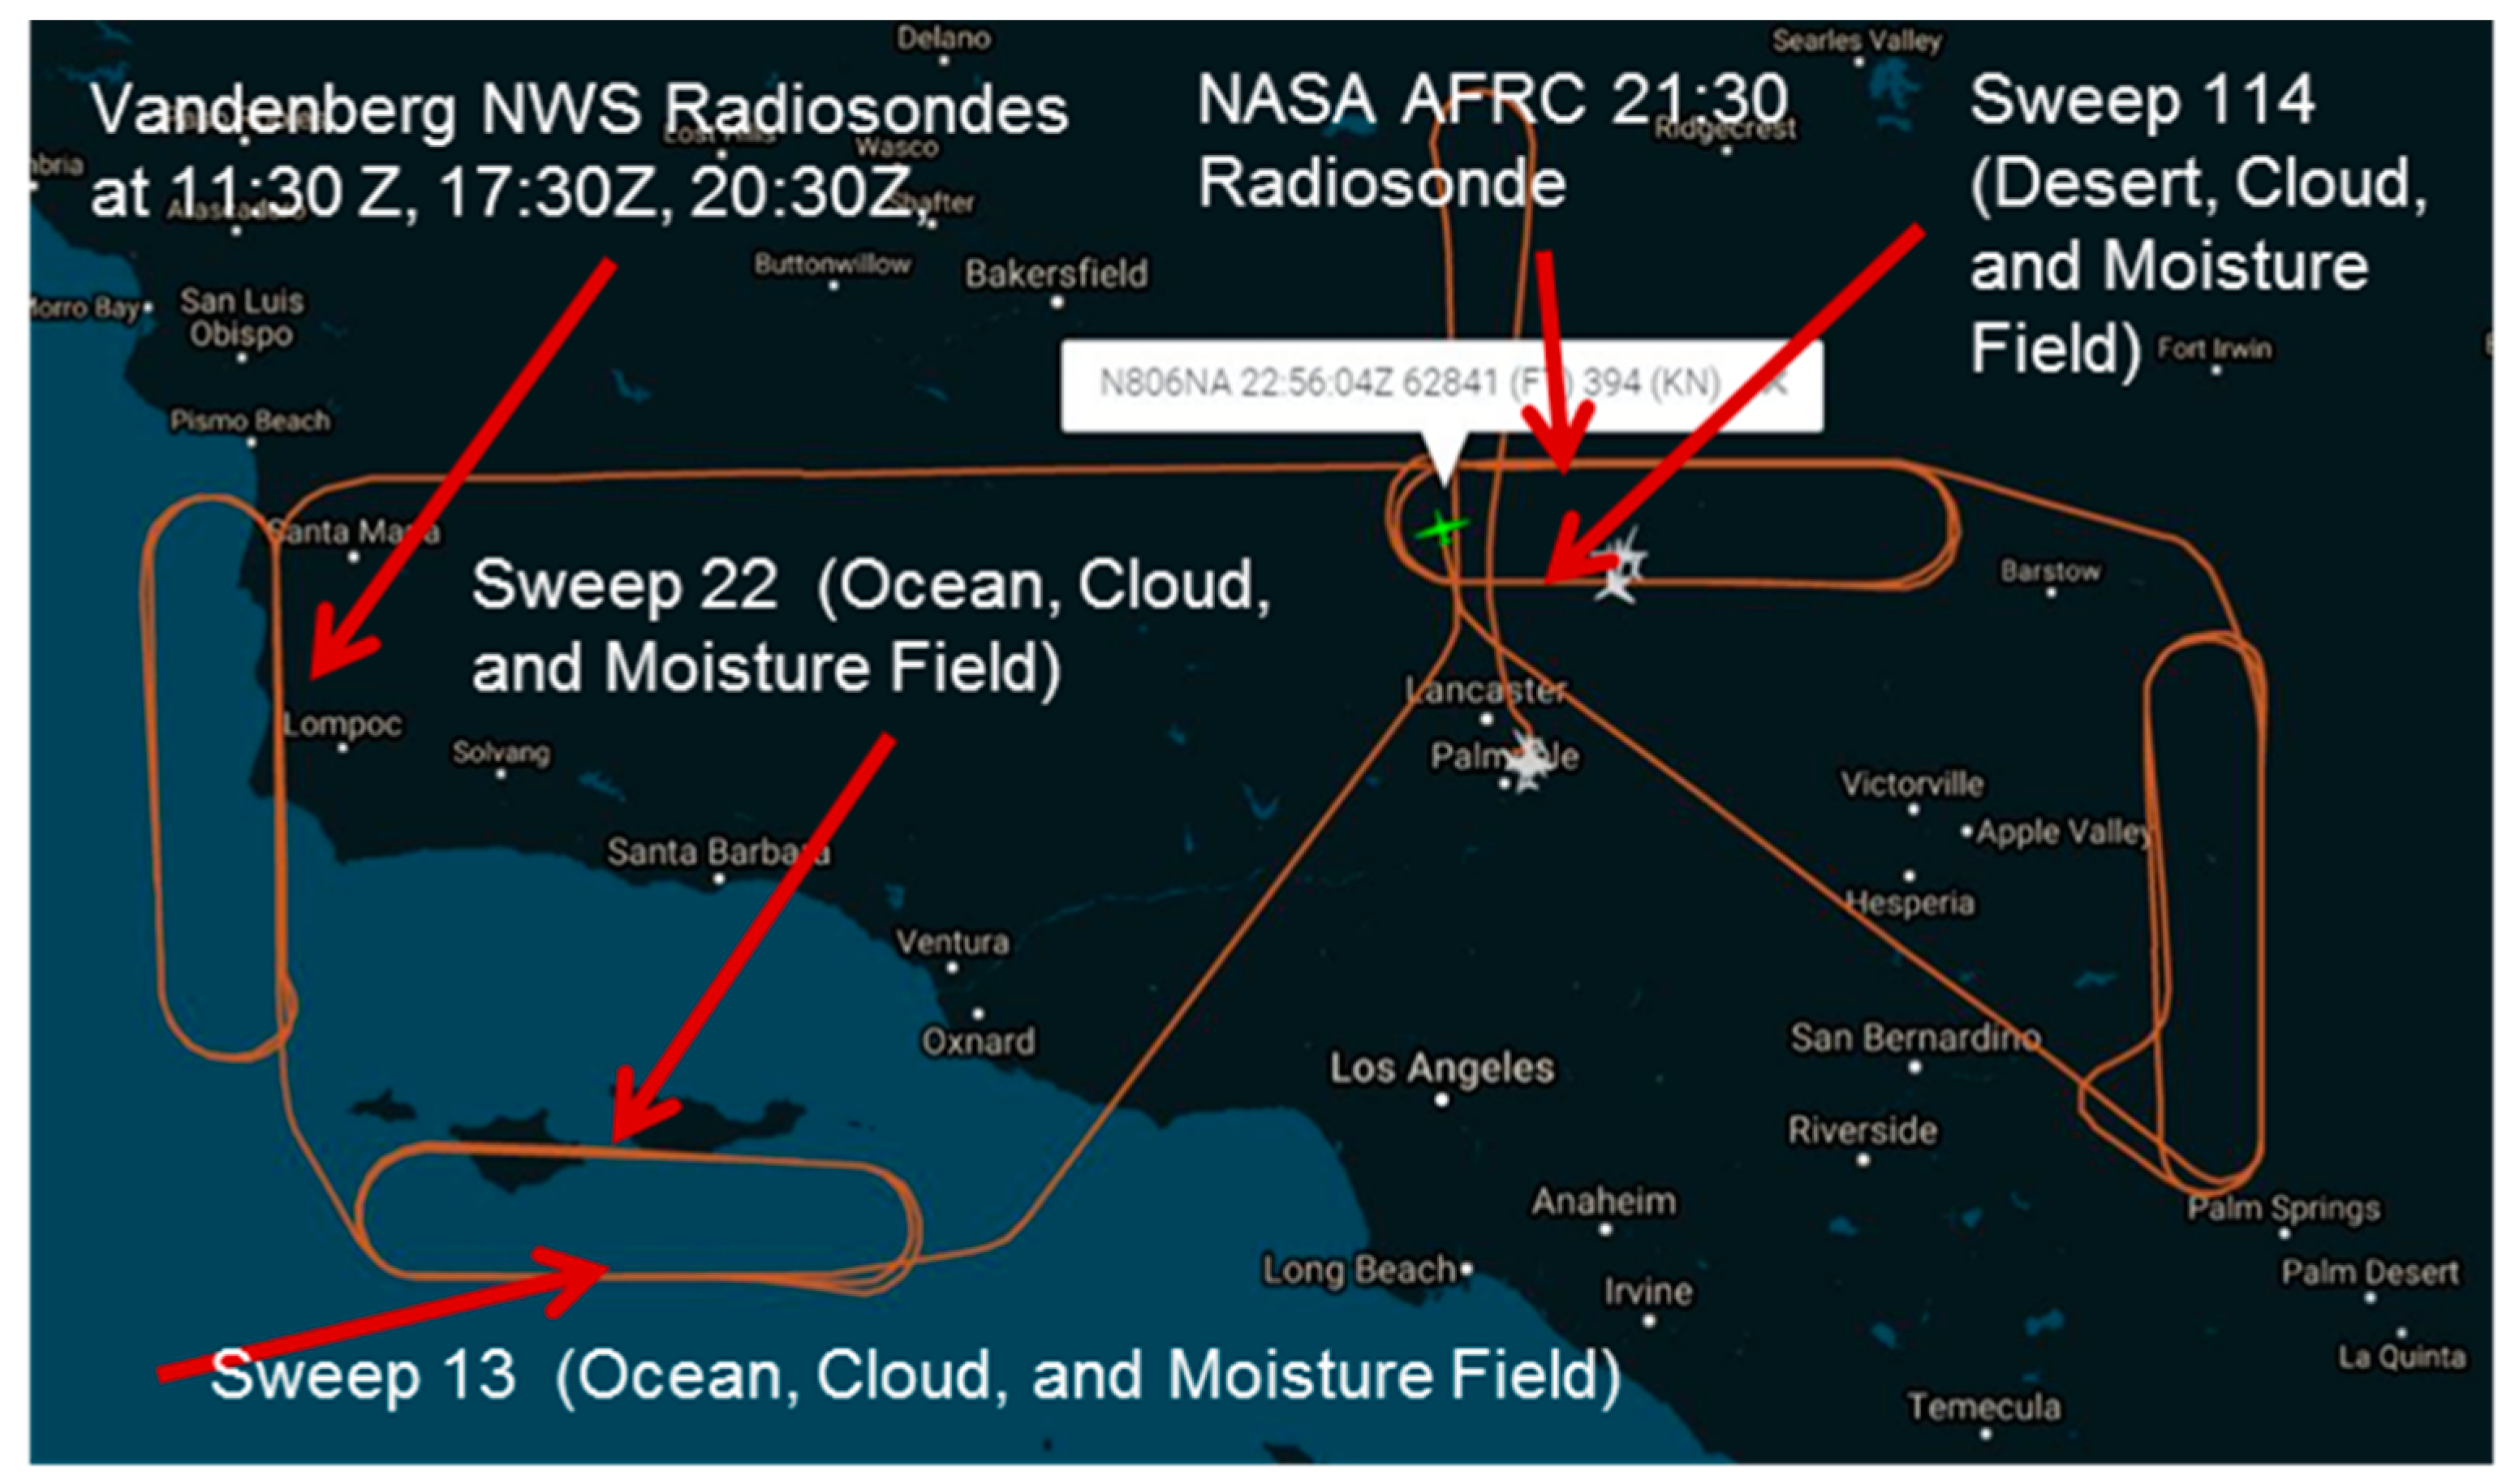
B.1. Flight Path for a MISTiC Observation Demonstration Flight on 4 December 2017

The path of this flight is shown on the left in Figure 10, and closely followed the plan developed with the pilot and flight planning support at NASA Armstrong. Following launch from Palmdale (approximately 10:30 AM PST), and ascent-stage maneuvers, the ER2 climbed above 60 kft above MSL, and MISTiC hyper-cube collection was initiated while flying to the southwest to the east of Oxnard (there is evidence of one of the many fires in the region in one portion of the first hypercube of this flight). After leveling off at the observation altitude of 65 kft, the ER2 executed 2 ½ passes around the orbit following a “racetrack” pattern, for the first Orbit, just south of the Channel Islands. The ER2 then proceeded to a second Orbit (2 ½), which included both land and open-ocean features near Vandenberg AFB. The third Orbit location (2 ½) is over Edwards AFB, and the fourth Orbit location is to the east, over the Twenty-Nine Palms region. The fourth Orbit was followed by return-to-base. These Orbit locations were chosen in part to support independent observations of the weather features for comparison to the MISTiC observations. The first two Orbits are close to the Vandenberg AFB National Weather Service RAWINSONDE launch site, which provided measurements of wind velocity and the atmospheric thermodynamic properties. Two additional radiosondes were launched from Vandenberg on 4 December, supplementing the standard ~0Z and 12Z launches. The first Orbit is over the open ocean—just following the IASI-B overpass—providing the simplest situation for comparing MISTiC and IASI-B spectra, and refining MISTiC spectral calibration. The first Orbit also over-flew departure pathway of commercial airliners flying out of LAX, potentially allowing comparisons with ACARS data. The third Orbit was executed over Edwards AFB, when a special RAWINSONDE was launched for MISTiC by the Armstrong weather support staff. Finally, the Twenty-Nine Palms Orbit is over the departure and arrival pathway to LAX from the east, providing another opportunity for comparison with ACARS data. Aqua, with AIRS over-flew the area during the third Orbit, as did Soumi NPP and JPSS-1, each hosting a CrIS instrument.

B2. The “Orbit”-the Approach to Repeat-Pass Imaging

The purpose of the Orbit is to enable repeat-pass observations of the scene in order to observe how atmospheric features are translated (the process as “advection”) by the wind between observations. The orbit straight and level sections are flown in approximately 6 min and were chosen to allow two or three hyper-cube collections, referred to as “sweeps” while the ER2 was in level flight. The individual orbit period was approximately 1000 s, and was selected to balance the needs for infrared radiance data SNR (the longer the viewing, the better), and to reduce the likely-hood of the clouds and moisture patterns from either moving out of the field of repeat-observation, or undergoing excess shape or feature change between observations (a motion-vector wind observation employs multiple observations of the scene and observes where features (clouds or distinctive features in the moisture field) have moved between observations to compute the wind velocity).

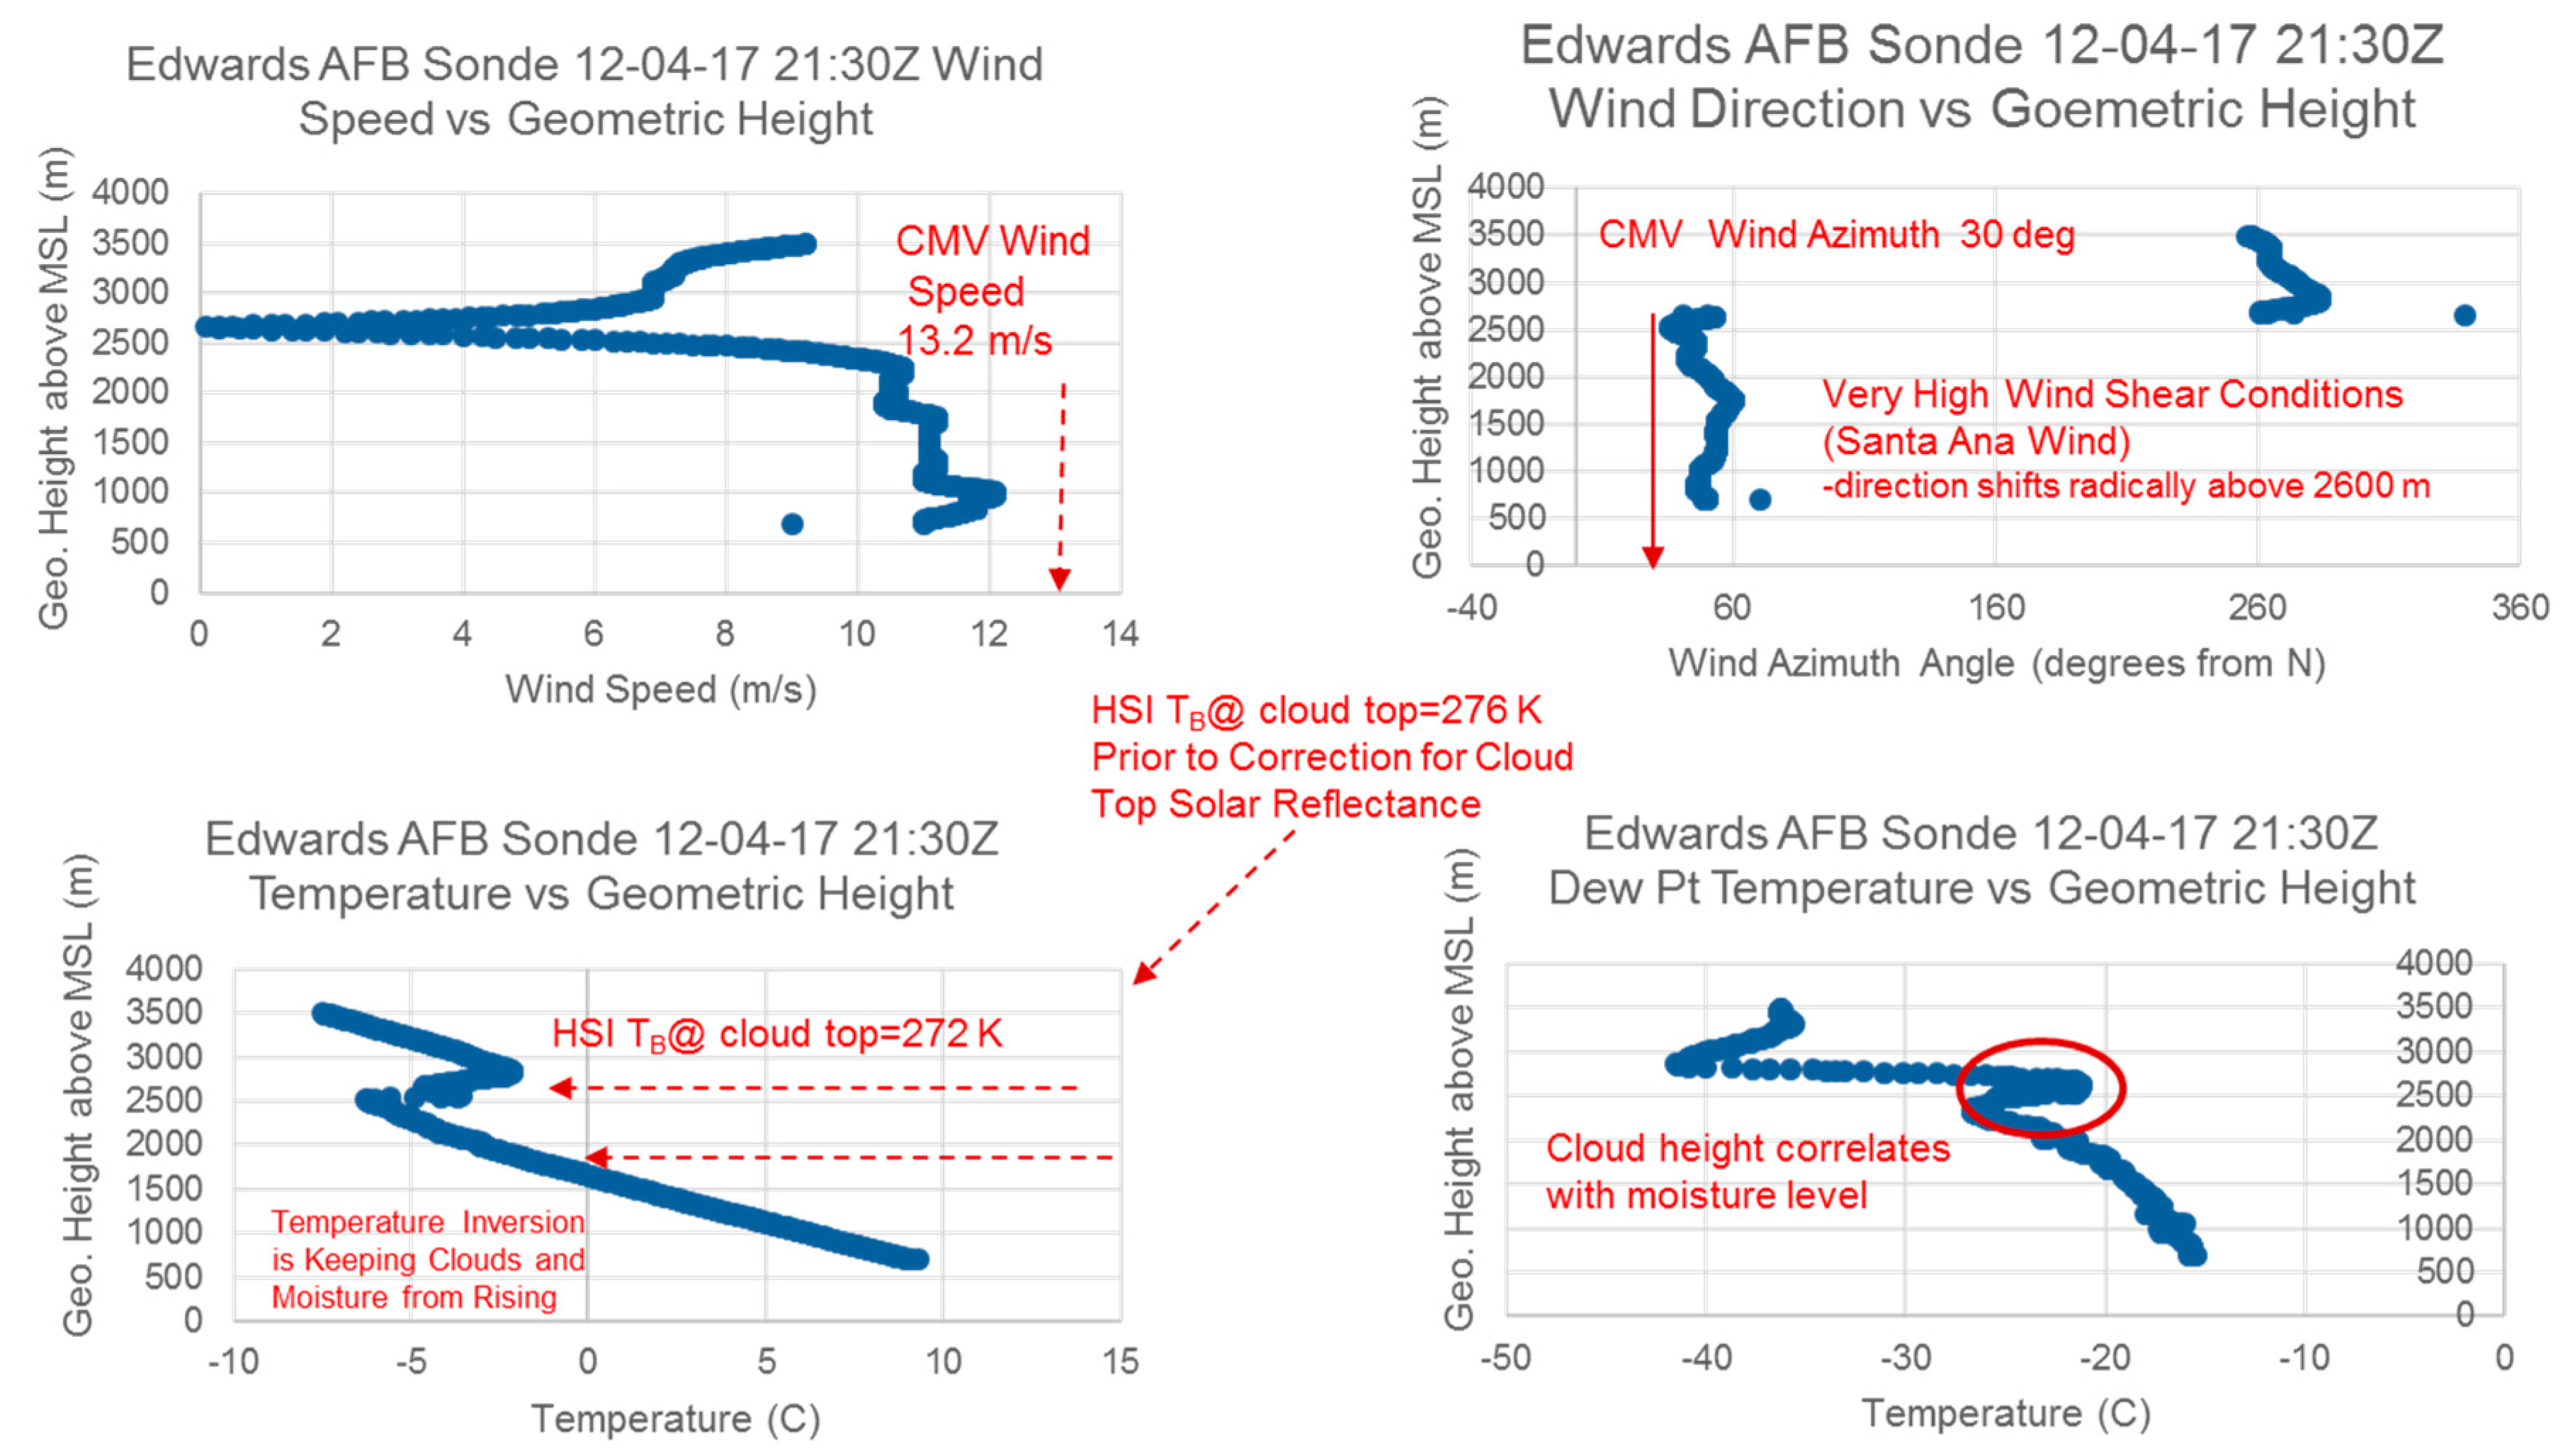
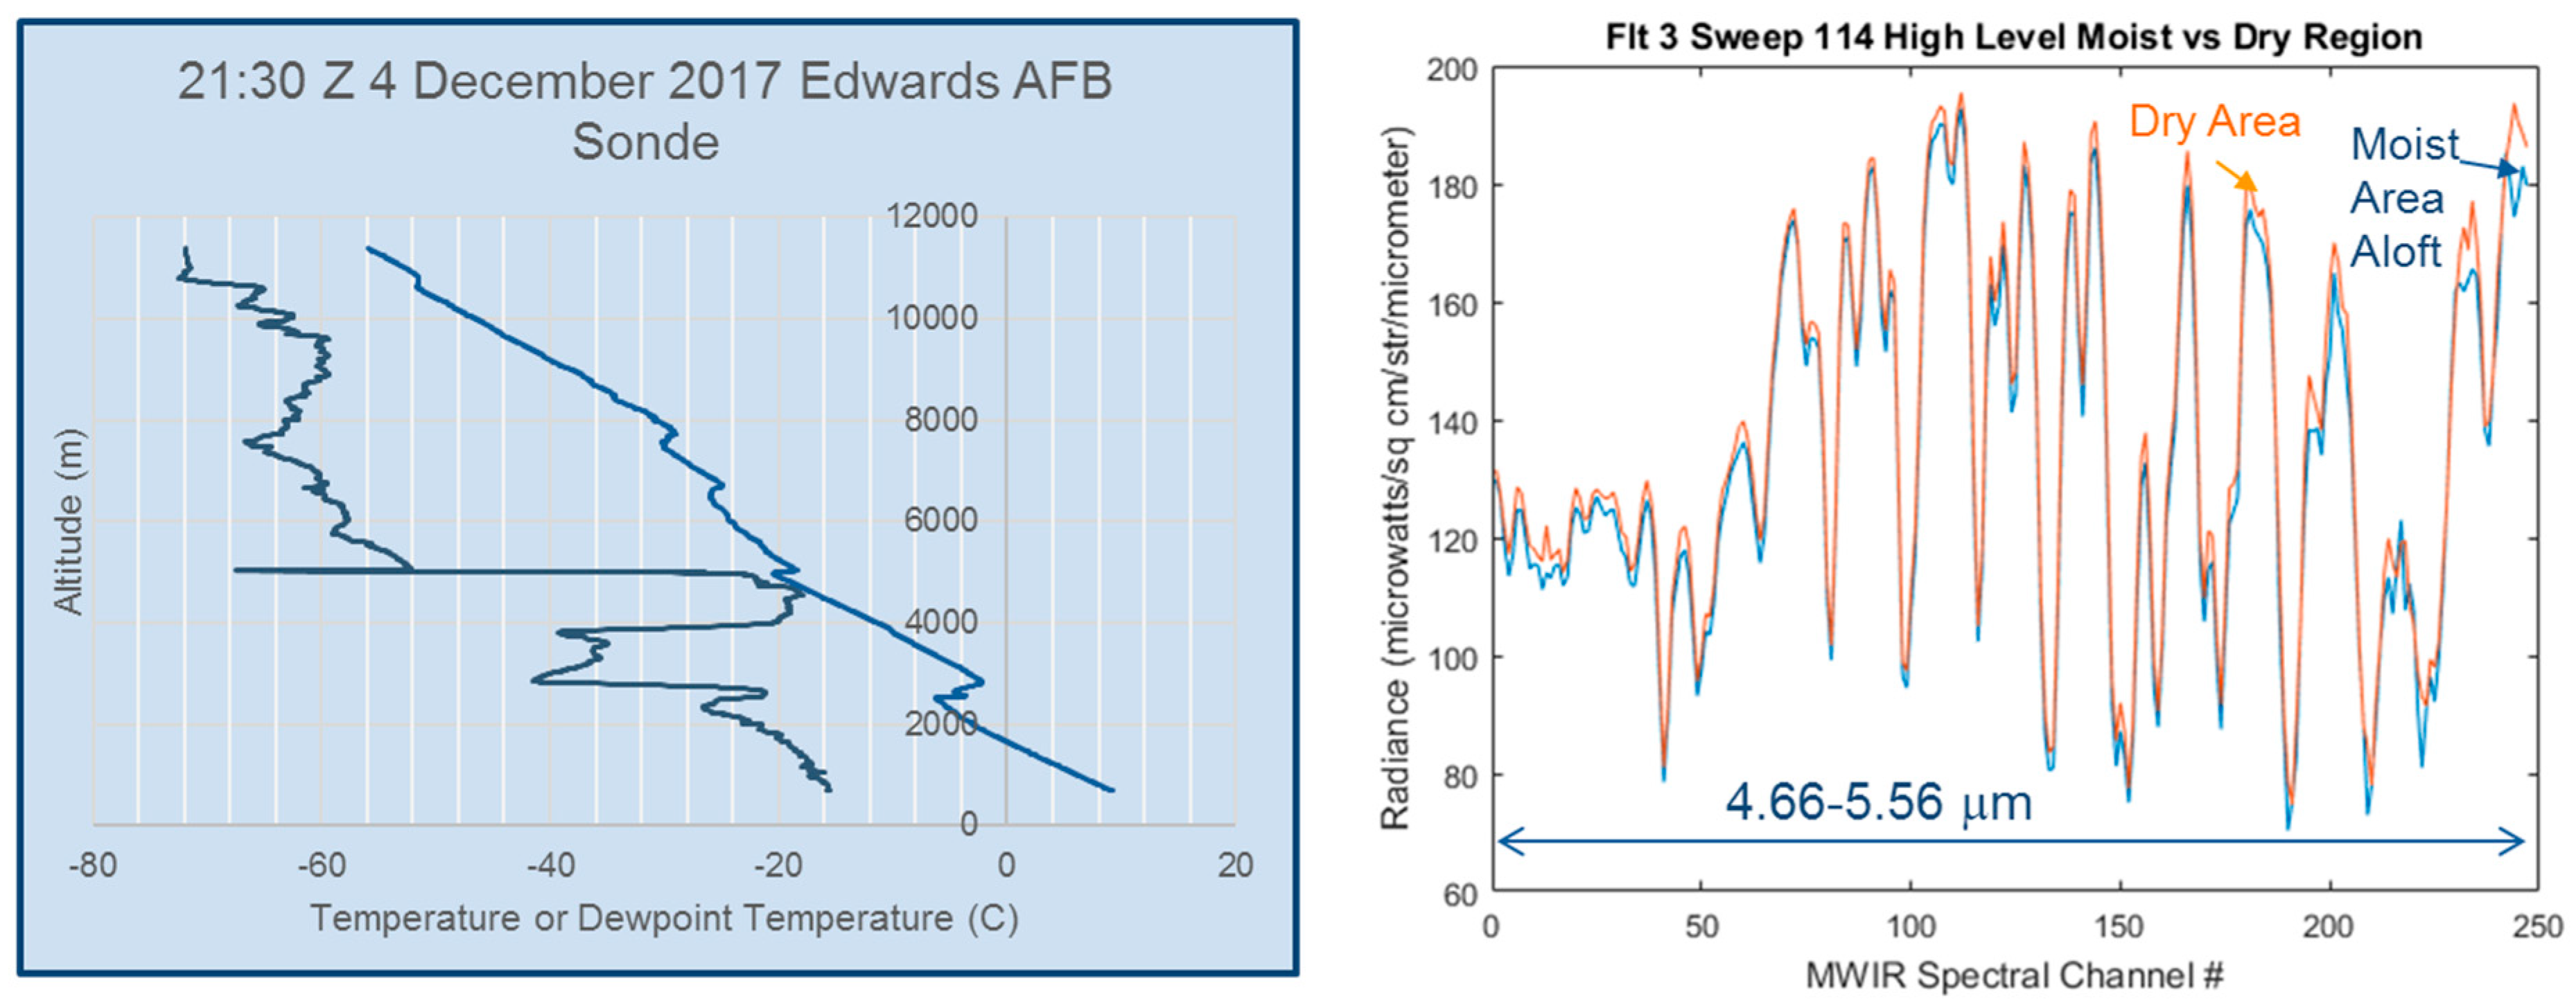
B3. Notes on the Weather for 4 December ’17 Flight

The weather over the region during the 4 December flight was characterized by two phenomena characteristic of the Southern California winter. At low altitudes, the conditions for the famed Santa Ana winds had arisen a few days prior, and a strong low-level easterly wind was flowing throughout the LA region through much of the week. The air was quite dry and relatively warm for December, and contributed to an outbreak and rapid spread of more than a dozen wildland fires in the LA region. These conditions interrupted the more typical December conditions in which a strong temperature inversion forms over the eastern Pacific, forming and trapping a low-lying marine cloud layer. At higher levels, a strong NW flow from the eastern Pacific spreads over the region. These low-altitude and higher-altitude patterns combine to produce conditions of particularly high wind-shear. From a weather remote sensing perspective, these conditions represent one of the most complex and error-prone situations for traditional motion-vector winds observations, which use images from multi-spectral imagers in GEO.

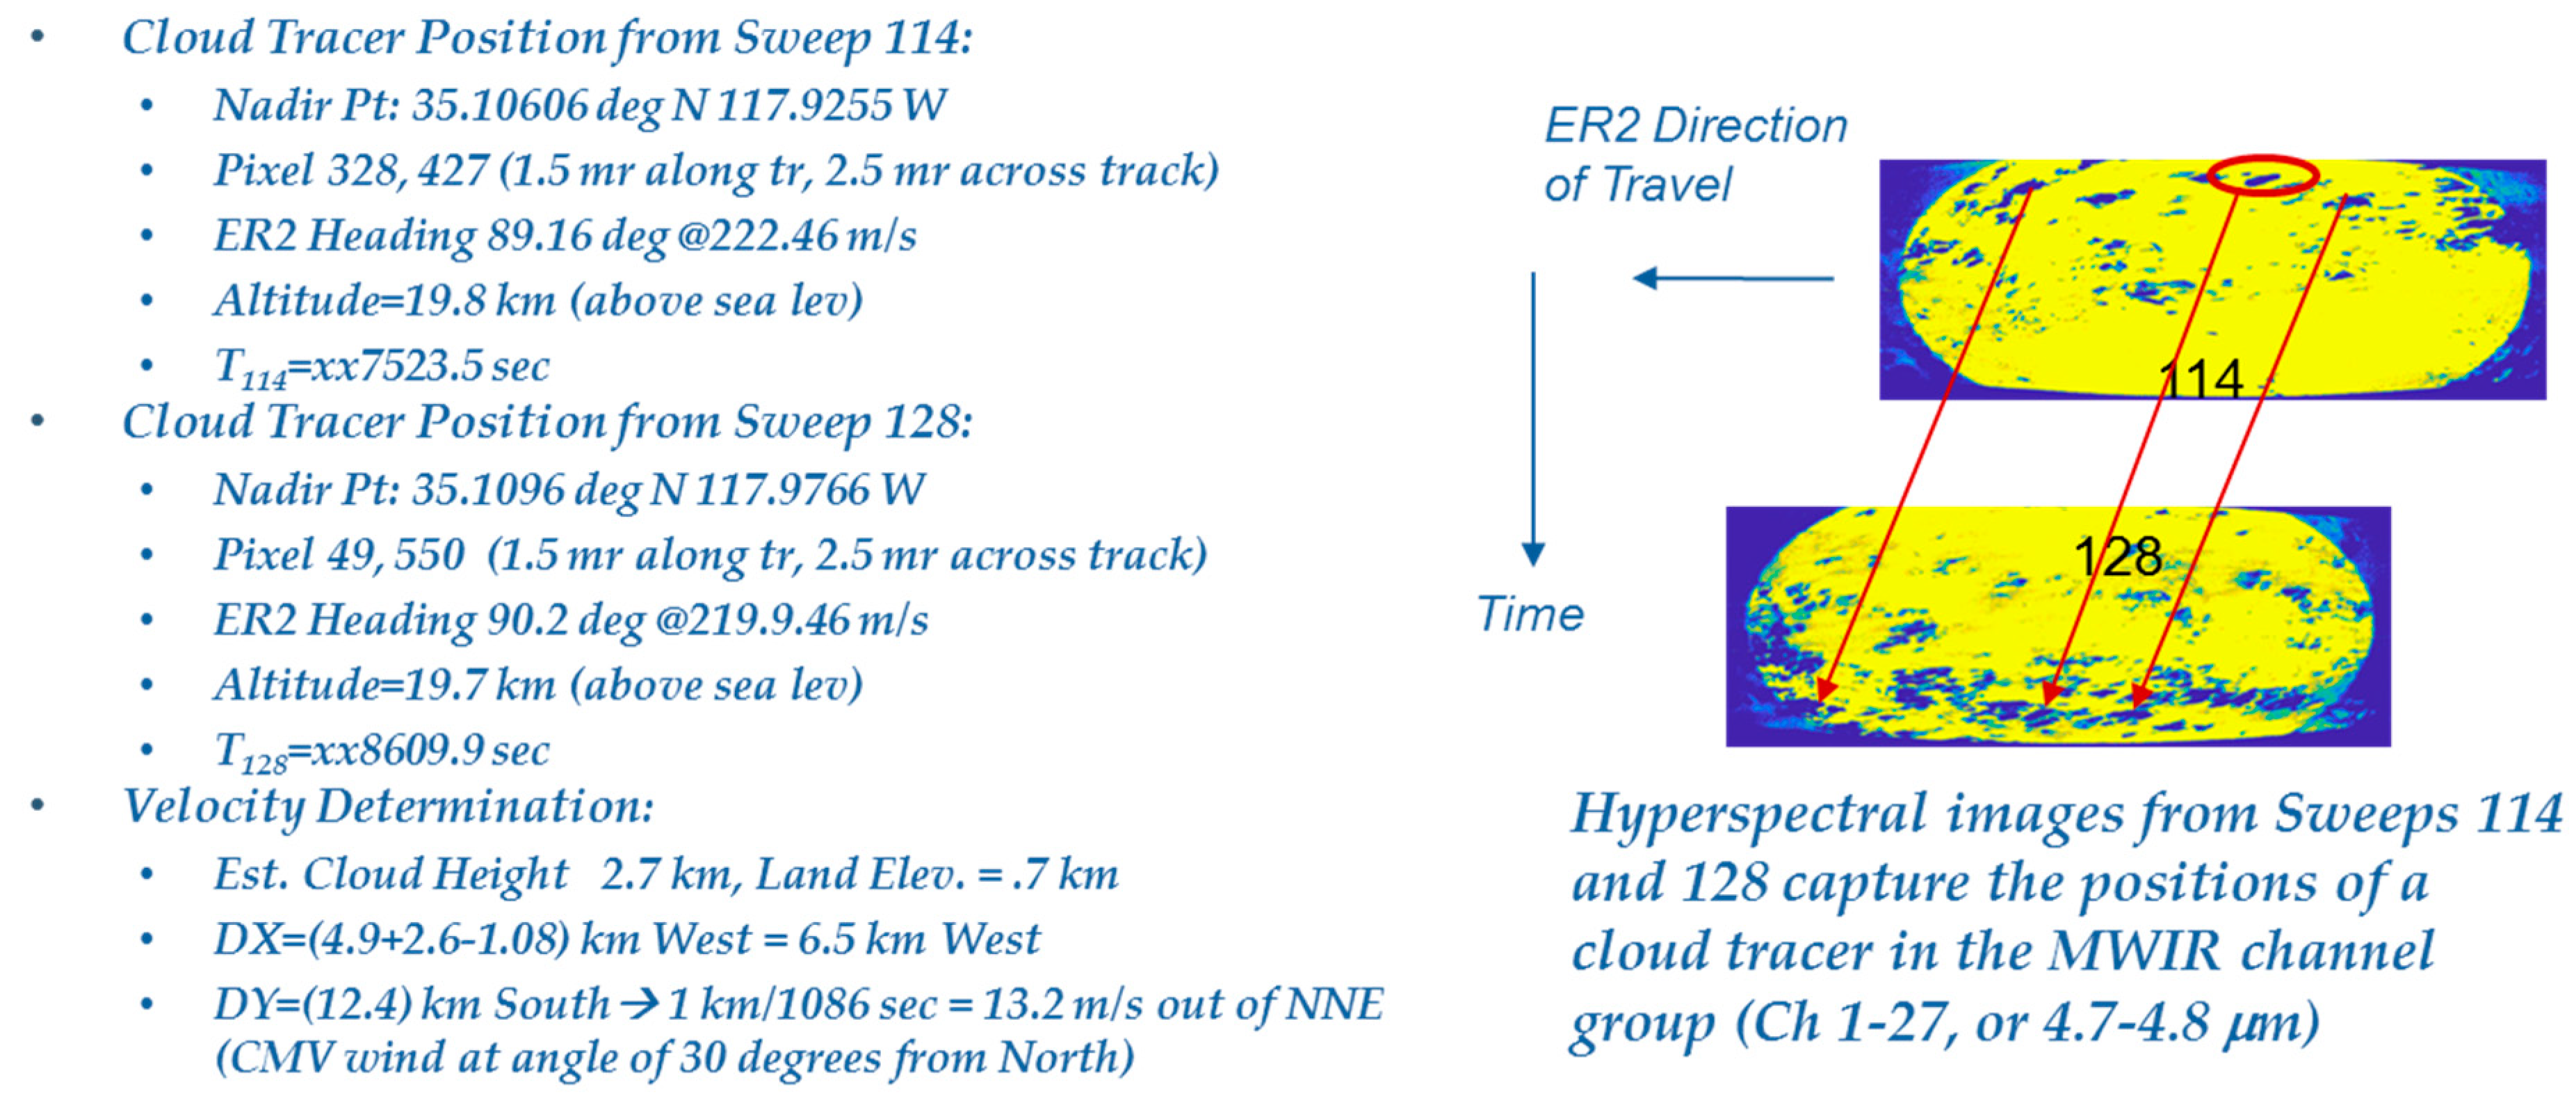
B4. Approach to 2D Wind Vector Identification for MISTiC Airborne Observations

The basic approach to observing the wind employed for MISTiC is the geometrical method first developed for Motion Vector Winds following the introduction of GEO multispectral imagers. The image field is examined for features in the cloud or moisture field that have been moved from one location to another during the time interval, and identifies track-points on these features to allow a quantitative measure of the change. This vector position difference is computed using image data, together with attitude and ephemeris data. In MISTiC Airborne, a feature position is determined from the GPS coordinates of the sweep nadir point, that angular position within the image field, GPS altitude, optics focal length, and FPA pixel size. The wind speed observed is just the magnitude of this vector difference. For the operational GEO AMVs, where thousands of AMVs are derived from a sequence of full-disk images, the manual identification of track-points procedure is too time-intensive, has been replaced by a spatial correlation computation method-but that is not needed, given the relatively much smaller number of image-pairs observed in a MISTiC airborne flight. Moreover, the image pixel-level spatial resolution available from MISTiC airborne is very high (50 m at nadir), compared to that available to GEO MET imagers, simplifying the correct identification of a geometric feature, a wind tracer in multiple positions. Finally, the low altitude of the MISTiC observations and wide angular field introduce substantial geometric distortion of the shape of tracer features as well as a truncation of the feature by the very limited spatial field of view. These are aspects of the images that a human image interpreter can reasonably overcome, but which would pose great difficulties to current automated cross-correlation algorithm. The other critical aspect of the AMV observation is the accurate assignment of height.

B5. Observation Demonstration Flight on 4 December 2017

Following two Engineering Check-out flights in May of 2017, an Observation Demonstration Flight of the MISTiC airborne instrument took place aboard a NASA ER2 on 4 December of 2017. Hyperspectral Imaging/Sounding observations, including some repeat-pass observations were taken over several areas in southern California and the adjacent eastern Pacific, as shown by the flight path in Figure 10. The MISTiC ER2 flight was complemented by RAWINSONDE launches close to the MISTiC over-flight locations and times. Two were conveniently but independently launched from the NWS site on the Vandenberg Air Force Base, and one launched from Edwards Air Force Base by the NASA Armstrong weather support team, with the launch timed to coincide with the MISTiC airborne overpass. These provide an independent observation of the local thermodynamic and wind vertical profile conditions that MISTiC observations can be compared with. Satellite observations, including those from several space-borne hyperspectral sounders are also available for comparison. The near-surface weather conditions were somewhat extreme, with the strong and relatively dry Santa Ana wind speed conditions and potentially high wind-shear conditions prevailing for the MISTiC airborne demonstration flight.

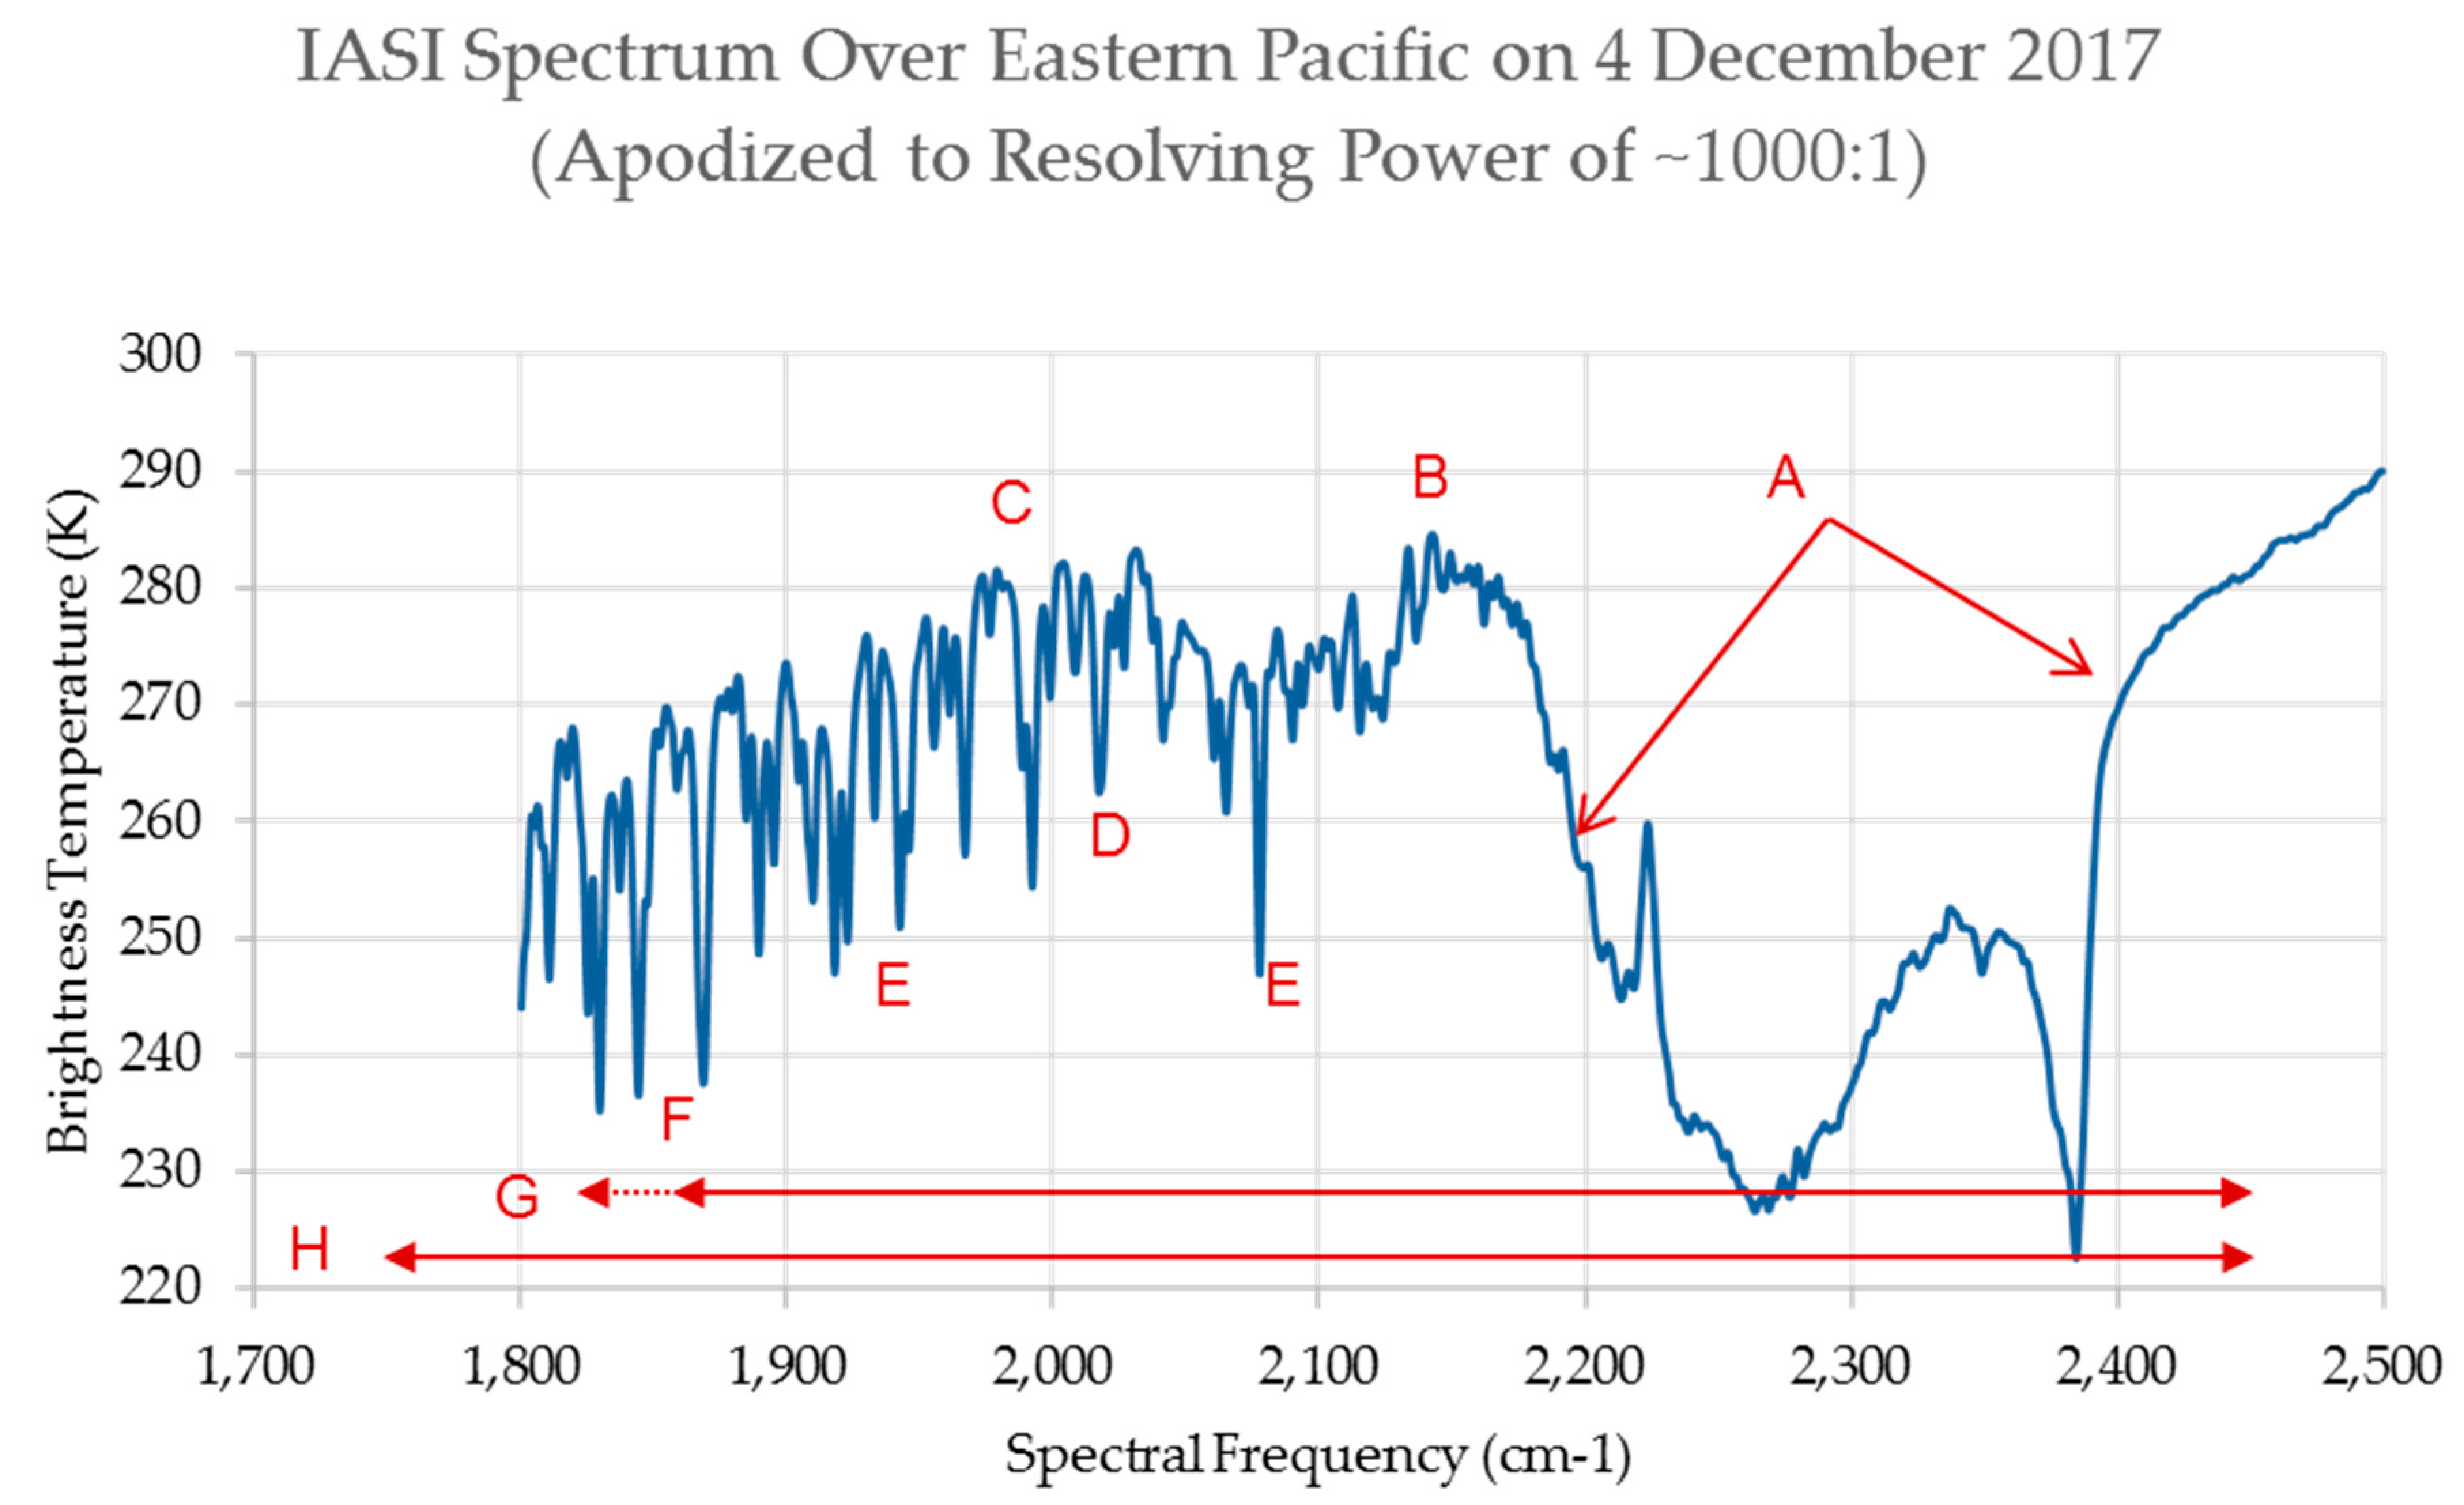
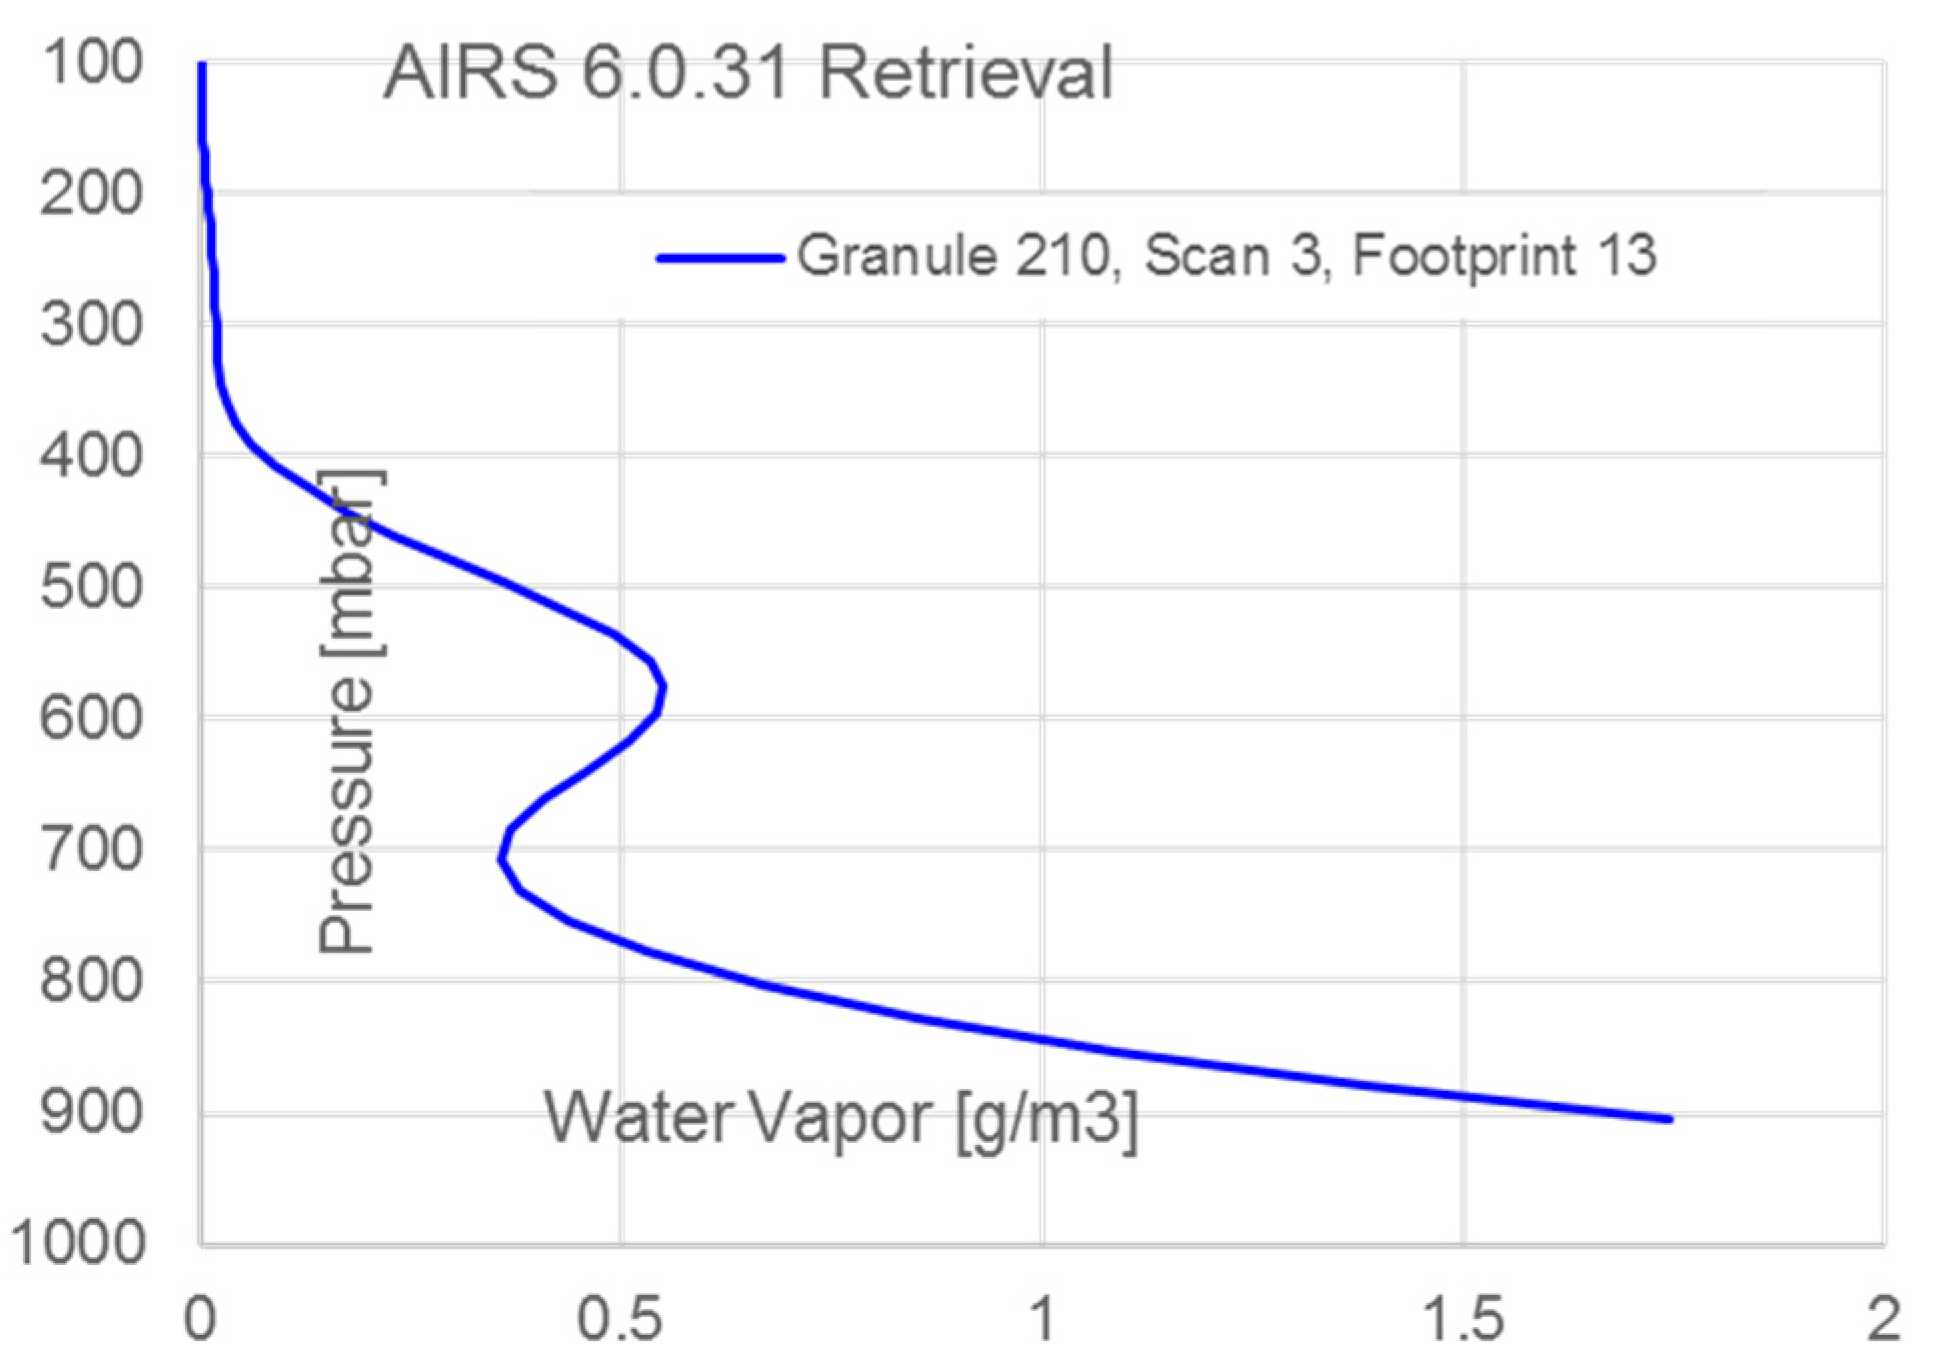
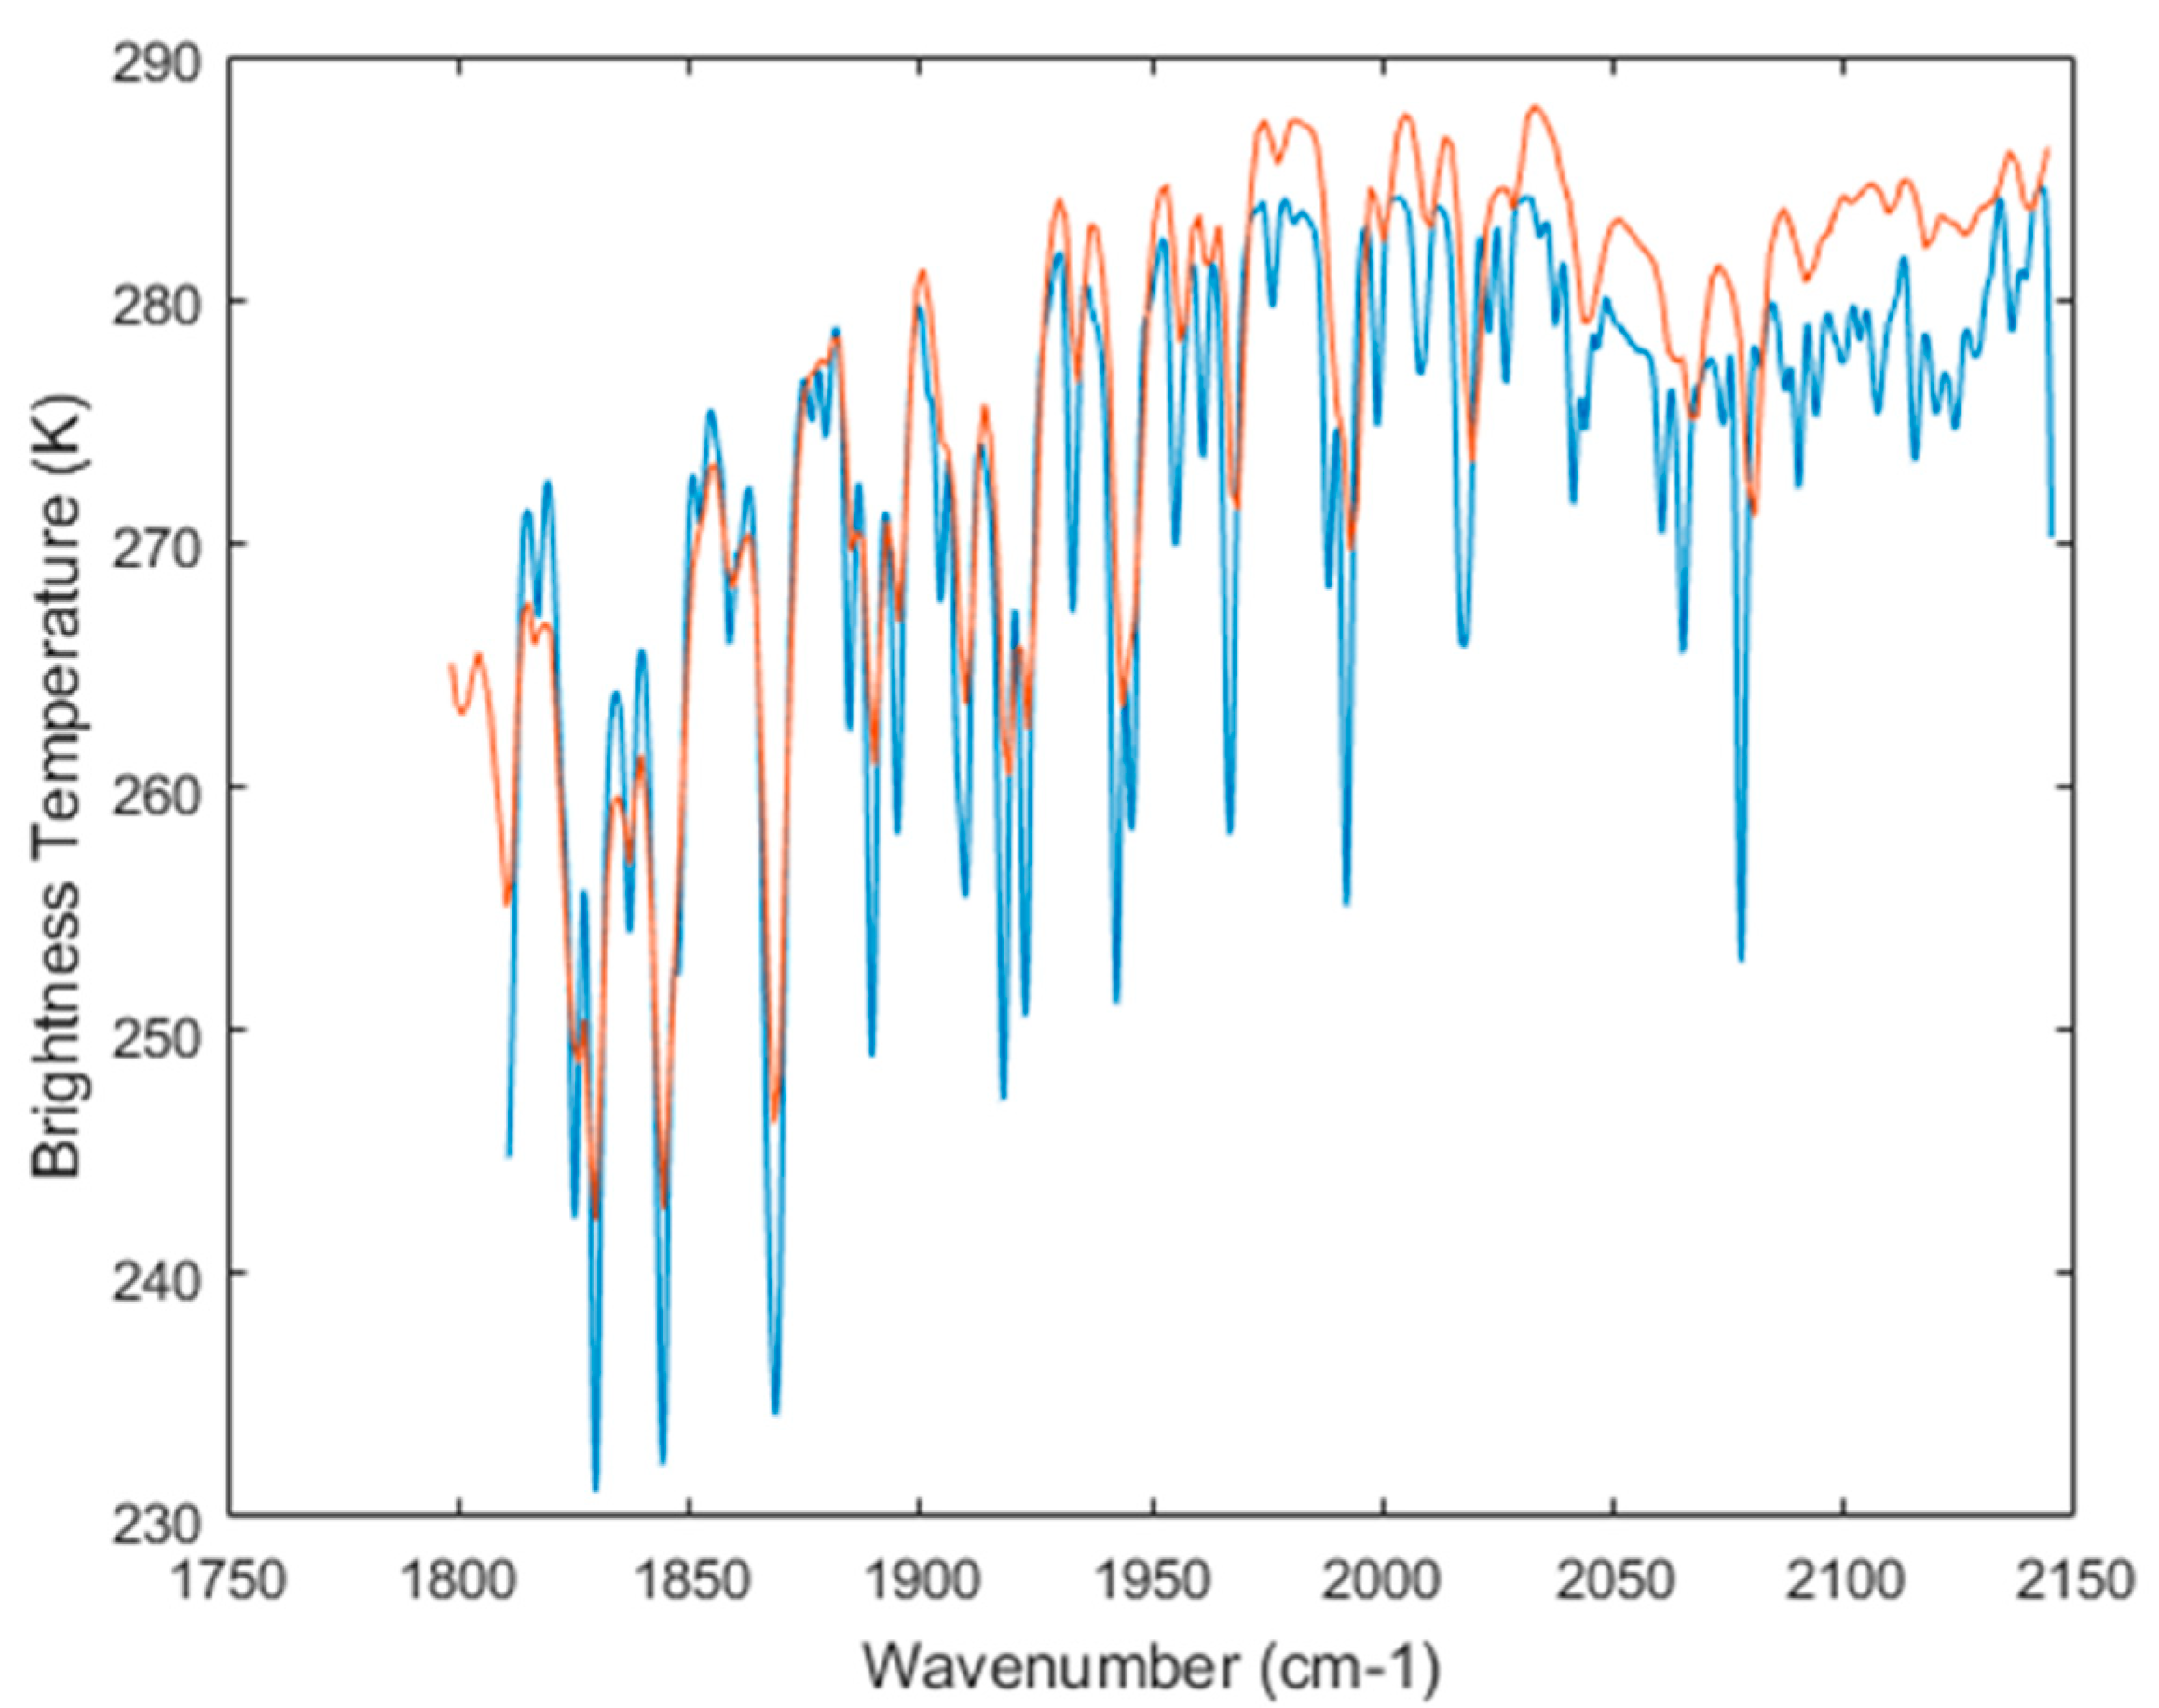
B6. MISTiC Airborne Observation Comparison with IASI over Ocean

A comparison of MISTiC Airborne observations with an IASI-B observation in an adjacent spatial location (the closest cloud-free IASI footprint to the MISTiC observation) approximately one hour earlier is shown in Figure A5. It shows a reasonable correlation of the spectral feature positions in the MISTiC airborne observations with those of IASI. MISTiC radiances in higher brightness-temperature surface-dominated spectral channels above 2150 cm−1 are somewhat higher than those of IASI, most likely due to modest ocean surface warming between the IASI and MISTiC overpass times. However, the apparent spectral resolving power of the MISTiC airborne instrument, during the ER2 flight, is somewhat less than expected when compared with IASI-B spectral observation. The IASI-B data in Figure A5 have been apodized to provide a spectral resolving power (>700:1) for which MISTiC was designed. The laboratory tests of the MISTiC instrument spectral resolving power, with all of the optics operated at the intended temperature range (cryogenic spectrometer, fore-optics near room temperature) shows spectral resolving power measurements matching design projections, so we conclude that the cause of the lower spectral resolving power during the airborne observations lies outside of the spectrometer . One important difference for the MISTiC airborne test conditions is that the fore-optics and dewar assembly were both far colder during the ER2 flight (−5 °C) than expected, and much colder than experienced during the laboratory monochrometer testing. These more extreme temperature conditions outside the spectrometer most likely led to a focus error between the spectrometer and the other elements, resulting in the lower spectral resolving power during the airborne tests. Funding constraints did not allow for adjustments to correct this problem during the IIP, but the situation may be remedied in future flights. An additional difference with IASI is that, at very low radiance levels, the airborne MISTiC observes some additional radiance than IASI. This is most likely due to modest errors in the ER2 window emission correction in the radiometric calibration procedure for MISTiC airborne instrument.
Figure A5. MWIR brightness temperature observed on 4 December over the cloud-clear ocean by the MISTiC airborne (red) instrument on the ER2 south of the Channel Islands, and the closest IASI-B (blue) nearly cloud-clear field observed from space approximately an hour earlier.
Remotesensing 11 02169 g0a5

References

  1. Kidder, S.Q.; Vonder Haar, T.H. Satellite Meteorology: An Introduction; Academic Press: Cambridge, MA, USA, 1995; pp. 233–244. [Google Scholar]
  2. AIRS Atmospheric Infrared Sounder. Available online: https://airs.jpl.nasa.gov/weather_and_climate_sciences/findings (accessed on 5 September 2019).
  3. Thriving on Our Changing Planet: A Decadal Strategy for Earth Observation from Space. Available online: http://nap.edu/24938 (accessed on 5 September 2019).
  4. Baker, W.E.; Emmit, G.D.; Robertson, F.; Atlas, R.M.; Molinari, J.E.; Bowdle, D.A.; Paegle, J.; Hardesty, R.M.; Menzies, R.T.; Krishnamurti, T.N.; et al. Lidar-measured winds from space: A key component for weather and climate prediction. Bull. Am. Meteorol. Soc. 1995, 76, 869–888. [Google Scholar] [CrossRef]
  5. AMV-World Meteorological Organization. Available online: https://www.wmo.int/pages/prog/www/OSY/Meetings/NWP5_Sedona2012/3c5_Daniels.pdf (accessed on 5 September 2019).
  6. Winds of Change in the Use of Atmospheric Motion Vectors in the ECMWF System. Available online: https://www.ecmwf.int/sites/default/files/elibrary/2013/17363-winds-change-use-atmospheric-motion-vectors-ecmwf-system.pdf (accessed on 5 September 2019).
  7. GIFTS: A New Way to Observe Weather in the Changing Atmosphere. Available online: https://www.nasa.gov/centers/langley/news/factsheets/GIFTS.html (accessed on 5 September 2019).
  8. Europe Launches ‘Aeolus’ Satellite on Mission to Map Earth’s Winds. Available online: https://www.space.com/41587-vega-rocket-launches-aeolus-wind-satellite.html (accessed on 5 September 2019).
  9. Maschhoff, K.R.; Polizotti, J.J.; Aumann, H.H.; Susskind, J. MISTiC Winds: A micro-satellite constellation approach to high resolution observations of the atmosphere using infrared sounding and 3D winds measurements. Proc. SPIE 2016. [Google Scholar] [CrossRef]
  10. MISTiC Winds, a Micro-Satellite Constellation Approach to High Resolution Observations of the Atmosphere Using Infrared Sounding and 3D Wind Measurements. Available online: http://cimss.ssec.wisc.edu/iwwg/iww13/proceedings_iww13/papers/session7/IWW13_Session7_5_Maschhoff_final.pdf (accessed on 5 September 2019).
  11. MISTiC Winds, a Micro-Satellite Constellation Approach to High Resolution Observations of the Atmosphere Using Infrared Sounding and 3D Winds Measurements: An Update. Available online: http://cimss.ssec.wisc.edu/iwwg/iww14/talks/04_Thursday/1120_IWW14_MISTiC_Maschhoff.pdf (accessed on 5 September 2019).
  12. Kaplan, L.D. Inference of atmospheric structures from satellite remote radiation measurements. J. Opt. Soc. Am. 1959, 49, 1004–2007. [Google Scholar] [CrossRef]
  13. Aumann, H.H.; Chahine, M.T.; Gautier, C.; Goldberg, M.D.; Kalnay, E.; McMillin, L.M.; Revercomb, H.; Rosenkranz, P.W.; Smith, W.L.; Staelin, D.H.; et al. AIRS/AMSU/HSB on the Aqua mission: Design, science objectives, data products, and processing systems. IEEE Trans. Geosci. Remote Sens. 2003, 41, 253–264. [Google Scholar] [CrossRef]
  14. Le Marshall, J.; Jung, J.; Derber, J.; Chahine, M.; Treadon, R.; Lord, S.J.; Goldberg, M.; Wolfe, W.; Liu, H.C.; Joiner, J.; et al. Improving Global Analysis and Forecasting with AIRS. Bull. Am. Meteorol. Soc. 2006, 87, 891–894. [Google Scholar] [CrossRef]
  15. McNally, A.P.; Watts, P.D.; Smith, J.A.; Engelen, R.; Kelly, G.A.; Thepaut, J.N.; Matricardi, M. The Assimilation of AIRS radiance data at ECMWF. QJR Meteorol. Soc. 2006, 132, 935–957. [Google Scholar] [CrossRef]
  16. Chahine, M.T.; Pagano, T.S.; Aumann, H.H.; Atlas, R.M.; Barnet, C.; Blaisdell, J.; Chen, L.; Divakarla, M.; Fetzer, E.J.; Goldberg, M.; et al. The Atmospheric Infrared Sounder (AIRS): Improving weather forecasting and providing new data on greenhouse gases. Bull. Am. Meteorol. Soc. 2006, 87, 911–926. [Google Scholar] [CrossRef]
  17. Jedlovec, G.J.; Atkinson, R.J. The Marshall Automated Wind algorithm: Error analysis, quality control and climate applications. In Proceedings of the Fourth International Winds Workshop, Huntsville, AL, USA, 1998; pp. 247–254. Available online: https://bit.ly/2lUAeBY (accessed on 18 September 2019).
  18. Introducing Atmospheric Motion Vectors Derived from the GOES-16 Advanced Baseline Imager (ABI). Available online: http://cimss.ssec.wisc.edu/iwwg/iww14/talks/01_Monday/1400_IWW14_ABI_AMVs_Daniels.pdf (accessed on 5 September 2019).
  19. Atlas, R.M. Personal Communication.
  20. Velden, C.S.; Dengel, G.; Dengel, R.; Stettner, D. Determination of wind vectors by tracking features on sequential moisture analyses derived from hyperspectral IR soundings. In Proceedings of the Seventh International Winds Workshop, Helsinki, Finland, 14–17 June 2004. [Google Scholar]
  21. Borde, R.; Hautecoer, O.; Heas, P. Atmospheric Motion Vector Generation from MTG-IRS. In Proceedings of the Assimilation of Hyperspectral Geostationary Satellite Observations Workshop, ECMWF, Reading, UK, 22–25 May 2017. [Google Scholar]
  22. A Blog Description of the HES Program and Its Ultimate Fate. Available online: http://rammb.cira.colostate.edu/training/visit/blog/index.php/tag/hyperspectral-environmental-suite/Ablog description of the HES program and its ultimate fate (accessed on 22 October 2013).
  23. An OSSE Investigating a Constellation of 4–5 μm Infrared Sounders. Available online: https://cimss.ssec.wisc.edu/itwg/itsc/itsc21/program/4december/1400_15.04_McCarty-MISTiC_for_ITSC.pdf (accessed on 5 September 2019).
  24. Santek, D.; Nebuda, S.; Stettner, D. Feature-tracked Winds from Moisture Fields Derived from AIRS Sounding Retrievals. In Proceedings of the 12th International Winds Workshop, Copenhagen, Denmark, 16–20 June 2014. [Google Scholar]
  25. Susskind, J.; Blaisdell, J.; Iredell, L. Significant Advances in the AIRS Science Team Version-6 Retrieval Algorithm. Proc. SPIE 2012. [Google Scholar] [CrossRef]
  26. Tobin, D.C.; Revercomb, H.E.; Knuteson, R.O.; Best, F.A.; Smith, W.L.; Ciganovich, N.N.; Howell, H.B. Radiometric and spectral validation of Atmospheric Infrared Sounder observations with the aircraft-based Scanning High-Resolution Interferometer Sounder. J. Geophys. Res. Atmos. 2006, 111, D9. [Google Scholar] [CrossRef]
  27. Observing System Capabilities Analysis and Review Tool, Observation Requirements. Available online: https://www.wmo-sat.info/oscar/applicationareas/view/2 (accessed on 5 September 2019).
  28. Weather Focus Area Workshop Report (2015). Available online: http://science.nasa.gov/earth-science/focus-areas/earth-weather. (accessed on 5 September 2019).
  29. Baker, E.E.; Atlas, R.; Cardinali, C.; Clement, A.; Emmitt, G.D.; Gentry, B.M.; Hardesty, R.M.; Källén, E.; Kavaya, M.J.; Langland, R.; et al. LIDAR-Measured Wind Profiles: The Missing Link in the Global Observing Systems. Bull. Am. Meteorol. Soc. 2014, 95, 543–564. [Google Scholar] [CrossRef]
  30. Menzel, W.P. Personal Communication.
  31. Beck, J.; Scritchfield, R.; Goodwin, M.; Wood, L.; Ohlson, M.; Skokan, M.; Kinch, M.; Mitra, P.; Wan, C.-F.; Robinson, J.; et al. Performance and Modeling of the MWIR HgCdTe e-APD. J. Electron. Mater. 2009, 38, 1579. [Google Scholar] [CrossRef]
Figure 1. Hyperspectral motion vector winds and infrared (IR) sounding constellations employing low earth orbit sun-synchronous orbit (LEO SSO) constellations. A winds constellation (blue) of three microsatellites in each of two orbital planes provides vertically resolved tropospheric winds and IR soundings globally, every six hours.
Remotesensing 11 02169 g001
Figure 2. Motion vector winds from MODIS, which observes portions of the polar region approximately every 100 min. Wind tracers are identified using automated algorithms that identify trackable features from a sequence of images. The positions and direction are indicated by wind-barbs, with flags encoded for speed. Color indicates approximate altitude of the AMV.
Remotesensing 11 02169 g002
Figure 3. MISTiC Winds IR instrument concept, shown with nadir up (left) and down (right).
Remotesensing 11 02169 g003
Figure 4. Spectral coverage range and resolution for MISTiC was selected to provide IR sounding of the troposphere. Key spectral regions are shown on this example spectrum from IASI, and described in the text. This spectrum that has been filtered so that the spectral feature shapes will be similar to those expected the MISTiC space instrument.
Remotesensing 11 02169 g004
Figure 5. A spectral range trade study using atmospheric infrared sounder (AIRS) Version 6 retrievals for a diverse set of cloud-clear footprints over the Pacific showed that a lower spectral range cutoff of 1750 cm−1 provided a good vertical coverage with needed accuracy for tropospheric temperature and water vapor.
Remotesensing 11 02169 g005
Figure 6. A combination of key requirements changes (focusing on tropospheric sounding), instrument design innovation and key technology advances enable a dramatic reduction in instrument size between AIRS instrument (left) and MISTiC , shown as an artist’s concept (right).
Remotesensing 11 02169 g006
Figure 7. MISTiC IR spectrometer opto-mechanical concept shown in cut-away.
Remotesensing 11 02169 g007
Figure 8. MISTiC Winds instrument radiometric sensitivity performance estimates show solid margin against the adopted requirements in Table 1. MISTiC radiometric sensitivity requirements are comparable to those of AIRS, which required NEΔT < 200 mK, referenced to 250 K scene temperature.
Remotesensing 11 02169 g008
Figure 9. Detailed (1000-node) thermal model analysis of passively cooled spectrometer temperature stability for worst-case sun-synchronous orbit shows substantial margin against requirements for stable IR sounder spectral calibration.
Remotesensing 11 02169 g009
Figure 10. Flight path for NASA ER2 (carrying MISTiC airborne instrument) on 4 December 2017 included hyperspectral imaging observations of wind, temperature, and water vapor over the Channel Islands and nearby ocean, and over Vandenberg and Edwards Air Force Bases where radiosondes that provided an independent observation of weather conditions were launched.
Remotesensing 11 02169 g010
Figure 11. Cloud positions observed from the MISTiC airborne instrument over Edwards Air Force Base during two over-passes, allowing determination of the cloud motion vector wind velocity at cloud level.
Remotesensing 11 02169 g011
Figure 12. 4 December 2017 21:30Z radiosonde observation over Edwards AFB and related MISTiC airborne observations for cloud motion vector winds. The radiosonde observations and MISTiC observations provide a consistent and physically sensible picture of the local thermodynamic and wind environment.
Remotesensing 11 02169 g012
Figure 13. Spectra for a portion of the radiance image (for channel 112, near 5.068 μm) near a cloud feature used for cloud-motion-vector observation. The radiance contrast in the image (left) has been expanded and shifted to show the higher brightness temperature of the water vapor field which surrounds the cloud. The brightest regions in the image are those without cloud and with low water vapor concentration. The spectra shown (right) are 10×10 pixel averages in the cloud, moist air, and dry air regions (surface emission-dominated) areas in the image.
Remotesensing 11 02169 g013
Figure 14. Clouds (and surrounding low-level water vapor field) under a higher-level water vapor field near Edwards Air Force Base were observed in a set of radiance images. Images from the spectral channels shown are a window channel (71, near 4.919 μm) first with broader radiance range-and then narrowed range to highlight clouds) and images for spectral channels near local spectral radiance minima caused by water vapor absorption and emission, which show a sequence of decreasing average radiance with increasing wavelength, as shown at right in Figure 13. (Channels 64→80→98→115, or 4.894, 4.952, 5.017, and 5.079 μm respectively are shown ). An area of moist air aloft, distinct from a dryer area (indicated in the lowest panel on the right), becomes increasingly apparent as spectral channels with increasing water vapor absorption strength are viewed.
Remotesensing 11 02169 g014
Figure 15. Radiosonde data during MISTiC Edwards over-flight (left) and MISTiC airborne MWIR spectra for areas of dry air and moist air aloft in sweep 114 (right). Spectral channels showing the greatest differences between dry and moist areas in Figure 14 are in the longer wavelength portions of the band that are most sensitive to higher-level water vapor. This is consistent with the high dew-point temperature layer aloft shown in the radiosonde data.
Remotesensing 11 02169 g015
Figure 16. AIRS water vapor retrievals for a cloud-free sounding closest to the Edwards Air Force Base radiosonde and MISTiC airborne data. The area of high water vapor concentration peaking near 560 hPa (4546 m) is consistent with the Edwards radiosonde data in Figure 15 and the presence of a higher-altitude region of higher water vapor concentration apparent in the images in Figure 14.
Remotesensing 11 02169 g016
Table 1. Key MISTiC instrument requirements.
MISTiC Key Instrument Performance Requirements
Instrument CharacteristicValueComments
Minimum Spectral Frequency1750 cm−15.72 μm
Maximum Spectral Frequency2450 cm−14.082 μm
Spectral Sampling~2:1~580 spectral samples
Spectral Resolving Power > 700:1 ν/δν (similar to CrIS-Apodized)
Spectral Calibration Knowledge1/100,000δλ/λ
Angular Sampling (Spatial Sampling)0.0016 radians x 0.0016 radians1.38 km (@ Nadir)
Orbital Altitude and Orbit Type705.3 km Polar/Sun-Synchronous
Angular Range (cross-track)1.570 radians90 Degrees—Same as AIRS
Spatial Resolution<3.0 km (geometric mean)@ Nadir
Radiometric Sensitivity<200 mK (Ref 250 K scene)(<150 mK @ 2380 cm−1)
Radiometric Accuracy<1%@ 300 K Scene Background
Table 2. Key vertically resolved wind and thermodynamic profile observation requirements.
MISTiC Winds Key Observation RequirementsValue
Vertically Resolved Motion Vector Winds
(Water Vapor and Cloud Motion Vectors)
Layer Wind Speed Uncertainty<2 m/s rms (Lower Troposphere)
<3 m/s (High Troposphere)
Layer Wind Direction Uncertainty (above 10 m/s)<10 degrees rms
Layer Height Pressure Height Assignment Accuracy<30 hPa rms (assuming 850–200 hPa wind shear <20 m/s)
Layer Effective Vertical Thickness <100 hPa (FWHM)
Minimum Pressure Height of Highest Level 350 hPa (WV)/500 hPa (C)
Tracer Potential Density (Cloud-Free Conditions for Water Vapor Motion Vector, Cloud Contrast for Cloud Motion Vector) >1 per 6 km2 per vertical layer (Water Vapor-nadir)
>1 per 150 km2 per layer (Cloud AMVs @ nadir)
Temperature Vertical ProfileLayer Effective Vertical Thickness >100 hPa (~1 km)
Layer Temperature Accuracy<1 .25 K (Lower Troposphere)
Layer Water Vapor Concentration Accuracy<15% (Lower Troposphere)
Sounding Measurement Potential Density>1 per 6 km2
Observation FrequencyObservation Refresh Period<6 h (two planes, each with three instruments)

