Burn Severity and Post-Fire Land Surface Albedo Relationship in Mediterranean Forest Ecosystems


1
Electronic Technology Department, University of Valladolid, Paseo Cauce, 59, 47011 Valladolid, Spain
2
Sustainable Forest Management Research Institute, University of Valladolid-INIA, 34004 Palencia, Spain
3
Agrarian Science and Engineering Department, University of León, Av. Astorga s/n, 24400 Ponferrada, Spain
4
Area of Ecology, Faculty of Biological and Environmental Sciences, University of León, 24071 León, Spain
*
Author to whom correspondence should be addressed.
Remote Sens. 2019, 11(19), 2309; https://0-doi-org.brum.beds.ac.uk/10.3390/rs11192309
Submission received: 5 August 2019
/
Revised: 24 September 2019
/
Accepted: 2 October 2019
/
Published: 3 October 2019
Abstract
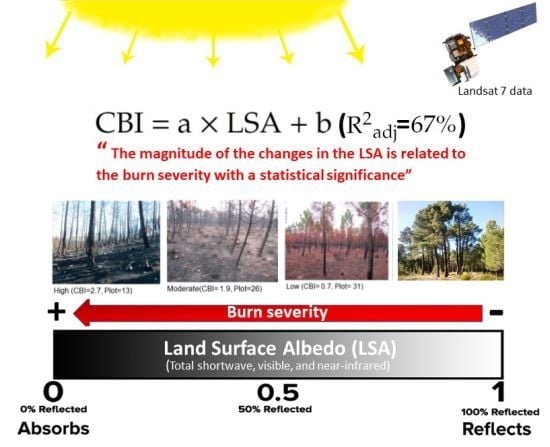
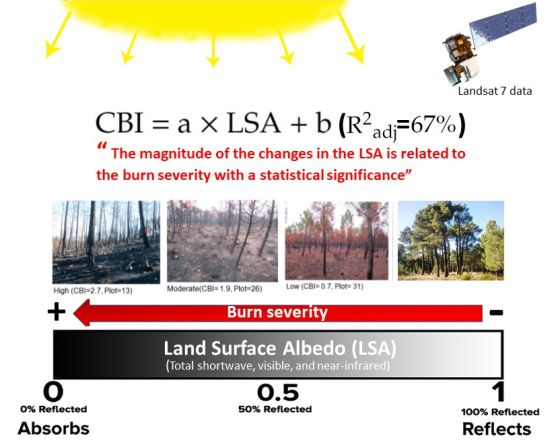
:Our study explores the relationship between land surface albedo (LSA) changes and burn severity, checking whether the LSA is an indicator of burn severity, in a large forest fire (117.75 km2, Spain). The LSA was obtained from Landsat data. In particular, we used an immediately-after-fire scene, a year-after-fire scene and a pre-fire one. The burn severity (three levels) was assessed in 111 field plots by using the Composite Burn Index (CBI). The potentiality of remotely sensed LSA as an indicator for the burn severity was tested by a one-way analysis of variance, correlation analysis and regression models. Specifically, we considered the total shortwave, visible, and near-infrared LSA. Immediately after the fire, we observed a decrease in the LSA for all burn severity levels (up to 0.631). A small increase in the LSA was found (up to 0.0292) a year after the fire. The maximum adjusted coefficient of determination (R2adj) of the linear regression model between the immediately post-fire LSA image and the CBI values was approximately 67%. Fisher’s least significance difference test showed that two burn severity levels could be discriminated by the immediately post-fire LSA image. Our results demonstrate that the magnitude of the changes in the LSA is related to the burn severity with a statistical significance, suggesting the potentiality of immediately-after-fire remotely sensed LSA for estimating the burn severity as an alternative to other satellite-based methods. However, the persistency of these changes in time should be evaluated in future research.
1. Introduction
Fires recurrently affect Mediterranean forest ecosystems, affecting important biodiversity [1]. Severe wildfires adversely impact on water and environmental resources as well as on human life and property. Additionally, fires may also modify the air circulation and the cloud development and reduction, causing changes in the Earth surface albedo [2,3].
Accurately distinguishing different burn severity levels is fundamental for restoration practices [4]. Among field methods for evaluating the burn severity, the composite burn index (CBI) [5] has been commonly accepted, and is now considered a standard [6,7]. Sensors on board satellites may, however, provide accurate data to obtain regionally comprehensive information on the fire activity, severity and its potential effects, in less time [8,9,10]. Therefore, remote sensing techniques are becoming key instruments for burned area and burn severity mapping [6]. Among remote sensing methods for assessing the severity, spectral indices-based procedures are commonly used due to their computational simplicity and easy implementation [11,12,13]. Furthermore, most work on post-fire damage is derived from Landsat imagery, mainly because of its adequate spatial resolution [14]. In particular, the method proposed by Key and Benson [5], based on the difference of pre- and post-fire Normalized Burn Ratio (dNBR) images, has been recognized as a standard method to estimate the burn severity from satellite data. It contemplates the short-term effects of fire from an immediately-after-fire NBR image (initial assessment) and the long-term effects from an NBR image a year after a fire (extended assessment).
Fire leads to short- and long-term effects on other remotely-sensed variables as well. The Land Surface Albedo (LSA) depends on solar illumination, and the state and quantity of vegetation [15]. Fire has a significant effect on vegetation (both the quantity and state) and modifies the landscape, covering the surface with residues (black, grey and white) [16]. This surface blackening leads to a reduction in LSA immediately after a fire [17,18,19,20]. Furthermore, the amplitude of this reduction is determined by the burn severity [18]. However, long-term changes in the LSA due to wildfire may be associated with the common substitution of low LSA forests with grasslands and shrublands that have a higher LSA [19].
Changes in LSA caused by fires vary in relation to ecosystems [19]. Boreal forests have been the study area of most studies on LSA and wildfires [21,22]. Similarly, most of these studies have been based on Moderate Resolution Imaging Spectroradiometer (MODIS) data. The aim of our work is to study the influence of the burn severity on post-fire LSA values and to evaluate the potential use of LSA in identifying burn severity levels in a Mediterranean forest ecosystem (from uni- and multi-temporal approaches). Like Key and Benson [5], we considered two scenarios: immediately after a wildfire and a summer after a wildfire. Some studies related the LSA to the burn severity levels (see [17]); however, the present study is the first to try to relate both variables using Landsat 7 Enhanced Thematic Mapper (ETM+) data and the direct field burn severity measured by CBI. Our hypothesis is that LSA values could be used as an indicator of the fire severity during the first year after fire (initial and extended assessment), as they include more spectral information than commonly used spectral indexes based just in two Landsat 7 spectral bands.
2. Materials and Methods
2.1. Materials
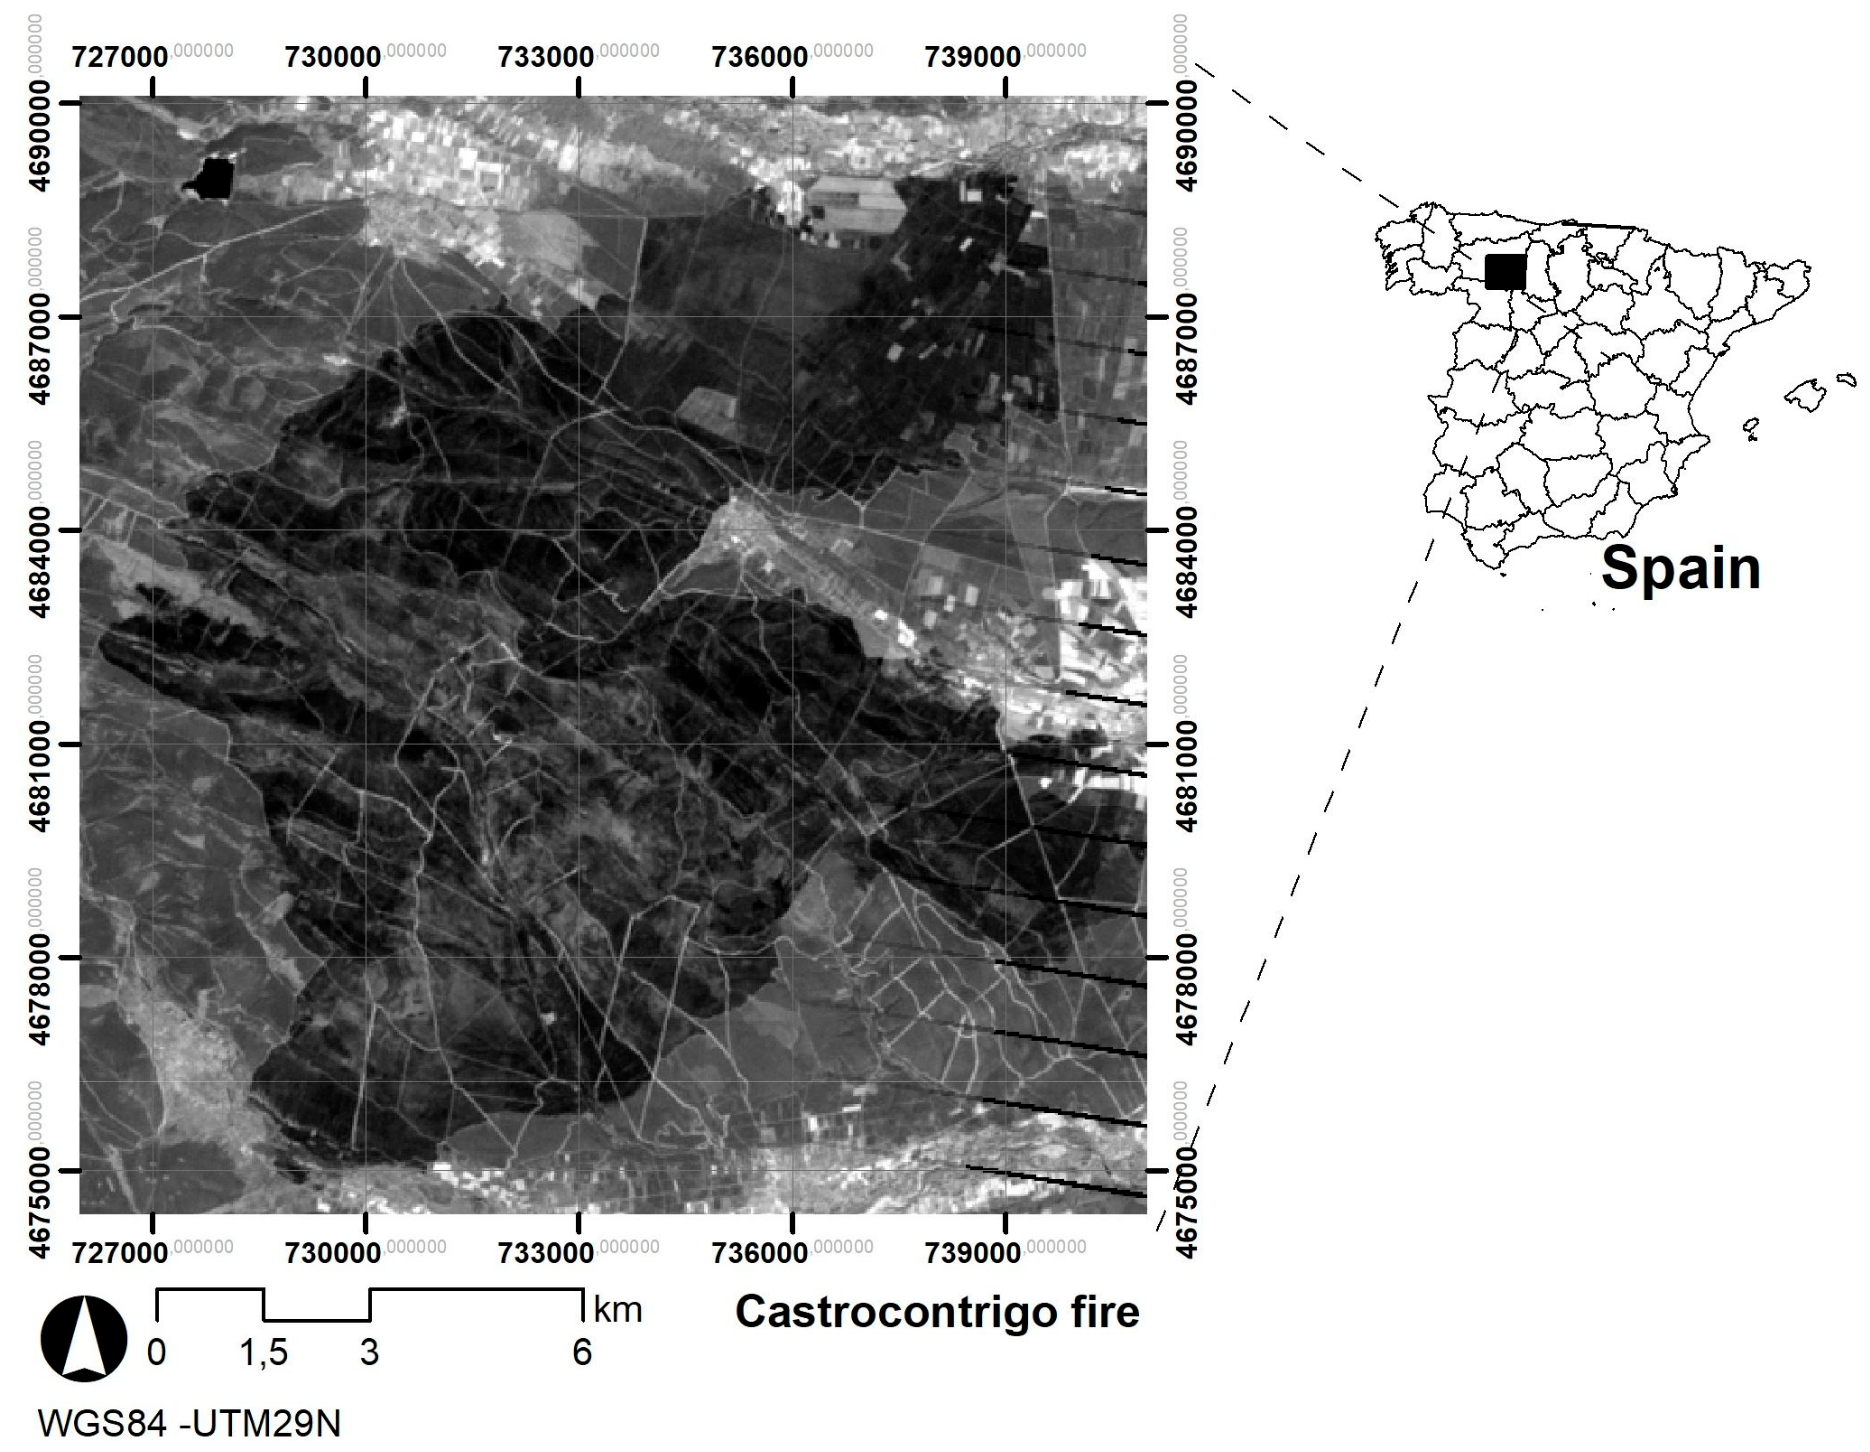
Our study area is located in northwestern Spain, in the Autonomous Community of Castile and León (specifically in Castrocontigo), (Figure 1). In 2012, a fire burned 117.75 km2 between August 19th and August 21st. The fire appeared in the annual report by the Joint Research Centre of the European Commission as one of the largest fires in Europe in 2012 [23]. The pre-fire land-cover map of the burned area (from the Third Spanish National Forest inventory) indicates that Pinus pinaster Ait. covered 73% of burn scar and that shrubs covered 10%.
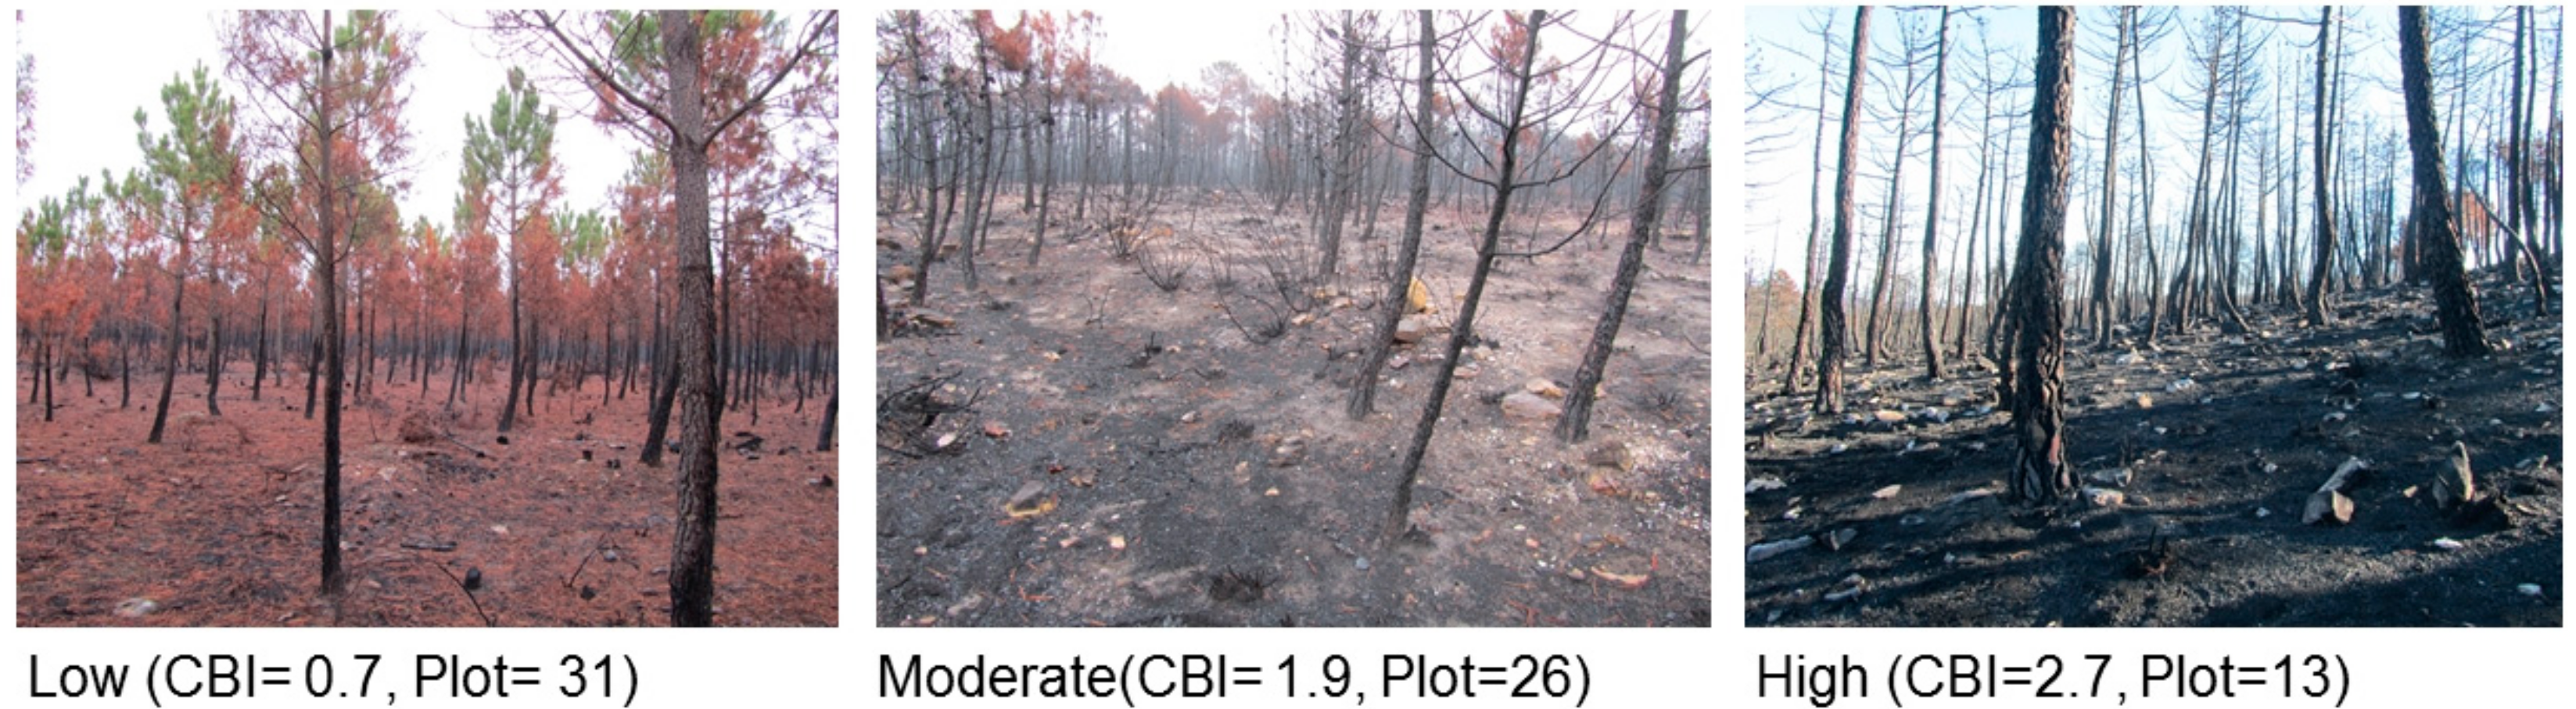
Following the methodology proposed by Key and Benson [5], an initial map of the burn severity (three levels) was computed based on the difference between the pre- and post-fire Normalized Burn Ratio images (dNBR). This initial burn severity map helped in defining the location of the field plots. We measured the burn severity in 111 30-m-diameter circular plots in the field 9-12 weeks after the fire by using CBI. The plots were established in areas of homogeneous stratification (having the five strata defined by the field protocol proposed by Key and Benson [5]), density and species and with similar burn severity levels (according to the initial burn severity map based on dNBR). (See [5] for more details). The number of studied plots was proportional to the extent of each burn severity class: 47 high severity plots, 29 moderate, 8 low, and 27 unburned plots). We set the CBI thresholds halfway between the values recommended by Miller and Thode [24] for the low, moderate and high categories. Specifically: high severity (2.25–3.00), moderate severity (1.25–2.24), low severity (0.10–1.24), and unburned (0.00). The photographs in Figure 2 illustrate the considered burn severity levels. It should be taken into account, however, that they are just an example of each burn severity level.
Three Landsat-7 ETM+ scenes (path/row 203/31) were downloaded from the US Geological Survey (USGS) (http://earthexplorer.usgs.gov/): 19 October 2010, 6 September 2012, and 9 September 2013. We tried to choose the same date of acquisition to keep the changes in illumination and their effects on the LSA to a minimum. Our study area was situated in the center of the Landsat-7 ETM+ scenes. Thus, we did not establish any CBI ground plots in the affected area by the Scan Line Corrector (SCL) malfunction of the sensor.
2.2. Methods
First, we windowed the downloaded Landsat 7 ETM+ scenes to our study area. We used the C-correction algorithm [25] to topographically normalize and atmospherically correct the subset images. Next, we scaled the reflective bands to surface reflectance. The image-based cosine of the solar transmittance (COST) method [26] was used to that end.
Second, we calculated the LSA from the surface reflectance images based on Liang [27] and Liang et al. [28], as their results showed very good agreement between the field measurements and their predictions (the average residual error was lower than 0.02). Often, the spectral dependence of the surface reflection is simplified by exclusively using the spectral regions where the surface reflectance is approximately constant [29]. Similarly, its angular dependence is reduced to the two components of incident light: 1) direct beam: sunlight that has not been scattered or absorbed; and 2) diffuse beam: sunlight that has been scattered and whose incidence with zenith angles is significantly different from the direct beam zenith angles [29]. Thus, in this study we calculated the total shortwave broadband LSA (LSAshort), total visible broadband LSA (LSAvis) and total near infrared (NIR) broadband LSA (LSANIR). Additionally, we computed the direct and diffuse albedos for LSAvis and LSANIR (see [27] for the detailed equations).
Third, we subtracted the post-fire LSA images from the pre-fire LSA images (dLSA) to evaluate the influence of the burn severity on the LSA images from a multitemporal point of view. We considered the 2010 Landsat 7 ETM+ image as a pre-fire reference. As post-fire LSA images, we used Landsat 7 ETM+ September 2012 (immediately after fire) and September 2013 (one year after fire). Next, a mean 3 x 3 filter was applied to both LSA and dLSA images, and the digital values for the 111 ground plots were extracted. Finally, a one-way analysis of variance (ANOVA) and Fisher’s Least Significant Difference (LSD) were used to check whether the post-fire LSA allowed us to differentiate three burn severity levels. In order to analyze the relationship between the LSA images and CBI values, we used a Pearson correlation analysis and linear regression models [30]. The adjusted coefficient of determination (R2adj) was used to evaluate the performance of the post-fire LSA images. We performed the same statistical treatments (ANOVA, regression model), but from a multi-temporal perspective, testing whether or not the LSA variations between the pre- and post-fire situations enable one to discriminate the burn severity levels that are to be determined.
3. Results
We observed a decrease in the LSA immediately after the fire (Table 1). LSAshort decreased from 0.1041 (unburned) to 0.0820 (high burn severity) and LSANIR from 0.1633 to 0.1129. A year after the fire (September 2013), the LSA increased (exceeding its pre-fire value, up to 0.1321 for LSAshort and 0.1963 for LSANIR, for the high severity level). The increase in the post-fire 2013 LSA values was higher for the moderate severity level than for the high one (Table 1). The mean LSAshort value for the moderate severity level was 0.1398, and it was 0.1321 for the high severity level; similarly, the same pattern was observed in all of the other LSA types. This trend (a decrease in LSA immediately after the fire and an increase in LSA a year after the fire) can also be observed in the dLSA images (see Table 3).
We observed significant differences (p-value < 0.05) between the mean unburned values and the rest of the burn severity levels for all the LSA images in the immediately-after-fire image. The LSAshort and LSANIR (total, diffuse and direct) images also allowed us to distinguish two levels of burn severity with a statistical significance. A year after the fire (Table 1), we observed significant differences between the burned and unburned values for the LSAshort and LSAvis (total, diffuse and direct) images. However, the LSANIR (total, diffuse and direct) images did not discriminate between the unburned and low severity level classes, and the LSANIR-diffuse images did not distinguish the burned from the unburned classes (Table 1).
As none of the 2013 LSA images discriminated burn severity levels (there are only significant differences between unburned and burned), we calculated the regression models only for the immediately post-fire LSA images (September 6th, 2012) (Table 2). All the immediately post-fire LSANIR images (total, diffuse and direct) had an R2adj higher than 62% (specifically, LSANIR diffuse had 67%), and LSAshort had an R2adj of 50%. However, the R2adj of the regression models between the LSAvis images (total, diffuse and direct) and the CBI values were approximately zero.
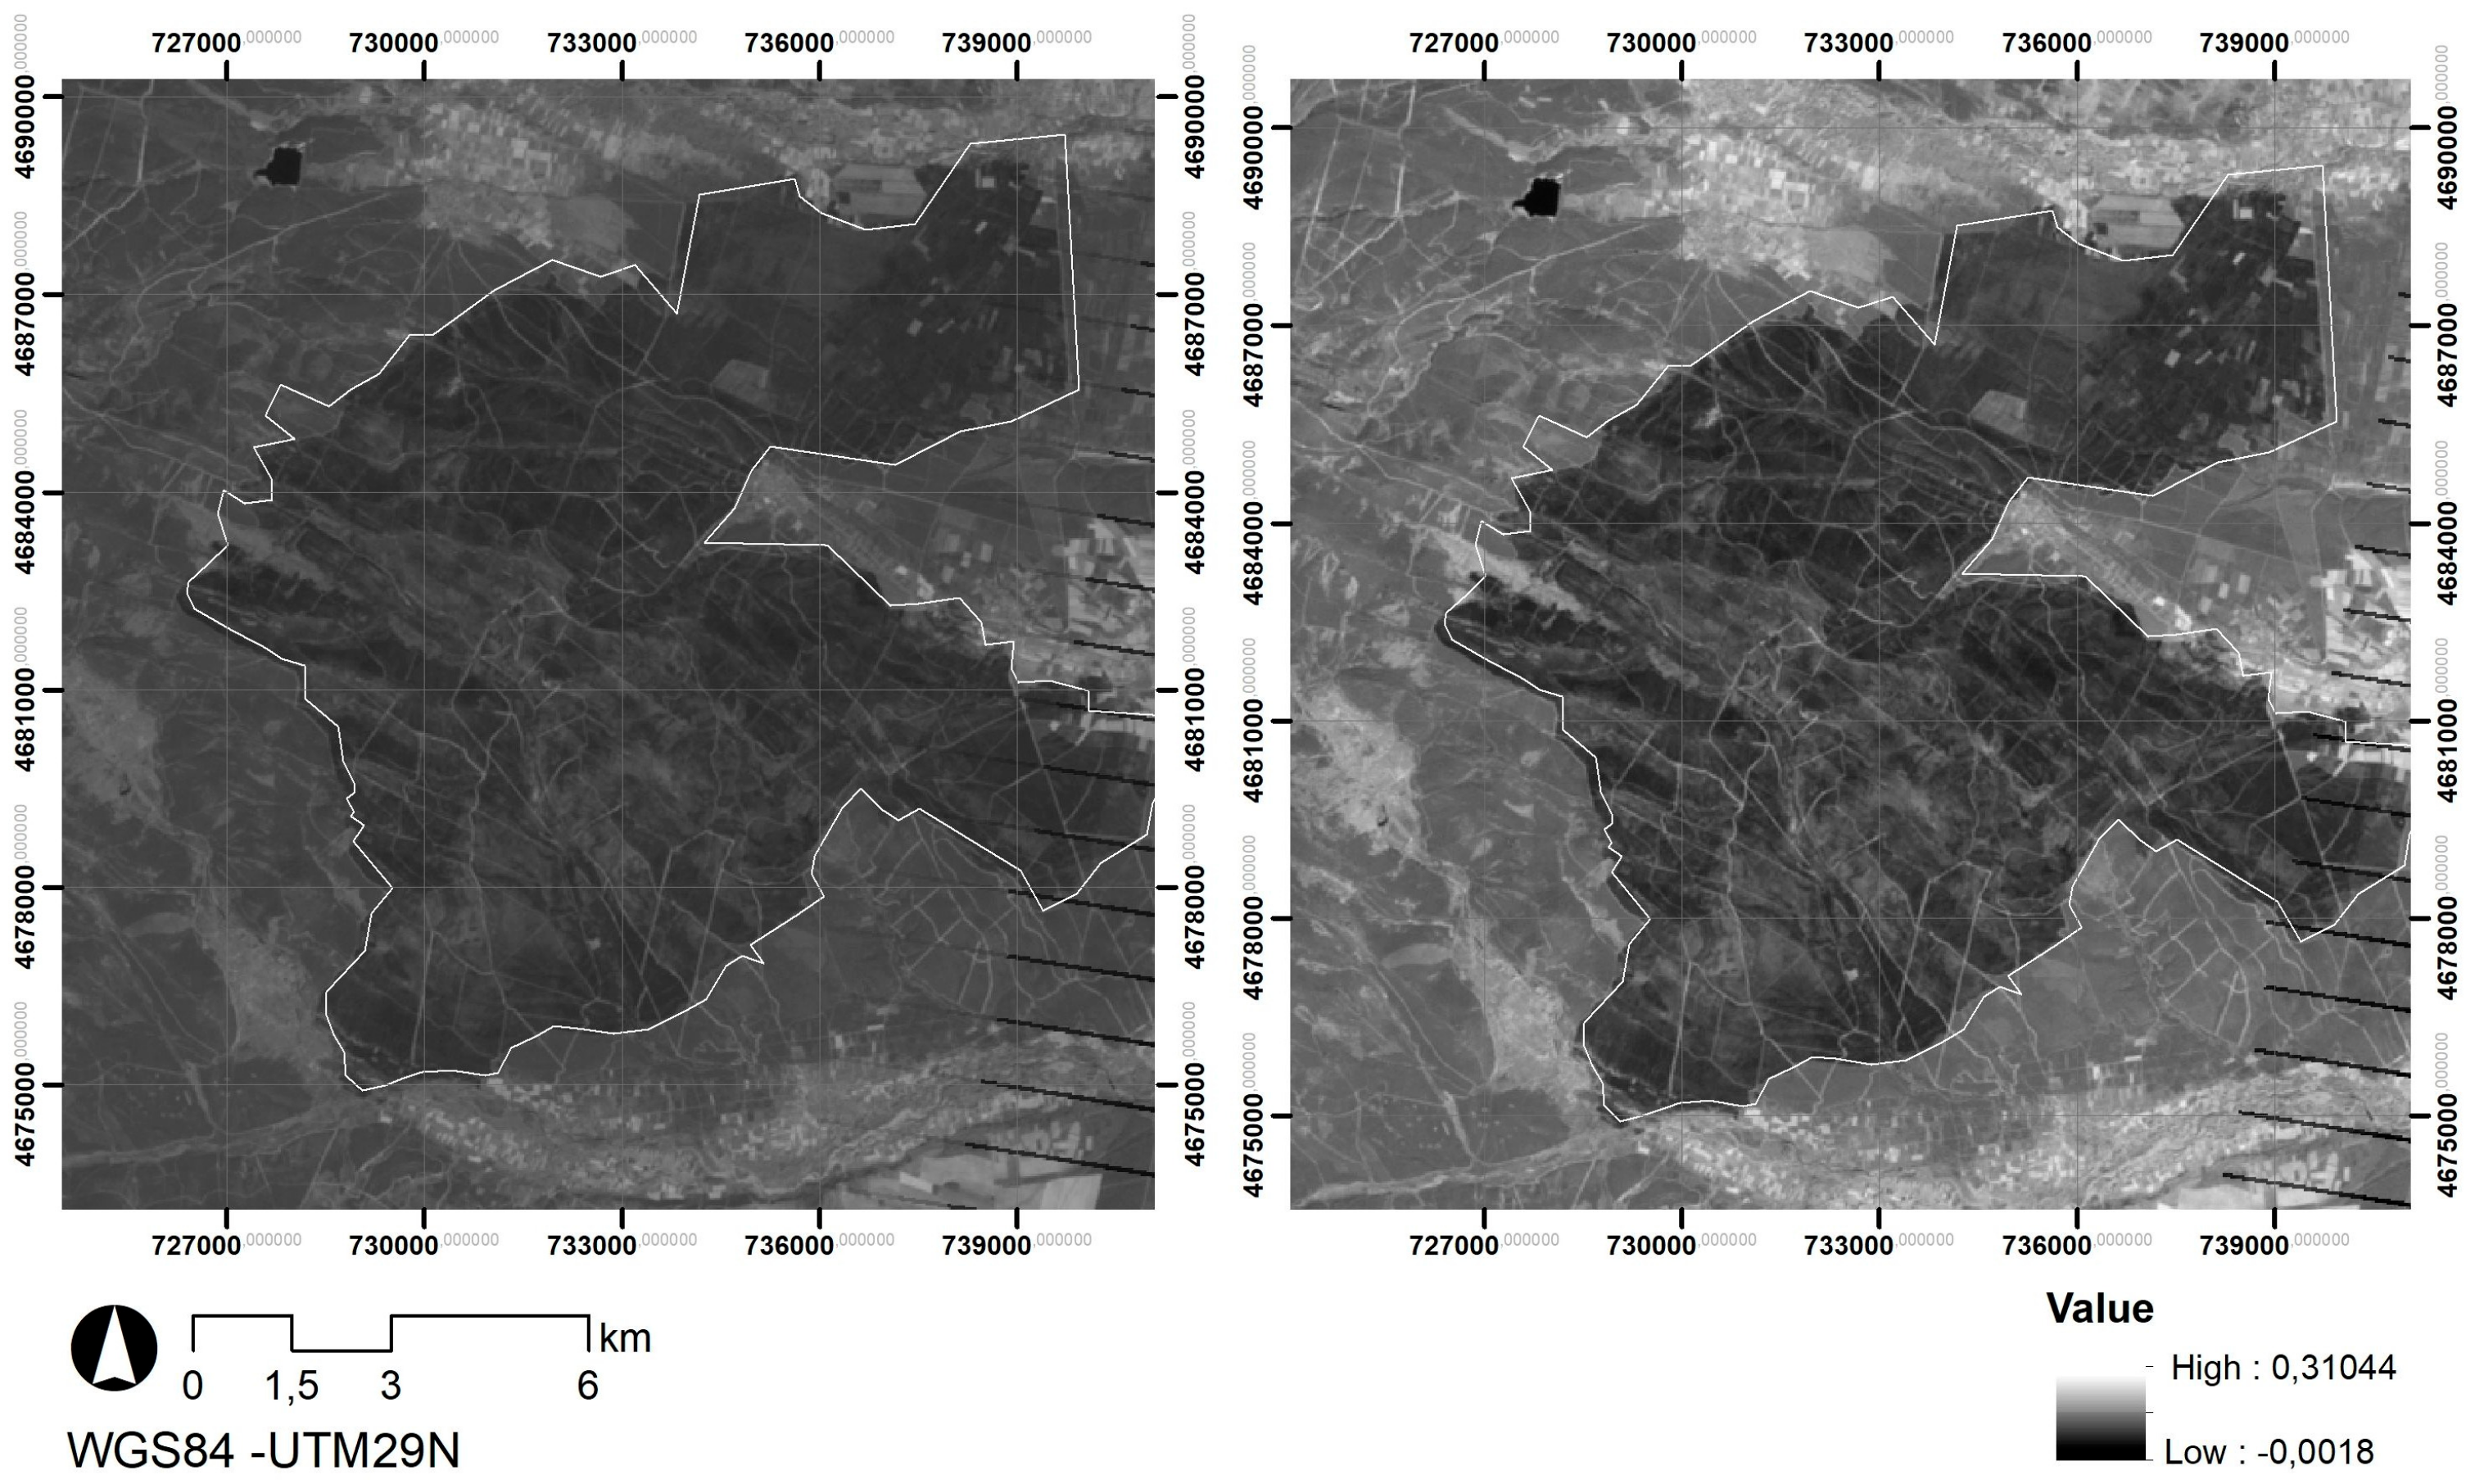
The spatial values of the immediately post-fire LSAshort and LSANIR images are displayed in Figure 3. In both images, it is possible to visually distinguish the burned from the unburned areas. In addition, we can observe some spatial variations in the burned area, mainly in the LSANIR image.
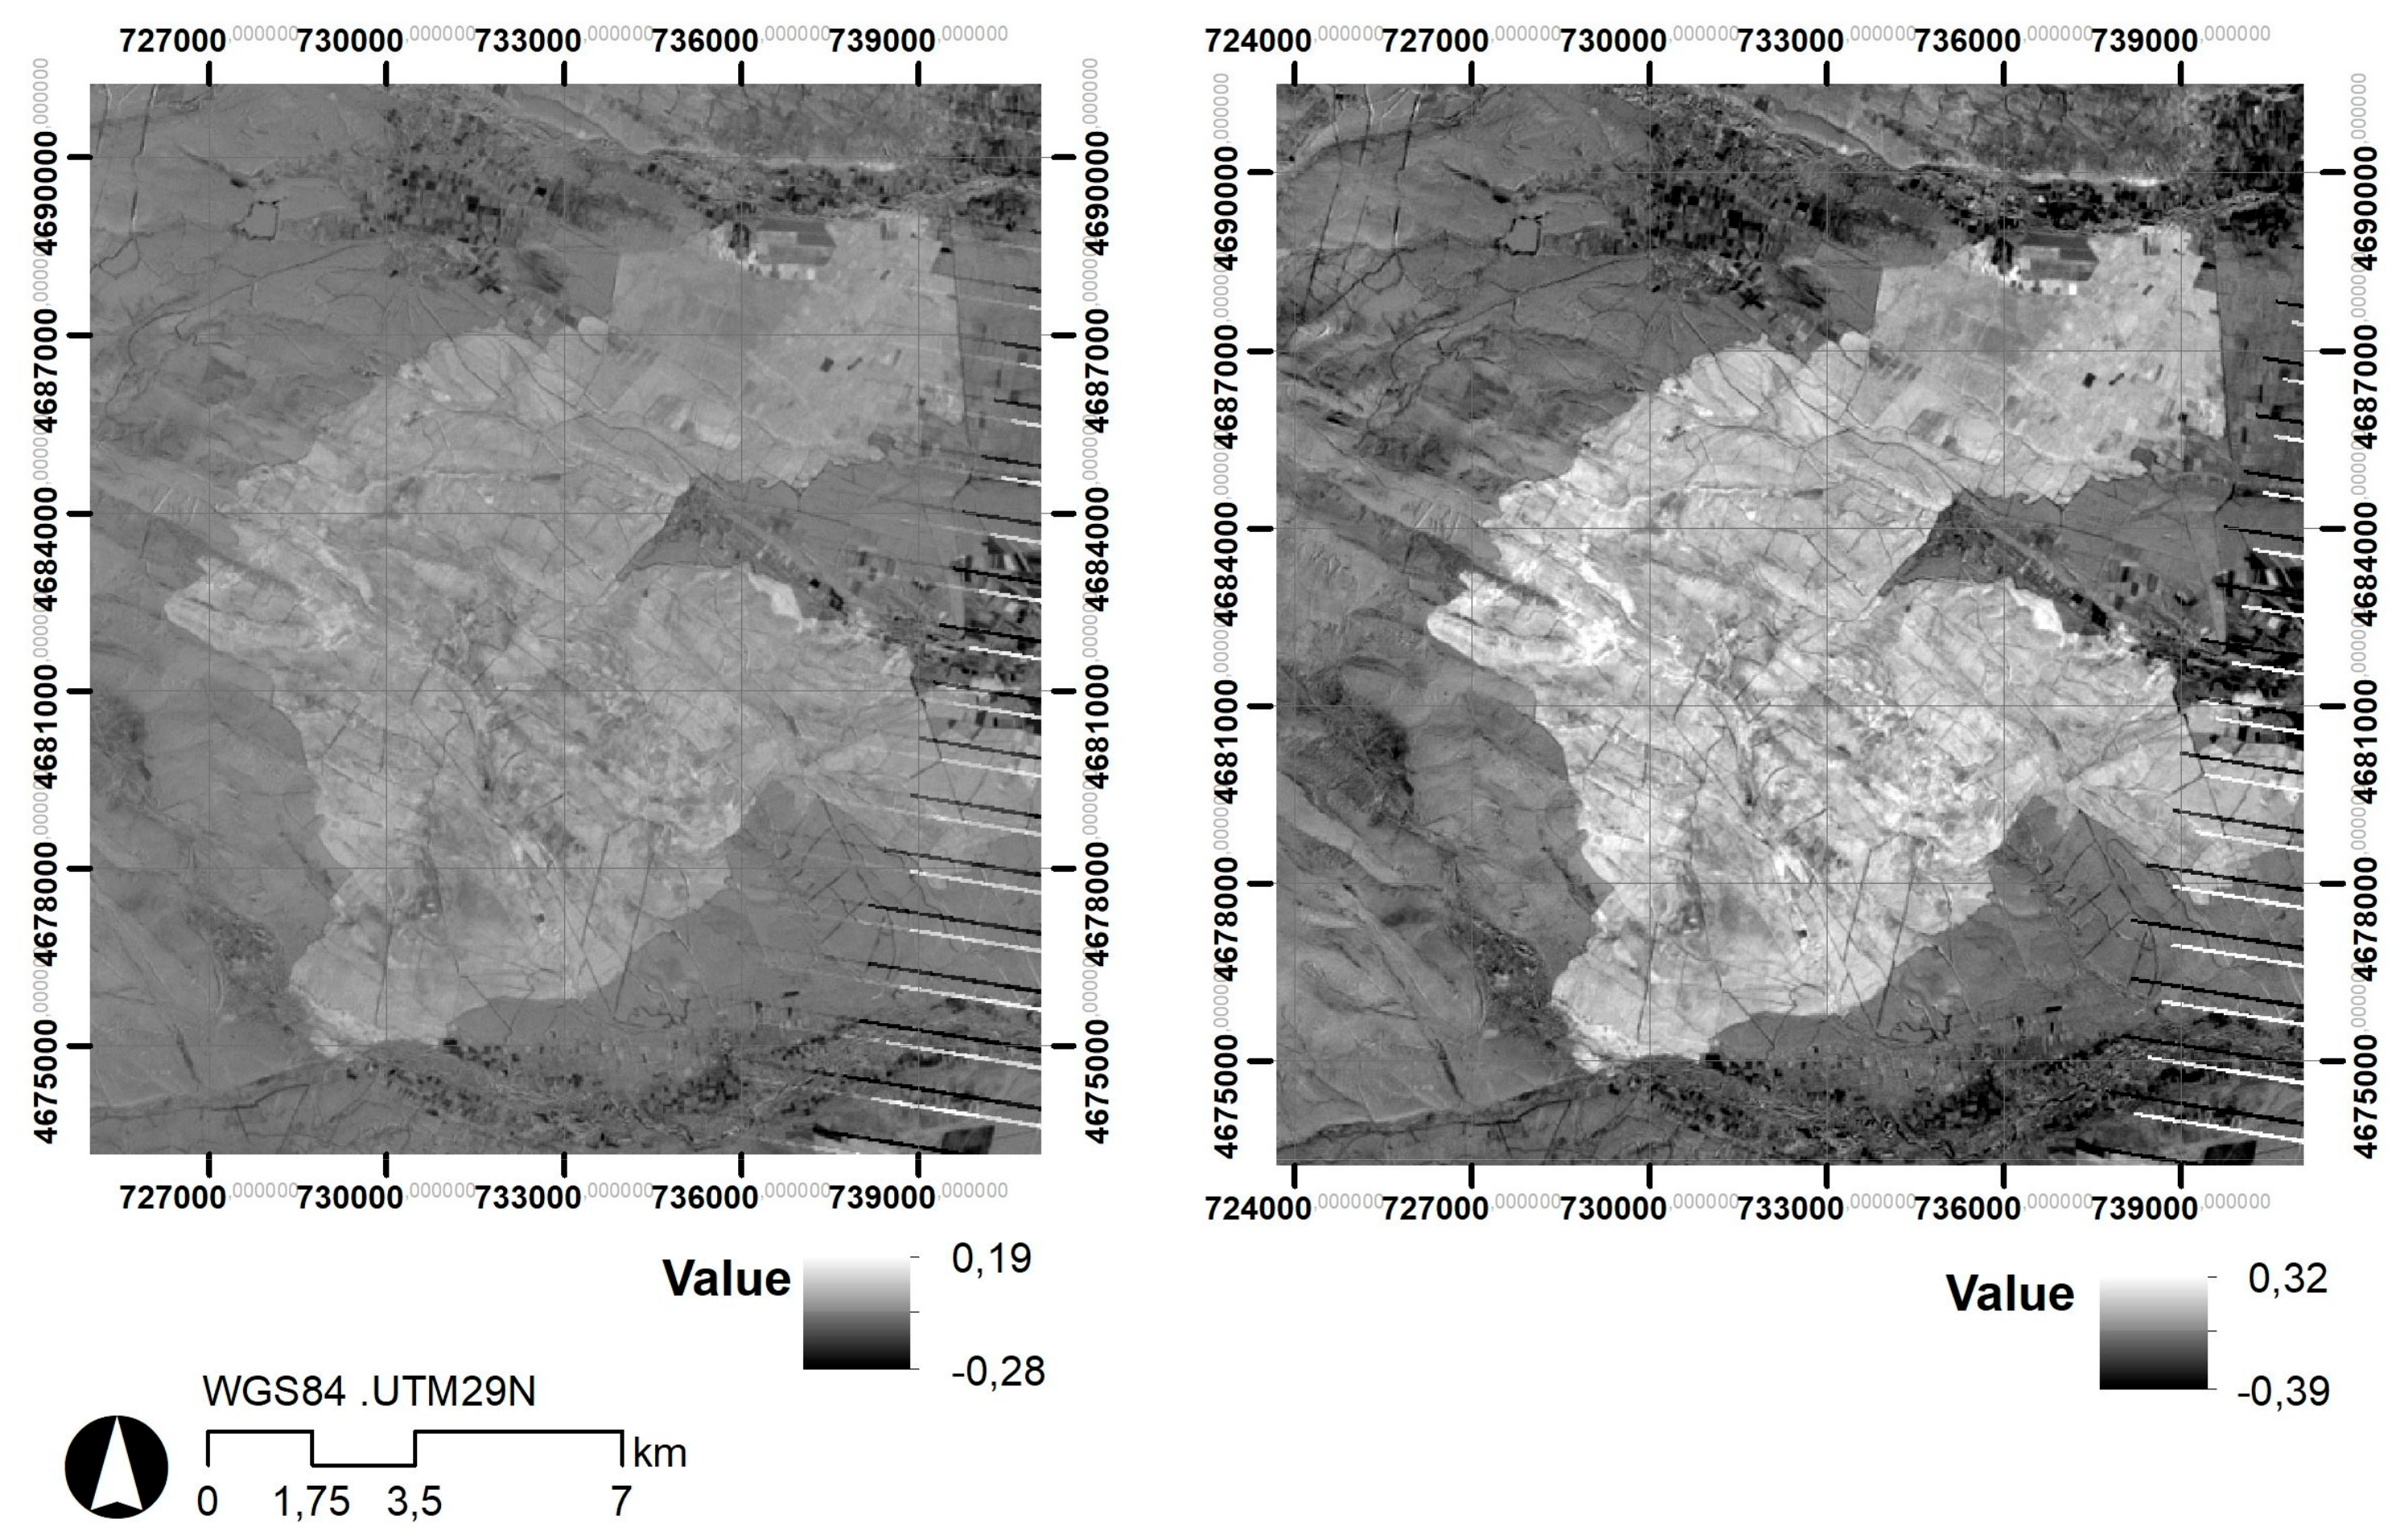
The results of the linear regression models between the dLSA images (Figure 4) and the field measured CBI values (Table 3) showed an R2adj maximum (61%) between the 2012 dLSANIR image and CBI. When the 2012 dLSAshort image was considered, R2adj decreased to 44%. R2adj values below 20% were obtained when the 2013 dLSA images were taken into account. Considering the results of the Fisher’s LSD test, we noticed significant differences (p-value < 0.05) between the unburned class and the other burn severity levels for all dLSA images. Both 2012 dLSA images (dLSANIR and dLSAshort) enabled us to discriminate two burn severity levels.
4. Discussion
The changes in the LSA values after a mega-wildfire in a Mediterranean Pinus pinaster ecosystem showed a significant decrease immediately after the fire and an increase one year after the fire. This pattern could be explained because wildfires significantly affect the LSA by altering the quantity of solar radiation that is absorbed [31]. The principal LSA variations are related to a reduction in ash and charcoal and to vegetation regrowth. In our ecosystem, there was important vegetation regeneration, mainly by re-sprouting shrub species (data not published), which affects the LSA values one year after the fire. In accordance with these facts, our results showed that the 2013 LSA images (1-year after fire) were not able to discriminate the burn severity levels, but only distinguished the burned from unburned areas. However, we must take into account that the LSA changes could be different in relation to the ecosystem type [19].
In boreal forest ecosystems, Jin et al. [21] found that during the first year after a fire, the summer LSA (short and NIR) decreased significantly below pre-fire levels. They also observed that the LSAvis remained fairly constant or even increased. Chambers and Chapin [32] observed that the post-fire summer LSA presents low values during several years due to the dark charring of soils and boles of burned trees. However, in our Mediterranean ecosystems one year after the wildfire, the boles of dead trees were removed and the black carbon coatings were leached out by rainfall, and, for this reason, we found an increase in the LSA values one year after the fire. In boreal forest ecosystems, Lyons et al. [20] and McMillan and Goulden [33] stated that vegetation growth led to increases in the summer LSA the first ten years after a fire. Regarding Mediterranean ecosystems, there are few studies relating the LSA and fire, but Veraverbeke et al. [17] observed an immediate post-fire LSAshort decrease after the 2007 Peloponnese fires. As there is heavy rainfall in Mediterranean winters, char was removed relatively soon, and this decrease had a comparatively short duration. In addition, both the char removal and vegetation growth lead to an increase in the LSA in the next post-fire summer period. Such a trend in the LSA change also agrees with the values found by Franch et al. [34] in their study on LSA and LST evolution after fire. They found an average LSAshort variation after a fire of 0.10 to 0.14 in fires in Portugal, and of 0.10 to 0.12 or 0.16 in some Spanish fires. Consequently, in our study area, the summer LSA values one year after the fire grew above pre-fire levels due to early successional plant biotypes (mainly herbs, re-sprouting shrubs and some deciduous trees [35]). These plant functional types have leaves and branches with a higher albedo than evergreen needleleaf trees [33,36,37].
In boreal ecosystems, high burn severity areas had the highest increases in post-fire spring LSA [21]. In our study, however, the post-fire 2013 LSA increase was higher for the moderate severity level than for the high one. Nevertheless, we can consider that our results agree with the findings of Jin et al. [21] because as the moderate and high burn severity levels could not be distinguished from the 2012 LSA images, we worked with only two levels of severity. Different studies (e.g., [19,38]) have concluded that the quantification of the recovery of LSA values after wildfire to achieve the pre-fire situation is very difficult, as there is a high variability (both spatial and temporal) in vegetation cover changes and rainfall. As Gatebe et al. [19] summarize, the complicated relationship between LSA variations, climate dynamics and human activities is an important question that needs to be studied.
Two burn severity levels were discriminated from the immediately post-fire LSA images with a statistical significance. The discrimination of only two severity levels has also been reported by other remote sensing-based studies (e.g., [24,39,40]). From a management overview, the identification of areas affected by high or very high severity levels is critical in terms of the ability to regenerate and of potential erosion effects [39,41], and therefore in terms of the ability to prioritise emergency measures for reducing these risks [42]. Therefore, the spatial identification of these areas would be one of the first post-fire management targets for forest managers, helping to recommend and put into practice emergency procedures to reduce and stop the additional deterioration of natural resources due to fire [43]. The capacity of LSA images in the discrimination of these high severity levels has been appropriate.
Jin et al. [21] proposed dLSA as a potential metric of burn severity. They found that spring dLSA was highly correlated with summer burn severity estimates (from dNBR) in all boreal ecozones they considered. Chambers et al. [44] affirmed that the use of dLSA as an indicator of the burn severity is most valuable in forested regions due to the lower sensitivity of dLSA to the burn severity in peatland and tundra regions (in areas with few or no trees, fire impacts are lower). In this sense, in our Mediterranean ecosystems we found a high correlation (up to 0.78) between the immediately-after-fire dLSA and the field-measured CBI values. However, more studies are needed before using dLSA as an operational indicator of burn severity, because the LSA varies both in space and time due to modifications in illumination (clouds, solar position) and surface characteristics (fire, snow, changes in vegetation cover, variations in soil moisture) [34].
Different authors [45,46,47] have shown the superiority of a multitemporal vs. single-date approach, pointing out the importance of pre-fire vegetation on post-fire spectral changes. We found, however, that the single-date approach based on the immediately post-fire LSA image provided the highest R2adj values. The main reason for our results is the date of acquisition of our pre-fire image. The scene was acquired two years before the fire, in autumn (October 19th), whereas our post-fire images are from late summer (September 6th and 9th). The seasonal difference caused changes in the vegetation cover, rainfall, solar illumination and, indirectly, in the LSA, masking the LSA change due to the forest fire.
Knowledge of burn severity can help with post-fire planning, as high severity burned areas must be included as target areas to control ecological problems. However, burn severity may be very diverse in a given burned area, and its estimate might introduce some uncertainties as well [2]. The development of new algorithms could reduce present uncertainties in terms of fire severity estimation to help in decision-making activities.
5. Conclusions
We evaluated the relationship between LSA and burn severity in Mediterranean forest ecosystems in a mega-forest wildfire (north western Spain) where CBI severity values were measured in 111 field plots. A one-way ANOVA, and regression models between CBI values and LSA (shortwave, visible and NIR), showed that immediately post-fire LSAshort and LSANIR accurately distinguished two levels of burn severity, whereas LSAvis only discriminated the unburned from the burned areas. A year after the fire, the LSA (shortwave, visible and NIR) could only discriminate the burned from the unburned areas. There was an increase in the LSA values immediately after the fire. However, one year after the wildfire, due to plant regeneration in the area, the LSA values decreased. The difference in the pre- and immediately post-fire LSA was highly correlated to the CBI values (0.78 dLSANIR and 0.66 dLSAshort). Our results suggest the capability of immediately-after-fire LSA in evaluating the burn severity in Mediterranean ecosystems. However, such a capability should be assessed in different ecosystems and fire regimes. Similarly, more studies must be carried out in this type of ecosystem to validate the potentiality of LSA as a severity indicator (from both uni- and multi-temporal points of view).
Author Contributions
Conceptualization, C.Q., A.F.-M. and E.M.; Formal analysis, C.Q. and A.F.-M.; Funding acquisition, L.C.; Methodology, C.Q. and A.F.-M.; Project administration, L.C.; Supervision, L.C.; Writing—original draft, C.Q. and A.F.-M.; Writing—review & editing, C.Q., A.F.-M., E.M. and L.C.
Funding
This research was funded by the Spanish Ministry of Economy and Competitiveness (FIRESEVES project, 559 AGL2017-86075-C2-1-R), and the Regional Government of Castile and León (SEFIRECYL project, LE001P17).
Acknowledgments
The authors would like to thank the Autonomous Government of Castile and León for sharing their information on the forest fires.
Conflicts of Interest
The authors declare no conflict of interest.
References
- Bowman, D.M.J.S.; Balch, J.K.; Artaxo, P.; Bond, W.J.; Carlson, J.M.; Cochrane, M.A.; D’Antonio, C.M.; Defries, R.S.; Doyle, J.C.; Harrison, S.P.; et al. Fire in the earth system. Science 2009, 324, 481–548. [Google Scholar] [CrossRef] [PubMed]
- Ichoku, C.; Kahn, R.; Chin, M. Satellite contributions to the quantitative characterization of biomass burning for climate modeling. Atmos. Res. 2012, 111, 1–28. [Google Scholar] [CrossRef] [Green Version]
- Poupkou, A.; Markakis, K.; Liora, N.; Giannaros, T.M.; Zanis, P.; Im, U.; Daskalakis, N.; Myriokefalitakis, S.; Kaiser, J.W.; Melas, D.; et al. A modelling study of the impact of the 2007 Greek forest fires on the gaseous pollutant levels in the Eastern Mediterranean. Atmos. Res. 2014, 2014. 149, 1–17. [Google Scholar] [CrossRef]
- García-Llamas, P.; Suárez-Seoane, S.; Taboada, A.; Marcos, E.; Fernández-Manso, A.; Quintano, C.; Fernández-García, V.; Fernández-Guisuraga, J.M.; Calvo, L. Environmental drivers of fire severity in extreme fire events that affect Mediterranean pine forest ecosystems. Forest Ecol. Manage. 2019, 2019. 433, 24–32. [Google Scholar] [CrossRef]
- Key, C.H.; Benson, N.C. Landscape Assessment: Ground Measure of Severity, the Composite Burn Indexand Remote Sensing of Severity, the Normalized Burn Ratio. In FIREMON Fire Effects Monitoring and Inventory System; Lutes, D.C., Keane, R.E., Caratti, J.F., Key, C.H., Benson, N.C., Sutherland, S., Gangi, L.J., Eds.; Gen. Tech. Rep. RMRS-GTR-164-CD: LA; USDA Forest Service, Rocky Mountain Research Station: Ogden, UT, USA, 2006; pp. 1–51. [Google Scholar]
- Parks, S.A.; Holsinger, L.M.; Koontz, M.J.; Collins, L.; Whitman, E.; Parisien, M.-A.; Loehman, R.A.; Barnes, J.L.; Bourdon, J.-F.; Boucher, J.; et al. Giving Ecological Meaning to Satellite-Derived Fire Severity Metrics across North American Forests. Remote Sens. 2019, 11, 1735. [Google Scholar] [CrossRef]
- Quintano, C.; Fernández-Manso, A.; Calvo, L.; Roberts, D.A. Vegetation and Soil Fire Damage Analysis Based on Species Distribution Modeling Trained with Multispectral Satellite Data. Remote Sens. 2019, 11, 1832. [Google Scholar] [CrossRef]
- Araújo, F.M.D.; Ferreira, L.G. Satellite-based automated burned area detection: A performance assessment of the MODIS MCD45A1 in the Brazilian savanna. Int. J. Appl. Earth Obs. 2015, 36, 94–102. [Google Scholar] [CrossRef]
- Colson, D.; Petropoulos, G.P.; Ferentinos, K.P. Exploring the Potential of Sentinels-1 & 2 of the Copernicus Mission in Support of Rapid and Cost-effective Wildfire Assessment. Int. J. Appl. Earth Obs. 2018, 73, 262–276. [Google Scholar]
- Marcos, B.; Gonçalves, J.; Alcaraz-Segura, D.; Cunha, M.; Honrado, J.P. Improving the detection of wildfire disturbances in space and time based on indicators extracted from MODIS data: a case study in northern Portugal. Int. J. Appl. Earth Obs. 2019, 78, 77–85. [Google Scholar] [CrossRef]
- Arnett, J.T.T.R.; Coops, N.C.; Daniels, L.D.; Falls, R.W. Detecting forest damage after a low-severity fire using remote sensing at multiple scales. Int. J. Appl. Earth Obs. 2015, 35, 239–246. [Google Scholar] [CrossRef]
- Harris, S.; Veraverbeke, S.; Hook., S. Evaluating spectral indices for assessing fire severity in Chaparral scosystems (Southern California) Using MODIS/ASTER (MASTER) Airborne Simulator Data. Remote Sens. 2011, 3, 2403–2419. [Google Scholar] [CrossRef]
- Stambaugh, M.C.; Hammer, L.D.; Godfrey, R. Performance of Burn-Severity Metrics and Classification in Oak Woodlands and Grasslands. Remote Sens. 2015, 7, 10501–10522. [Google Scholar] [CrossRef] [Green Version]
- French, N.; Kasischke, E.; Hall, R.; Murphy, K.; Verbyla, D.; Hoy, E.; Allen, J. Using Landsat data to assess fire and burn severity in the North American boreal forest region: an overview and summary of results. Int. J. Wildland Fire 2008, 17, 443–462. [Google Scholar] [CrossRef]
- He, T.; Liang, S.; Wang, D.; Wu, H.; Yu, Y.; Wang, J. Estimation of surface albedo and directional reflectance from Moderate Resolution Imaging Spectroradiometer (MODIS) observations. Remote Sens. Env. 2012, 119, 286–300. [Google Scholar] [CrossRef] [Green Version]
- Pereira, P.; Jordán, A.; Cerdá, A.; Martín, D. Editorial: The role of ash in fire-affected ecosystems. Catena. 2014. [Google Scholar] [CrossRef]
- Veraverbeke, S.; Verstraeten, W.W.; Lhermitte, S.; van de Kerchove, R.; Goossens, R. Assessment of post-fire changes in land surface temperature and surface albedo, and their relation with fire–burn severity using multitemporal MODIS imagery. Int. J. Wildland Fire. 2012, 21, 243–256. [Google Scholar] [CrossRef]
- Beringer, J.; Hutley, L.; Tapper, N.; Coutts, A.; Kerley, A.; O’Grady, A. Fire impacts on surface heat, moisture and carbon fluxes from a tropical savanna in northern Australia. Int. J. Wildland Fire 2003, 12, 333–340. [Google Scholar] [CrossRef]
- Gatebe, C.K.; Ichoku, C.M.; Poudyal, R.; Román, M.O.; Wilcox, E. Surface albedo darkening from wildfires in northern sub-Saharan Africa. Environ. Res. Lett. 2014, 9, 065003. [Google Scholar] [CrossRef] [Green Version]
- Lyons, E.A.; Jin, Y.; Randerson, J.T. Changes in surface albedo after fire in boreal forest ecosystems of interior Alaska assessed using MODIS satellite observations. J. Geophys. Res. 2008, 113, 1–15. [Google Scholar] [CrossRef]
- Jin, Y.; Randerson, J.T.; Goetz, S.J.; Beck, P.S.A.; Loranty, M.M.; Goulden, M.L. The influence of burn severity on postfire vegetation recovery and albedo change during early sucesión in North American boreal forests. J. Geophys. Res. Biogeosci. 2012. [Google Scholar] [CrossRef]
- Mack, M.C.; Treseder, K.K.; Manies, K.L.; Harden, J.W.; Schuur, E.A.G.; Vogel, J.G.; Randerson, J.T.; Chapin, F.S. Recovery of aboveground plant biomass and productivity after fire in mesic and dry black spruce forests of interior Alaska. Ecosystems 2008, 11, 209–225. [Google Scholar] [CrossRef]
- Schmuck, G.; San-Miguel-Ayanz, J.; Camia, T.; Durrant, T.; Boca, R.; Libertá, G. Forest Fires in Europe, Middle East and North Africa 2012. In Reference Report by the Joint Research Centre of the European Commission; Joint Research Centre of the European Commission: Brussels, Belgium, 2012; p. 118. [Google Scholar]
- Miller, J.D.; Thode, A.E. Quantifying burn severity in a heterogeneous landscape with a relative version of the delta Normalized Burn Ratio (dNBR). Remote Sens. Environ. 2007, 109, 66–80. [Google Scholar] [CrossRef]
- Teillet, P.M.; Guindon, B.; Goodenough, D.G. On the slope-aspect correction of multispectral scanner data. Can. J. Remote Sens. 1982, 8, 84–106. [Google Scholar] [CrossRef]
- Chavez, P.S., Jr. Image-based atmospheric corrections—Revisited and improved. Photogramm. Eng. Remote Sens. 1996, 62, 1025–1036. [Google Scholar]
- Liang, S. Narrowband to broadband conversions of land surface albedo. I Algorithms. Remote Sens. Environ. 2000, 76, 213–238. [Google Scholar] [CrossRef]
- Liang, S.; Shuey, C.J.; Russ, A.L.; Fang, H.; Chen, M.; Walthall, C.L.; Daughtry, C.S.T.; Hunt, R., Jr. Narrowband to broadband conversions of land surface albedo: II. Validation. Remote Sens. Environ. 2002, 84, 25–41. [Google Scholar] [CrossRef]
- Coakley, J.A., Jr. Reflectance and Albedo, Surface. Encyclopedia of the Atmosphere; Holton, J.R., Curry, J.A., Eds.; Academic Press: Cambridge, MA, USA, 2002; pp. 1914–1923. [Google Scholar]
- Loboda, T.V.; French, N.H.F.; Hight-Harf, C.; Jenkins, L.; Miller, M.E. Mapping fire extent and burn severity in Alaskan tussock tundra: An analysis of the spectral response of tundra vegetation to wildland fire. Remote Sens. Environ. 2013, 134, 194–209. [Google Scholar] [CrossRef]
- O’Halloran, T.L.; Law, B.E.; Goulden, M.L.; Wang, Z.; Barr, J.G. Radiative forcing of natural forest disturbances. Glob. Change Biol. 2012, 18, 555–565. [Google Scholar] [CrossRef]
- Chambers, S.D.; Chapin III, F.S. Fire effects on surface atmosphere energy exchange in Alaskan black spruce ecosystems: Implications for feedbacks to regional climate. J. Geophys. Res. 2002, 107, 8145. [Google Scholar] [CrossRef]
- McMillan, A.M.S.; Goulden, M.L. Age-dependent variation in the biophysical properties of boreal forests. Global Biogeochem. Cy. 2008, 22, GB2023. [Google Scholar]
- Franch, B.; Vermote, E.F.; Claverie, M. Intercomparison of Landsat albedo retrieval techniques and evaluation against in situ measurements across the US SURFRAD network. Remote Sens. Environ. 2014, 152, 627–637. [Google Scholar] [CrossRef]
- Calvo, L.; Torres, O.; Valbuena, L.; Luis, E. Recruitment and early growth of Pinus pinaster seedlings over five years after a wildfire in NW Spain. Forest Systems. 2013, 22, 582–586. [Google Scholar] [CrossRef]
- Amiro, B.D.; Orchansky, A.L.; Barr, A.G.; Black, T.A.; Chambers, S.D.; Chapin III, F.S.; Goulden, M.L.; Litvak, M.; Liu, H.P.; McCaughey, J.H.; et al. The effect of postfire stand age on the boreal forest energy balance. Agr. Forest Meteorol. 2006, 140, 41–50. [Google Scholar] [CrossRef]
- Roberts, D.A.; Ustin, S.L.; Ogunjemiyo, S.; Greenberg, J.; Dobrowski, S.Z.; Chen, J.Q.; Hinckley, T.M. Spectral and structural measures of northwest forest vegetation at leaf to landscape scales. Ecosystems 2004, 7, 545–562. [Google Scholar] [CrossRef]
- Fuller, O.D.; Ottke, C. Land cover, rainfall and land-surface albedo in West Africa. Climatic Change 2002, 54, 181–204. [Google Scholar] [CrossRef]
- Cocke, A.E.; Fulé, P.Z.; Crouse, J.E. Comparison of burn severity assessments using Differenced Normalized Burn Ratio and ground data. Int. J. Wildland Fire 2005, 14, 189–198. [Google Scholar] [CrossRef] [Green Version]
- Tanase, M.; de la Riva, J.; Pérez-Cabello, F. Estimating burn severity in Aragón pine forest using optical based indices. Can. J. Forest Res. 2011, 41, 863–872. [Google Scholar] [CrossRef]
- Vieira, D.C.S.; Fernández, C.; Vega, J.A.; Keizer, J.J. Does soil burn severity affect the post-fire runoff and interrill erosion response? A review bases on meta-analysis of field rainfall simulation data. J. Hydrol. 2015, 523, 452–464. [Google Scholar] [CrossRef]
- Vega, J.A.; Fontúrbel, M.T.; Fernández, C.; Arellano, A.; Díaz-Raviña, M.; Carballas, T.; Martín, A.; González-Prieto, S.; Merino, A.; Benito, E. Acciones urgentes contra la erosión en áreas forestales quemadas: Guía para su planificación en Galicia; Andavira, D.L., Ed.; Xunta de Galicia: Santiago de Compostela, Spain, 2013; p. 139. ISBN 978-84-8408-716-8. [Google Scholar]
- Ireland, G.; Petropoulos, G.P. Exploring the relationships between post-fire vegetation regeneration dynamics, topography and burn severity: A case study from the Montane Cordillera Ecozones of Western Canada. Appl. Geogr. 2015, 56, 232–248. [Google Scholar] [CrossRef]
- Chambers, S.D.; Beringer, J.; Randerson, J.T.; Chapin III, F.S. Fire effects on net radiation and energy partitioning: Contrasting responses of tundra and boreal forest ecosystems. J. Geophys. Res. 2005, 110, D09106. [Google Scholar] [CrossRef]
- Miettinen, J. Variability of fire-induced changes in MODIS surface reflectance by land-cover type in Borneo. Int. J. Remote Sens. 2007, 28, 4967–4984. [Google Scholar] [CrossRef]
- Pereira, J.M. Remote sensing of burned areas in tropical savannas. Int. J. Wildland Fire. 2003, 12, 259–270. [Google Scholar] [CrossRef] [Green Version]
- Silva, J.M.N.; Cadima, J.F.C.L.; Pereira, J.M.C.; Grégoire, J.-M. Assessing the feasibility of a global model for multitemporal burned area mapping using SPOT-VEGETATION data. Int. J. Remote Sens. 2004, 25, 4889–4913. [Google Scholar] [CrossRef]
Figure 1.
The location of the study area.

Figure 2.
Field photographs depicting the burn severity levels.

Figure 3.
The immediately-after-fire LSAshort (left) and immediately-after-fire LSANIR (right).

Figure 4.
The difference between the pre- and immediately post-fire LSAshort (left) and the difference between the pre- and immediately post-fire LSANIR (right).
Figure 4.
The difference between the pre- and immediately post-fire LSAshort (left) and the difference between the pre- and immediately post-fire LSANIR (right).


Table 1.
Fisher’s Least Significant Difference test for the post-fire LSA images (LSAshort, LSAvis, LSAvis-diffuse, LSAvis-direct, LSANIR, LSANIR-diffuse and LSANIR-direct) and the burn severity levels, immediately after a wildfire (September 6th 2012) and one year after a wildfire (September 9th 2013).
| Burn Severity Levels | LSAshort | LSAvis | LSAvis-diffuse | LSAvis-direct | LSANIR | LSANIR-diffuse | LSANIR-direct | |||||||
|---|---|---|---|---|---|---|---|---|---|---|---|---|---|---|
| μ | HG | μ | HG | μ | HG | μ | HG | μ | HG | Μ | HG | μ | HG | |
| Landsat 7 ETM+. September 6th, 2012 | ||||||||||||||
| Unburned | 0.1041 | a | 0.0458 | a | 0.0409 | a | 0.0475 | a | 0.1633 | a | 0.1656 | a | 0.1645 | a |
| Low | 0.0971 | b | 0.0607 | b | 0.0555 | b | 0.0625 | b | 0.1358 | b | 0.1249 | b | 0.1346 | b |
| Moderate | 0.0838 | c | 0.0535 | b | 0.0490 | b | 0.0550 | b | 0.1159 | c | 0.1054 | c | 0.1132 | c |
| High | 0.0820 | c | 0.0527 | b | 0.0482 | b | 0.0542 | b | 0.1129 | c | 0.1041 | c | 0.1102 | c |
| Landsat 7 ETM+. September 9th, 2013 | ||||||||||||||
| Unburned | 0.1060 | a | 0.0365 | a | 0.0314 | a | 0.0383 | a | 0.1761 | a | 0.1823 | a | 0.1772 | a |
| Low | 0.1280 | b | 0.0667 | b | 0.0598 | b | 0.0692 | b | 0.1935 | a | 0.1820 | a | 0.1958 | a |
| Moderate | 0.1398 | b | 0.0791 | b | 0.0713 | b | 0.0822 | b | 0.2062 | b | 0.1899 | a | 0.2087 | b |
| High | 0.1321 | b | 0.0728 | b | 0.0656 | b | 0.0755 | b | 0.1963 | b | 0.1802 | a | 0.1981 | b |
LSAshort: total shortwave broadband Land Surface Albedo; LSAvis: total visible broadband Land Surface Albedo; LSAvis-diffuse: diffuse visible broadband Land Surface Albedo; LSAvis-direct: direct visible broadband Land Surface Albedo; LSANIR: total near-infrared broadband Land Surface Albedo; LSANIR-diffuse: diffuse near-infrared broadband Land Surface Albedo; LSANIR-direct: direct near-infrared broadband Land Surface Albedo; μ: mean value; HG: Homogeneous Groups, the different letters in each HG column indicate a group of means amongst which there are no significant differences.
Table 2.
The linear regression models between the field-measured CBI values and the immediately post-fire LSA images (CBI = a × LSA + b).
Table 2.
The linear regression models between the field-measured CBI values and the immediately post-fire LSA images (CBI = a × LSA + b).
| LSAshort | LSAvis | LSAvis-diffuse | LSAvis-direct | LSANIR | LSANIR-diffuse | LSANIR-direct | |
|---|---|---|---|---|---|---|---|
| Intercept | 5.3802 | 1.9086 | 1.6805 | 2.0123 | 4.9754 | 4.6587 | 4.8010 |
| Slope | −40.8008 | −1.8548 | 2.9281 | −3.79334 | −25.1403 | −23.8127 | −24.048 |
| Correlation coefficient | −0.7136 | −0.0164 | 0.0244 | −0.0344 | −0.7902 | −0.8207 | −0.7976 |
| R2adj (%) | 50.35 | −1.15 | −1.12 | −1.06 | 62.00 | 66.98 | 63.20 |
| Standard error | 0.7972 | 1.1379 | 1.1377 | 1.1374 | 0.69747 | 0.6502 | 0.6864 |
| Mean absolute error | 0.6723 | 0.9657 | 0.9694 | 0.9632 | 0.5752 | 0.5133 | 0.5625 |
LSAshort: total shortwave broadband Land Surface Albedo; LSAvis: total visible broadband Land Surface Albedo; LSAvis-diffuse: diffuse visible broadband Land Surface Albedo; LSAvis-direct: direct visible broadband Land Surface Albedo; LSANIR: total near-infrared broadband Land Surface Albedo; LSANIR-diffuse: diffuse near-infrared broadband Land Surface Albedo; LSANIR-direct: direct near-infrared broadband Land Surface Albedo; R2adj (%): the values of R2adj have been adjusted according to the number of degrees of freedom.
Table 3.
The linear regression models between the ground measured CBI and the pre- and post-fire differenced LSA images (shortwave and NIR), and Fisher’s least significant difference test for them and for the burn severity levels.
Table 3.
The linear regression models between the ground measured CBI and the pre- and post-fire differenced LSA images (shortwave and NIR), and Fisher’s least significant difference test for them and for the burn severity levels.
| LSA2010–LSA2012 | LSA2010–LSA2013 | |||||||
|---|---|---|---|---|---|---|---|---|
| Linear regression models (CBI = a× dLSA + b) | ||||||||
| dLSAshort | dLSANIR | dLSAshort | dLSANIR | |||||
| Intercept | 0.9300 | 0.4448 | 1.4154 | 1.6314 | ||||
| Slope | 46.5521 | 28.5414 | −19.2374 | −8.5627 | ||||
| Correlation coefficient | 0.6667 | 0.7811 | −0.4503 | −0.2561 | ||||
| R2adj (%) | 44.45 | 61.09 | 20.27 | 6.56 | ||||
| Standard error | 0.8501 | 0.7114 | 1.0356 | 1.1212 | ||||
| Mean absolute error | 0.7278 | 0.5900 | 0.8715 | 0.9563 | ||||
| Fisher’s least significant difference test for the spectral indices and burn severity levels. | ||||||||
| dLSAshort | dLSANIR | dLSAshort | dLSANIR | |||||
| Burn severity levels | μ | HG | μ | HG | μ | HG | μ | HG |
| Unburned | 0.0040 | a | 0.0121 | a | 0.0053 | a | 0.0020 | a |
| Low | 0.0155 | b | 0.0489 | b | −0.0206 | b | −0.015 | b |
| Moderate | 0.0267 | c | 0.0631 | c | −0.0292 | b | −0.0290 | b |
| High | 0.0245 | c | 0.0606 | c | −0.0266 | b | −0.0219 | b |
LSA2010: 2010 Land Surface Albedo; LSA2012: 2012 Land Surface Albedo; LSA2013: 2013 Land Surface Albedo; dLSAshort: pre- and post-fire differenced total shortwave broadband Land Surface Albedo; dLSANIR: pre- and post-fire differenced total near-infrared broadband Land Surface Albedo; R2adj (%): the values of R2adj have been adjusted according to the number of degrees of freedom; μ: mean value; HG: Homogeneous Groups, the different letters in each HG column indicate a group of means amongst which there are no significant differences.
© 2019 by the authors. Licensee MDPI, Basel, Switzerland. This article is an open access article distributed under the terms and conditions of the Creative Commons Attribution (CC BY) license (http://creativecommons.org/licenses/by/4.0/).
Share and Cite
MDPI and ACS Style
Quintano, C.; Fernandez-Manso, A.; Marcos, E.; Calvo, L. Burn Severity and Post-Fire Land Surface Albedo Relationship in Mediterranean Forest Ecosystems. Remote Sens. 2019, 11, 2309. https://0-doi-org.brum.beds.ac.uk/10.3390/rs11192309
AMA Style
Quintano C, Fernandez-Manso A, Marcos E, Calvo L. Burn Severity and Post-Fire Land Surface Albedo Relationship in Mediterranean Forest Ecosystems. Remote Sensing. 2019; 11(19):2309. https://0-doi-org.brum.beds.ac.uk/10.3390/rs11192309
Chicago/Turabian StyleQuintano, Carmen, Alfonso Fernandez-Manso, Elena Marcos, and Leonor Calvo. 2019. "Burn Severity and Post-Fire Land Surface Albedo Relationship in Mediterranean Forest Ecosystems" Remote Sensing 11, no. 19: 2309. https://0-doi-org.brum.beds.ac.uk/10.3390/rs11192309
Note that from the first issue of 2016, this journal uses article numbers instead of page numbers. See further details here.