A New Fusion Approach for Extracting Urban Built-up Areas from Multisource Remotely Sensed Data


1
Institute of Cartography and Geographic Information System, Chinese Academy of Surveying and Mapping, Beijing 100830, China
2
College of Surveying and Geo-Informatics, Tongji University, Shanghai 200092, China
*
Author to whom correspondence should be addressed.
Remote Sens. 2019, 11(21), 2516; https://0-doi-org.brum.beds.ac.uk/10.3390/rs11212516
Submission received: 13 August 2019
/
Revised: 11 October 2019
/
Accepted: 22 October 2019
/
Published: 28 October 2019
(This article belongs to the Special Issue Remote Sensing of Nighttime Observations)
Abstract
:Recent advances in the fusion technology of remotely sensed data have led to an increased availability of extracted urban information from multiple spatial resolutions and multi-temporal acquisitions. Despite the existing extraction methods, there remains the challenging task of fully exploiting the characteristics of multisource remote sensing data, each of which has its own advantages. In this paper, a new fusion approach for accurately extracting urban built-up areas based on the use of multisource remotely sensed data, i.e., the DMSP-OLS nighttime light data, the MODIS land cover product (MCD12Q1) and Landsat 7 ETM+ images, was proposed. The proposed method mainly consists of two components: (1) the multi-level data fusion, including the initial sample selection, unified pixel resolution and feature weighted calculation at the feature level, as well as pixel attribution determination at decision level; and (2) the optimized sample selection with multi-factor constraints, which indicates that an iterative optimization with the normalized difference vegetation index (NDVI), the modified normalized difference water index (MNDWI), and the bare soil index (BSI), along with the sample training of the support vector machine (SVM) and the extraction of urban built-up areas, produces results with high credibility. Nine Chinese provincial capitals along the Silk Road Economic Belt, such as Chengdu, Chongqing, Kunming, Xining, and Nanning, were selected to test the proposed method with data from 2001 to 2010. Compared with the results obtained by the traditional threshold dichotomy and the improved neighborhood focal statistics (NFS) method, the following could be concluded. (1) The proposed approach achieved high accuracy and eliminated natural elements to a great extent while obtaining extraction results very consistent to those of the more precise improved NFS approach at a fine scale. The average overall accuracy (OA) and average Kappa values of the extracted urban built-up areas were 95% and 0.83, respectively. (2) The proposed method not only identified the characteristics of the urban built-up area from the nighttime light data and other daylight images at the feature level but also optimized the samples of the urban built-up area category at the decision level, making it possible to provide valuable information for urban planning, construction, and management with high accuracy.
1. Introduction
Urban built-up areas are generally defined as the urban administrative region where the majority of the area has been developed, and the municipal public facilities are widely available. These areas tend to have a higher population density and more social-environmental problems than their surroundings [1,2]. One of the main advantages of remote sensing technology is that information about the extents and elements of the built-up areas can be identified and extracted for urban planning and resource management, risk assessment, and disaster warning [3,4,5]. Methods for extracting and analyzing the traditional optical remote sensing image data for urban built-up areas from QuickBird, Landsat, Systeme Probatoire d’ Observation de la Terre (SPOT), and Moderate Resolution Imaging Spectroradiometer (MODIS) are emerging continuously. It is worth stressing that the Defense Meteorological Satellite Program-Operational Linescan System (DMSP-OLS) nighttime light data can effectively detect city lights and extract information about cities, and the related theories and technologies have driven great achievements in many fields, such as the extraction of urban scope, the monitoring of urban expansion changes, and the prediction of socioeconomic factors, such as gross national product, power consumption, and carbon emissions [6,7,8,9,10].
High-resolution optical remote sensing images and other high-quality land cover data products are important data sources for the extraction of urban information [11,12,13,14,15,16,17]. Li et al. [18] proposed an approach to detect built-up areas by using unsupervised learning technology, which was based on remote sensing images with high resolution. Chen et al. [19] developed a field-based method to automatically detect built-up areas from high-resolution satellite images. However, most of the available data have a limited temporal coverage, which limits its usefulness for dynamic spatial or temporal analysis. Problems arise when the same object exhibits different spectra and different objects exhibit the same spectrum. If results are interpreted accurately, an analysis usually requires complex computations or limited accuracy, leading to time consumption and instability. Additionally, most high-resolution data and the associated extraction methods are mainly limited by their temporal coverage or spatial characteristics. Moreover, labor-intensive and time-consuming disadvantages will become increasingly obvious when considering a large number of scenarios. Undoubtedly, these are the manifestation of the limited usefulness of large-scale studies, especially those predicated on urban remote sensing, such as urban dynamic analysis and geographical condition monitoring.
Recent advances related to the data fusion of nighttime light data and other daylight images aim to enable feature complementation and information enhancement and are potentially useful for compensating for the disadvantages of the abovementioned single data sources in extracting urban information [20,21,22,23,24]. Bhatti [25] proposed a novel method to extract built-up areas by integrating temperature data, normalized difference vegetation index (NDVI), and the modified normalized difference water index (MNDWI), which improved the overall accuracy of the extraction. Lin et al. [26] proposed a maximum-entropy method for extracting urban areas from data collected in 2000, 2005 and 2010 by combining MODIS surface reflectance, MODIS NDVI, and DMSP-OLS data based on the maximum-entropy model (MAXENT). Zhou et al. [27] developed a cluster-based method to estimate the optimal thresholds and map urban extent from the DMSP-OLS NTL data based on the cluster size and overall nighttime light magnitude, which can be used to map urban areas at different levels. Although these methods can reduce the issues of over- and underestimation, the deficiencies of nighttime light data resolution, such as the overlapping of adjacent pixels, geolocation error, and the limited temporal coverage of the data products, can still be considered unavoidable influencing factors. Shi et al. [28] proposed an improved Neighborhood Focal Statistic (NFS) method based on nighttime light data, NDVI data, and water vector data in accordance with the approximation of the characterization trend of each urban area in the nighttime light data and digital elevation model (DEM). The improved NFS method primarily identifies central and marginal urban areas using maximum and minimum NFS calculations based on the DMSP-OLS data while eliminating vegetation features and water bodies with multisource geographic data integration to optimally extract the urban areas. However, the abovementioned research mainly achieved data fusion at a single level or only discussed data integration from the perspective of GIS (i.e., an overlay analysis). Huang et al. [27] proposed a novel ensemble support vector machine (SVM) method, which combined multisource data (including remote sensing and socioeconomic data). The core concept of his method is an adaptive thresholding technique, which can be used to identify the diverse urban characteristics for mapping urban areas, especially for prefecture-level cities. Substantial achievements have been obtained by the abovementioned fusion methods, especially for urban information extraction from high resolution images, nighttime light data, and various other products. The following challenges may still be encountered: (1) Since urban elements are characterized from different remote sensing data, the features dependent on the relevant sample selection and training parameters or indices have not been comprehensively considered; (2) The issue of differences in the resolution among multisource data has not been addressed properly. Specifically, the adverse influences of the extraction result accuracy may still occur regardless of the adopted fusion method.
To address the abovementioned problems, which are associated with the fusion extraction methods for urban built-up areas, as well as to improve the credibility and effectiveness of the final results, a new fusion approach for extracting urban built-up areas is proposed based on multisource data sets, i.e., DMSP-OLS nighttime light data, the MODIS land cover product (MCD12Q1) and Landsat 7 ETM+ images. The proposed approach mainly consists of two steps: (1) multi-level data fusion, which is composed of the initial sample selection, unified pixel resolution, and feature weighted calculation, as well as pixel attribution determination at the decision level, enhancing the characteristics of urban built-up area samples and providing for the subsequent SVM optimization. (2) SVM iterative optimization with multi-factor constraints, which considers the abovementioned fusion results as samples of urban built-up areas, and several indices related to vegetation, water, and bare soil as samples of a non-urban built-up area. This process refines the sample training and obtains the final urban built-up extraction results with high creditably. To validate the flexibility and robustness of the proposed method, experiments were conducted for several typical regions in the Chinese domestic cities along the Silk Road Economic Belt. The experimental results revealed the spatial patterns and processes of urban expansion at a large spatial scale over nearly a decade but also demonstrated that the proposed approach can be applied to urban thematic studies that use multisource, multi-temporal, and multi-resolution remote sensing data. In particular, the characterization of urban ground objects is strengthened. More importantly, the proposed method effectively improved the extraction accuracy of urban built-up areas.
2. Study Areas and Materials
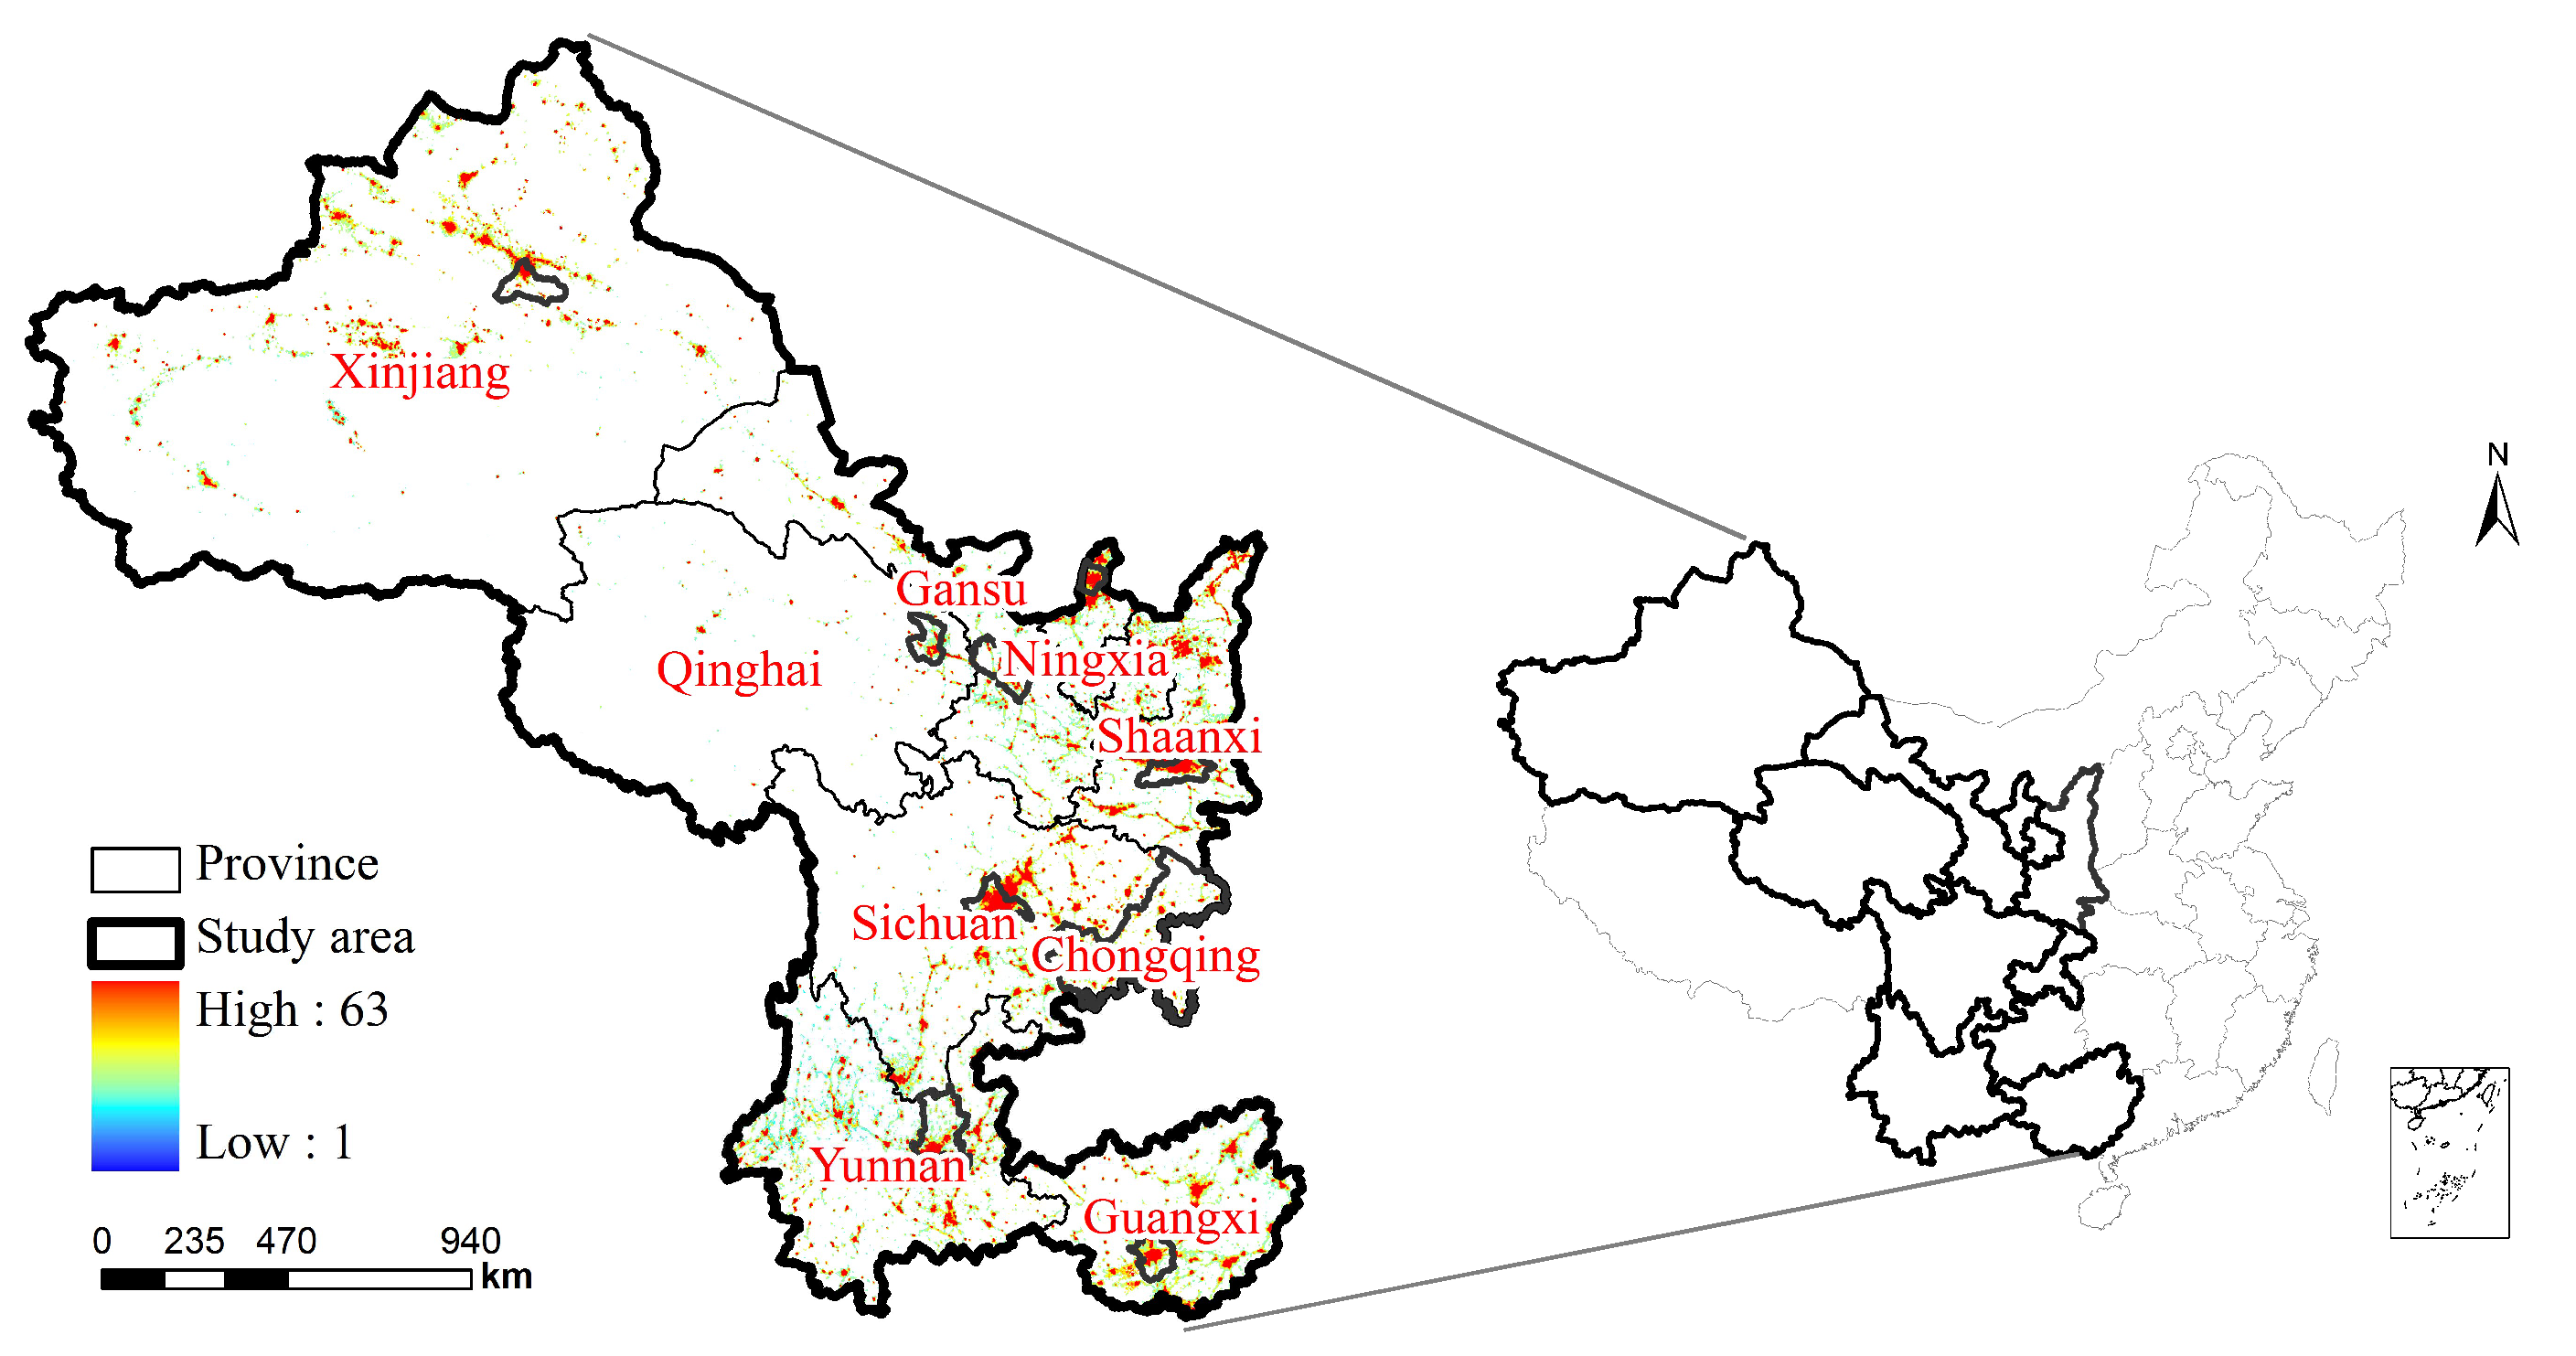
The Silk Road Economic Belt is an economic development area formed on the basis of the “ancient silk road” and a major strategy proposed by the Chinese President Xi Jinping in his speech at the Nazarbayev University in Kazakhstan in 2013 [29]. Domestic regions along the Silk Road Economic Belt mainly cover five northwestern provinces (Shaanxi, Gansu, Qinghai, Ningxia, and Xinjiang) and four southwestern provinces (Chongqing, Sichuan, Yunnan, and Guangxi), as shown in Figure 1. Capital cities such as Xi’an, Lanzhou, Xining, Yinchuan, Urumqi, Chongqing, Chengdu, Kunming, and Nanning are the key experimental areas for information fusion and the subsequent extraction of the urban built-up areas in this paper. Therefore, accurately and efficiently extracting information from urban built-up areas at multi-spatial and multi-temporal scales is of great significance to fully understand the urbanization process in western China.
The DMSP-OLS data, MODIS land cover product (MCD12Q1), and Landsat 7 ETM+ image data were used in this research. The main characteristics of each data source are summarized in Table 1. Note that all datasets were acquired in 2010 and covered several of the cities considered in this study.
The DMSP-OLS data with a 2 km global spatial resolution and were provided by the National Geophysical Data Center. Stable nighttime light images, one of the DMSP-OLS products, are annual raster graphic images that show the average nighttime light intensity, which includes lights in urban and rural areas and other permanent lights but excludes noise, such as moonlit clouds or fire [30,31]. Specifically, the digital number (DN) values of these images represent the average light intensity, which ranges from 0 to 63. Pixels with a value equal to 0 represent a completely dark area, which is not the focus of this study, whereas a relatively high DN value represents greater light intensity and more human activity.
The MODIS land cover product (MCD12Q1) is an annual data product with a global land coverage obtained by a MODIS sensor with a resolution of 500 meters [32]. This product mainly captures evergreen coniferous forests, evergreen broad-leaved forests, deciduous-coniferous forest, deciduous broad-leaved forests, mixed forests, jungles, bushes, tropical grasslands/grasslands with trees, crops, water, bare land, or low vegetation, as well as urban and built-up areas. For the information fusion and extraction for urban built-up areas, the land cover type with the attribute value of 13 in the MCD12Q1 product is classified as the built-up area land cover type, while ground objects corresponding to other attribute values are uniformly classified into the non-built-up area land cover type. Moreover, in this study, the Maryland University Vegetation Classification Scheme [33] was used to classify and extract the local elements in the MCD12Q1 data based on the natural environment and urban development characteristics of the test area to provide a data foundation for the subsequent fusion and extraction.
The Landsat-7 satellite was launched by NASA on April 15, 1999, and the main sensor it possesses is the Enhanced Thematic Imager (ETM+) [34]. The multi-spectral data from the Landsat 7 ETM+ sensor has eight bands: the visible bands, i.e., band 1–3; the near-infrared band, i.e., band 4; the shortwave infrared bands, i.e., bands 5 and 7; the thermal infrared band, i.e., band 6, which was not considered in this paper; and the panchromatic band, i.e., band 8. The spatial resolution of bands 1–5 and band 7 is 30 m and that of bands 6 and 8 are 60 m and 15 m, respectively. Bands 1–5, band 7, and band 8 were used in the preprocessing step for extracting the indices of vegetation, water, and bare soil as well as conducting the optimized processing of the ETM+ image during the multi-band fusion. This can lay a foundation for the later error matrix verification and visualized comparison of the extraction results.
3. Methods
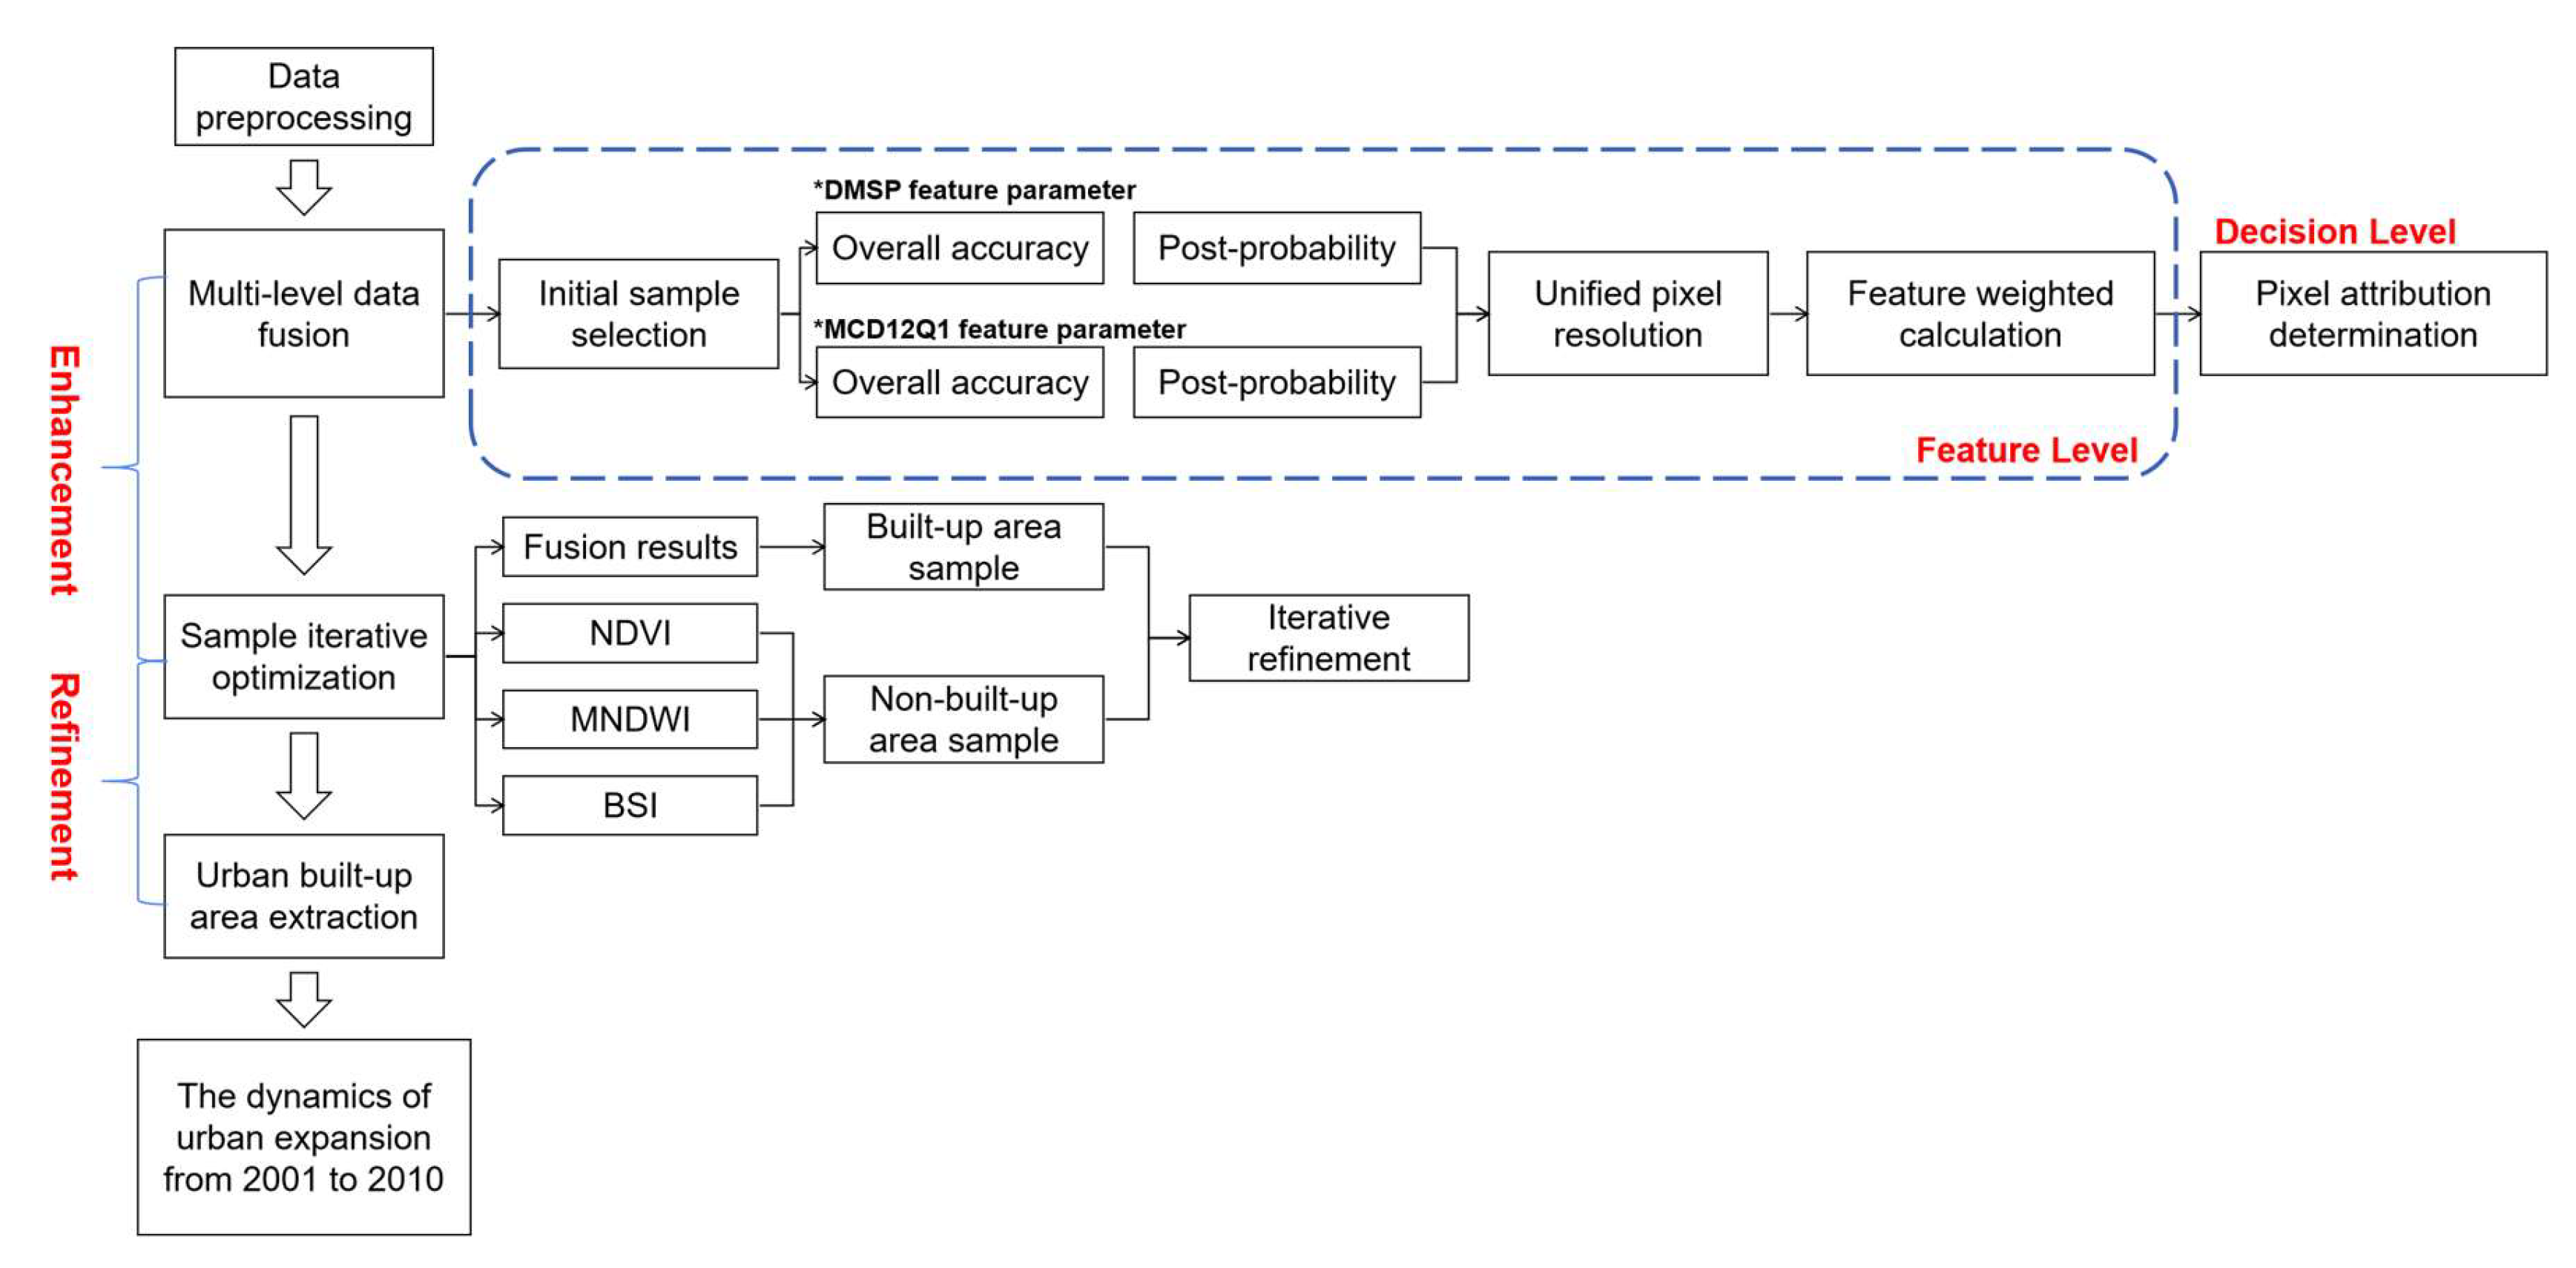
A new fusion approach for extracting urban built-up areas from multisource remotely sensed data was proposed with a high degree of reliability. The flowchart in Figure 2 mainly includes the following: (1) Preprocessing of the DMSP-OLS data, MCD12Q1 product, and Landsat 7 ETM+ images; (2) multi-level data fusion, including the initial sample selection, unified pixel resolution and feature weighted calculation at the feature level, as well as the determination of the pixel attribution at the decision level; and (3) Sample iterative optimization with multi-factor constraints, including the refined sample selection and iterative mechanism for the final urban built-up area results. The details of each step are described as follows.
3.1. Data Preprocessing
The preprocessing operations were first performed on the nighttime light data, land coverage data, and Landsat 7 ETM+ remote sensing images. The details are presented as follows:
(1) Regarding the saturation phenomenon of the DMSP-OLS stable nighttime light data series and the discontinuity phenomenon related to its multiple sensors [35,36,37], this article used the calibration method of long time series DMSP-OLS nighttime light datasets proposed by Cao et al. [39]. The major steps are the mutual calibration of the raw data images and the calibration between each image series from 2001 to 2010. Next, the areas of interest are extracted from the abovementioned result sets with a mask and then converted to the WGS-84 coordinate system.
(2) Regarding the preprocessing of land cover data, the “urban and built-up areas” raster datasets were extracted for subsequent fusion and extraction according to the self-classification system and the threshold definition of each element of the ground objects in the MCD12Q1 product. Next, the areas of interest are extracted from the abovementioned result sets with a mask and then converted to the WGS-84 coordinate system.
(3) Regarding the preprocessing of Landsat 7 ETM+ remote sensing data, in addition to converting the data to the WGS-84 coordinate system and extracting the areas of interest with a mask, there was also the fusion processing of its own bands and the index calculation of its corresponding ground objects to provide the data foundation for the subsequent extraction. Specifically, the fusion bands were calculated with Equations (1)–(3) as NDVI [40], MNDWI [41], and BSI [42] in accordance with the spectral characteristics of natural elements such as vegetation, water, and bare soil. The index results were saved as rasters in the form of vegetation, water, and bare soil sample sets. The specific indices are calculated as follows:
where NDVI is the most widely applied metric parameter to represent the vegetation cover and growth status on the land surface; MNDWI represents the water metric parameter of vegetated areas and urban areas; and BSI represents bare soil in urban areas. is the red band, is the green band, is the blue band, is the near-infrared band, is the medium-infrared band, and is the shortwave infrared band.
Considering that Landsat 7 ETM+ data are far superior to nighttime light data and land coverage data in terms of spatial resolution and spectral band richness, the extraction result could be used as a reference for the future verification of various methods [43,44]. To better verify the results of the built-up areas extracted by various methods, this paper also fused the original Landsat 7 ETM+ spectral bands 1–5 (30 m) and 7 (30 m) with the panchromatic band 8 (15 m) to obtain six fusion bands with a resolution of 15 m. Then, the SVM classifier was utilized to extract built-up areas from the fused images. The 15 m resolution extracted dataset was obtained for the quantitative verification and comparative analysis of the different extraction methods.
3.2. Multi-Level Data Fusion
Based on the characteristics of feature-level and decision-level fused remote sensing data, urban built-up areas and their relation to the data fusion and feature extraction processes were considered the focus of this study. A multi-level data fusion method was proposed to enhance the characterization of urban built-up areas and to provide fusion samples for subsequent SVM sample training and iterative optimization.
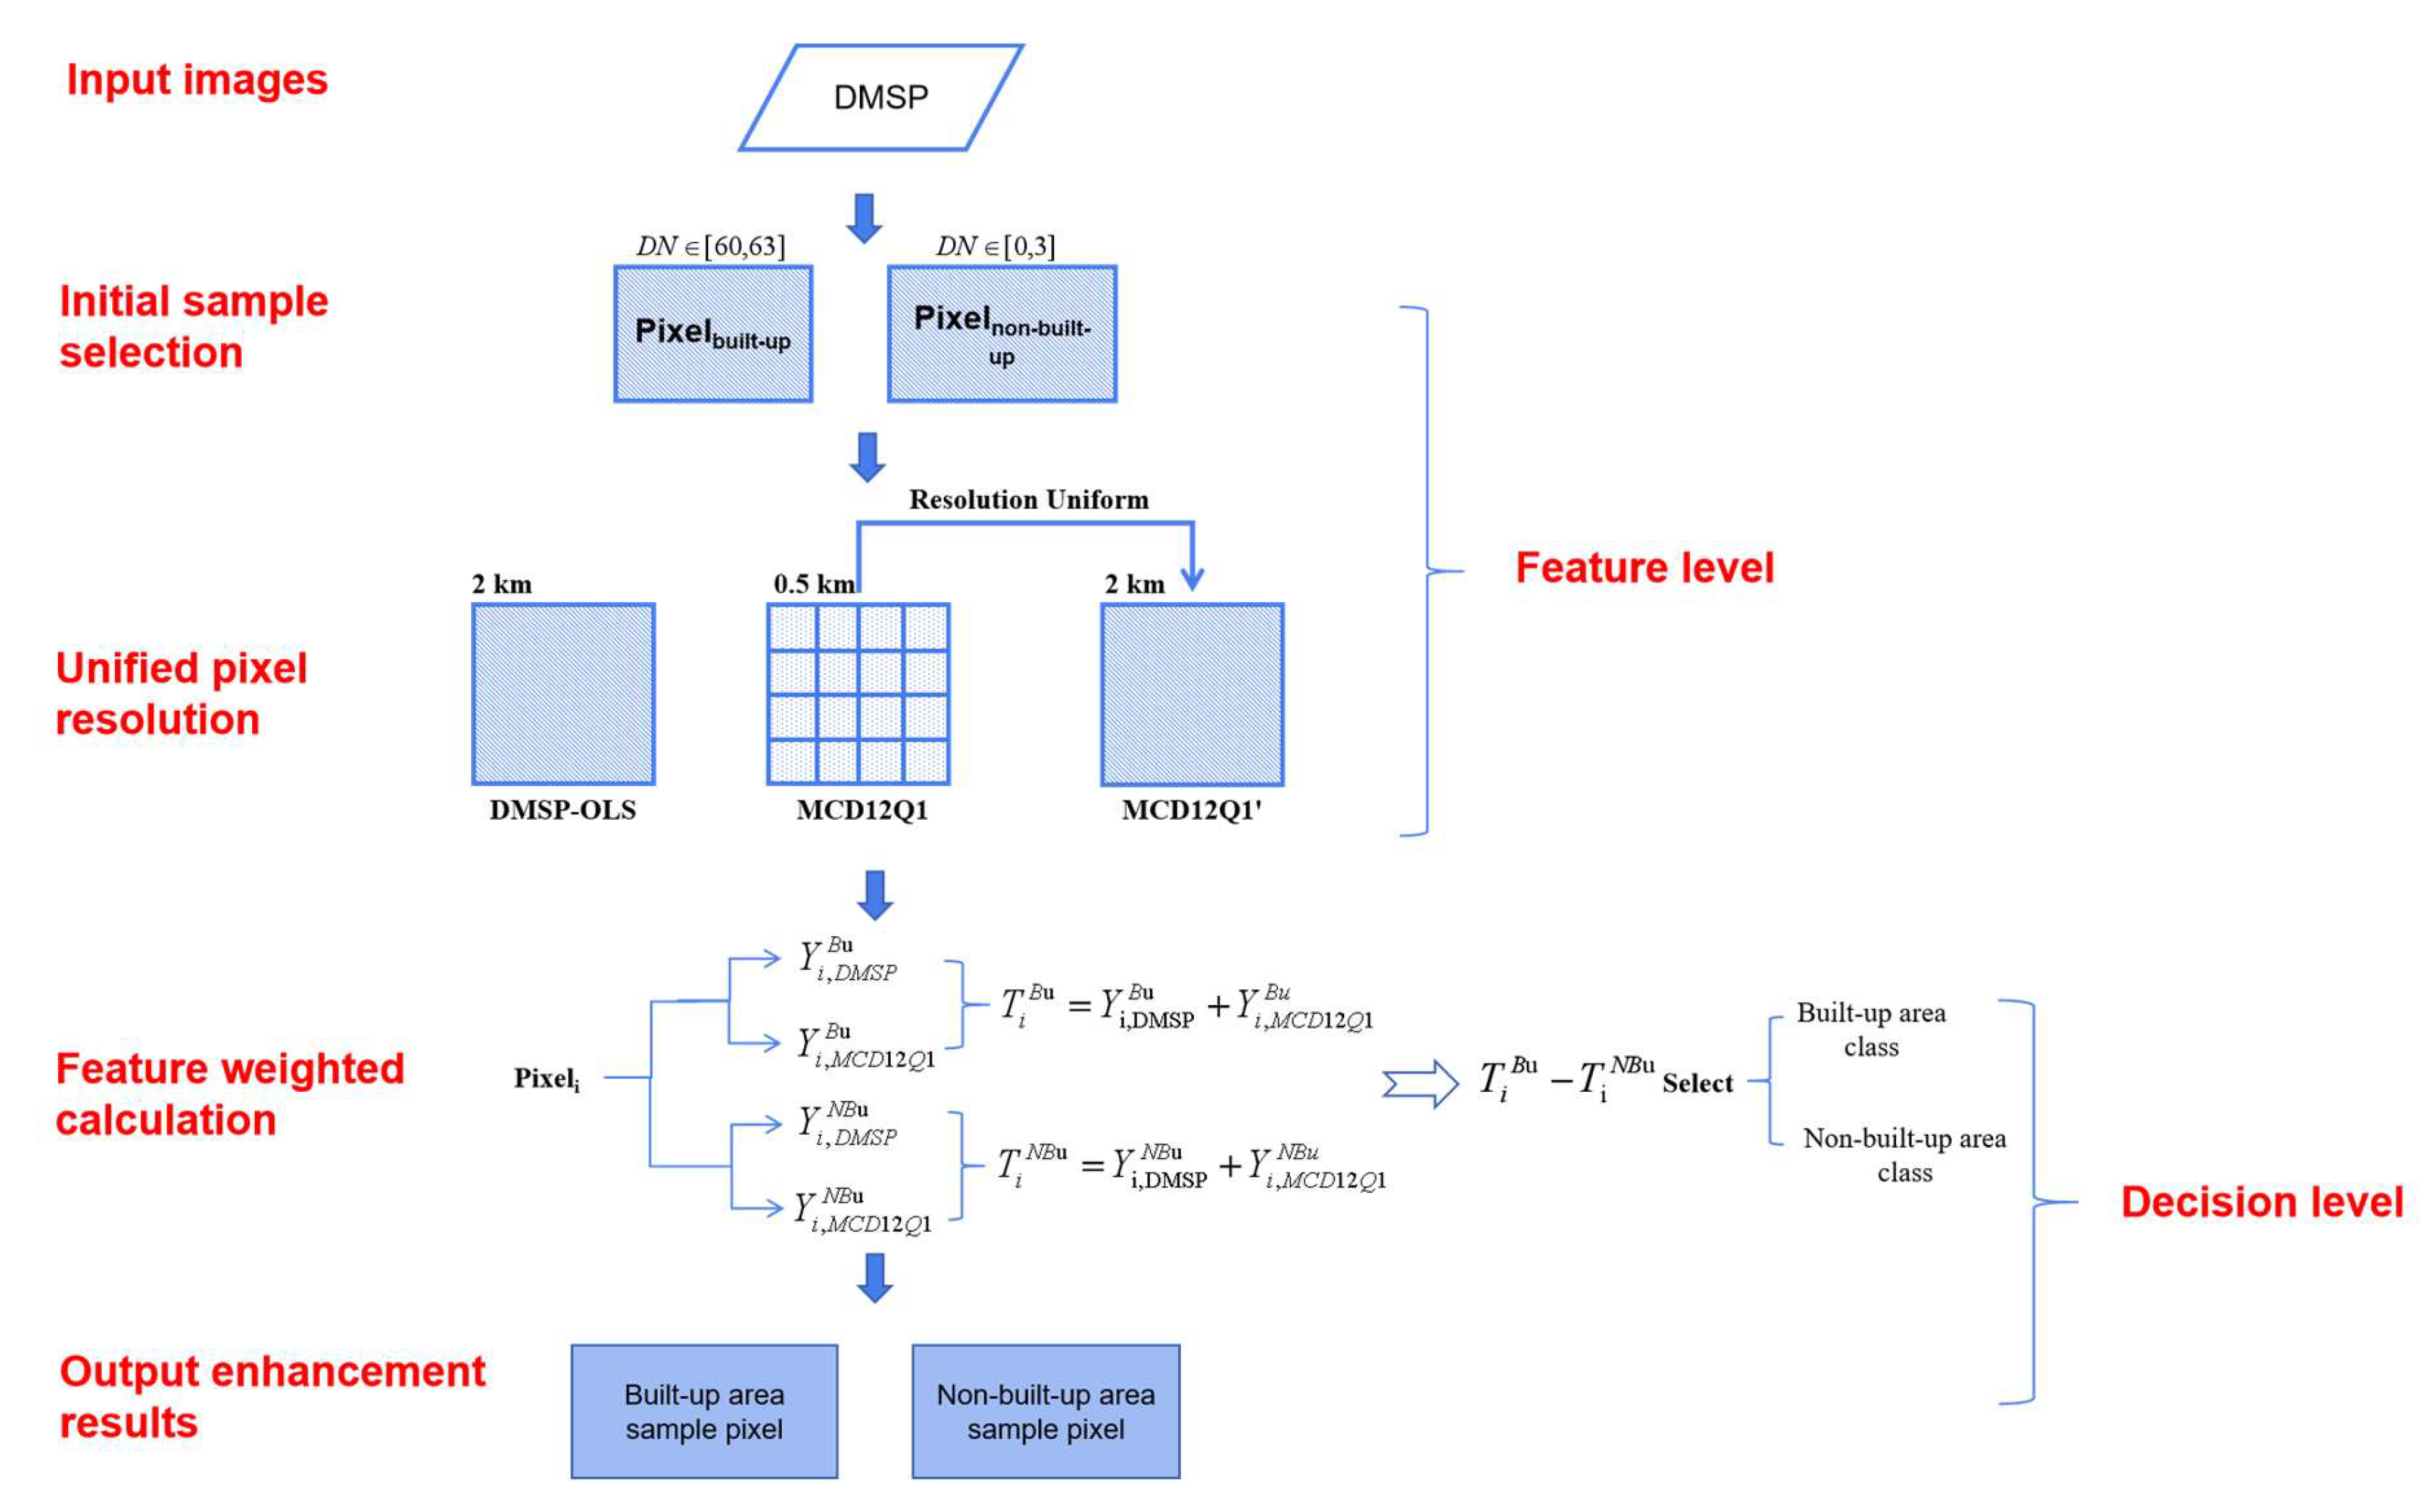
Specifically, the data fusion method is composed of initial sample selection, unified pixel resolution and feature weighted calculation at the feature level, and pixel attribution determination at the decision level. DMSP-OLS nighttime light data and MCD12Q1 products were used as examples in Figure 3, and the flowchart and more details are described below.
(1) In the initial sample selection step, the SVM classification method was used to obtain the feature parameters of the built-up areas from the DMSP-OLS data and the MCD12Q1 product. On the one hand, it should be considered that the built-up urban areas are illuminated artificially at night, and the corresponding pixels in nighttime light images have larger DN values than those of the surrounding dark rural areas [45,46]. Based on this, the patches whose DN values fall within the range of [60, 63] could be chosen as the initial sample of the built-up area land cover type from the DMSP-OLS data and patches whose DN values fall within the range of [0, 3] could be selected as the initial sample of the non-built-up area type from the DMSP-OLS data. On the other hand, patches that belong to the type “urban and built-up areas” in the MCD12Q1 product could be chosen as the initial sample of the built-up area land cover type, and patches not conforming to this land cover type could be chosen as the initial sample of the non-built-up area type from the MCD12Q1 product. Meanwhile, the post probability value P [47], which indicates the actual probability that a pixel belongs to a given category, can be obtained after the SVM classifications based on the DMSP-OLS data and MCD12Q1 product. By combining the extraction results of the SVM classification and the ETM+ fusion image, the overall accuracy value in the corresponding error matrix can be calculated.
(2) Large differences existed in the resolutions between the DMSP-OLS data and MCD12Q1 product. During the pixel resolution unification step, the overall accuracy and post probability value of each pixel at the original resolution of 0.5 km was downscaled to a 2 km resolution. This means that the integrated pixels and their corresponding values could be obtained by downscaling the resolution, which laid the foundation for the subsequent feature weighted calculation.
(3) In the feature weighted calculation step, the feature weighted models (Equations (4) and (5)) were adopted to separately calculate the tendency degree (that is, the weighted value , which refers to the built-up area type, and the weighted value , which refers to the non-built-up area type) with the overall accuracy and the post probability value for pixel i (as above) for the j data source, i.e., the DMSP-OLS data and MCD12Q1 product. Then, weighted values corresponding to the abovementioned data sources for pixel i were summarized to determine the total weighted value and the total weighted value :
where represents the weighted value Y of each pixel i in the data source j, which is equal to the product of the overall accuracy and the post probability P, n is the total number of the pixels in the data source j, and m is the total number of the kinds of data sources. The weighted value can be regarded as the influence degree or tendency degree of different data sources on the determination of each pixel attribute type, where the weighted value of the built-up area type of pixel i in the data source j is , while the weighted value of the non-built-up area type of the pixel i is .
where Ti represents the total weighted value of each pixel, which is obtained by summarizing the corresponding of each data source j, reflecting the sum of the weights from all the data sources to each pixel i belonging to different types. The attribute value of the tendency degree of the built-up area “Bu” of the given pixel i in all data sources is , while the attribute value of the tendency degree of the non-built-up area “NBu” of the pixel i is .
(4) In the pixel attribution determination step, the true type Di of the pixel i was determined through the decision analysis model (Equation (6)) based on each and .
where Di represents the final attribution type of each pixel i, which is determined by comparing and of the pixel. If is greater than , it indicates that the weighted results of all the data sources will be the built-up area type “Bu” towards the pixel i; otherwise, the weighted results of all the data sources will be the non-built-up area type “NBu” towards the pixel i.
After the abovementioned processing operations, the set of urban built-up areas could be obtained. Not only did our proposed method greatly enhance the characteristic information of the land cover type “Bu” but it also provided guarantees for the sample iterative optimization with multi-factor constraints in the next stage.
3.3. Sample Iterative Optimization with Multi-Factor Constraints
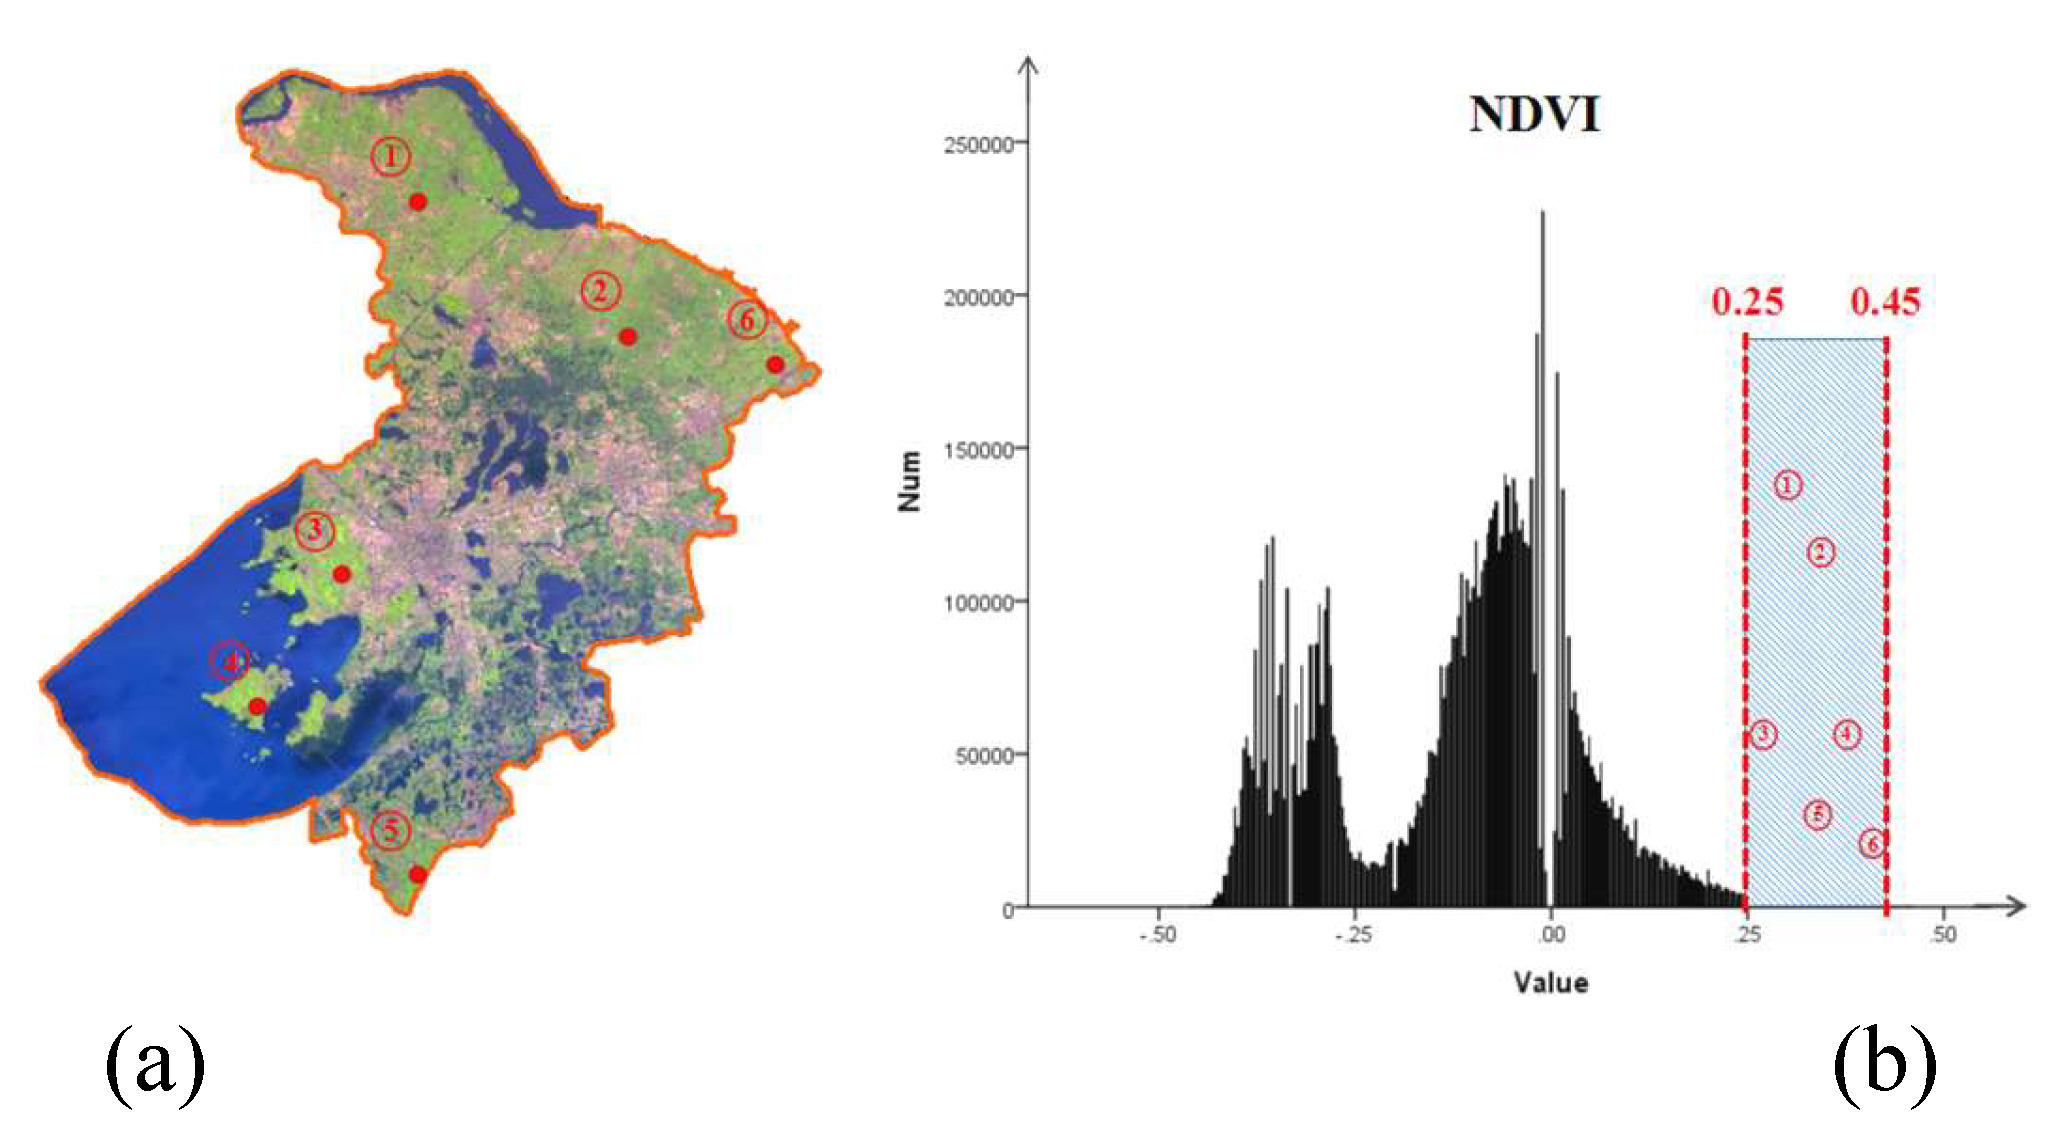
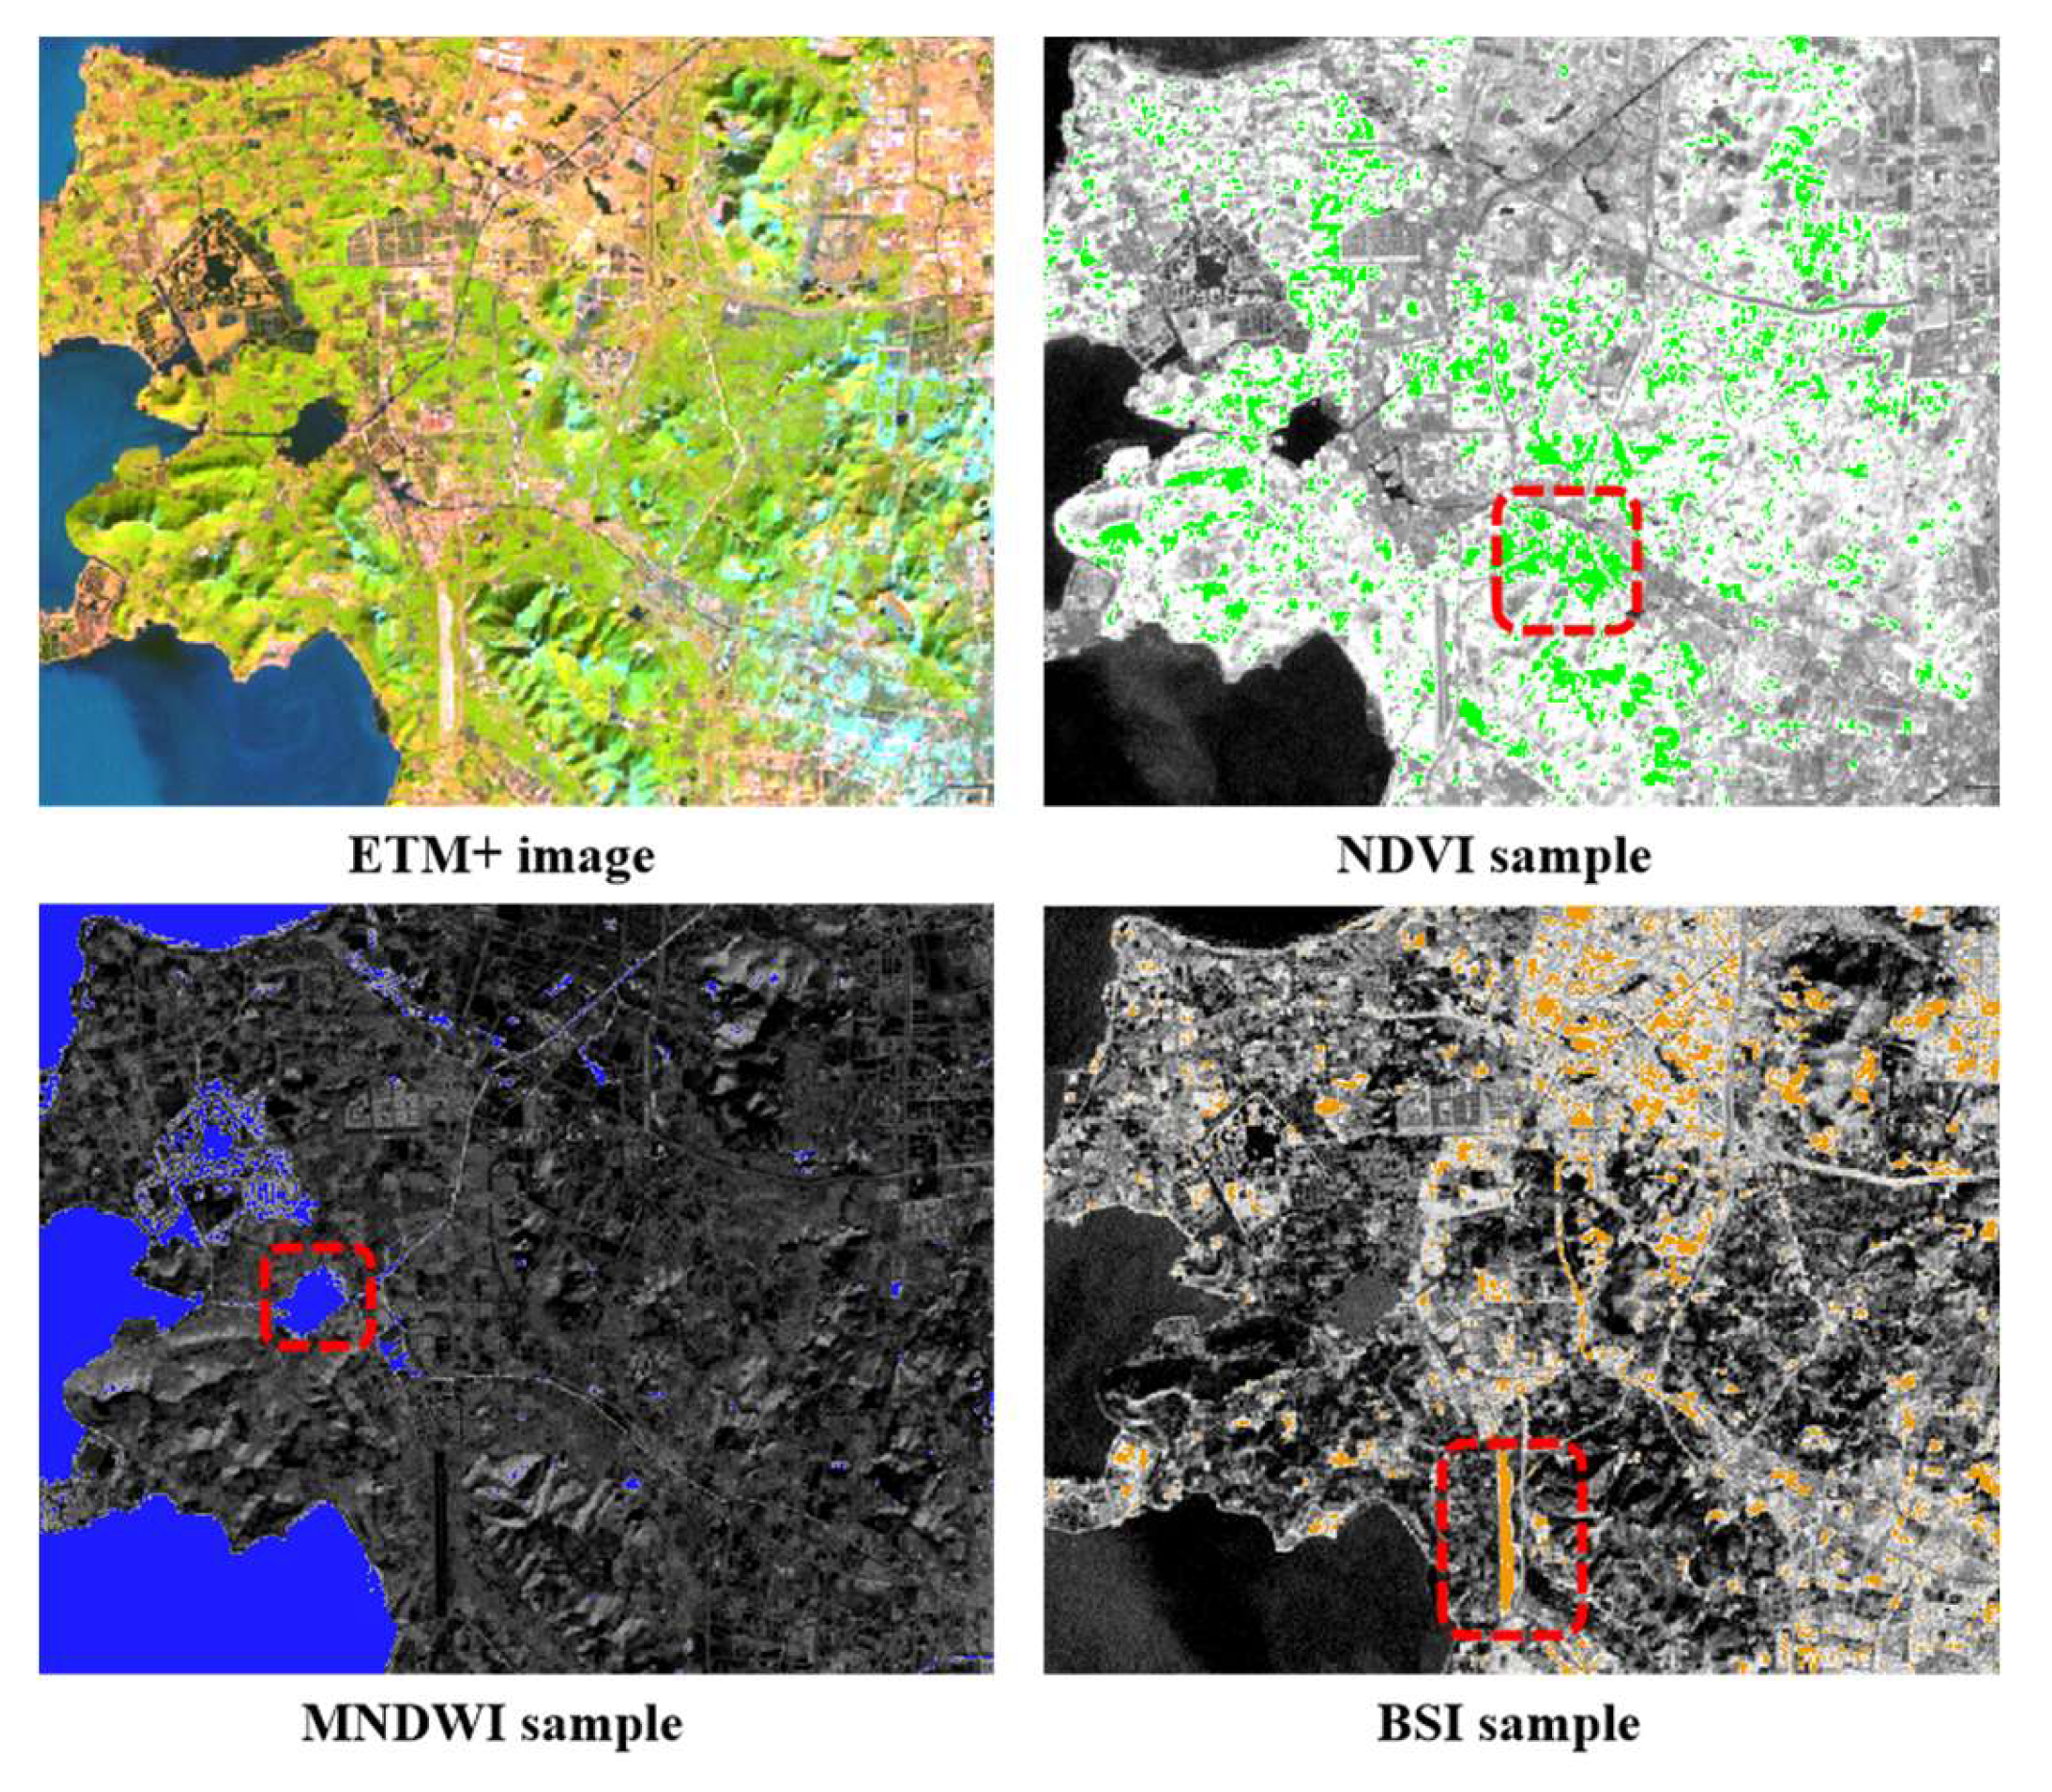
According to the characteristics of each spectral band of the Landsat 7 ETM+ image and concepts related to SVM sample training [27], a method of sample iterative optimization with multi-factor constraints was proposed to extract information at a finer scale. The results of the multi-level data fusion for urban built-up areas mentioned in Section 3.2, together with the results of the index calculations of the vegetation, water, and bare soil in the Landsat 7 ETM+ image, were regarded as the multi-factor constraints. These factors were included in the sample refined selection between the urban built-up area class and non-built-up area class. After that, the final results of the urban built-up area were obtained through the SVM iterative optimization. Specifically, the set of urban built-up areas resulting from the process described in Section 3.2 was used as the criteria for the built-up area type. Pixels satisfying this condition were used as samples of the urban built-up area in the subsequent SVM iterative optimized extraction. Meanwhile, the distributions of the NDVI, MNDWI, and BSI values associated with vegetation, water, and bare soil elements in the corresponding experimental areas were calculated. These were used as multiple natural element factors, which were involved in the sample selection of the non-built-up area type. The larger the value of each natural element index is, the more prominent the characteristics of the corresponding ground object elements. Based on this, the range of extreme values of each element index can be determined and set. Pixels falling within the range of extreme values have the maximum probability of belonging to natural elements such as vegetation, water, and bare soil. These pixels were used as the non-built-up area samples to be included in the subsequent SVM iterative optimized extraction. Taking the distribution of the NDVI value in Suzhou as an example (shown in Figure 4), approximately 100 sample points, as shown by the red and highlighted symbols, were selected from the Landsat 7 ETM+ images based on the visual interpretation of the images. From the statistical analysis, it can be observed that the NDVI values of the highlighted point clusters are within the range of a certain value, such as 0.25 and 0.45, both of which were used to identify the above-highlighted clusters. If the given NDVI values fall within a range of value domains (such as [0.25, 0.45] in Figure 4b), then that range was set as the range of extreme values corresponding to the samples of vegetation. According to the abovementioned rules, the ranges of the extreme values corresponding to MNDWI and BSI were obtained. Those pixels falling within the ranges of the extreme value could be used for reflecting the features of ground objects, such as vegetation, water, or bare soil, as well as unified into the refined sample pixel of the non-urban built-up areas in Suzhou. In Figure 5, the areas enclosed in the red boxes are forested land, inner lake, and dirt road; the NDVI, MNDWI, and BSI values of all the pixels in these areas are also within the range of the value domains and can be used as non-urban built-up area samples.
The refined samples of the built-up area type and the non-built-up area type are processed through SVM iterative optimization and classification by referring to our related research [48]. When the SVM classification is completed, the patch of built-up area and its proportion in the total area before and after the calculation were compared to see whether it is consistent with the subsequent conditions of the iteration.
where , , and represent the patch area of the built-up area obtained from the previous iteration, the current iteration and the total area of the urban patch, respectively; θ is the proportion of the differences in the two iterative classification results in the total urban area. The relationships among , , and were evaluated repeatedly based on Equation (7). With multiple iterations, when θ was completely converged (at ), the results of the previous iteration and the current iteration were very close, so the current iterative result could be the optimal refinement result. This would satisfy the high credibility requirements of urban built-up area extraction.
4. Experimental Results and Discussion
This study focused on nine capital cities (including Xi’an, Lanzhou, Xining, Yinchuan, Urumqi, Chongqing, Chengdu, Kunming, and Nanning) along the Silk Road Economic Belt in Western China. The spatial resolution of the Landsat 7 ETM+ fusion image had a finer resolution than that of the nighttime light data and global land coverage data; therefore, the extraction results from the ETM+ fusion image were used as a reference for the following experiments. To quantify the overall performance of the traditional threshold dichotomy method [49], the improved NFS method [28], and the proposed method in this paper, an accuracy assessment was carried out at the provincial and municipal scales that considered those methods used in the different extraction schemes. Each result was compared with those extracted from the ETM+ fusion images based on the visual and quantitative comparison of the spatial distribution and the form of the pattern spots.
4.1. Urban Extraction from 2001 to 2010
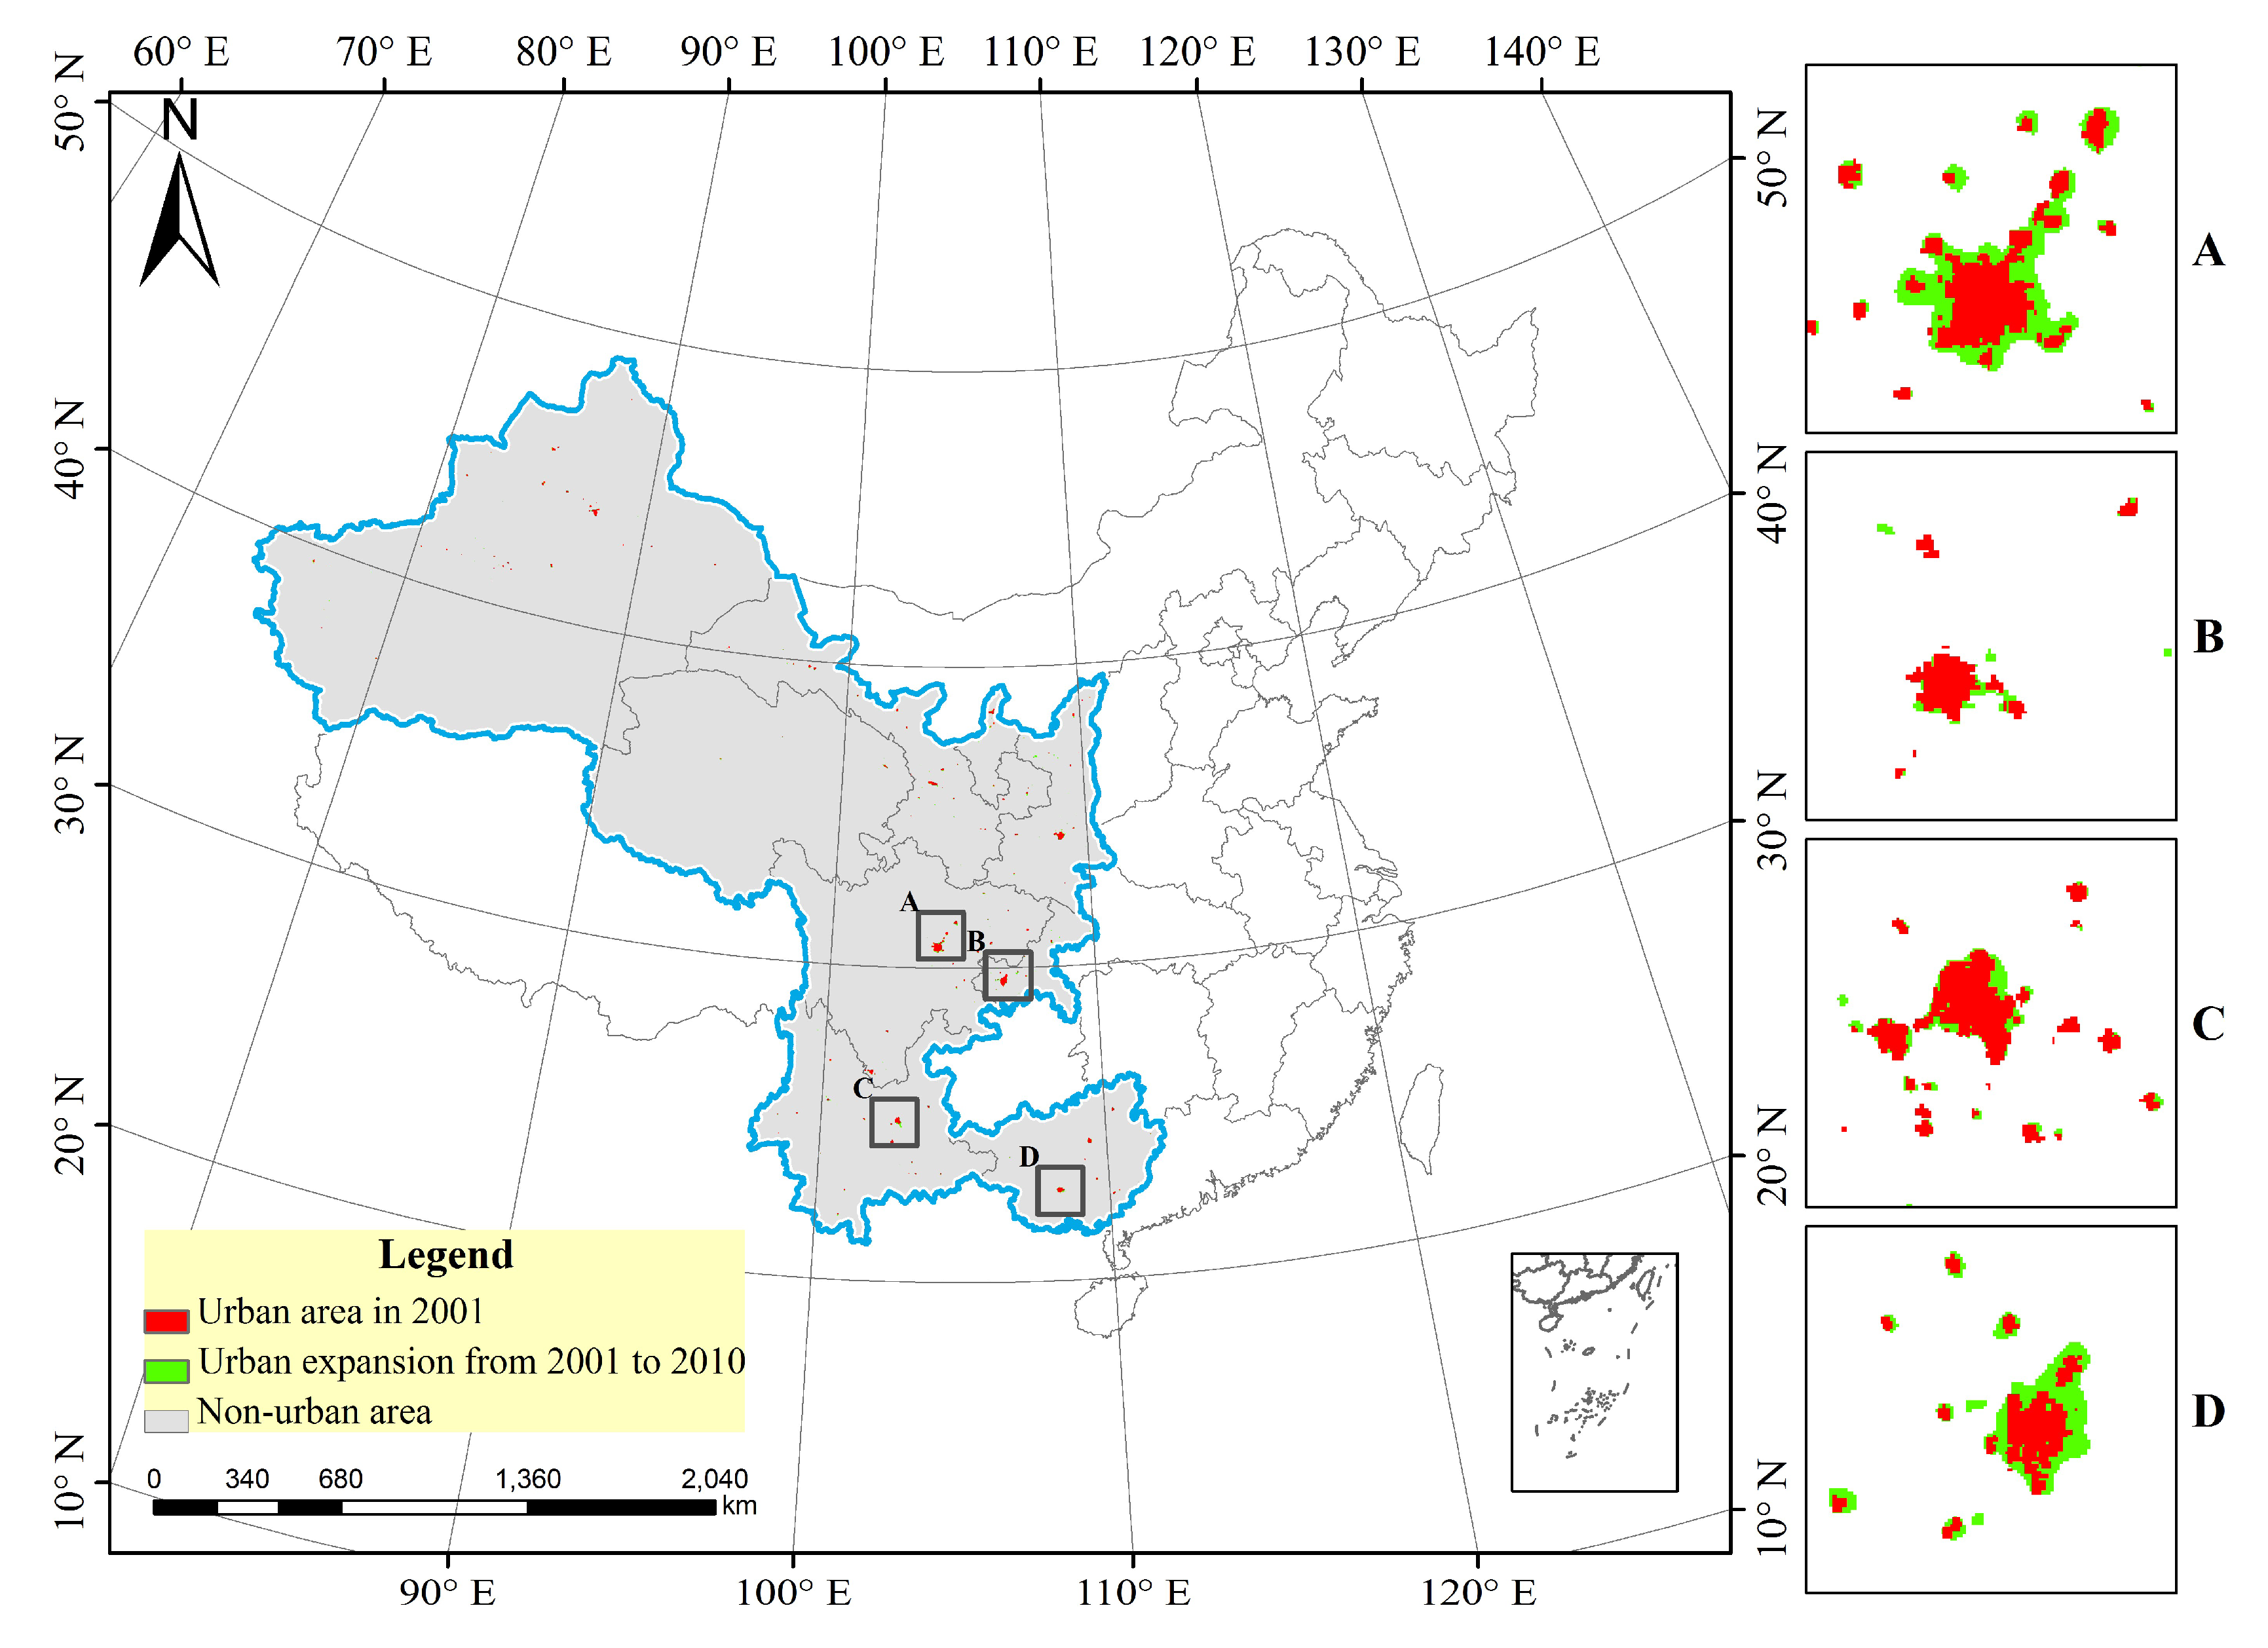
Figure 6 shows the dynamics of urban expansion over the period 2001 to 2010 based on the results of the urban built-up area extracted by the method proposed in this paper. As shown in Figure 6, the red spots characterize the urban built-up areas with relatively concentrated populations and frequent activities in the provincial capital cities, such as Chengdu, Chongqing, Kunming, and Nanning, in 2001; the green spots characterize the expansion of the abovementioned urban built-up areas from 2001 to 2010, while the gray mixed areas represent non-built-up areas. It can be observed that the green spots in the abovementioned areas are significantly expanded along the outer edges of the built-up areas, shown in red, in 2001, indicating that the urban expansion in the area along the Silk Road Economic Belt is significant in the past decade. This expansion is mainly seen in the urban-rural integration area with the urban built-up areas as the centers and the spread into the non-urban areas.
4.2. Accuracy Assessment Based on Finer-Resolution Remote Sensing Data
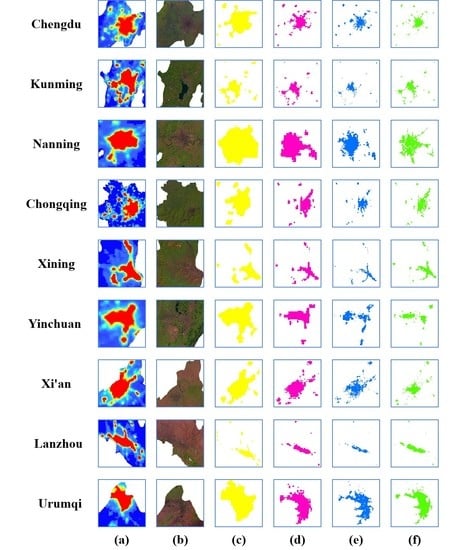
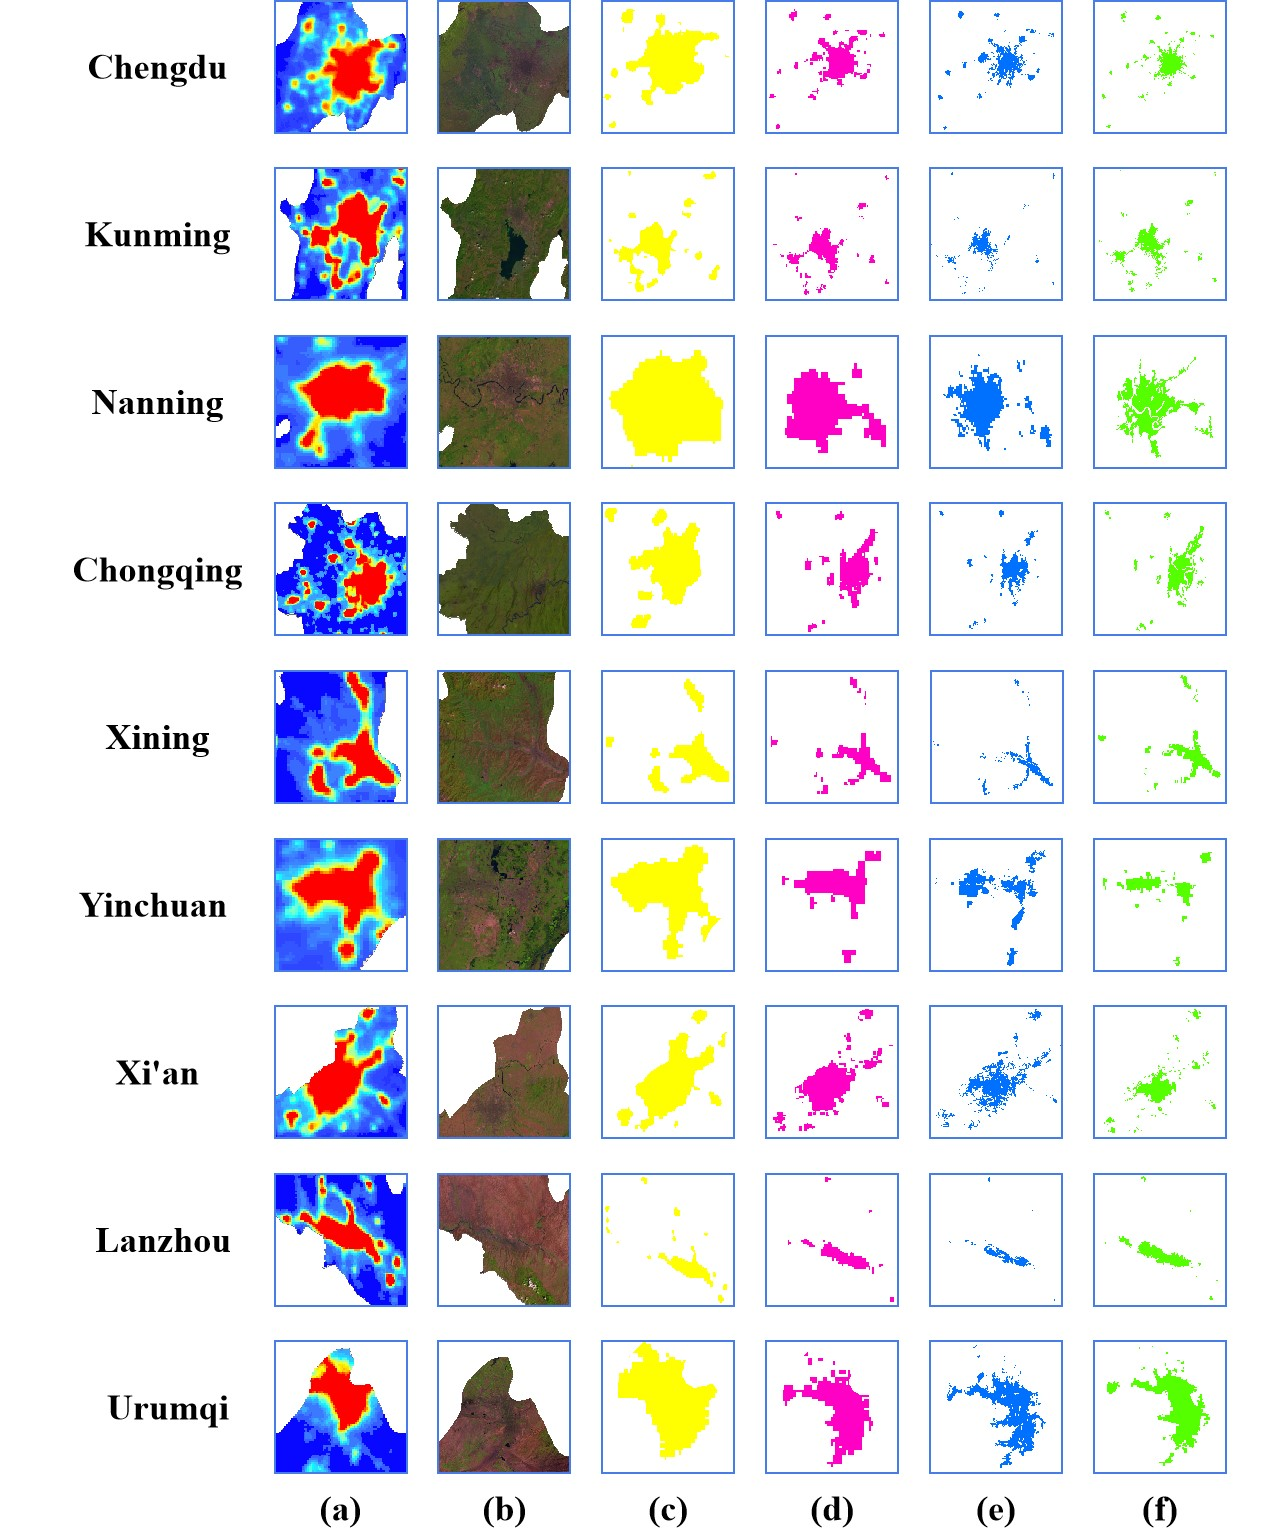
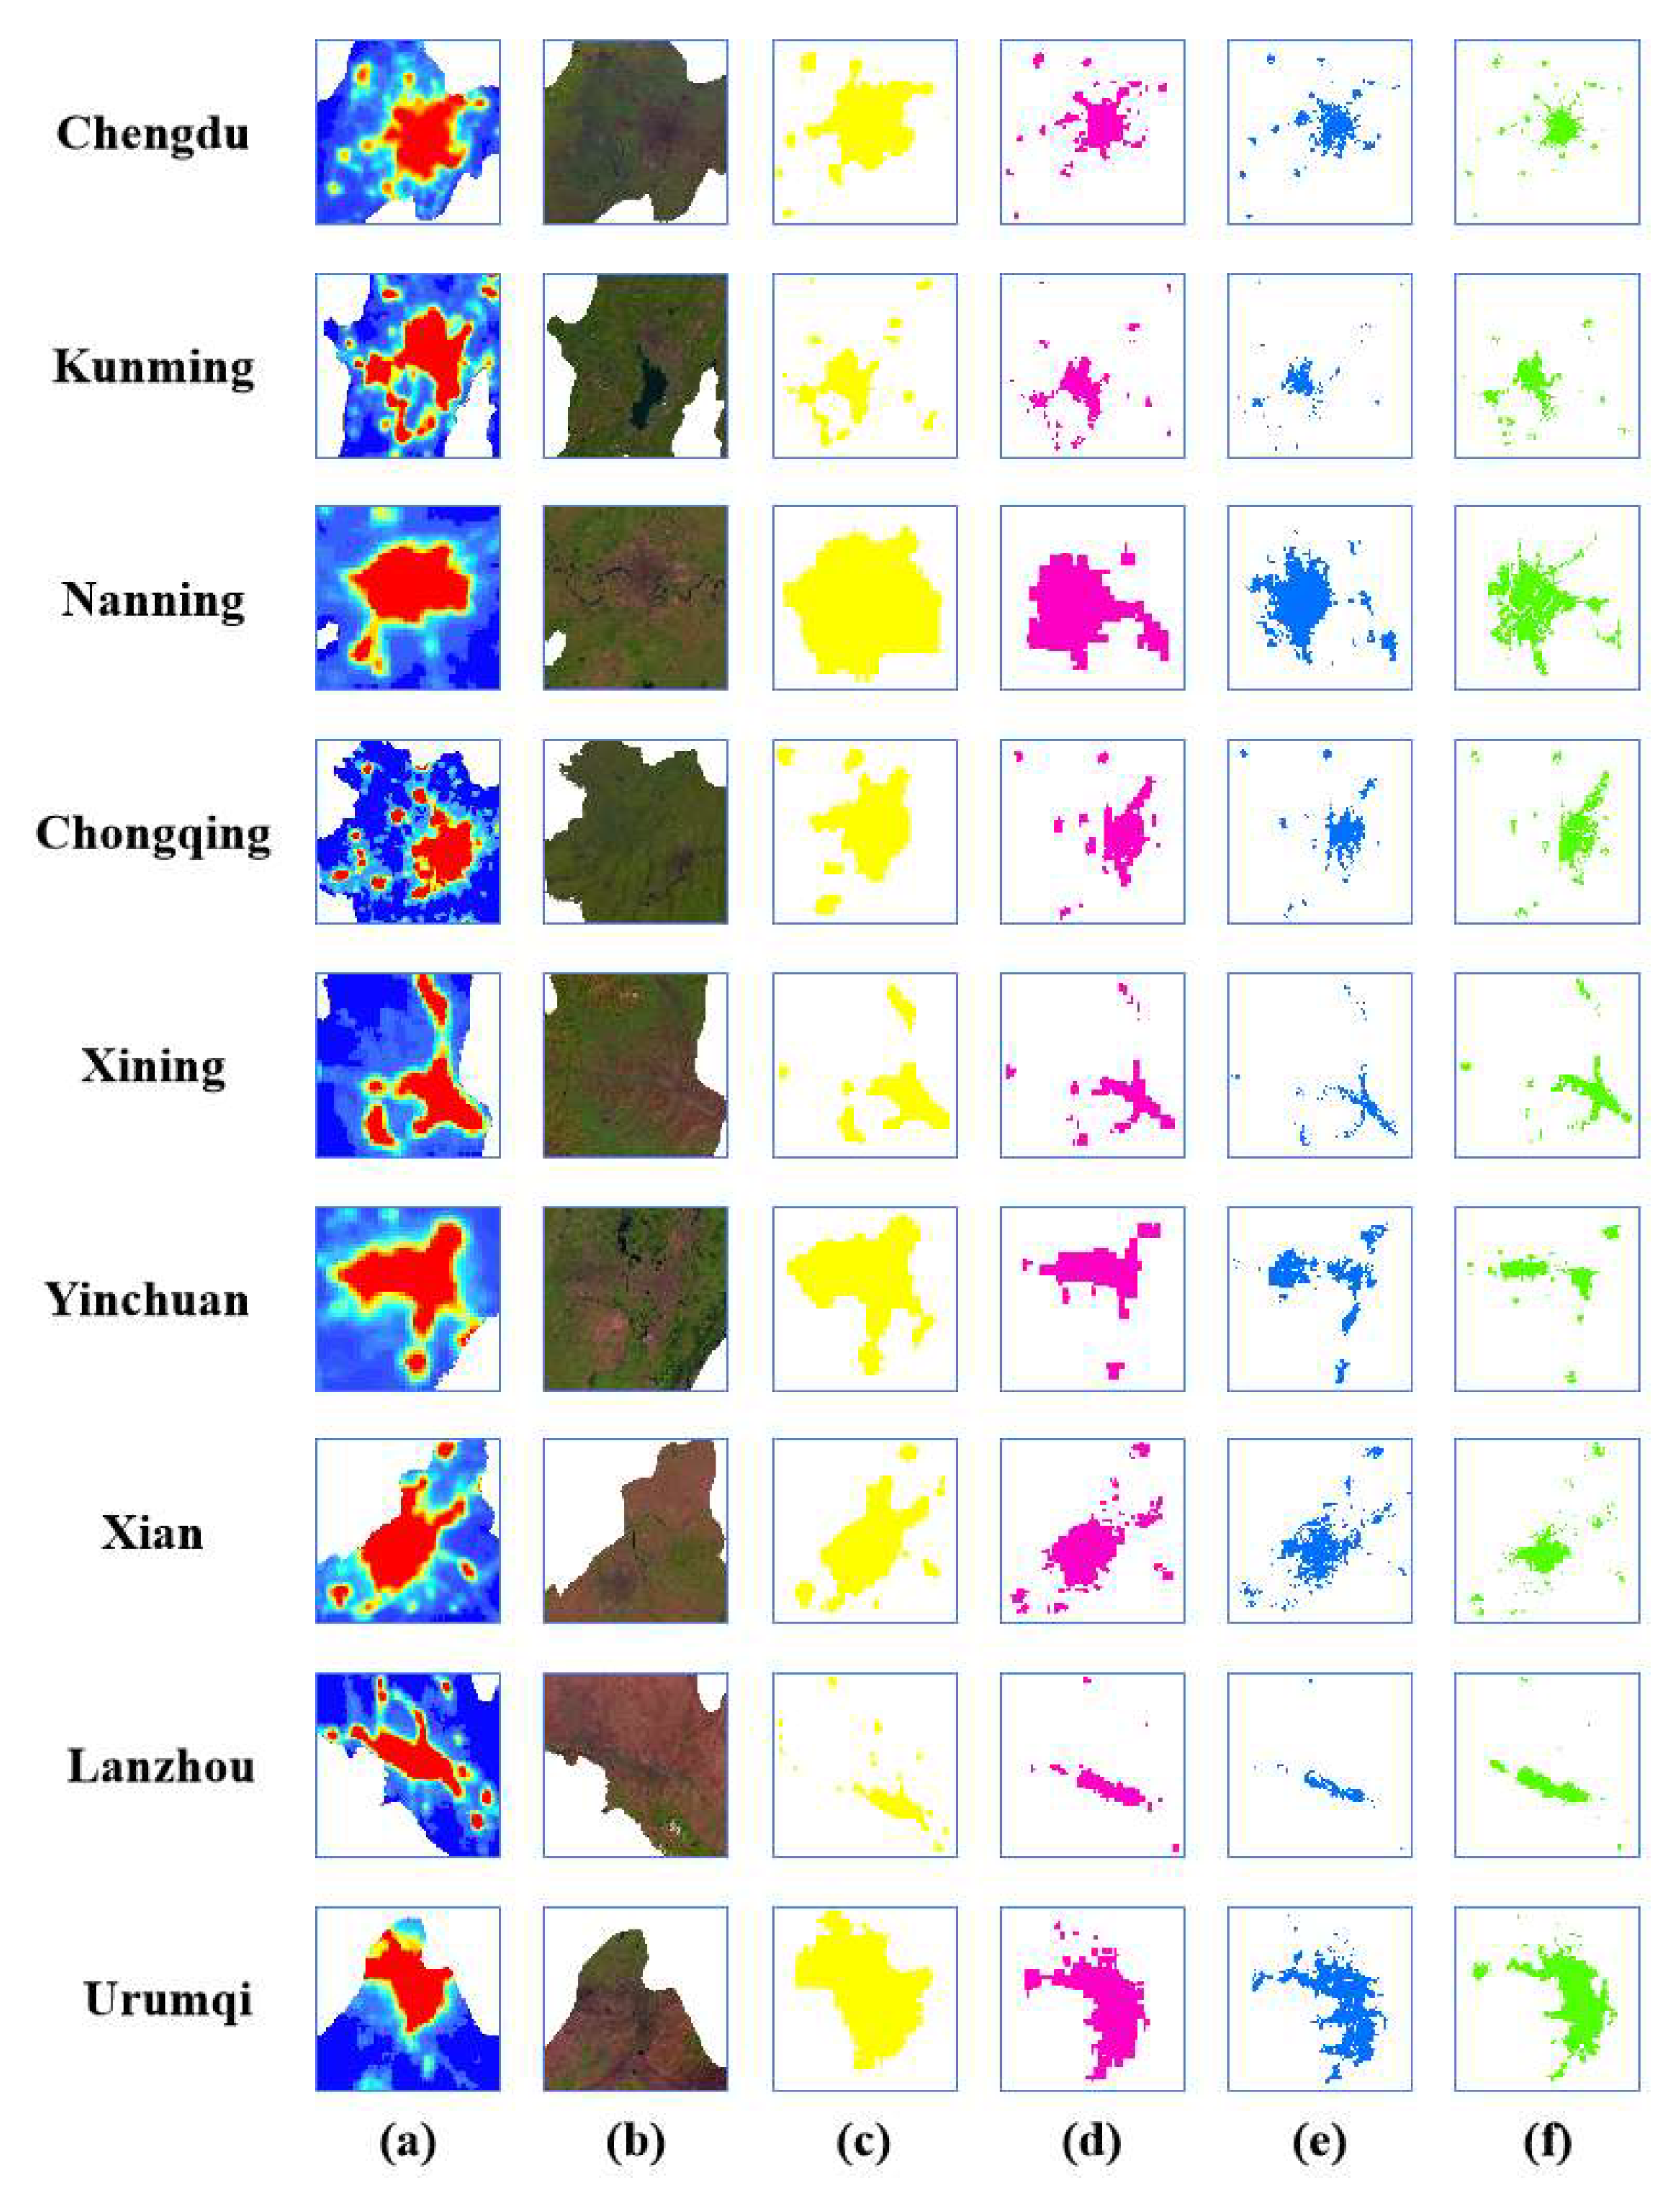
Regarding visual verification, nine provincial capital cities (Xi’an, Lanzhou, Xining, Yinchuan, Urumqi, Chongqing, Chengdu, Kunming, and Nanning) were used as examples in this section for studying the areas along the Silk Road Economic Belt. Based on the extraction results of the ETM+ fusion images in 2010, visual verification was conducted at the provincial scale for the threshold dichotomy, the improved NFS method, and the method proposed in this paper. As shown in Figure 7, the results extracted by the abovementioned three methods are very similar to those of the ETM+ image extraction. Nevertheless, the patches extracted by the threshold dichotomy method are the roughest according to the manual intervention of the threshold comparison and adjustment, which can be seen in Figure 7c. Specifically, the results obtained from the threshold dichotomy method covered not only the regions of the extraction results from the ETM+ image but also a large number of commission errors. The results of the built-up areas extracted by the improved NFS method are shown in Figure 7d. As there is a process of eliminating water and vegetation elements involved in this method based on the NDVI calculation and overlay analysis of the vector data layer, both the overall contour of the built-up area and the patch details are superior to those obtained by the dichotomy method. It should be noted that differences still exist in the extraction results of the ETM+ image, as shown in Figure 7f. For example, the misclassification of the patches in Nanning, Yinchuan, and Urumqi are relatively distinct, and the number and the range of the overall patch exceeds those of the ETM+ image extraction results. Compared with the above two methods, the proposed approach could eliminate natural elements such as water, vegetation, and bare soil. This can be observed intuitively from the spatial distribution of patches in Figure 7e, which matches with the extraction results of the ETM+ fusion image. Although the land cover around the cities varies in detail, such as the size and shape of the built-up area patches, our proposed method can still efficiently identify the locations and boundaries of the urban built-up area patches and have the highest consistency with the extraction results of the ETM+ fusion image.
Based on the extraction results of the abovementioned provincial capital cities, Chengdu, Kunming, Nanning, and Chongqing were selected as key examples of the accuracy validation in this section. By referring to the extraction results of the ETM+ fusion images for 2010, confusion matrix parameters, such as the overall accuracy (OA), Kappa coefficient, commission error (CE), and omission error (OE), can be utilized to verify the accuracy of the threshold dichotomy method, the improved NFS method, and the method proposed in this paper. As shown in Table 2, in these cities, the overall accuracy of our proposed method is higher than that of the other two methods, and the commission and omission errors of the proposed method are the lowest among these methods. Moreover, the average of the Kappa coefficient is maintained above 0.83. The average of the OA values exceeds 95%, while the CE and OE values are less than 20%. For instance, the Kappa coefficient and OA values of the fusion extraction method proposed in this paper were improved by 0.08 and 4.48%, respectively, in comparison with those of the improved NFS method in areas in Chongqing; this is an increase of 0.11% and 8.31%, respectively, in comparison with the extraction results of the threshold dichotomy method. The proposed method produces a decrease of 10.21% and 1.72% for the CE and OE values, respectively, in comparison with those of the improved NFS method. The proposed method also optimized the CE and OE values by 18.38% and 9.84% in comparison with the extraction results of the threshold dichotomy. Therefore, the method proposed in this paper has been shown to have a high ability to extract built-up areas surrounded by a variety of complex natural ground objects as well as to suppress the adverse effects caused by error transmission that might be generated between different resolutions and different areas to a certain extent.
Compared to other existing built-up area extraction methods, our proposed method devotes greater attention to the characterization of urban built-up areas and the surrounding ground objects in different data sources regardless of whether the analysis is based on nighttime light data or daylight data. The proposed method not only implemented the fusion of nighttime light data and other multisource, multi-temporal, and multi-resolution remote sensing images at the feature level and decision level but also considered the sample fusion of multiple characterization factors of built-up areas and non-built-up areas, thus enhancing the credibility of information extraction of the urban built-up areas. However, it does have some limitations and areas for improvement, which should not be ignored. First, the influence of nighttime light saturation and problems associated with using sensors of various quality, especially the low resolution of DMSP-OLS nighttime light data, are still unavoidable. Second, the test scales and coverage area involved in this study only reached the municipal level. Therefore, the scales of the nation, the continent, and even the world have not yet been considered. Third, new nighttime data, such as NPP-VIIRS and LJ1-01, can be adopted to improve the fusion of nighttime light data and daylight data. Overall, the proposed method has the potential to extract urban built-up areas with satisfactory accuracy.
5. Conclusions
In this paper, the urban built-up area, which reflects urban development and human activities, was regarded as the main research object. Based on the remote sensing data fusion theory at the feature level and decision level, a new fusion approach for extracting urban built-up areas from multisource remotely sensed data was proposed. The approach includes the multi-level fusion at the feature level and decision level, as well as sample iterative optimization with multi-factor constraints based on DMSP-OLS data, the MCD12Q1 product, and Landsat 7 ETM+ images. Specifically, the multi-level fusion is performed to enhance the characterization of urban built-up areas and provide fusion samples for the sample iterative optimization. The sample iterative optimization is used to refine the SVM sample training by taking into account the multi-factor constraints and iterative optimization mechanism, leading to final extraction results with high credibility. The results of the proposed method for extracting built-up areas in domestic cities along the Silk Road Economic Belt in China showed a high consistency with those of the ETM+ fusion image compared with the conventional threshold dichotomy method that is only based on the combination of DMSP-OLS nighttime light data and statistical data as well as the state-of-art improved NFS method. Moreover, spatial patterns and processes of urban expansion in the Silk Road Economic Belt for nearly a decade were revealed comprehensively at the provincial or municipal scales.
A comparative analyses of these advanced built-up area extraction methods confirm the superior performance of the proposed method. (1) The proposed method achieved high accuracy and eliminated natural elements to a great extent while obtaining extraction results consistent with the more precise improved NFS approach at a fine scale. The average OA and average Kappa values of the extracted urban built-up areas were 95% and 0.83, respectively, which were based on the results of the ETM+ fusion image extraction at the 15 m resolution. (2) The proposed method demonstrated the characteristics of the built-up areas in the nighttime light remote sensing images and conventional optical images at the feature and decision levels. Several relevant parameters and index interval settings completely accounted for the regional differences. (3) The proposed method is applicable to the special studies, such as urban expansion monitoring and analysis, of various well-established cities. These studies not only reveal the spatio-temporal dynamics of urban development at the municipal and provincial levels accurately and realistically but also provide valuable reference information for the decision makers at government institutions, especially for identifying the urban or regional development conditions, making urban plans and properly allocating urban resources.
Future research will focus primarily on two aspects: (1) The analyzed scale of the proposed method will be extended to a broader scale, such as the national scale or continental scale, to verify and complement the universality of the method. (2) Other multisource and multi-temporal datasets will be exploited to further validate the performance of the proposed method. In particular, in the field of nighttime light remote sensing, the close combination of the DMSP-OLS data, NPP-VIIRS data, and LJ1-01 data will be used for both time series and spatial scale representations.
Author Contributions
Conceptualization, S.L.; Data curation, X.M.; Formal analysis, S.L.; Funding acquisition, C.L.; Investigation, X.T.; Methodology, X.M. and S.L.; Supervision, C.L. and X.T.; Validation, S.L.; Writing–original draft, X.M.; Writing–review & editing, X.T. and S.L.
Funding
This research was funded by the National Key Research and Development Plan of China (No. 2018YFB0505400), the Natural Science Foundation of China (No. 41631178, 41871375, 41601354), and the Fundamental Research Funds for the Central Universities (No. 22120180005),the Opening Foundation funded by Key Laboratory of Advanced Engineering Surveying of National Administration of Surveying, Mapping and Geo-information (No. TJES1801) and by Key Laboratory of Cities Mitigation and Adaptation to Climate Change in Shanghai (CMACC).
Acknowledgments
We would like to thank the National Geomatics Center of China (NGCC), the National Oceanic and Atmospheric Administration (NOAA), the National Geophysical Data Center (NGDC), the Center for Earth Observation and Digital Earth (CEODE), the Data Center for Resources and Environmental Sciences (RESDC) in Chinese Academy of Sciences for supporting the use of their data, as well as Professor Jun Chen for providing valuable comments in our study. This work was partly supported by the National Key Research and Development Plan of China (Project Nos. 2018YFB0505400), the Natural Science Foundation of China (Project Nos. 41631178, 41871375, 41601354), and the Fundamental Research Funds for the Central Universities (No. 22120180005).
Conflicts of Interest
The authors declare no conflict of interest.
References
- Du, P.; Li, X.; Cao, W.; Luo, Y.; Zhang, H. Monitoring urban land cover and vegetation change by multi-temporal remote sensing information. Min. Sci. Technol. 2010, 20, 922–932. [Google Scholar] [CrossRef]
- Zhang, P.; Sun, Q.; Liu, M.; Li, J.; Sun, D. A strategy of rapid extraction of built-up area using multi-seasonal Landsat-8 thermal infrared Band 10 images. Remote Sens. 2017, 9, 1126. [Google Scholar] [CrossRef]
- Ge, W.; Yang, H.; Zhu, X.; Ma, M.; Yang, Y. Ghost City Extraction and Rate Estimation in China Based on NPP-VIIRS Night-Time Light Data. ISPRS Int. J. Geo-Inf. 2018, 7, 219. [Google Scholar] [CrossRef]
- Tolpekin, V.A. Detection of built-up area in optical and synthetic aperture radar images using conditional random fields. J. Appl. Remote Sens. 2014, 8, 083672. [Google Scholar]
- Bhaskaran, S.; Paramananda, S.; Ramnarayan, M. Per-pixel and object-oriented classification approachs for mapping urban features using Ikonos satellite data. Appl. Geogr. 2010, 30, 650–665. [Google Scholar] [CrossRef]
- Haas, J.; Ban, Y. Urban growth and environmental impacts in Jing-Jin-Ji, the Yangtze, River Delta and the Pearl River Delta. Int. J. Appl. Earth Observ. Geoinf. 2014, 30, 42–55. [Google Scholar] [CrossRef]
- Liu, Z.; He, C.; Zhang, Q.; Huang, Q.; Yang, Y. Extracting the dynamics of urban expansion in China using DMSP-OLS nighttime light data from 1992 to 2008. Landsc. Urban Plan. 2012, 106, 62–72. [Google Scholar] [CrossRef]
- Li, H.; Wu, Y.; Huang, X.; Sloan, M.; Skitmore, M. Spatial-temporal evolution and classification of marginalization of cultivated land in the process of urbanization. Habitat Int. 2017, 61, 1–8. [Google Scholar] [CrossRef] [Green Version]
- Ma, X.; Tong, X.; Liu, S.; Li, C.; Ma, Z. A Multisource Remotely Sensed Data Oriented approach for Ghost City” Phenomenon Identification. IEEE J. Sel. Top. Appl. Earth Observ. Remote Sens. 2018, 99, 2310–2319. [Google Scholar] [CrossRef]
- Dong, L.; Pan, J.; Feng, Y.; Wang, W. Spatial Difference Pattern of House Vacancy in China from Nighttime Light View. Econ. Geogr. 2017, 37, 62–69. [Google Scholar]
- Liu, S.; Tong, X.; Bruzzone, L.; Du, P. A novel semisupervised framework for multiple change detection in hyperspectral images. In Proceedings of the 2017 IEEE International Geoscience and Remote Sensing Symposium, Fort Worth, TX, USA, 23–28 July 2017; pp. 173–176. [Google Scholar]
- Amarsaikhan, D.; Ganzorig, M.; Blotevogel, H.H.; Nergui, B.; Gantuya, R. Integrated approach to extract information from high and very high resolution RS images for urban planning. J. Geogr. Reg. Plan. 2009, 2, 258–267. [Google Scholar]
- Li, K.; Chen, Y. A Genetic Algorithm-Based Urban Cluster Automatic threshold approach by Combining VIIRS DNB, NDVI, and NDBI to Monitor Urbanization. Remote Sens. 2018, 10, 277. [Google Scholar] [CrossRef]
- Xu, H. A new index for delineating built-up land features in satellite imagery. Int. J. Remote Sens. 2008, 29, 4269–4276. [Google Scholar] [CrossRef]
- Xiang, D.; Tang, T.; Hu, C.; Fan, Q.; Su, Y. Built-up area extraction from polSAR imagery with model-based decomposition and polarimetric coherence. Remote Sens. 2016, 8, 685. [Google Scholar] [CrossRef]
- Pesaresi, M.; Gerhardinger, A.; Kayitakire, F. A robust built-up area presence index by anisotropic rotation-invariant textural measure. IEEE J. Sel. Top. Appl. Earth Observ. Remote Sens. 2008, 1, 180–192. [Google Scholar] [CrossRef]
- Waqar, M.M.; Mirza, J.F.; Mumtaz, R.; Hussain, E. Development of new indices for extraction of built-up area and bare soil from Landsat Data. Open Access Sci. Rep. 2012, 1, 1–4. [Google Scholar]
- Li, Y.; Tan, Y.; Deng, J.; Wen, Q.; Tian, J. Cauchy graph embedding optimization for built-up areas detection from high-resolution remote sensing images. IEEE J. Sel. Top. Appl. Earth Observ. Remote Sens. 2015, 8, 2078–2096. [Google Scholar] [CrossRef]
- Chen, Y.; Qin, K.; Jiang, H.; Wu, T.; Zhang, Y. Built-up area extraction using data field from high-resolution satellite images. In Proceedings of the 2016 IEEE International Geoscience and Remote Sensing Symposium, Beijing, China, 10–15 July 2016; pp. 437–440. [Google Scholar]
- Wang, X.; Liu, S.; Du, P.; Liang, H.; Xia, J.; Li, Y. Object-based change detection in urban areas from high spatial resolution images based on multiple features and ensemble learning. Remote Sens. 2018, 10, 276. [Google Scholar] [CrossRef]
- Su, Y.; Chen, X.; Wang, C.; Zhang, H.; Liao, J.; Ye, Y.; Wang, C. A new approach for extracting built-up urban areas using DMSP-OLS nighttime stable lights: A case study in the Pearl River Delta, Southern China. GISci. Remote Sens. 2015, 52, 218–238. [Google Scholar] [CrossRef]
- Xin, X.; Liu, B.; Di, K.; Zhu, Z.; Zhao, Z.; Liu, J.; Zhang, G. Monitoring urban expansion using time series of night-time light data: A case study in Wuhan. China. Int. J. Remote Sens. 2017, 38, 6110–6128. [Google Scholar] [CrossRef]
- Hu, T.; Huang, X.; Li, J.; Zhang, L. A novel co-training approach for urban land cover mapping with unclear Landsat time series imagery. Remote Sens. Environ. 2018, 217, 144–157. [Google Scholar] [CrossRef]
- Zhang, T.; Huang, X. Monitoring of Urban Impervious Surfaces Using Time Series of High-Resolution Remote Sensing Images in Rapidly Urbanized Areas: A Case Study of Shenzhen. IEEE J. Sel. Top. Appl. Earth Observ. Remote Sens. 2018, 11, 1–17. [Google Scholar] [CrossRef]
- Bhatti, S.S.; Tripathi, N.K. Built-up area extraction using Landsat 8 OLI imagery. GISci. Remote Sens. 2014, 51, 445–467. [Google Scholar] [CrossRef] [Green Version]
- Lin, J.; Liu, X.; Li, K.; Li, X. A maximum entropy approach to extract urban land by combining MODIS reflectance, MODIS NDVI, and DMSP-OLS data. Int. J. Remote Sens. 2014, 35, 6708–6727. [Google Scholar] [CrossRef]
- Huang, X.; Hu, T.; Li, J.; Wang, Q.; Benediktsson, J.A. Mapping Urban Areas in China Using Multisource Data with a Novel Ensemble SVM Method. IEEE Trans. Geosci. Remote Sens. 2018, 56, 4258–4273. [Google Scholar] [CrossRef]
- Shi, K.; Chen, Y.; Yu, B.; Xu, T.; Li, L.; Huang, C.; Liu, R.; Chen, Z.; Wu, J. Urban expansion and agricultural land loss in China: A multiscale perspective. Sustainability 2016, 8, 790. [Google Scholar] [CrossRef]
- Shi, K.; Yu, B.; Huang, C.; Wu, J.; Sun, X. Exploring spatiotemporal patterns of electric power consumption in countries along the Belt and Road. Energy 2018, 150, 847–859. [Google Scholar] [CrossRef]
- Zhou, N.; Hubacek, K.; Roberts, M. Analysis of spatial patterns of urban growth across South Asia using DMSP-OLS nighttime lights data. Appl. Geogr. 2015, 63, 292–303. [Google Scholar] [CrossRef]
- Li, A.; Zhang, Z.; Su, H.; Li, Y.; Lei, B. Research on “Ghost Town” Index Based on Landsat Data Products and DMSP/OLS Nighttime Light Data: A Case Research of Anhui Province. Sci. Mosaic 2017, 6, 172–176. [Google Scholar]
- Li, X.; Zhou, Y. A stepwise calibration of global DMSP/OLS stable nighttime light data (1992–2013). Remote Sens. 2017, 9, 637. [Google Scholar]
- Liang, D.; Zuo, Y.; Huang, L.; Zhao, J.; Teng, L.; Yang, F. Evaluation of the consistency of MODIS land cover product (MCD12Q1) based on Chinese 30 m GlobeLand30 datasets: A case study in Anhui Province, China. ISPRS Int. J. Geo-Inf. 2015, 4, 2519–2541. [Google Scholar] [CrossRef]
- Estoque, R.C.; Murayama, Y. Classification and change detection of built-up lands from Landsat-7 ETM+ and Landsat-8 OLI/TIRS imageries: A comparative assessment of various spectral indices. Ecol. Indic. 2015, 56, 205–217. [Google Scholar] [CrossRef]
- National Bureau of Statistics of the People’s Republic of China. China City Statistical Yearbook; China Statistics Press: Beijing, China, 2002.
- National Bureau of Statistics of the People’s Republic of China. China City Statistical Yearbook; China Statistics Press: Beijing, China, 2006.
- National Bureau of Statistics of the People’s Republic of China. China City Statistical Yearbook; China Statistics Press: Beijing, China, 2011.
- National Fundamental Geographic Information System, National Geomatics Center of China. Available online: http://ngcc.sbsm.gov.cn/ (accessed on 7 May 2019).
- Cao, Z.; Wu, Z.; Kuang, Y.; Huang, N. Correction of DMSP/OLS night-time light images and its application in China. J. Geo-Inf. Sci. 2015, 17, 1092–1102. [Google Scholar]
- Zhang, Q.; Wang, P.; Chen, H.; Huang, Q.; Jiang, H.; Zhang, Z.; Zhang, Y.; Luo, X.; Sun, S. A novel approach for urban area extraction from VIIRS DNB and MODIS NDVI data: A case study of Chinese cities. Int. J. Remote Sens. 2017, 38, 1–16. [Google Scholar] [CrossRef]
- Chao, Z.; Sheng, M. Study on extraction approachs for water information in Nantong city, China using Landsat7 ETM+ data. Int. Conf. Remote Sens. 2011, 51, 771–774. [Google Scholar]
- Chen, X.; Wen, X.; Guo, L. Study on urban heat island effect in Nanchang based on landsat 8 satellite images. Acta Agric. Jiangxi 2017, 29, 103–108. [Google Scholar]
- Ma, X.; Tong, X.; Liu, S.; Ma, Z. Extraction of built-up areas in Chinese silk road economic belt based on DMSP-OLS data. In Proceedings of the 2017 IEEE International Geoscience and Remote Sensing Symposium, Fort Worth, TX, USA, 23–28 July 2017; pp. 5877–5880. [Google Scholar]
- Jiang, W.; He, G.J.; Long, T.F.; Wang, C.; Ni, Y.; Ma, R.Q. Assessing light pollution in China based on nighttime light imagery. Remote Sens. 2017, 9, 135. [Google Scholar] [CrossRef]
- Small, C.; Pozzi, F.; Elvidge, C.D. Spatial Analysis of Global Urban Extent from DMSPOLS Night Lights. Remote Sens. Environ. 2005, 96, 277–291. [Google Scholar] [CrossRef]
- Shi, K.; Huang, C.; Yu, B.; Yin, B.; Huang, Y.; Wu, J. Evaluation of NPP-VIIRS night-time light composite data for extracting built-up urban areas. Remote Sens. Lett. 2014, 5, 358–366. [Google Scholar] [CrossRef]
- Wu, B.; Zhang, L.; Li, P. Unmixing of Hyperspectral Imagery Based on Probabilistic Outputs of Support Vector Machines. Geomat. Inf. Sci. 2006, 31, 51–54. [Google Scholar]
- Ma, X.; Tong, X.; Liu, S.; Luo, X.; Xie, H.; Li, C. Optimized sample selection in SVM classification by combining with DMSP-OLS, Landsat NDVI and globeland30 products for extracting urban built-up areas. Remote Sens. 2017, 9, 236. [Google Scholar] [CrossRef]
- He, C.; Shi, P.; Li, J.; Chen, J.; Pan, Y.; Li, J.; Zhuo, L.; Toshiaki, I. Study on the Reconstruction of China’s Urbanization Process in 1990s Based on DMSP/OLS Night Light Data and Statistical Data. Chin. Sci. Bull. 2006, 51, 856–861. [Google Scholar] [CrossRef]
Figure 1.
Nighttime light image covering nine Chinese provinces in the Silk Road Economic Belt in 2010.
Figure 1.
Nighttime light image covering nine Chinese provinces in the Silk Road Economic Belt in 2010.

Figure 2.
Flowchart of the proposed approach.

Figure 3.
Flowchart of multi-level Data Fusion.

Figure 4.
Selected samples in Landsat 7 ETM+ images, histogram of the normalized difference vegetation index (NDVI) (a) and the range of extreme values in Suzhou (b).
Figure 4.
Selected samples in Landsat 7 ETM+ images, histogram of the normalized difference vegetation index (NDVI) (a) and the range of extreme values in Suzhou (b).

Figure 5.
Sample selection results for NDVI, modified normalized difference water index (MNDWI), and bare soil index (BSI) in Suzhou: (a) a false color composite of the ETM+ image; (b) candidate NDVI samples; (c) candidate MNDWI samples; (d) candidate BSI samples.
Figure 5.
Sample selection results for NDVI, modified normalized difference water index (MNDWI), and bare soil index (BSI) in Suzhou: (a) a false color composite of the ETM+ image; (b) candidate NDVI samples; (c) candidate MNDWI samples; (d) candidate BSI samples.

Figure 6.
The dynamics of urban expansion in domestic cities, such as the local areas in (A) Sichuan, (B) Chongqing, (C) Yunnan, and (D) Guangxi, along the Silk Road Economic Belt in China from 2001 to 2010.
Figure 6.
The dynamics of urban expansion in domestic cities, such as the local areas in (A) Sichuan, (B) Chongqing, (C) Yunnan, and (D) Guangxi, along the Silk Road Economic Belt in China from 2001 to 2010.

Figure 7.
Results of built-up area extraction in 2010 by the proposed approach and several reference methods. (a) The Defense Meteorological Satellite Program-Operational Linescan System (DMSP-OLS) image; (b) the Landsat 7 ETM+ image; (c) the threshold dichotomy method; (d) the improved neighborhood focal statistics (NFS) method; (e) the proposed method; (f) the ETM+ fusion image extraction.


Table 1.
Description of the Multisource remote sensing data sets used in this study.
| Data Source | Product Description | Spatial Resolution | Time |
|---|---|---|---|
| DMSP-OLS data | Yearly stable nighttime light composites, which show the average nighttime light intensity, including light emission from fires disasters, large-scale burning, the surface of the sea and cities at night with an anti-interference function to reduce the noise caused by clouds and water. | 2 km | 2001 to 2010 |
| MODIS landcover product | MCD12Q1 product, which is obtained from annual Terra and Aqua observations, usually describing 17 types of land cover surfaces, including 11 natural vegetation types, 3 land-development and inlay types, and 3 types other than vegetation and developed land. | 0.5 km | |
| Landsat 7 ETM+ images | Sensor with Enhanced Thematic Mapper Plus (ETM+) equipment, which induces surface reflection of the solar radiation and thermal radiation, including 8 bands of sensors covering different wavelengths from infrared to visible light. | 30 m | 2010 |
Table 2.
Comparison of the obtained accuracy and error values among the different algorithms.
| Study Areas | Method | Kappa | OA (%) | CE (%) | OE (%) |
|---|---|---|---|---|---|
| Chengdu | Threshold dichotomy | 0.67 | 88.65 | 41.67 | 11.59 |
| Improved NFS | 0.72 | 91.41 | 37.52 | 3.79 | |
| Proposed method | 0.78 | 95.38 | 18.98 | 10.99 | |
| Kunming | Threshold dichotomy | 0.76 | 86.73 | 29.31 | 25.49 |
| Improved NFS | 0.80 | 90.49 | 5.98 | 28.23 | |
| Proposed method | 0.85 | 97.98 | 13.42 | 12.86 | |
| Nanning | Threshold dichotomy | 0.69 | 88.42 | 39.01 | 43.65 |
| Improved NFS | 0.72 | 92.37 | 37.85 | 10.86 | |
| Proposed method | 0.80 | 98.16 | 17.95 | 12.63 | |
| Chongqing | Threshold dichotomy | 0.81 | 90.11 | 31.57 | 12.83 |
| Improved NFS | 0.84 | 93.94 | 23.40 | 4.71 | |
| Proposed method | 0.92 | 98.42 | 13.19 | 2.99 |
© 2019 by the authors. Licensee MDPI, Basel, Switzerland. This article is an open access article distributed under the terms and conditions of the Creative Commons Attribution (CC BY) license (http://creativecommons.org/licenses/by/4.0/).
Share and Cite
MDPI and ACS Style
Ma, X.; Li, C.; Tong, X.; Liu, S. A New Fusion Approach for Extracting Urban Built-up Areas from Multisource Remotely Sensed Data. Remote Sens. 2019, 11, 2516. https://0-doi-org.brum.beds.ac.uk/10.3390/rs11212516
AMA Style
Ma X, Li C, Tong X, Liu S. A New Fusion Approach for Extracting Urban Built-up Areas from Multisource Remotely Sensed Data. Remote Sensing. 2019; 11(21):2516. https://0-doi-org.brum.beds.ac.uk/10.3390/rs11212516
Chicago/Turabian StyleMa, Xiaolong, Chengming Li, Xiaohua Tong, and Sicong Liu. 2019. "A New Fusion Approach for Extracting Urban Built-up Areas from Multisource Remotely Sensed Data" Remote Sensing 11, no. 21: 2516. https://0-doi-org.brum.beds.ac.uk/10.3390/rs11212516
Note that from the first issue of 2016, this journal uses article numbers instead of page numbers. See further details here.