Article

Co-Seismic Deformation and Fault Slip Model of the 2017 Mw 7.3 Darbandikhan, Iran–Iraq Earthquake Inferred from D-InSAR Measurements

The National Key Laboratory of Earthquake Dynamics, Institute of Geology, China Earthquake Administration, Beijing 100029, China
*
Author to whom correspondence should be addressed.
Remote Sens. 2019, 11(21), 2521; https://0-doi-org.brum.beds.ac.uk/10.3390/rs11212521
Submission received: 27 September 2019 / Revised: 24 October 2019 / Accepted: 24 October 2019 / Published: 28 October 2019

Abstract

:
The 12 November 2017 Darbandikhan earthquake (Mw 7.3) occurred along the converence zone. Despite the extensive research on this earthquake, none of this work explained whether this earthquake rupture was limited to the thick sedimentary cover or it extends to the underlying crystalline basement rock (or both). Besides, whether this region will generate devastating earthquakes again and whether there is a one-to-one correlation between these anticlines and blind-reverse faults need further investigation. In this study, we derived the co-seismic interferograms from the Sentinel-1A/B data and successfully described the surface deformation of the main seismic zone. The fringe patterns of both the ascending and descending interferograms show that the co-seismic deformation is dominated by horizontal movements. Then, using the along- and across-track deformation fields of different orbits, we retrieved the three-dimensional deformation field, which suggests that the Darbandikhan earthquake may be a blind thrust fault close to the north–south direction. Finally, we inverted the geometrical parameters of the seismogenic fault and the slip distribution of the fault plane. The results show that the source fault has an average strike of 355.5° and a northeast dip angle of −17.5°. In addition, the Darbandikhan earthquake has an average rake of 135.5°, with the maximum slip of 4.5 m at 14.5 km depth. On the basis of the derived depth and the aftershock information provided by the Iranian Seismological Center, we inferred that this event primarily ruptured within the crystalline basement and the seismogenic fault is the Zagros Mountain Front Fault (MFF). The seismogenic region has both relatively low historical seismicity and convergent strain rate, which suggests that the vicinity of the epicenter may have absorbed the majority of the energy released by the convergence between the Arabian and the Eurasian plates and may generate Mw > 7 earthquakes again. Moreover, the Zagros front fold between the Lurestan Arc and the Kirkuk Embayment may be generated by the long-distance slippage of the uppermost sedimentary cover in response to the sudden shortening of the MFF basement. We thus conclude that the master blind thrust may control the generation of the Zagros front folding.

1. Introduction

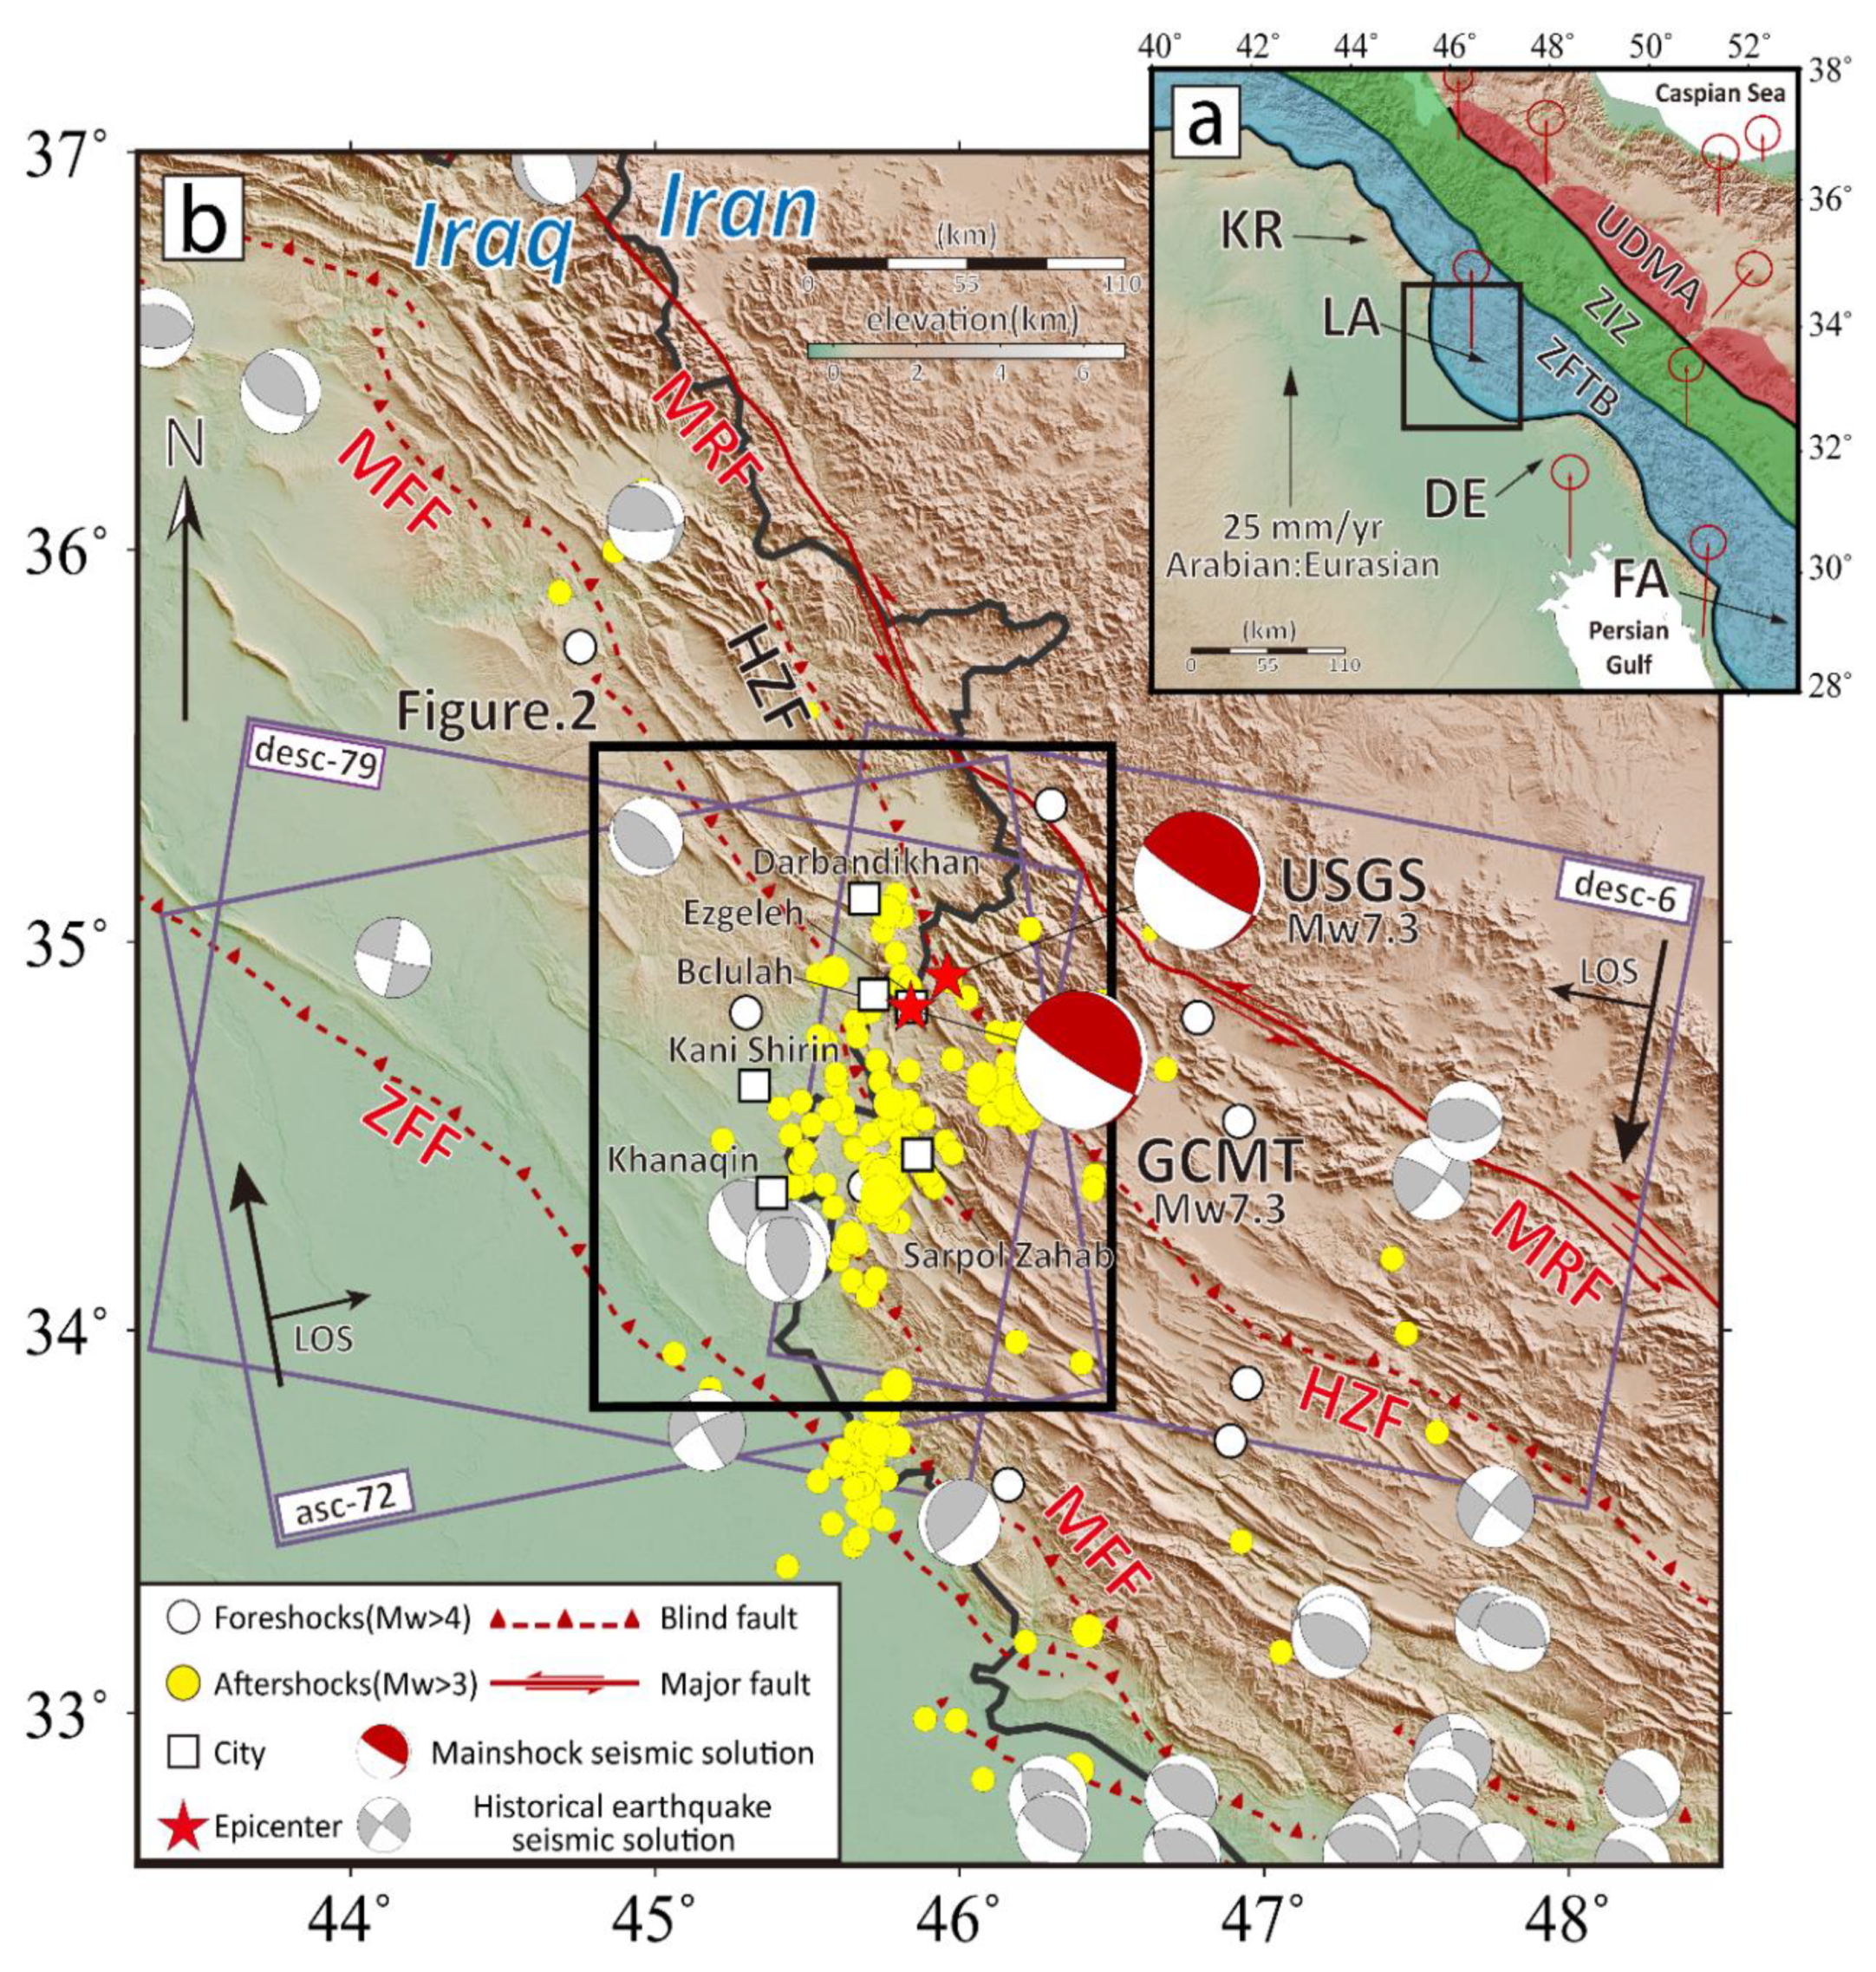
1.1. The Darbandikhan Earthquake

According to USGS-NEIC, on 12 November 2017, an Mw 7.3 earthquake occurred in Darbandikhan (hereafter referred to as ‘the Darbandikhan earthquake’), −50 km northwest of Sarpol-e Zahab city, on the Iran–Iraq border. This earthquake was the largest one in the northwest of Zagros Fold-and-Thrust Belt (ZFTB) ever recorded by the seismic instrument. According to the initial field investigation of the International Institute of Earthquake Engineering and Seismology (IIEES), the earthquake caused serious structure damage to the cities of Sarpol-e Zahab and Qasr Shirin and hundreds of casualties and thousands of injuries [1]. There were three foreshocks with the magnitude over 4.0, and the largest one (Mw 4.4) occurred just 60 km southwest to the location of the main shock. Within 200 days after the main shock, thousands of aftershocks (Mw > 2.5) occurred in the 150 km2 area around the epicenter (Figure 1).
The focal mechanism solutions from the U.S. Geological Survey (USGS) and Global Centroid Moment Tensor (GCMT) suggest that the Darbandikhan earthquake occurred on a slightly oblique thrust fault with a centroid depth of 20 km (Table 1). As noted, traditional seismology solutions have large uncertainties, especially the focal depth. The depth of the source mechanism given by various agencies vary a lot, ranging from 15–20 km. The geological hazard assessment conducted by the Geological Survey of Iran show that many landslides, avalanche, rock falls, and cracks were observed in the Sarpol-e Zahab region and Ezgaleh city. In Ezgaleh city, some surface cracks have been found [3], but no co-seismic surfaces ruptures associated with the causative faults were found [4,5]. Therefore, it is not straightforward to identify the seismic source fault related the Darbandikhan earthquake using tradition. Other methods, such as satellite geodesy, may be helpful to improve the understanding of the co-seismic deformation, the source fault, and its slip distribution related to the earthquake.
Interferometric synthetic aperture radar (InSAR) and global positioning system (GPS) can obtain detailed co-seismic deformation with high precision. However, due to the sparse distribution of GPS stations in the northwest of ZFTB, there is insufficient information for constructing fault geometry (Figure 1). InSAR has been adopted to acquire the co-seismic deformation field and investigate parameters of the source model in the Darbandikhan earthquake. For instance, [6] retrieved co-seismic and early post-seismic deformation fields using a series of Sentintel-1 data and reported that the co-seismic ruptures concentrate on a shallowly dipping thrust fault within the crystalline Arabian basement, while the Darbandikhan earthquake generated stress-driven afterslip on the basal decollement at a depth of 10–13 km. [7] used both the Sentinel-1 and Alos-2 data to restore the co-seismic deformation field and found two large-slip asperities with a maximum slip of 6 m at the fault plane. Using similar geodetic data, [5] reconstructed the three-dimensional (3D) deformation field by the multiple aperture InSAR (MAI) and azimuth pixel offset (AZO) methods. Table 1 lists the focal mechanism solution of different researchers and institutions. Although the previous studies have obtained co-seismic deformation field and the co-seismic source parameters, a little attention has been paid to distinguish whether there are multiple slip centers on the fault plane.

1.2. Tectonic Setting

The Zagros orogenic belt locates in the collision zone between the Arabian and Eurasia plates and it accommodates approximately one-third of the N–S shortening (25 mm yr−1) between the two plates [2]. In terms of the topography, structure, and lithology, the Zagros orogenic belt can be divided into three parallel tectonic zones: The Uremiah–Dokhtar magmatic assemblage (UMDA), the Zagros imbricate zone (ZIZ), and the Zagros fold-and-thrust belt (ZFTB). ZFTB, one of the most seismically active thrust zones [2], can be further divided into four parts from northwest to southeast: The Kikuk Embayment, the Lurestan Arc, the Dezful Embayment, and the Fars Arc [6]. The major active faults in ZFTB, including the Zagros Main Recent Fault (MRF), the High Zagros Fault (HZF), the Zagros Mountain Front Fault (MFF), and the Zagros Foredeep Fault (ZFF), mostly trending NW–SE and NNW–SSE with dips 30–60° and rakes of 60–120° along the plate boundary [8].
Most of the earthquakes at Zagros occurred in ZFTB, and most of them are moderate earthquakes (Mw 5–6). The instrumental seismicity rate significantly increases from the northwest to southeast of ZFTB [9]. The Darbandikhan earthquake occurred close to the convergence boundary between the two plates, where very few large historical earthquakes have been recorded, and only two of them have a magnitude of over 6.5 [10]. Therefore, the Darbandikhan earthquake provides a valuable opportunity to further research, such as the potential seismic risks of the seismogenic fault in Zagros.
Focusing on the fault geometry of the slip distribution model of the Darbandikhan earthquake, this study employed three pairs of SAR images covering the seismic zone obtained by the European Space Agency′s Sentinel-1A and 1B satellites to derive three co-seismic interferograms and co-seismic ground deformation from three different viewing geometries (paths) with the GAMMA software package. We derive the 3D co-seismic deformation using the along- and across-track deformation field of different orbits and analyzed the 3D co-seismic deformation field. Then the geometry of the source fault and its associate fault slip distribution were retrieved on the basis of the deformation data. Finally, we discussed the characteristics of the seismogenic fault and its implications to potential earthquake hazards as well as the relationship between the causative fault and local active folding.

2. InSAR Measurements

2.1. SAR Interferometry

Spatially dense remote sensing geodetic observations of surface displacements provide a strong constraint for determining the subsurface fault locations and geometries [11,12]. In this study, we used both ascending and descending orbits of the Sentinel-1A and 1B data from the European Space Agency (https://scihub.copernicus.eu/dhus/#/home) to generate the co-seismic interferograms covering the entire seismic zone of the Darbandikhan earthquake. Three Sentinel-1 tracks acquired separately on the fifth, sixth, and seventh day after the mainshock for ascending and descending orbits were selected to minimize the post-seismic effect. The perpendicular baselines of the image pairs were shorter than 100 m (Table 2), which ensure good coherence of interferograms in the barren land in Iran and Iraq [13]. The detail parameters and image coverage are presented in Table 2 and Figure 1, respectively.
The differential interferometric processing of all single look complex (SLC) data was done by the GAMMA software package, which was developed by GAMMA Remote Sensing and Consulting AG, Bern, Switzerland [14]. Firstly, the Sentinel-1A/B TOPS SAR data were processed by high accuracy (1/1000 pixels) co-registration in the azimuth direction [15]. Then, we derived interferograms from the 3 arcsec Shuttle Radar Topography Mission (SRTM). After the topographic contributions were eliminated [16], the interferograms were downsampled with multilook factors of 10 and 2 in azimuth and range, respectively, to improve the signal quality and phase unwrapping. Then, the adaptive spectral filter [17] was used to reduce the noise. After masking the low coherence area, phase unwrapping was carried out by the minimum cost flow (MCF) algorithm [18,19]. The reference point, which is considered to have non-deformation, was selected far away from the co-seismic displacement field. Finally, we used an empirical linear model [20] to remove the topography-correlated atmospheric phases.

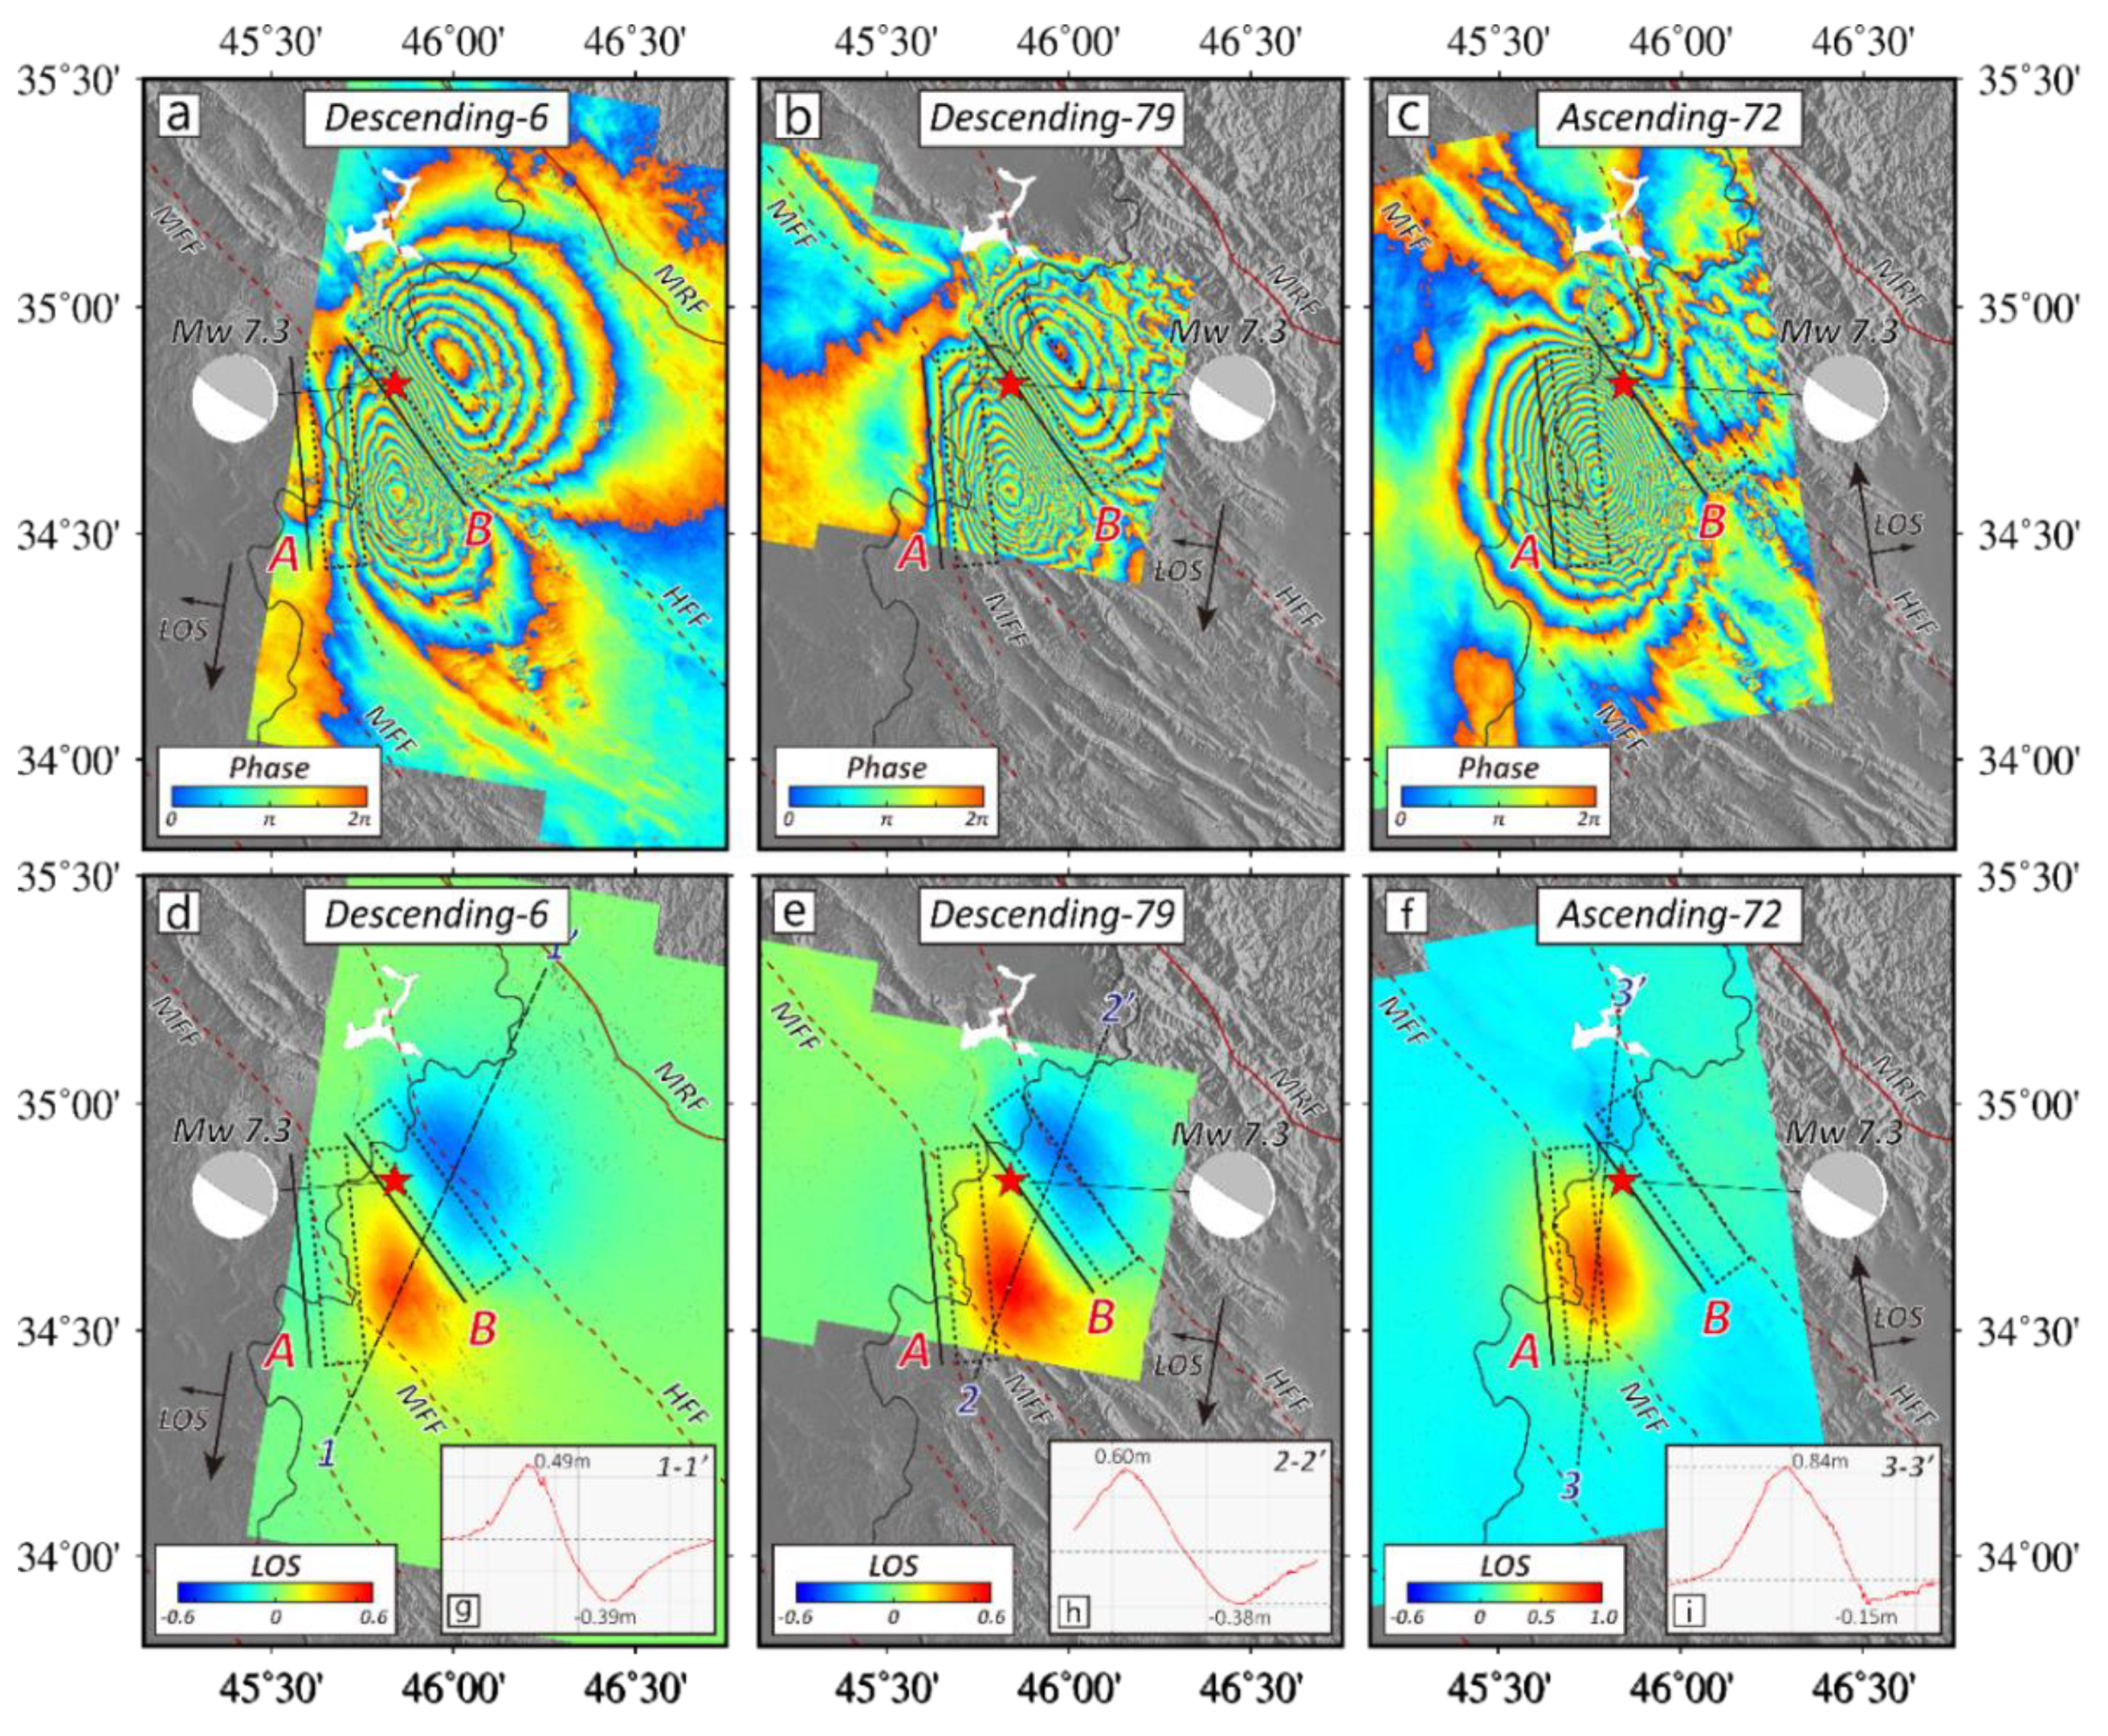
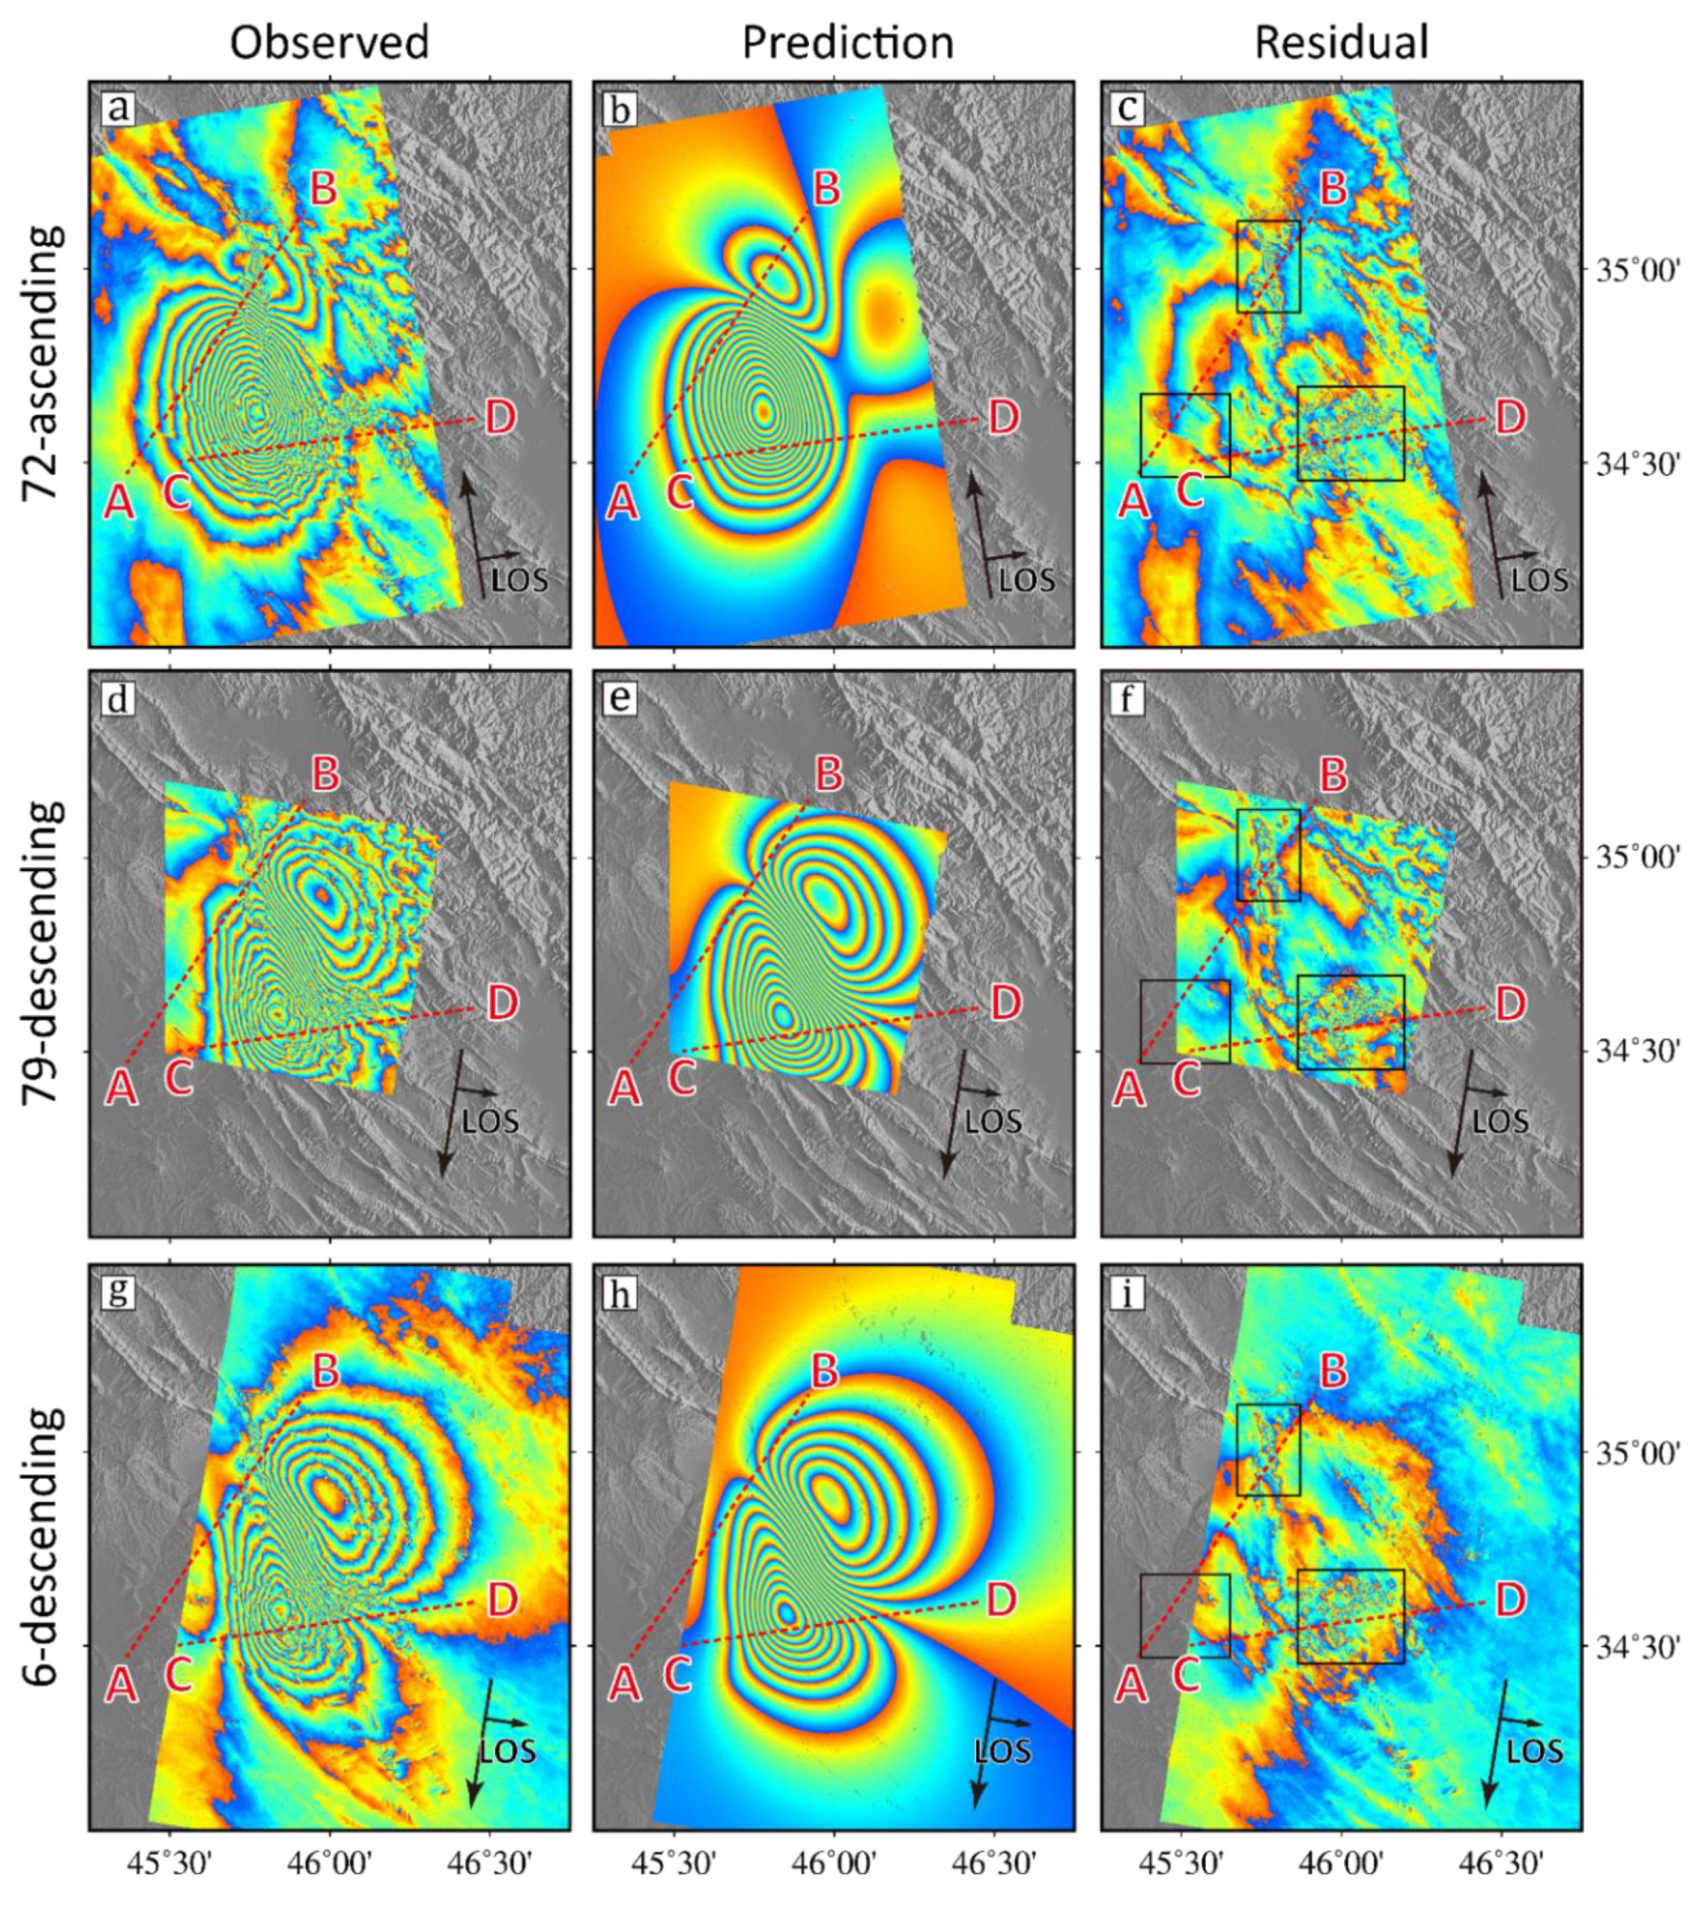
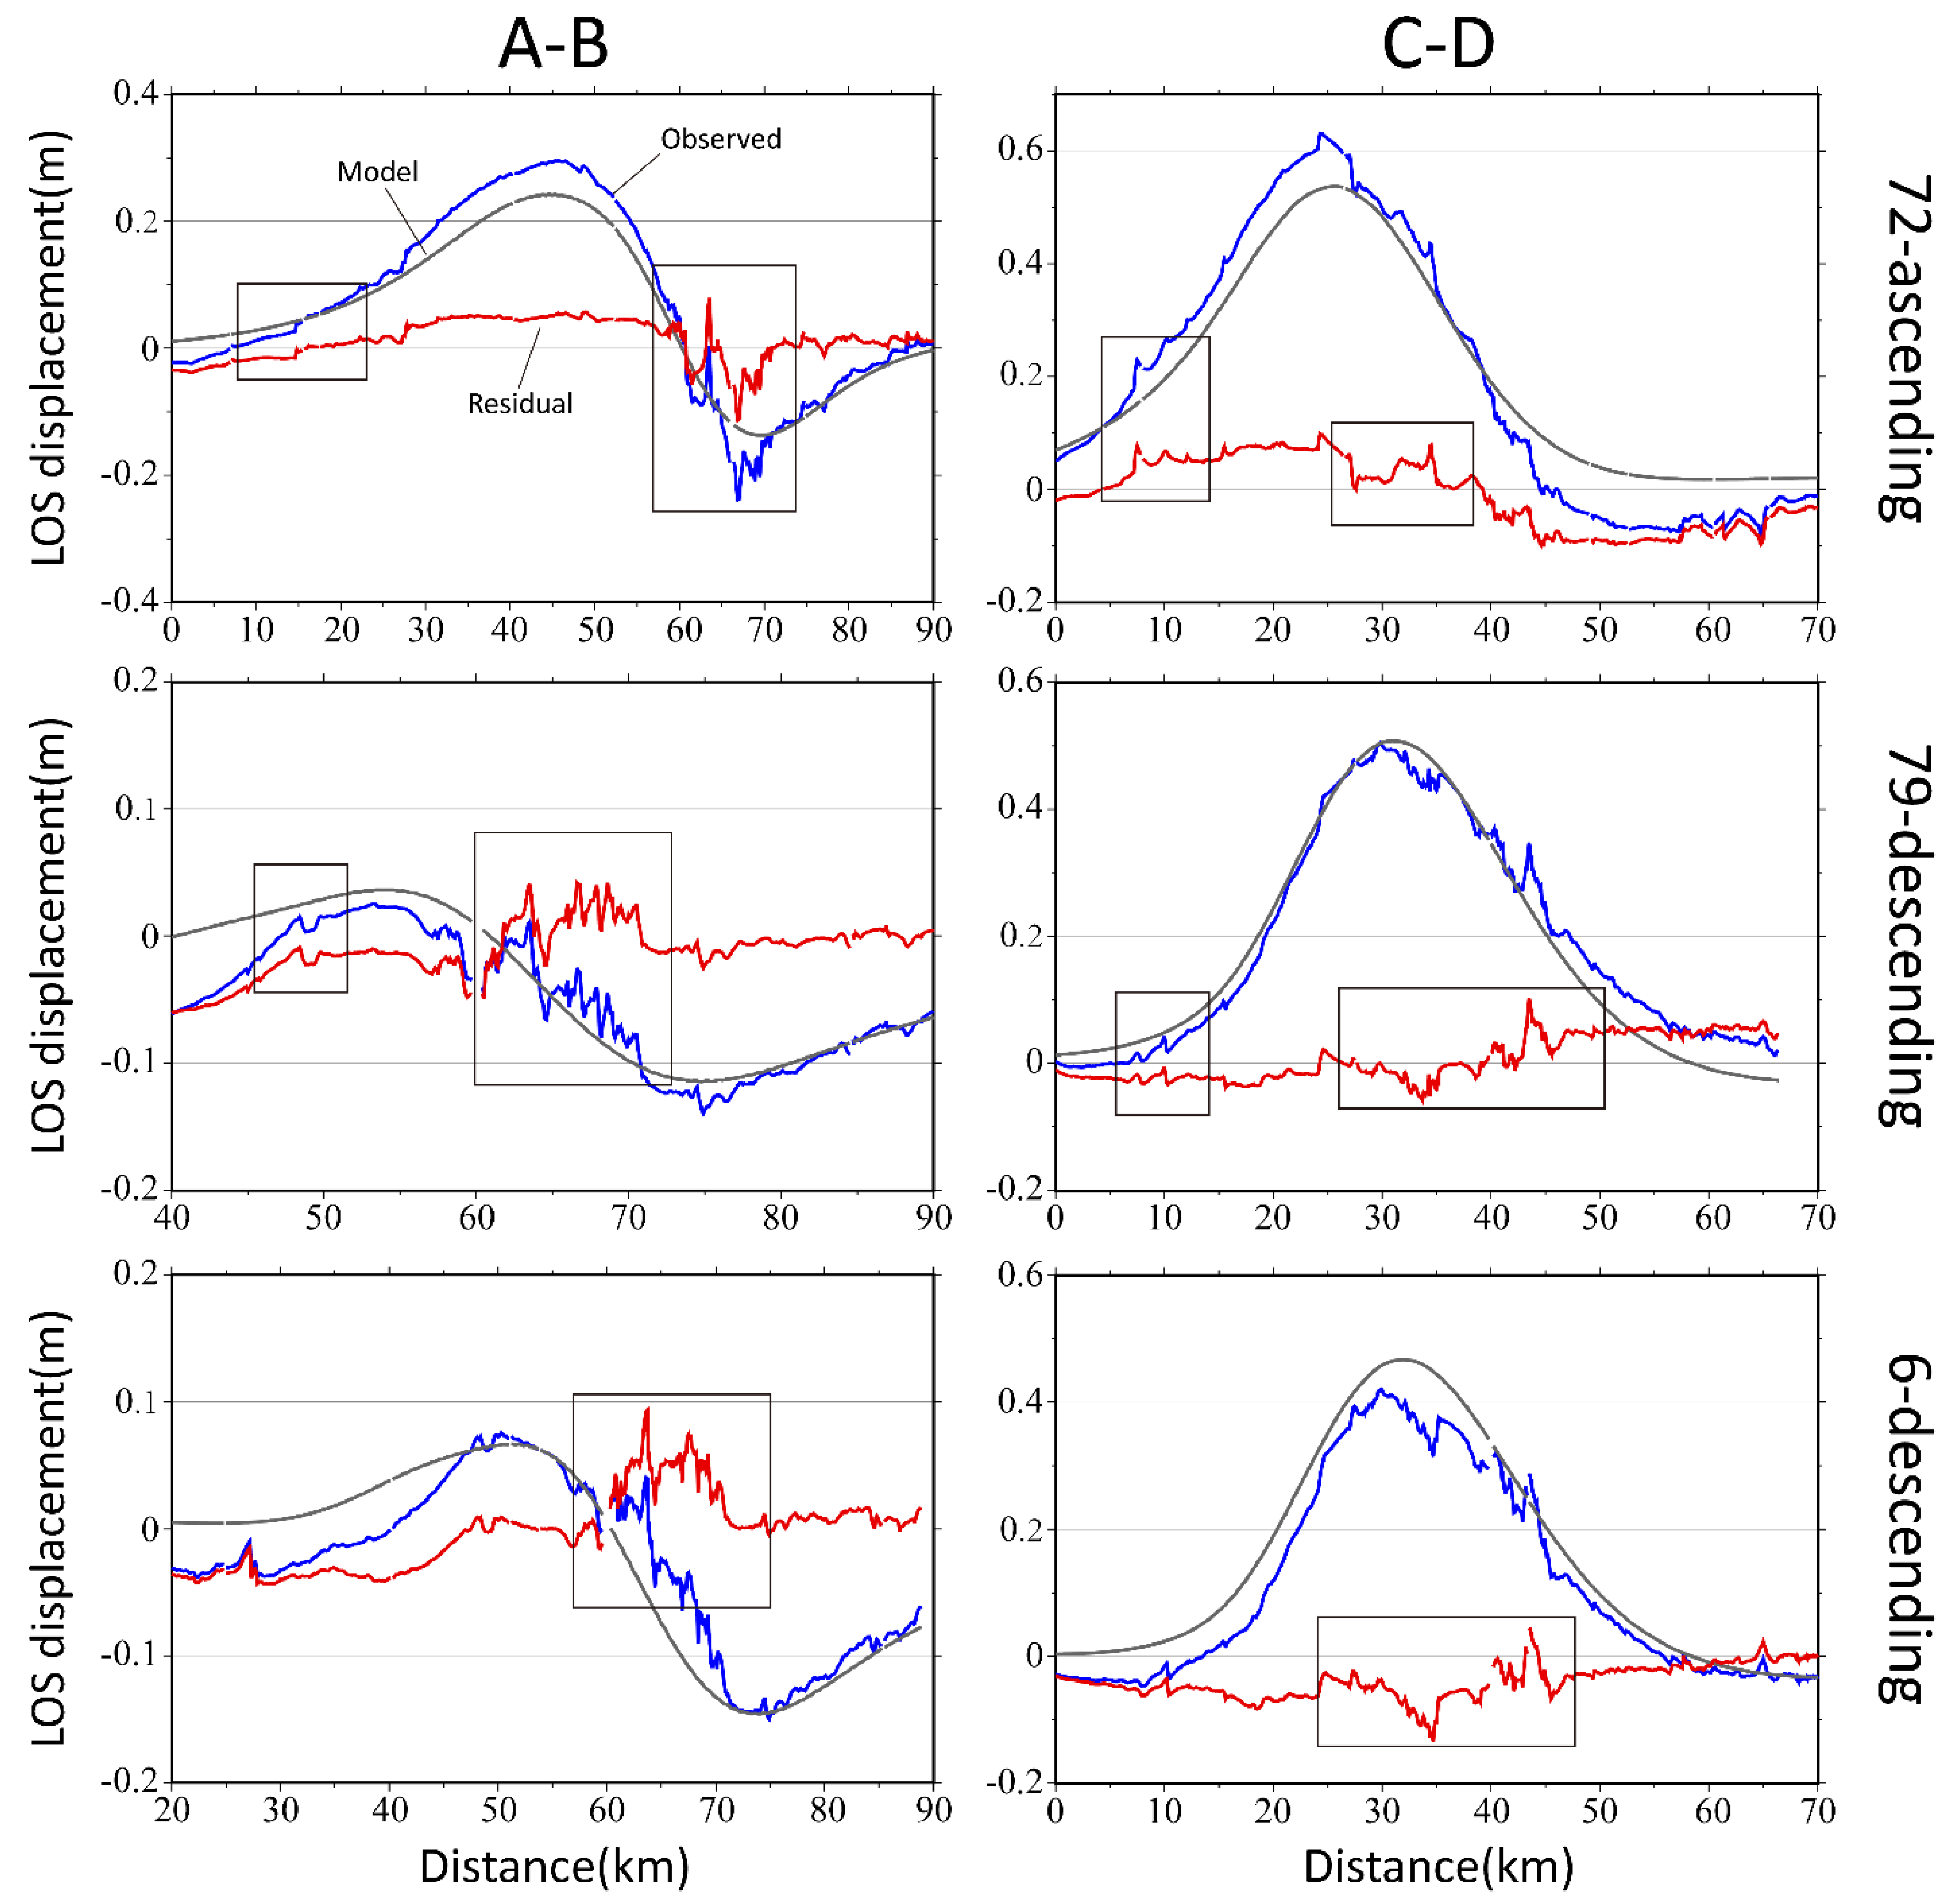
2.2. Coseismic Interferograms

Figure 2 shows the multiple co-seismic line-of-sight (LOS) displacement field derived from the Sentinel-1A and 1B data. In the descending orbit, the interferometric fringe pattern (Figure 2a,b) and displacement fields (Figure 2d,e) of tracks 6 and 79 present similar elliptical-shaped lobes. For these two tracks, the maximum uplifts in the southwestern lobe are 49 cm and 60 cm and the minimum subsidence in the northeastern lobe are 39 cm and 38 cm, respectively. In the descending track 6, the earthquake is in the far field of the SAR image with an incidence angle of −43.9°, which is almost equally sensitive to the vertical and the east–west ground displacements. In track 79, the near field incidence angle of the SAR image is −33.9°, leading to larger sensitivity in the vertical deformation than the east–west ground deformation. In the ascending orbit (track 72), the interferometric fringe pattern (Figure 2c) and displacement field (Figure 2f) show the maximum value in the southwestern lobe of about 84 cm, and the minimum value in the northeastern lobe along the line-of-sight (LOS) of 15 cm. The slant range shortening and lengthening signals of the ascending and descending tracks are completely different, indicating that the surface deformation of the Darbandilkhan earthquake is dominated by a horizontal east–west (EW) component.

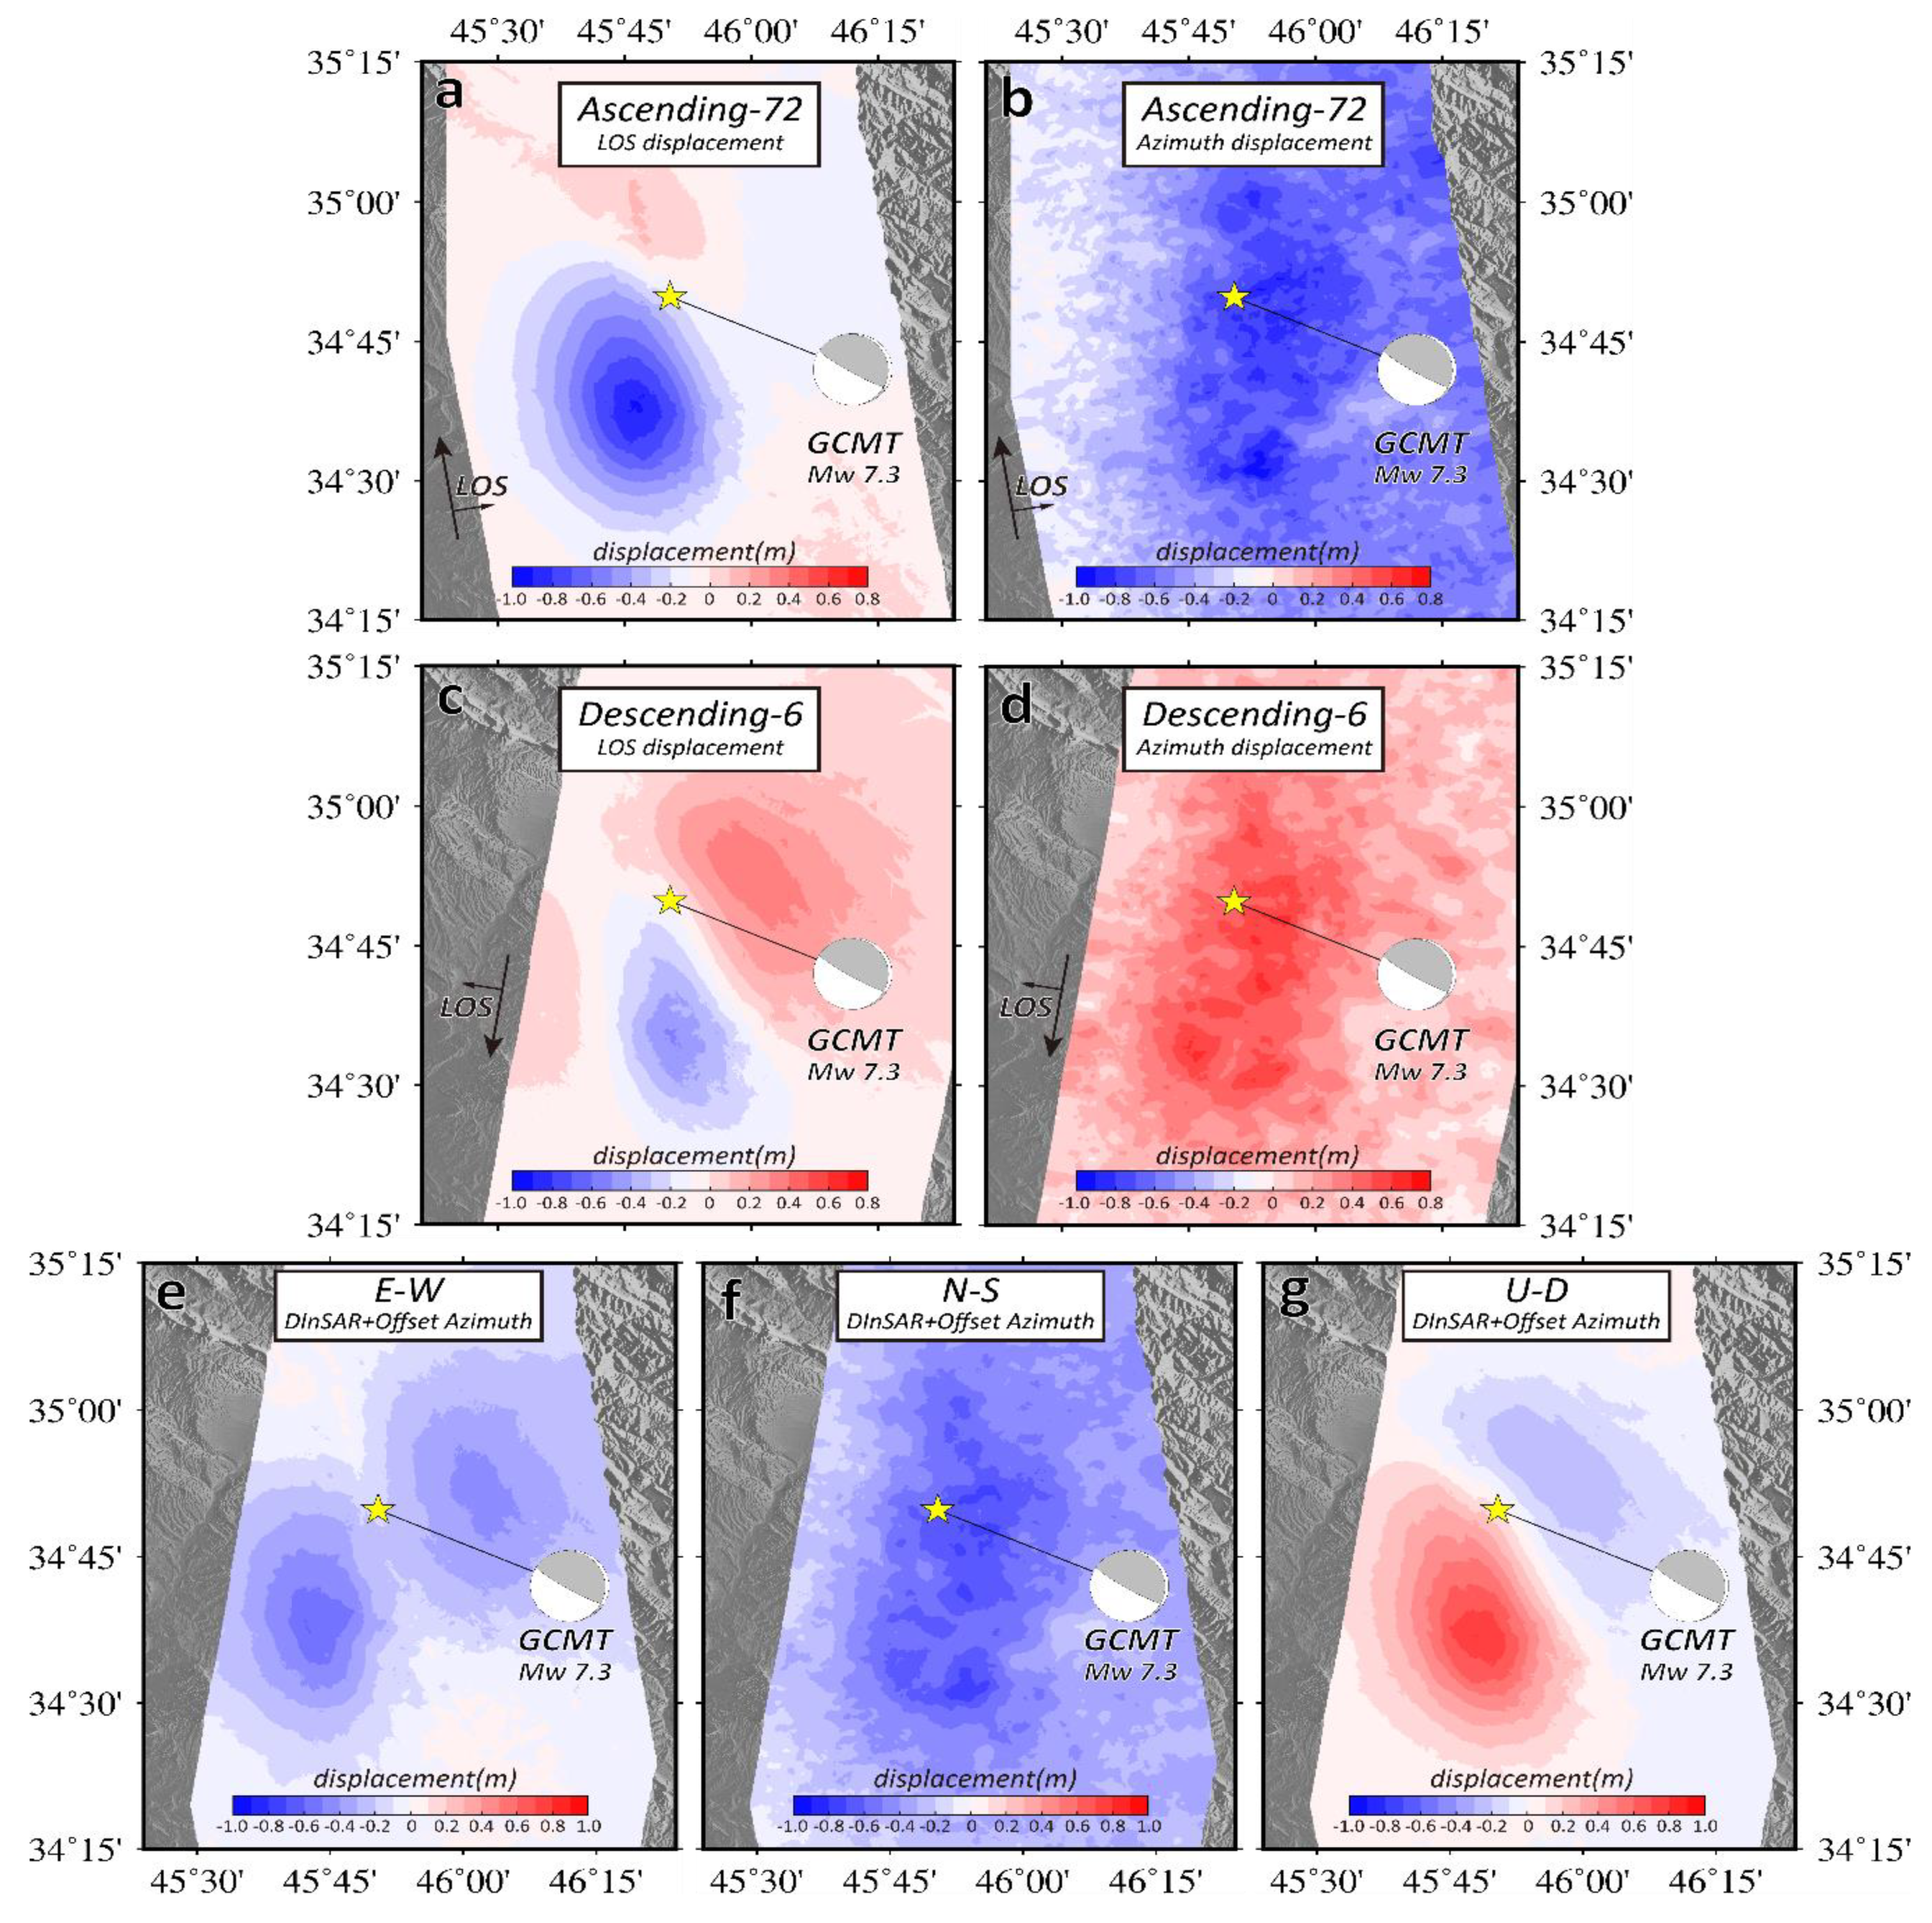
3. Determination of the Three-Dimensional (3D) Coseismic Displacement Field

3.1. Methodology

The ground deformation field, limited to the single direction (LOS), can be decomposed into three mutually perpendicular components (east–west, north–south, and up–down). Theoretically, we can obtain the three-dimensional deformation field utilizing multiple InSAR measurement results acquired by different SAR satellites [21]. However, this method is not applicable in the Darbandikhan earthquake because of three reasons. First, most current SAR satellites fly in near-polar orbits, so the acquired SAR data is not quite sensitive to the north–south deformation. Second, the interferograms of different satellites are right-looking. Third, the source mechanism of different organization (Table 1) indicate that this earthquake had a strike-slip movement close to the north–south direction accompanied by large deformations. The along-track deformation field, extracted from each interferometric pair, can overcome the limitations of LOS deformation and acquire reliable results. Therefore, combining the LOS and along-track measurements, we can get the complete 3D displacement.
In this study, we mapped the complete 3D co-seismic surface of the earthquake by integrating the ascending (track 72) and descending orbits (track 6) LOS measurements derived from D-InSAR and the along-track measurements derived from offset-tracking (Figure 3). The offset-tracking method searches the corresponding point on the amplitude images by the cross-correlation technique [22,23] and calculates the selected points′ azimuth offsets. Then, the robust azimuth offset of the surface deformation can be got by subtracting the components of the topographic relief and orbit trend separation [24]. Given four independent components (LOS and along-track directions) (Figure 3a–c), we can directly obtain the 3D surface deformation.

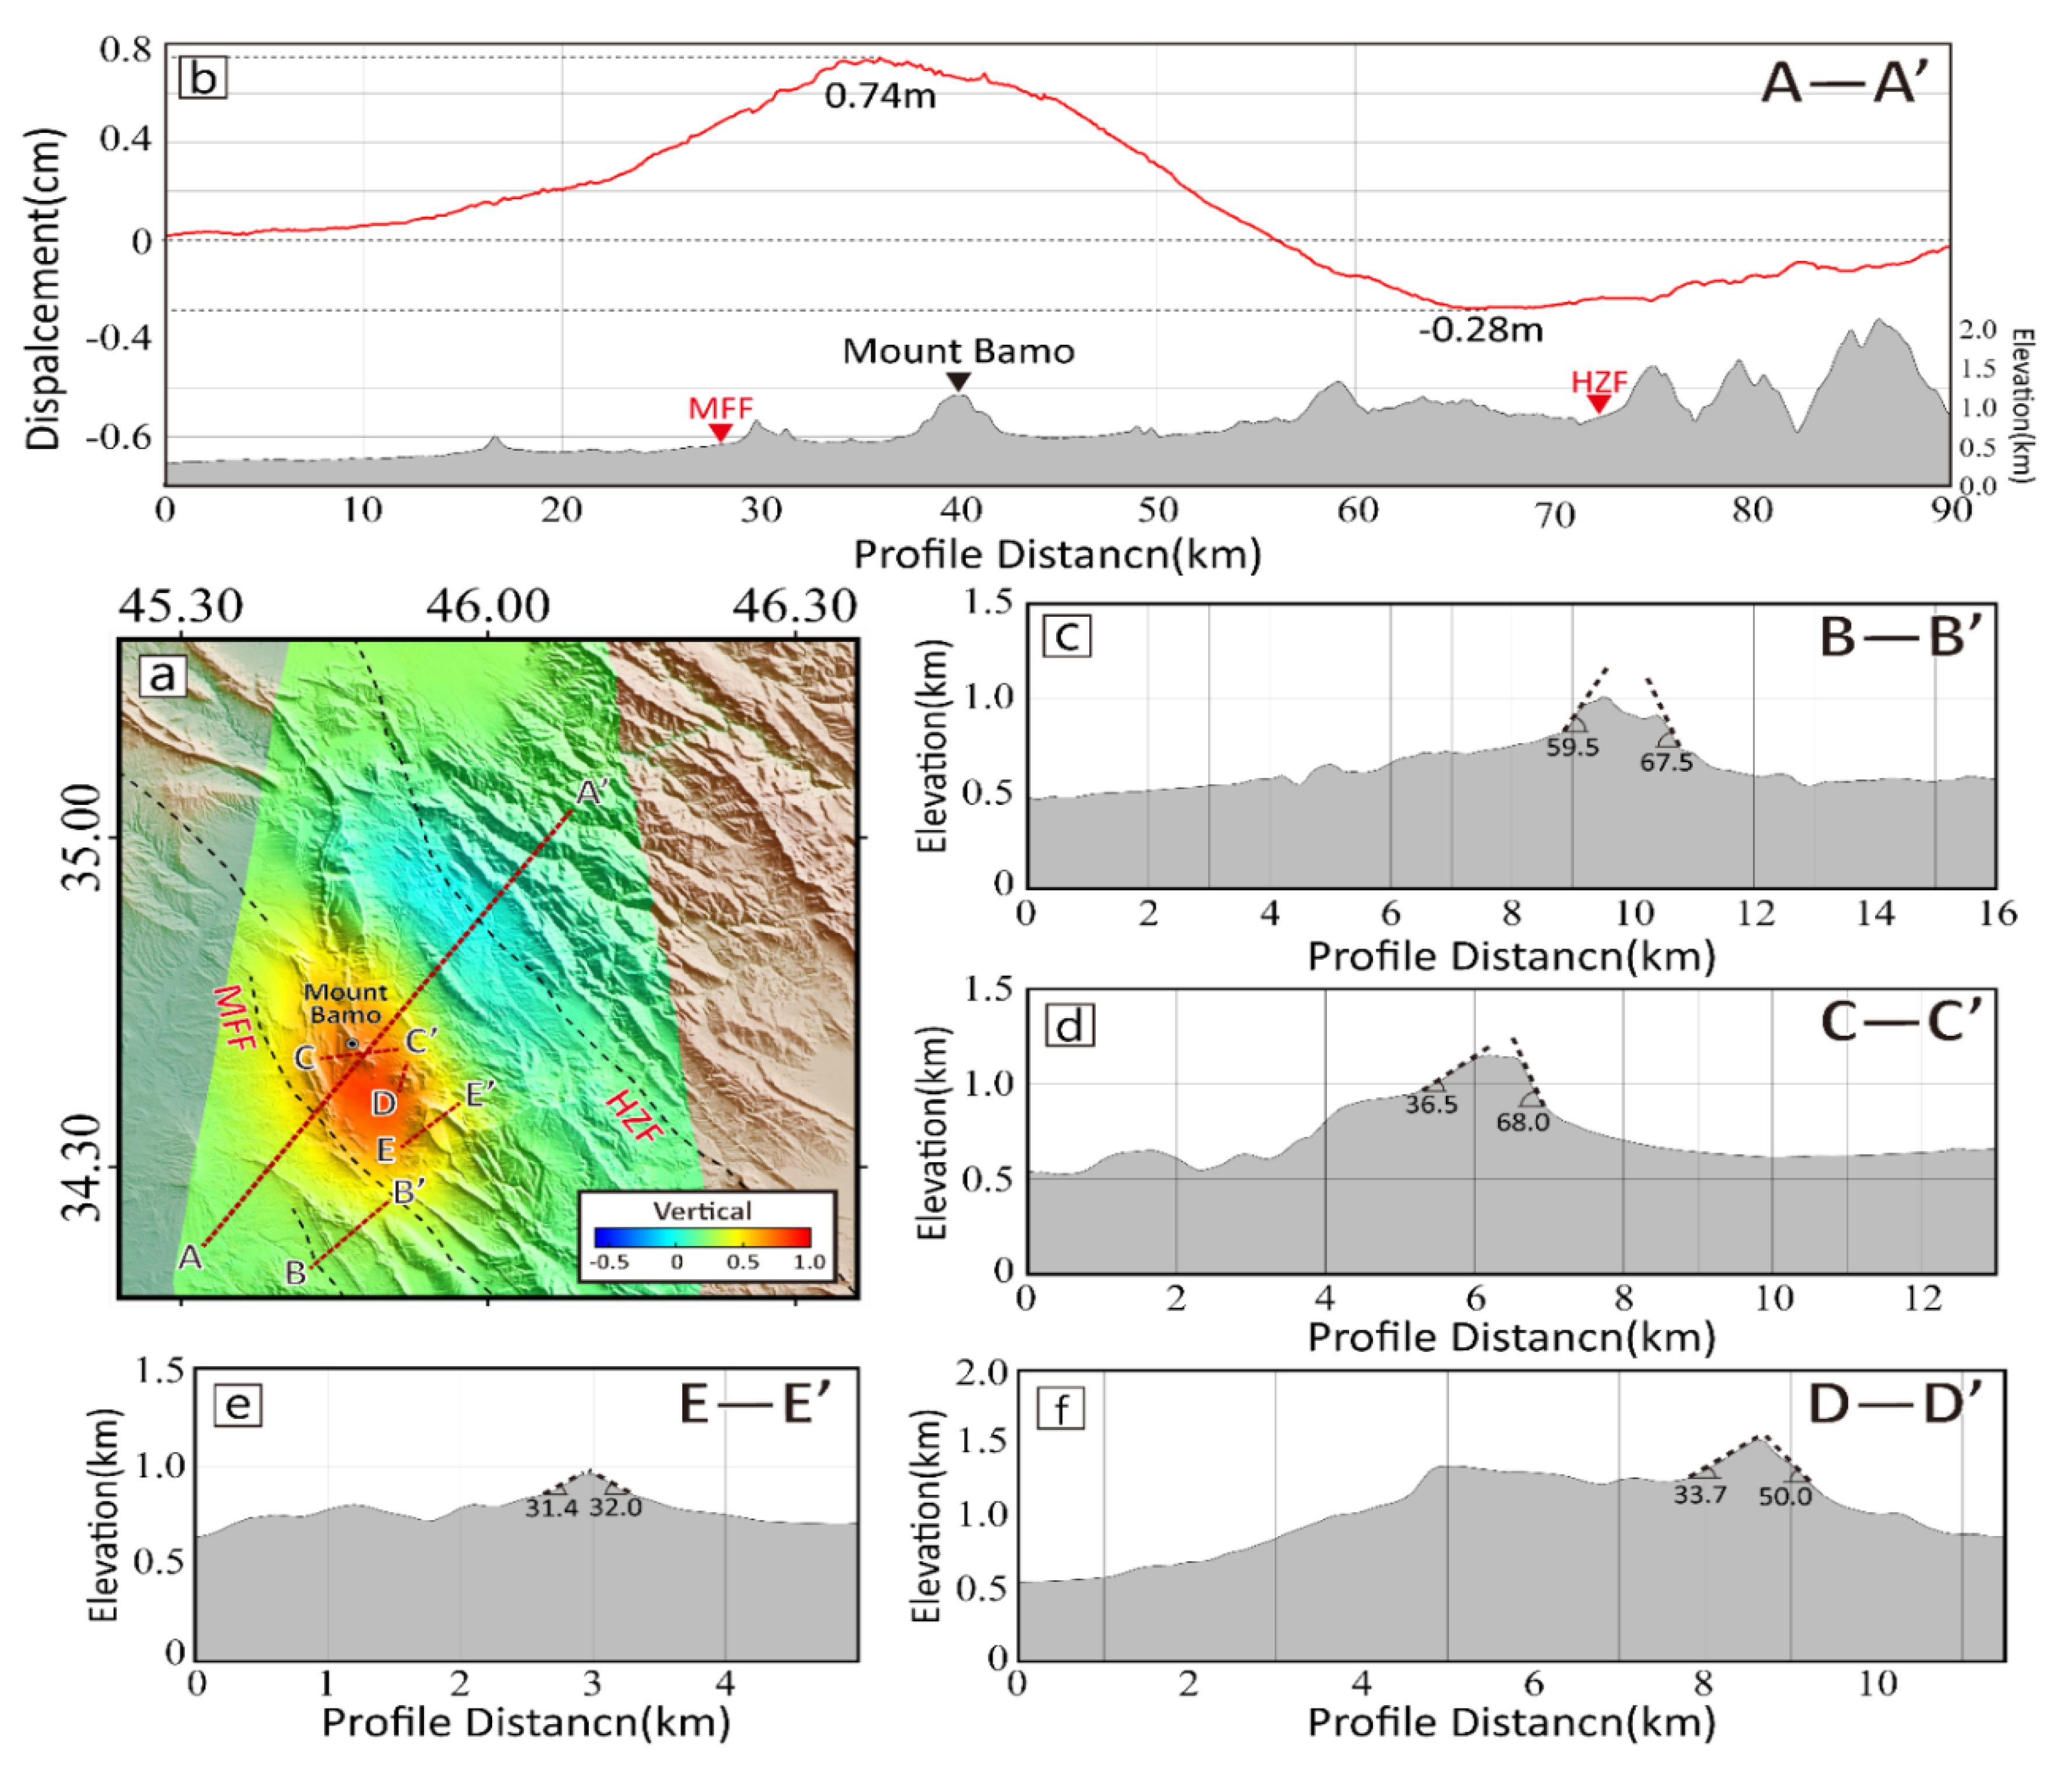
3.2. Analysis on the 3D Co-Seismic Deformation Field

The full 3D co-seismic surface deformation of the Darbandikhan earthquake are shown in Figure 3e–g. There are significant deformation in the region around the epicenter in all the three directions, especially in the east–west and up–down direction. In the east–west direction, the solution area is characterized by westward movement and the maximum displacement can is −0.65 m. In the north–south direction, there is no horizontal displacement toward the north and the maximum deformation is −0.73 m. Therefore, the horizontal displacement is toward southwest, which suggests that the region with co-seismic deformation mainly concentrates in the northeast part of the seismogenic fault. This conclusion is similar to the focal mechanism solution from USGS. In the vertical direction, there are two significant lobes in the main rupture region. The maximum uplift is −0.81 m and the maximum subsidence is −0.28 m. The huge value difference between the uplift and the subsidence lobes on the two sides of the fault confirms the thrust movement. Moreover, the field geological survey shows that there is no surface rupture related to the seismogenic fault. Therefore, this earthquake might be caused by a blind thrust fault close to north–south with the deformation field concentrating on the northwest side of the fault.

4. Fault Slip Distribution Inversion

4.1. Inversion Method

There is no obvious discontinuity between the simple two-lobe signal in either ascending or descending interferograms, except for some steep mountainous regions. This means that the slip occurred at deep depth and had not reached the surface. The causative fault was assumed to be planar. We used the uniform elastic half-space dislocation model [25] to calculate the surface displacement of the Green′s Function, assuming a Poisson ratio of 0.25. Then, we inverted the InSAR deformation data in two steps. First, we inferred the geometry of the seismogenic fault plane with the uniform slip assumption. Then, we estimated the slip distribution after discretizing the fault plane into sub-faults. The constrained least squares method [4] was adopted to fit the InSAR data as
Gs - d 2 + β 2 H τ 2 2 = min ,
where G is the Green function, s is slip, d is the actual observation value, β is the smoothing factor that can control Laplacian smoothing to improve robustness for the inversion result, H is the Laplacian operator, τ is the stress drop [26]. After the dowsampling, the size of the interferogram data sets was reduced from 1,443,200 to 4500 for the ascending data, from 1,565,410 to 3589 for the descending data of track 79 and from 1,687,987 to 4968 for the descending data of track 6. The seismogenic fault parameters, including the strike, dip, rake, location, length, top, and bottom depth, can be inversed from the InSAR deformation field using a forward trial-and-error approach under the uniform slip assumption. Firstly, we estimated a priori fault parameters according to the fringes pattern of the InSAR observation and the mapped faults on the surface. Usually, the surface projection of the seismogenic fault is very close to the dense fringes. In the Darbandikhan earthquake, the possible surface projection of the fault is along either the western (segment A in Figure 2) or central edge (segment B in Figure 2) of the two-lobe fringe pattern in the interferograms. Therefore, the endpoint location, width, and length of the fault can be determined according to the fringe pattern (Table 2). In addition, using the focal mechanism solutions of USGS and GCMT, we obtained an initial dip angle of each source fault and the uniform slip on the rectangular fault plane by altering the dip. Also, we can assume the bottom depth of the source fault at 20 km deep. Then, using the obtained location, strike, dip, we got the top depth of the fault plane. To sum it up, the uniform slip inversion results present a single fault geometry, with a length of 70 km and a width of 35 km. The top and bottom depth of the fault plane is about 9 km and 20 km, respectively (Table 3). This fault model is consistent with the location of aftershocks (Figure 4a,b).

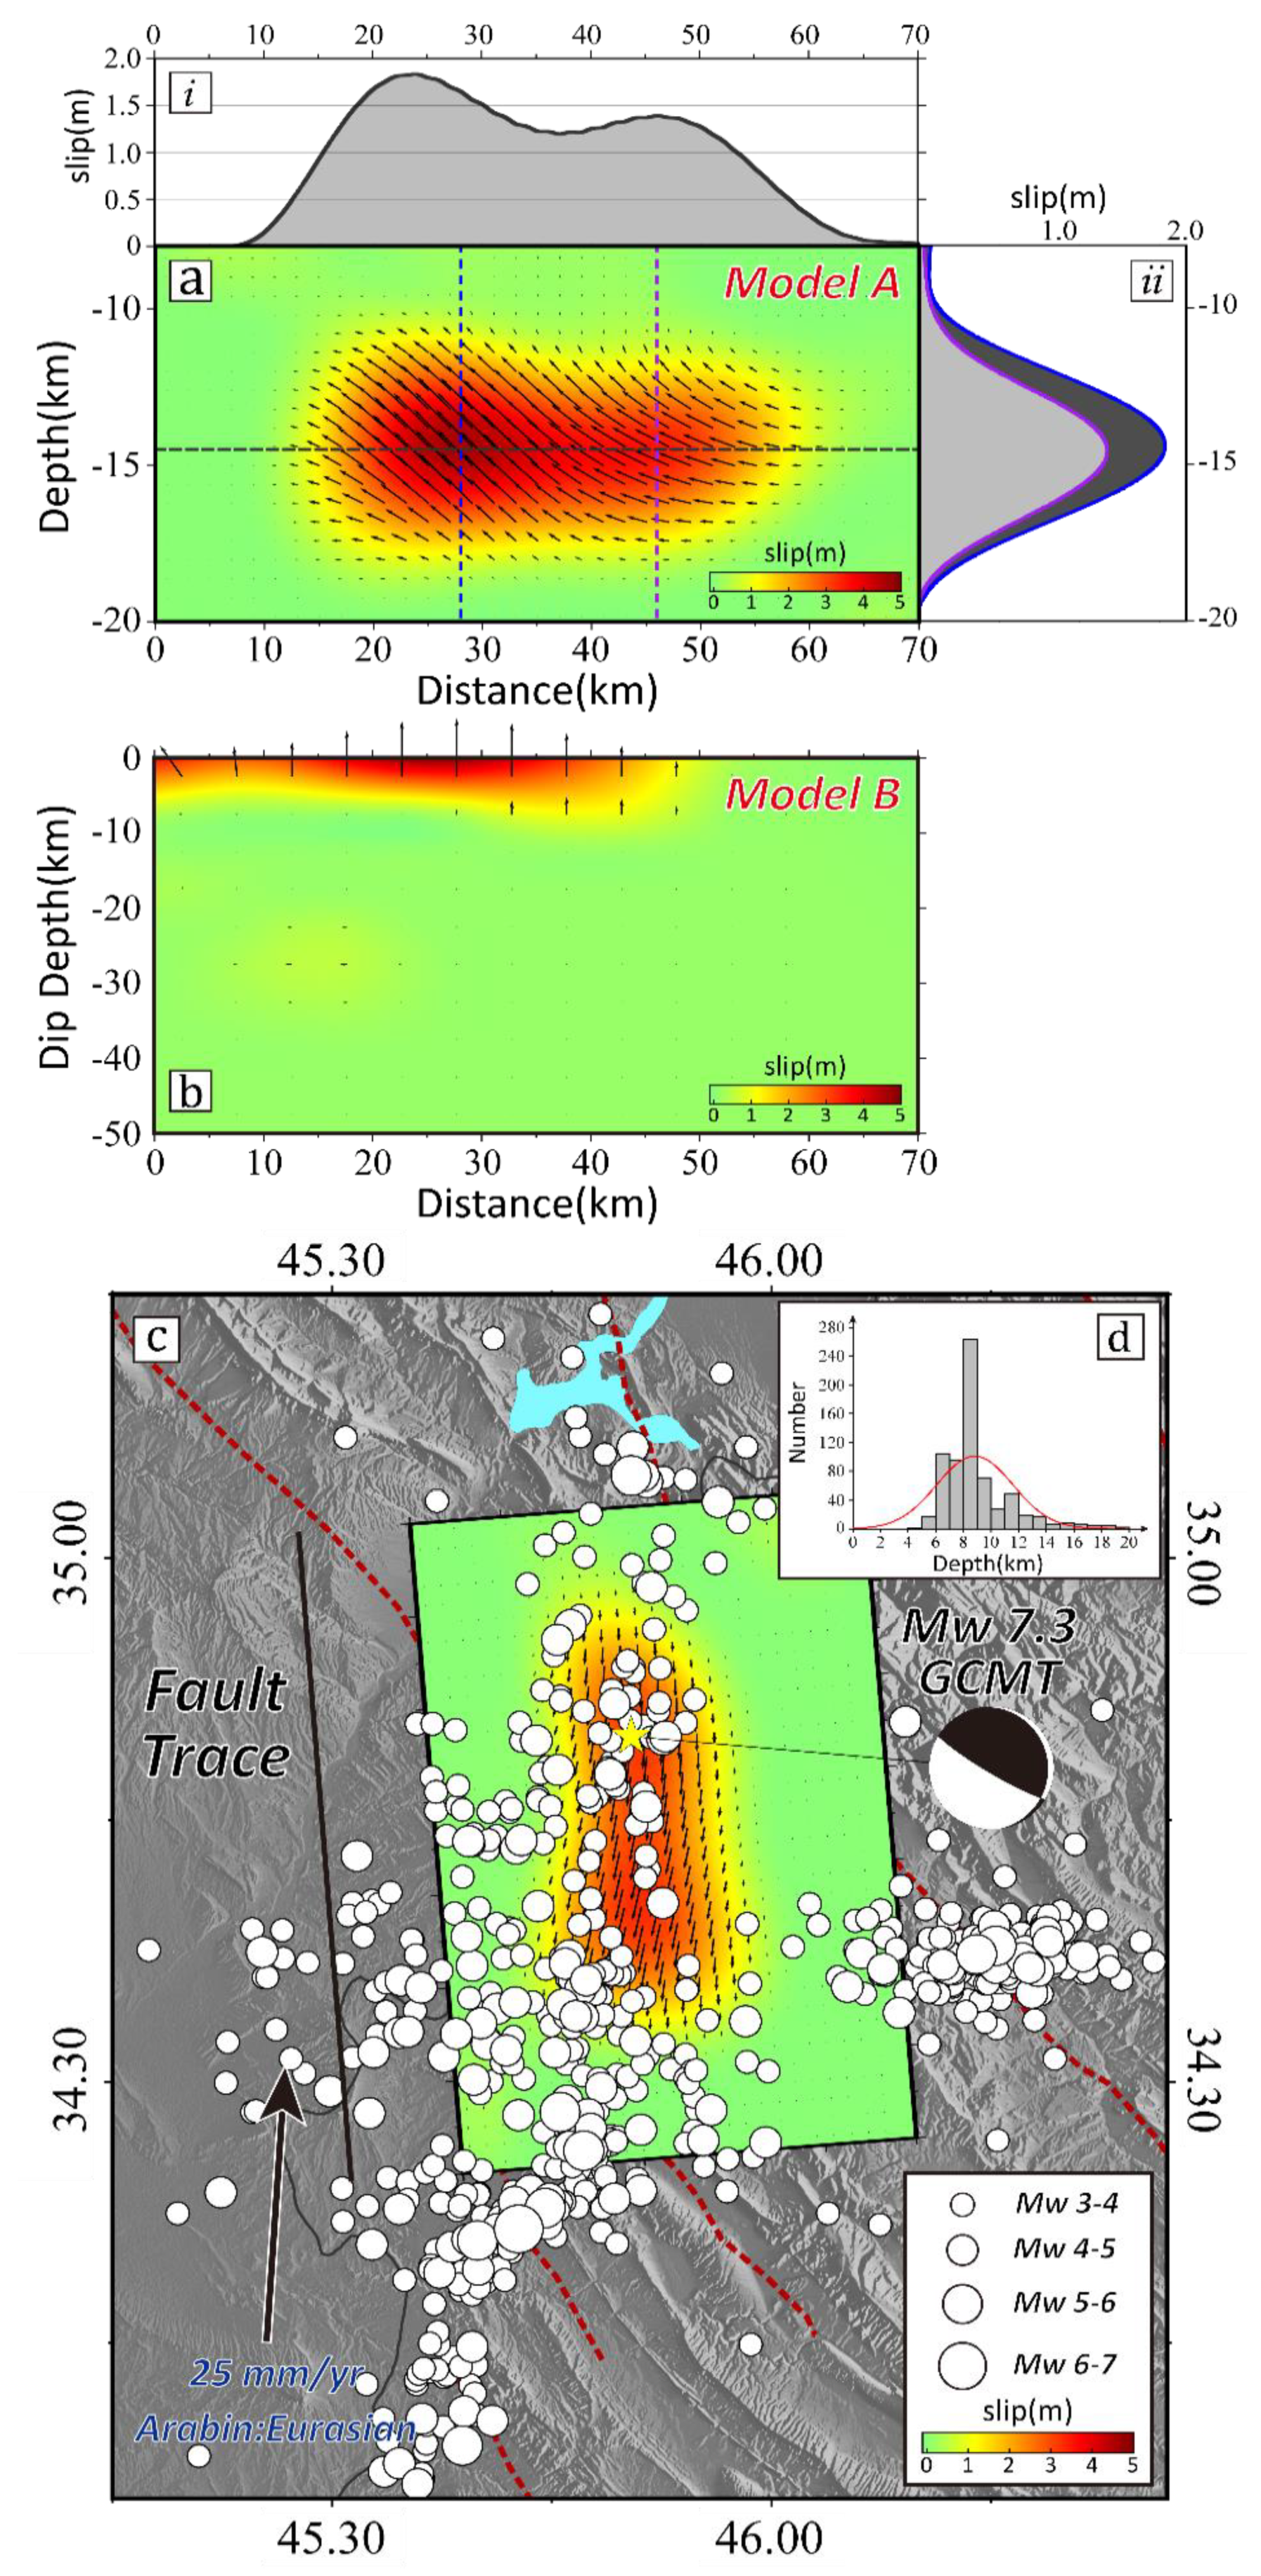
4.2. Distribution of Coseismic Slip

On the basis of a single uniform slip fault, we set the fault plane to be 100 km long along strike and 80 km wide and divided it into 2 × 2 km2 sub-faults. In order to stabilize the result of inversion, the Laplacian smoothing and the relative weight of the constraints between the Sentinel-1A and 1B data were determined. The Laplacian smoothing reflects the stability of fault model parameters, which can decrease the large and unphysical slip values. We can find a smoothing factor (0.40) to achieve the balance between roughness and root-mean-square (RMS) misfit [27]. On the other hand, the joint inversion of different orbit data needs relative weights. However, there is no objective way can automatically determine the optimal weights [28]. Here, we used the trial and error method and constantly adjusted the weight until all datasets were optimally fitted. Finally, we set the constraint of the rake range to be [90°, 180°] according to the Darbandikhan focal mechanisms.
Figure 4a,b present the estimated co-seismic slip distribution in the fault plane. Given that the fault slip of model B is inconsistent with the actual situation, we get rid of model B. The result of model A (Figure 4a) suggests that the rupture zone of the mainshock concentrates at a depth of 11–19 km, extending in the strike direction. The maximum slip is approximately 4.5 m, located at 14.5 km below the surface. Besides, the rake shows some variation from 156° on the north to 127° on the south, indicating that the Darbandikhan earthquake is a thrust combining some left-lateral fault motions. This kind of oblique slip matches the regional geological background that the Arabian plates are subducting underneath the Eurasian plate northwestward (Figure 1). There is no substantial slip shallower than 11 km, which again verifies that the Darbandikhan earthquake is a blind event associated with buried faults. With the shear modulus of 30 GPa, we can obtain the total geodetic moment of 0.889 × 10²⁰ Nm, equivalent to an Mw 7.2, slightly smaller than the seismic moment of USGS and GCMT.
Figure 5 shows the observed and modelled deformations as well as the residuals (the observation value minus the prediction value) derived from Sentinel-1 ascending and descending data. The RMS values between different datasets are small, which are 2.8 cm, 2.2 cm, and 1.8 cm for track 72 of Sentinel-1A, track 79 of Sentinel-1B and track 6 of Sentinel-1B, respectively. In order to further compare the observed and the modeled deformation, we analyzed the profiles of A-B and C-D of Figure 5, which go through the major deformation zone (Figure 6). The observation and modelled deformation show overall consistency, except for some de-coherence regions. These de-coherence regions may be caused by the shallow surface fault movements triggered by the seismogenic fault.

5. Discussion

5.1. Determination of the Seismogenic Fault

The co-seismic inversion result of the 2017 Darbandikhan earthquake reveals that the rupture depth ranges between 11 km and 19 km, similar to those of the historical earthquakes (Mw > 6) in Zagros. However, whether this earthquake ruptured the thick sedimentary cover or the underlying crystalline basement (or both) remains unclear [29]. There are some researches on the thickness of the sedimentary cover. For instance, [30] summed the individual stratigraphic units of different regions of ZFTB and found that the total sedimentary thickness decreases gradually from −14 km in the northwest (Lurestan Arc) to −10 km in the southeast (Fars Arc). [31] exploited the receiver function results of local velocity models and got the crustal thickness of the sedimentary rock (−10 km) and basement (−35 km) in Zagros. However, due to insufficient precise seismic wave refraction and reflection data, these obtained cover thicknesses have uncertainty of kilometers. This is why many earlier researches [32,33,34] suggest that the moderate-size and major earthquakes in Zagros were located within the crystalline basement at the scarcity of the outstanding surface rupture. Using an elastic dislocation model, the surface deformation derived from the InSAR measurement can be used to precisely restore the parameters of the seismogenic fault [35]. Therefore, the InSAR measurement was used to determine the depth of the causative fault in this study. The results show that most of the moderate-size earthquake with the source depth in the range of 4–9 km are located within the sedimentary cover, and major earthquakes, with a hypocentral depth between the range of 12–19 km, are generally located within the crystalline basement in Zagros [29,36].
Additionally, the aftershocks data provided by Iranian Seismological Center show that most aftershocks occurred at 6–10 km depth. And few aftershocks occurred 1–6 km and >10 km deep (Figure 4d), which indicates that the crystalline basement along the fault plane is locked and continuously accumulates slip for the next destructive earthquake. Therefore, the Darbandikhan earthquake primarily ruptured within the Precambrian crystalline basement and occurred on one of the active blind-thrust fault systems within the basement, such as ZFF, MFF, and HZF. This conclusion is consistent with the geodetic result of [37], which used the sparse GPS data to infer the possible seismogenic depth in Zagros, 10–15 km. Furthermore, given that the projection of the fault plane are coincident with the location of the inferred MFF and focal mechanism solutions of the historical earthquake events along MFF is dominant thrust slip with some dextral strike slip, the seismogenic fault of the Darbandikhan earthquake might be MFF, which is consistent with that of [6].

5.2. Oblique Thrusting and Its Implication of the Darbandikhan Earthquake

The Darbandikhan earthquake occurred in a region with complex tectonic activities. MFF and MRF constitutes the southwestern and northeastern boundaries of the Lurestan Arc, respectively. MFF is a master blind thrust fault and MFF is a major active right-lateral strike-slip fault, so the Lurestan Arc region is characterized by main thrust and some strike slip. This is consistent with the focal mechanism solutions of most historical earthquake instrumental records in this region. However, our preferred inversion result show that this earthquake is an oblique thrust slip of −135° on a fault striking −351° and is oblique crossing with overall topography strike trend of ZFTB. Therefore, the vicinity of the epicenter in Lurestan Arc, especially 10–15 km deep, should have absorbed most energy released by the convergence between the Arabian and the Eurasian plates. Eventually, the energy displayed in the form of seismicity, surface fold, aseismic fault slip, and ductile shortening of the basement [38].
Zagros is often linked to the early stage of the Himalaya orogeny [37], but there are two significant differences between these two tectonic environments. One is that the seismic activity of ZFTB was thought to be very weak. There are no recorded large earthquakes. However, the Himalaya thrust belt has accommodated lots of great earthquakes, such as the Mw 8.2 Lo Mustang earthquake in 1505, the Mw 8.1 Shilong earthquake in 1897, the Mw 7.8 Kangra earthquake in 1905, the Mw 8.1 Bihar–Nepal earthquake in 1934, the Mw 8.5 Assam earthquake in 1950, and the Mw 7.8 Gorkha earthquake in 2015 [39,40,41]. The other difference is that the convergence direction of the India–Eurasia plate is nearly perpendicular to the major thrust fault, so most earthquakes occurred there had pure thrust motions. However, the ZFTB region has oblique thrusting. For the former difference, we argue that MFF in the northwest section of ZFTB may have ruptured many times, but most ruptures did not reach the surface, so those earthquakes are unrecognized. The occurrence of the 2017 Darbandikhan earthquake has justified that earthquakes with a magnitude greater than 7.0 are definitely possible in the Lurestan Arc, indicating that this region can generate devastating earthquakes. Furthermore, GPS measurements showed that the northwest section of ZFTB has a relatively low seismic strain rate, which means local faults are locked and seismic energy could be accumulated [2,42].
The determination of the recurrence time of major earthquakes (Mw > 7) is important for seismic hazard assessment [28]. On the basis of the shortening rate of the strain accumulation derived from inter-seismic GPS measurement and the maximum slip of fault plane, [6] stated that the recurrence period ranges from 700 to 1200 years. However, owing to sparse GPS distribution in ZFTB, the recurrence time of the main earthquake remains unclear. How to precisely determine recurrence interval is out of the scope of this study and it will be addressed in our future study.

5.3. The Relationship Between the Master Blind Thrust and Surface Fold

In the Zagros fold-thrust belt, most surface deformation is characterized by the spectacular whaleback fold composed of anticlines and synclines. Is there a one-to-one correlation between these anticlines and blind-reverse faults [43,44]? Some studies have demonstrated the one-to-one correlation in the southeast ZFTB [29,36], but very few studies covered the northwest ZFTB. The surface displacement caused by the Darbandikhan earthquake provides an opportunity to investigate the correlation between the topography, especially the collision foreland of Zagros, and seismic events. Therefore, we computed the vertical motions derived from the ascending (track 72) and descending (track 6) orbit LOS displacements (from D-InSAR) and azimuth displacement (from offset tracking). Figure 7 shows a peak uplift of 0.74 m located around Mount Bamo (fold) and a maximum subsidence of 0.28 m near the Vanisar village along profile A-A′. We note that the slope of the left limb is slightly smaller than that of the right limb, which is referred to a ‘non-significant’ asymmetric fold (Figure 7b–f). MFF did not rupture the near-surface in the Darbandikhan earthquake. In addition, [6] reported that the co-seismic rupture within the basement (the dipping of 15°) triggered an aseismic slip on the decollement flat ramp (dipping 3°). We inferred that the ‘non-significant’ asymmetric fold may be caused by the long slippage of the uppermost sedimentary cover ramp, responding the sudden shortening (i.e., earthquake rupture) of basement caused by MFF. This result is consistent with the result of [45], which employed a two-stage model to explain this fold: firstly, the sedimentary cover adapting the upwards propagation of the basement fault is buckling; secondly, the mechanically weak group at the base of cover, for example the Hormuz salt or something else, migrated into the core of anticlines, which can cause steeper limb of fold. We conclude that the master blind thrust may control the local folding.

6. Conclusions

In this study, we described the surface deformation in ZFTB caused by the 2017 Darbandlihan earthquake using the ascending and descending co-seismic interferograms derived from the Sentinel-1A/B data. The interferogram maintains good coherence in most regions, whose fringe pattern indicates that the co-seismic deformation was dominated by the horizontal movement rather than the vertical motion. The east–west component and the peak displacement are 65.0 cm and 54.8 cm, respectively. We then used the along- and across-track deformation fields of different orbits (ascending-72 and descending-6) to retrieve the three-dimensional field. More importantly, based on the fact that the horizontal movement is toward southwest without any opposite displacement and the significant difference between uplift with subsidence lobe, we can obtain the conclusion that the Darbandikhan earthquake may be caused by a blind thrust fault close to the north–south direction. On the basis of the surface displacement, we inverted the geometrical parameters of the seismogenic fault, and the slip distribution of the fault plane. The inversion result indicates that the causative fault has a strike of 355°, northeast dip of 18°, average rakes of 135°, and the maximum slip is approximately 4.5 m at the depth of 14.5 km. With the shear modulus of 30 GPa, the total geodetic moment is 0.889 × 10²⁰ Nm, equivalent to Mw 7.2, which is consistent with the seismic moment of USGS and GCMT.
On the basis of the D-InSAR measurement, the 3D co-seismic deformation field and fault model, we got the following conclusions. First, the depth derived from the InSAR measurement is −11–19 km and that of the aftershocks is 4–9 km, so the Darbandikhan earthquake primarily ruptured within the crystalline basement and the seismogenic fault is MFF. Second, the Darbandikhan earthquake occurred in a region with complex tectonic activities. As the Lurestan Arc has a fault striking of −355°, average rake of −136° and a relatively low seismic strain rate, the vicinity of the epicenter might have absorbed the major energy released by the convergence between the Arabian and the Eurasian plates and it may generate devastating earthquakes again. Third, we investigated the relationship between these anticlines and the master blind-reverse faults in the collision foreland of ZFTB and inferred that the ‘non-significant’ asymmetric fold may be generated by the large distance slip of uppermost sedimentary cover, which is to adapt to the sudden shortening of the basement caused by MFF.

Author Contributions

Conceptualization, Z.H., G.Z. and Y.Z; Methodology, W.G.; Validation, G.Z. and W.G.; Formal analysis, Z.H.; Investigation, Z.H.; Resources, X.S. and G.Z.; Data curation, W.G.; Writing—Original draft preparation, Z.H.; Writing—Review and editing, Z.H., G.Z., X.S., W.G., Y.Z. and Y.L.; Visualization, Y.Z. and Y.L.; Supervision, G.Z., Y.Z. and Y.L.

Funding

This research was funded by the Chinese National Science Foundation (41631073), Basic Scientific Funding of Institute of Geology, China Earthquake Administration (IGCEA1919).

Acknowledgments

The Sentinel ascending- and descending-track data used in this research were downloaded from the European Space Agency (https://scihub.copernicus.eu) and were processed with the GAMMA software [15]. The Shuttle Radar Topography Mission (SRTM) data from the CGIAR-CSI SRTM 90 database (http://srtm.csi.cgiar.org) was used for InSAR data processing and topographic map generation. Focal mechanism was provided by the Global CMT (https://www.globalcmt.org/CMTsearch.html) and USGS (https://earthquake.usgs.gov/earthquakes/eventpage/us2000bmcg/moment-tensor). The aftershocks data was provided by Iranian Seismological Center (IRSC) (http://irsc.ut.ac.ir/bulletin.php). The master blind faults data in Zagros referred to digital active fault map of Iran. All figures were made using the Generic Mapping Tools software package v.5.4.5 (www.soest.hawaii.edu/gmt) [46].

Conflicts of Interest

The authors declare no conflict of interest.

References

  1. Zare, M.; Kamranzad, F.; Parcharidis, I.; Tsironi, V. Preliminary Report of Mw7.3 Sarpol-E Zahab, Iran Earthquake on November 12, 2017; International Institute of Earthquake Engineering and Seismology (IIEES): Tehran, Iran, 2017. [Google Scholar]
  2. Vernant, P.; Nilforoushan, F.; Hatzfeld, D.; Abbassi, M.R.; Vigny, C.; Masson, F.; Nankali, H.; Martinod, J.; Ashtiani, A.; Bayer, R.; et al. Present-day crustal deformation and plate kinematics in the Middle East constrained by GPS measurements in Iran and northern Oman. Geophys. J. Int. 2004, 157, 381–398. [Google Scholar] [CrossRef] [Green Version]
  3. Shahryar Solaymani Azad, N.; Moradi, S.M.; Ajhdari, A.; Youssefi, T.; Mashal, M.; Roustaie, M. Preliminary Report on Geological Features of the Ezgaleh-Kermanshah Earthquake; Geological Survey of Iran Seismotectonics & Seismology Department: Tehran, Iran, 2017. [Google Scholar]
  4. Kobayashi, T.; Morishita, Y.; Yarai, H.; Fujiwara, S. InSAR-derived crustal deformation and reverse fault motion of the 2017 Iran–Iraq Earthquake in the Northwest of the Zagros Orogenic Belt. Bull. Geospat. Inf. 2018, 66, 2. [Google Scholar]
  5. Wang, Z.; Zhang, R.; Wang, X.; Liu, G. Retrieving threedimensional co-seismic deformation of the 2017 Mw7.3 Iraq earthquake by multi-sensor SAR images. Remote Sens. 2018, 10, 857. [Google Scholar] [CrossRef]
  6. Barnhart, W.D.; Brengman, C.M.J.; Li, S.; Peterson, K.E. Ramp-flat basement structures of the Zagros Mountains inferred from co-seismic slip and afterslip of the 2017 Mw7.3 Darbandikhan, Iran/Iraq earthquake. Earth Planet. Sci. Lett. 2018, 496, 96–107. [Google Scholar] [CrossRef]
  7. Feng, W.; Samsonov, S.; Almeida, R.; Yassaghi, A.; Li, J.; Qiu, Q.; Li, P.; Zheng, W. Geodetic Constraints of the 2017 M w 7.3 Sarpol Zahab, Iran Earthquake, and its implications on the structure and mechanics of the Northwest Zagros Thrust-Fold Belt. Geophys. Res. Lett. 2018, 45, 6853–6861. [Google Scholar] [CrossRef]
  8. Hessami, K.; Jamali, F.; Tabassi, H. Active Faults of Iran; International Institute of Earthquake Engineering and Seismology (IIEES): Tehran, Iran, 2003. [Google Scholar]
  9. Nissen, E.; Tatar, M.; Jackson, J.A.; Allen, M.B. New views on earthquake faulting in the Zagros fold-and-thrust belt of Iran. Geophys. J. Int. 2011, 186, 928–944. [Google Scholar] [CrossRef] [Green Version]
  10. Kuang, J.; Ge, L.; Metternicht, G.I.; Hay, A.; Ng, M.; Wang, H.; Zare, M.; Kamranzad, F. Coseismic deformation and source model of the 12 November 2017 MW 7.3 Kermanshah Earthquake (Iran–Iraq border) investigated through DInSAR measurements. Int. J. Remote Sens. 2011. [Google Scholar] [CrossRef]
  11. Elliott, J.R.; Jolivet, R.; Gonzalez, P.J.; Avouac, J.-P.; Hollingsworth, J.; Searle, M.P.; Stevens, V.L. Himalayan megathrust geometry and relation to topography revealed by the Gorkha earthquake. Nat. Geosci. 2011, 9, 174–180. [Google Scholar] [CrossRef]
  12. Jouanne, F.; Awan, A.; Madji, A.; Pêcher, A.; Latif, M.; Kausar, A.; Mugnier, J.L.; Khan, I.; Khan, N.A. Postseismic deformation in Pakistan after the 8 October 2005 earthquake: Evidence of afterslip along a flat north of the Balakot-Bagh thrust. J. Geophys. Res. Solid Earth 2011, 116, B07401. [Google Scholar] [CrossRef]
  13. Funning, G.J.; Parsons, B.; Wright, T.J.; Jackson, J.A.; Fielding, E.J. Surface displacements and source parameters of the 2003 Bam (Iran) earthquake from Envisat advanced synthetic aperture radar imagery. J. Geophys. Res. 2005, 110, B09406. [Google Scholar] [CrossRef]
  14. Wegmüller, U.; Werner, C. Gamma SAR processor and interferometry software. In Proceedings of the 3rd ERS Symposium, Florence, Italy, 14–21 March 1997. [Google Scholar]
  15. González, P.J.; Bagnardi, M.; Hooper, A.J.; Larsen, Y.; Marinkovic, P.; Samsonov, S.V.; Wright, T.J. The 2014–2015 Eruption of Fogo Volcano: Geodetic Modeling of Sentinel-1 TOPS Interferometry. Geophys. Res. Lett. 2015, 42, 9239–9246. [Google Scholar] [CrossRef]
  16. Farr, T.G.; Rosen, P.A.; Caro, E.; Crippen, R.; Duren, R.; Hensley, S.; Kobrick, M.; Paller, M.; Rodriguez, E.; Roth, L.; et al. The shuttle radar topography mission. Rev. Geophys. 2007, 45. [Google Scholar] [CrossRef]
  17. Goldstein, R.M.; Werner, C.L. Radar interferogram filtering for geophysical applications. Geophys. Res. Lett. 1998, 25, 4035–4038. [Google Scholar] [CrossRef] [Green Version]
  18. Costantini, M. A Novel Phase Unwrapping Method Based on Network Programming. IEEE Trans. Geosci. Remote Sens. 1998, 36, 813–821. [Google Scholar] [CrossRef]
  19. Costantini, M.; Rosen, P.A. A Generalized Phase Unwrapping Approach for Sparse Data. In Proceedings of the Geoscience and Remote Sensing Symposium, Hamburg, Germany, 28 June–2 July 1999; pp. 267–269. [Google Scholar]
  20. Doin, M.-P.; Lasserre, C.; Peltzer, G.; Cavalié, O.; Doubre, C. Corrections of stratified tropospheric delays in SAR interferometry: Validation with global atmospheric models. J. Appl. Geophys. 2009, 69, 35–50. [Google Scholar] [CrossRef]
  21. Wright, T.J.; Parsons, B.; England, P.C.; Fielding, E.J. InSAR observations of low slip rates on the major faults of western Tibet. Science 2004, 305, 236–239. [Google Scholar] [CrossRef] [PubMed]
  22. Rott, H.; Stuefer, M.; Siegel, A.; Skvarca, P.; Eckstaller, A. Mass fluxes and dynamics of Moreno Glacier, Southern Patagonia Icefield. Geophys. Res. Lett. 1998, 25, 1407–1410. [Google Scholar] [CrossRef]
  23. Gray, A.L.; Short, N.; Mattar, K.E.; Jezek, K.C. Velocities and flux of the Filchner ice shelf and its tributaries determined from speckle tracking interferometry. Can. J. Remote Sens. 2001, 27, 193–206. [Google Scholar] [CrossRef]
  24. Werner, C.; Wegmüller, U.; Strozzi, T.; Wiesmann, A. Precision estimation of local offsets between pairs of SAR SLCs and detected SAR images. In Proceedings of the IGARSS 2005: IEEE International Geoscience and Remote Sensing Symposium, Seoul, Korea, 29 July 2005; Volume 7, pp. 4803–4805. [Google Scholar]
  25. Okada, Y. Surface Deformation Due to Shear and Tensile Faults in a Half-Space. Bull. Seismol. Soc. Am. 1985, 75, 1135–1154. [Google Scholar]
  26. Wang, R.; Motagh, M.; Walter, T.R. Inversion of slip distribution from coseismic deformation data by a sensitivity-based iterative fitting (SBIF)method. In Proceedings of the EGU General Assembly, Vienna, Austria, 13–18 April 2008. [Google Scholar]
  27. Ainscoe, E.A.; Elliott, J.R.; Copley, A.; Craig, T.J.; Li, T.; Parsons, B.E.; Walker, R.T. Blind thrusting, surface folding, and the develop-ment of geological structure in the Mw 6.3 2015 Pishan (China) earthquake. J. Geophys. Res. 1985, 122, 9359–9382. [Google Scholar] [CrossRef]
  28. Chen, K.; Liu, Z.; Liang, C.; Song, Y.T. Towards the application of seismogeodesy in central Italy: A case study for the 2016 August 24 Mw 6.1 Italy earthquake modelling. Geophys. J. Int. 2018, 213, 1647–1658. [Google Scholar] [CrossRef]
  29. Roustaei, M.; Nissen, E.; Abbassi, M.; Gholamzadeh, A.; Ghorashi, M.; Tatar, M.; Yamini-Fard, F.; Bergman, E.; Jackson, J.; Parsons, B. The 2006 March 25 Fin earthquakes (Iran)—Insights into the vertical extents of faulting in the Zagros Simply Folded Belt. Geophys. J. Int. 2010, 181, 1275–1291. [Google Scholar] [CrossRef]
  30. Casciello, E.; Vergés, J.; Saura, E.; Casini, G.; Fernández, N.; Blanc, E.; Homke, S.; Hunt, D.W. Fold patterns and multilayer rheology of the Lurestan Province, Zagros Simply Folded Belt (Iran). J. Geol. Soc. 2009, 166, 947–959. [Google Scholar] [CrossRef] [Green Version]
  31. Hatzfeld, D.; Tatar, M.; Priestley, K.; Ghafory-Ashtiany, M. Seismological constraints on the crustal structure beneath the Zagros Mountain belt (Iran). Geophys. J. Int. 2003, 155, 403–410. [Google Scholar] [CrossRef]
  32. Yielding, G.; Jackson, J.A.; King, G.C.P.; Sinvhal, H.; Vita-Finzi, C.; Wood, R.M. Relations between surface deformation, fault geometry, seismicity, and rupture characteristics during the El Asnam (Algeria) earthquake of 10 October 1980. Earth Planet. Sci. Lett. 2003, 56, 287–304. [Google Scholar] [CrossRef]
  33. Berberian, M. Master “blind” thrust faults hidden under the Zagros folds: Active basement tectonics and surface morphotectonics. Tectonophysics 1995, 241, 193–224. [Google Scholar] [CrossRef]
  34. Talebian, M.; Jackson, J. A reappraisal of earthquake focal mechanisms and active shortening in the Zagros mountains of Iran. Geophys. J. Int. 2004, 156, 506–526. [Google Scholar] [CrossRef]
  35. Wright, T.J.; Parsons, B.E.; Jackson, J.A.; Haynes, M.; Fielding, E.J.; England, P.C.; Clarke, P.J. Source parameters of the 1 October 1995 Dinar (Turkey) earthquake from SAR interferometry and seismic bodywave modelling. Earth Planet. Sci. Lett. 1999, 172, 23–37. [Google Scholar] [CrossRef]
  36. Nissen, E.; Ghorashi, M.; Jackson, J.; Parsons, B.; Talebian, M. The 2005 Qeshm Island earthquake (Iran)—A link between buried reverse faulting and surface folding in the Zagros Simply Folded Belt? Geophys. J. Int. 2007, 171, 326–338. [Google Scholar] [CrossRef]
  37. Hatzfeld, D.; Molnar, P. Comparisons of the kinematics and deep structures of the Zagros and Himalaya and of the Iranian and Tibetan plat-eaus and geodynamic implications. Rev. Geophys. 2010, 48, RG2005. [Google Scholar] [CrossRef]
  38. Allen, M.B.; Saville, C.; Blanc, E.J.-P.; Talebian, M.; Nissen, E. Orogenic plateau growth: Expansion of the Turkish-Iranian Plateau across the Zagros fold-and-thrust belt. Tectonics 2013, 32, 1–20. [Google Scholar] [CrossRef]
  39. Feng, G.; Li, Z.; Shan, X.; Zhang, L.; Zhang, G.; Zhu, J. Geodetic model of the 2015 April 25 Mw 7.8 Gorkha Nepal Earthquake and Mw 7.3 after-shock estimated from InSAR and GPS data. Geophys. J. Int. 2015, 203, 896–900. [Google Scholar] [CrossRef]
  40. Liu, J.; Ji, C.; Zhang, J.Y.; Zhang, J.Y.; Zhang, P.Z.; Zeng, L.S.; Li, Z.F.; Wang, W. Tectonic setting and general features of coseismic rupture of the 25 April, 2015 M w 7.8 Gorkha, Nepal earthquake. China Sci. Bull. 2015, 60, 2640–2655. [Google Scholar] [CrossRef]
  41. Shan, X.J.; Zhang, G.H.; Wang, C.S.; Li, Y.C.; Qu, C.Y.; Song, X.G.; Yu, L.; Liu, Y.H. Joint inversion for the spatial fault slip distribution of the 2015 Nepal Mw 7.9 earthquake based on InSAR and GPS observations. Chin. J. Geophys. 2015, 58, 4266–4276. [Google Scholar] [CrossRef]
  42. Reilinger, R.; McClusky, S.; Vernant, P.; Lawrence, S.; Ergintav, S.; Çakmak, R.; Ozener, H.; Kadirov, F.; Guliev, I.; Stepanyan, R.; et al. GPS constraints on continental deformation in the Africa- Arabia-Eurasia continental collision zone and implications for the dynamics of plate interactions. J. Geophys. Res. 2006, 111, B05411. [Google Scholar] [CrossRef]
  43. Falcon, N. Problems of the relationship between surface structure and deep displacements illustrated by the Zagros Range. Geol. Soc. (Lond.) Spec. Publ. 2015, 3, 9–21. [Google Scholar] [CrossRef]
  44. Jackson, J.A. Reactivation of basement faults and crustal shortening in orogenic belts. Nature 1980, 283, 343–346. [Google Scholar] [CrossRef]
  45. Sherkati, S.; Letouzey, J.; Frizon de Lamotte, D. Central Zagros fold-thrust belt (Iran): New insights from seismic data, field observation, and sandbox modeling. Tectonics 2015, 25, TC4007. [Google Scholar] [CrossRef]
  46. Wessel, P.; Smith, W.H.F. New, improved version of the Generic Mapping Tools released, Eos Trans. AGU 1998, 79, 579. [Google Scholar]
Figure 1. Regional tectonic setting and the background seismicity of the 2017 Mw 7.3 Darbandikhan earthquake. (a) The tectonic map of Zagros, which is composed of the Zagros Fold-and-Thrust Belt (ZFTB), the Zagros Imbricate Zone (ZIZ), and the Urumieh-Dokhar Magmatic Assemblage (UDMA). ZFTB can be divided into four parts from northwest to southeast: Kirkuk Embayment (KE), Lurestan Arc (LA), Dezful Embayment (DE), and Fars Arc (FA). The black and red arrows denote the GPS velocity of the Arabian plate relative to the stable Eurasia plate and GPS velocity field, respectively [2]. The black rectangle outlines the study area, which is shown in (b). (b) The seismotectonic setting of the study area. Red beach balls and red stars show the focal moment solution and the epicenter of the Mw 7.3 Darbandikhan earthquake reported by U.S. Geological Survey (USGS) and Global Centroid Moment Tensor Project (CMT), respectively. The gray moment tensors are the historical earthquakes (>Mw 5.0) documented by Global CMT (1976–2017). White and yellow dots are the foreshocks (Mw > 4.0) between June and July 2017 and the aftershocks (Mw > 3) between 12 November 2017 and 1 October 2018 from USGS, respectively. The red line depicts the major strike fault, the Main Recent Fault (MRF). The dashed red lines denote the possible locations of “master blind thrusts”, which are the High Zagros Fault (HZF), Zagros Foredeep Fault (ZFF) and Mountain Front Fault (MFF). The white squares indicate the cities around the mainshock. The purple rectangles show the spatial coverage of the Sentinel-1A/B data. The area outlined by the black rectangle will be discussed in Figure 2.
Remotesensing 11 02521 g001
Figure 2. (ac) show the co-seismic deformation interferograms derived from the Sentinel-1A/B data. Each cycle of color (from blue to red) represent a half radar wavelength (0.028 m) along the line-of-sight direction. The solid black lines denote the estimated locations of the seismogenic fault (model A and B). The red star indicates the epicenter derived from Global CMT. (df) are the unwrapped interferograms of (ac), respectively. The dashed black lines, 1-1′, 2-2′, and 3-3′, pass through the maximum and minimum displacement of the coseismic deformation field. (eg) show the LOS displacements along profiles 1-1′, 2-2′, and 3-3′.
Remotesensing 11 02521 g002
Figure 3. (a,c) are the across-track (LOS) displacement of track 72 and track 6, respectively. (b,d) are the along-track (offset azimuth) displacement of track 72 and track 6, respectively. (eg) are the three-dimensional (3D) co-seismic deformation map of the Mw 7.3 Darbandikhan earthquake based on the ascending (track 72) and descending (track 6) orbit LOS displacements (from D-InSAR) and azimuth displacement (from offset tracking) in the east–west, north–south, and up–down directions, respectively.
Remotesensing 11 02521 g003
Figure 4. (a) The joint inversion of the fault slip estimate from the Sentinel-1A/B ascending-track and descending-track data with seismogenic faults by Model A. The black vector indicates the magnitude and azimuth of slip. The dashed grey, red, and blue lines are the profiles that have been detailed in (i,ii). (b) The joint inversion of fault slip estimated from the Sentinel-1A/B ascending-track and descending-track data with seismogenic faults by Model B. (c) The slip distribution of fault on the map coordinate (Model A). White dots are the aftershocks (Mw > 3) between 12 November 2017 and 1 January 2019 from the Iranian Seismological Center. The thick black line represents fault tracks at the surface. Black beach balls and the yellow star show the focal moment solution and the epicenter of the Mw 7.3 Darbandikhan earthquake reported by Global Centroid Moment Tensor Project (CMT), respectively. (d) The relationship diagram between aftershock depth and number.
Remotesensing 11 02521 g004
Figure 5. The co-seismic deformation field derived from data of (a) track 72, (d) track 79, and (g) track 6. The co-seismic deformation field estimated by the preferred model using data of (b) track 72, (e) track 79 and (h) track 6. (c,f,i) are the residuals obtained by subtracting the prediction from the observation value. The de-coherent areas and linear surface ruptures are outlined by black rectangles. The dashed red lines A–B and C–D are two profiles that will be analyzed in Figure 6.
Remotesensing 11 02521 g005
Figure 6. The LOS displacements along the profiles A-B and C-D of Figure 5. Blue, grey, and red lines denote the observed deformation, predicted deformation, and residuals, respectively.
Remotesensing 11 02521 g006
Figure 7. (a) The surface vertical components of the displacement map derived from the ascending (track 72) and descending (track 6) orbit LOS displacements (from D-InSAR) and azimuth displacement (from offset tracking). The black dot indicates the location of Mount Bamo. (bf) show the topography variation along profile A-A′, B-B′, C-C′, D-D′, and E-E′ denoted by the red dashed lines in (a). The red line in (b) shows the vertical deformation along profile A-A′.
Remotesensing 11 02521 g007
Table 1. Fault plane parameters of the Darbandikhan earthquake inverted from seismology and line-of-sight displacements.
SourceEpicenterFault Plane 1Fault Plane 2Depth (km)Mw
Longitude (°)Latitude (°)Strike (°)Dip (°)Rake (°)Strike (°)Dip (°)Rake (°)
USGS 145.9634.9135116137122797821.57.3
Global CMT 245.8434.8335111140121838218.07.3
Barnhart et al. (2018) 345.87 a34.65 a35015128 b——————15.0 a7.3
Feng et al. (2018) 345.86 a34.73 a353.514.5135.6 b——————14.5 a7.3
InSAR (this study)————355.517.5135.5 b————14.5 a7.2
1 USGS, U.S. Geological Survey; 2 Global CMT, Global Centroid Moment Tensor Project; 3 The different model fault planes derived from the elliptical fringe pattern of co-seismic interferograms; a The longitude, latitude, and depth is defined as the centroid of the fault plane; b The mean rake direction determined by each fault patches.
Table 2. Co-seismic interferometry pairs.
TrackMethodsOrbit PathData 1Data 2 B ( m ) B T ( d ) Heading (°)Incidence (°)
72D-InSAR Offset-trackingAscending12 November 201717 November 2017626−12.9533.78
79D-InSARDescending17 November 201718 November 2017566−166.9633.97
6D-InSAR Offset-trackingDescending17 November 201719 November 20171512−167.0233.86
Data1: the master image of pre-earthquake; Data2: slave image of post-earthquake; B : the perpendicular baseline between the orbits in each pair (m); B T the interval between the image acquisition dates.
Table 3. Fault plane solution estimated by Sentinel data.
ParameterLength (km)Width (km)Top DepthBottom DepthDipStrikeSlip 1Rake 2
InSAR70358.52017.5355.53.6135.5
1 Maximum slip in the fault plane; 2 Mean rake direction determined by each fault patch.

