Application of DInSAR-PSI Technology for Deformation Monitoring of the Mosul Dam, Iraq

 ,
,  ,
,
Abstract
:
1. Introduction
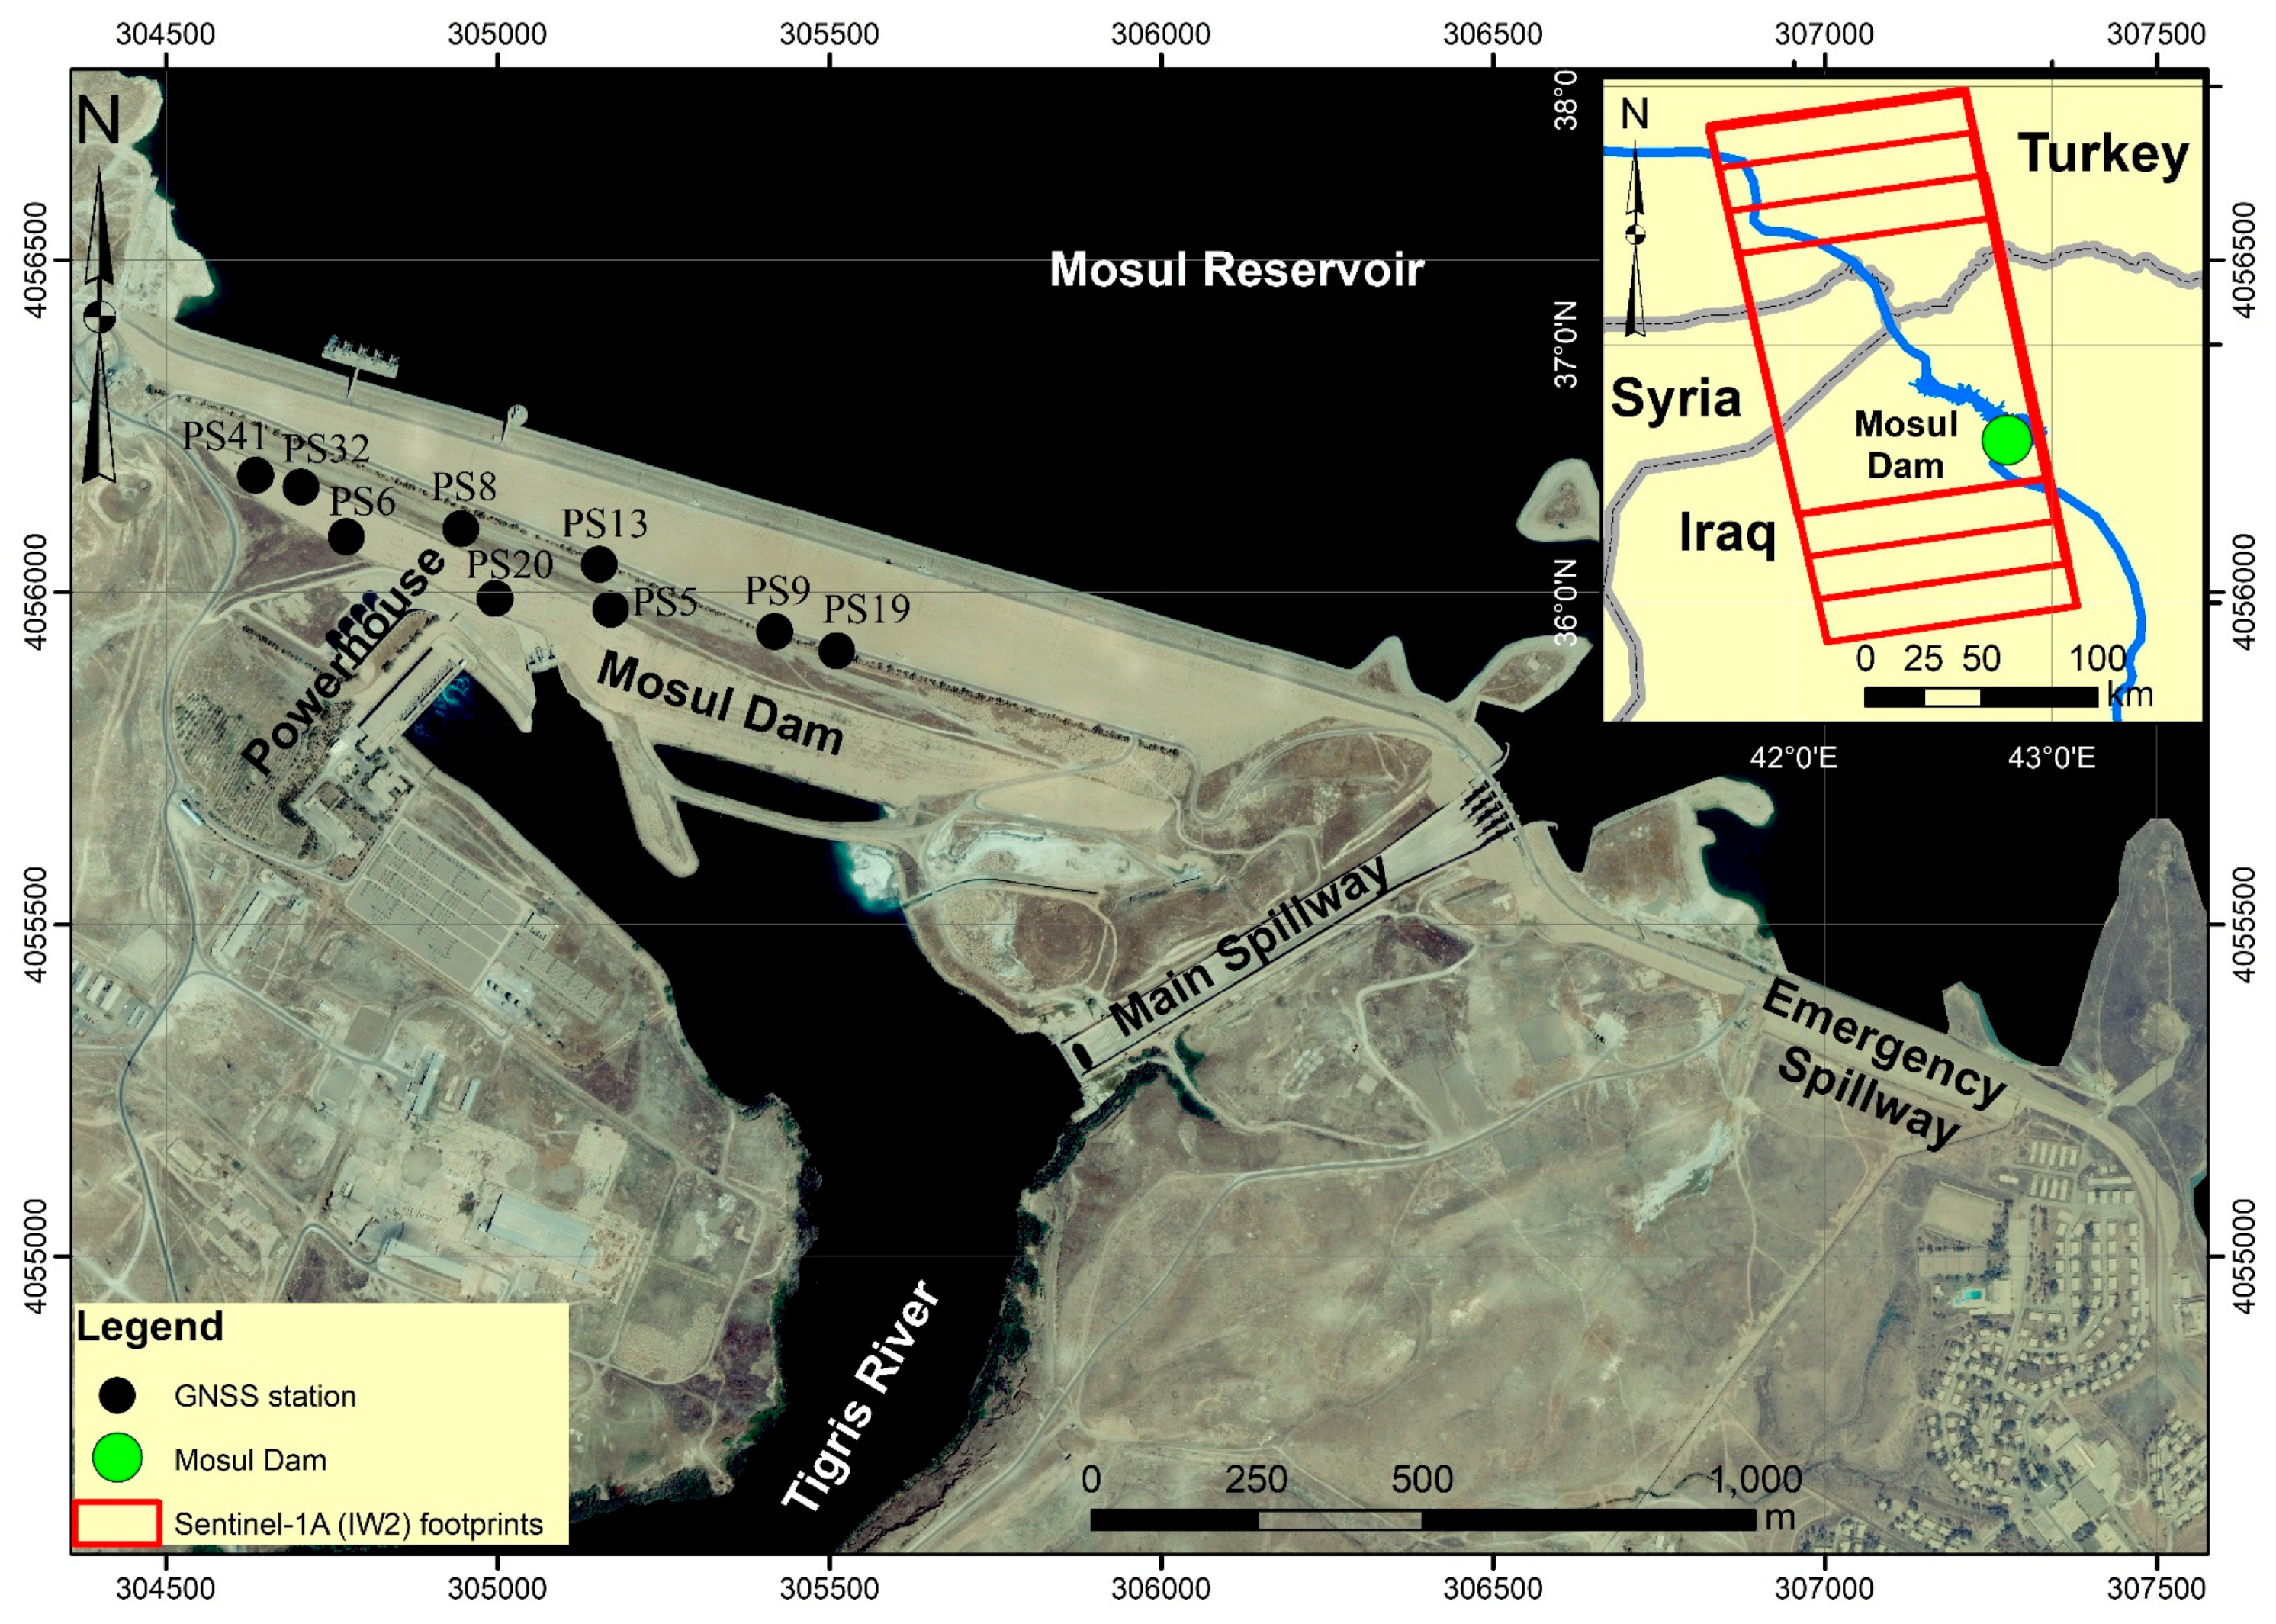
2. Study Area
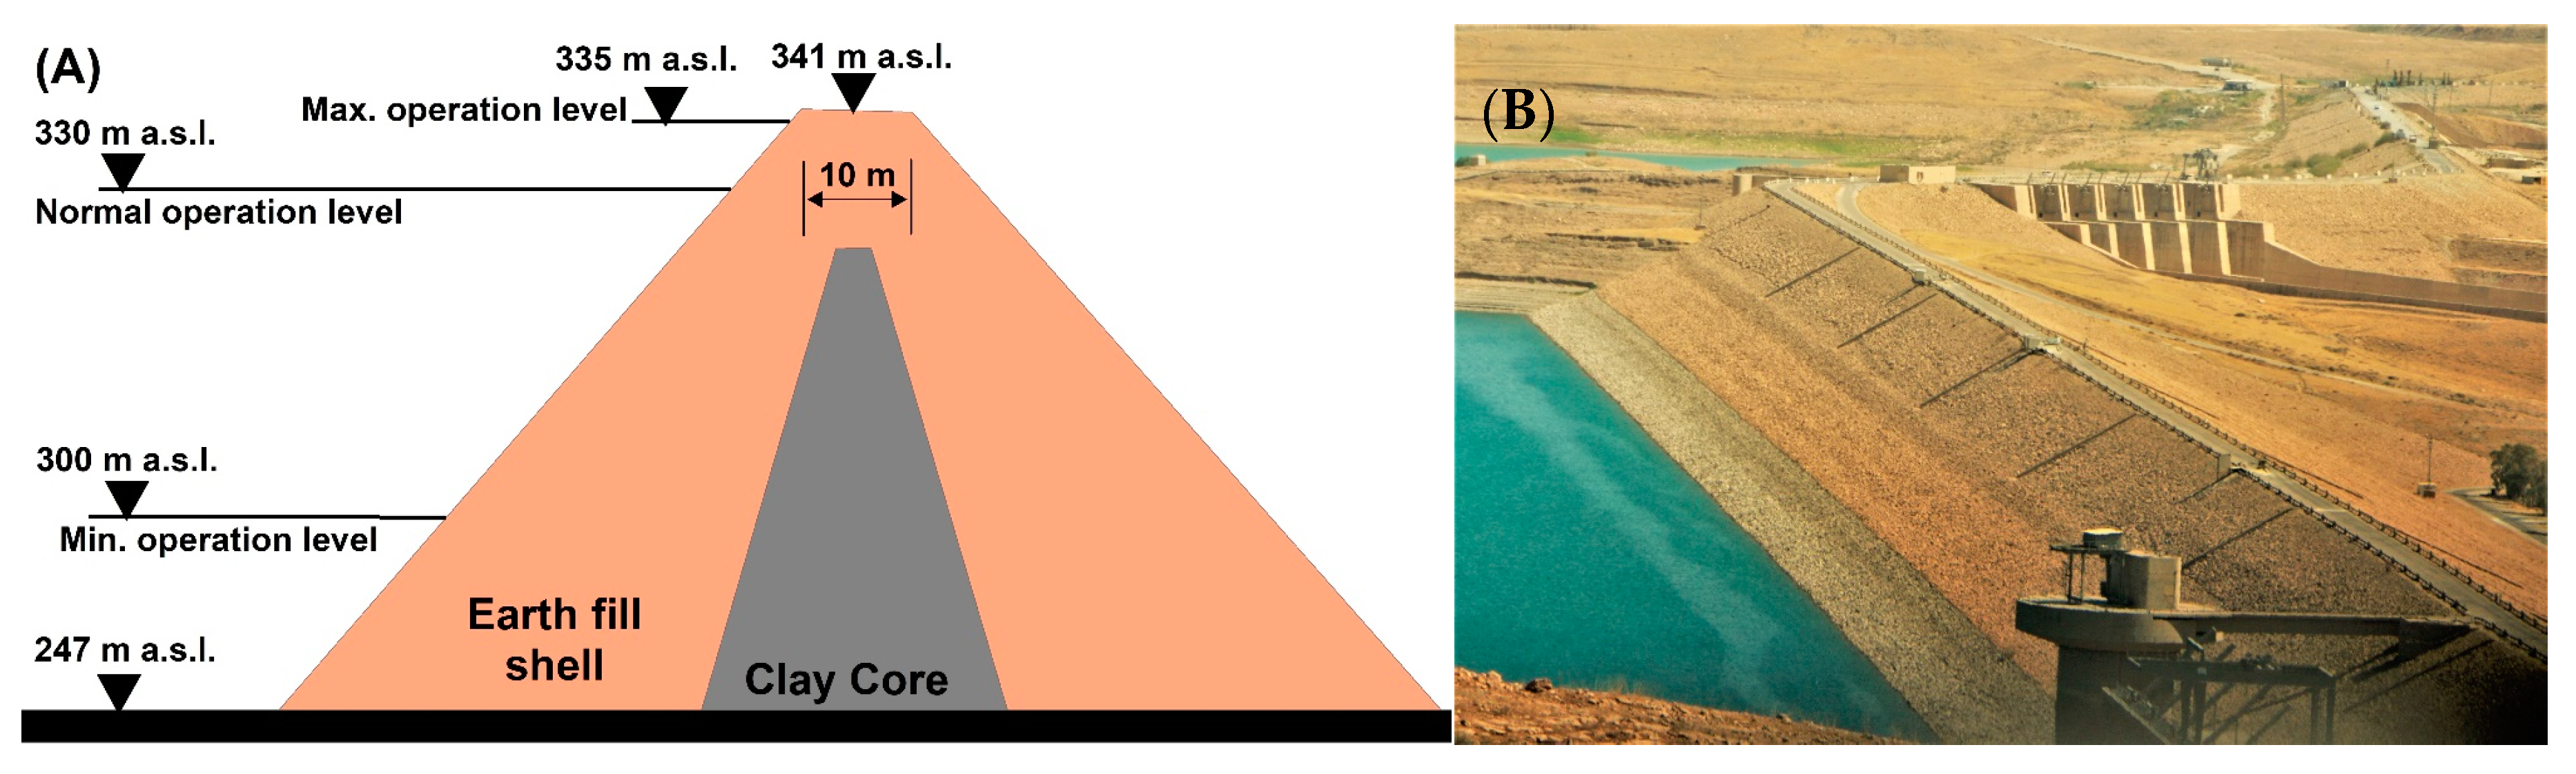
2.1. The Mosul Dam
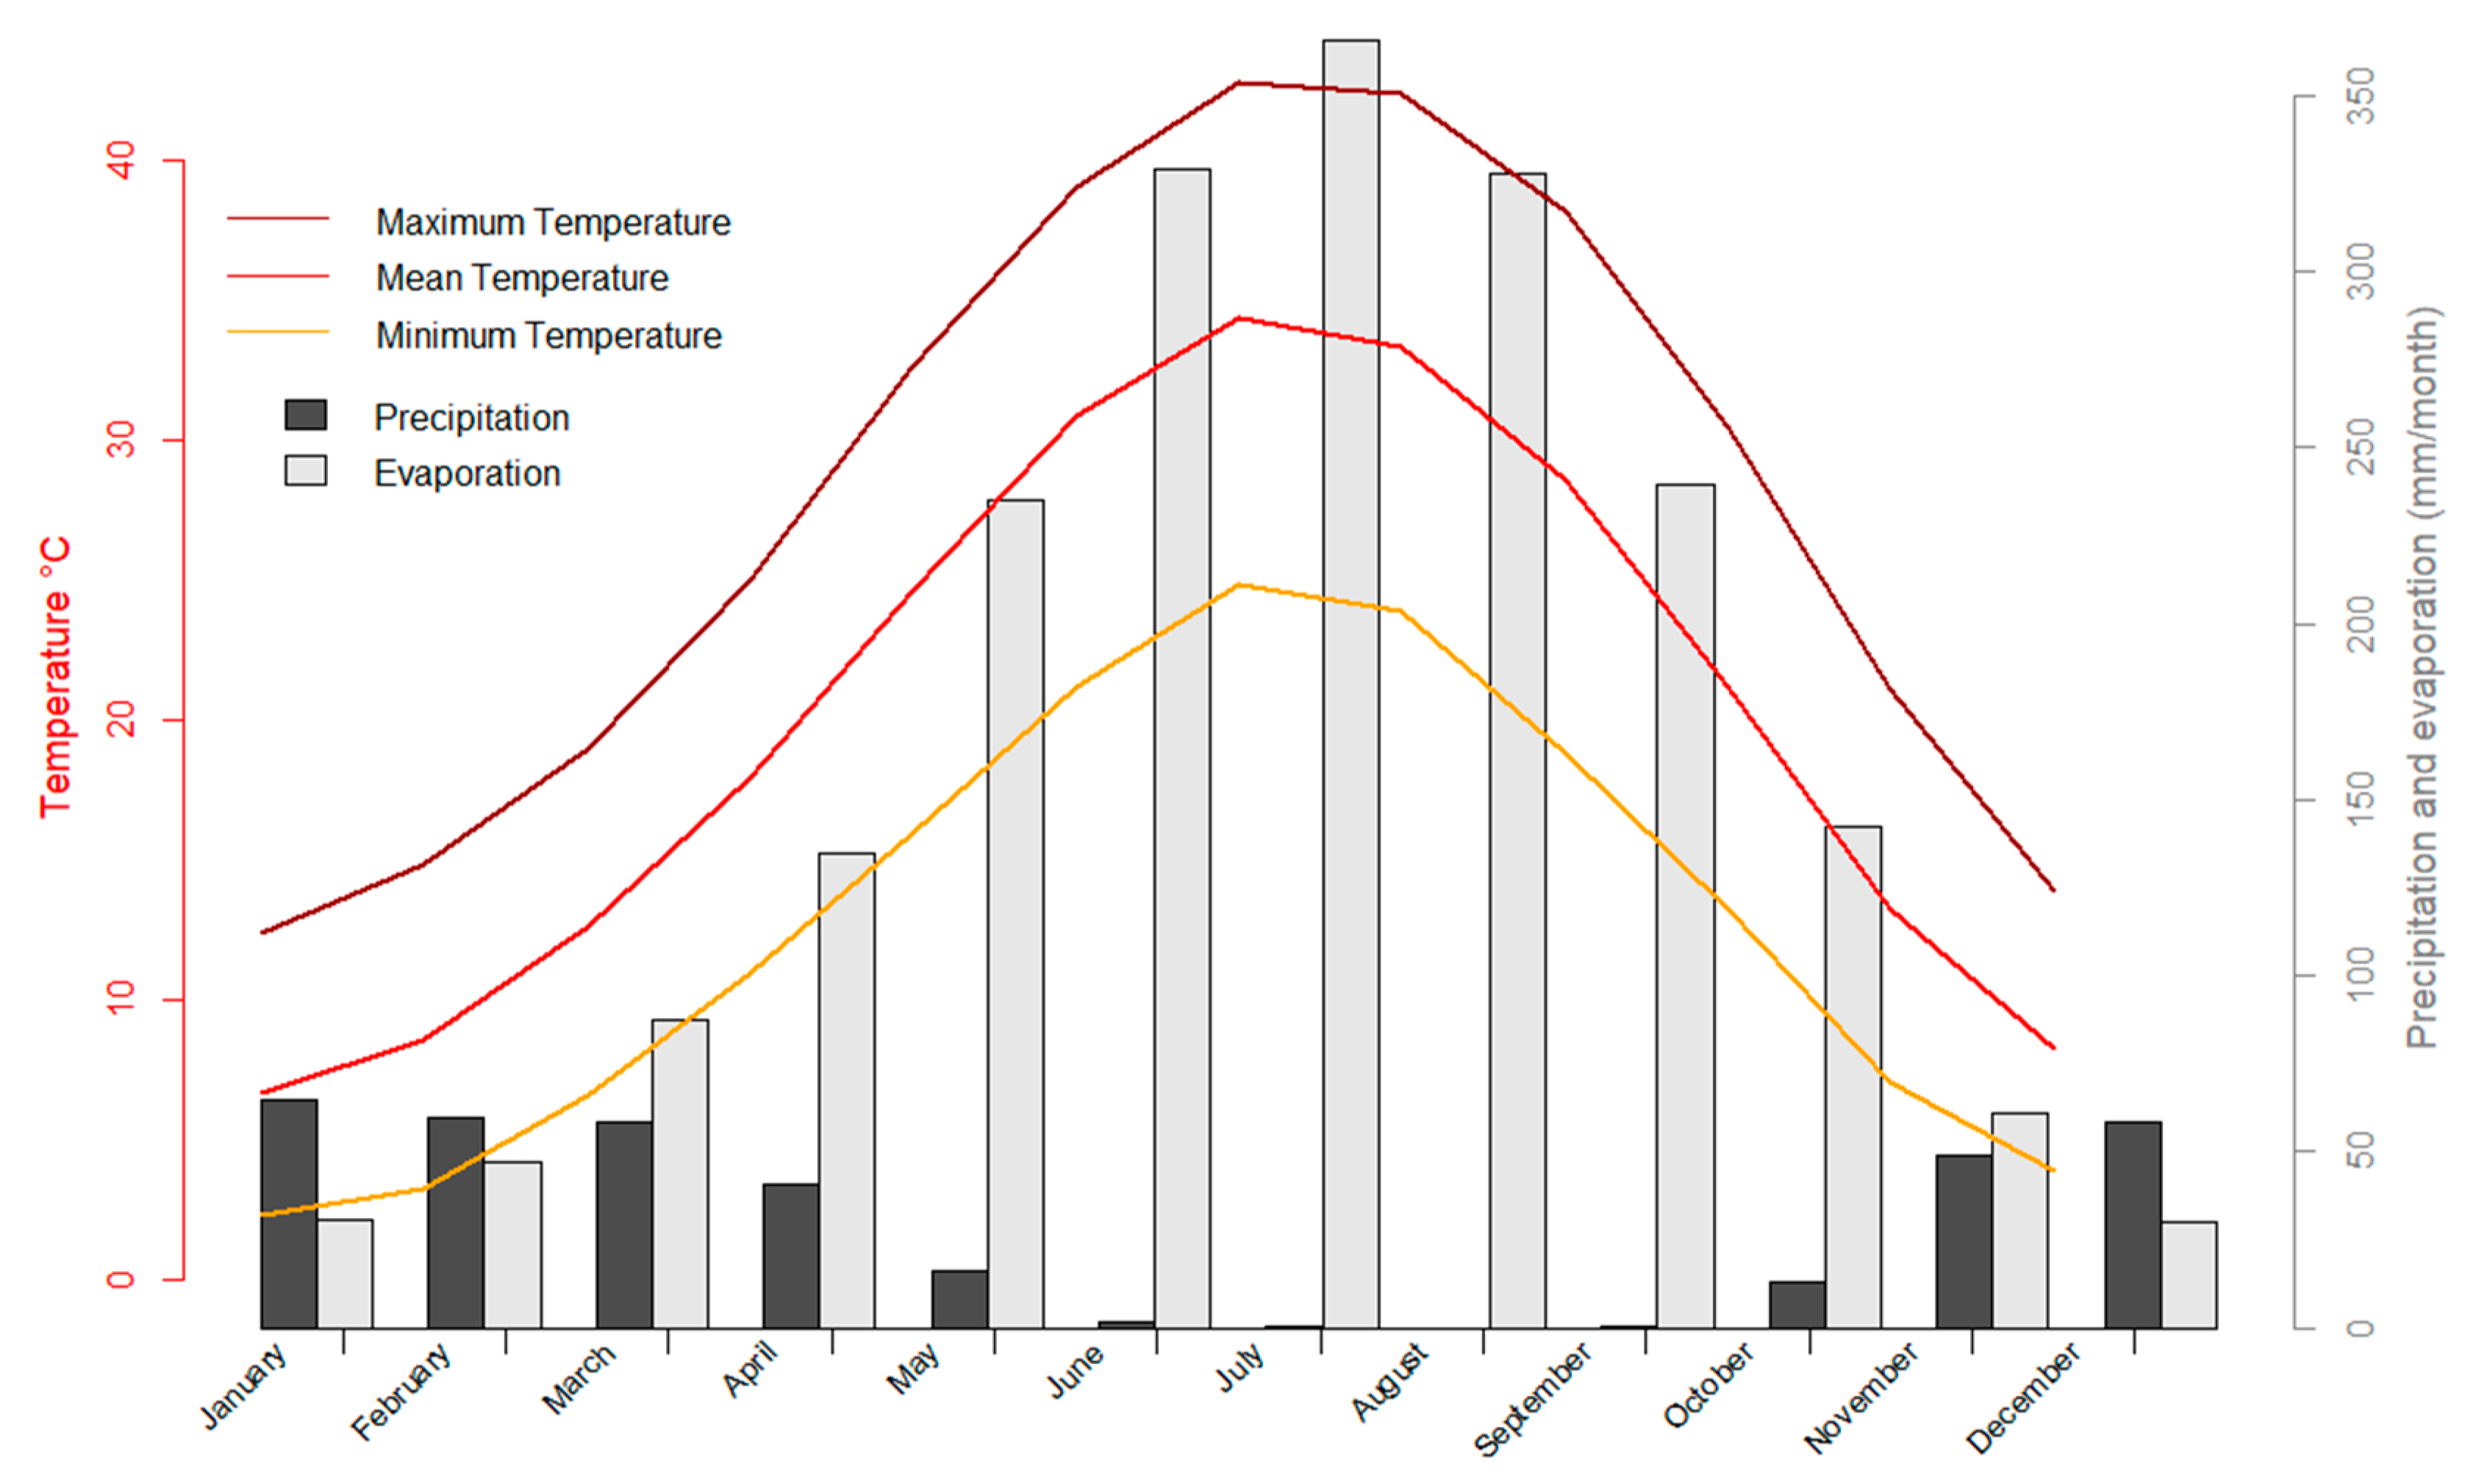
2.2. Climate and Discharge
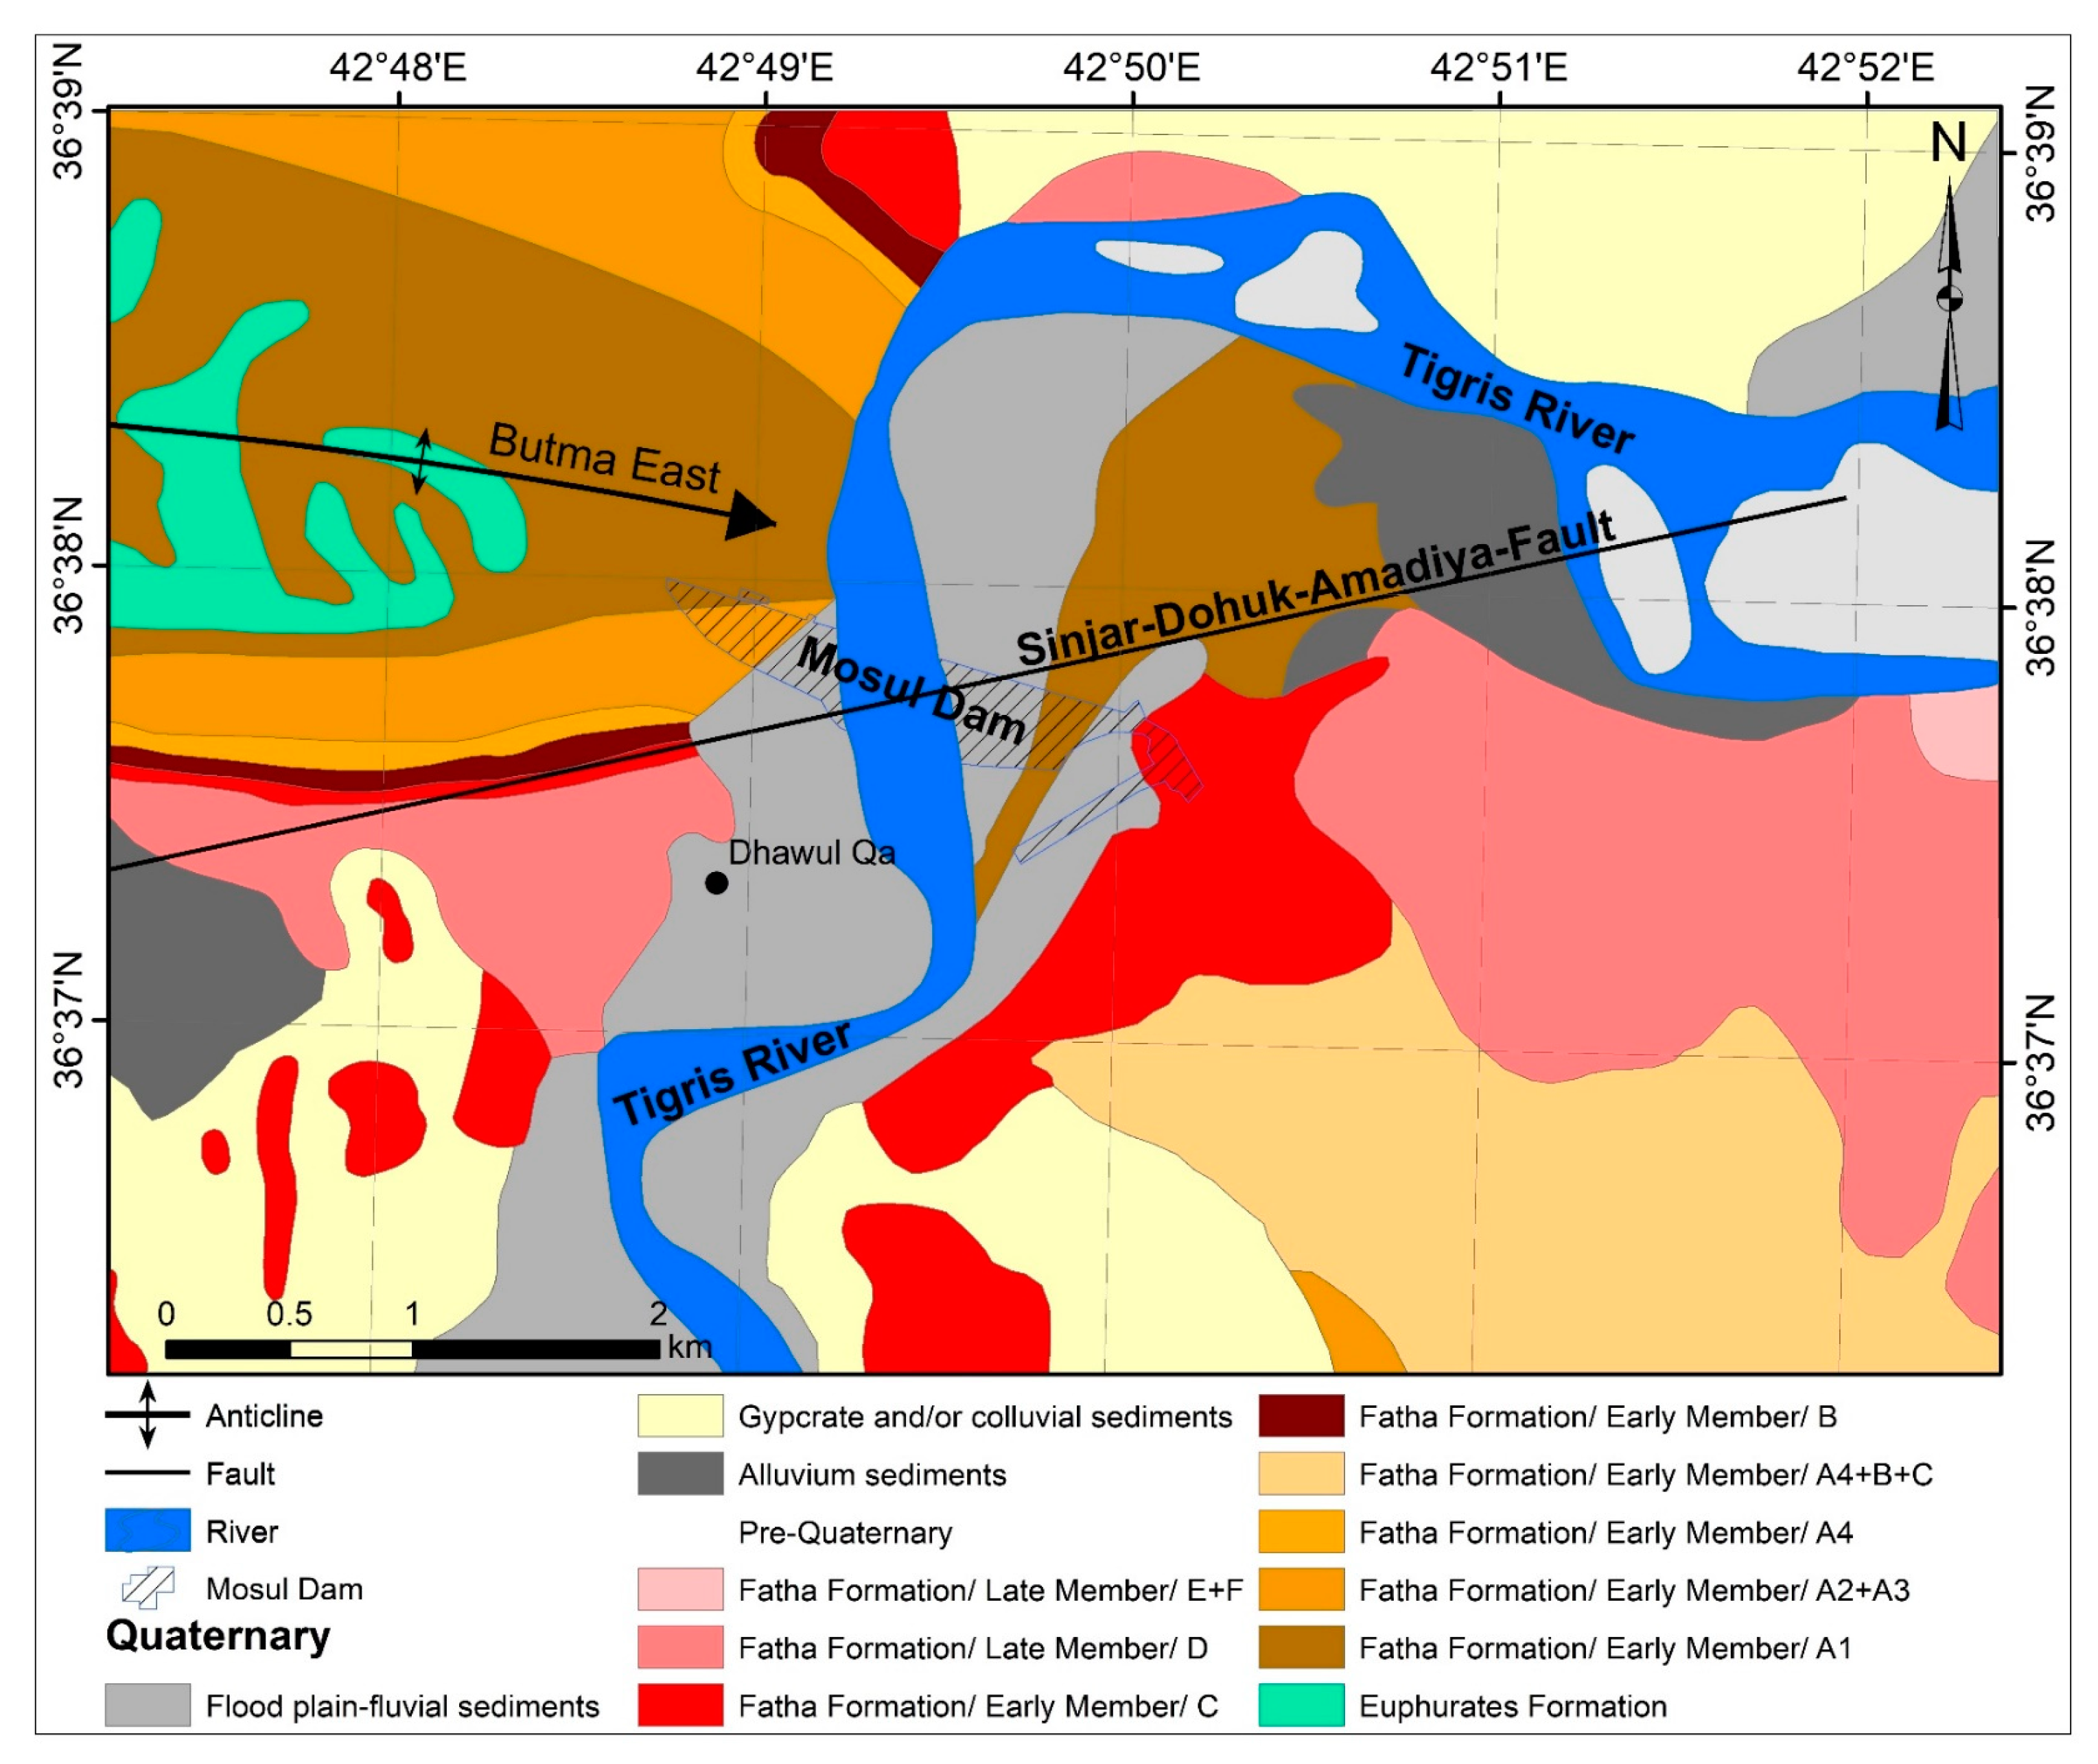
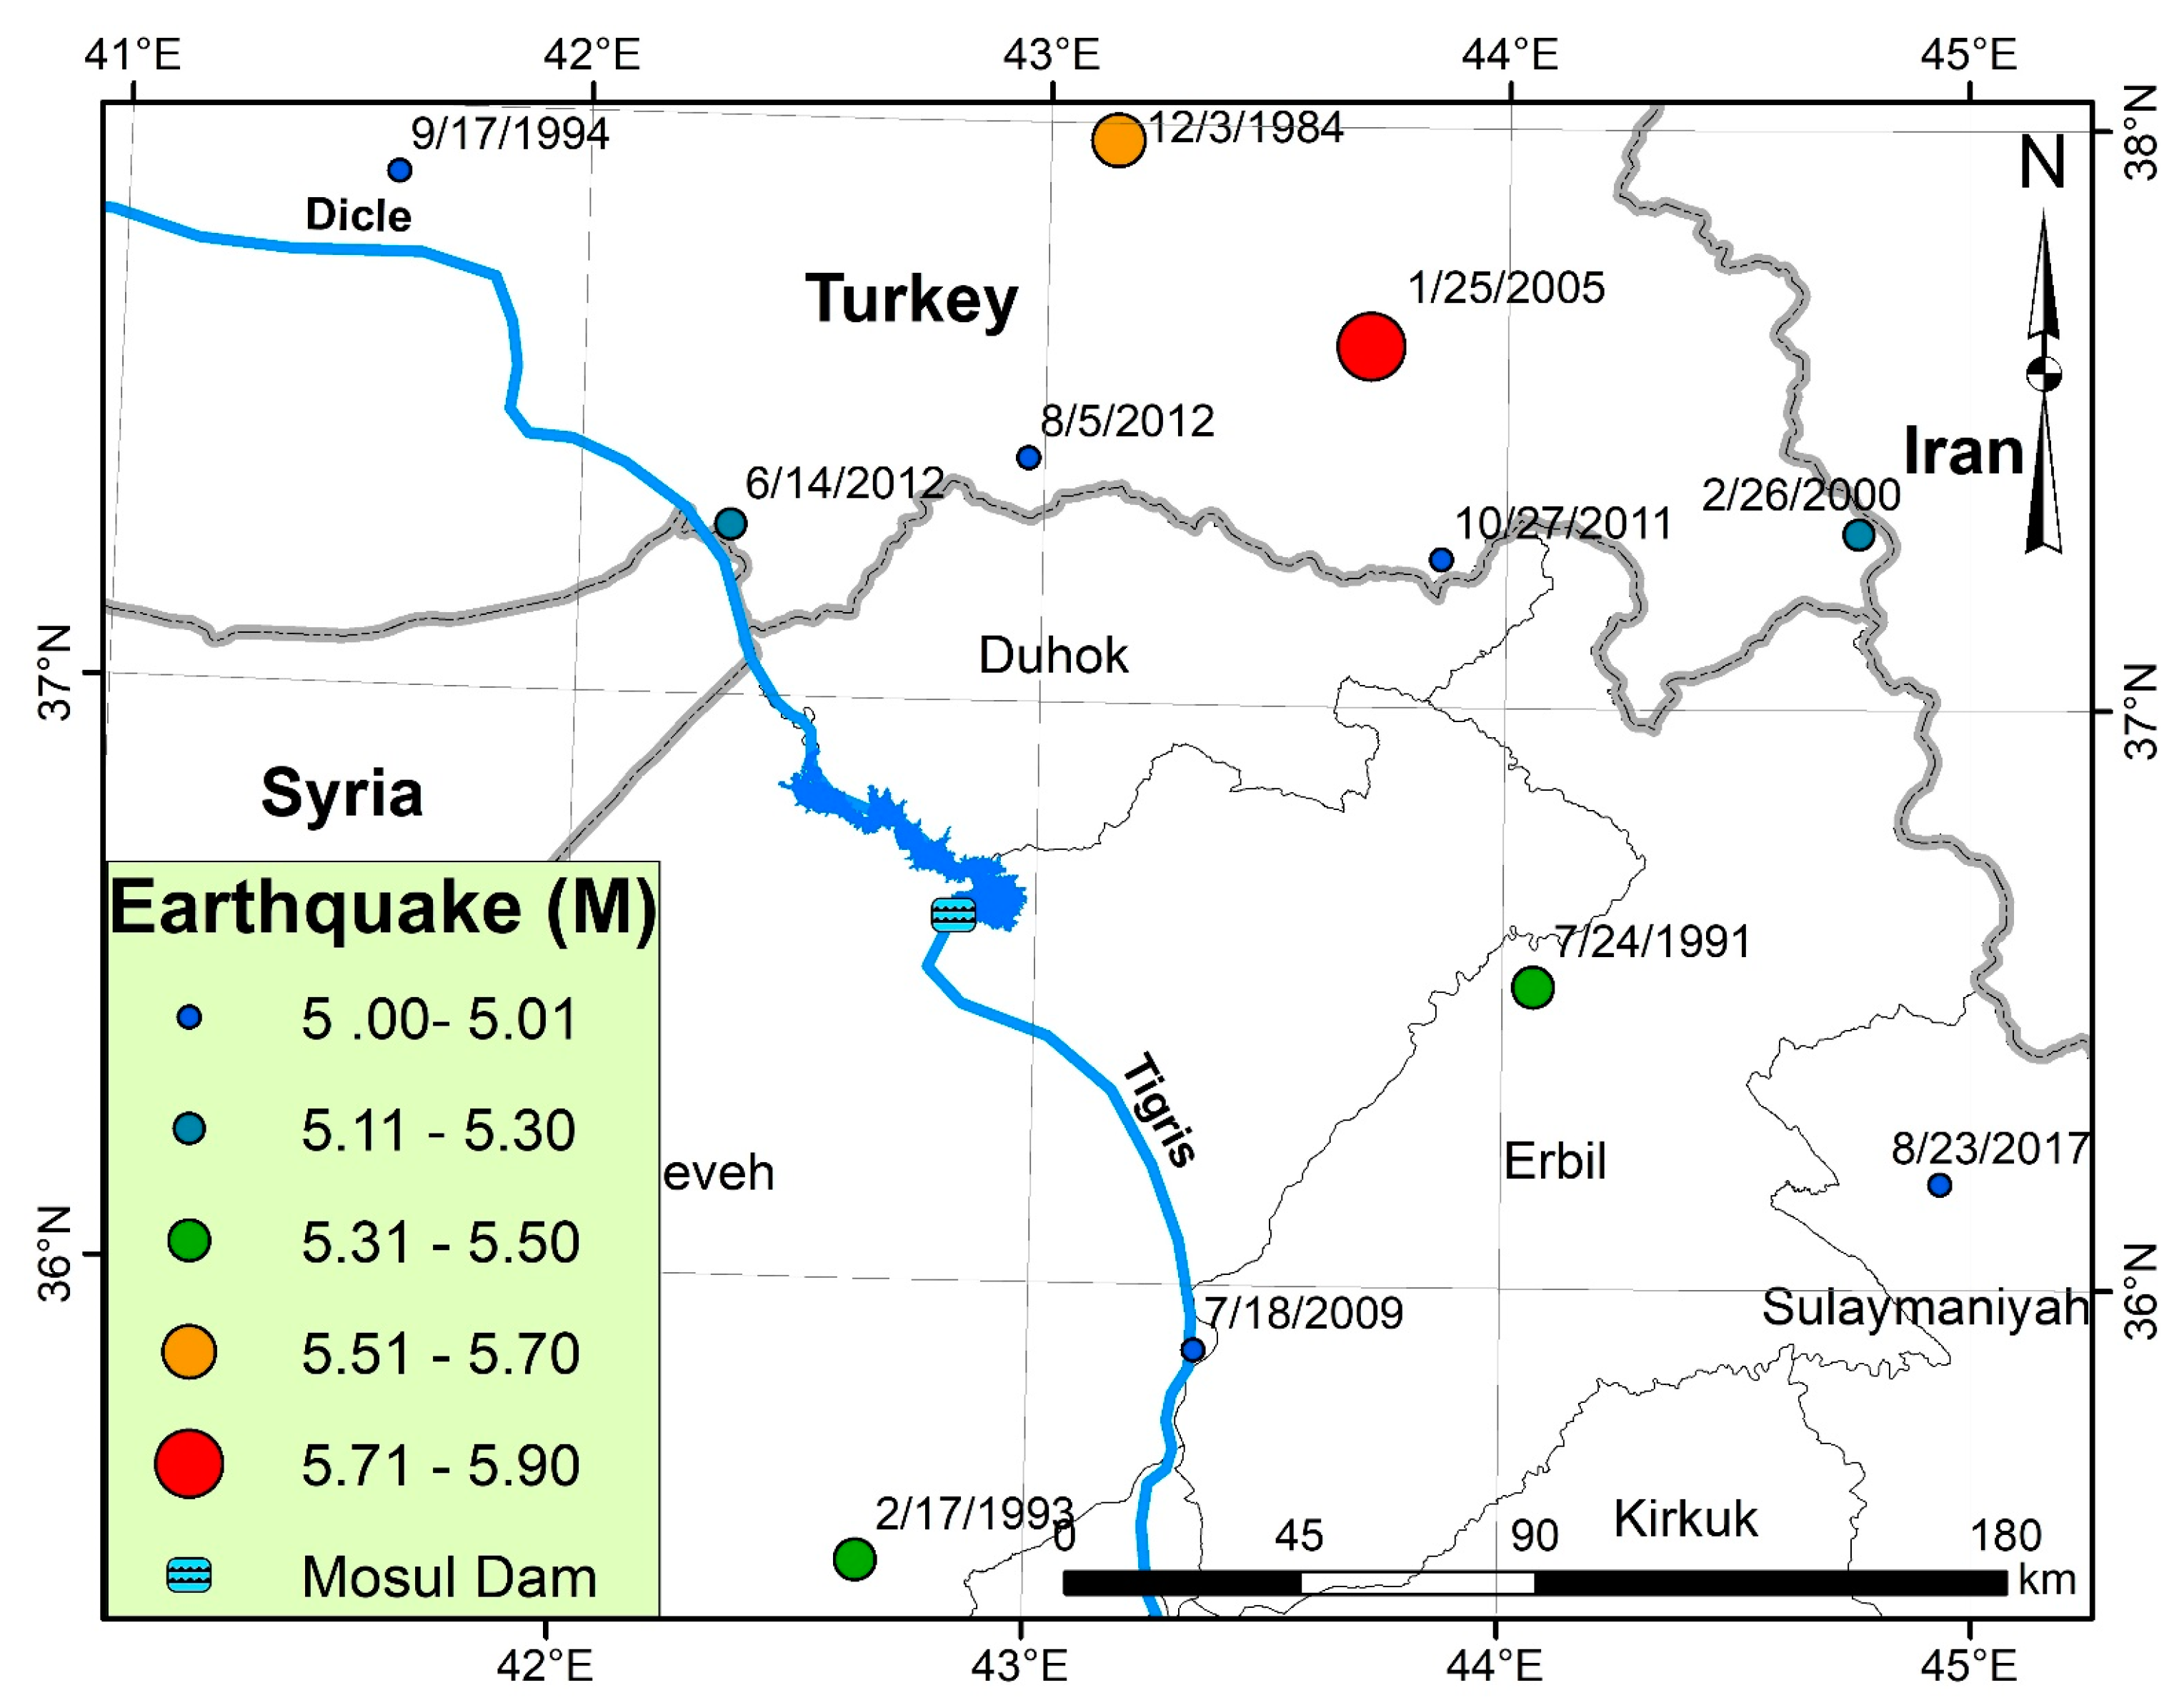
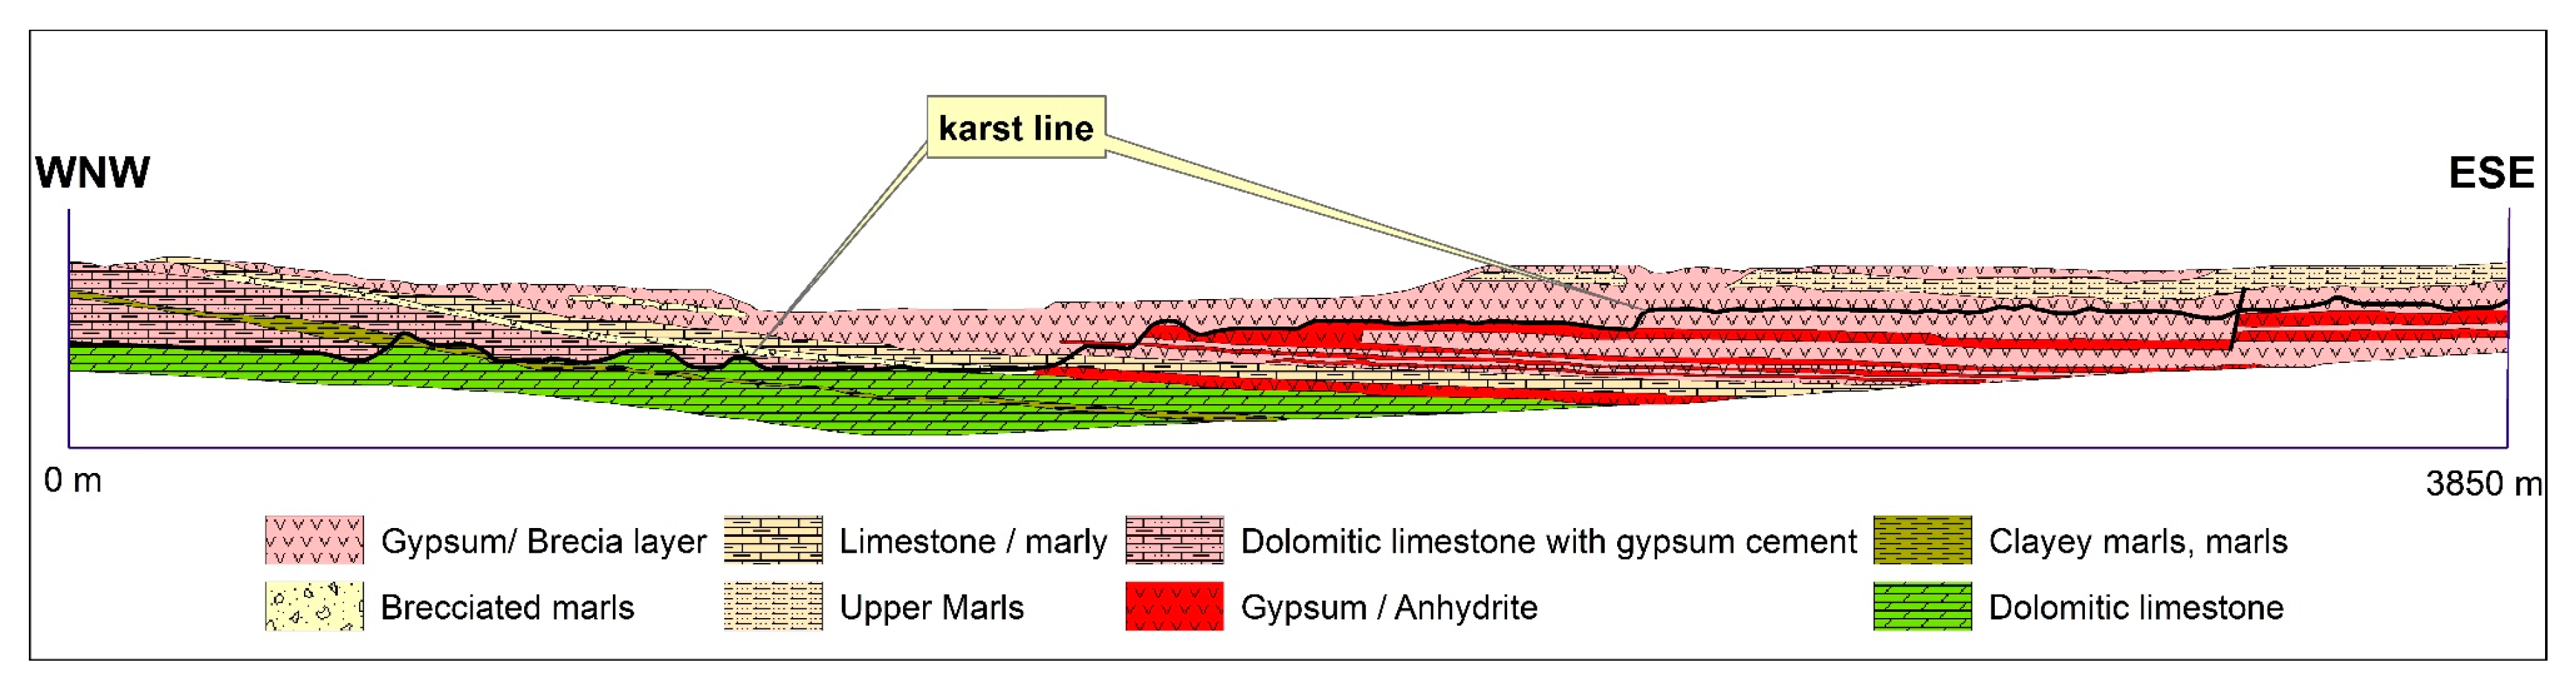
2.3. Geological Setting
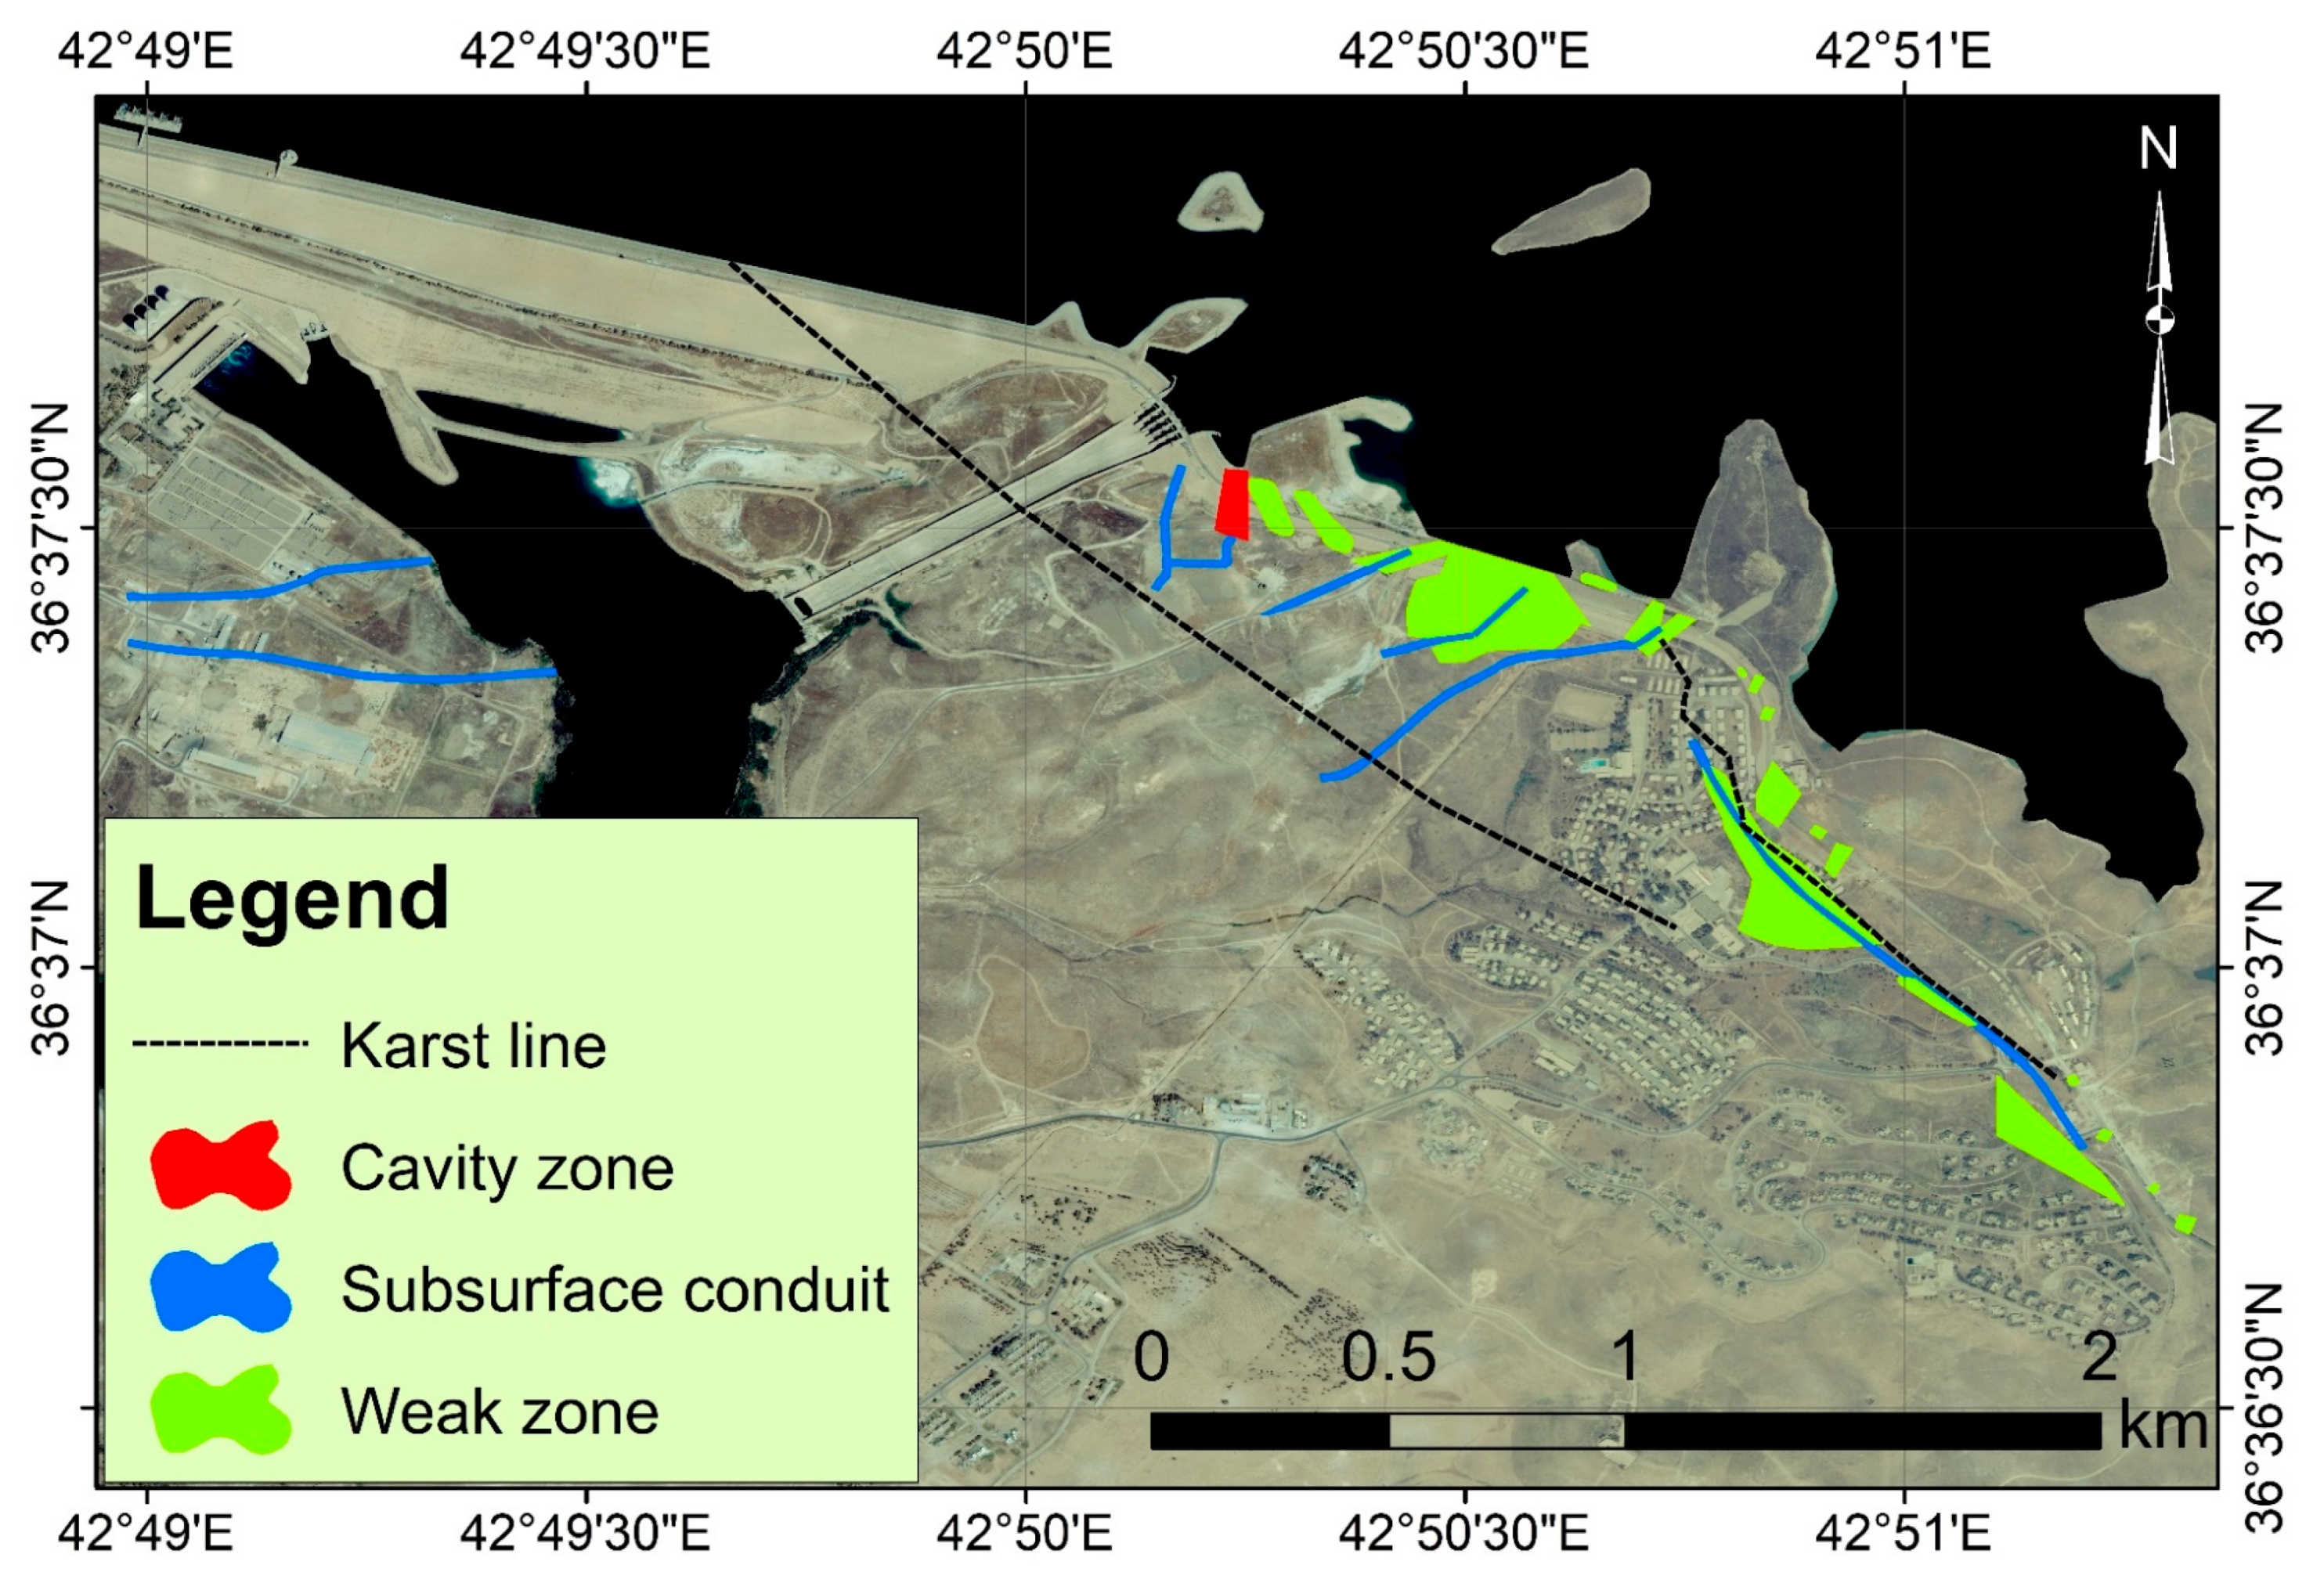
2.4. Mosul Dam and Karstification
3. Materials and Methods
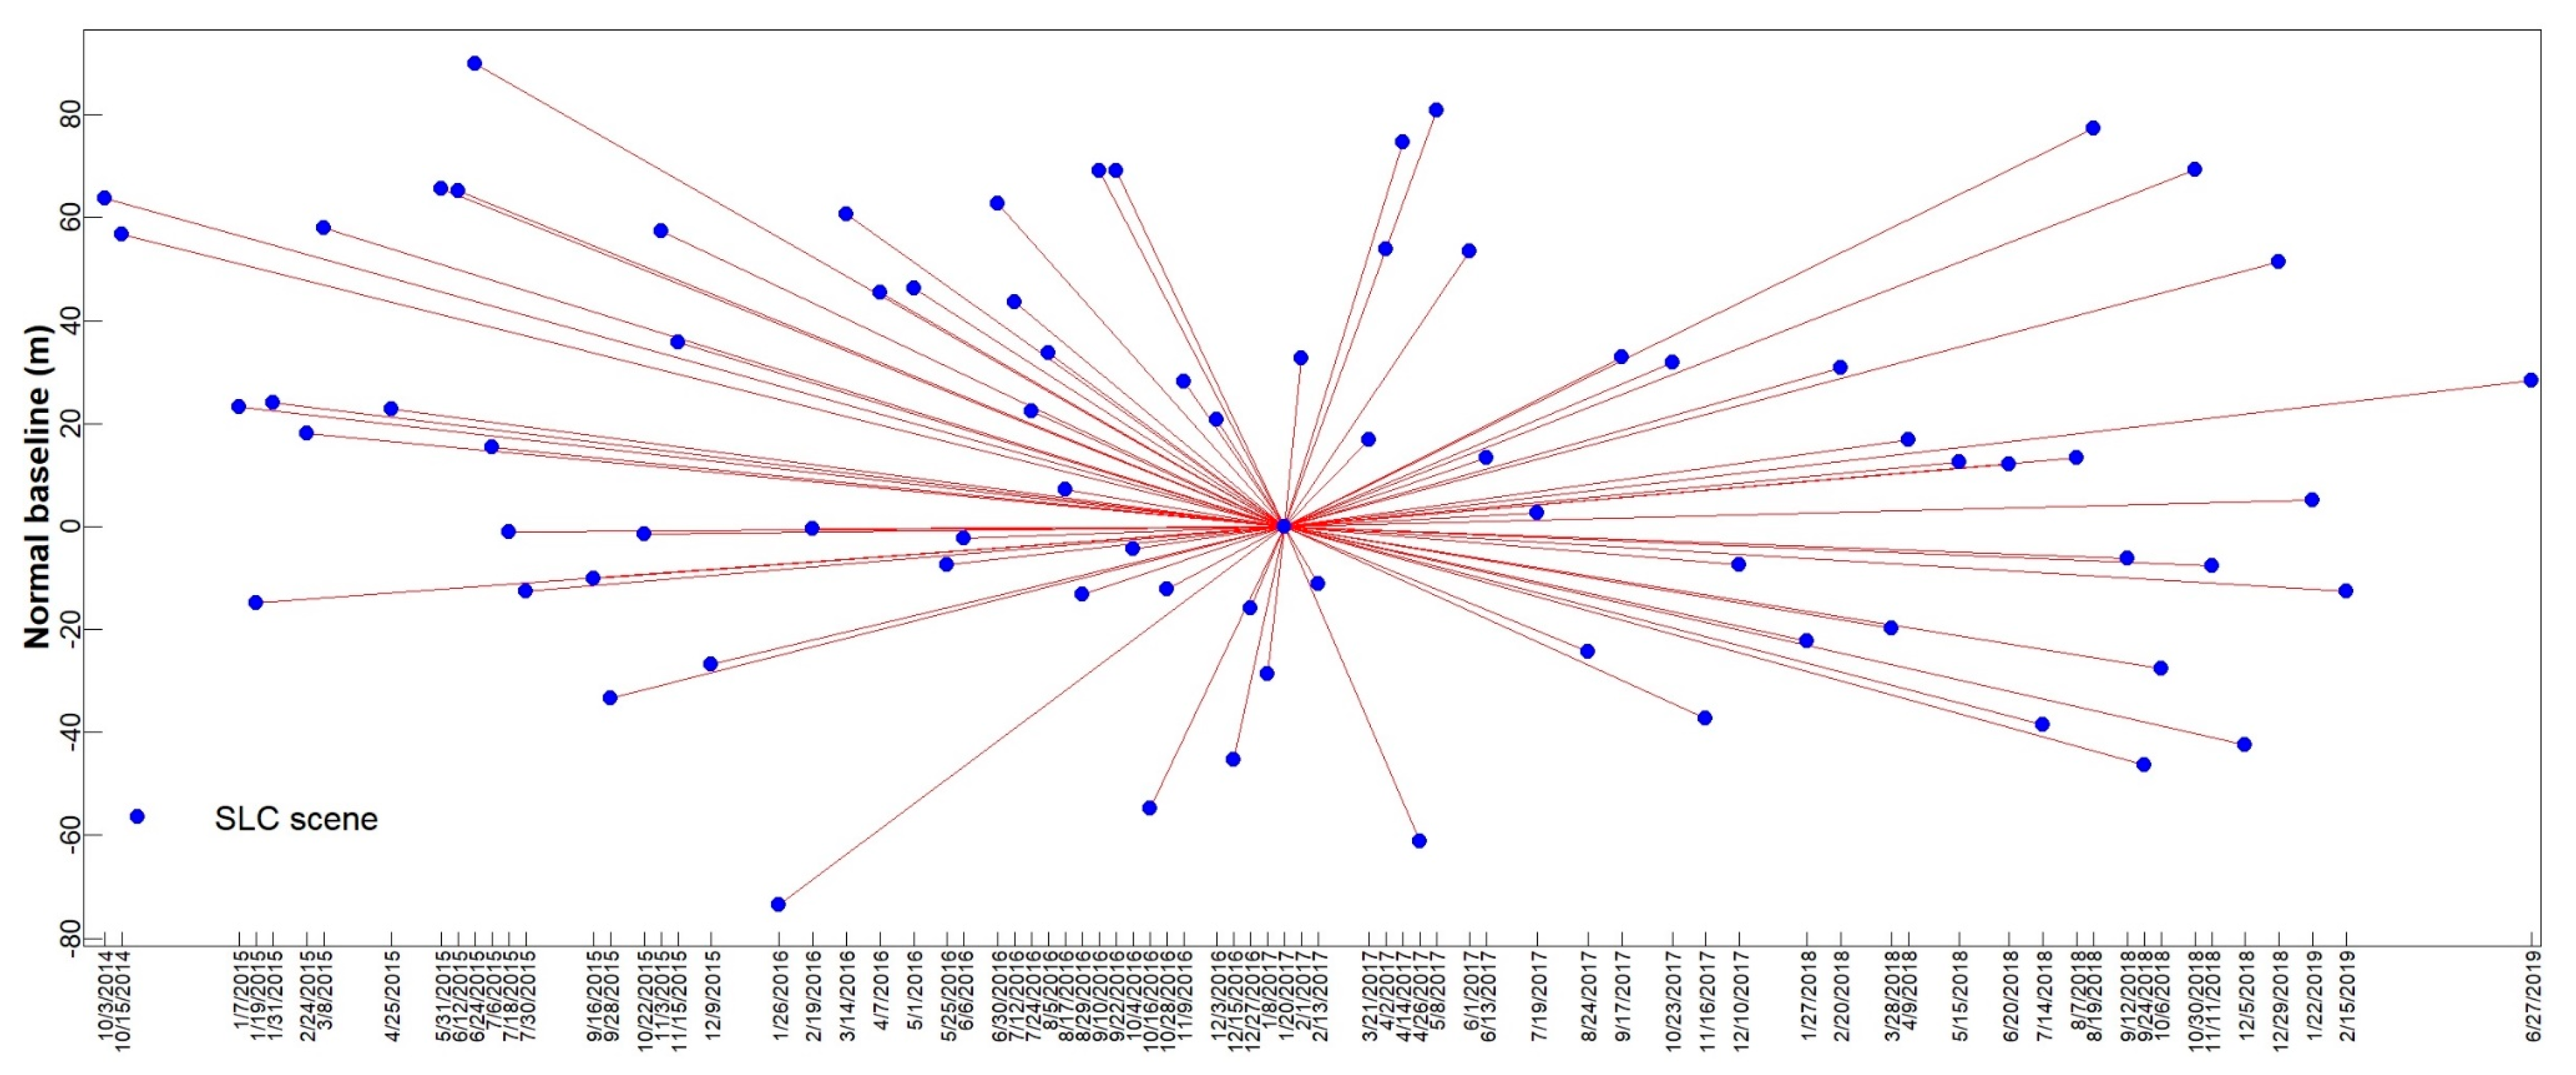
3.1. Data
3.2. Software
3.3. Pre-Processing Work and Persistent Scatterer Interferometry (PSI)
4. Results
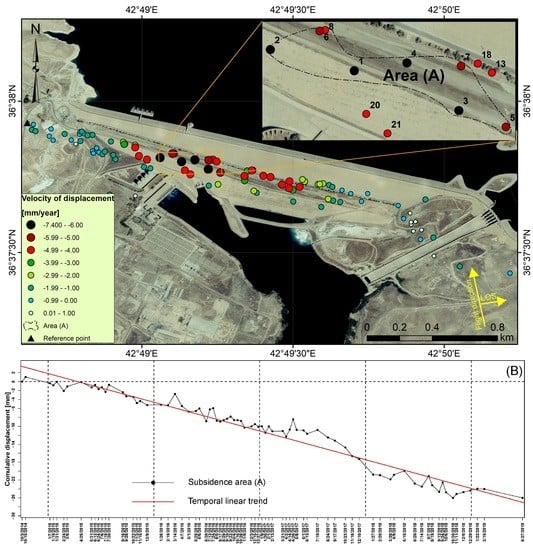
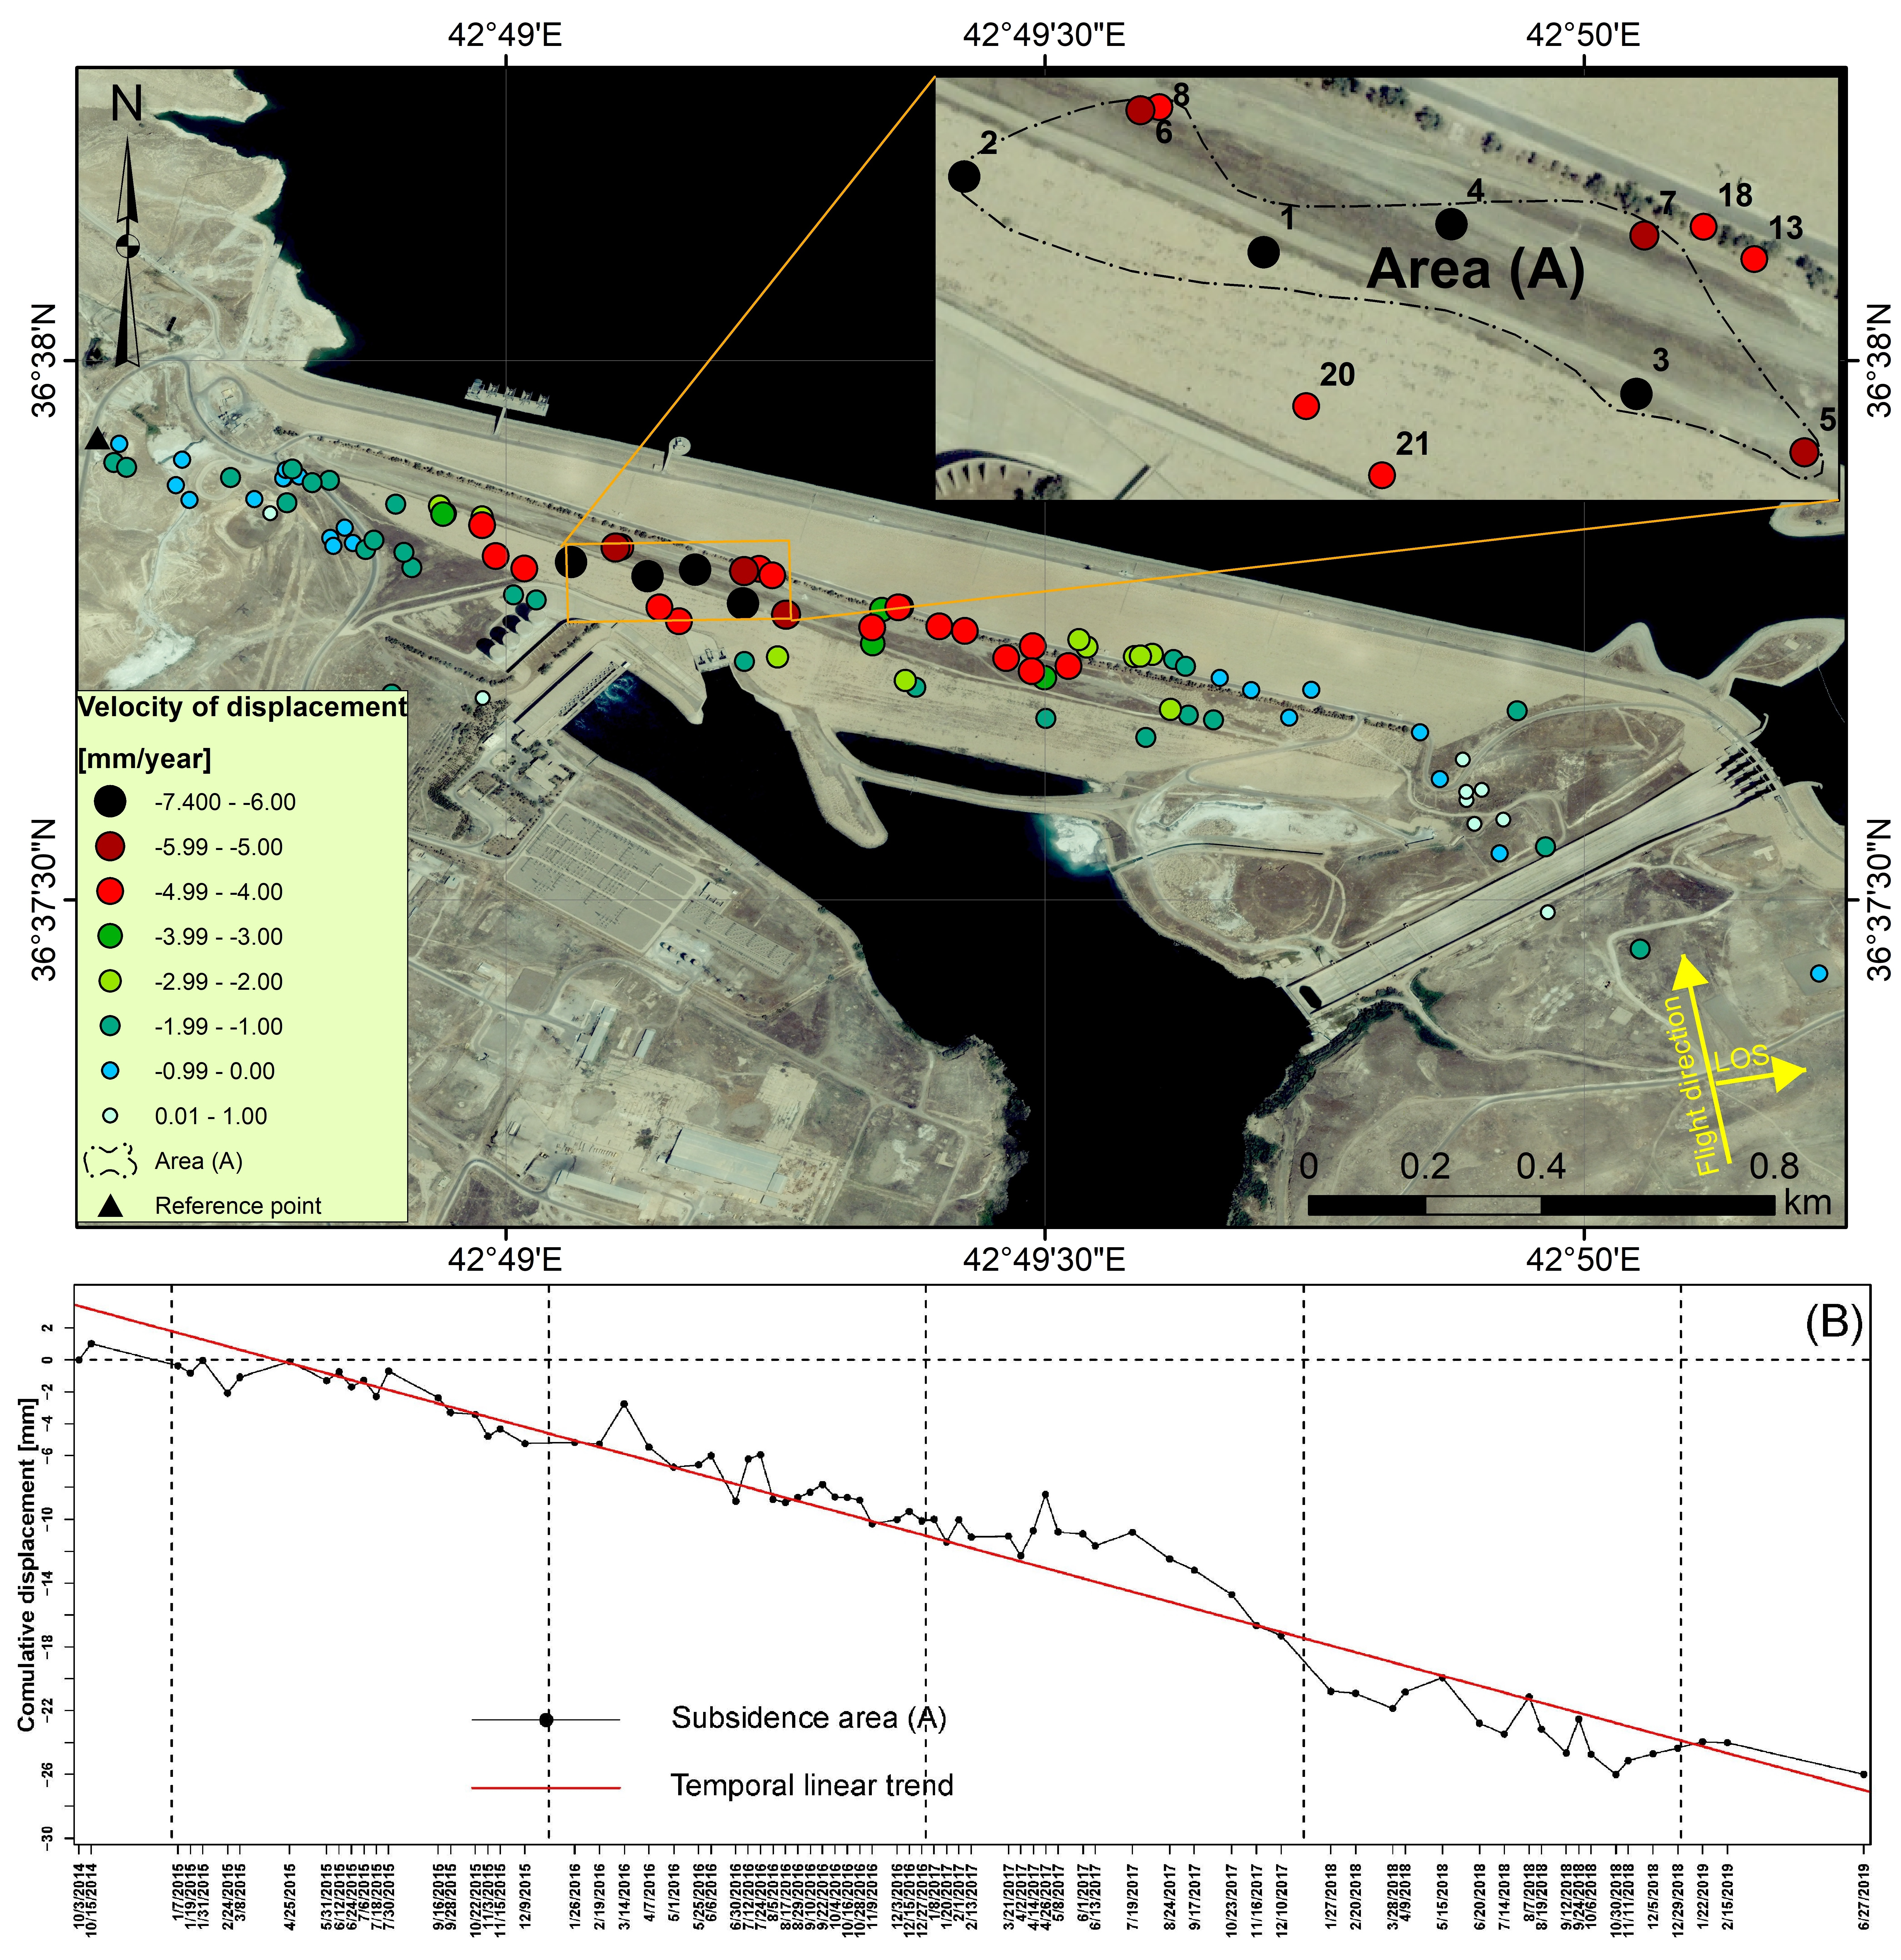
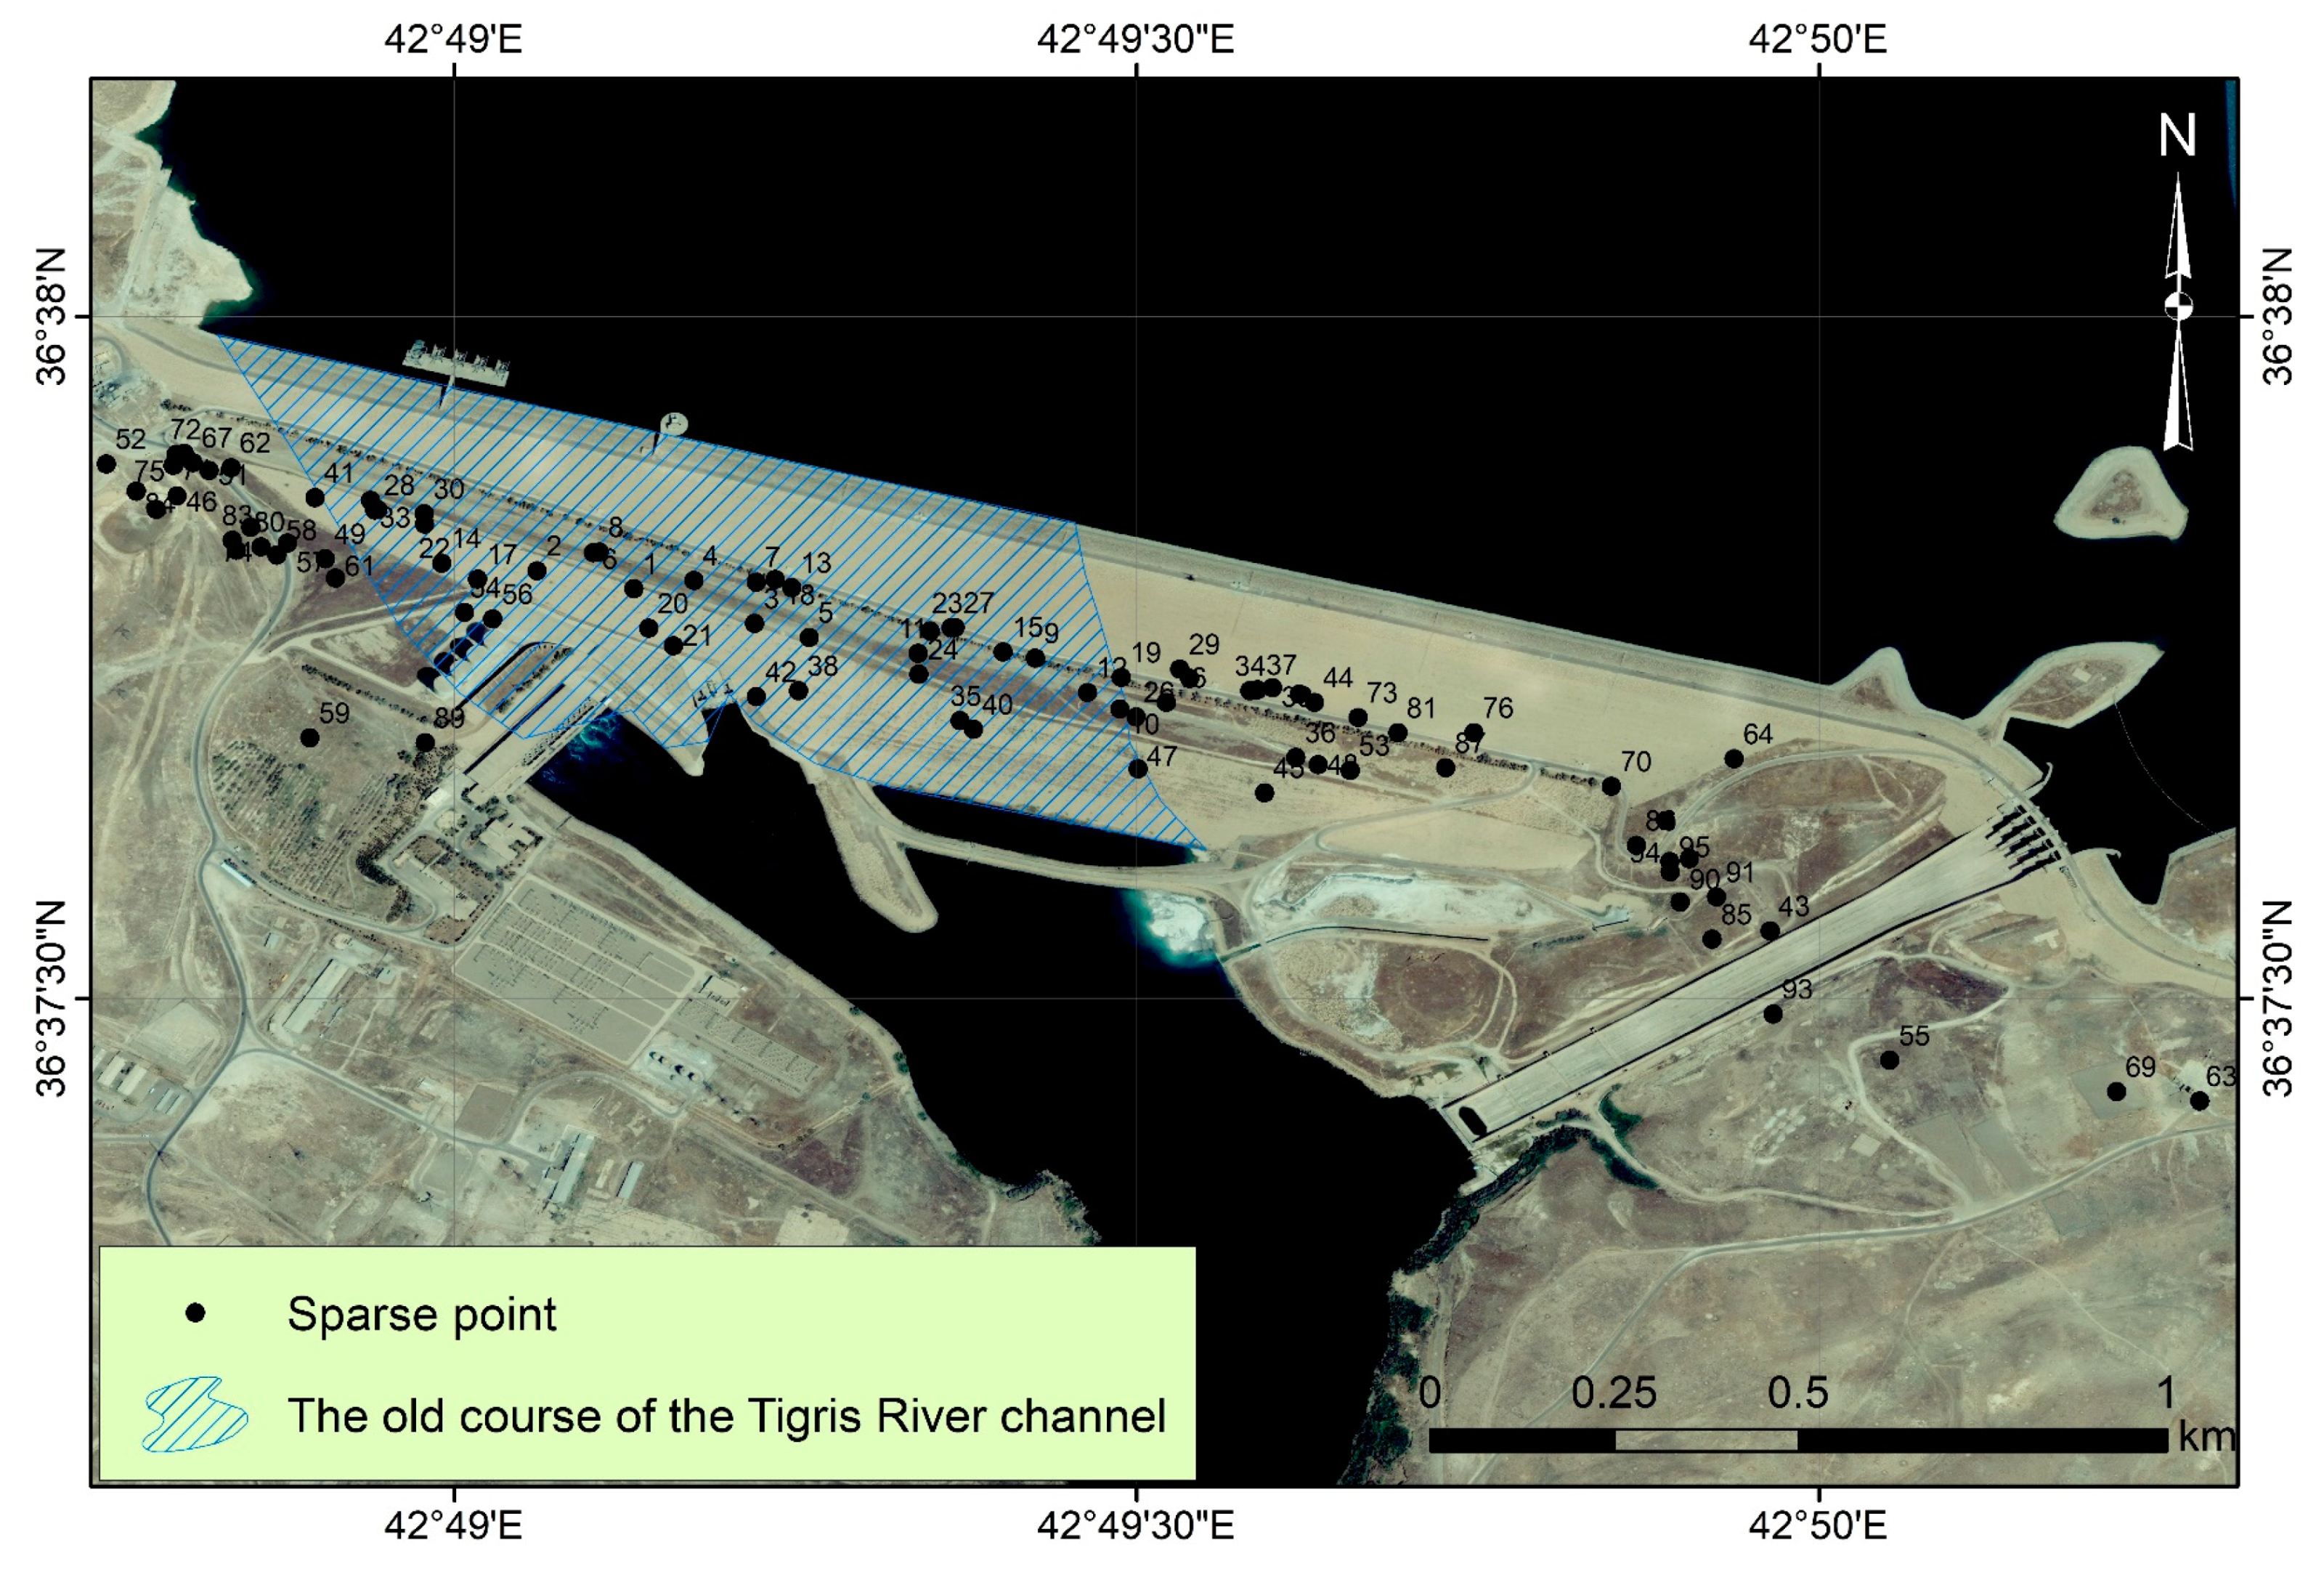
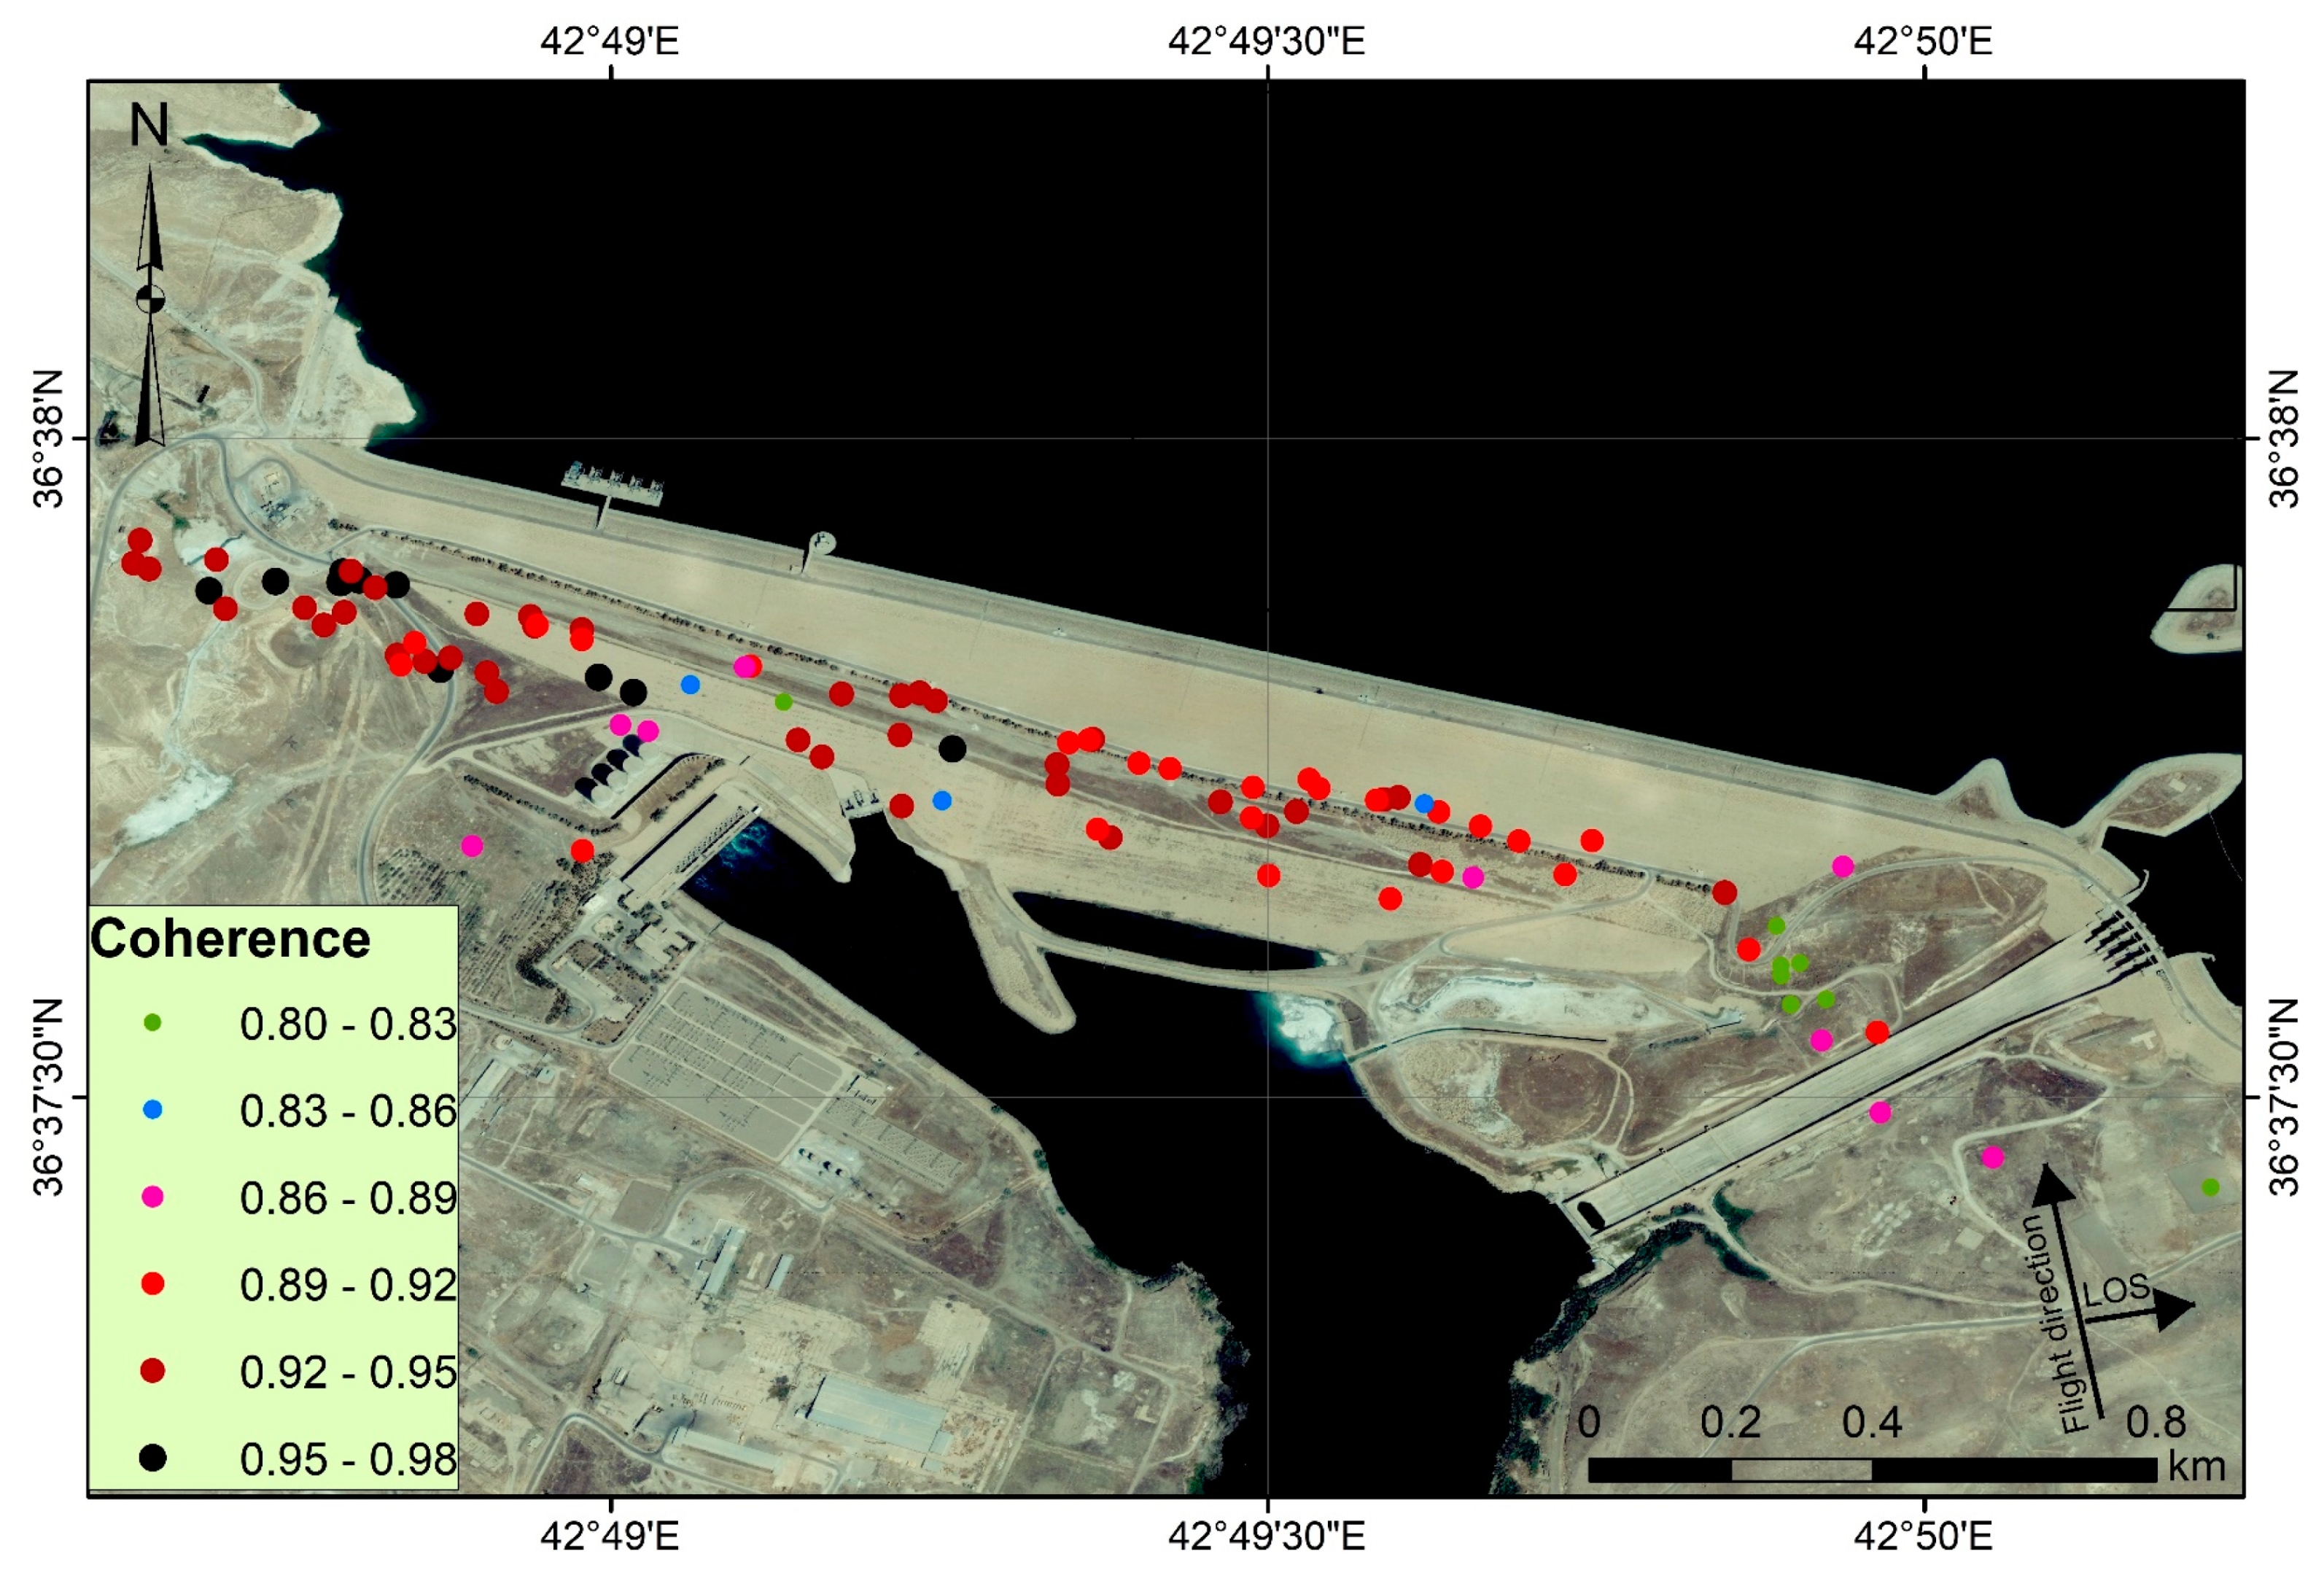
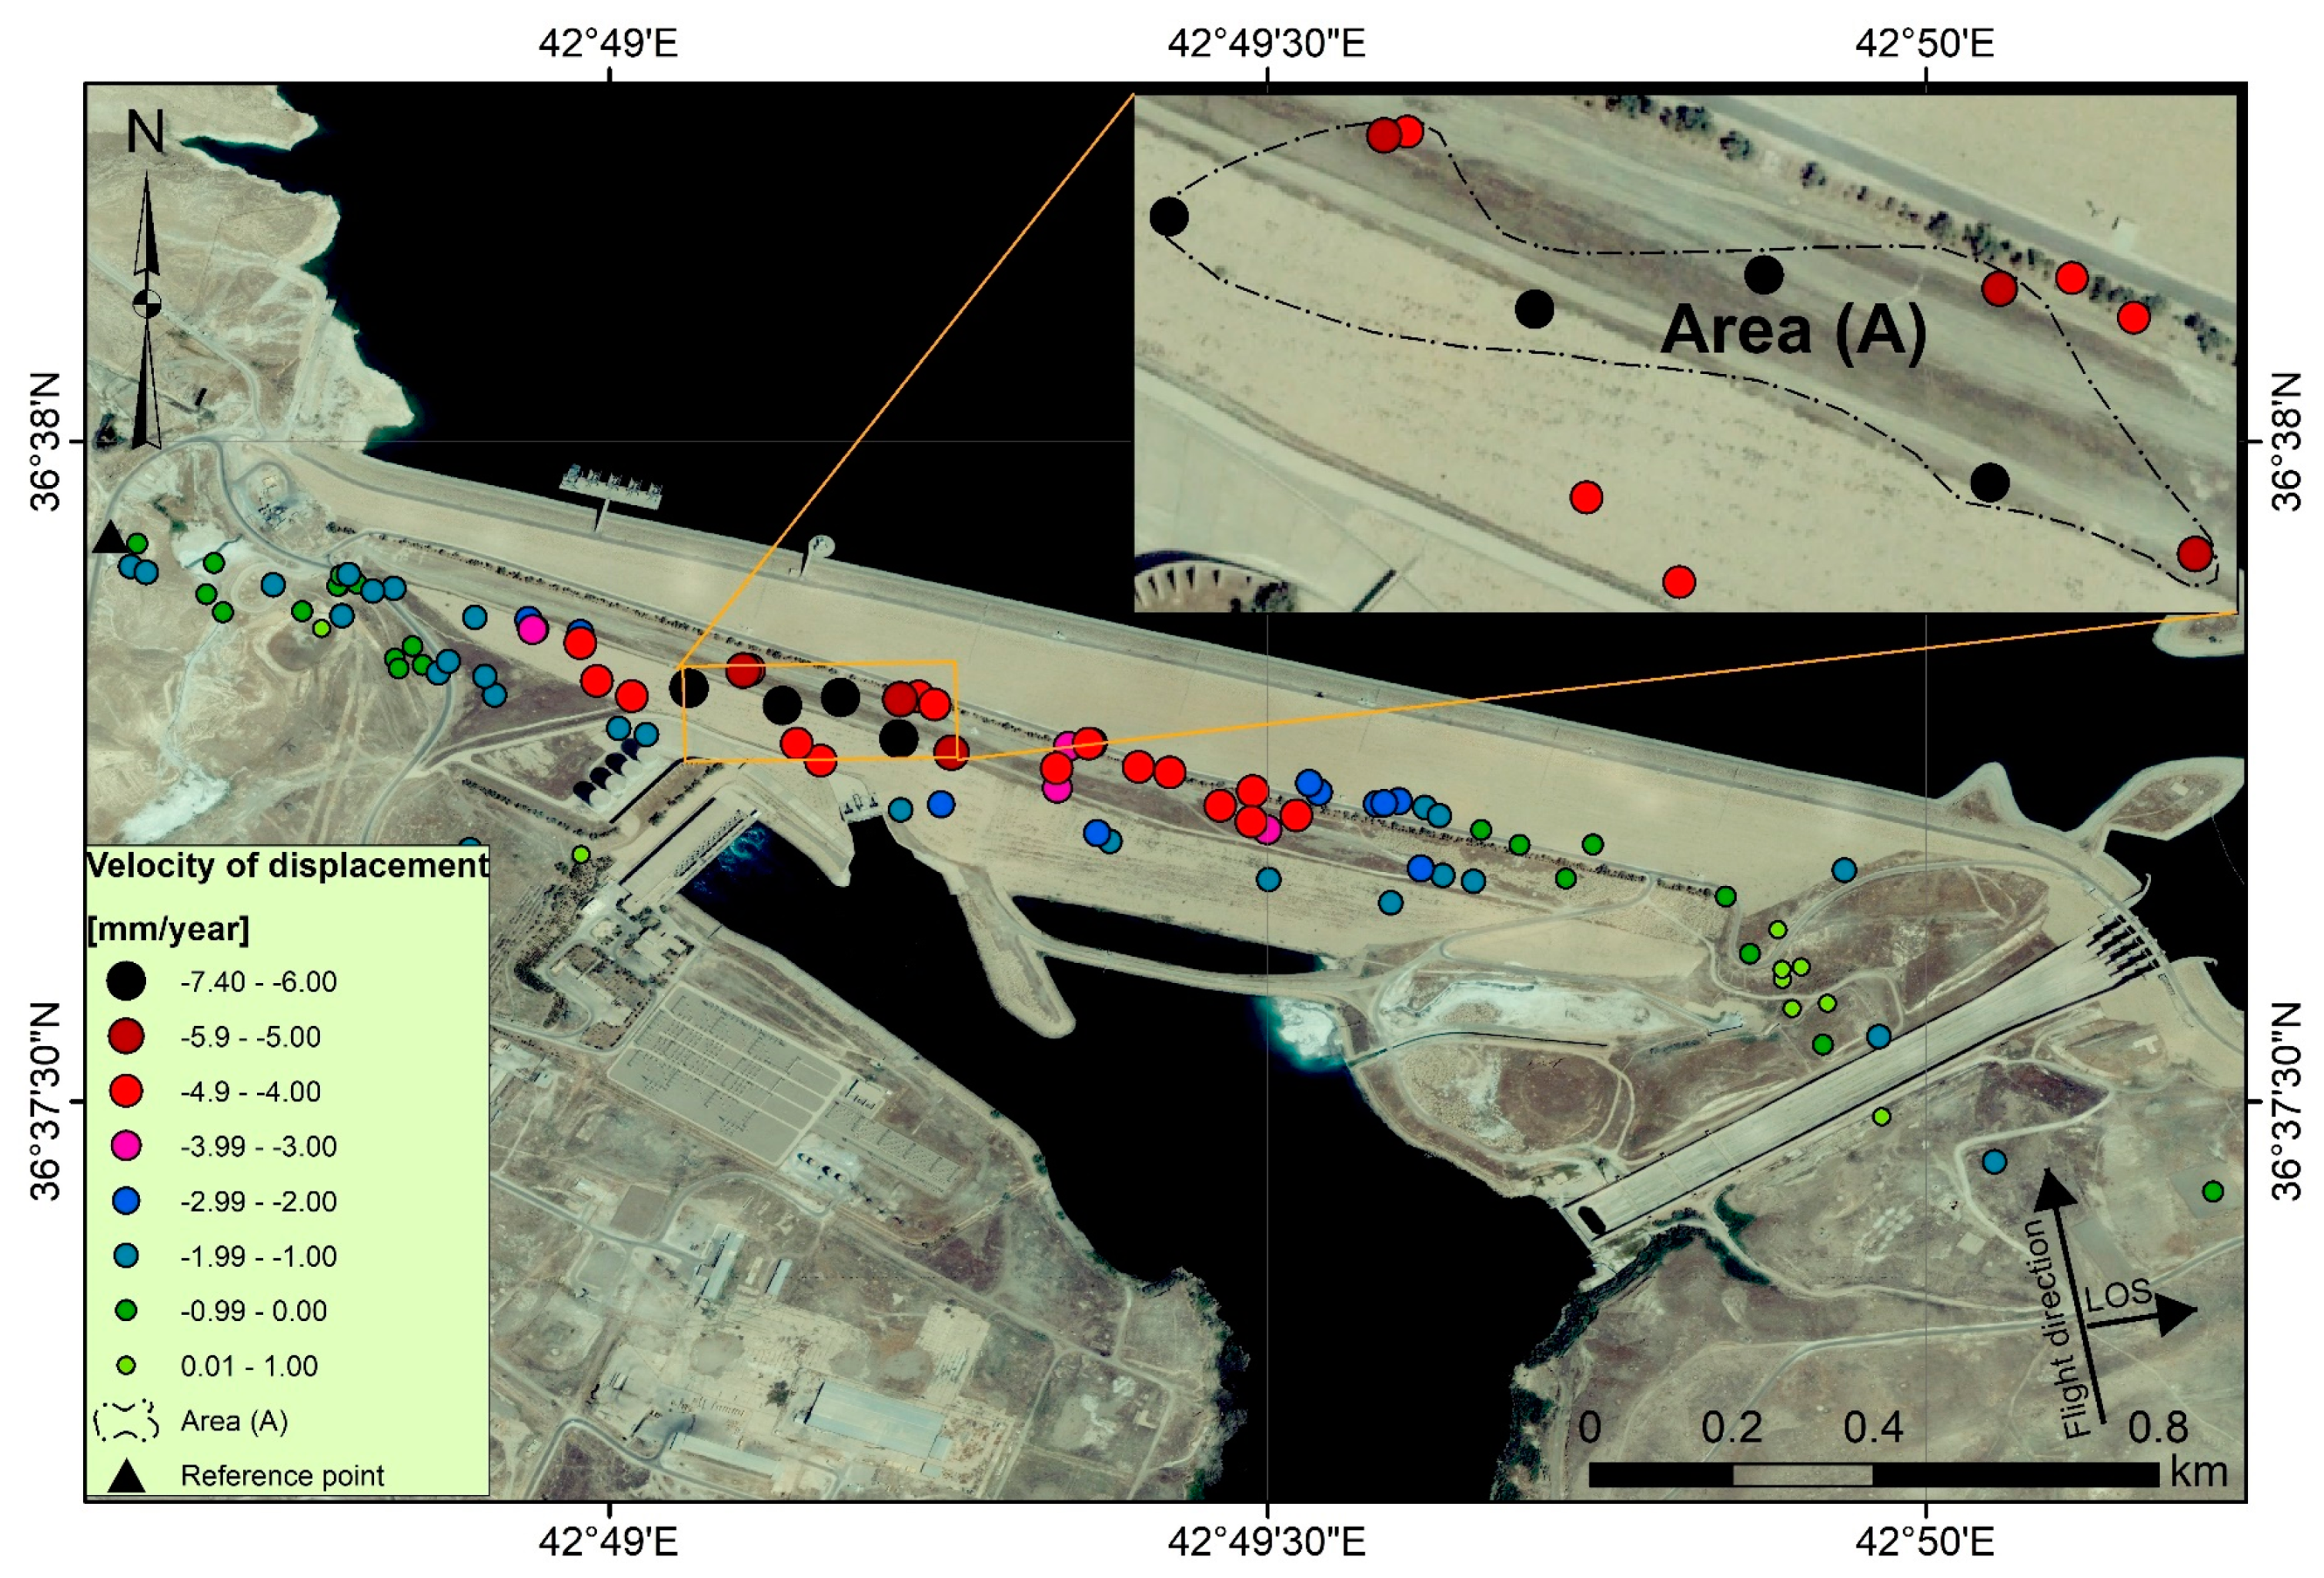
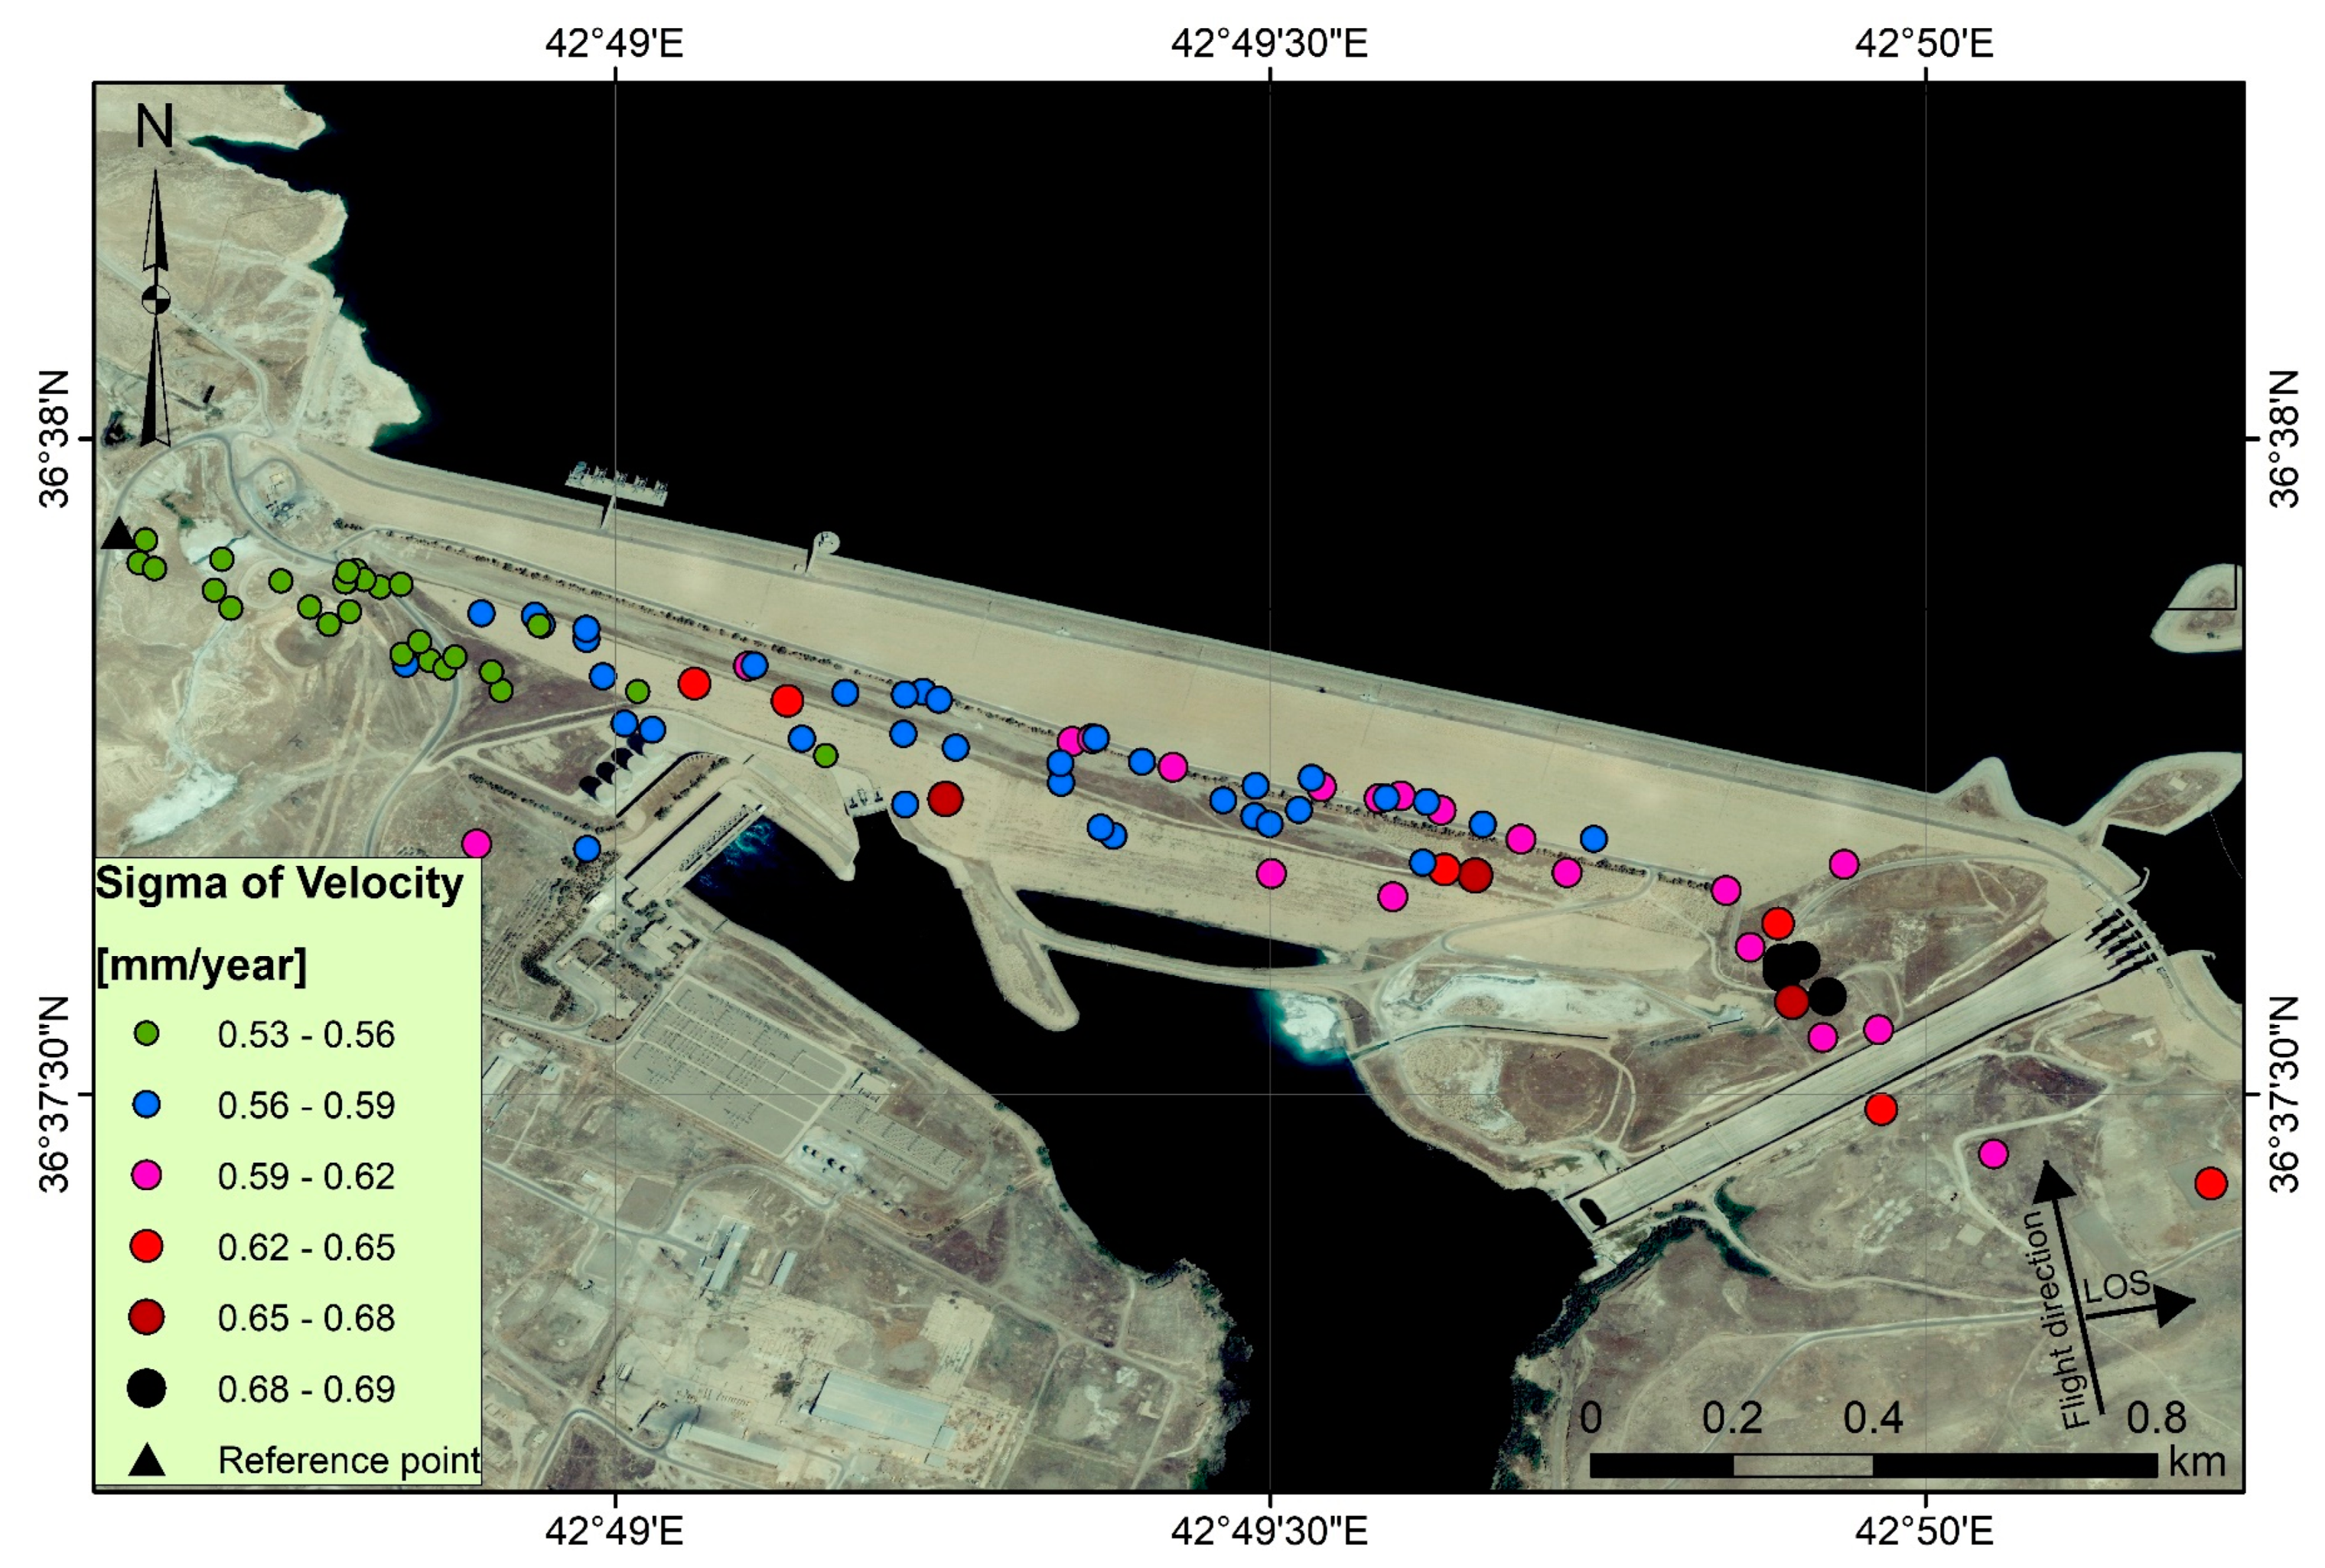
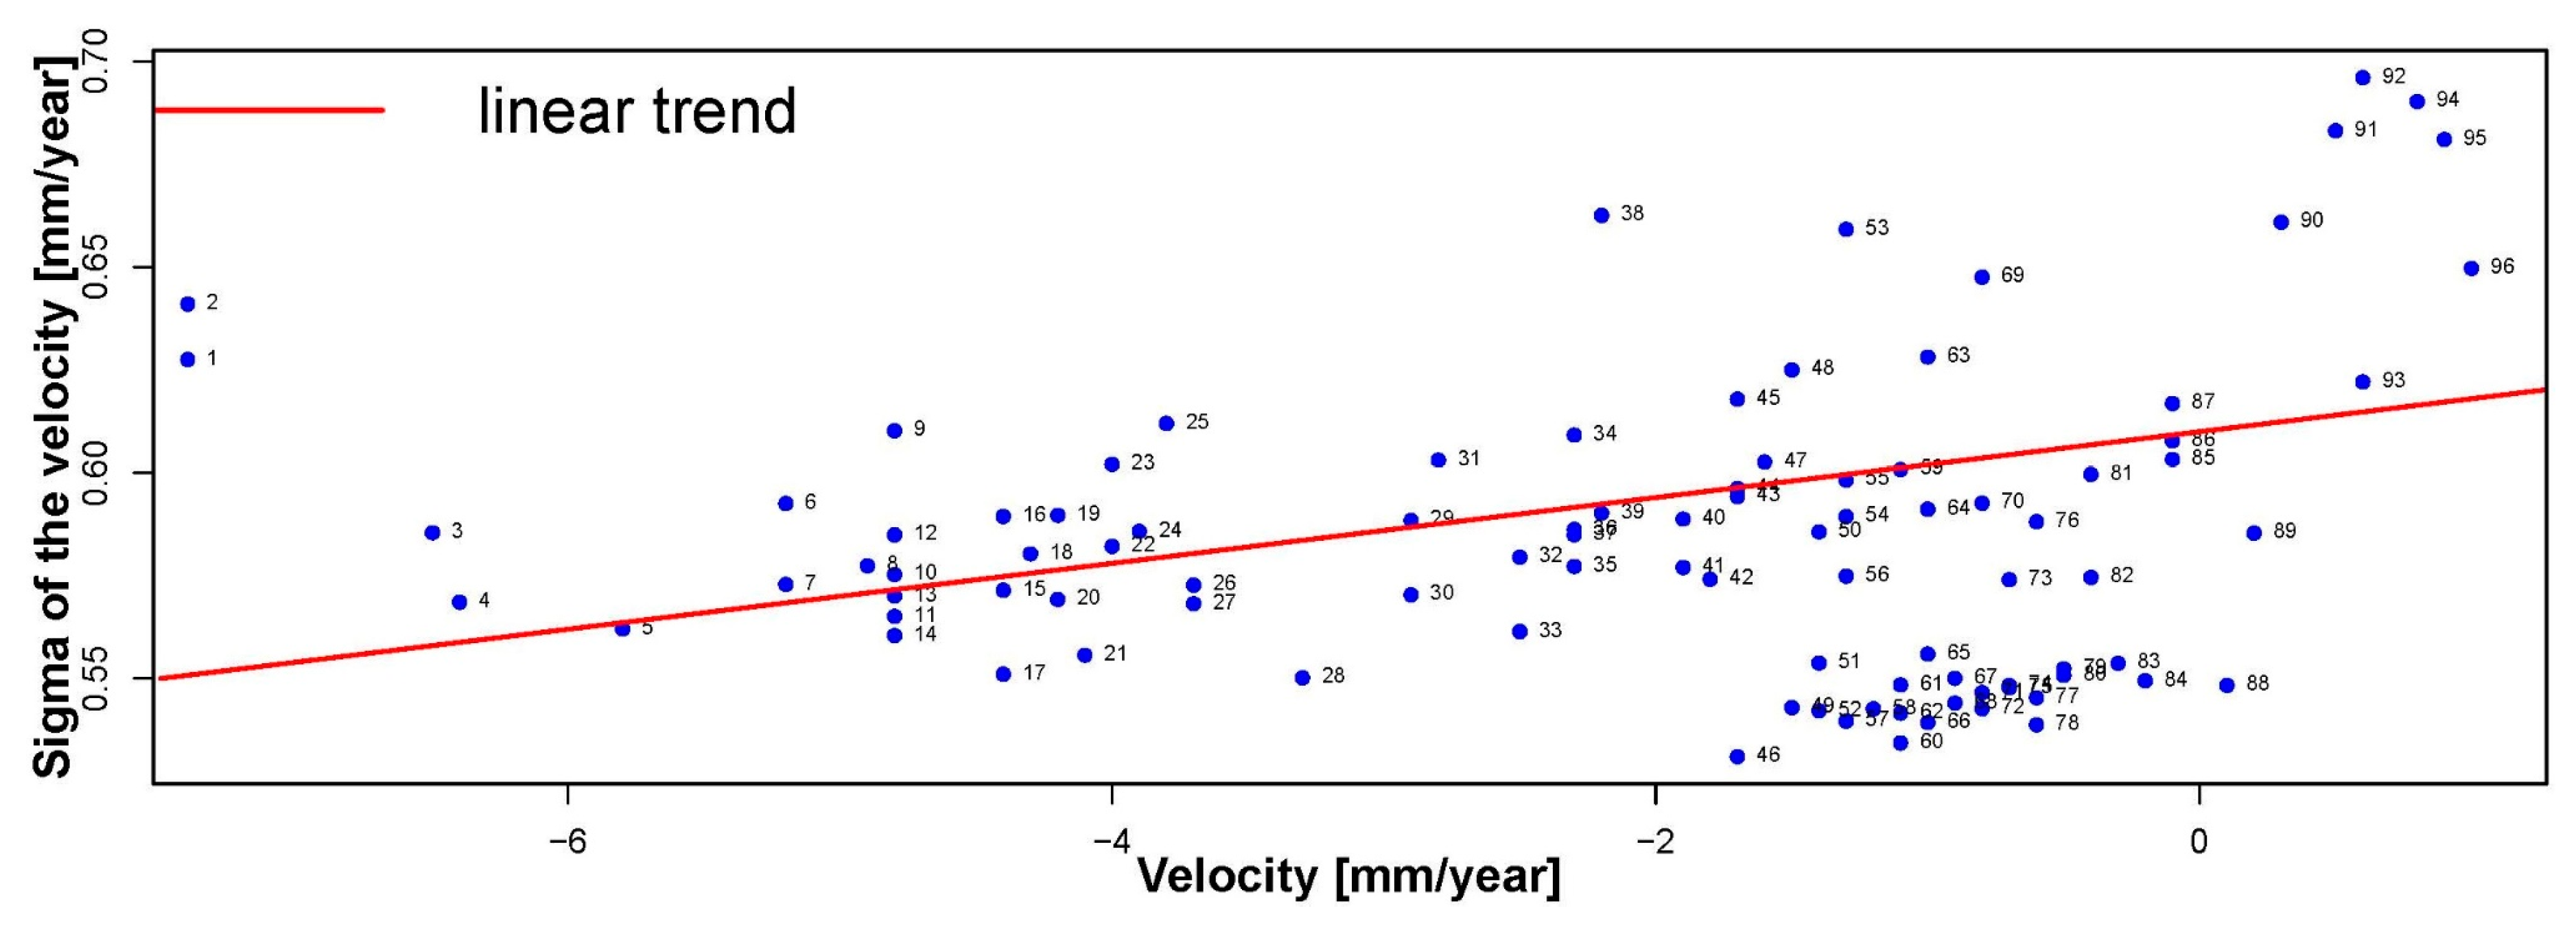
4.1. PSI Characterization and Monitoring of the Mosul Dam
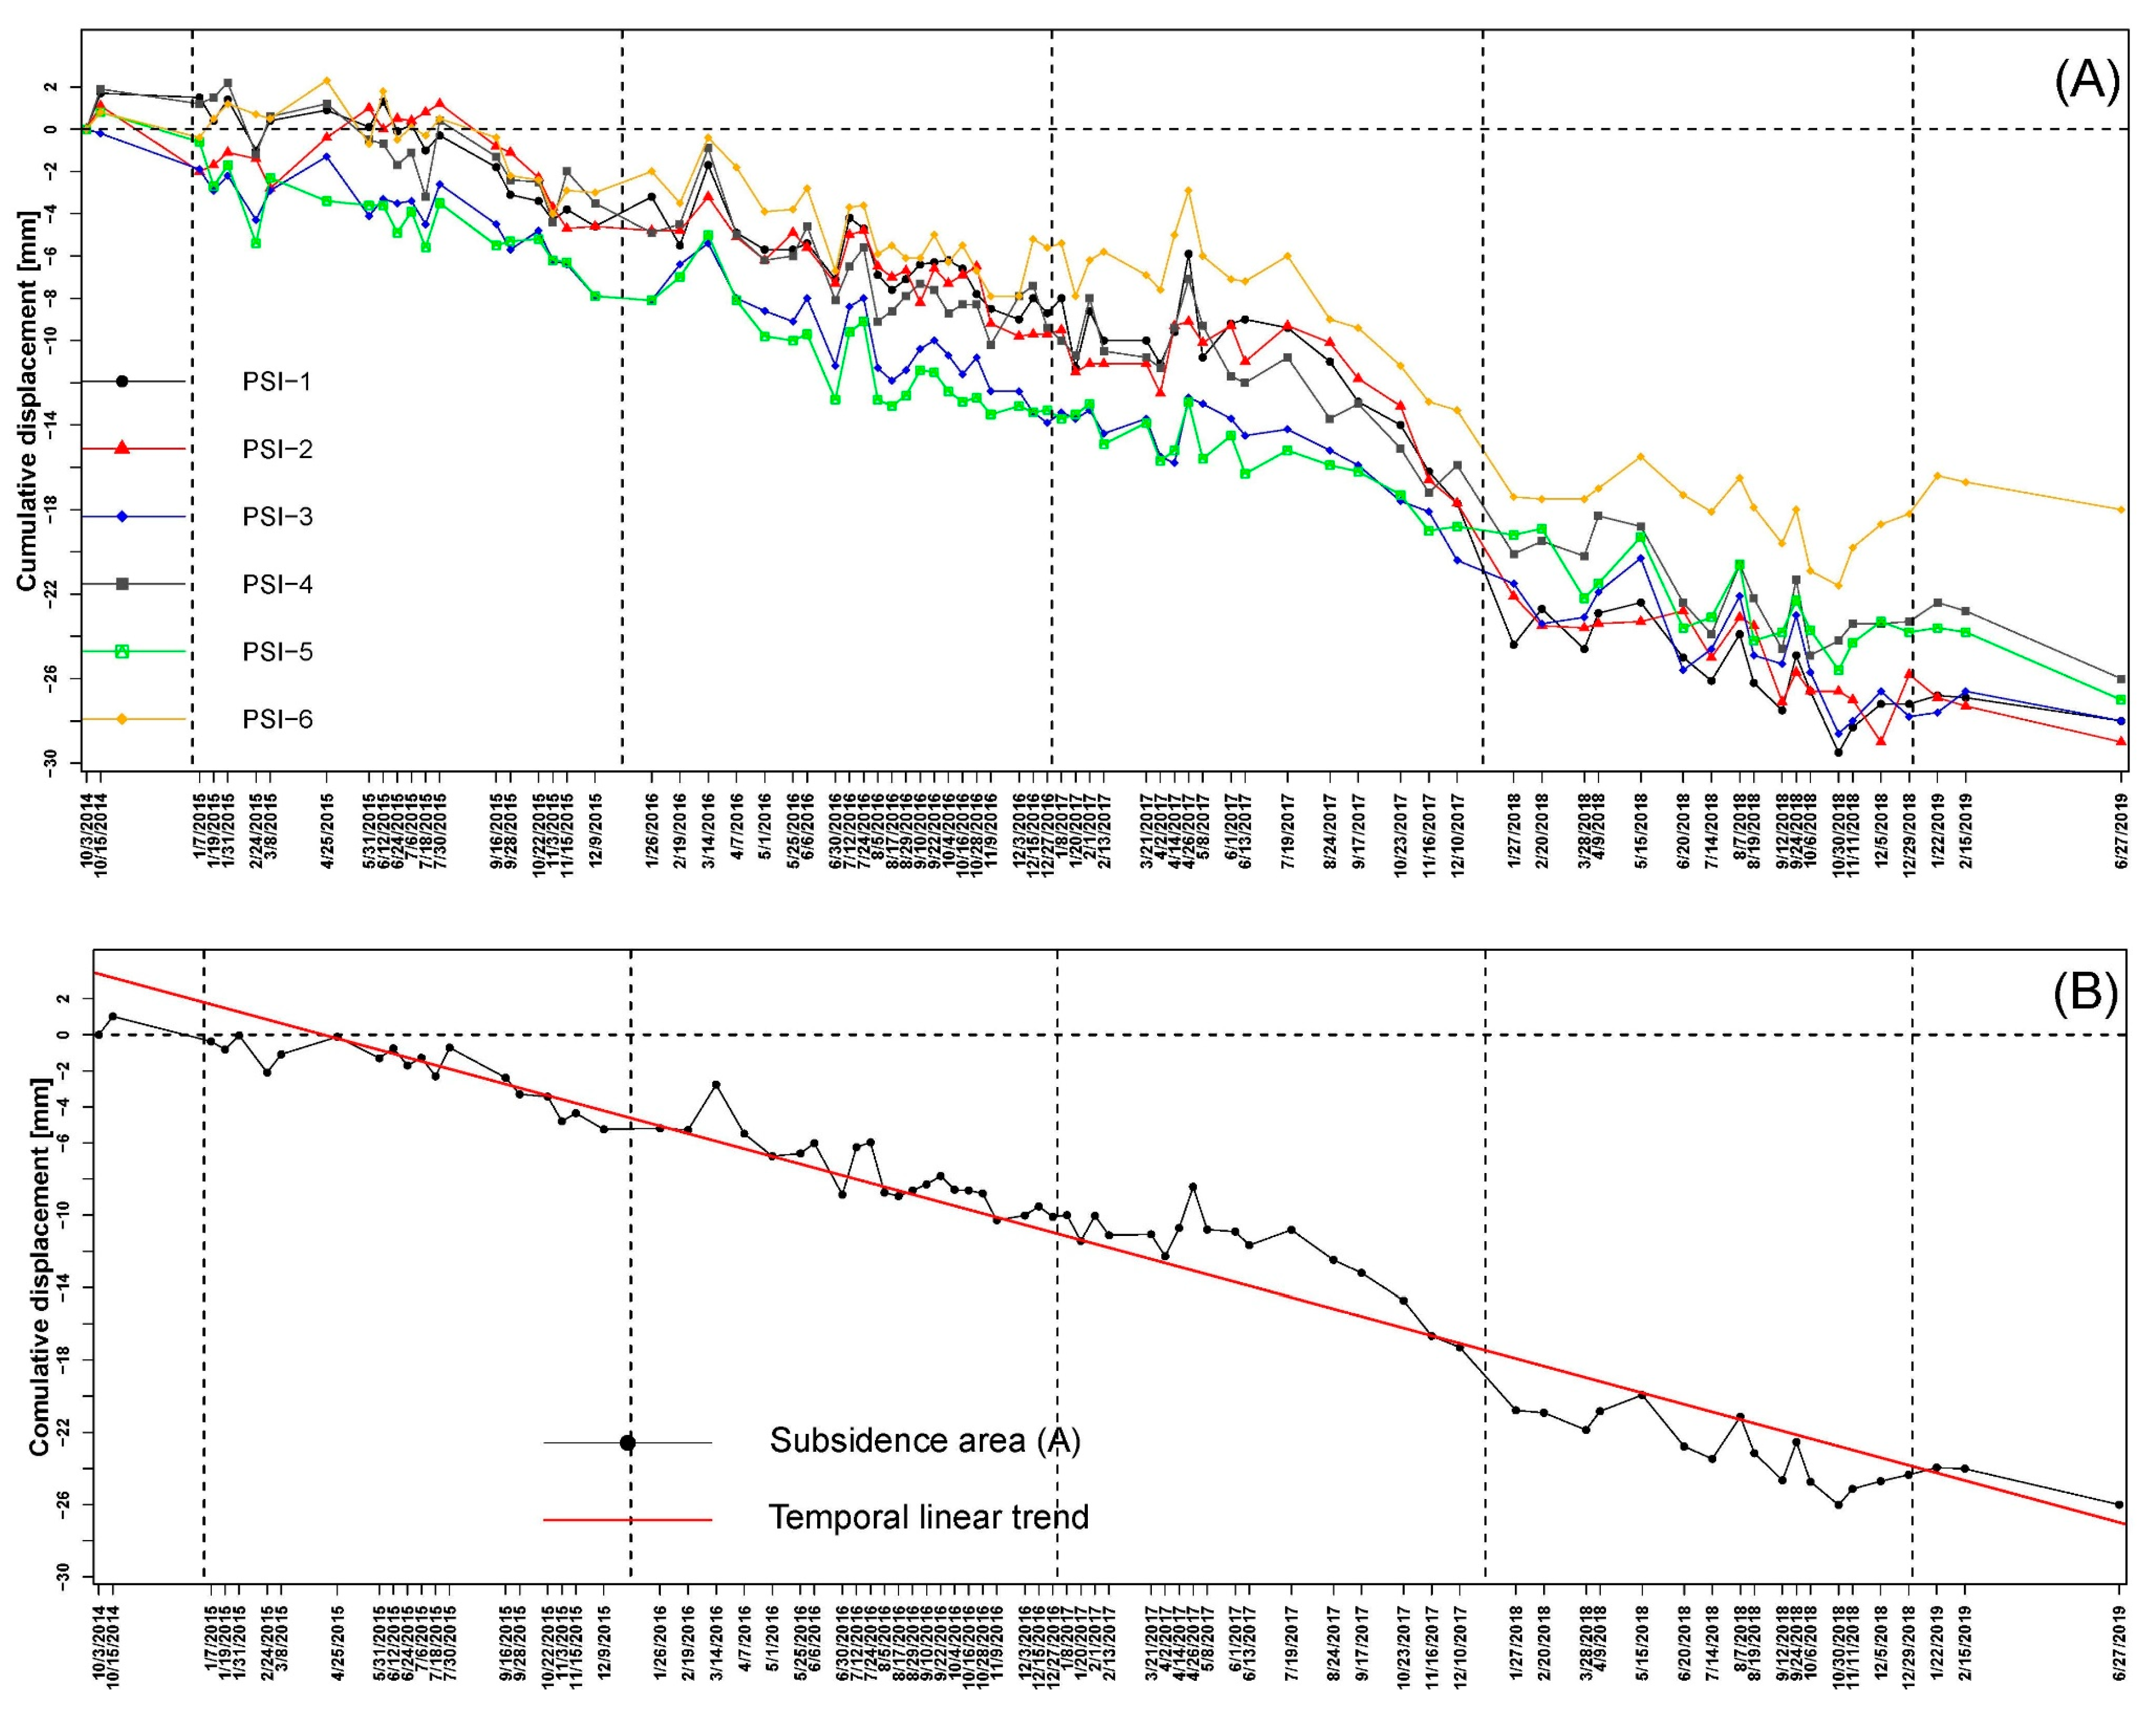
4.2. PSI Time Series Monitoring
5. Discussion
6. Conclusions
Author Contributions
Funding
Acknowledgments
Conflicts of Interest
Appendix A

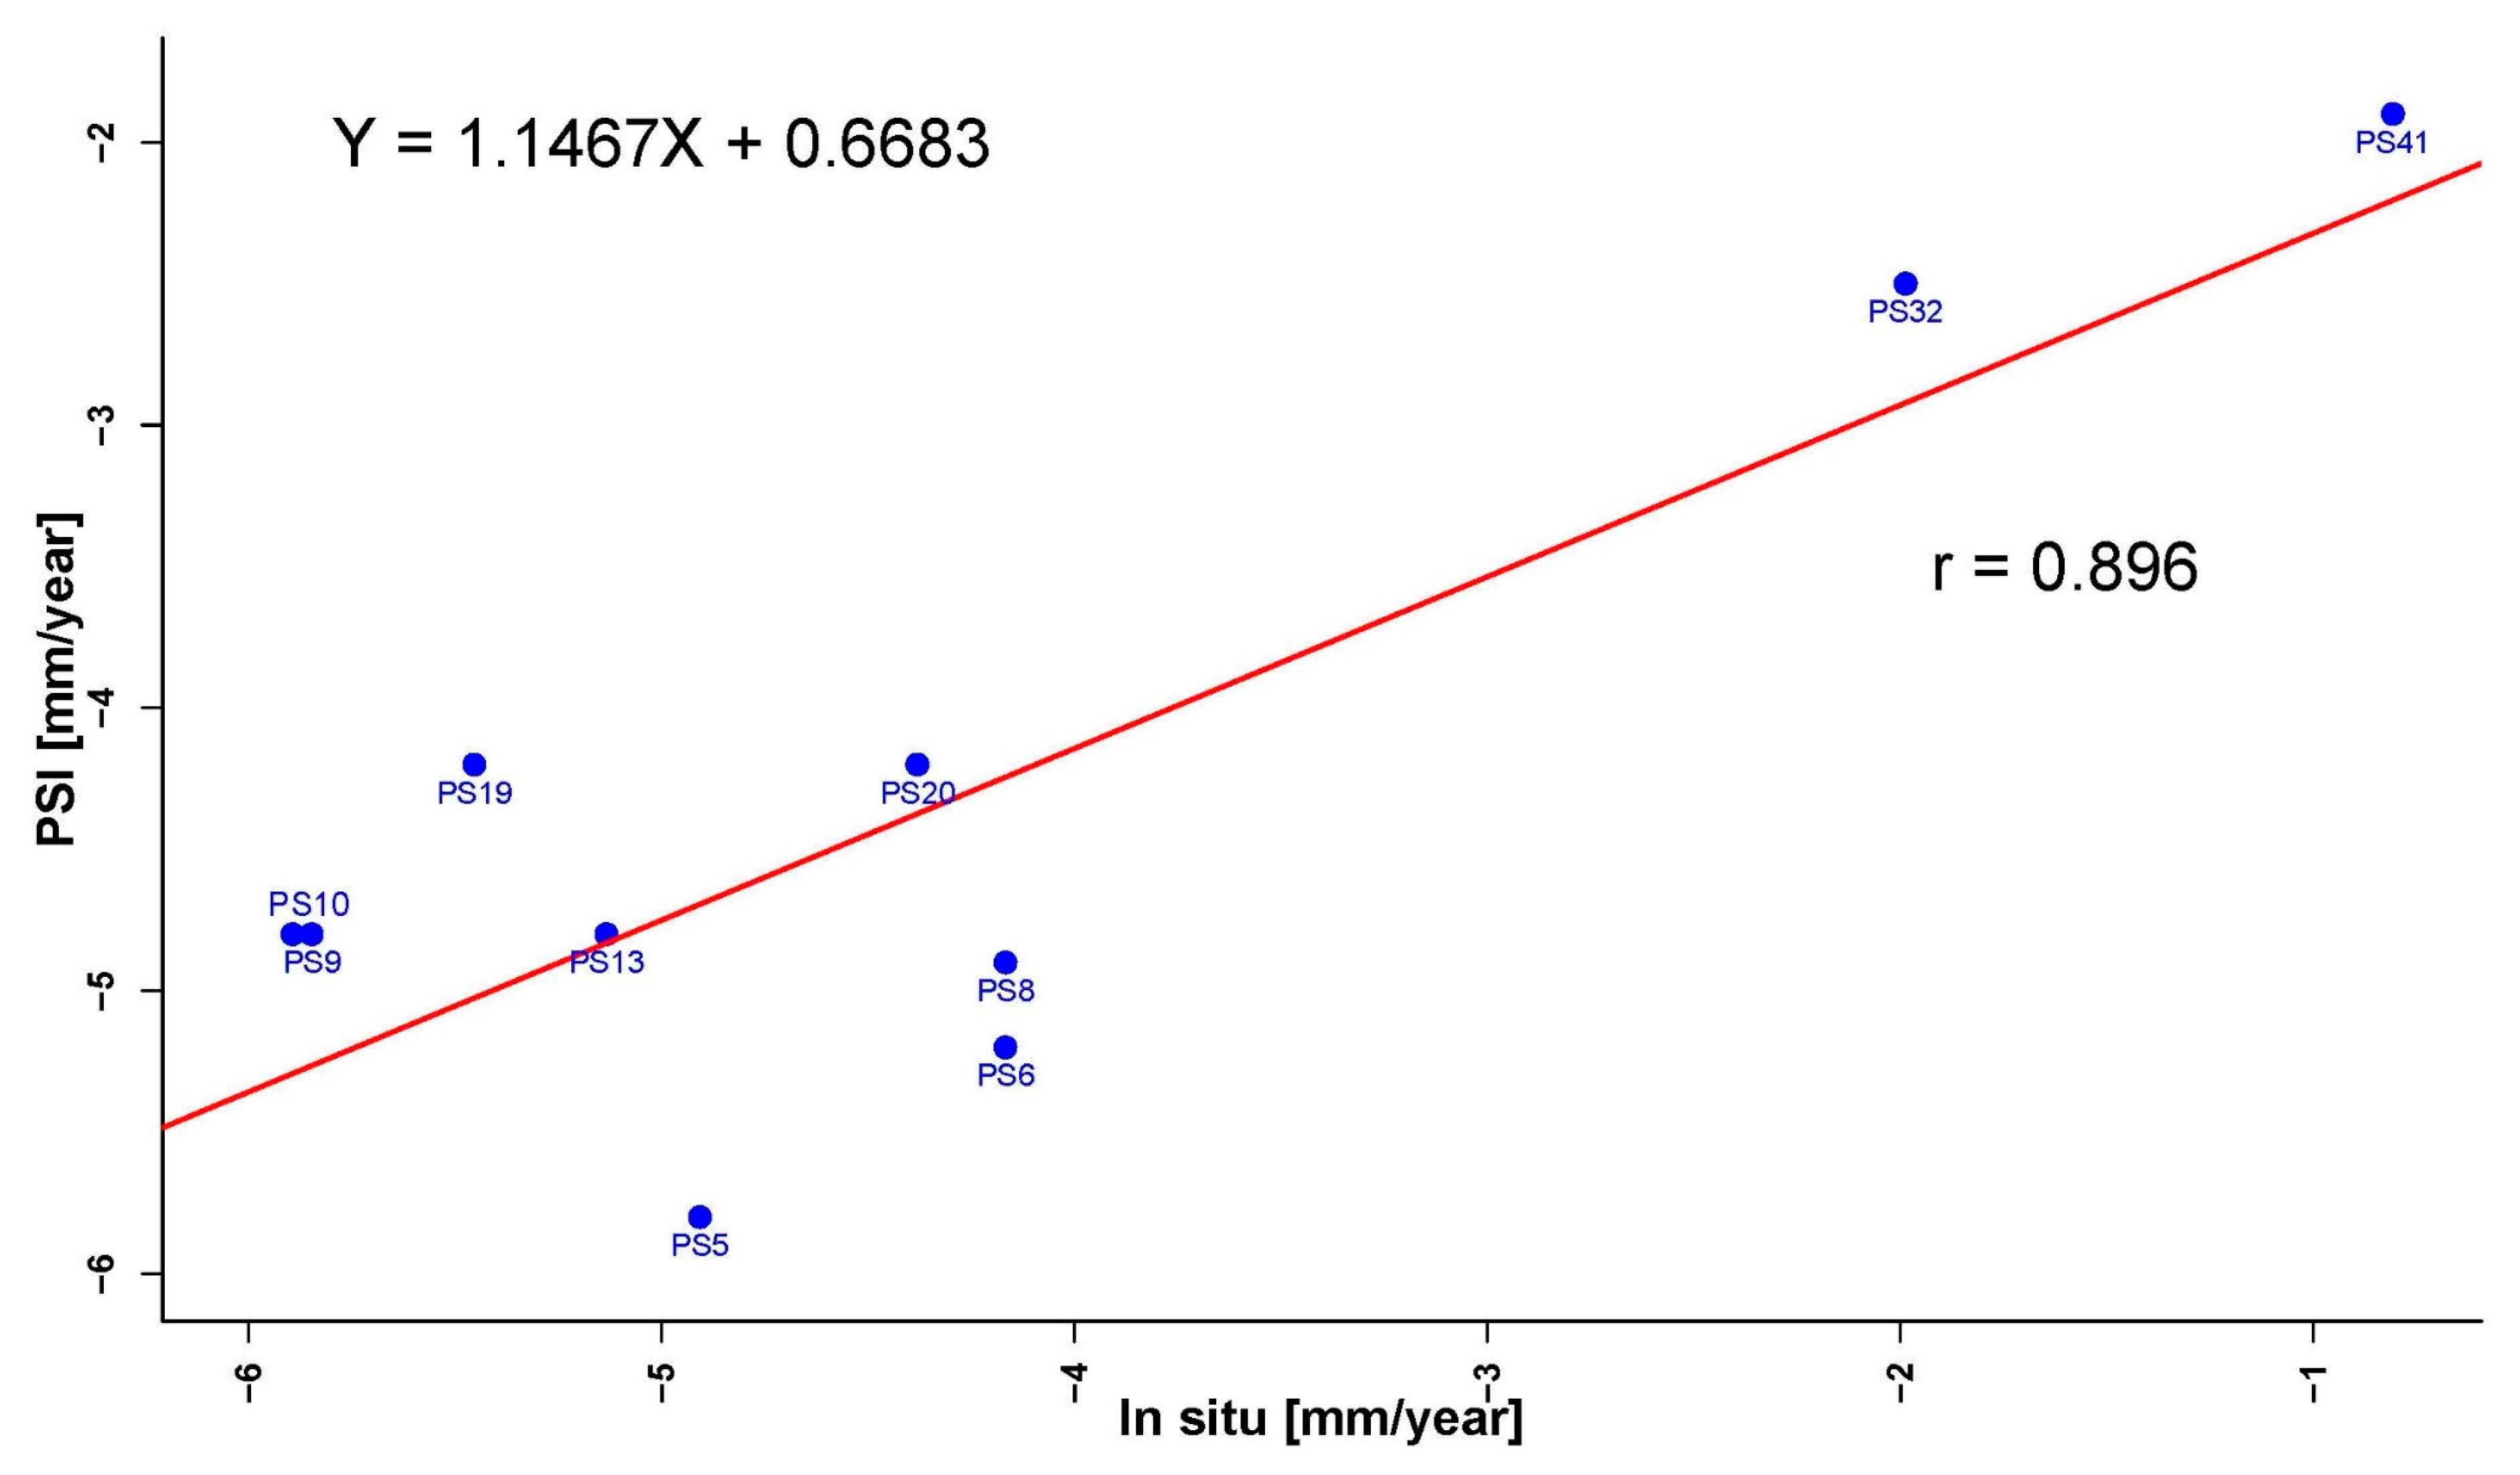
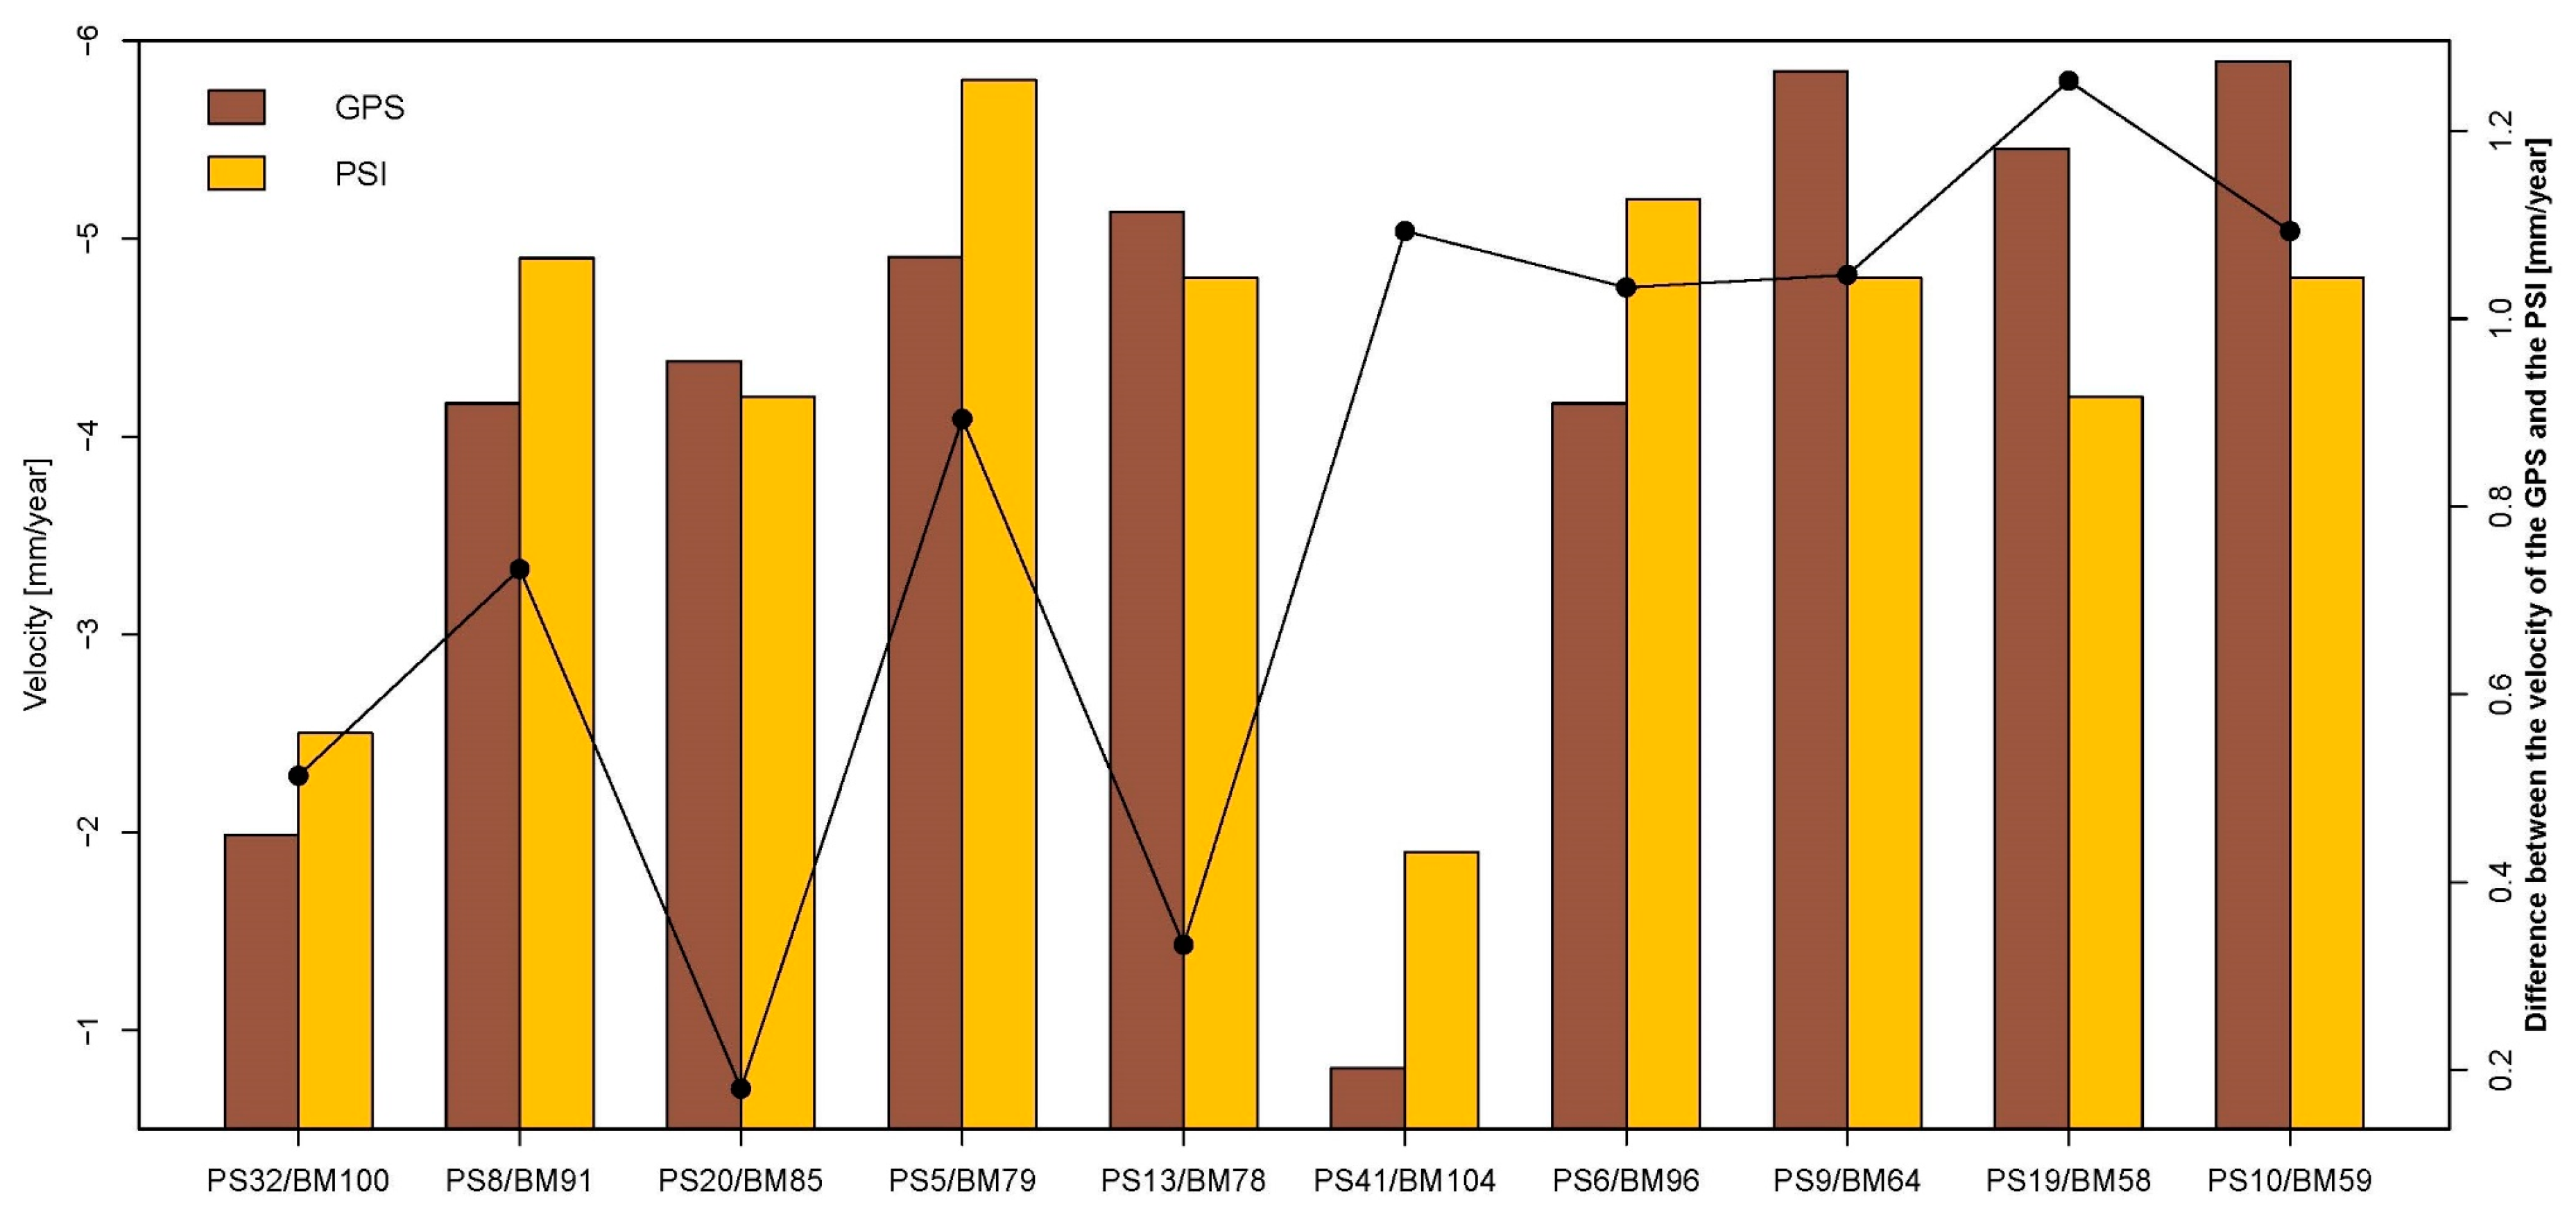
| GNSS | PSI | Velocity (GNSS) | Velocity (PSI) | X-Coordinate (GNSS) | Y-Coordinate (GNSS) | Distance between PSI and GNSS Station (m) |
|---|---|---|---|---|---|---|
| BM100 | PS32 | −1.99 | −2.5 | 304725 | 4056164 | 23.38 |
| BM91 | PS8 | −4.17 | −4.9 | 304924 | 4056076 | 27.24 |
| BM85 | PS20 | −4.38 | −4.2 | 305035 | 4056026 | 54.10 |
| BM79 | PS5 | −4.91 | −5.8 | 305154 | 4055973 | 15.81 |
| BM78 | PS13 | −5.13 | −4.8 | 305181 | 4056063 | 36.11 |
| BM104 | PS41 | −0.81 | −1.9 | 304611 | 4056215 | 46.19 |
| BM96 | PS6 | −4.17 | −5.2 | 304813 | 4056124 | 22.08 |
| BM64 | PS9 | −5.85 | −4.8 | 305422 | 4055962 | 23.41 |
| BM58 | PS19 | −5.45 | −4.2 | 305509 | 4055937 | 25.25 |
| BM59 | PS10 | −4.8 | −5.89 | 305481 | 4055841 | 25.26 |
References
- Scaioni, M.; Marsella, M.; Crosetto, M.; Tornatore, V.; Wang, J. Geodetic and remote-sensing sensors for dam deformation monitoring. Sensors 2018, 18, 3682. [Google Scholar] [CrossRef] [PubMed]
- Fell, R.; MacGregor, P.; Stapledon, D.; Bell, G. Geotechnical Engineering of Dams; Taylor Francis Group: London, UK, 2005; Volume 53. [Google Scholar]
- Gutiérrez, F.; Desir, G.; Gutiérrez, M. Causes of the catastrophic failure of an earth dam built on gypsiferous alluvium and dispersive clays (Altorricón, Huesca Province, NE Spain). Environ. Geol. 2003, 43, 842–851. [Google Scholar] [CrossRef]
- Ferretti, A.; Prati, C.; Rocca, F. Permanent scatterers in SAR interferometry. IEEE Trans. Geosci. Remote Sens. 2001, 39, 8–20. [Google Scholar] [CrossRef]
- Vajedian, S.; Motagh, M.; Nilfouroushan, F. StaMPS improvement for deformation analysis in mountainous regions: Implications for the Damavand volcano and Mosha fault in Alborz. Remote Sens. 2015, 7, 8323–8347. [Google Scholar] [CrossRef]
- Sowter, A.; Bateson, L.; Strange, P.; Ambrose, K.; Fifiksyafiudin, M. Dinsar estimation of land motion using intermittent coherence with application to the south derbyshire and leicestershire coalfields. Remote Sens. Lett. 2013, 4, 979–987. [Google Scholar] [CrossRef]
- Crosetto, M.; Monserrat, O.; Cuevas-González, M.; Devanthéry, N.; Crippa, B. Persistent Scatterer Interferometry: A review. ISPRS J. Photogramm. Remote Sens. 2016, 115, 78–89. [Google Scholar] [CrossRef]
- Mura, J.C.; Gama, F.F.; Paradella, W.R.; Negrão, P.; Carneiro, S.; de Oliveira, C.G.; Brandão, W.S. Monitoring the vulnerability of the dam and dikes in Germano iron mining area after the collapse of the tailings dam of fundão (Mariana-MG, Brazil) using DInSAR techniques with terraSAR-X data. Remote Sens. 2018, 10, 1507. [Google Scholar] [CrossRef]
- Neokosmidis, S.; Elias, P.; Parcharidis, I.; Briole, P. Deformation estimation of an earth dam and its relation with local earthquakes, by exploiting multitemporal synthetic aperture radar interferometry: Mornos dam case (Central Greece). J. Appl. Remote Sens. 2016, 10, 026010. [Google Scholar] [CrossRef]
- Grenerczy, G.; Wegmüller, U. Deformation analysis of a burst red mud reservoir using combined descending and ascending pass ENVISAT ASAR data. Nat. Hazards 2013, 65, 2205–2214. [Google Scholar] [CrossRef]
- Grenerczy, G.; Wegmüller, U. Persistent scatterer interferometry analysis of the embankment failure of a red mud reservoir using ENVISAT ASAR data. Nat. Hazards 2011, 59, 1047–1053. [Google Scholar] [CrossRef]
- Corsetti, M.; Manunta, M.; Marsella, M.; Scifoni, S.; Sonnessa, A.; Ojha, C. Satellite Techniques: New Perspectives for the Monitoring of Dams BT-Engineering Geology for Society and Territory; Lollino, G., Manconi, A., Guzzetti, F., Culshaw, M., Bobrowsky, P., Luino, F., Eds.; Springer: Cham, The Netherlands, 2015; Volume 5, pp. 989–993. [Google Scholar]
- Corsetti, M.; Fossati, F.; Manunta, M.; Marsella, M. Advanced SBAS-DInSAR technique for controlling large civil infrastructures: An application to the Genzano di Lucania dam. Sensors 2018, 18, 2371. [Google Scholar] [CrossRef] [PubMed]
- Milillo, P.; Perissin, D.; Salzer, J.T.; Lundgren, P.; Lacava, G.; Milillo, G.; Serio, C. Monitoring dam structural health from space: Insights from novel InSAR techniques and multi-parametric modeling applied to the Pertusillo dam Basilicata, Italy. Int. J. Appl. Earth Obs. Geoinf. 2016, 52, 221–229. [Google Scholar] [CrossRef]
- Sato, H.; Sasaki, T.; Kondo, M.; Kobori, T.; Onodera, A.; Yoshikawa, K.; Sango, D.; Morita, Y. Basic investigation of displacement monitoring of dams following earthquakes based on SAR satellite data. J. Disaster Res. 2017, 12, 515–525. [Google Scholar] [CrossRef]
- Emadali, L.; Motagh, M.; Haghshenas Haghighi, M. Characterizing post-construction settlement of the Masjed-Soleyman embankment dam, Southwest Iran, using TerraSAR-X SpotLight radar imagery. Eng. Struct. 2017, 143, 261–273. [Google Scholar] [CrossRef]
- Ullo, S.L.; Addabbo, P.; Martire, D.D.; Sica, S.; Fiscante, N.; Cicala, L.; Angelino, C.V. Application of DInSAR Technique to High Coherence Sentinel-1 Images for Dam Monitoring and Result Validation Through in Situ Measurements. IEEE J. Sel. Top. Appl. Earth Obs. Remote Sens. 2019, 12, 875–890. [Google Scholar] [CrossRef]
- Zhu, X.X.; Wang, Y.; Montazeri, S.; Ge, N.A. Review of ten-year advances of multi-baseline SAR interferometry using terraSAR-X data. Remote Sens. 2018, 10, 1374. [Google Scholar] [CrossRef]
- Jia, H.; Liu, L. A technical review on persistent scatterer interferometry. J. Mod. Transp. 2016, 24, 153–158. [Google Scholar] [CrossRef]
- Di Martire, D.; Tessitore, S.; Brancato, D.; Ciminelli, M.G.; Costabile, S.; Costantini, M.; Graziano, G.V.; Minati, F.; Ramondini, M.; Calcaterra, D. Landslide detection integrated system (LaDIS) based on in-situ and satellite SAR interferometry measurements. CATENA 2016, 137, 406–421. [Google Scholar] [CrossRef]
- Milillo, P.; Bürgmann, R.; Lundgren, P.; Salzer, J.; Perissin, D.; Fielding, E.; Biondi, F.; Milillo, G. Space geodetic monitoring of engineered structures: The ongoing destabilization of the Mosul dam, Iraq. Sci. Rep. 2016, 6, 37408. [Google Scholar] [CrossRef]
- Milillo, P.; Porcu, M.C.; Lundgren, P.; Soccodato, F.; Salzer, J.; Fielding, E.; Burgmann, R.; Milillo, G.; Perissin, D.; Biondi, F. The ongoing destabilization of the mosul dam as observed by synthetic aperture radar interferometry. In Proceedings of the 2017 IEEE International Geoscience and Remote Sensing Symposium, Fort Worth, TX, USA, 23–28 July 2017; pp. 6279–6282. [Google Scholar]
- Riccardi, P.; Tessari, G.; Floris, M. Use of Sentinel-1 SAR Data to Monitor Mosul dam Vulnerability Use of Sentinel-1 SAR Data to Monitor Mosul dam Vulnerability; EGU: Vienna, Austria, 2017. [Google Scholar]
- Issa, I.E. Sedimentological and Hydrological Investigation of Mosul Dam Reservoir. Ph.D. Thesis, Luleå University of Technology, Luleå, Sweden, 2015. [Google Scholar]
- Issa, E.; Al-Ansari, N.; Sherwany, G.; Knutsson, S. Sedimentation processes and useful life of Mosul Dam Reservoir, Iraq. Engineering 2013, 5, 779–784. [Google Scholar] [CrossRef]
- Gill, M.A. Sedimentation and useful life of reservoirs. J. Hydrol. 1979, 44, 89–95. [Google Scholar] [CrossRef]
- Garg, V.; Jothiprakash, V. Estimation of useful life of a reservoir using sediment trap efficiency. J. Spat. Hydrol. 2008, 8, 1–14. [Google Scholar]
- IMOS. Climate Data; IMOS: Iraq, Baghdad, 2018. [Google Scholar]
- Fouad, S.F. Tectonic Map of Iraq, scale 1:1000,000, 3rd ed.; Iraq Geological Survey Publications: Baghdad, Iraq, 2012. [Google Scholar]
- Sissakian, V.K. Geological evolution of the Iraqi Mesopotamia Foredeep, inner platform and near surroundings of the Arabian Plate. J. Asian Earth Sci. 2013, 72, 152–163. [Google Scholar] [CrossRef]
- Moghadam, H.S.; Stern, R.J.; Chiaradia, M.; Rahgoshay, M. Geochemistry and tectonic evolution of the Late Cretaceous Gogher–Baft ophiolite, central Iran. Lithos 2013, 168–169, 33–47. [Google Scholar] [CrossRef]
- McQuarrie, N.; Stock, J.M.; Verdel, C.; Wernicke, B.P. Cenozoic evolution of Neotethys and implications for the causes of plate motions. Geophys. Res. Lett. 2003, 30, 2036. [Google Scholar] [CrossRef]
- Alavi, M. Tectonics of the zagros orogenic belt of iran: New data and interpretations. Tectonophysics 1994, 229, 211–238. [Google Scholar] [CrossRef]
- Alavi, M. Regional stratigraphy of the Zagros fold-thrust belt of Iran and its proforeland evolution. Am. J. Sci. 2004, 304, 1–20. [Google Scholar] [CrossRef]
- Othman, A.A.; Gloaguen, R. Integration of spectral, spatial and morphometric data into lithological mapping: A comparison of different Machine Learning Algorithms in the Kurdistan Region, NE Iraq. J. Asian Earth Sci. 2017, 146, 90–102. [Google Scholar] [CrossRef]
- Othman, A.A.; Gloaguen, R. Automatic extraction and size distribution of landslides in kurdistan region, NE Iraq. Remote Sens. 2013, 5, 2389–2410. [Google Scholar] [CrossRef]
- Othman, A.A.; Gloaguen, R. River Courses Affected by Landslides and Implications for Hazard Assessment: A High Resolution Remote Sensing Case Study in NE Iraq–W Iran. Remote Sens. 2013, 5, 1024–1044. [Google Scholar] [CrossRef]
- Othman, A.A.; Gloaguen, R. Improving lithological mapping by SVM classification of spectral and morphological features: The discovery of a new chromite body in the Mawat ophiolite complex (Kurdistan, NE Iraq). Remote Sens. 2014, 6, 6867–6896. [Google Scholar] [CrossRef]
- Othman, A.A.; Gloaguen, R.; Andreani, L.; Rahnama, M. Improving landslide susceptibility mapping using morphometric features in the Mawat area, Kurdistan Region, NE Iraq: Comparison of different statistical models. Geomorphology 2018, 319, 147–160. [Google Scholar] [CrossRef]
- Al-Kadhimi, J.A.M.; Sissakian, V.K.; Fattah, A.S.; Deikran, D.B. Tectonic Map of Iraq, 2nd ed.; scale 1:1000,000; Iraq Geological Survey: Baghdad, Iraq, 1997. [Google Scholar]
- Tawfiq, J.M.; Domas, J. Geological Mapping of Duhok-Ain Zala Area; Iraq Geological Survey: Baghdad, Iraq, 1977. [Google Scholar]
- USGS Earthquake Data. Available online: https://earthquake.usgs.gov/earthquakes/ (accessed on 30 November 2018).
- Jassim, S.Z.; Jibril, A.S.; Numan, N.M.S. Gypsum karstification in the Middle Miocene Fatha Formation, Mosul area, northern Iraq. Geomorphology 1997, 18, 137–149. [Google Scholar] [CrossRef]
- Hijab, S.R.; Al-Jabbar, M.A. Geophysical Investigation on Mosul Dam area, Stage One: Emergency Microgravity Survey; Iraq Geological Survey Library: Baghdad, Iraq, 2007. [Google Scholar]
- Modacom, J.V. Drawing No.FR 82303. Permeability of Parent Rocks, Mosul, Iraq, 1984.
- ESA Sentinel-1. Available online: https://earth.esa.int/web/guest/missions/esa-operational-eo-missions/sentinel-1 (accessed on 15 October 2019).
- Ruiz-Armenteros, A.M.; Lazecky, M.; Hlaváčová, I.; Bakoň, M.; Manuel Delgado, J.; Sousa, J.J.; Lamas-Fernández, F.; Marchamalo, M.; Caro-Cuenca, M.; Papco, J.; et al. Deformation monitoring of dam infrastructures via spaceborne MT-InSAR. The case of La Viñuela (Málaga, southern Spain). Procedia Comput. Sci. 2018, 138, 346–353. [Google Scholar] [CrossRef]
- Roccheggiani, M.; Piacentini, D.; Tirincanti, E.; Perissin, D.; Menichetti, M. Detection and monitoring of tunneling induced ground movements using Sentinel-1 SAR interferometry. Remote Sens. 2019, 11, 639. [Google Scholar] [CrossRef] [Green Version]
- Rabus, B.; Eineder, M.; Roth, A.; Bamler, R. The shuttle radar topography mission-A new class of digital elevation models acquired by spaceborne radar. ISPRS J. Photogramm. Remote Sens. 2003, 57, 241–262. [Google Scholar] [CrossRef]
- EROS Landsat OLI. Available online: https://earthexplorer.usgs.gov/ (accessed on 15 October 2019).
- Xu, H. Modification of normalised difference water index (NDWI) to enhance open water features in remotely sensed imagery. Int. J. Remote Sens. 2006, 27, 3025–3033. [Google Scholar] [CrossRef]
- Topcon. Introducing the Most Advanced GPS+ Receiver System ever Made, Tokyo, Japan, 2009.
- Perissin, D. SARPROZ, West Lafayette, IN, USA, 2017.
- Perissin, D.; Wang, Z.; Lin, H. Shanghai subway tunnels and highways monitoring through Cosmo-SkyMed Persistent Scatterers. ISPRS J. Photogramm. Remote Sens. 2012, 73, 58–67. [Google Scholar] [CrossRef]
- ESRI. ArcGIS; Redlands, CA, USA, 2011. [Google Scholar]
- R Core Team. R: The Foundation for Statistical Computing, Boston, MA, USA, 2017.
- Crosetto, M.; Monserrat, O.; Cuevas, M.; Crippa, B. Spaceborne differential SAR interferometry: Data analysis tools for deformation measurement. Remote Sens. 2011, 3, 305–318. [Google Scholar] [CrossRef] [Green Version]
- Lazecký, M.; Perissin, D.; Zhiying, W.; Ling, L.; Yuxiao, Q. Observing dam’s movements with spaceborne sar interferometry. In Engineering Geology for Society and Territory-Volume 5: Urban Geology, Sustainable Planning and Landscape Exploitation; Springer: Cham, The Netherlands, 2015; pp. 131–136. [Google Scholar]
- Temporim, F.A.; Gama, F.F.; Mura, J.C.; Paradella, W.R.; Silva, G.G. Application of persistent scatterers interferometry for surface displacements monitoring in N5E open pit iron mine using TerraSAR-X data, in Carajás Province, Amazon region. Braz. J. Geol. 2017, 47, 225–235. [Google Scholar] [CrossRef] [Green Version]
- Hooper, A.; Zebker, H.; Segall, P.; Kampes, B. A new method for measuring deformation on volcanoes and other natural terrains using InSAR persistent scatterers. Geophys. Res. Lett. 2004, 31, 1–5. [Google Scholar] [CrossRef]
- Kampes, B.M. Radar Interferometry Persistent Scatterers Technique; Springer: Dordrecht, The Netherlands, 2006. [Google Scholar]
- Bozzano, F.; Mazzanti, P.; Perissin, D.; Rocca, A.; De Pari, P.; Discenza, E.M. Basin Scale Assessment of Landslides Geomorphological Setting by Advanced InSAR Analysis. Remote Sens. 2017, 9, 267. [Google Scholar] [CrossRef] [Green Version]
- Zebker, H.A.; Villasenor, J. Decorrelation in interferometric radar echoes. IEEE Trans. Geosci. Remote Sens. 1992, 30, 950–959. [Google Scholar] [CrossRef] [Green Version]
- Zhang, Y.; Zhang, J.; Wu, H.; Lu, Z.; Guangtong, S. Monitoring of urban subsidence with SAR interferometric point target analysis: A case study in Suzhou, China. Int. J. Appl. Earth Obs. Geoinf. 2011, 13, 812–818. [Google Scholar] [CrossRef]
- Ferretti, A.; Prati, C.; Rocca, F. Nonlinear subsidence rate estimation using permanent scatterers in differential SAR interferometry. IEEE Trans. Geosci. Remote Sens. 2000, 38, 2202–2212. [Google Scholar] [CrossRef] [Green Version]
- Giardina, G.; Milillo, P.; DeJong, M.J.; Perissin, D.; Milillo, G. Evaluation of InSAR monitoring data for post-tunnelling settlement damage assessment. Struct. Control Heal. Monit. 2019, 26, e2285. [Google Scholar] [CrossRef] [Green Version]
- Jiang, Y.; Liao, M.; Wang, H.; Zhang, L.; Balz, T. Deformation monitoring and analysis of the geological environment of Pudong International Airport with persistent scatterer SAR interferometry. Remote Sens. 2016, 8, 1021. [Google Scholar] [CrossRef] [Green Version]


© 2019 by the authors. Licensee MDPI, Basel, Switzerland. This article is an open access article distributed under the terms and conditions of the Creative Commons Attribution (CC BY) license (http://creativecommons.org/licenses/by/4.0/).
Share and Cite
Othman, A.A.; Al- Maamar, A.F.; Al-Manmi, D.A.M.; Liesenberg, V.; Hasan, S.E.; Al-Saady, Y.I.; Shihab, A.T.; Khwedim, K. Application of DInSAR-PSI Technology for Deformation Monitoring of the Mosul Dam, Iraq. Remote Sens. 2019, 11, 2632. https://0-doi-org.brum.beds.ac.uk/10.3390/rs11222632
Othman AA, Al- Maamar AF, Al-Manmi DAM, Liesenberg V, Hasan SE, Al-Saady YI, Shihab AT, Khwedim K. Application of DInSAR-PSI Technology for Deformation Monitoring of the Mosul Dam, Iraq. Remote Sensing. 2019; 11(22):2632. https://0-doi-org.brum.beds.ac.uk/10.3390/rs11222632
Chicago/Turabian StyleOthman, Arsalan Ahmed, Ahmed F. Al- Maamar, Diary Ali Mohammed Al-Manmi, Veraldo Liesenberg, Syed E. Hasan, Younus I. Al-Saady, Ahmed T. Shihab, and Kareem Khwedim. 2019. "Application of DInSAR-PSI Technology for Deformation Monitoring of the Mosul Dam, Iraq" Remote Sensing 11, no. 22: 2632. https://0-doi-org.brum.beds.ac.uk/10.3390/rs11222632