Leaf Canopy Layers Affect Spectral Reflectance in Silver Birch


Department of Environmental and Biological Sciences, University of Eastern Finland, 111, 80101 Joensuu, Finland
*
Author to whom correspondence should be addressed.
Remote Sens. 2019, 11(24), 2884; https://0-doi-org.brum.beds.ac.uk/10.3390/rs11242884
Submission received: 30 September 2019
/
Revised: 19 November 2019
/
Accepted: 30 November 2019
/
Published: 4 December 2019
(This article belongs to the Section Forest Remote Sensing)
Abstract
:The availability of light within the tree canopy affects various leaf traits and leaf reflectance. We determined the leaf reflectance variation from 400 nm to 2500 nm among three canopy layers and cardinal directions of three genetically identical cloned silver birches growing at the same common garden site. The variation in the canopy layer was evident in the principal component analysis (PCA), and the influential wavelengths responsible for variation were identified using the variable importance in projection (VIP) based on partial least squares discriminant analysis (PLS-DA). Leaf traits, such as chlorophyll, nitrogen, dry weight, and specific leaf area (SLA), also showed significant variation among the canopy layers. We found a shift in the red edge inflection point (REIP) for the canopy layers. The canopy layers contribute to the variability in the reflectance indices. We conclude that the largest variation was among the canopy layers, whereas the differences among individual trees to the leaf reflectance were relatively small. This implies that within-tree variation due to the canopy layer should be taken into account in the estimation of intraspecific variation in the canopy reflectance.
Keywords:
canopy layers; cardinal directions; spectral reflectance; leaf traits; NDVI; PRI; SLA; silver birch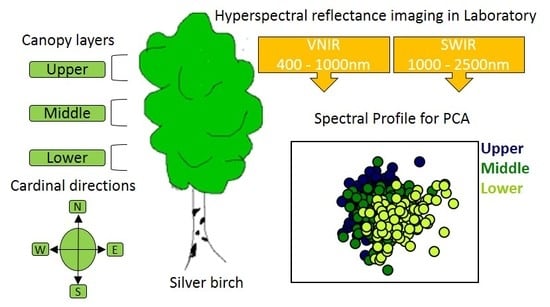
1. Introduction
Forests play an important role in the overall reflectance properties of the Earth’s surface obtained using satellite remote sensing. Forest productivity depends on the light interception and tree acclimation to the high irradiance, as well as the nutrient supply, the temperature, and water availability [1]. Light availability within a forest depends on the tree species composition, the proportion of evergreen to deciduous broad-leaved trees, stand age, and the environmental variables that affect the growth [2]. From the global forest cover, 29% is covered by the boreal forest [3]. Species diversity in the boreal forest is limited to a few tree species and, thus, the reflectance properties of any single species can make a big difference in monitoring changes in the ecosystem. Silver birch (Betula pendula Roth) is an important ecological component in the boreal forest ecosystem. It is economically the most important broadleaved deciduous tree species in northern Europe and it thrives in high light [4].
The variation within a tree canopy in the forest is associated with the availability of light. Different canopy layers of a tree are exposed to different light environments, and trees respond to this change as the light intensity decreases from the upper to the lower canopy [5]. The light availability for individual leaves is affected by self-shading from the branches of the upper canopy layers and from the neighboring trees [6]. Such variation in light availability has an influence on the leaf morphological, biochemical, and physiological traits [4].
Intraspecific variability in functional traits can be substantial even though it has traditionally been assumed to be small in relation to interspecific variability [7]. Intraspecific variability among populations [8] and among individuals within a population [8,9] has been well studied for different leaf traits, whereas the within-individual variability has received much less attention [10].
The sun-exposed upper canopy leaves differ from the shaded lower canopy leaves in their chlorophyll and nitrogen content, water content (WC), and specific leaf area (SLA) [11,12,13]. On an area basis, depending on the species, the upper canopy leaves have a higher chlorophyll content than the lower canopy leaves [14,15], or there is no difference along the canopy gradient [16]. However, on a dry mass basis, the upper canopy leaves have less chlorophyll than the lower canopy leaves since the shade leaves need more chlorophyll to capture the available light [12]. The chlorophyll (Chl) a/b ratio also shows a decreasing gradient from the upper to the lower canopy [14,16,17], where the high Chl a/b ratio of the upper canopy leaves relates to a higher proportion of reaction center pigment proteins and less light-harvesting proteins, the latter being enriched in chlorophyll b, than in lower canopy leaves [14]. Similar to chlorophyll content, there is more nitrogen in the upper canopy [13], and nitrogen content on an area basis shows a decreasing gradient from the upper to the lower canopy in different species [13,18], including silver birch trees [19]. Leaf area also showed a decreasing gradient from the upper to the lower canopy layer in Carpinus betulus L, whereas Platanus x acerifolia Willd had an opposite pattern [20]. Studies on different species have reported lower WC and SLA in sun leaves than in the shade leaves [12,20]. SLA has been reported to correlate negatively with Chl content [17]. SLA showed a positive correlation with nitrogen content on a dry weight basis and on an area basis [17,21,22] or no relationship [22] on the dry weight basis.
Variance in the leaf biochemical properties influences the foliar spectral reflectance. Leaf pigments affect reflectance in the visible range of the electromagnetic spectrum (400–750 nm). The content of leaf pigments (chlorophyll, carotenoids, anthocyanins and a variety of other pigments) is affected by the physiological status of a plant, e.g., by stress conditions. The strong absorption by pigments generally diminishes the reflectance intensity for wavelengths at the visible range [23,24,25]. The reflectance between 750 and 1400 nm is affected by the leaf intercellular structure variations, as reviewed in Ollinger [25]. Near-infrared reflectance (NIR) is influenced by the ratio of mesophyll cell surface exposed to intercellular air spaces per unit leaf area so that leaves with a high ratio have a predictably high reflectance in NIR [24,25]. Non-pigment leaf components, such as water, nitrogen, protein, lignin, and cellulose, influence leaf spectral reflectance mainly in short wave infrared (SWIR) range (1400–2500 nm) [24,25]. Strong water absorbance features are located at 1450 and 1950 nm, weaker features at 980 and 1150 nm, and a constant decrease increasingly in the longer wavelengths of SWIR (1400–2500 nm) where the water effects can mask other weaker features [25]. Leaf traits and leaf reflectance were shown to co-vary across the canopy layers in Gara et al. (2018) [15].
Foliar spectral reflectance differs among the tree species [26,27], within a species among provenances or genotypes [27,28,29], between the adaxial and abaxial side of a leaf [26,30], among the seasons [26,28], and in response to the environmental stress, such as drought [31]. The foliar reflectance in the visible and infrared range has been shown to differ among the canopy layers [15,17,26,32]. Thus, leaf spectral reflectance can be valuable for monitoring the canopy level variation [15]. However, the importance of the canopy layer as a modifier of the reflectance spectrum has differed among studies [33], and deciduous trees have been less studied than conifers.
Reflectance indices can be used in the assessment of plant physiological status. Due to the dominant role of chlorophyll in photosynthesis, major research interest has focused on chlorophyll estimation and thus produced a wide range of indices for chlorophyll [34]. There can be structural differences between the sun and the shaded leaves that may lead to different performances of the same chlorophyll index for different canopy layers [34]. The photochemical reflectance index (PRI) provides a potential means for estimating photosynthetic light use efficiency across different species by remote sensing [35,36].
Current developments in remote sensing obtain supporting information from proximal sensing (portable spectrometers and cameras mounted on mobile platforms, towers, or drones), and proximal sensing provides validation for the large-scale air/space borne remote sensing. Spectral imaging is commonly utilized in proximal and remote sensing to estimate the contents of biochemical constituents [37,38], and those estimates are further used to assess the gross primary production of vegetation [39] and plant stress [40]. Usually, it is assumed that the canopy reflectance depends on the constituent composition of the upper canopy, and thus, the leaves for comparison by chemical analysis are collected from the upper canopy [37]. However, Gara et al. (2019) [41] recently showed that the inclusion of the leaves from the lower canopy improved the estimation of carbon content and leaf mass area in comparison to only the upper canopy when upscaled to simulated Sentinel-2 satellite data. This implies that the extent of within-species variation has relevance to the choice of comparison material for remote sensing and, therefore, to the accuracy of biochemical content estimation by remote sensing.
Differences in spectral reflectance among cardinal directions are much less studied than among canopy layers. Studies on the SLA within individual Douglas fir and hybrid spruce showed relatively minor influence based on the cardinal directions [42]. The difference in the cardinal orientation of branches for the catalase activity has been reported, where the north-facing branches have higher enzyme activity than the south-facing branches [43]. There was a decrease in catalase activity in response to stress conditions or increased light intensity [43]. A study on the sun-exposed needles of Norway spruce (Picea abies) showed no difference in any of the biochemical and structural parameters studied from the branches of different cardinal directions [44].
This study presents leaf reflectance measured in the range of visible and near-infrared (VNIR, 400–1000 nm) and shortwave infrared (SWIR, 1000–2500 nm) for three different leaf canopy layers from three silver birch trees. In addition, the effect of the cardinal directions within the canopy to spectral reflectance is also described in this paper. We used 30 different hyperspectral indices for chlorophyll in our study to determine the best indices for the characterization of the chlorophyll content in the upper and lower canopy of the tree. The specific tasks were (1) to determine whether the leaf spectral reflectance in the wavelength range of 400 to 2500 nm differs among canopy layers and cardinal directions for three birch trees of the same genotype; (2) to identify the wavelengths influencing the variance among the canopy layers; (3) to evaluate whether spectral indices for chlorophyll content are applicable equally for leaves from the upper and the lower canopy; (4) to analyze whether variation in the spectral reflectance and the leaf traits are similar to each other. We hypothesize that (1) the canopy layer affects the foliar reflectance of silver birch leaves; (2) the influential wavelengths for the separation among the canopy layers are associated with the leaf traits, and (3) the performance of the indices to chlorophyll estimation differs between the upper and the lower canopy.
2. Materials and Methods
2.1. Leaf Sampling
The study was performed on the leaves of silver birch (Betula pendula) trees in a botanical garden in Joensuu, Finland (62°35N, 29°46E). Micropropagated plantlets of 26 genotypes were planted in July 2010. For this study, three six-year-old trees of the genotype V14 originating from Vehmersalmi (62°45N, Central Finland) with similar height (ca. 5 m) were selected. The original planting distance between plantlets was 1.2 m, but every second tree was harvested in 2015. Details of the common garden experimental design and setup are described in Heimonen et al. [45]. Silver birch has both long and short shoot leaves. Short shoot leaves burst simultaneously in the spring while the long shoot leaves develop gradually during the summer. Fully matured short shoot leaves were used for the study as they are of the same age. Leaves were sampled on 15, 17 and 18 July 2016 between 12:00 and 14:00 h Finnish time for the three trees from different canopy layers: the lower, middle, and upper canopy. The leaves in branches from less than 50 cm to the ground and higher than 50 cm to the terminal bud of the main stem of the tree were left out. The leaves were sampled from the middle of the branch, with a minimum distance of about 15 cm to the main stem and the tip. Ten leaves were picked from two branches for each canopy layer in each cardinal direction (e.g., 10 leaves from lower southern part), and 360 leaves from three trees were analyzed. The leaves were completely randomized before imaging.
2.2. Leaf Trait Measurements
Chlorophyll and nitrogen indices were measured in the field with a chlorophyll meter, Dualex 4 Scientific (Dx4) (FORCE-A, Paris, France), before sample collection. Dualex measures chlorophyll content as the proportion of transmittance at 850 to 710 nm, flavonoid content as a proportion of near-infrared fluorescence excited by red light to near-infrared fluorescence excited by UV-A light and nitrogen as NBI® (Nitrogen Balance Index) which is the ratio chlorophyll to flavonoids [46]. The measured leaves were detached, stored in a portable cooler, and moved to the laboratory. All reflectance measurements in the laboratory were performed within three hours of the leaf collection. The fresh weight (FW, g) was measured before the reflectance measurements. After the reflectance measurements, leaves were oven-dried overnight for 40 °C, and the dry weight (DW, g) was measured the next day. Subsequently, the water content (WC [%]) was calculated as follows, WC = [(FW – DW)/FW] × 100). The leaf area was calculated from the images (0.4 mm resolution) acquired during reflectance measurements in the visible near-infrared range. Specific leaf area (SLA) was calculated by dividing leaf dry mass by leaf area (cm2).
2.3. Reflectance Spectral Measurements
The spectral images were acquired using a pushbroom hyperspectral imaging system designed by Specim (Spectral Imaging Ltd., Oulu, Finland). The system includes a visible and near-infrared (VNIR, 400–1000 nm) camera combined with an imaging spectrograph (ImSpector V10E) and a short wavelength infrared (SWIR, 1000–2500 nm) camera with ImSpector N25E spectrograph. Eight tungsten halogen lamps of 35 W were used to illuminate the sample uniformly with an angle of 45 degrees with the leaf surface. The two cameras and the halogen lights are encased in a moving frame attached to a conveyor belt. The leaves were placed on a fixed table under the camera system at 48.5 cm and 47 cm from the outmost lens of the VNIR and SWIR system, respectively. The distance from the camera was chosen so that four leaves side by side can be visualized by the camera with a good resolution. The VNIR camera has a spatial resolution of 1032 pixels and 240 spectral channels (FWHM = 3.5 nm) and SWIR has a spatial resolution of 320 pixels and 256 spectral channels (FWHM = 12nm). The resulting image had a spatial resolution of 0.4 mm per pixel for VNIR and 1.2 mm per pixel for SWIR. The image focus was adjusted for both cameras. The exposure time for the image acquisition was set at 8.1 ms and 1.2 ms for the VNIR and SWIR cameras, respectively.
Leaves were arranged with the adaxial side facing the camera in a row of four and a column of six (24 leaves) on a plywood plate (40 × 60 cm). The plywood was painted with Maston 100 series Matt black before the experiment process to reduce reflectance from the wood (spectrum of the plywood in Supplementary Figure S2b). The leaves were imaged in a random order in five batches with a similar arrangement for all batches. The leaves were covered by a glass plate to keep them flat. The high-transmission type of glass (Pilkington Optiwhite) was used and was further measured to check that it transmits light across the range of 400 to 2500 nm (transmittance of the glass in Supplementary Figure S2a). Laboratory-based measurements of the field-grown tree leaves allows the repeated measurements of the leaves in exactly similar manner. Each batch was imaged 3 times in a sequence, then the places of the leaves were switched from right to the left side and vice versa, and the same batch was imaged three times in the other position to avoid position dependence on the results. An average of all six images was used for the average reflectance of each leaf.
2.4. Spectral Preprocessing
A standard sample (SpectralonTM, Labsphere, North Sutton, New Hampshire, USA, (99%)) with a known reflectance spectrum was used to determine the light illumination distribution effect on the data. The white reference (Spectralon) was placed at the same distance from the camera as the leaves were and was measured with the same configuration for the leaves. The dark image was acquired by closing the mechanical shutter of the camera. The images were converted from instrument measurement values to the reflectance value of each leaf with Evince v.2.7 hyperspectral imaging software (Prediktera, Umeå, Sweden). Spikes caused by sensor faults were replaced by the median.
The spectral reflectance of each leaf was determined by using the equation
where R(x, y, λ) is the spectral reflectance image, is the raw spectral image, D(x, y, λ) is the dark image, is the white reference image, and W(λ) is the reflectance spectra of the white-reference sample in the range from 400 nm to 2500 nm. The background was removed and the leaf shape identification were done by thresholding. The reflectance of each leaf was extracted by averaging the pixels of the leaf lamina, omitting the leaf margins.
2.5. Reflectance Indices
Different spectral indices, such as single band, simple ratio, and normalized difference vegetation index (NDVI) from green, red edge, and NIR ranges, were chosen for the estimation of chlorophyll content from the foliar reflectance (Table 1) [34]. The derivative index included in this study was focused on the red edge [34]. A strong relationship between the contents of chlorophyll both at leaf and canopy levels has been established in Schlemmer et al. [47]. The photochemical reflectance index (PRI 531, 570) was chosen for the estimation of photosynthetic light use efficiency (Table 1) [36].
2.6. Analysis and Classification
Statistical analysis was performed in SIMCA-P+ 14.1 (Umetrics, Umeå, Sweden) and in R software version 3.5.0 (R Core Team, 2018, Vienna, Austria). Data preprocessing using the first derivative was performed with 5 points smoothing based on Savitzky–Golay filter. Spectral ranges from 386 to 480 nm, 979–1009 nm, and 2313 to 2538 nm were noisy and thus removed after preprocessing. The reflectance datasets for all the three trees were analyzed together. Mean centering was used for the multivariate analysis to remove any inappropriate spectral variability. Principal component analysis (PCA), an unsupervised method, was used for the dimensionality reduction of the reflectance (average of each leaf) dataset. PCA converts a large number of correlated variables to a set of uncorrelated variables, principal components (PCs) [67]. PCA treats all variables equally, maximizes the variance of the features, and does not take into account the classification label associated with them. A supervised method, partial least squares discriminant analysis (PLS-DA) [68], was performed for the classification of canopy layers, trees, and cardinal directions. The key wavelengths that influence the reflectance of the leaves for the differences among the canopy layers (together for three trees) were identified using the variable importance in projection (VIP) [68] for the wavelength range from 482 to 2307 nm. VIPs larger than one represents variables that were influential in group discrimination. For assessing the reliability of the model, an analysis of variance testing of cross-validated predictive residuals (CV-ANOVA) was performed for PLS-DA. The standard deviation of spectral reflectance for all wavelengths was depicted separately for each canopy layer to evaluate the extent of variation within each group. The first derivative reflectance spectra without smoothing were used for depicting the shift at the red edge inflection point (REIP). Variation in the mean leaf spectral reflectance due to the tree canopy layer and the cardinal direction for each canopy layer was tested using ANOVA with the canopy layer and the cardinal direction as a fixed factor, respectively. Following a significant ANOVA test, Tukey’s HSD (honestly significant difference) post-hoc tests were performed for the pairwise differences of the tree canopy layers. Linear regression was used to determine the relationship between the chlorophyll content and 30 hyperspectral chlorophyll indices. Boxplots for the leaf traits were prepared using the R package ggpubr [69]. Variation in the leaf traits: chlorophyll content, nitrogen content, dry weight, water content, leaf area, specific leaf area (SLA) was tested using pairwise ANOVA with the canopy layer as a fixed factor. Variation in the chlorophyll, nitrogen, water content, and SLA due to the cardinal directions separately for each canopy layers was tested using pairwise ANOVA with the cardinal direction as a fixed factor. Variation in two normalized difference vegetation indices (NDVI) and a photochemical reflectance index (PRI) due to the canopy layers and due to the cardinal directions for each canopy layer was analyzed with ANOVA and pairwise ANOVA, respectively.
3. Results
3.1. Differences in Reflectance Among Canopy Layers
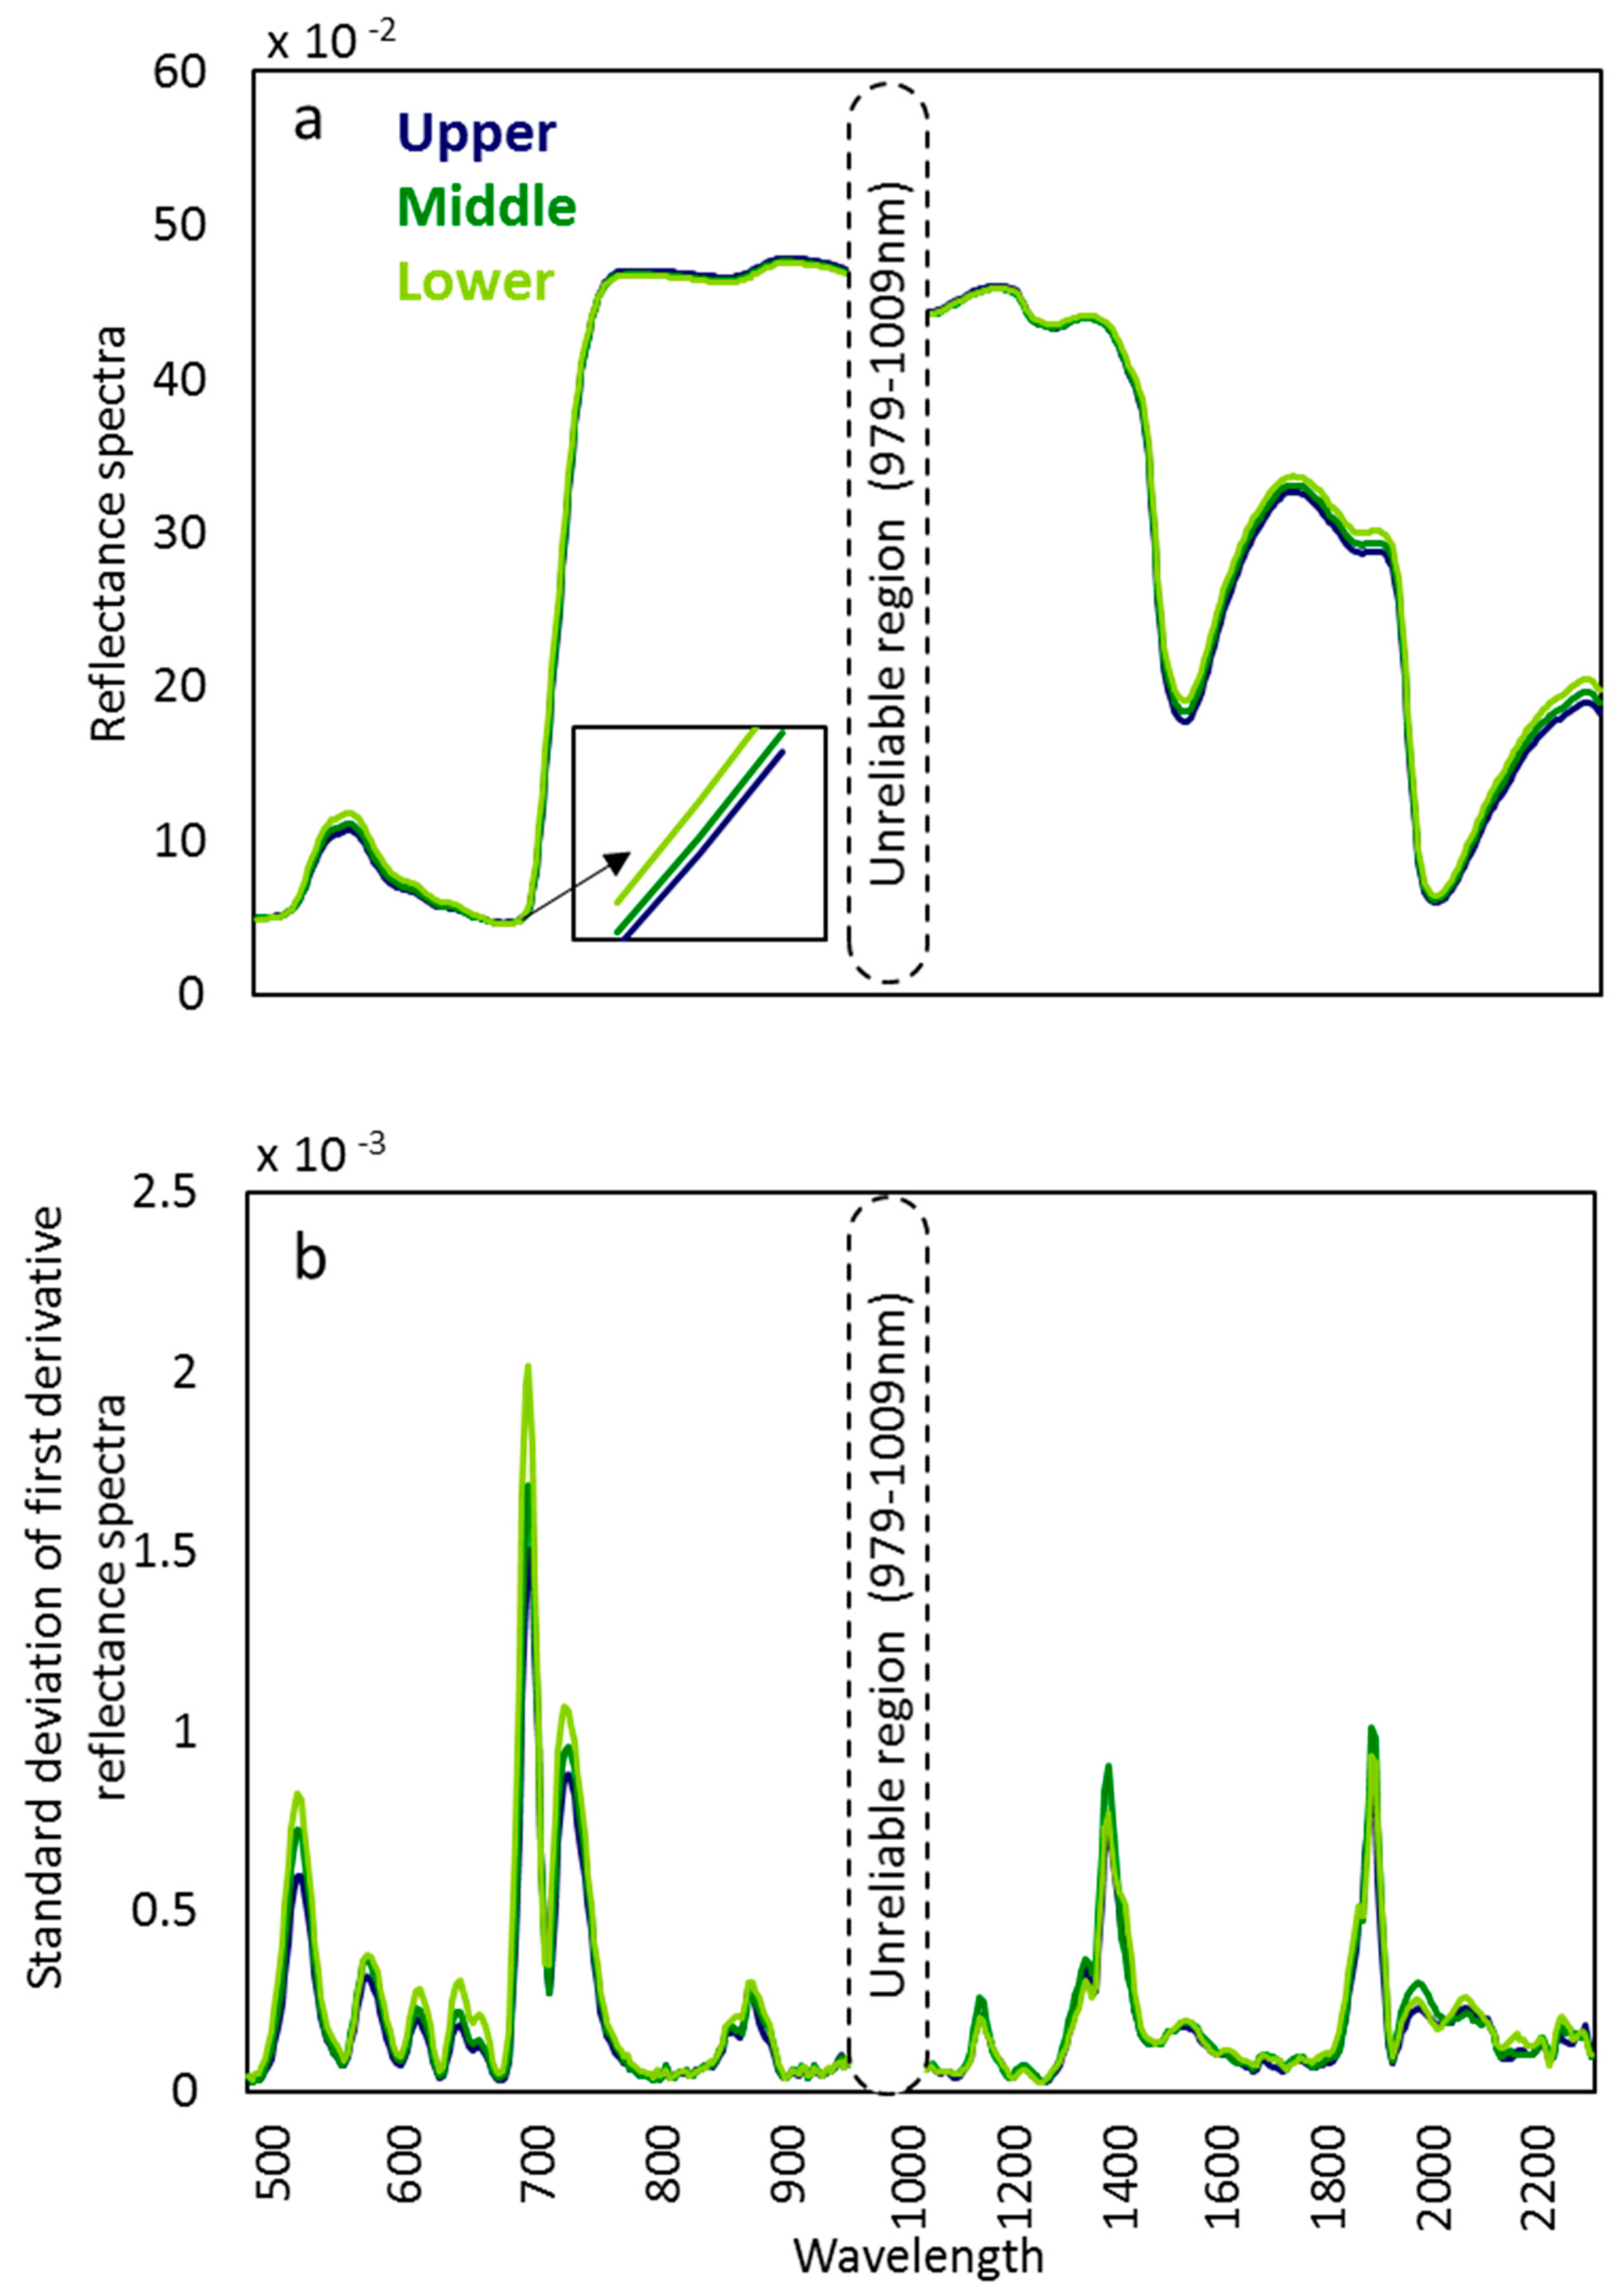
The mean reflectance of the upper canopy leaves was lower than that of lower canopy leaves in the green hump around 550 nm, in the red edge, and in the range from ca. 1400 nm to 2500 nm (Figure 1a).
In the first derivative transformed spectra, variability was the highest in the lower canopy layer, particularly in the VNIR range. The wavelength ranges with the highest variance were 507–532 nm, 691–701 nm, and 717–740 nm (Figure 1b). In the SWIR range, there was no consistent pattern among canopy layers in the extent of variability. The standard deviation curves exhibited two distinct peaks before the dominant water absorbance bands, 1377–1395 nm and 1887–1899 nm.
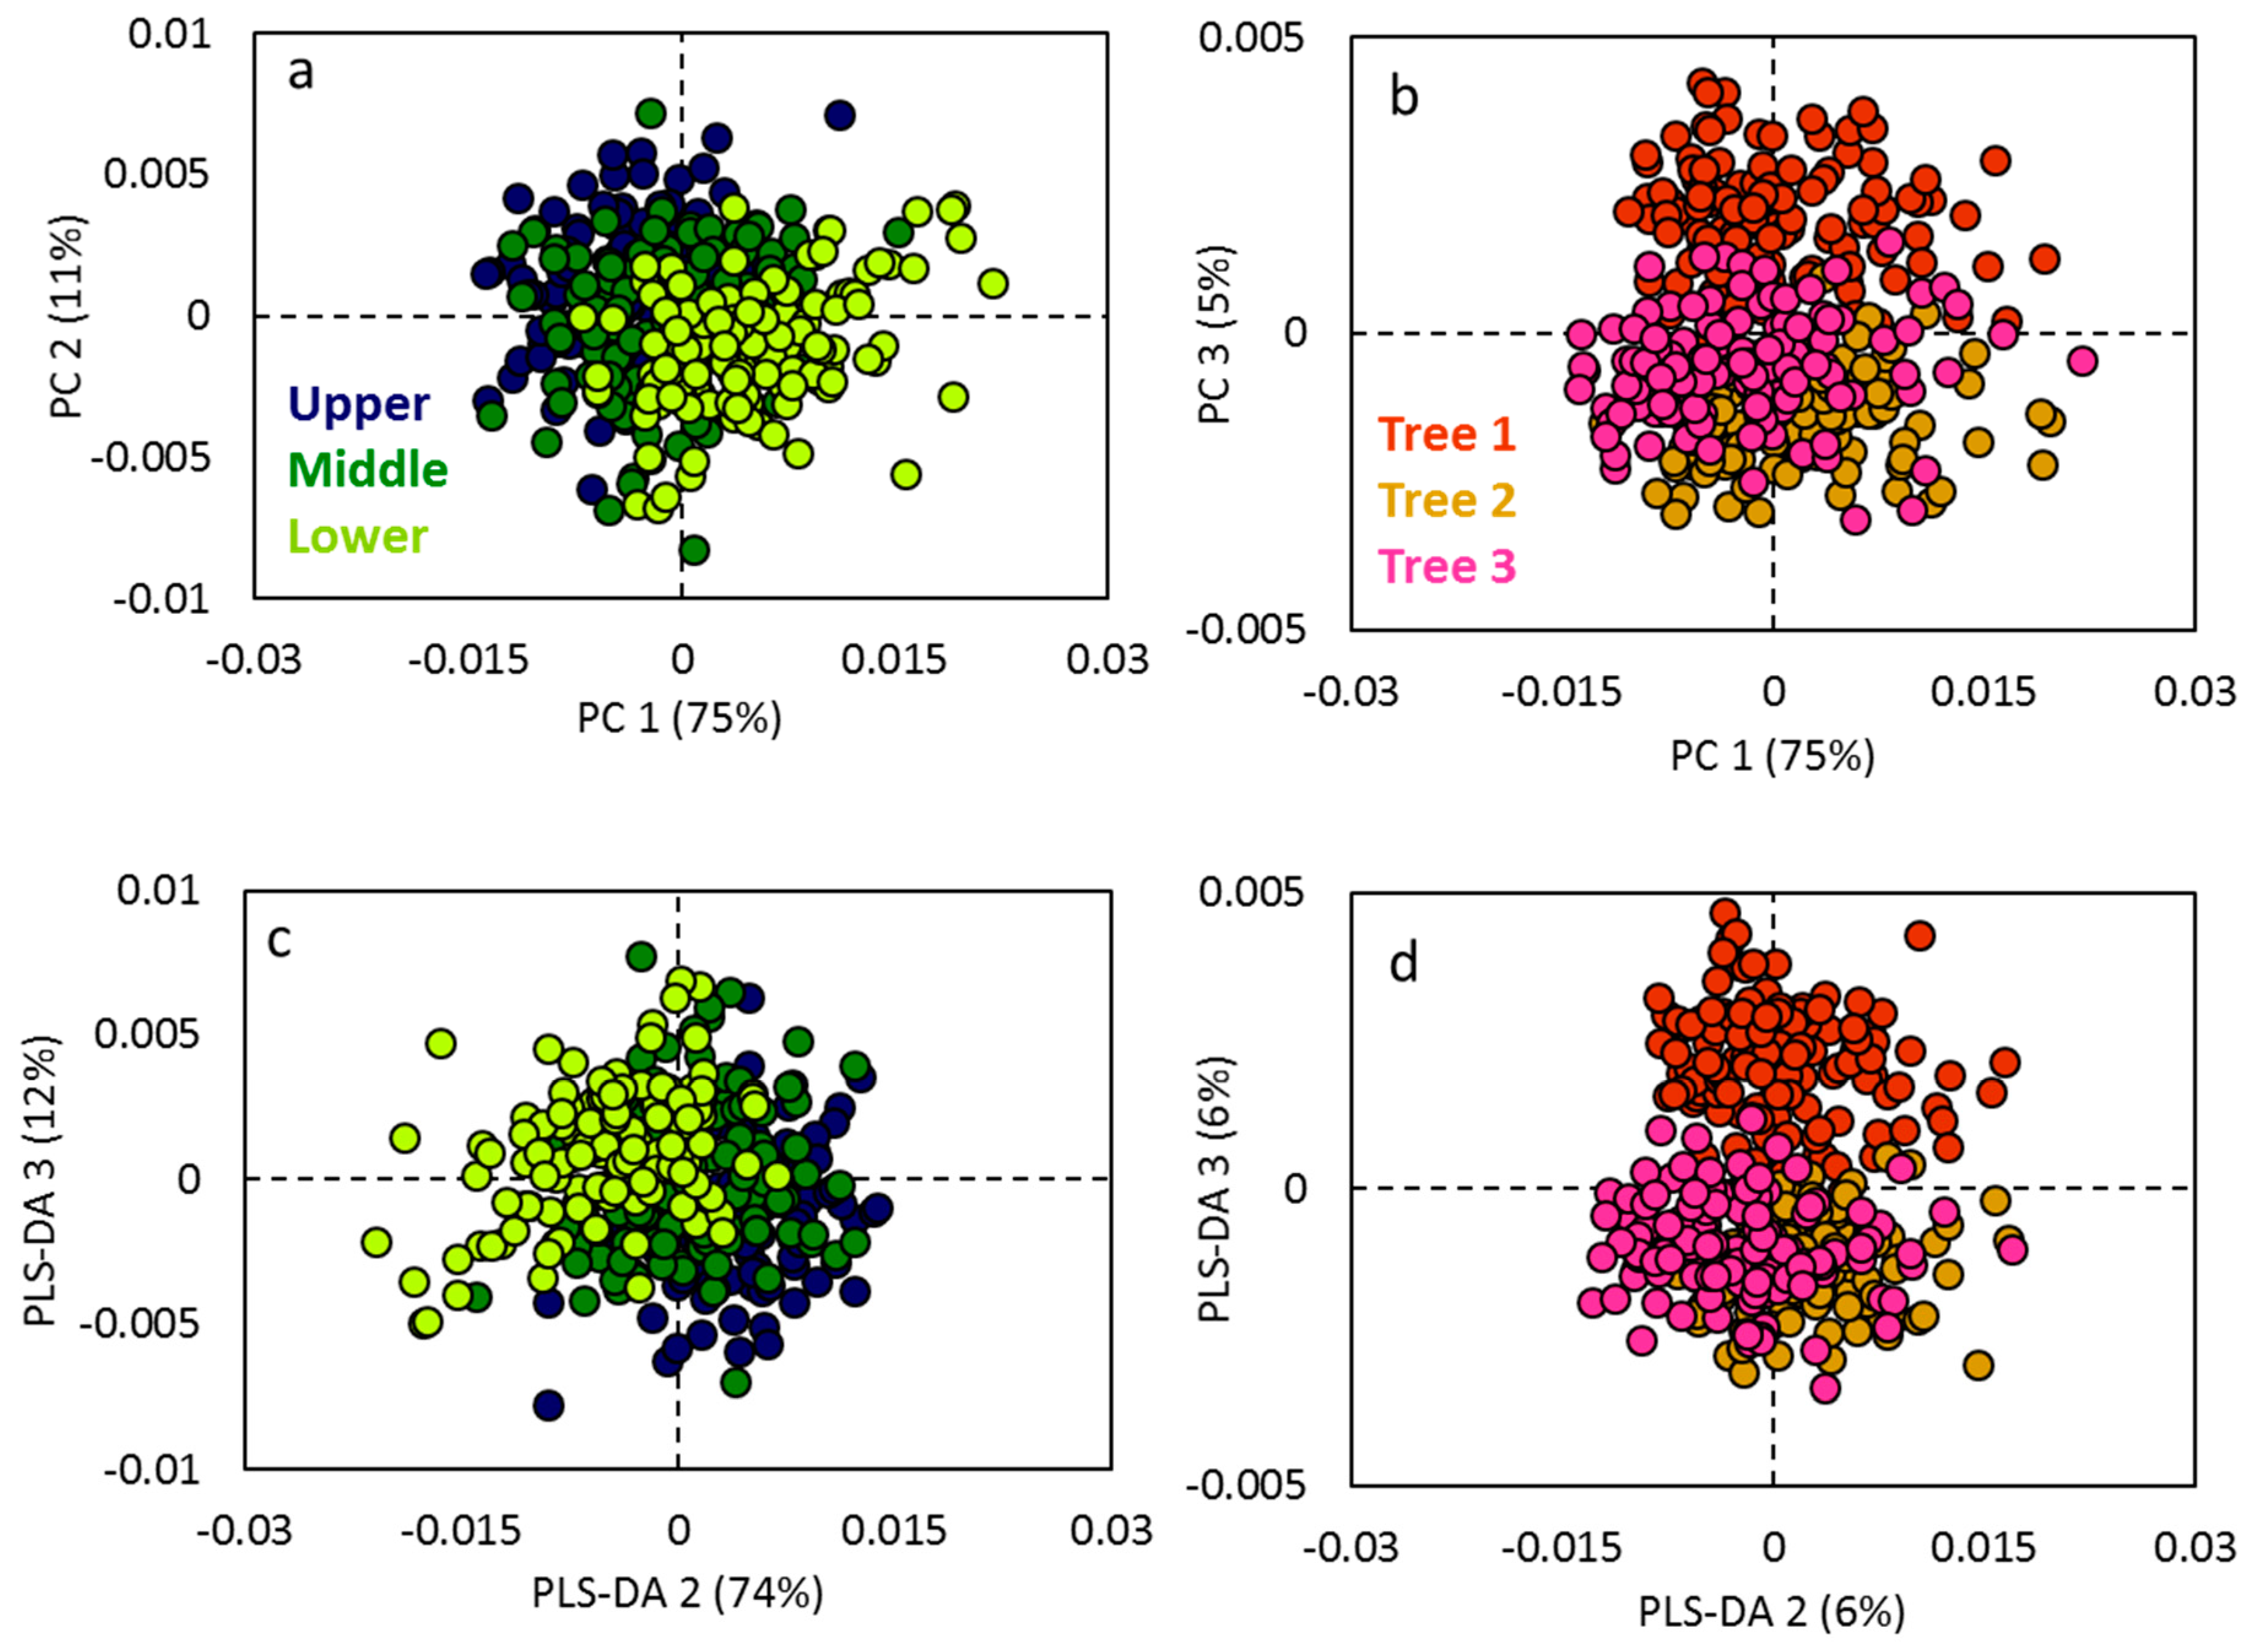
Canopy layers differed from each other in PCA of reflectance data (Figure 2a,b). The upper and the lower canopy layers were clearly separated from each other, with the middle canopy layer being mixed with the upper and lower canopy layers. Canopy layers were separated predominantly by the first PC, accounting for 75% of overall variation, the second PC contributing with 11%. Additionally, a separation among the three trees was noticed in the third PC with a 5% variation. Further, PLS-DA was performed, which confirmed the separation among the canopy layers. However, it did not further improve the grouping among the canopy layers. The PLS-DA among the trees showed that there was separation among the three trees of the same genotype. The cross-validation analysis of variance (CV-ANOVA) reported p-value < 0.0001 for both canopy layers and among the trees.
3.2. Wavelengths Discriminating the Canopy Layers
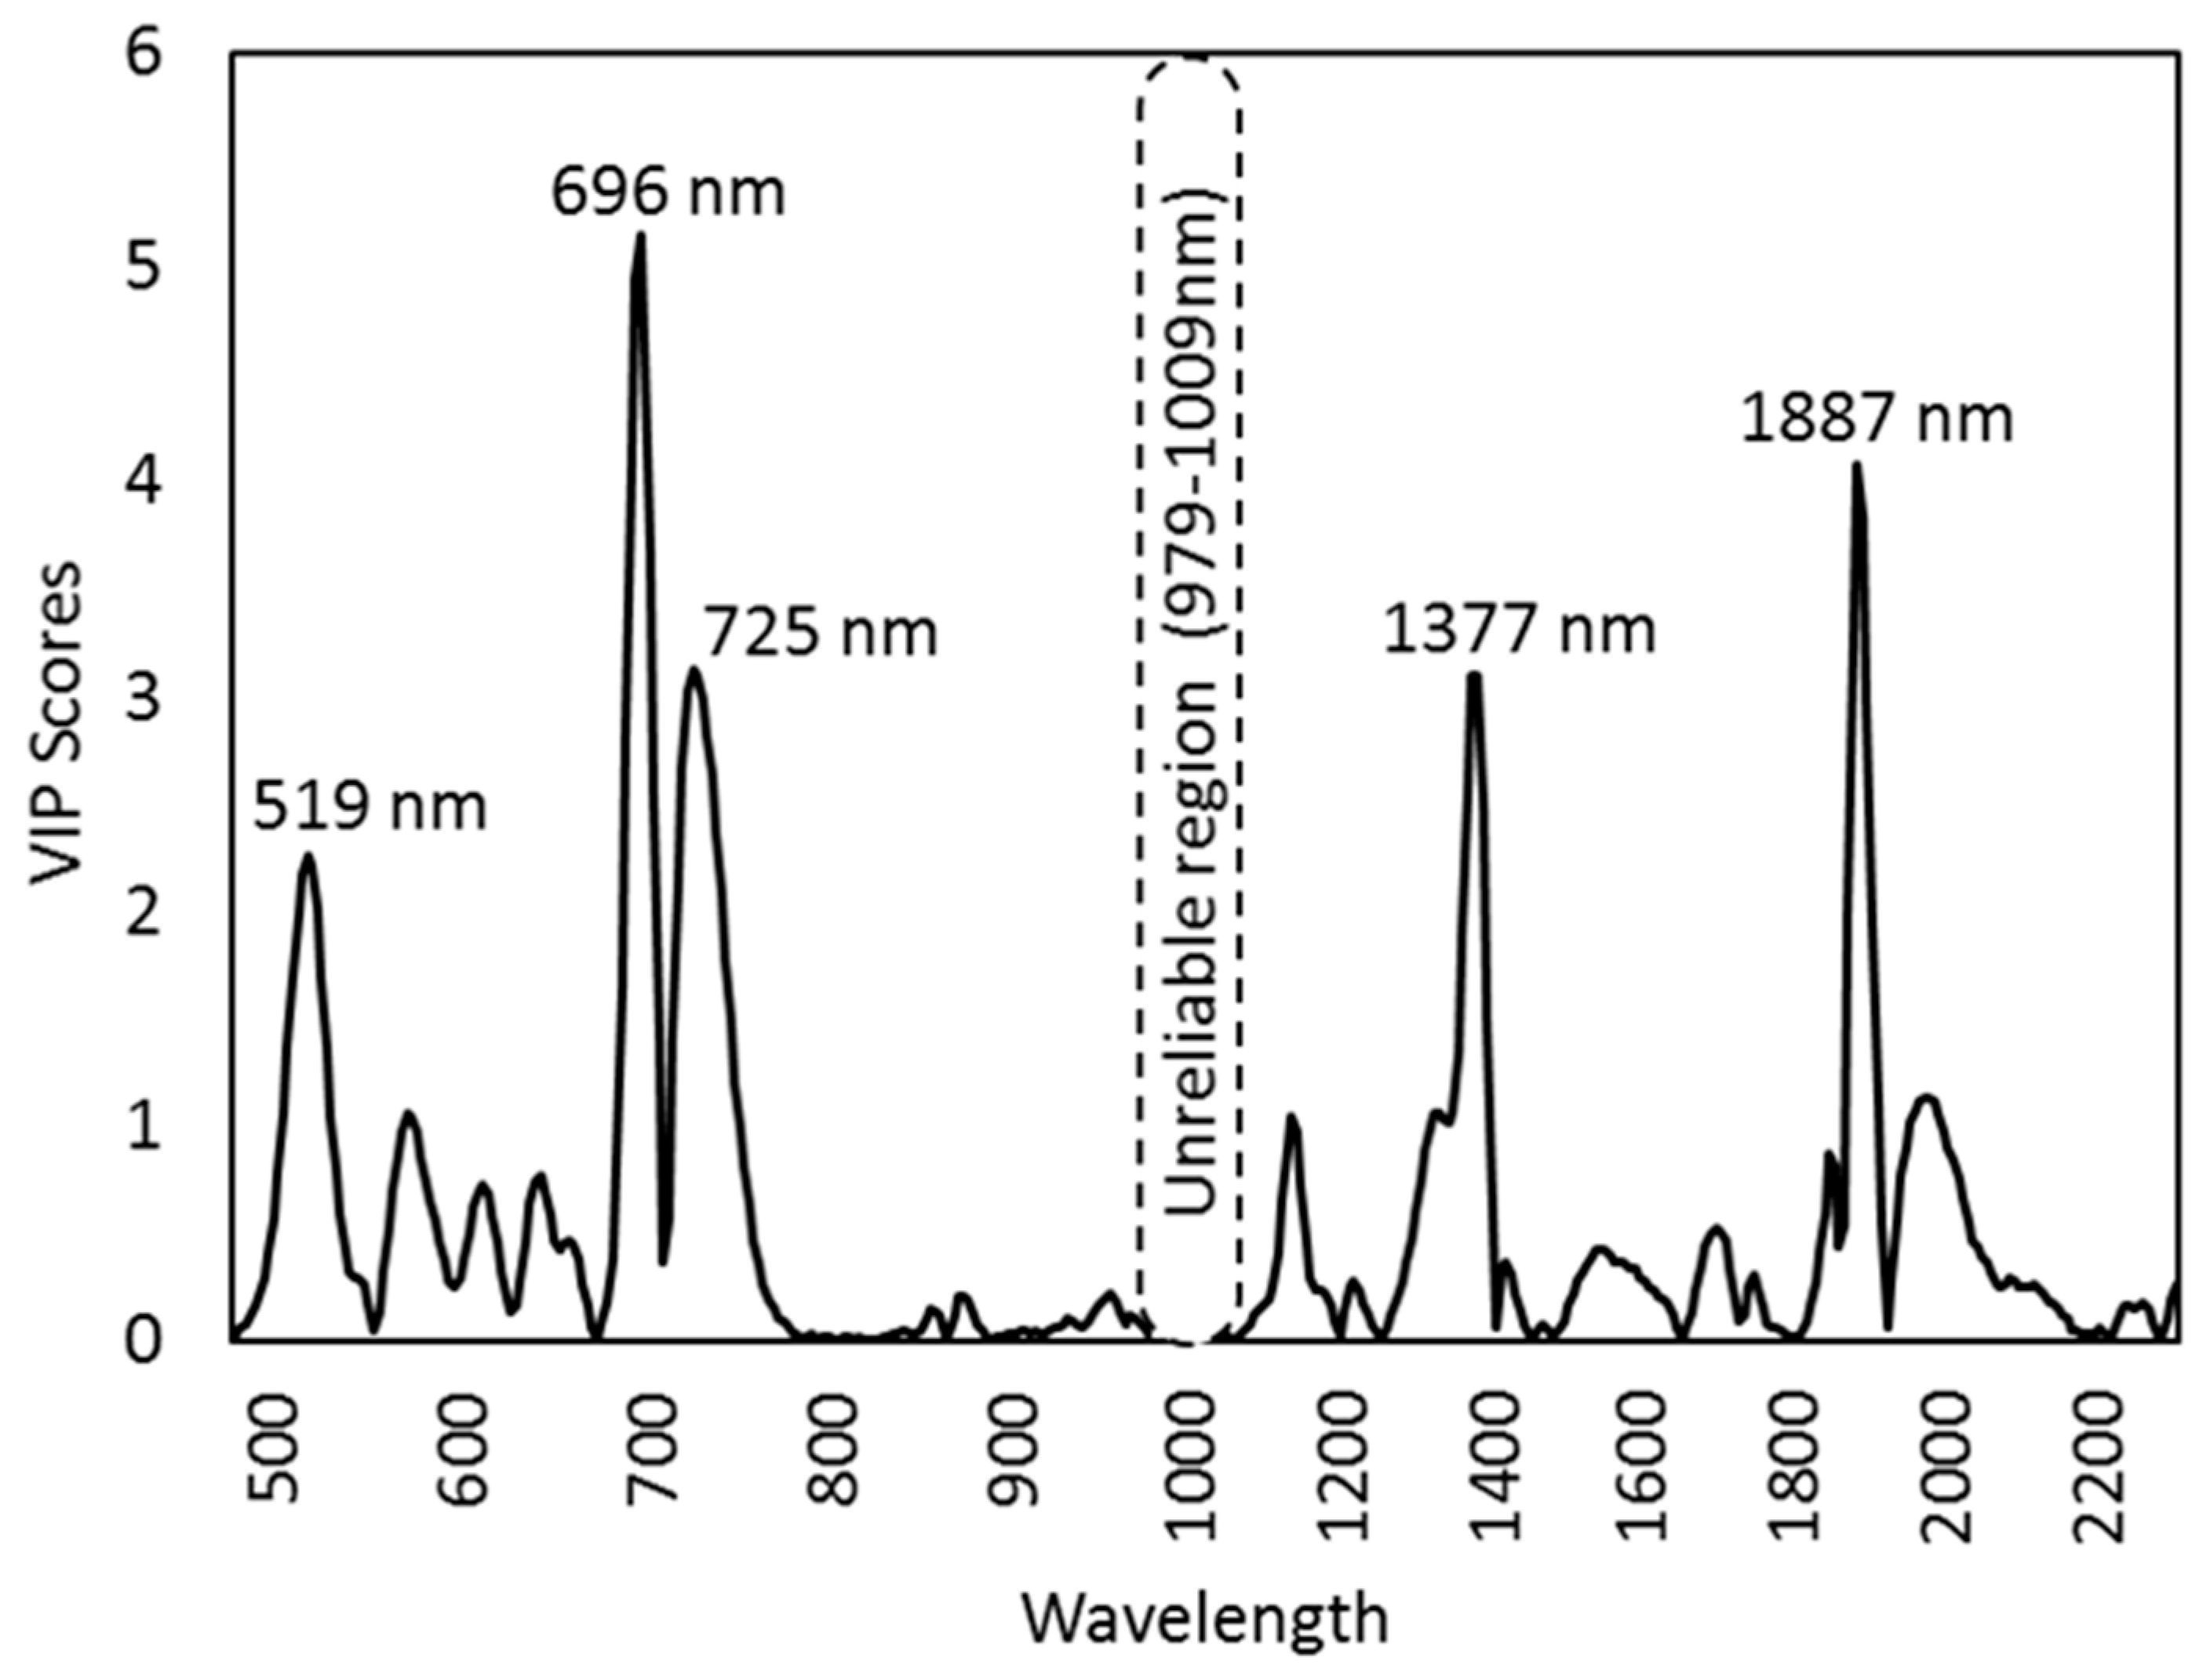
We identified the most influential wavelengths for the discrimination between the upper, middle, and lower canopy leaves according to VIP (variable importance in projection) scores in a PLS-DA model. The wavelengths responsible for the separation (VIP >1) were 507–532 nm, 572–574 nm, 686–701 nm, and 714–748 nm for the VNIR range (Figure 3). For the SWIR range, the key wavelengths were 1136, 1320–1395 nm, and 1874–1912 nm and 1956–1994 nm. The wavelengths with the strongest influence (VIP >2) on the separation were 519 nm, 696 nm, 725 nm, 1377 nm, and 1887 nm (Figure 3).
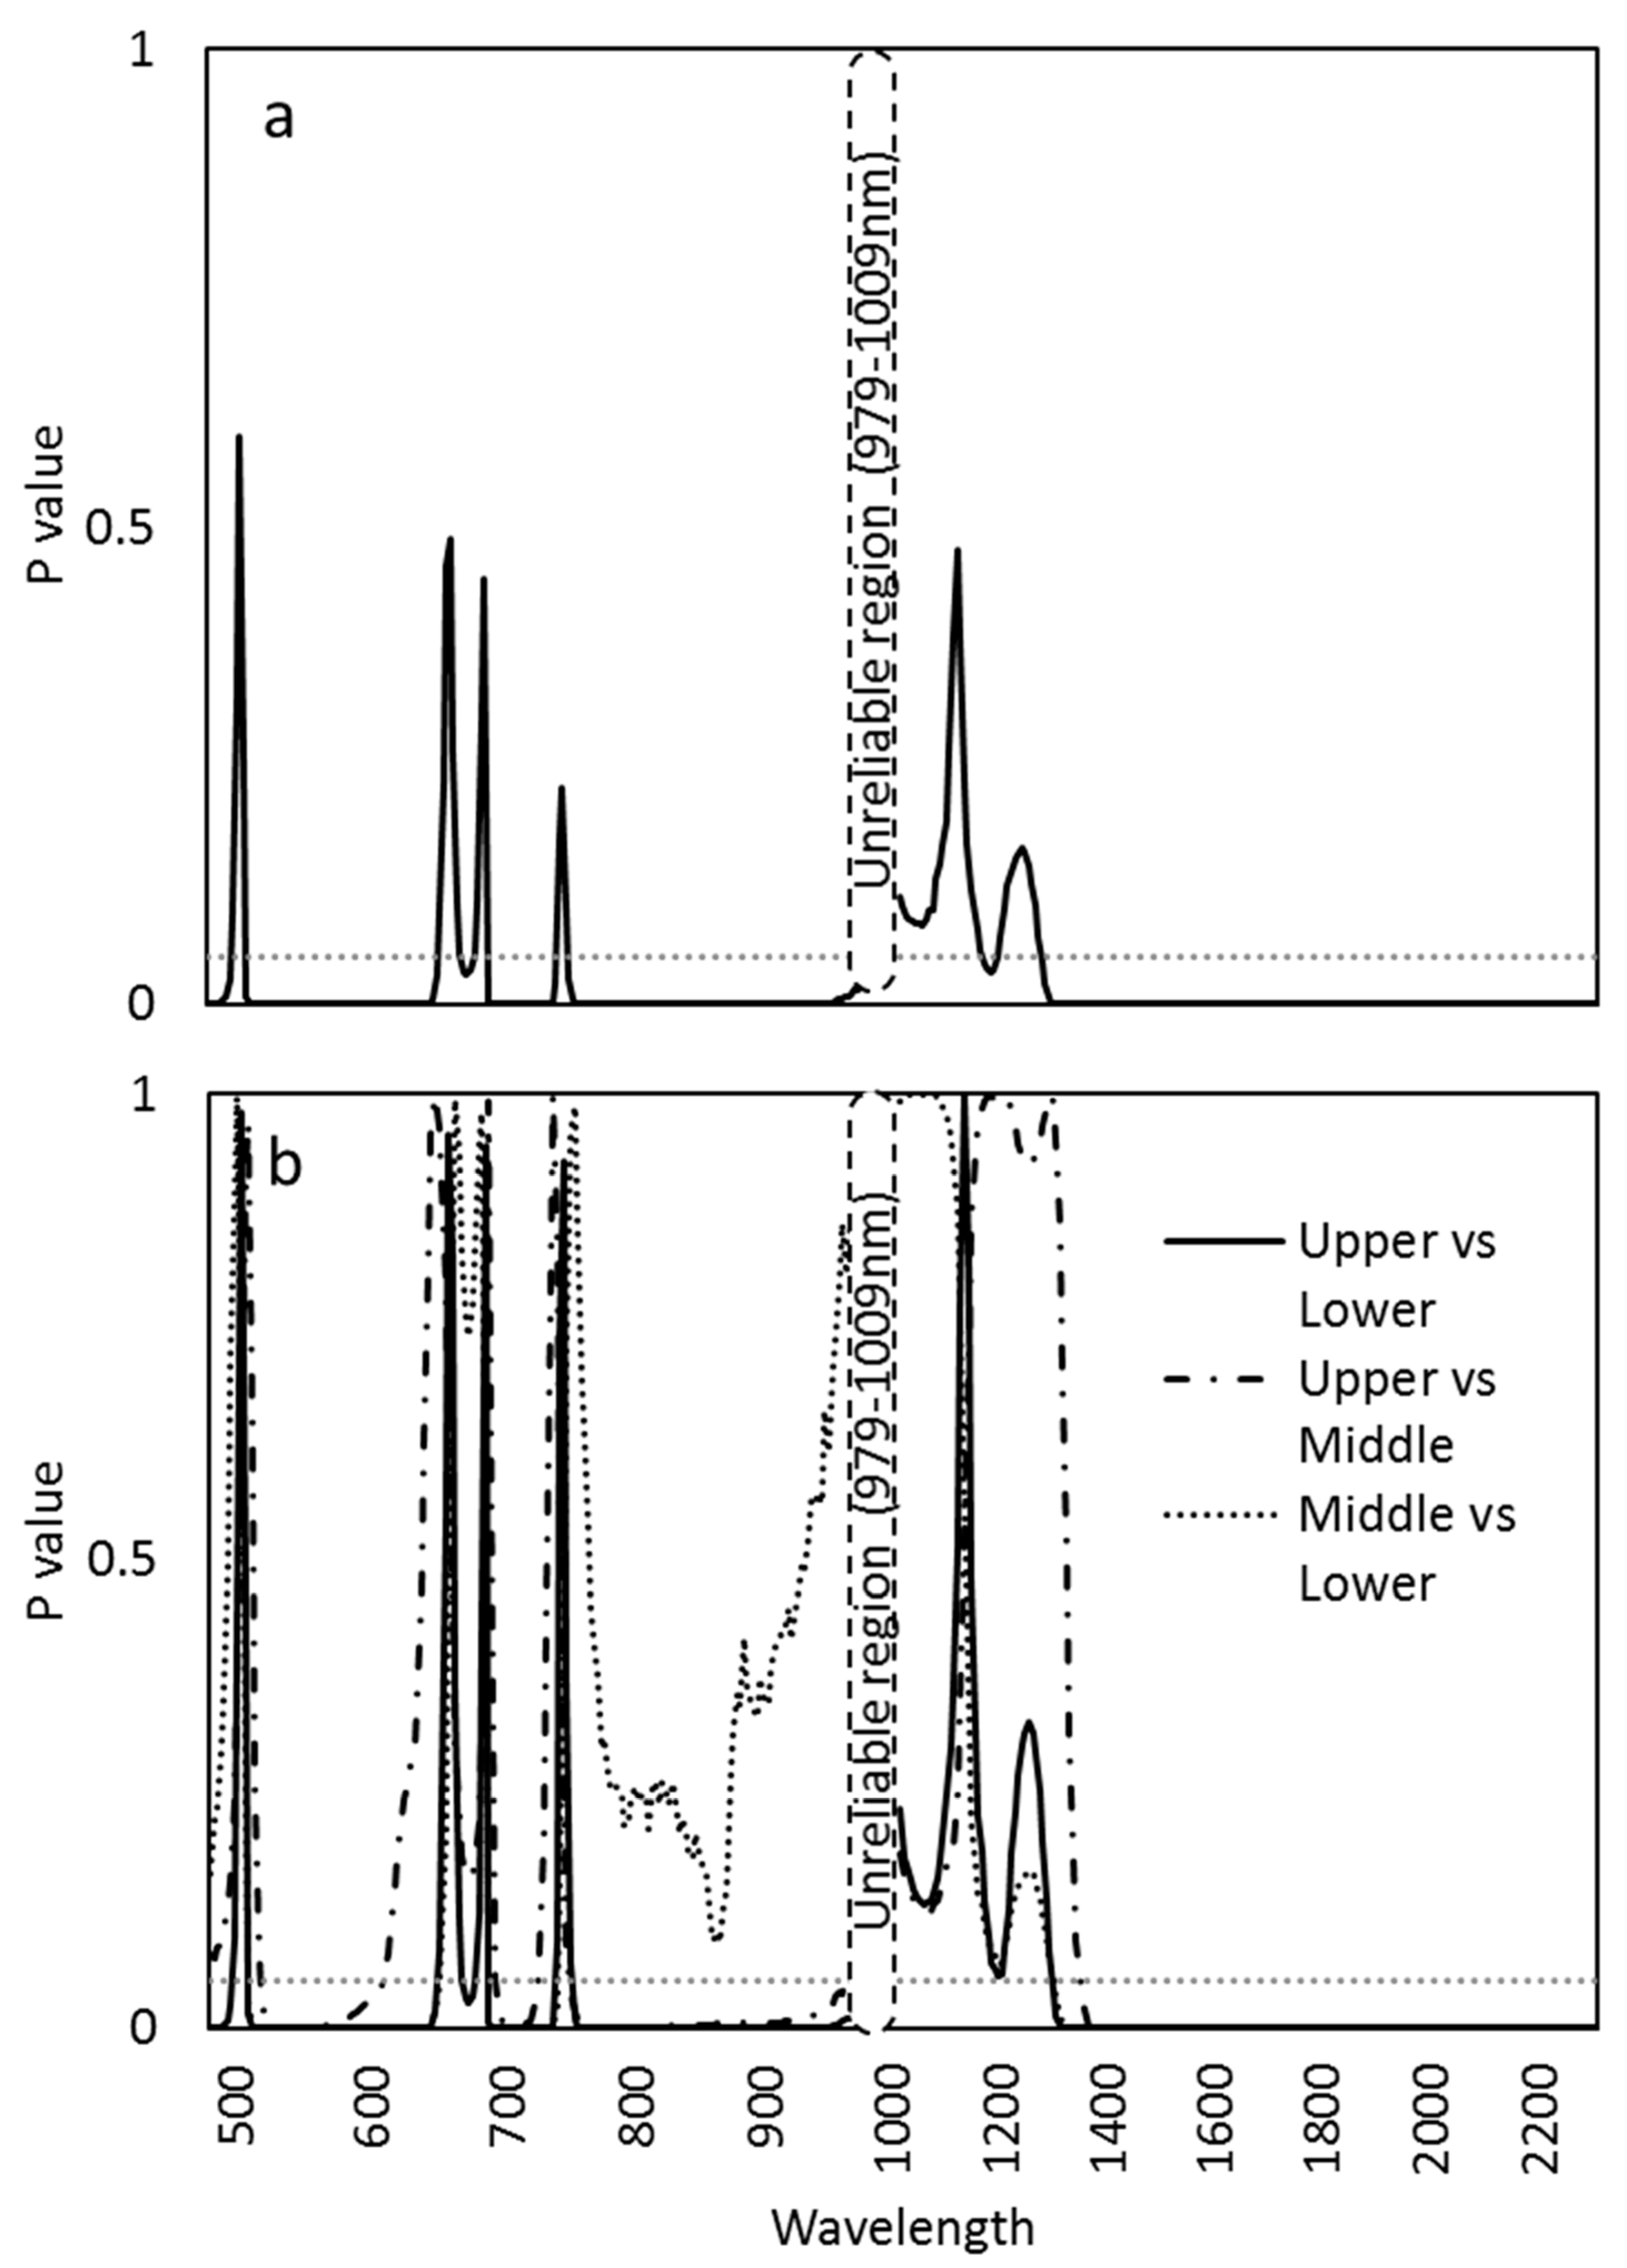
The ANOVA tests of the mean reflectance by wavelengths for the canopy layers indicated significant differences at wavelength ranges from 482–500 nm, 512–653 nm, 668–678 nm, 691–740 nm, and 750–976 nm for the VNIR (Figure 4a). In the SWIR range, wavelength ranges 1180–1212 nm and 129–2307 nm were significant (Figure 4a). Tukey’s HSD test for the pairwise comparison between the canopy layers showed a similar pattern as in the ANOVA test between the upper and lower canopy (Figure 4b). The VNIR wavelength ranges 519–612 nm, 694–725 nm, and 750–976 nm were significant for the upper vs. the middle canopy, whereas 509–650 nm, 691–740 nm were significant between the middle vs. the lower canopy (Figure 4b). The wavelengths between 1301–2307 nm showed significance for Tukey’s HSD test between the upper vs. the lower and the middle vs. the lower canopy, and the wavelengths 1351–2307 nm showed a significant difference between the upper and lower canopy (Figure 4b).
3.3. Differences in Reflectance Among The Cardinal Directions
Cardinal directions within each canopy layer did not show any clear pattern of variation in the PCA, and thus, we performed supervised PLS-DA profiles among the different canopy layers (Supplementary Figure S3a,b). However, we were unable to identify a clear difference between the cardinal directions via PLS-DA. The CV-ANOVA was 0.02 for the middle canopy and p-value > 0.05 for the lower canopy. The upper canopy layer did not produce any PLS-DA plot for the cardinal direction. Even though the middle canopy showed a level of significance, the R2, the measure of the overall fit of the model was 0.094, and the Q2, the predictability of the model, was 0.053 indicating that the model was overfitting.
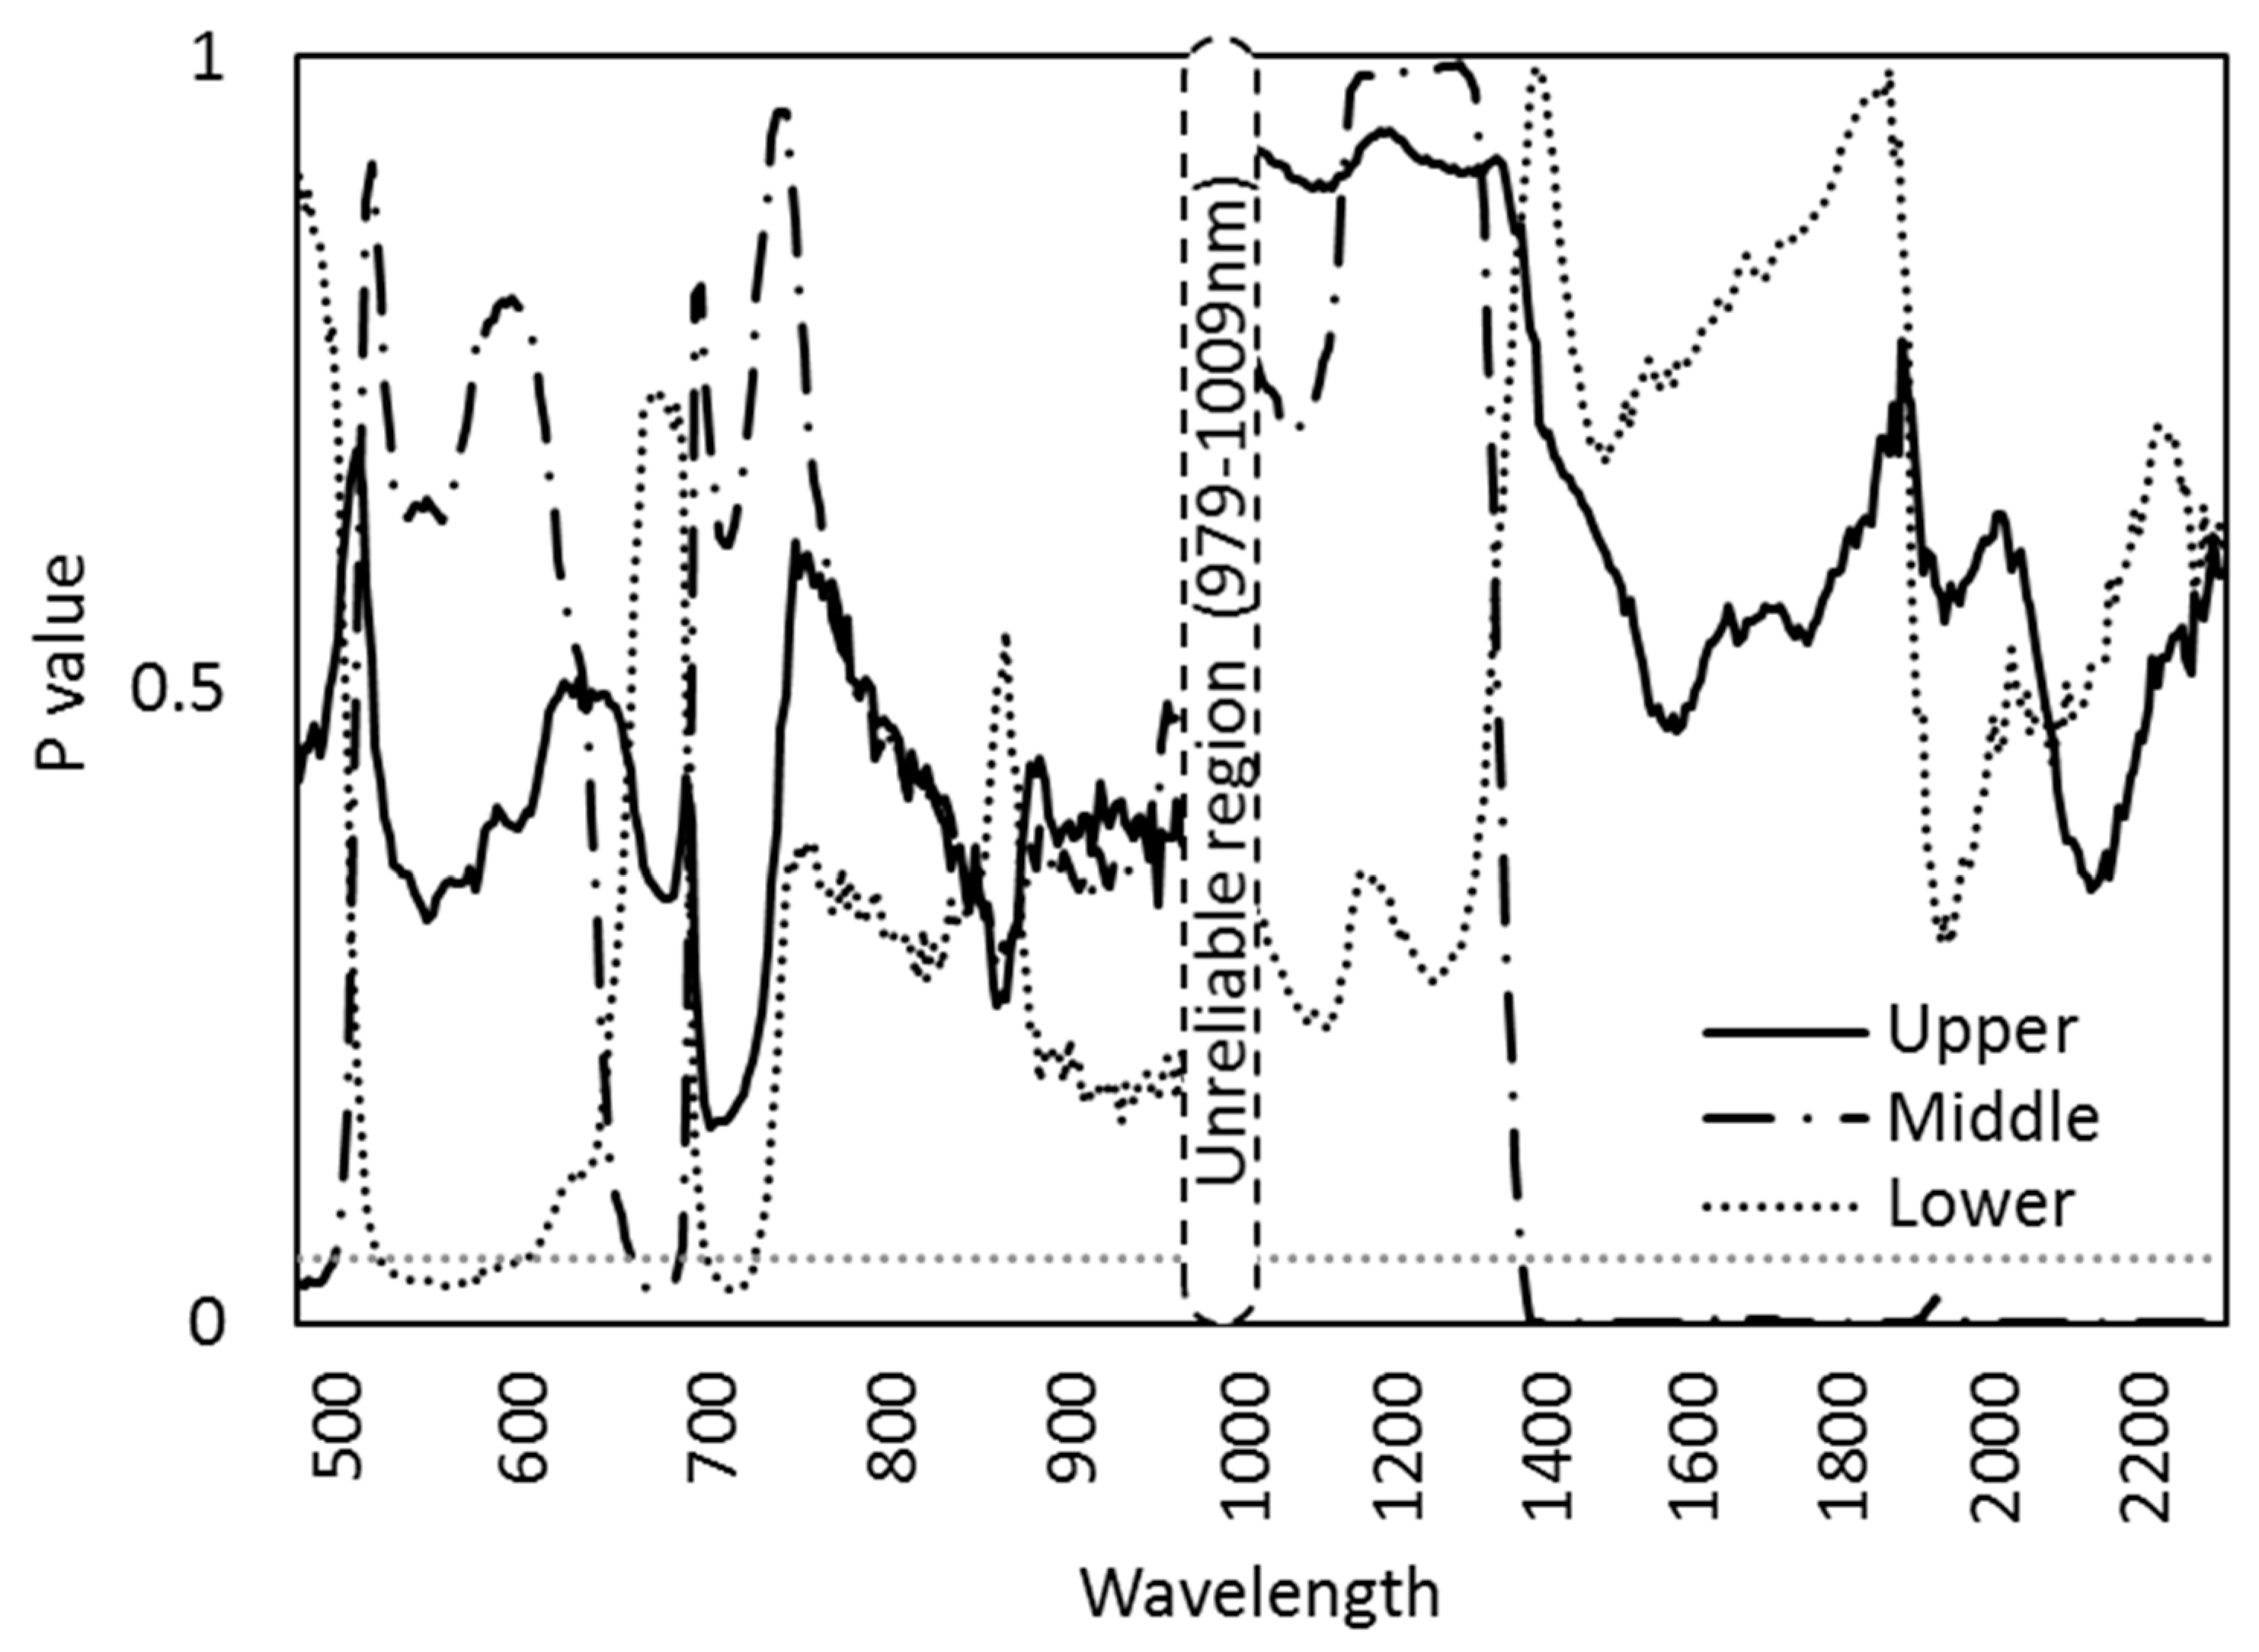
An ANOVA test showed that the cardinal directions showed a varied response among the different canopy layers (Figure 5). The lower canopy leaves showed significant variation among the cardinal directions in the wavelength range 527–602 nm and 704–727 nm while the middle part showed significance in the range 482–499 nm and 660–686 nm. In the SWIR range, the cardinal directions showed a significant variation only for the middle part of the canopy starting from 1383 to 2307 nm (Figure 5).
3.4. Red Edge, NDVI, and PRI Variation among Canopy Layers and Cardinal Directions
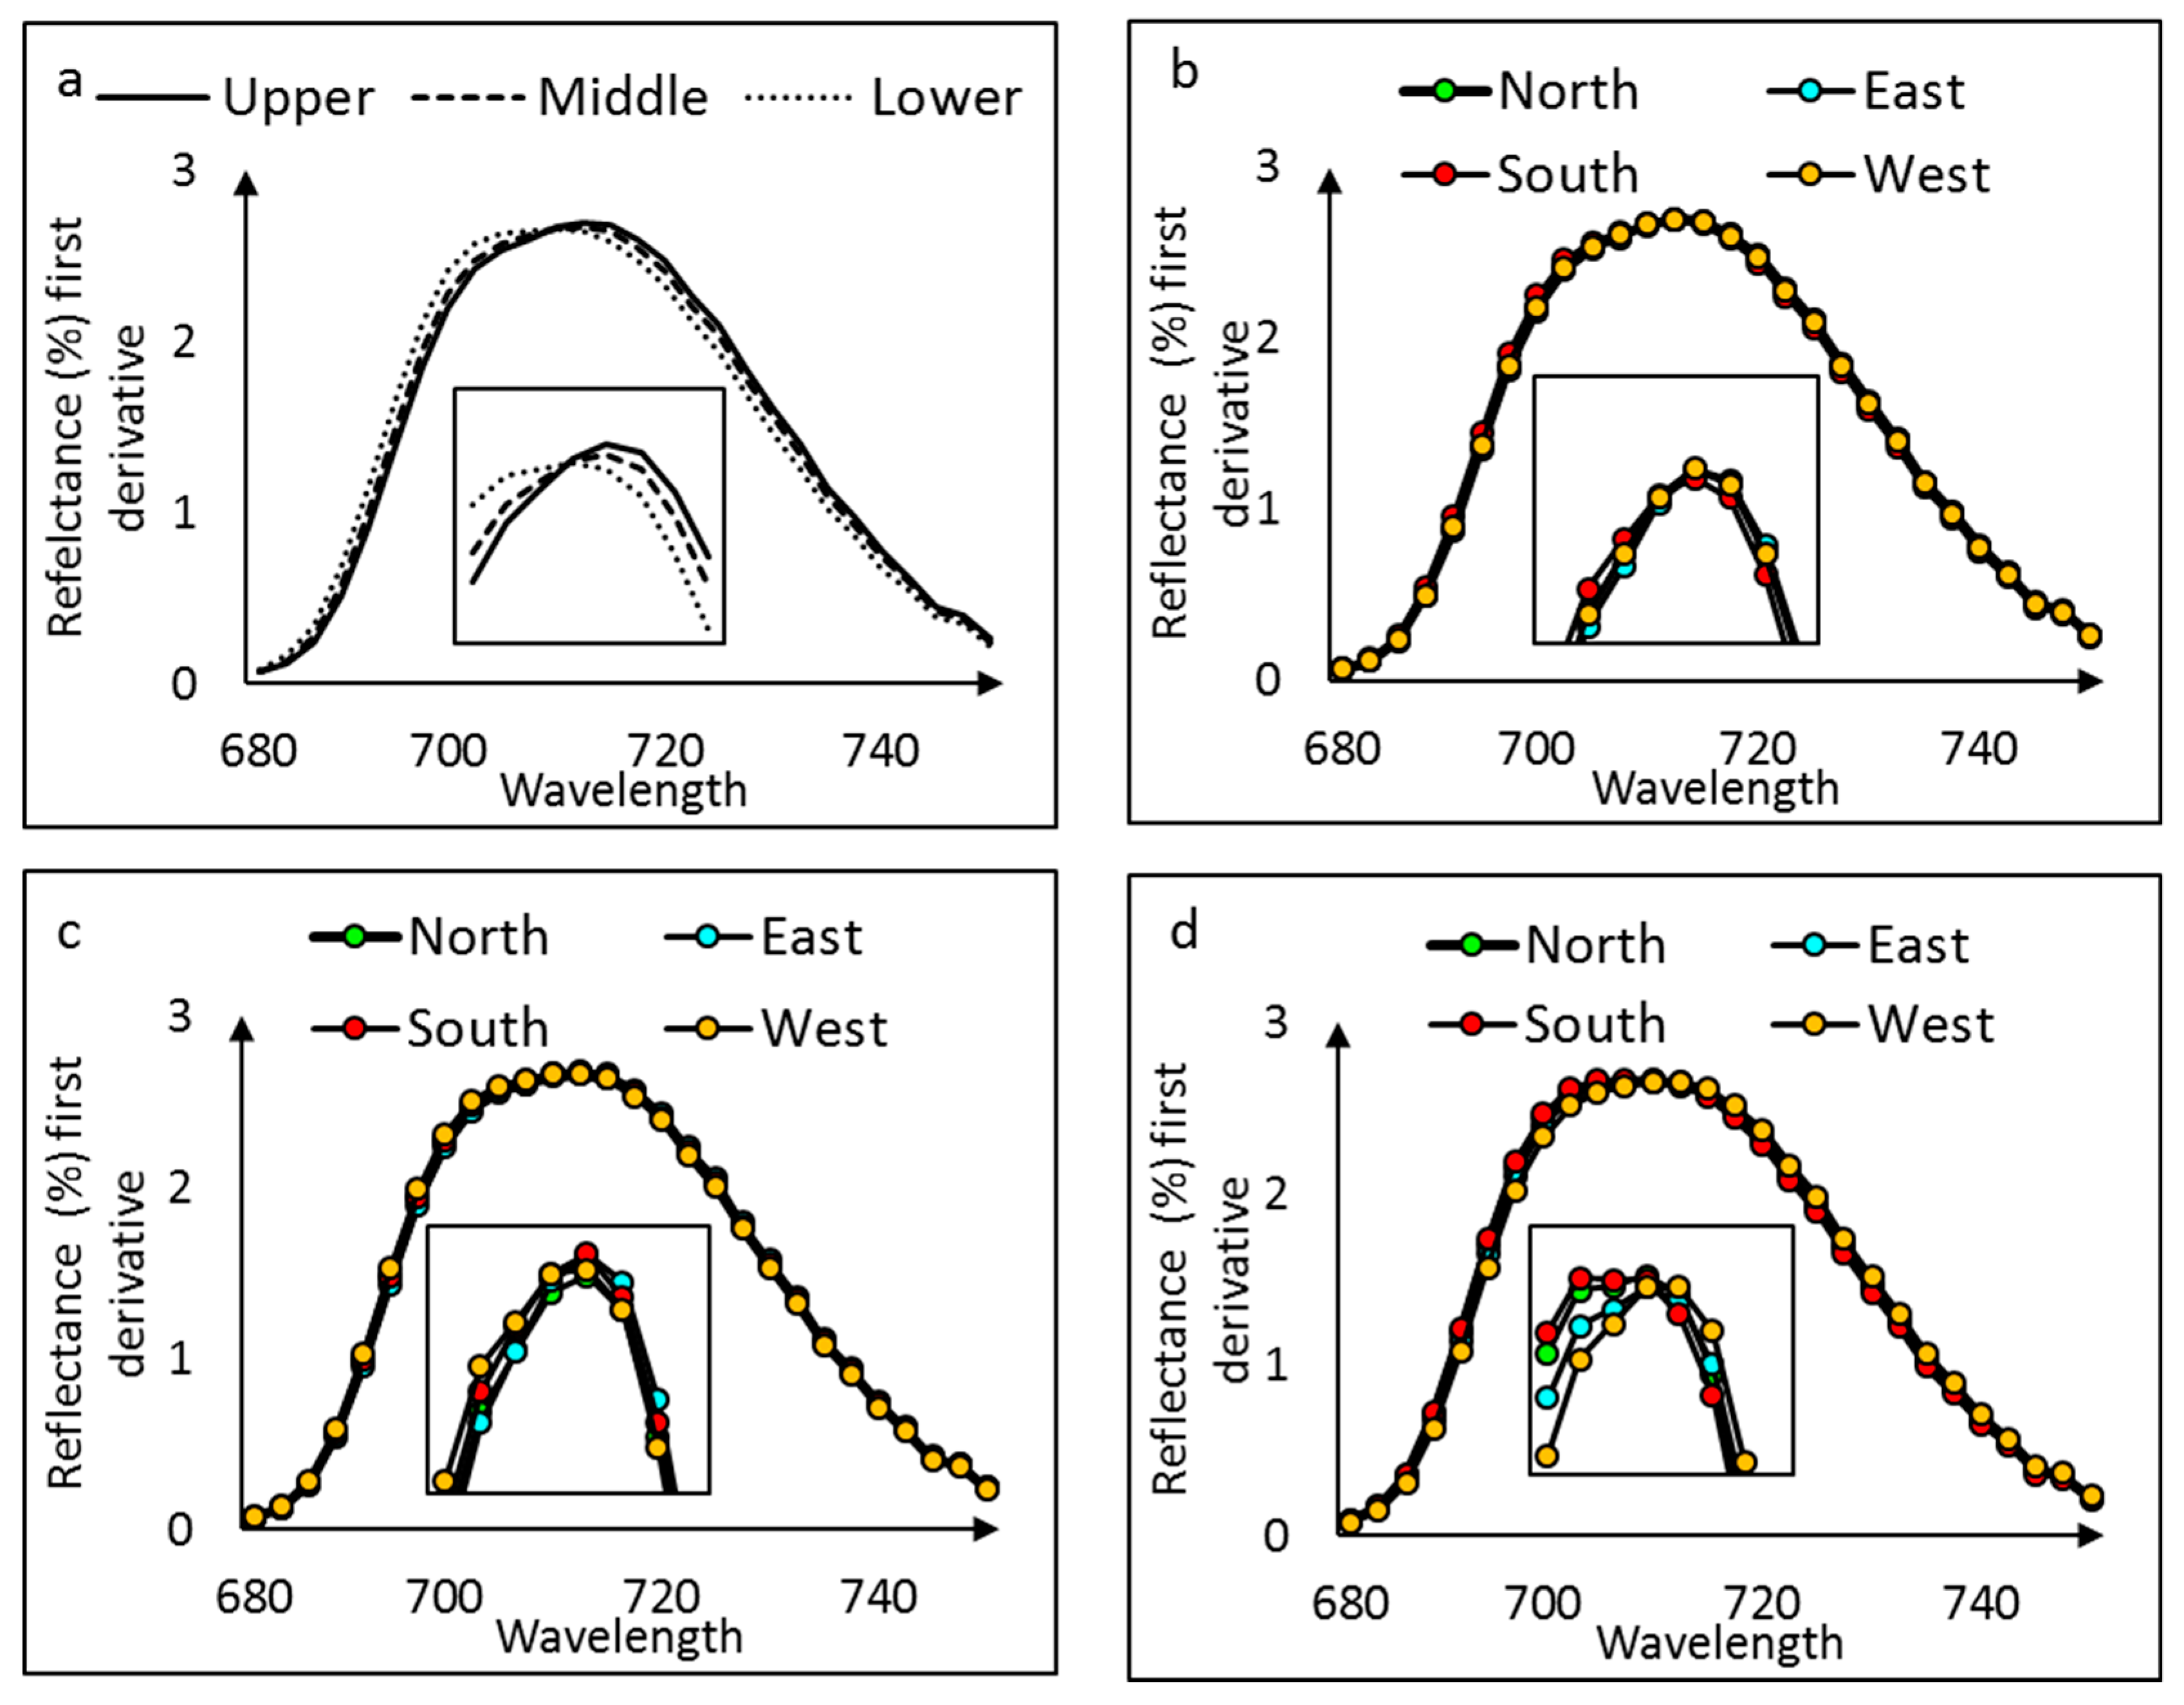
The leaf reflectance showed a shift in the red edge among the canopy layers with the lower canopy having the REIP at 709 nm, whereas REIP in the middle and the upper canopy was shifted towards 712 nm (Figure 6a).
The leaf reflectance spectra for the cardinal direction separately for each canopy layer showed no consistent pattern of variation. There was no shift in the upper (Figure 6b), middle (Figure 6c), or lower (Figure 6d) canopy reflectance due to the cardinal direction.
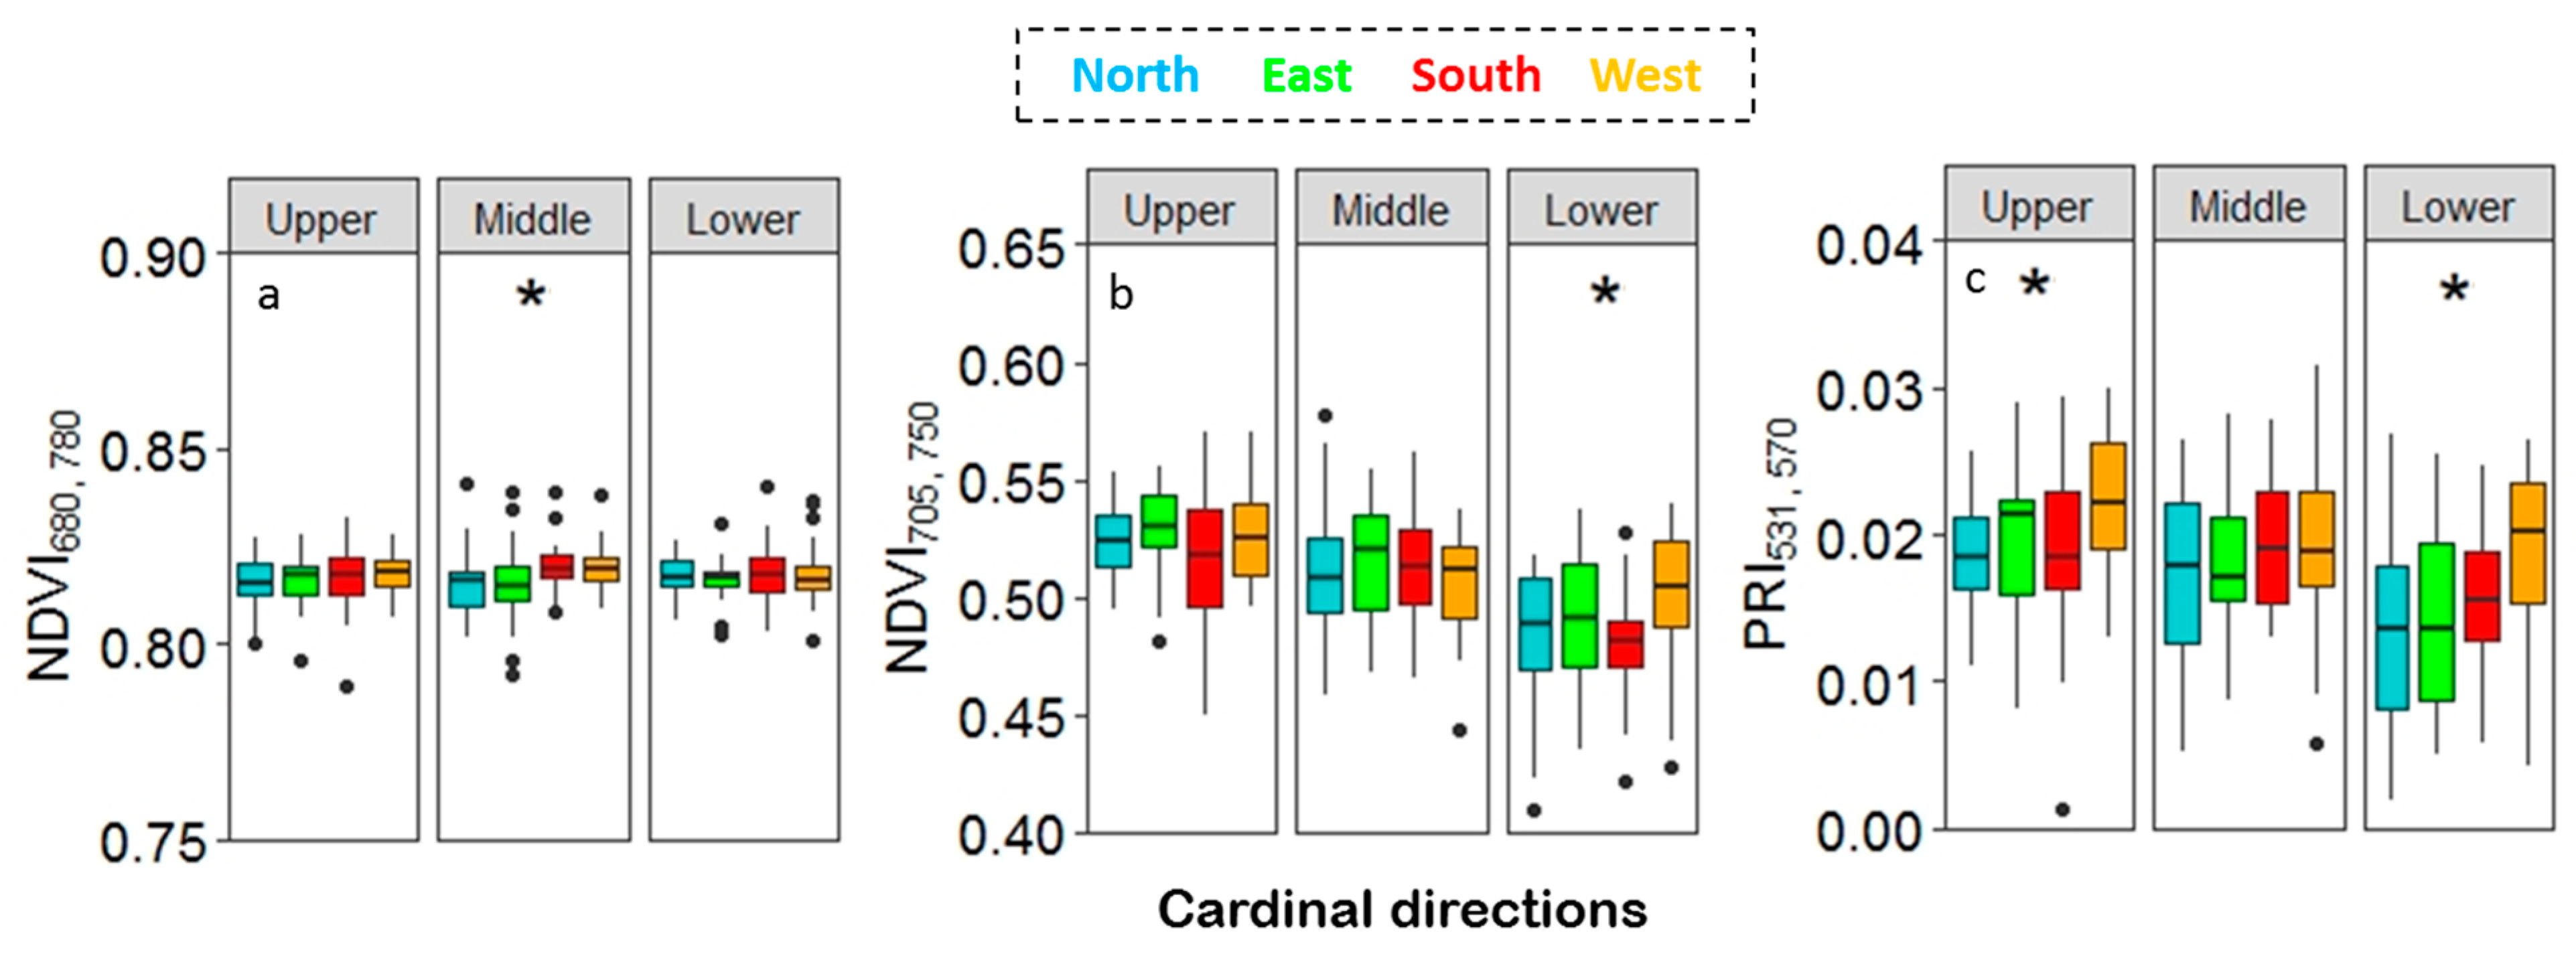
The NDVI 705, 750 and PRI 531, 570 indexes showed a significant difference (p < 0.001) among the canopy layers with a decreasing trend towards the lower canopy (Figure 7) when separately analyzed with ANOVA. The NDVI705, 750 showed a highly significant variation (p < 0.0001) between the leaves from the upper vs. the middle, the upper vs. the lower and the middle vs. the lower canopy, whereas PRI varied (p<0.0001) between the upper vs. the lower and the middle vs. the lower canopy. The NDVI 680, 780 showed no significant variation among the canopy layers. The effect of the cardinal direction on NDVI for all three canopy layers (Figure 7a,b) showed different patterns for the two NDVIs used. The NDVI 680, 780 showed a significant difference among cardinal directions in the middle canopy, whereas the NDVI 705, 750 showed a significant difference in the lower canopy. Instead, for the PRI 531, 570, both the lower and upper canopy leaves had a significant variation among the cardinal directions (Figure 7c). The pairwise ANOVA for the cardinal direction showed that leaves from the north and the east side of the tree differed to leaves from the south and the west side, for NDVI 680, 780 (p < 0.05). For the NDVI 705, 750 index, leaves from the west differed from the south and the north side in the lower canopy (p < 0.05), whereas for the PRI 531, 570, leaves from the west differed from all the other directions for both the upper and the lower canopy.
3.5. Leaf Traits among the Canopy Layers and Cardinal Directions
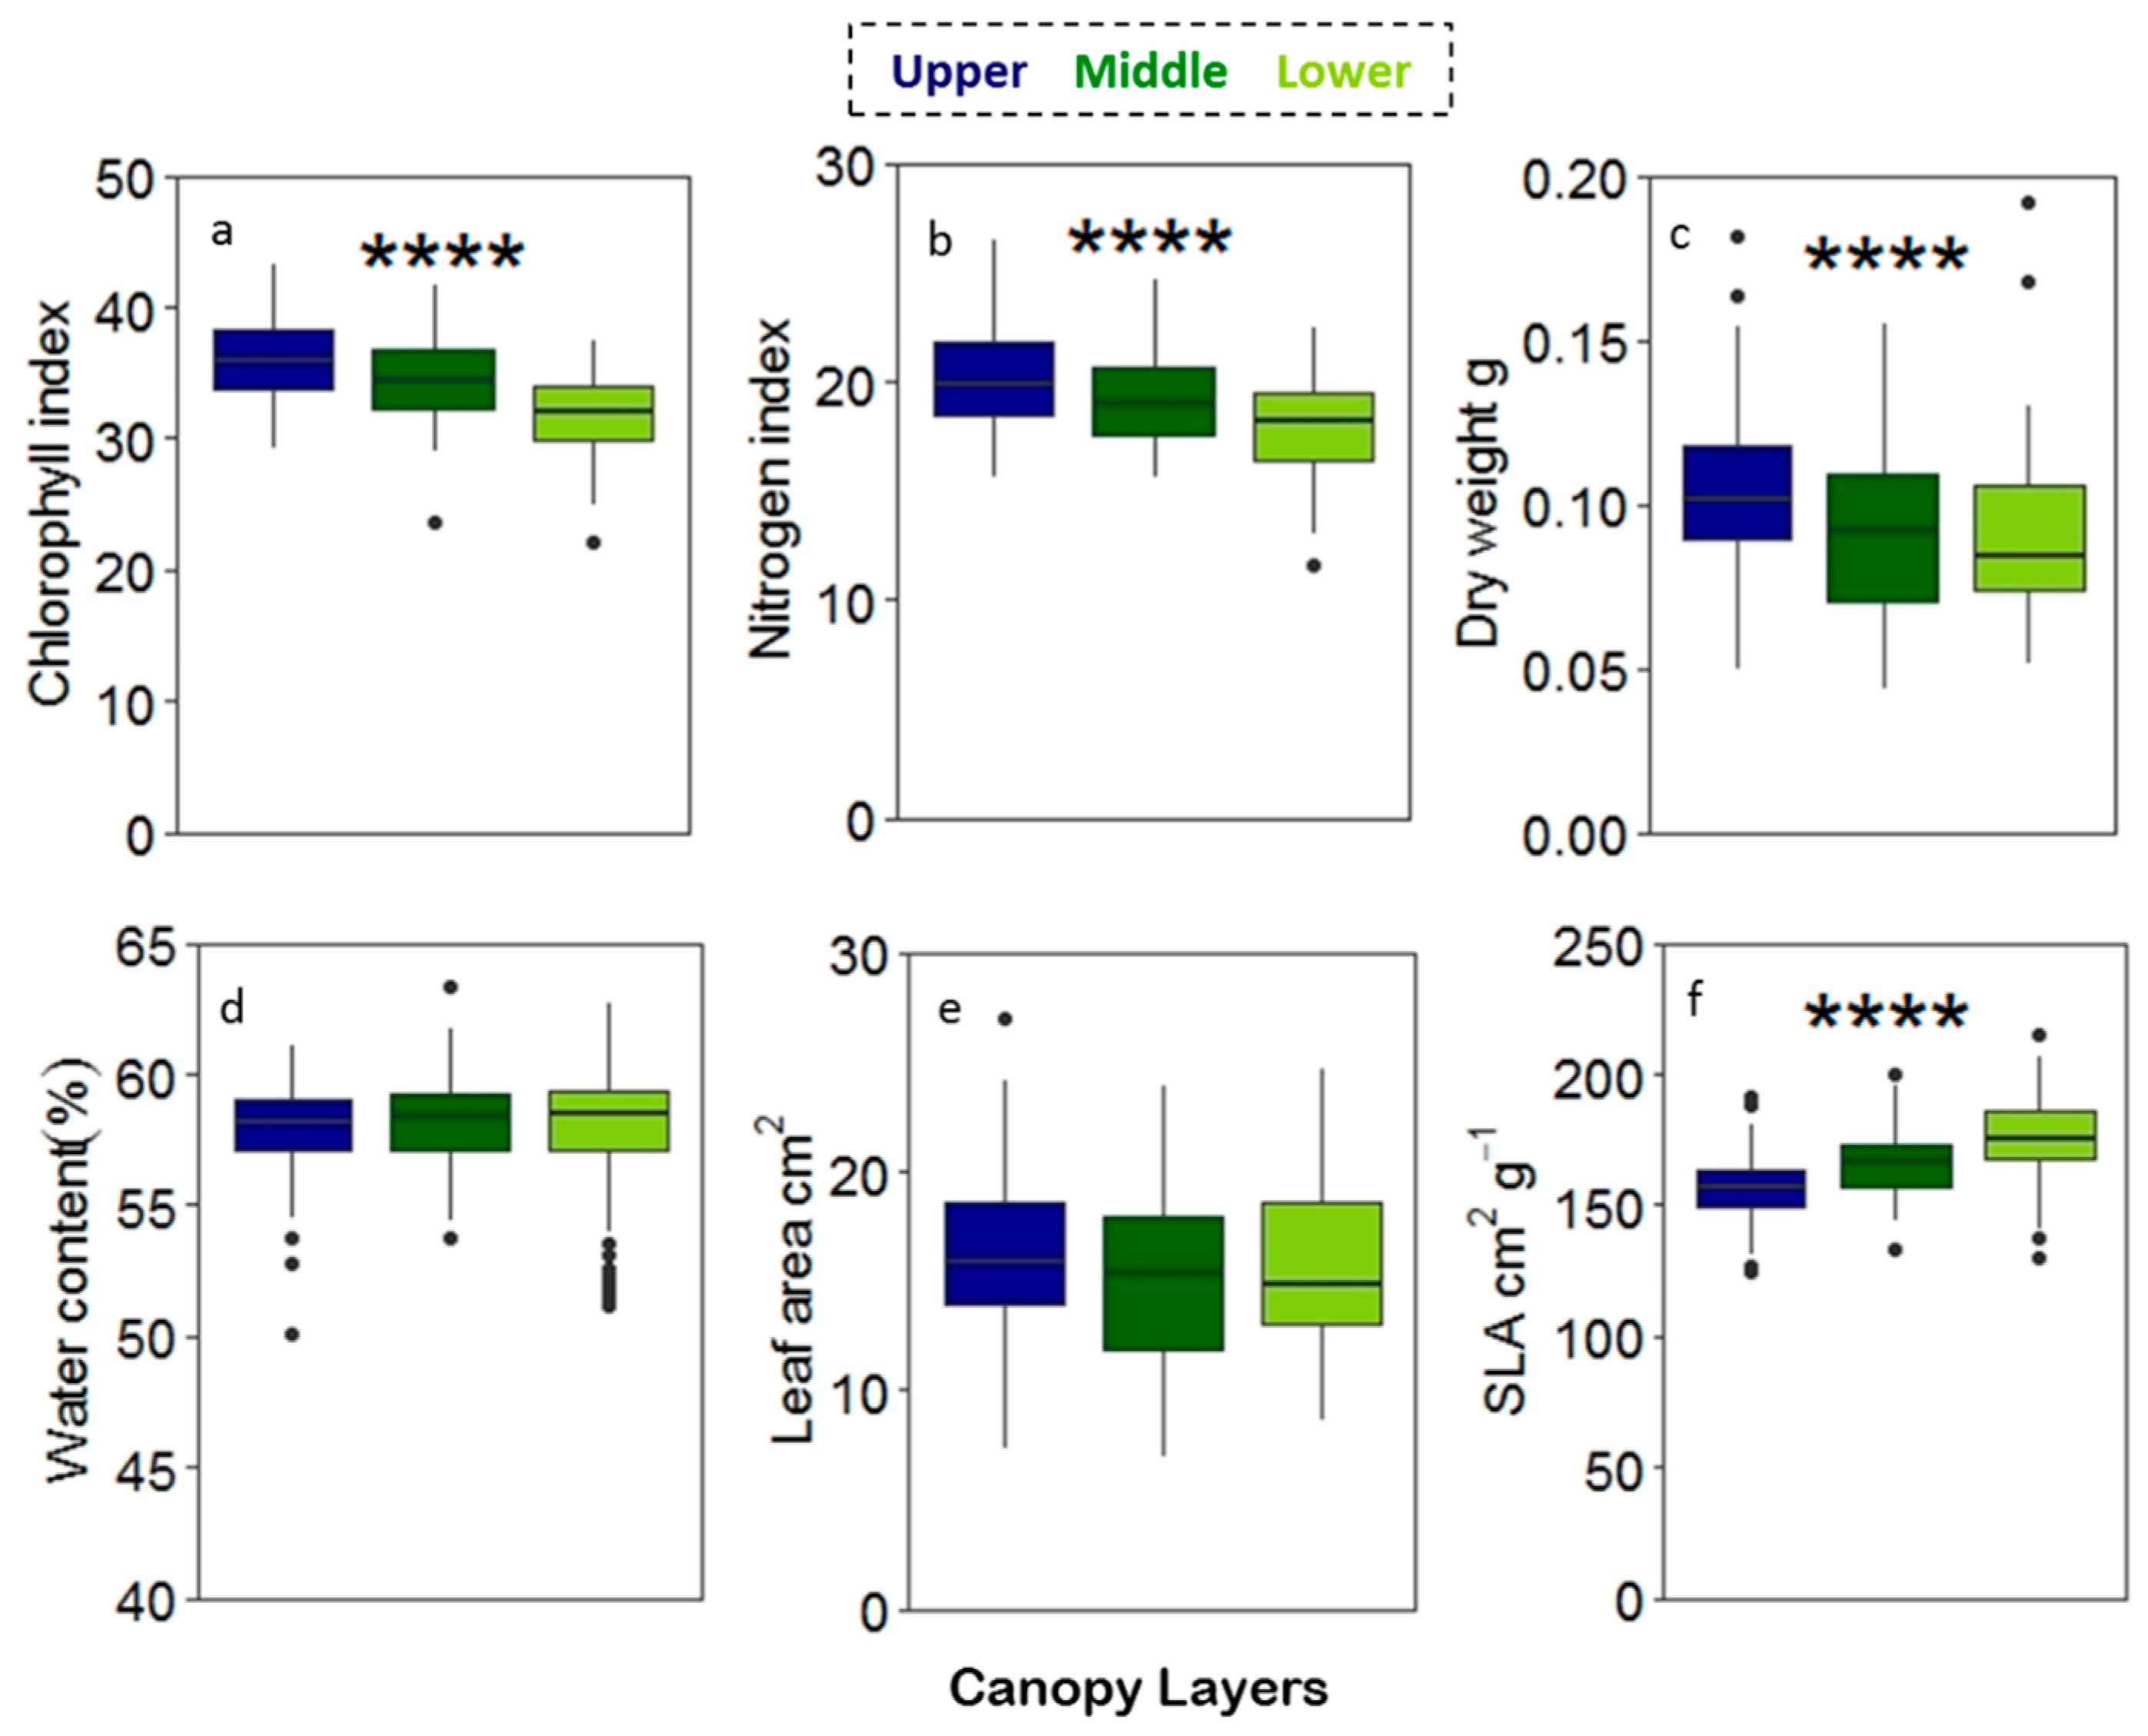
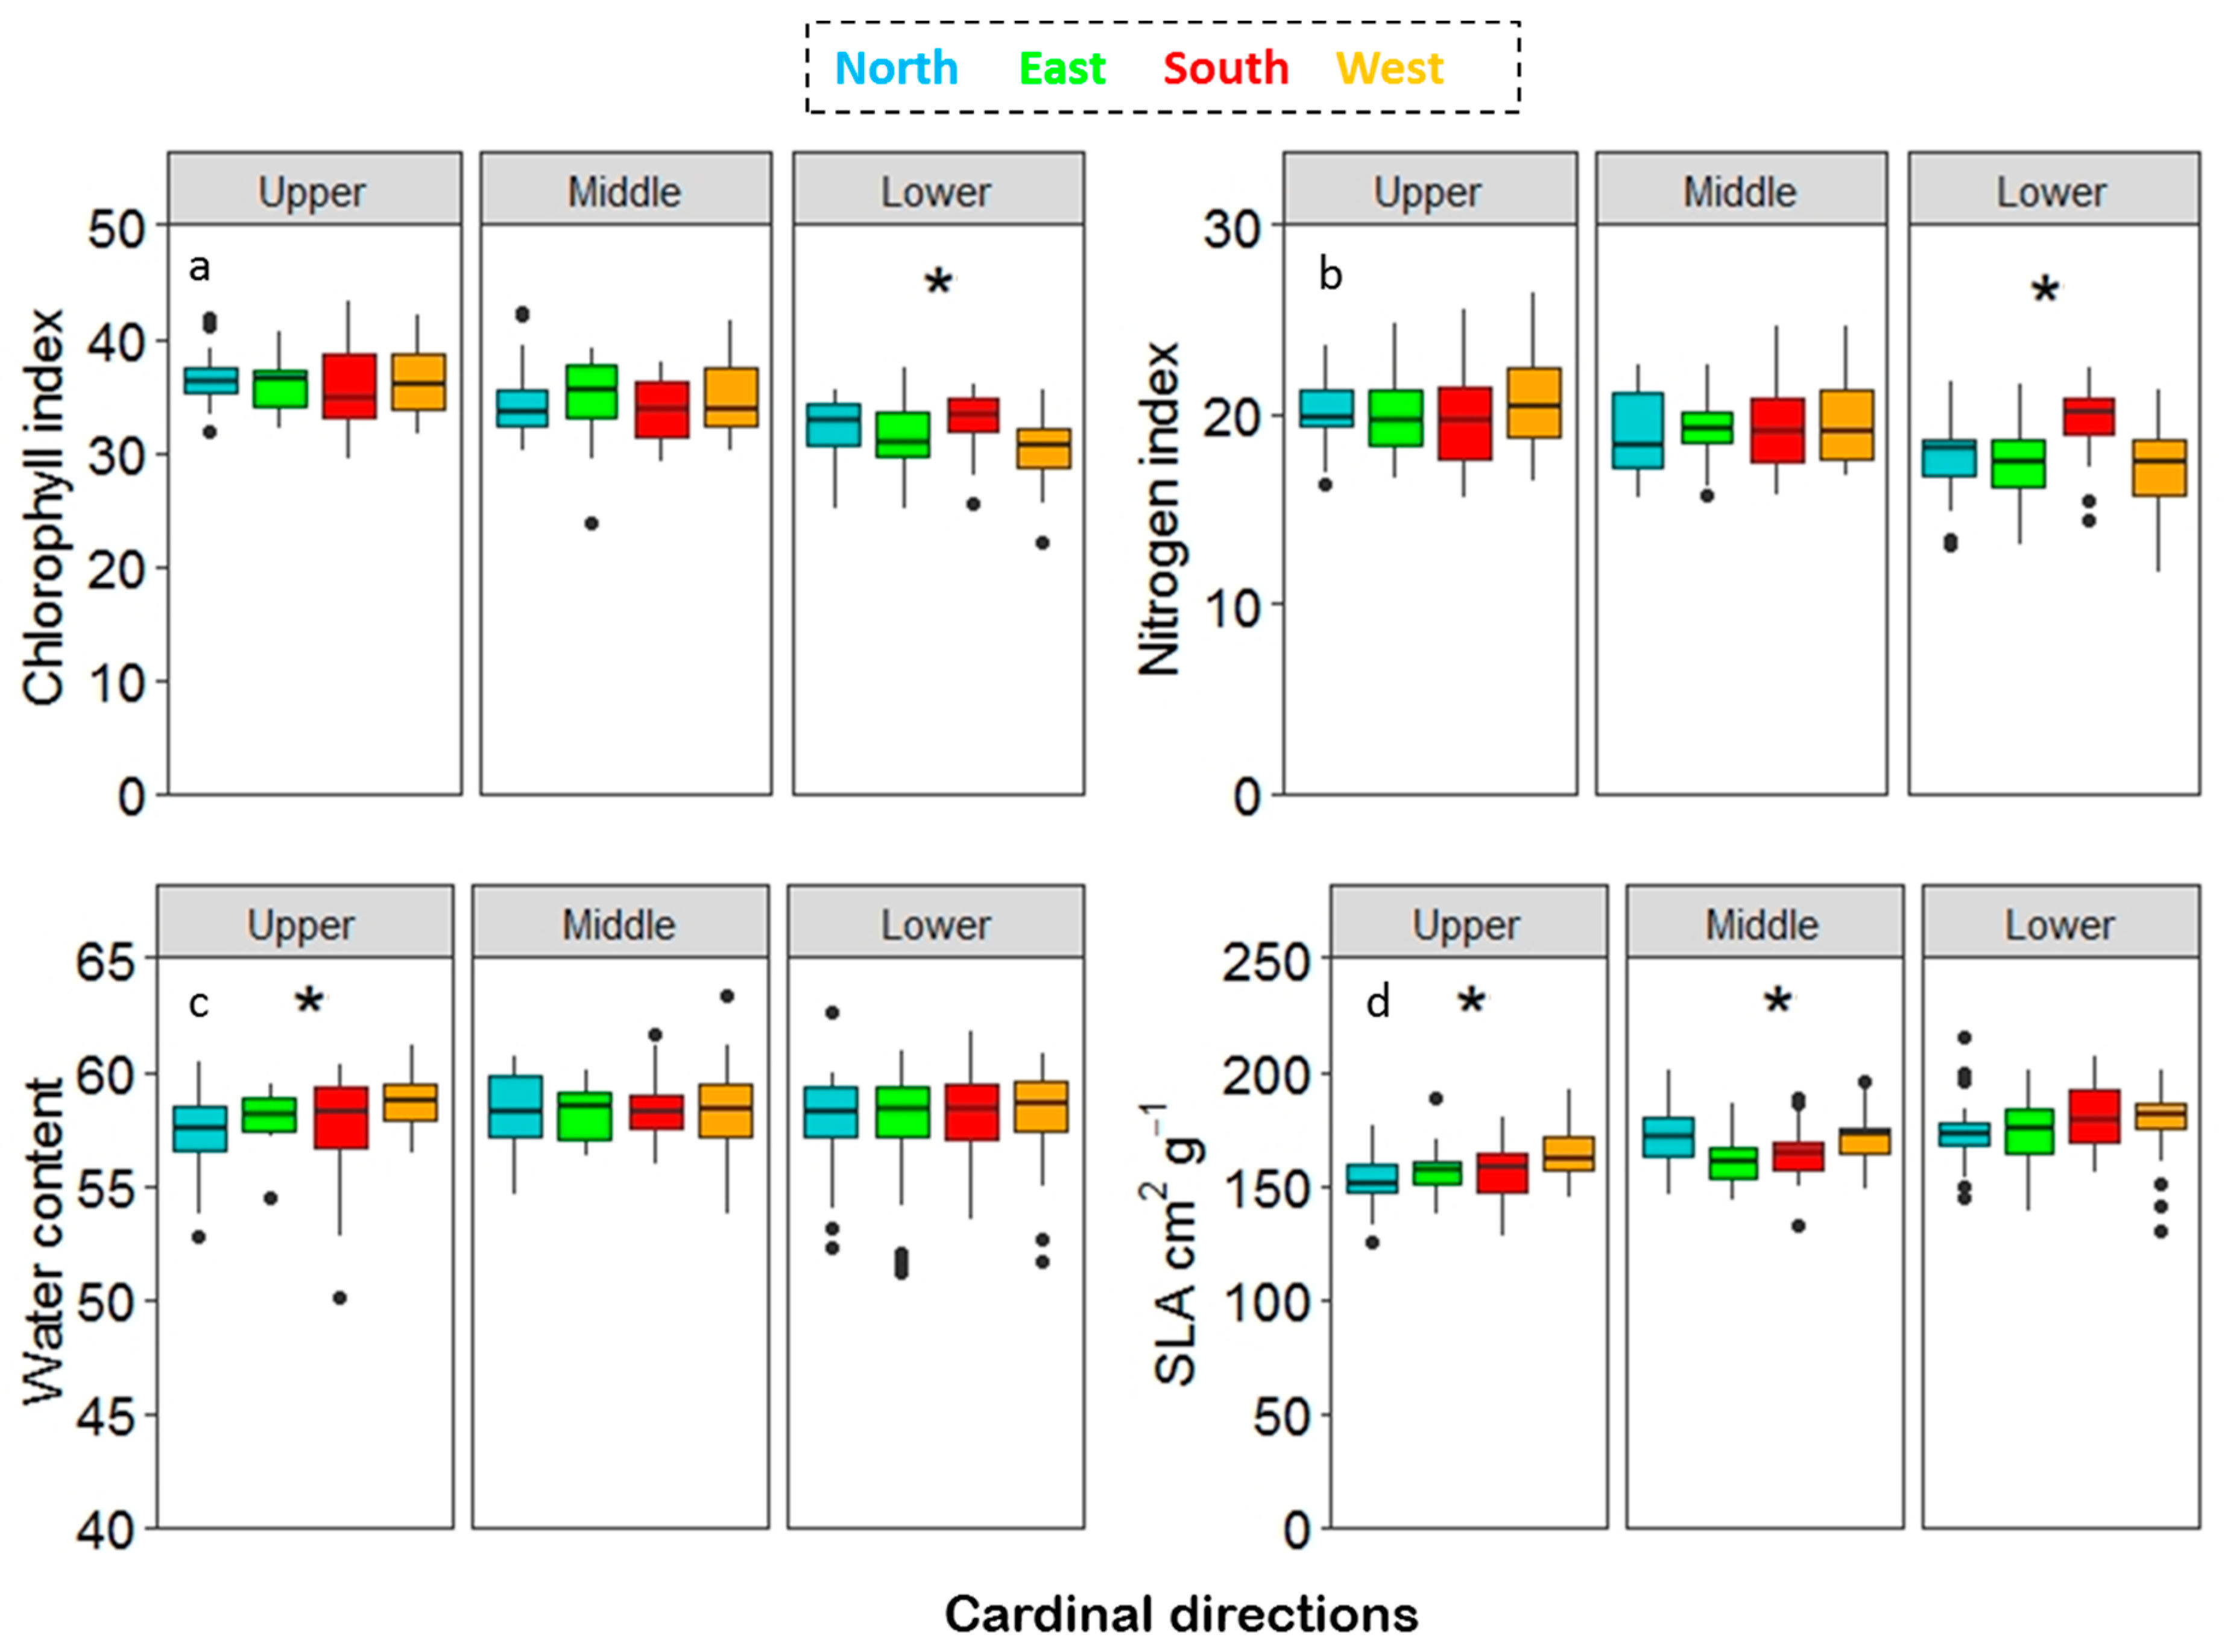
Chlorophyll and nitrogen content index and dry weight varied significantly among the canopy layers with decreasing values from the upper towards the lower canopy (Figure 8a, b, c). SLA showed an increasing pattern from the upper to the lower canopy (Figure 8f). Leaf traits for the cardinal directions showed a significant difference in the lower part of canopy for the chlorophyll and the nitrogen content index (Figure 9a,b) and in the upper canopy for water content (Figure 9c), whereas SLA showed a significant difference in both the upper and the middle canopy (Figure 9d). The pairwise ANOVA showed a significant p-value (p < 0.05); however, no clear pattern of variation in the leaf traits. The leaves from the south differed from the east and the west in their chlorophyll content index, and leaves from the south differed from the east and the north in their nitrogen content index for the lower canopy. Water content showed that leaves from the west differed from the east and the north. For SLA, leaves from the west differed from the east and the north in the upper canopy and the leaves from the east were different from the north and the west in the middle canopy.
3.6. Relationship between Leaf Traits and Their Reflectance Indices among the Canopy Layers
Most chlorophyll indices correlated with the chlorophyll content index with moderate R2 value (Table 2). This was true also for the upper and lower canopy leaves, separately. Three indices did not have any significant correlation to the chlorophyll content. All these indices included the wavelength 800 nm in the index calculation. The chlorophyll indices of the upper canopy leaves had a higher correlation with the chlorophyll content index than the ones of the lower canopy leaves.
4. Discussion
We explored the variation among canopy layers and cardinal directions in the leaf reflectance spectra of three individual silver birch trees of the same genotype growing in the field conditions. The canopy layers differed from each other in their mean reflectance spectra, with the largest difference between the upper and the lower canopy. Even though the spectral differences between the sun leaves (mostly in the upper canopy) and shade leaves (mostly in the lower canopy) have been shown before [17,26,32], the middle canopy has been included only in the comparison of evergreen plant species under controlled conditions [15]. The leaf canopy layer reflectance variation exhibited a consistent pattern with a clear separation between the upper and the lower canopy leaves, whereas the middle canopy was mixed with both of them. As reviewed by Rautiainen et al. [33], the separation between the sun-exposed canopy and shaded canopy layers has differed in effect size among studies [26,32]. Our study showed similar variation in the mean reflectance spectra as in Lukeš et al. [32], who reported a clear, but small difference, between sun-exposed and shade leaves in silver birch. Few studies quantify in detail the effect of light conditions on the leaf spectral reflectance, which can be species-specific.
The upper canopy leaves showed consistently lower reflectance in the visible range than the lower canopy leaves in this study, which is in line with Gara et al. [15]. The largest variation in the visible range was observed in the green hump and around the red edge. The reflectance variation in green hump is strongly affected by the chlorophyll and anthocyanin content in the leaf. The spectral variation in the red edge range is related to the leaf chlorophyll content [70,71]. Red edge wavelengths are thus widely used to estimate chlorophyll content [72]. The red edge position also responds to various stresses and has been used to provide an indication of the physiological condition of the plants [29,71]. Our results showed a spectral shift towards longer wavelengths in the red edge position from lower to upper canopy layers, as in Gara et al. [15], which is consistent with a concurrent gradient of increasing chlorophyll content [73].
The high standard deviation in the VNIR range in the lower canopy leaves could be due to the variation in the light exposure caused by neighboring trees. Thus, the smaller variation at the upper canopy can be thought of as being due to a more homogeneous light environment. This appears to be contrary to Lichtenthaler et al. [12], who suggested that shade leaves are exposed to a more homogeneous environment during most of their existence, therefore, enabling more homogeneous leaf properties. Although the proportion of shade leaves is likely to be higher in the lower canopy than in the middle or the upper canopy in our study, the trees at the common garden site were six years old (5 m in height), and thus lower canopy was not as shaded as in a stand of mature trees.
In our study, the highest PLS-DA VIP scores for separating the canopy layers were found before the major water absorbance bands in the SWIR region 1377–1395 nm (VIP >2) and 1887–1899 nm (VIP >2), suggesting differences in water content among the canopy layers. However, there was no clear pattern among the canopy layers in reflectance around 1200 nm, a minor water absorption band in the SWIR region. Moreover, the water content of the leaves did not show a significant difference among the canopy layers. This implies that other leaf traits, such as polysaccharides or phenolic compounds [74], influenced the reflectance and overlapped the broad water absorbance features. The waveband ranges influential in canopy layer discrimination were almost the same but somewhat narrower than those reported by Gara et al. [15], 1372–1407 nm (VIP >1), 1902–1989 nm and 2106–2170 nm (VIP >1). Contrary to Gara et al. [15], wavelengths over 2000 nm were not responsible for the canopy layer separation in our study. There was also no clear difference in the near-infrared domain (750–1350nm) between the upper and the lower canopy layer leaves as in beech sunlit and shaded leaves [33], probably due to the heterogeneous light environment of the lower canopy layer in this study.
The differences among canopy layers are most relevant in proximal sensing [75], for example, in the estimation of photosynthetic capacity. Proximal sensing provides measurements at a scale that can be easily related to the leaf traits [76] and thus contribute background information for remote sensing applications, as highlighted in Serbin et al. [77]. In the VNIR range, the highest spectral reflectance differences among the canopy layers occurred at 519 nm, 696 nm, and 725 nm. The visible region has little atmospheric interference [78], and thus, the differences in reflectance patterns among canopy layers on these wavelengths encourages the application in remote sensing. However, the wavelength regions with the highest VIP values in the SWIR range separating canopy layers in our study are generally ignored in airborne and satellite remote sensing, since they compromise the overlapping atmospheric water vapor.
The leaf spectral reflectance differed clearly in ANOVA, showing that the canopy layers differed significantly at most wavelengths, except for a few narrow wavebands in VNIR and ca. 1000–1350 nm in SWIR. The results from Tukey’s post-hoc comparisons between any two canopy layers mostly agreed with ANOVA results. Moreover, the difference between the upper and the lower canopy was exactly the same as in the ANOVA results. The largest differences were thus between the upper and lower layer in the VNIR region, as reported in previous studies [17,26,32]. In the SWIR range, there were significant differences among all three canopy layers, as in Gara et al. [15].
Our results show that even though the canopy layer showed the largest variation in spectral reflection, the three trees also differed from each other in their foliar spectral reflectance. This indicates the differences occurred in foliar spectral reflectance due to the minor environmental variation in the common garden field. However, there was no consistent pattern of variation in the spectral profile nor in the leaf traits among cardinal directions. No variation in the cardinal direction was observed for the upper canopy, which is in line with Lhotáková et al. [44], where no cardinal heterogeneity was reported for the sunlit leaves of the Norway spruce. The lower and middle canopy layers showed sporadic significant differences among cardinal directions at different wavelength regions. However, the variation was not consistent or coinciding with the variation in the leaf traits indicating no clear pattern of variation among cardinal directions.
In addition to the vertical position of the leaves in the canopy, the spectral reflectance is influenced by differences in optical properties between leaf sides (adaxial or abaxial surfaces) [26]. Silver birch adaxial leaf surface had lower reflectance than the abaxial side in the visible range [26,32], but higher in the NIR and SWIR range [26]. The difference between the surfaces was similar for both sun-exposed and shaded leaves [32]. Although we limited our study to the adaxial side of the leaves, these represent the majority of leaf surfaces to be remotely sensed above the canopy.
The differences in foliar spectral reflectance among canopy layers, even in a rather homogeneous stand of six-year-old birch trees, imply that within-tree variation can have implications for leaf sampling procedures. Lower canopy leaves may need to be included in the sampling for the calibration of hyperspectral data on remote sensing to estimate the contents of biochemical constituents. In a boreal forest with relatively sparse tree cover, lower canopy layers can be expected to be detectable from above. Serbin et al. [77] studied the accuracy of estimation of several leaf traits, including nitrogen content on an area basis and leaf mass area, by spectroscopy in temperate and boreal forest vegetation and they found that the inclusion of within tree variation did not hamper the model performances for calibration. Gara et al. [41] showed that model estimations of canopy traits for evergreen plants underperformed when only the upper canopy leaves were included in the estimation, whereas validation including the upper, middle, and lower canopy leaves improved the performance of the leaf carbon and leaf mass area estimation.
Among the leaf traits, chlorophyll and nitrogen contents on an area basis followed a commonly found pattern with the lower canopy layer showing lower values and an ascending trend towards the upper canopy in all three trees [14]. The major factor influencing these gradients is light availability, which is related to the observed gradient of increasing SLA from the upper to the lower canopy layer, found here similar to other studies [12,20]. Shade leaves of light-demanding tree species, such as Betula papyrifera, have been shown to respond to shade primarily by altering SLA [79]. Even though our results showed significant variation in chlorophyll and associated nitrogen content among the cardinal directions in the lower canopy, there was no clear pattern. SLA showed significant directional variation in the upper and middle canopy layers. This is partly in line with the results of Weiskittel et al. [42], who found only a very minor influence of cardinal directions in SLA with conifer species. However, for broadleaf species, within-individual variation in SLA can be substantial. Petruzzellis et al. [10] found that in Quercus ilex, the change in SLA related to light availability decreasing from the upper to the lower canopy and from outer to inner part of the canopy can be as much as 43% of the total intraspecific variation. SLA responds well to varying microenvironments within a forest and is directly influenced by the light intensity in the medium and large gaps compared to small gaps [21], which may partly explain the lack of directional SLA variation in the lower canopy in silver birch.
Sonobe and Wang [34] reported that the performance of spectral indices used for the estimation of chlorophyll content varies among different leaf types of deciduous trees. Our results showed that the relationships between various indices and chlorophyll contents estimated with Dualex differed clearly between the upper and the lower canopy layers, with the lower canopy having rather low R2 values. This could be due to the structural differences between the leaves from the upper and the lower canopy, which could influence the relationships of chlorophyll content and spectral indices differently among the canopy layers. The performance of indices based on the NIR band at 800 nm and chlorophyll absorption band at 670 or 680 nm was particularly weak, in contrast to indices, including reflectance intensities at the red edge.
The weak performance of indices based on wavelengths at chlorophyll maximum absorption at 670–680 nm and the observed variation in the red edge position among canopy layers and cardinal directions suggest that different variants of commonly used NDVI indices may exhibit within-tree variation. The NDVI 680, 780 index did not show significant difference among the canopy layers, but the index based on location of the red edge, including reflectance intensities at 705 and 750 nm (NDVI 705, 750), did, with values increasing from the lower to the upper canopy, corresponding to the concurrent chlorophyll content gradient. For the cardinal directions, the NDVI 705, 750 showed significant differences among the cardinal directions only in the lower canopy, as was also found for the chlorophyll and nitrogen contents. As in the estimation of chlorophyll content with various reflectance indices, the indices, including red edge wavebands, appeared to correspond better to the leaf trait variation. Since we found the green wavebands to be significant in various aspects of within-individual spectral reflectance variation, we also explored the commonly used PRI index in a similar manner. The PRI varied significantly among the canopy layers, the upper canopy having the highest values, which is consistent with the findings of Gamon and Berry [80]. Variation in the cardinal directions was significant in the upper and lower canopy with the highest PRI values in the leaves from the west likely due to differences in directional irradiance patterns and the extent of shading [36].
5. Conclusions
Our study utilized proximal sensing instruments in the laboratory to acquire the hyperspectral reflectance images of silver birch leaves for estimating the variation among the canopy layers, cardinal directions, and among the trees. This study quantifies in detail the within-tree variation in silver birch stands, which are representative of deciduous trees in the boreal forest. The largest variation was among the canopy layers. However, a smaller yet clear variation was observed among the trees. The variation of the canopy layers is probably related to the light availability in the microenvironment. From the remote sensing perspective, the green hump and red edge were the most significant in separating the canopy layers. However, in the SWIR region, the most important separating wavelengths fall outside of the atmospheric window. Yet, these regions are influential in proximal sensing. Our study has important implications for the effect of the cardinal direction within each canopy layer, especially if the studies are conducted on the less dense forest where the canopy reflectance is affected by the middle and lower canopies. We conclude that for the assessment of leaf traits and spectral reflectance, the canopy layer should be taken into account in the sampling protocol. The results may help to improve physical models of leaf, canopy, and ecosystem processes for photosynthesis and energy exchange. Reliable data from detailed studies within and among individual tree species is not readily available as few studies have been conducted. There is a need for further studies to assist in the development of remote sensing.
Supplementary Materials
The following are available online at https://0-www-mdpi-com.brum.beds.ac.uk/2072-4292/11/24/2884/s1, Figure S1: (a) Samples of silver birch leaves and (b)imaging set up, Figure S2. (a) Transmittance spectra of glass used for image scanning and (b) reflectance spectra from the plywood plate painted with Maston 100 series Matt black, Figure S3. PLS-DA for classification of cardinal direction (a) middle canopy and (b) lower canopy.
Author Contributions
M.D. conducted the investigation, analysis, funding acquisition, prepared the original draft, and did the reviewing and editing. L.F. contributed to the methodology and reviewing and editing. S.K.-S. contributed to the reviewing, editing, and supervision. M.K. supervised the study, contributed to the reviewing, editing, and funding acquisition. E.O. contributed to the funding acquisition, supervised the study, and closely followed the writing of the final draft. All co-authors contributed to the conceptualizations of the research and to the improvement of the final draft.
Funding
This study is part of the Academy of Finland, BETUMICS project 284931 and European Union Structural Funds project “Spectral imaging and analysis in environmental and industrial applications” funded by the Finnish Funding Agency for Innovation (Tekes), filing number 70005/13. The study was supported by the Juho and Lempi Pitkänen Fund (project 69247). The funding for result analysis and manuscript preparation was from Niemi Foundation, project 20170014 and 20180031.
Acknowledgments
We acknowledge Flobert Ndah and Subramaniam Puvanenthirarajah for sample collection in the field and laboratory assistance and the staff of Botania for their support in the field site. We would like to thank Sari Kontunen-Soppela for providing the field for the sample collection and for the useful discussions. We are grateful to the University of Eastern Finland for providing the opportunity to work in a cordial atmosphere. We thank the Academy of Finland Flagship for Photonics Research and Innovations (PREIN), decision 320166. We would like to express our gratitude towards the editors and anonymous reviewers for their insightful comments and constructive criticism.
Conflicts of Interest
The authors declare no conflict of interest. The funders have no role in the study design, data analysis methodology, or interpretation of results.
References
- Niinemets, Ü.; Keenan, T.F.; Hallik, L. A worldwide analysis of within canopy variations in leaf structural, chemical and physiological traits across plant functional types. New Phytol. 2015, 205, 973–993. [Google Scholar] [CrossRef] [PubMed] [Green Version]
- Niinemets, U. Photosynthesis and resource distribution through plant canopies. Plant Cell Environ. 2007, 30, 1052–1071. [Google Scholar] [CrossRef] [PubMed]
- Shvidenko, A.; Barber, C.V.; Persson, R.; Gonzalez, P.; Hassan, R.; Lakyda, P. Forest and Woodland Systems. In Current State & Trends Assessment of the Millennium Assessment; Island Press: Washington, DC, USA, 2005; Volume 1, pp. 587–621. [Google Scholar]
- Atkinson, M.D. Betula pendula Roth (B. verrucosa Ehrh) and B. pubescens Ehrh. J. Ecol. 1992, 80, 837–870. [Google Scholar] [CrossRef]
- Rijkers, T.; Pons, T.L.; Bongers, F. The effect of tree height and light availability on photosynthetic leaf traits of four neotropical species differing in shade tolerance. Funct. Ecol. 2000, 14, 77–86. [Google Scholar] [CrossRef]
- Niinemets, Ü.; Cescatti, A.; Rodeghiero, M.; Tosens, T. Complex adjustments of photosynthetic potentials and internal diffusion conductance to current and previous light availabilities and leaf age in Mediterranean evergreen species Quercus ilex. Plant Cell Environ. 2006, 29, 1159–1178. [Google Scholar] [CrossRef] [PubMed] [Green Version]
- Violle, C.; Enquist, B.J.; McGill, B.J.; Jiang, L.; Albert, C.H.; Hulshof, C.; Jung, V.; Messier, J. The return of the variance: Intraspecific variability in community ecology. Trends Ecol. Evol. 2012, 27, 244–252. [Google Scholar] [CrossRef]
- Deepak, M.; Lihavainen, J.; Keski-Saari, S.; Kontunen-Soppela, S.; Salojärvi, J.; Tenkanen, A.; Heimonen, K.; Oksanen, E.; Keinänen, M. Genotype-and provenance-related variation in the leaf surface secondary metabolites of silver birch. Can. J. For. Res. 2018, 48, 494–505. [Google Scholar] [CrossRef] [Green Version]
- Possen, B.J.H.M.; Anttonen, M.J.; Oksanen, E.; Rousi, M.; Heinonen, J.; Kostiainen, K.; Kontunen-Soppela, S.; Heiskanen, J.; Vapaavuori, E. Variation in 13 leaf morphological and physiological traits within a silver birch (Betula pendula) stand and their relation to growth. Can. J. For. Res. 2014, 44, 657–665. [Google Scholar] [CrossRef]
- Petruzzellis, F.; Palandrani, C.; Savi, T.; Alberti, R.; Nardini, A.; Bacaro, G. Sampling intraspecific variability in leaf functional traits: Practical suggestions to maximize collected information. Ecol. Evol. 2017, 7, 11236–11245. [Google Scholar] [CrossRef] [Green Version]
- Lichtenthaler, H.K.; Buschmann, C.; Döll, M.; Fietz, H.-J.; Bach, T.; Kozel, U.; Meier, D.; Rahmsdorf, U. Photosynthetic activity, chloroplast ultrastructure, and leaf characteristics of high-light and low-light plants and of sun and shade leaves. Photosynth. Res. 1981, 2, 115–141. [Google Scholar] [CrossRef]
- Lichtenthaler, H.K.; Marek, M.V.; Kalina, J.; Urban, O. Differences in pigment composition, photosynthetic rates and chlorophyll fluorescence images of sun and shade leaves of four tree species. J. Plant Physiol. Biochem. 2007, 45, 577–588. [Google Scholar] [CrossRef] [PubMed]
- Hikosaka, K. Optimal nitrogen distribution within a leaf canopy under direct and diffuse light. Plant Cell Environ. 2014, 37, 2077–2085. [Google Scholar] [CrossRef] [PubMed]
- Lichtenthaler, H.K.; Babani, F.; Langsdorf, G. Chlorophyll fluorescence imaging of photosynthetic activity in sun and shade leaves of trees. Photosynth. Res. 2007, 93, 235–244. [Google Scholar] [CrossRef] [PubMed]
- Gara, T.W.; Darvishzadeh, R.; Skidmore, A.K.; Wang, T. Impact of Vertical Canopy Position on Leaf Spectral Properties and Traits across Multiple Species. Remote Sens. 2018, 10, 346. [Google Scholar] [CrossRef] [Green Version]
- Poorter, L.; Oberbauer, S.F.; Clark, D.B. Leaf optical properties along a vertical gradient in a tropical rainforest canopy in Costa Rica. Am. J. Bot. 1995, 82, 1257–1263. [Google Scholar] [CrossRef]
- Atherton, J.; Olascoaga, B.; Alonso, L.; Porcar-Castell, A. Spatial variation of leaf optical properties in a boreal forest is influenced by species and light environment. Front. Plant Sci. 2017, 8, 309. [Google Scholar] [CrossRef] [Green Version]
- Scartazza, A.; Di Baccio, D.; Bertolotto, P.; Gavrichkova, O.; Matteucci, G. Investigating the European beech (Fagus sylvatica L.) leaf characteristics along the vertical canopy profile: Leaf structure, photosynthetic capacity, light energy dissipation and photoprotection mechanisms. Tree Physiol. 2016, 36, 1060–1076. [Google Scholar] [CrossRef] [Green Version]
- Sellin, A.; Rosenvald, K.; Õunapuu-Pikas, E.; Tullus, A.; Ostonen, I.; Lõhmus, K. Elevated air humidity affects hydraulic traits and tree size but not biomass allocation in young silver birches (Betula pendula). Front. Plant Sci. 2015, 6, 860. [Google Scholar] [CrossRef] [Green Version]
- Khavaninzadeh, A.R.; Veroustraete, F.; Van Wittenberghe, S.; Verrelst, J.; Samson, R. Leaf reflectance variation along a vertical crown gradient of two deciduous tree species in a Belgian industrial habitat. Environ. Pollut. 2015, 204, 324–332. [Google Scholar] [CrossRef]
- Buajan, S.; Jinfu, L.; ZhongSheng, H.; XuePing, F.; Muhammad, A. The effect of light on microenvironment and specific leaf area within the gap, subtropical forest. China Pak. J. Bot. 2017, 49, 273–282. [Google Scholar]
- Carswell, F.E.; Meir, P.; Wandelli, E.V.; Bonates, L.C.M.; Kruijt, B.; Barbosa, E.M.; Nobre, A.D.; Grace, J.; Jarvis, P.G. Photosynthetic capacity in a central Amazonian rain forest. Tree Physiol. 1999, 20, 179–186. [Google Scholar] [CrossRef] [PubMed] [Green Version]
- Gates, D.M.; Keegan, H.J.; Schleter, J.C.; Weidner, V.R. Spectral properties of plants. Appl. Opt. 1965, 4, 11–20. [Google Scholar] [CrossRef]
- Knipling, E.B. Physical and physiological basis for the reflectance of visible and near-infrared radiation from vegetation. Remote Sens. Environ. 1970, 1, 155–159. [Google Scholar] [CrossRef]
- Ollinger, S.V. Sources of variability in canopy reflectance and the convergent properties of plants. New Phytol. 2010, 189, 375–394. [Google Scholar] [CrossRef] [PubMed]
- Hovi, A.; Raitio, P.; Rautiainen, M. A spectral analysis of 25 boreal tree species. Silva Fennica 2017, 51, 4. [Google Scholar] [CrossRef] [Green Version]
- Cavender-Bares, J.; Meireles, J.; Couture, J.; Kaproth, M.; Kingdon, C.; Singh, A.; Serbin, S.; Center, A.; Zuniga, E.; Pilz, G.; et al. Associations of leaf spectra with genetic and phylogenetic variation in oaks: Prospects for remote detection of biodiversity. Remote Sens. 2016, 8, 221. [Google Scholar] [CrossRef] [Green Version]
- Danusevicius, D.; Masaitis, G.; Mozgeris, G. Visible and near infrared hyperspectral imaging reveals significant differences in needle reflectance among Scots pine provenances. Silvae Genet. 2014, 63, 169–180. [Google Scholar] [CrossRef] [Green Version]
- Čepl, J.; Stejskal, J.; Lhotáková, Z.; Holá, D.; Korecký, J.; Lstibůrek, M.; Tomášková, I.; Kočová, M.; Rothová, O.; Palovská, M.; et al. Heritable variation in needle spectral reflectance of Scots pine (Pinus sylvestris L.) peaks in red edge. 2018. Remote Sens. Environ. 2018, 219, 89–98. [Google Scholar] [CrossRef]
- Baránková, B.; Lazár, D.; Nauš, J. Analysis of the effect of chloroplast arrangement on optical properties of green tobacco leaves. Remote Sens. Environ. 2016, 174, 181–196. [Google Scholar] [CrossRef]
- Carter, G.A. Ratios of leaf reflectances in narrow wavebands as indicators of plant stress. Remote Sens. 1994, 15, 697–703. [Google Scholar] [CrossRef]
- Lukeš, P.; Stenberg, P.; Rautiainen, M.; Mõttus, M.; Vanhatalo, K.M. Optical properties of leaves and needles for boreal tree species in Europe. Remote Sens. Lett. 2013, 4, 667–676. [Google Scholar] [CrossRef]
- Rautiainen, M.; Lukeš, P.; Homolová, L.; Hovi, A.; Pisek, J.; Mõttus, M. Spectral Properties of Coniferous Forests: A Review of In Situ and Laboratory Measurements. Remote Sens. 2018, 10, 207. [Google Scholar] [CrossRef] [Green Version]
- Sonobe, R.; Wang, Q. Hyperspectral indices for quantifying leaf chlorophyll concentrations performed differently with different leaf types in deciduous forests. Ecol. Inform. 2017, 37, 1–9. [Google Scholar] [CrossRef]
- Gamon, J.A.; Serrano, L.; Surfus, J.S. The photochemical reflectance index: An optical indicator of photosynthetic radiation-use efficiency across species, functional types, and nutrient levels. Oecologia 1997, 112, 492–501. [Google Scholar] [CrossRef]
- Gamon, J.A.; Bond, B. Effects of irradiance and photosynthetic downregulation on the photochemical reflectance index in Douglas-fir and ponderosa pine. Remote Sens. Environ. 2013, 135, 141–149. [Google Scholar] [CrossRef]
- Asner, G.P.; Martin, R.E.; Anderson, C.B.; Knapp, D.E. Quantifying forest canopy traits: Imaging spectroscopy versus field survey. Remote Sens. Environ. 2015, 158, 15–27. [Google Scholar] [CrossRef]
- Croft, H.; Chen, J.M. Leaf Pigment Content. In Reference Module in Earth Systems and Environmental Sciences; Elsevier: Oxford, UK, 2017. [Google Scholar] [CrossRef]
- Gitelson, A.A.; Viña, A.; Verma, S.B.; Rundquist, D.C.; Arkebauer, T.J.; Keydan, G. Relationship between gross primary production and chlorophyll content in crops: Implications for the synoptic monitoring of vegetation productivity. J. Geophys. Res. 2006, 111. [Google Scholar] [CrossRef] [Green Version]
- Sampson, P.H.; Zarco-Tejada, P.J.; Mohammed, G.H.; Miller, J.R.; Noland, T.L. Hyperspectral remote sensing of forest condition: Estimating chlorophyll content in tolerant hardwoods. For. Sci. 2003, 49, 381–391. [Google Scholar] [CrossRef]
- Gara, T.W.; Darvishzadeh, R.; Skidmore, A.K.; Wang, T.; Heurich, M. Accurate modelling of canopy traits from seasonal Sentinel-2 imagery based on the vertical distribution of leaf traits. ISPRS J. Photogramm. Remote Sens. 2019, 157, 108–123. [Google Scholar] [CrossRef]
- Weiskittel, A.R.; Temesgen, H.; Wilson, D.; Maguire, D.A. Sources of within-and between-stand variability in specific leaf area of three ecologically distinct conifer species. Ann. For. Sci. 2008, 65, 1–10. [Google Scholar] [CrossRef]
- Schittenhelm, J.; Toder, S.; Fath, S.; Westphal, S.; Wagner, E. Photoinactivation of catalase in needles of Norway spruce. Physiol. Plant. 1994, 90, 600–606. [Google Scholar] [CrossRef]
- Lhotáková, Z.; Albrechtová, J.; Malenovský, Z.; Rock, B.N.; Polák, T.; Cudlín, P. Does the azimuth orientation of Norway spruce (Picea abies/L./Karst.) branches within sunlit crown part influence the heterogeneity of biochemical, structural and spectral characteristics of needles. Environ. Exp. Bot. 2007, 59, 283–292. [Google Scholar] [CrossRef] [Green Version]
- Heimonen, K.; Valtonen, A.; Kontunen-Soppela, S.; Keski-Saari, S.; Rousi, M.; Oksanen, E.; Roininen, H. Colonization of a host tree by herbivorous insects under a changing climate. Oikos 2015, 124, 1013–1022. [Google Scholar] [CrossRef]
- Cerovic, Z.G.; Ben Ghozlen, N.; Milhade, C.; Obert, M.; Debuisson, S.; Le Moigne, M. Nondestructive diagnostic test for nitrogen nutrition of grapevine (Vitis vinifera L.) based on Dualex leaf-clip measurements in the field. J. Agric. Food Chem. 2015, 63, 3669–3680. [Google Scholar] [CrossRef]
- Schlemmer, M.; Gitelson, A.; Schepers, J.; Ferguson, R.; Peng, Y.; Shanahan, J.; Rundquist, D. Remote estimation of nitrogen and chlorophyll contents in maize at leaf and canopy levels. Int. J. Appl. Earth Obs. Geoinf. 2013, 25, 47–54. [Google Scholar] [CrossRef] [Green Version]
- Carter, G.A.; Knapp, A.K. Leaf optical properties in higher plants: Linking spectral characteristics to stress and chlorophyll concentration. Am. J. Bot. 2001, 88, 677–684. [Google Scholar] [CrossRef] [PubMed] [Green Version]
- Miller, J.R.; Hare, E.W.; Wu, J. Quantitative characterisation of the red edge reflectance 1. An inverted-Gaussian model. Int. J. Remote Sens. 1990, 11, 1755–1773. [Google Scholar] [CrossRef]
- Boochs, F.; Kupfer, G.; Dockter, K.; Kuhbauch, W. Shape of the red edge as vitality indicator for plants. Int. J. Remote Sens. 1990, 11, 1741–1753. [Google Scholar] [CrossRef]
- Gitelson, A.A.; Buschmann, C.; Lichtenthaler, H.K. The chlorophyll fluorescence ratio F-735/F-700 as an accurate measure of the chlorophyll content in plants. Remote Sens. Environ. 1999, 69, 296–302. [Google Scholar] [CrossRef]
- Datt, B. Remote sensing of chlorophyll a, chlorophyll b, chlorophyll a+b, and total carotenoid content in eucalyptus leaves. Remote Sens. Environ. 1998, 66, 111–121. [Google Scholar] [CrossRef]
- Chappelle, E.W.; Kim, M.S.; McMurtrey, J.E. Ratio analysis of reflectance spectra (RARS): An algorithm for the remote estimation of the concentrations of chlorophyll a, chlorophyll b, and carotenoids in soybean leaves. Remote Sens. Environ. 1992, 39, 239–247. [Google Scholar] [CrossRef]
- Birth, G.; McVey, G. Measuring the color of growing turf with a reflectance spectrophotometer. Agron. J. 1968, 60, 640–643. [Google Scholar] [CrossRef]
- Datt, B. A new reflectance index for remote sensing of chlorophyll content in higher plants: Tests using eucalyptus leaves. J. Plant Physiol. 1999, 154, 30–36. [Google Scholar] [CrossRef]
- Zarco-Tejada, P.J.; Berni, J.A.J.; Suarez, L.; Sepulcre-Canto, G.; Morales, F.; Miller, J.R. Imaging chlorophyll fluorescence with an airborne narrow-band multispectral camera for vegetation stress detection. Remote Sens. Environ. 2009, 113(6), 1262–1275. [Google Scholar] [CrossRef]
- Gong, Z.; Zhao, Y.; Zhao, W.; Lin, C. Estimation model for plant leaf chlorophyll content based on the spectral index content. Acta Ecol. Sin. 2014, 34, 5736–5745. [Google Scholar]
- Blackburn, G.A. Quantifying chlorophylls and carotenoids at leaf and canopy scales: An evaluation of some hyperspectral approaches. Remote Sens. Environ. 1998, 66, 273–285. [Google Scholar] [CrossRef]
- Maccioni, A.; Agati, G.; Mazzinghi, P. New vegetation indices for remote measurement of chlorophylls based on leaf directional reflectance spectra. J. Photochem. Photobiol. B. 2001, 61, 52–61. [Google Scholar] [CrossRef]
- Gitelson, A.; Merzlyak, M.N. Spectral reflectance changes associated with autumn senescence of Aesculus hippocastanum L. and Acer platanoides L. leaves. Spectral features and relation to chlorophyll estimation. J. Plant Physiol. 1994, 143, 286–292. [Google Scholar] [CrossRef]
- Gitelson, A.A.; Gritz, Y.; Merzlyak, M.N. Relationships between leaf chlorophyll content and spectral reflectance and algorithms for non-destructive chlorophyll assessment in higher plant leaves. J. Plant Physiol. 2003, 160, 271–282. [Google Scholar] [CrossRef]
- Le Maire, G.; Francois, C.; Soudani, K.; Berveiller, D.; Pontailler, J.Y.; Breda, N.; Genet, H.; Davi, H.; Dufrene, E. Calibration and validation of hyperspectral indices for the estimation of broadleaved forest leaf chlorophyll content, leaf mass per area, leaf area index and leaf canopy biomass. Remote Sens. Environ. 2008, 112, 3846–3864. [Google Scholar] [CrossRef]
- Guan, L.; Liu, X. Hyperspectral recognition models for physiological ecology characterization of rice in Cd pollution stress. Ecol. Environ. Sci. 2009, 18, 488–493. [Google Scholar]
- Qi, J.; Chehbouni, A.; Huete, A.R.; Kerr, Y.H.; Sorooshian, S. A modified soil adjusted vegetation index. Remote Sens. Environ. 1994, 48, 119–126. [Google Scholar] [CrossRef]
- Wu, C.; Niu, Z.; Tang, Q.; Huang, W. Estimating chlorophyll content from hyperspectral vegetation indices: Modeling and validation. Agric. For. Meteorol 2008, 148, 1230–1241. [Google Scholar] [CrossRef]
- Tucker, C.J. Red and photographic infrared linear combinations for monitoring vegetation. Remote Sens. Environ. 1979, 8(2), 127–150. [Google Scholar] [CrossRef] [Green Version]
- Jolliffe, I. Principal Component Analysis, 2nd ed.; Springer: New York, NY, USA, 2002; pp. 1–9. [Google Scholar]
- Heim, R.H.-J.; Jürgens, N.; Große-Stoltenberg, A.; Oldeland, J. The effect of epidermal structures on leaf spectral signatures of ice plants (Aizoaceae). Remote Sens. 2015, 7, 16901–16914. [Google Scholar] [CrossRef] [Green Version]
- Kassambara, A. ggpubr: ‘ggplot2’ Based Publication Ready Plots. 2018. R Package Version 0.1.7. Available online: https://CRAN.R project.org/package=ggpubr (accessed on 30 September 2019).
- Curran, P.J.; Dungan, J.L.; Gholz, H.L. Exploring the relationship between reflectance red edge and chlorophyll content in slash pine. Tree Physiol. 1990, 7, 33–48. [Google Scholar] [CrossRef]
- Mutanga, O.; Skidmore, A.K. Red edge shift and biochemical content in grass canopies. ISPRS J. Photogramm. Remote Sens. 2007, 62, 34–42. [Google Scholar] [CrossRef]
- Le Maire, G.; François, C.; Dufrêne, E. Towards universal deciduous broad leaf chlorophyll indices using PROSPECT simulated database and hyperspectral reflectance measurements. Remote Sens. Environ. 2004, 89, 1–28. [Google Scholar] [CrossRef]
- Vogelman, T.C.; Rock, B.N.; Moss, D.M. Red edge spectral measurements from sugar maple leaves. Int. J. Remote Sens. 1993, 14, 1563–1575. [Google Scholar] [CrossRef]
- Schwanninger, M.; Stefke, B.; Hinterstoisser, B. Qualitative assessment of acetylated wood with infrared spectroscopic methods. J. Near Infrared Spectrosc. 2011, 19, 349. [Google Scholar] [CrossRef]
- Serbin, S.P.; Dillaway, D.N.; Kruger, E.L.; Townsend, P.A. Leaf optical properties reflect variation in photosynthetic metabolism and its sensitivity to temperature. J. Exp. Bot. 2011, 63, 489–502. [Google Scholar] [CrossRef] [PubMed] [Green Version]
- Gamon, J.A.; Somers, B.; Malenovsky, Z.; Middleton, E.M.; Rascher, U.; Schaepman, M.E. Assessing Vegetation Function with Imaging Spectroscopy. Surv. Geophys. 2019, 40, 489–513. [Google Scholar] [CrossRef] [Green Version]
- Serbin, S.P.; Singh, A.; Mcneil, B.E.; Kingdon, C.C.; Townsend, P.A. Spectroscopic determination of leaf morphological and biochemical traits for northern temperate and boreal tree species. Ecol. Appl. 2014, 24, 1651–1669. [Google Scholar] [CrossRef] [PubMed] [Green Version]
- Campbell, J.B. Introduction to Remote Sensing, 3rd ed.; Taylor and Francis: New York, NY, USA, 2002; pp. 1–9. [Google Scholar]
- Kubiske, M.E.; Pregitzer, K.S. Ecophysiological responses to simulated canopy gaps of two tree species of contrasting shade tolerance in CO2. Funct. Ecol. 1997, 11, 24–32. [Google Scholar] [CrossRef]
- Gamon, J.A.; Berry, J.A. Facultative and constitutive pigment effects on the Photochemical Reflectance Index (PRI) in sun and shade conifer needles. ISRJ Plant Sci. 2012, 60, 85–95. [Google Scholar] [CrossRef]
Figure 1.
(a) Average adaxial foliar reflectance spectra of three silver birch trees at different canopy layers in the wavelength range of 482 to 2307 nm) and (b) standard deviation of the five points smoothed first derivative preprocessed reflectance spectra of three silver birch trees at different canopy layers.

Figure 2.
Scatter plots depicting the dissimilarity of foliar reflectance profiles in visible and near-infrared (VNIR) and short wave infrared (SWIR) range for principal component analysis (PCA) among (a) the canopy layers and (b) among the three different trees, and for partial least squares discriminant analysis (PLS-DA) among (c) the canopy layers and (d) among the three different trees.

Figure 3.
Influential wavelengths from the variable importance in projection (VIP) scores of PLS-DA separating three canopy layers.
Figure 3.
Influential wavelengths from the variable importance in projection (VIP) scores of PLS-DA separating three canopy layers.

Figure 4.
p-values for the difference in mean spectral reflectance ranging from 482 to 2307 nm (a) among canopy layers based on the ANOVA test and (b) between every combination of the canopy layers by Tukey’s post-hoc pairwise comparison. The p-value of 0.05 with dotted lines.
Figure 4.
p-values for the difference in mean spectral reflectance ranging from 482 to 2307 nm (a) among canopy layers based on the ANOVA test and (b) between every combination of the canopy layers by Tukey’s post-hoc pairwise comparison. The p-value of 0.05 with dotted lines.

Figure 5.
p-values for the difference among cardinal directions for mean spectral reflectance of each canopy layer (the upper, middle, and lower canopy) based on the ANOVA test. The p-value of 0.05 with dotted lines.
Figure 5.
p-values for the difference among cardinal directions for mean spectral reflectance of each canopy layer (the upper, middle, and lower canopy) based on the ANOVA test. The p-value of 0.05 with dotted lines.

Figure 6.
Mean of first derivative spectral reflectance of red edge inflection point (REIP) at (a) canopy layers and (b) cardinal direction in the upper, (c) middle, and (d) lower canopy layers.
Figure 6.
Mean of first derivative spectral reflectance of red edge inflection point (REIP) at (a) canopy layers and (b) cardinal direction in the upper, (c) middle, and (d) lower canopy layers.

Figure 7.
Normalized difference vegetation indices (NDVI) and photochemical reflectance index (PRI) for the cardinal directions across the canopy layers (a) NDVI 680, 780), (b) NDVI 705, 750, and (c) PRI 531, 570.
Figure 7.
Normalized difference vegetation indices (NDVI) and photochemical reflectance index (PRI) for the cardinal directions across the canopy layers (a) NDVI 680, 780), (b) NDVI 705, 750, and (c) PRI 531, 570.

Figure 8.
Notch plot for leaf traits across the canopy layers (a) chlorophyll, (b) nitrogen, (c) dry weight, (d) water content, (e) leaf area, and (f) SLA. Statistically significant effects for canopy layers were test by ANOVA **** p < 0.0001, ***p < 0.001, **p < 0.01, *p < 0.05.
Figure 8.
Notch plot for leaf traits across the canopy layers (a) chlorophyll, (b) nitrogen, (c) dry weight, (d) water content, (e) leaf area, and (f) SLA. Statistically significant effects for canopy layers were test by ANOVA **** p < 0.0001, ***p < 0.001, **p < 0.01, *p < 0.05.

Figure 9.
Notch plot for canopy layers across the cardinal directions for (a) chlorophyll, (b) nitrogen, (c) water content, and (d) SLA. Statistically significant effects for canopy layers were tested by ANOVA *p < 0.5.
Figure 9.
Notch plot for canopy layers across the cardinal directions for (a) chlorophyll, (b) nitrogen, (c) water content, and (d) SLA. Statistically significant effects for canopy layers were tested by ANOVA *p < 0.5.


Table 1.
Hyperspectral indices used in this study.
| Index | Formula | Reference |
|---|---|---|
| Carter | R550 | Carter and Knapp,2001 [48] |
| D2 | D720 | Miller et al., 1990 [49] |
| D1 | D703 | Boochs et al., 1990 [50] |
| Gitel1 | 1/R700 | Gitelson et al., 1999 [51] |
| SR1 | R750/R700 | Datt, 1998 [52] |
| SR2 | R750/R550 | Datt, 1998 [52] |
| SR3 | R675/R700 | Chappelle et al., 1992 [53] |
| SR4 | R695/R670 | Carter, 1994 [31] |
| SR5 | R710/R760 | Carter, 1994 [31] |
| SR6 | R695/R760 | Carter, 1994 [31] |
| SR7 | R605/R760 | Carter, 1994 [31] |
| SR8 | R800/R680 | Birth and McVey, 1968 [54] |
| SR9 | R672/R550 | Datt 1998 [52] |
| SR10 | R850/R710 | Datt, 1999 [55] |
| Datt1 | R860/(R550*R708) | Datt,1998 [52] |
| Datt2 | R672/(R550*R708) | Datt,1998 [52] |
| C1 | R675*R690/R2683 | Zarco-Tejada et al., 2009 [56] |
| NDVI1 | (R565-R735)/(R565+R735) | Gong et al., 2014 [57] |
| NDVI2 | (R800-R680)/(R800+R680) | Blackburn, 1998 [58] |
| NDVI3 | (R780-R710)/(R780-R680) | Maccioni et al., 2001 [59] |
| ND14 | (R850-R710)/(R850-R680) | Datt, 1999 [55] |
| NDVI 705, 750 | (R750-R705)/(R750+R705) | Gitelson and Merzlyak, 1994 [60] |
| Gitel | (R750-R800)/(R695-R740)-1 | Gitelson et al., 2003 [61] |
| DDn | 2*(R710-R(710-50)-R(710+50) | le Maire et al.,2008 [62] |
| MCARI1 | 1.5[1.2(R712-R670)-0.5(R712-R550)](R712/R670) | Guan and Liu, 2009 [63] |
| MSAVI | 0.5*(2*R800+1-SQRT((2*R800+1)2-8*(R800-R670))) | Qi et al., 1994 [64] |
| MCARI2 | ((R750-R705)-0.2*(R750-R550))*(R750/R705) | Wu et al., 2008 [65] |
| OSAVI1 | (1+0.16)*(R750-R705)/(R750+R705+0.16) | Wu et al., 2008 [65] |
| MCARI1/MSAVI | MCARI1/MSAVI | Guan and Liu, 2009 [63] |
| MCARI2/MSAVI | MCARI2/MSAVI | Wu et al., 2008 [65] |
| NDVI 680, 780 | ((R780-R680)/(R780+R680)) | Tucker, 1979 [66] |
| PRI 531, 570 | ((R531-R570)/(R531+R570)) | Gamon and Bond, 2013 [36] |
Table 2.
Hyperspectral indices for quantifying chlorophyll in three trees separately for the total canopy and along the canopy layers separately (the upper and the lower layer). Linear regression indicating the relationship (R2) between the spectral indices and chlorophyll content (Dualex values) with significant ones in bold.
| Index | R2 Total | R2 Upper Canopy | R2 Lower Canopy | ||||||
|---|---|---|---|---|---|---|---|---|---|
| Tree1 | Tree2 | Tree3 | Tree1 | Tree2 | Tree3 | Tree1 | Tree2 | Tree3 | |
| Carter | 0.430 | 0.278 | 0.438 | 0.550 | 0.562 | 0.369 | 0.243 | 0.065 | 0.089 |
| D2 | 0.436 | 0.299 | 0.508 | 0.610 | 0.717 | 0.389 | 0.175 | 0.037 | 0.187 |
| D1 | 0.425 | 0.271 | 0.511 | 0.569 | 0.647 | 0.398 | 0.207 | 0.062 | 0.056 |
| Gitel1 | 0.414 | 0.279 | 0.428 | 0.522 | 0.617 | 0.350 | 0.198 | 0.066 | 0.083 |
| SR1 | 0.437 | 0.298 | 0.455 | 0.568 | 0.671 | 0.370 | 0.195 | 0.059 | 0.106 |
| SR2 | 0.455 | 0.313 | 0.468 | 0.602 | 0.627 | 0.396 | 0.218 | 0.060 | 0.095 |
| SR3 | 0.437 | 0.292 | 0.485 | 0.538 | 0.636 | 0.281 | 0.191 | 0.060 | 0.063 |
| SR4 | 0.439 | 0.278 | 0.478 | 0.53 | 0.639 | 0.279 | 0.222 | 0.066 | 0.086 |
| SR5 | 0.452 | 0.296 | 0.494 | 0.612 | 0.715 | 0.404 | 0.212 | 0.056 | 0.120 |
| SR6 | 0.411 | 0.267 | 0.363 | 0.500 | 0.55 | 0.284 | 0.217 | 0.06 | 0.128 |
| SR7 | 0.394 | 0.242 | 0.356 | 0.493 | 0.411 | 0.271 | 0.22 | 0.047 | 0.120 |
| SR8 | 0.008 | 0.005 | 0.001 | 0.009 | 0.031 | 0.025 | 0.007 | 0.004 | 0.029 |
| SR9 | 0.459 | 0.310 | 0.472 | 0.595 | 0.649 | 0.261 | 0.212 | 0.063 | 0.047 |
| SR10 | 0.458 | 0.310 | 0.506 | 0.615 | 0.737 | 0.421 | 0.202 | 0.056 | 0.104 |
| Datt1 | 0.446 | 0.308 | 0.476 | 0.588 | 0.67 | 0.403 | 0.201 | 0.062 | 0.08 |
| Datt2 | 0.458 | 0.313 | 0.529 | 0.616 | 0.699 | 0.377 | 0.201 | 0.064 | 0.072 |
| C1 | 0.428 | 0.254 | 0.482 | 0.562 | 0.604 | 0.245 | 0.220 | 0.055 | 0.071 |
| NDVI1 | 0.441 | 0.290 | 0.469 | 0.585 | 0.563 | 0.390 | 0.225 | 0.056 | 0.113 |
| NDVI2 | 0.009 | 0.005 | 0.001 | 0.013 | 0.030 | 0.021 | 0.008 | 0.003 | 0.036 |
| NDVI3 | 0.457 | 0.299 | 0.518 | 0.625 | 0.733 | 0.405 | 0.214 | 0.057 | 0.112 |
| ND14 | 0.460 | 0.301 | 0.521 | 0.620 | 0.740 | 0.408 | 0.218 | 0.057 | 0.110 |
| NDVI 705, 750 | 0.448 | 0.296 | 0.486 | 0.599 | 0.701 | 0.397 | 0.208 | 0.057 | 0.119 |
| Gitel | 0.342 | 0.268 | 0.261 | 0.292 | 0.526 | 0.184 | 0.187 | 0.067 | 0.006 |
| DDn | 0.465 | 0.306 | 0.518 | 0.638 | 0.754 | 0.418 | 0.213 | 0.055 | 0.125 |
| MCARI1 | 0.434 | 0.272 | 0.484 | 0.541 | 0.617 | 0.298 | 0.224 | 0.064 | 0.058 |
| MSAVI | 0.178 | 0.021 | 0.001 | 0.008 | 0.110 | 0.023 | 0.001 | 0.022 | 0.068 |
| MCARI2 | 0.458 | 0.311 | 0.500 | 0.62 | 0.736 | 0.411 | 0.19 | 0.049 | 0.128 |
| OSAVI1 | 0.450 | 0.300 | 0.491 | 0.609 | 0.713 | 0.401 | 0.207 | 0.055 | 0.128 |
| MCARI1/MSAVI | 0.449 | 0.284 | 0.501 | 0.584 | 0.670 | 0.331 | 0.226 | 0.062 | 0.074 |
| MCARI2/MSAVI | 0.457 | 0.312 | 0.504 | 0.62 | 0.745 | 0.410 | 0.182 | 0.045 | 0.139 |
© 2019 by the authors. Licensee MDPI, Basel, Switzerland. This article is an open access article distributed under the terms and conditions of the Creative Commons Attribution (CC BY) license (http://creativecommons.org/licenses/by/4.0/).
Share and Cite
MDPI and ACS Style
Deepak, M.; Keski-Saari, S.; Fauch, L.; Granlund, L.; Oksanen, E.; Keinänen, M. Leaf Canopy Layers Affect Spectral Reflectance in Silver Birch. Remote Sens. 2019, 11, 2884. https://0-doi-org.brum.beds.ac.uk/10.3390/rs11242884
AMA Style
Deepak M, Keski-Saari S, Fauch L, Granlund L, Oksanen E, Keinänen M. Leaf Canopy Layers Affect Spectral Reflectance in Silver Birch. Remote Sensing. 2019; 11(24):2884. https://0-doi-org.brum.beds.ac.uk/10.3390/rs11242884
Chicago/Turabian StyleDeepak, Maya, Sarita Keski-Saari, Laure Fauch, Lars Granlund, Elina Oksanen, and Markku Keinänen. 2019. "Leaf Canopy Layers Affect Spectral Reflectance in Silver Birch" Remote Sensing 11, no. 24: 2884. https://0-doi-org.brum.beds.ac.uk/10.3390/rs11242884
Note that from the first issue of 2016, this journal uses article numbers instead of page numbers. See further details here.