Article

Precipitation Characteristics at Two Locations in the Tropical Andes by Means of Vertically Pointing Micro-Rain Radar Observations

1
Institute for Modelling Hydraulic and Environmental Systems, University of Stuttgart, D-70569 Stuttgart, Germany
2
Laboratory for Climatology and Remote Sensing, Philipps-University Marburg, D-35032 Marburg, Germany
3
Institute for Environmental Sciences, Brandenburg University of Technology (BTU), Cottbus-Senftenberg, D-03013 Cottbus, Germany
4
Departamento de Recursos Hídricos y Ciencias Ambientales, Universidad de Cuenca, Cuenca EC010207, Ecuador
5
Centro de Investigación Ambiental para el Desarrollo, Universidad Nacional Santiago Antúnez de Mayolo, Huaraz 02002, Peru
6
Departamento de Recursos Hídricos y Ciencias Ambientales, and Facultad de Ingeniería, Universidad de Cuenca, Cuenca EC010207, Ecuador
7
Department of Geography, University of Zurich, CH-8057 Zurich, Switzerland
*
Author to whom correspondence should be addressed.
Remote Sens. 2019, 11(24), 2985; https://0-doi-org.brum.beds.ac.uk/10.3390/rs11242985
Submission received: 30 September 2019 / Revised: 4 December 2019 / Accepted: 4 December 2019 / Published: 12 December 2019
(This article belongs to the Special Issue Radar Meteorology)

Abstract

:
In remote areas with steep topography, such as the Tropical Andes, reliable precipitation data with a high temporal resolution are scarce. Therefore, studies focusing on the diurnal properties of precipitation are hampered. In this paper, we investigated two years of data from Micro-Rain Radars (MRR) in Cuenca, Ecuador, and Huaraz, Peru, from February 2017 to January 2019. This data allowed for a detailed study on the temporal precipitation characteristics, such as event occurrences and durations at these two locations. Our results showed that the majority of precipitation events had durations of less than 3 h. In Huaraz, precipitation has a distinct annual and diurnal cycle where precipitation in the rainy season occurred predominantly in the afternoon. These annual and diurnal cycles were less pronounced at the site in Cuenca, especially due to increased nocturnal precipitation events compared to Huaraz. Furthermore, we used a fuzzy logic classification of fall velocities and rainfall intensities to distinguish different precipitation types. This classification showed that nightly precipitation at both locations was predominantly stratiform, whereas (thermally induced) convection occurred almost exclusively during the daytime hours.

Graphical Abstract

1. Introduction

Precipitation is a major component in the hydrological cycle and characterized by a high temporal and spatial variability. This is especially true in areas with a pronounced topography, such as the Tropical Andes in South America. In this region, which is particularly exposed to climate change, water is of high socio-economic importance [1,2]. Several recent studies have addressed the challenges related to water resources management in the context of climate change and glacier recession in the Tropical Andes (e.g., [1,2,3,4,5,6]). Robust knowledge about highly resolved spatio-temporal precipitation processes and variability is crucial to understand existing and future water resources problems. However, high resolution precipitation studies are limited, and the lack of a dense precipitation measurement network is a major barrier to improve our understanding [7,8]. In addition, the limited number of available in situ observations does not account for the complex topography and the resulting high spatio-temporal precipitation variability in the Tropical Andes. Furthermore, uncertainties due to the data quality are frequent, especially from manned in situ stations [9].
Available precipitation data provided by the national weather services in Ecuador and Peru, as well as available data portals such as the one by Schwarb et al. [10] usually have a daily temporal resolution. However, investigating precipitation characteristics such as diurnally driven patterns, event durations, and intensities or precipitation types requires a temporal resolution higher than daily.
Weather and rainfall radar instruments are a promising approach to generate and analyze high resolution precipitation data and improve the understanding of precipitation characteristics and thus hydro-climatic implications. In the Tropical Andes, and more specifically in southern Ecuador, diurnal patterns and precipitation characteristics on the eastern slopes of the Andes were studied by Bendix et al. [11]. Rainfall behavior was found to be mostly of a stratiform character, but the influences of local convection were detected for afternoon events, as well as nocturnal events [12]. Another study in this area by Muñoz et al. [13] assessed the error of estimated rainfall intensities by means of rain gauges of different resolutions along an altitudinal gradient. As a reference, optical disdrometer data were used. Here, the percent absolute bias was largest for low rainfall intensities (≤2 mm h 1 ) and short time scales (≤10 min). In addition, no relation between rainfall depth and elevation was found. Recently, Orellana-Alvear et al. [14] analyzed different rainfall types based on the mean volume diameter (Dm) of raindrops at different locations in southern Ecuador. The authors found that rainfall was more convective at lower altitudes with shorter duration events, whereas very light rain (drizzle) was more common at the higher range. Furthermore, Rollenbeck and Bendix [15] used the information from an X-band local area weather radar (LAWR) for unveiling different weather situations that generate distinguished patterns of rainfall distribution in the high mountains of southern Ecuador.
The lack of high resolution precipitation data and monitoring in the Tropical Andes has been recognized, and efforts have been initiated to set up a radar weather network in the Tropical Andes (RadarNet-Sur), including the installation of new weather radars in southern Ecuador and recently in Piura, in northern Peru [16]. This extended weather radar network covers the complex transition zone from the coastal plains of southern Ecuador and Peru, across the Andean Cordillera to the eastern foot of the mountains and will improve the knowledge on regional rainfall extremes and the flow dynamics in the region. Several studies have been recently carried out using data from the RadarNet-Sur network. Orellana-Alvear et al. [14] derived several Z-R relationships for further radar quantitative precipitation estimation (QPE) using optical disdrometers. Here, a strong spatial variability of the Z-R relations was found within the radar extent. Furthermore, rainfall events and rainfall classes were derived from disdrometer data. Guallpa et al. [17] analyzed the impact of different spatial (100–500 m) and temporal (1–60 min) resolutions of radar data on the cumulative QPE. It was found that rain event features were properly captured at 1 min temporal resolution, which highlighted the strong variability of the rainfall in the region. Recently, Orellana-Alvear et al. [18] applied a machine learning model to optimize the QPE of the highest radar in the network. Although the results were promising (i.e., a correlation coefficient up to 0.83), the complex topography of the Andes remains an important factor that limits the accuracy of rainfall estimation in the area.
In the Andes of Peru, the lack of weather radars has thus far impeded improvement in the understanding of small scale rainfall processes, which limits further studies in the field of hydro-climatology. To our knowledge, the only study thus far based on radar data was conducted by Endries et al. [8], who studied the temporal characteristics and vertical structure of precipitation in Cusco, Peru (and in La Paz, Bolivia) using a Micro-Rain Radar (MRR) and local in situ measurements and calculated backward trajectories of low level air masses for selected events. Further studies that analyzed precipitation dynamics along the western slopes of the Peruvian Andes utilized information from daily observations and a numerical weather model from the Lima region [19] and conducted a comparison of in situ measurement based gridded precipitation datasets, remote sensing products, and WRF numerical weather model outputs in the Cordillera Blanca, to investigate the diurnal precipitation cycle at high spatial (3 km) and temporal (hourly) resolution [20].
Nearly all of the analyses on rainfall dynamics described above fell short of explaining the underlying processes of rainfall types. This is mainly due to missing vertical information on the development of rainfall events at high temporal resolution. With the recently installed vertically pointing Micro-Rain Radars (MRR) in Huaraz, Peru, and Cuenca, Ecuador, a systematic analysis of rainfall types and their dynamics is possible for the first time. The continuous two year MRR datasets with a temporal resolution of 1 min allow for a detailed examination of event based precipitation duration and intensities, which is hampered using global satellite products or common rain gauges on a daily basis only. Thus, the main aims of our study are: (i) to identify the temporal precipitation characteristics and climatology at the two sites of the Andean Cordillera; (ii) to detect temporal highly resolved precipitation events and to relate these events to different precipitation types using a classification based on a fuzzy rule system (FRS). The paper is structured as follows: Section 2 gives an overview of the study areas, their general climatological features, and the related environmental circulation patterns, followed by the data and methods used for the classification of precipitation characteristics. In Section 4.1, the precipitation events are examined in the context of their temporal characteristics, such as occurrence and event durations. In Section 4.2, we show typical case studies for different precipitation types and present the results of the precipitation classification, followed by a discussion and conclusions.

2. Study Area

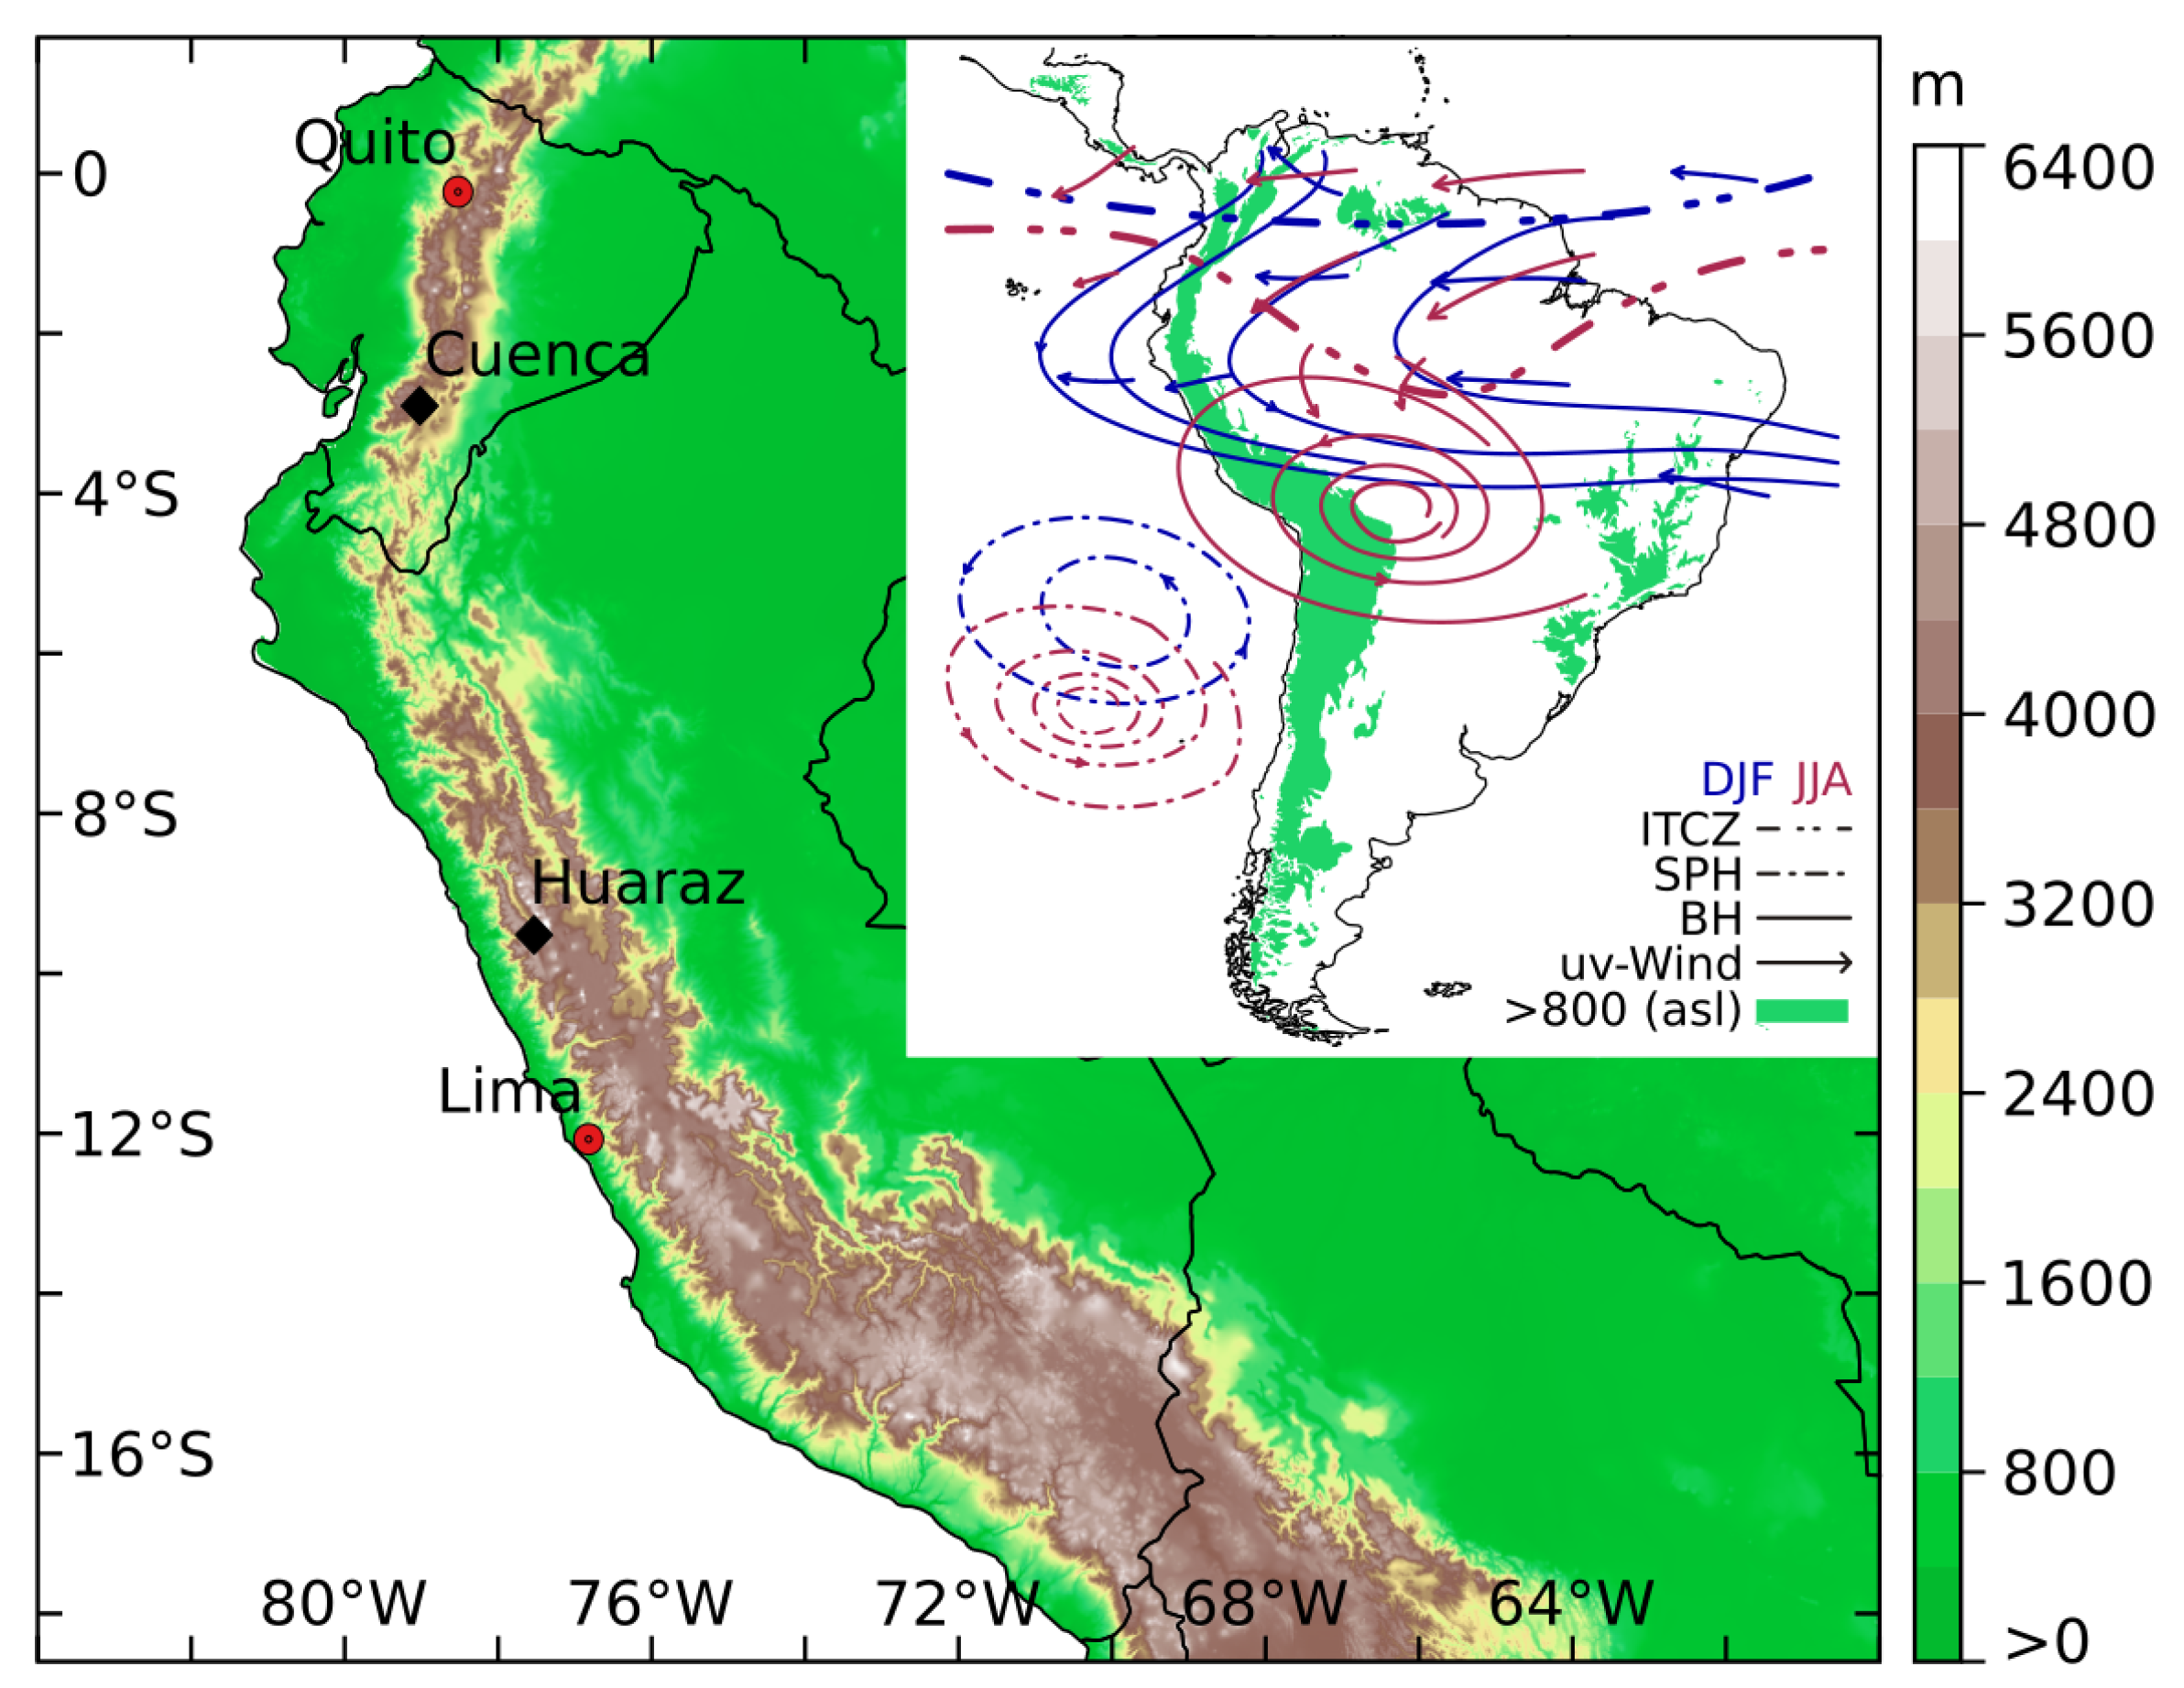
The main study area is located in the Tropical Andes as illustrated in Figure 1 with the locations of the MRR in Cuenca, Ecuador, and Huaraz, Peru. The general climate at both sites is determined by the South American monsoon system [21,22,23,24], among others, driven by the seasonal cycle of the large scale circulation patterns and the inter-hemispherical migration of the Inter-Tropical Convergence Zone (ITCZ). During the austral summer season (December–February, DJF), a high pressure system, i.e., the Bolivian High (BH), is developed in the upper troposphere near 20 S and 60 W [23]. In the lower troposphere, the ITCZ is located in the Southern Hemisphere, resulting in an easterly moisture transport from the Amazon Basin to the Andes Mountains, which act as a barrier. The low tropospheric easterly trade winds impinging this terrain cause an orographic enhancement of precipitation formation, which generates a climate divide between the eastern and western escarpment [25,26]. In contrast, the western slopes are under the influence of the South Pacific High Pressure System (SPH), which induces stable and, thus, drier conditions [27]. In the austral winter months (June–August, JJA), the ITCZ, as well as the SPH are shifted northward, and the central Andes experience their main dry season. The SPH causes large scale subsidence, which inhibits deep convection. Additionally, a strong westerly flow in the upper atmosphere blocks the transport of moisture from the Amazon. These conditions contrast with the northern Andes, which experience rainy periods due to prevailing easterlies [28].
Cuenca is situated in the eastern fringe of the western Andean Cordillera in southern Ecuador in an inter-Andean depression downstream of the tributaries of the main rivers that cross the city. This inter-Andean depression constitutes the low part of an altitudinal gradient that ranges up to 4100 m a.s.l. The climate is characterized by a bimodal rainfall pattern with two wet seasons (MAM and SON). Cuenca has a mean annual precipitation of 969 mm [14] and a mean temperature of 14 C [29].
The city of Huaraz is located in the inter-Andean valley of the Rio Santa between the Cordillera Blanca, with some of the highest mountains in Peru (up to 6700 m) and the Cordillera Negra in the Province of Ancash. The climate in this area is characterized by a wet (DJF) and a dry season (JJA) as well, and the average temperatures in Huaraz are around 15 C all year round [30]. The precipitation amounts in this region show a pronounced gradient from the mountain ranges of the Cordillera Blanca with up to 1000 mm per year [20] to the coastal desert areas along the Pacific Ocean. In Huaraz, the annual precipitation sum varies between 600 and 1000 mm (based on the PISCO V2.1 dataset [31]).

3. Data and Methods

3.1. Micro-Rain Radar

The MRR is a vertically pointing frequency modulated continuous wave (FMCW) radar, which operates at 24.1 GHz. From the measured Doppler spectra, parameters like drop size spectra, radar reflectivity factors, liquid water content, and rain rates are derived for 31 gates [32,33]. The MRR in Cuenca was deployed in January 2017 and is situated at the Balzay Campus of Universidad de Cuenca at an elevation of 2610 m above sea level (a.s.l.). The analyzed data are comprised of the period from 1 February 2017 until 31 January 2019. Data from the same period were also used from the MRR located in Huaraz at 3050 m a.s.l., which was installed at the Universidad Nacional Santiago Antúnez de Mayolo (UNASAM) at the end of January 2017. For both MRR, the height resolution was set to 100 m, resulting in a vertical extent of 3100 m above ground level (a.g.l.) at the measurement sites. The data were averaged to 1 min by the manufacturers’ processing software and used for the subsequent analyses. For the identification of rainfall, the rainfall intensities from the third range gate (200–300 m a.g.l.) were used. The lower range gates are usually excluded from any further analysis [32]. Due to occasional power failures and hardware/computer problems, both datasets exhibit several data gaps. Therefore, we performed a specific gap filling for both datasets. For the Cuenca MRR, the data from a collocated tipping bucket rain gauge (TBR) with a 5 min temporal resolution was used to infill the gaps in the derived rain rates of MRR. In order to assess the errors introduced by this infilling, we compared the time periods where both devices had valid data (Figure 2). The MRR systematically underestimates the precipitation amounts (hourly sums), but shows some outliers towards higher sums. The indicator correlation (rain/no rain) between the hourly MRR and TBR data was 0.98.
The MRR data from Huaraz had fewer and shorter gaps than the Cuenca data, but at this site, no reliable precipitation measurements in the vicinity were available for any further gap filling. Most of the data gaps in the Huaraz data were below 10 min. In those cases, the rain rate was interpolated linearly from the neighboring values, resulting in 0 mm when no precipitation was recorded by the MRR before and after these gaps. Most of the remaining data gaps below two hours occurred during the dry season or in the morning hours when the rainfall probability was very low. These gaps were set to 0 mm as well. After this procedure, six larger data gaps with durations longer than two hours remained in the data, the longest one was for more than five days at the beginning of September 2018. Table 1 gives an overview of the data gaps in the 1 min MRR rain rates before and after infilling.

3.2. Data Analysis

Information about the temporal occurrence and duration of precipitation events was obtained from the gap filled MRR rain rates. A precipitation event was defined based on rain intensities and separation time as follows: rain intensities must be greater than 0.1 mm h 1 for each time step considered (i.e., 1 min), and the precipitation total must be greater than 0.2 mm over the duration of the corresponding event. Additionally, rain events were separated using a threshold of more than 20 min with less than 0.1 mm h 1 .
The classification and analysis of the precipitation types required the full information from the MRR data (i.e., the vertical fall velocity profiles and drop size distributions); therefore, the precipitation type analysis (cf. Section 4.2) was done based on the original MRR data without any infilling (cf. Table 1).
The characteristics of precipitation types are often determined on the basis of rain intensities [34], fall velocities [35], radar reflectivities [36], drop size distributions [37,38,39,40], or a combination of two or more of these parameters [38,41,42]. In case vertical reflectivity profiles from radar are available, the presence or absence of a melting layer (“bright band”) is a further prominent indicator to discriminate between stratiform and convective precipitation [42,43]. In our study, we used an approach based on vertical fall velocity profiles and a fuzzy rule system (FRS). An evaluation of the vertical fall velocity and reflectivity profiles of the 2 year MRR data showed that due to the tropical climate, the height of the bright band during stratiform precipitation remained fairly stable over the course of the year at both sites. Hence, we used the information from the fall velocities above and below the typical height of the bright band (1700–2400 m a.g.l. in Cuenca and 1100–2000 m a.g.l. in Huaraz) for the classification scheme, and we distinguished convective (C) and stratiform (ST) precipitation. The absence of the bright band points to unstable atmospheric conditions with strong vertical motion of the hydrometeors below and above the freezing level, which indicates convection (C). On the other hand, stratiform precipitation (ST) is characterized by a pronounced bright band with low fall velocities above and moderate fall velocities below the bright band. To better discriminate between ST and C precipitation types, we also included the rain rate from the 3rd MRR gate in the FRS. For the classification, we calculated 5 min averages of the MRR fall velocities profiles and rain rates. The 5 min averages were considered a reasonable trade-off between reducing the noise in the fall velocity data and detecting changes in the precipitation characteristics. These fall velocities and rain rates were then used for a precipitation classification scheme based on an FRS with the following rules:
D O F i ( a , b , c ) = μ a , i ( a ) · μ b , i ( b ) · μ c , i ( c )
where D O F is the degree of fulfillment and i are the rules for C and ST precipitation types. a is the 5 min average of the mean fall velocities (m s 1 ) above the typical height of the bright band in the MRR gates 26–30 ( = ^ 2600–3000 m a.g.l.) in Cuenca and 21–26 ( = ^ 2100–2600 m a.g.l.) in Huaraz. b is the 5 min average of the mean fall velocities (m s 1 ) below the bright band in the MRR gates 4–8 ( = ^ 400–800 m a.g.l.) at both sites. c is the 5 min average rain rate (mm h 1 ) derived from the 3rd MRR gate. The membership functions μ for the different rules are given in Table 2. The precipitation type for each 5 min time step was assigned according to the highest degree of fulfillment. Furthermore, all precipitation types where the DOF was zero for both fuzzy rules being rejected and labeled as “No Class”.
In order to evaluate the FRS classifier, we used two other approaches to distinguish convective and stratiform rainfall. The first was based on a concept by White et al. [41], who used the information from gradients in fall velocities and reflectivities to distinguish bright band and non-bright band rainfall. For our study, we considered a bright band to be present if (i) a gradient of more than 1.5 m s 1 /200 m was detected in the 5 min MRR averaged fall velocities and (ii) a gradient of more than 2.5 dBZ/200 m was detected within ±2 MRR gates. The second one was based on an approach by Bringi et al. [44], which used the standard deviation in rain rates recorded by the MRR. If the standard deviation of minutely MRR rain rates within a 5 min interval was ≥ 1.5 mm h 1 , then precipitation was considered to be convective, otherwise it was assumed to be stratiform.

4. Results

4.1. Temporal Precipitation Characteristics

Figure 3 and Figure 4 show the diurnal distribution of hourly averaged MRR precipitation intensities across the two years at the two study sites. These plots were based on the infilled 1 min rain rates from the third MRR gate, which were averaged to hourly precipitation intensities. For Cuenca, the annual precipitation pattern describes a clear seasonality with most of the rain occurring from March–May and a drier season during July–August. In the diurnal course, typical afternoon events between 14:00 and 19:00 local time (LT, UTC–5) could be observed, which reached intensities of more than 4 mm h 1 . In addition, nocturnal rainfalls developed most frequently during March–May. Compared to the daytime events the precipitation intensities with up to 1 mm h 1 were rather low, which points to stratiform characteristics.
In contrast, Huaraz (Figure 4) has a more pronounced annual and diurnal cycle, which highlights that it is located in a different climate zone. In JJA, a clear signal of the dry season could be observed with only few low intensity events. In contrast to this, most of the precipitation was recorded in the rainy season from September–May. During this season, the precipitation shows a strong diurnal cycle with high precipitation intensities exceeding 5 mm h 1 predominantly in the afternoon hours between 13:00 and 20:00 LT, which indicates thermally induced convective events. With respect to nighttime hours, rainfalls were recorded predominantly in January–April and featured rather low intensities (up to 1 mm h 1 ), similar to Cuenca. In the late morning hours (8:00–12:00 LT) until noon however, almost no precipitation developed.
Next, we analyzed the event duration at both sites as described above based on the infilled 1 min data. Overall, for the study period from February 2017 to January 2019, 504 and 560 precipitation events were identified for Cuenca and Huaraz, respectively. Figure 5a shows a violin plot of monthly event occurrence and duration for both study sites. As expected from Figure 3 and Figure 4, the number of events reflectes the annual cycle in the precipitation formation through a decrease/increase of the events, which is more pronounced in Huaraz (e.g., only three events in June and two in July). Generally, the number of events was lower in Cuenca, except during the dry season and May and September. These are the months of the passage of the ITCZ, which especially increases the precipitation formation in the inner tropical study site Cuenca. Regarding the precipitation duration, it is interesting to note that short term events dominated at both sites, although the sites are located in different climate zones. In Cuenca, as well as in Huaraz, most of the rain events were shorter than 3 h, and no events exceeded a duration time of 7 h during the study period. However, very short rain events with a duration of less than 90 min were more frequent in Cuenca from April to October.
In Figure 5b, the duration of day and nighttime events is depicted. Daytime and nighttime were defined from 9:00 to 21:00 LT and vice versa. This ensured that rainfalls originating in the late afternoon/early evening were considered as day events and rainfalls occurring in the early morning hours were treated as night events. In Cuenca, there were more nocturnal events with shorter durations than in Huaraz. This relationship was opposite during the day, where more and longer precipitation events were identified in Huaraz.

4.2. Precipitation Type Classification

In order to explore the precipitation characteristics and the performance of the FRS classification at both study sites, we present four event based case studies, which featured mixed convective-stratiform and pure stratiform events at both sites using the information from vertical radar reflectivity (dBZ), the vertical fall velocity (m s 1 ), and the precipitation intensity (mm h 1 ) (Figure 6, Figure 7, Figure 8 and Figure 9).
Figure 6 shows an event in Huaraz with a convective onset, which often occur in the late afternoon hours during the rainy season (see Figure 4). Such convective events feature different stages, such as initial, mature, and dissipation, which demonstrate different fall velocities and precipitation intensities. Here, we also can identify such changes within one precipitation event. During the first phase of the event until 17:15 LT, convective activities were prevalent as indicated by the high reflectivities of more than 50 dBZ above the melting layer. The corresponding fall velocities also illustrate high values (> 10 m s 1 ) with a high variability. This points to turbulent air motion which is typical for deep convective plumes. Additionally, a clear bright band signal could not be observed. This example shows that the FRS was not able to capture the initial convective phase properly. Due to the delay of falling hydrometeors, the fall velocities close to the ground were low and thus led to a misclassification as stratiform precipitation. However, the gradient based bright band detection algorithm detected a bright band in the initial phase of the event as well. Furthermore, the gradient based approach detected occasional bright bands towards the end of this event, whereas the FRS classified this phase correctly as stratiform. The initial convective phase is followed by a stratiform phase. The main difference is the presence of a bright band signal in the height level around 1600 m a.g.l. (4600 m a.s.l.), as well as a moderate to low precipitation intensity from 17:15 to 20:45 LT. Thus, as expected, the cumulative rainfall sum of around 14 mm was primarily contributed during the convective phase.
Figure 7 shows mixed stratiform/convective event that was recorded in Cuenca. This event has some initial convective features with rain intensities > 10 mm h 1 as well, but in contrast to the case in Huaraz (Figure 6), there is a convective enhancement during the event between 16:30 and 17:00 LT. Similar to the case shown in Figure 6, the onset of this convective phase was also not detected correctly by the FRS. The remaining part of the event was of a stratiform character where the occurrence of a bright band was detected as well.
Figure 7 and Figure 9 show two stratiform precipitation events in Cuenca and Huaraz, respectively. The event in Cuenca (Figure 6) occurred in the evening hours, whereas the one in Huaraz was one of the few longer nocturnal events that were recorded during the two years (cf. Figure 4). Both events show solely stratiform features, which points to a calm atmosphere without turbulent elements. Both cases are characterized by a pronounced bright band and weak reflectivities of up to 30 dBZ. Not surprisingly, rather low precipitation intensities of mostly lower than 1.5 mm h 1 were observed, which led to a rainfall total of less than 2.5 mm for both events.
Next, we used the aforementioned FRS to classify convective and stratiform precipitation. The occurrences of these classified precipitation types are shown in Table 3. At both sites, more than 90% of the precipitation is of a stratiform character. This is a result of the nighttime events, which hardly show any convective features, and the frequent precipitation events in the afternoon, which had a convective onset and change towards stratiform in the further course of the event (cf. Figure 6). Consequently, precipitation, which shows pronounced convective features, is limited to the daytime and early evening hours. In Huaraz, the occurrences of convective precipitation at nighttime can be attributed to false classifications from the FRS since no deep convection is likely to develop after sunset. However, in Cuenca at the eastern slopes of the Andes, nocturnal convection develops due to sufficient low level convergence and a potential instability of the atmospheric stratification, as demonstrated by Trachte et al. [45] and Trachte et al. [12]. This could explain the higher proportion of convective precipitation during nighttime compared to Huaraz.
In order to validate the FRS classification, we used two other classification methods based on (i) the standard deviation of rain rates and (ii) a bright band detection algorithm (cf. Section 3.2). Table 4 shows the results for the standard deviation of rain rates which are similar to the FRS. A summary of the comparison with the bright band detection is shown in Table 5. For the convective precipitation, both classifiers showed a good agreement. In Cuenca, however, the number of cases where a bright band was detected for convective precipitation was higher. For stratiform precipitation, there were many cases where the gradient based approach did not detect a bright band when the precipitation was classified as stratiform by the FRS. Such cases could be seen in all the case studies.
Furthermore, we analyzed the drop size distributions (DSD) for the three precipitation types. The DSD from the third MRR gate (200–300 m a.g.l.) were averaged to 5 min and used to calculate the mass weighted mean diameter ( D m ) and the normalized intercept parameter ( N w ) according to Bringi et al. [44] for the two different precipitation types.
Figure 10 shows the scatterplot of D m and l o g 10 N w for Huaraz and Cuenca, which allows the identification of clusters in the DSD. The mean values of D m and l o g 10 N w and the corresponding standard deviation for the convective and stratiform precipitation types are shown in Table 6. At both sites, the stratiform precipitation has a similar DSD. The values of D m and l o g 10 N w are close together and show a small standard deviation, indicating that these are well defined clusters. With regard to convective precipitation, the two locations show different characteristics. In Cuenca, the average drop sizes are bigger than in Huaraz; however, the number of drops is smaller. Overall, it can be stated that the precipitation types detected by the FRS have very distinctive DSD parameters at both locations.

5. Discussion

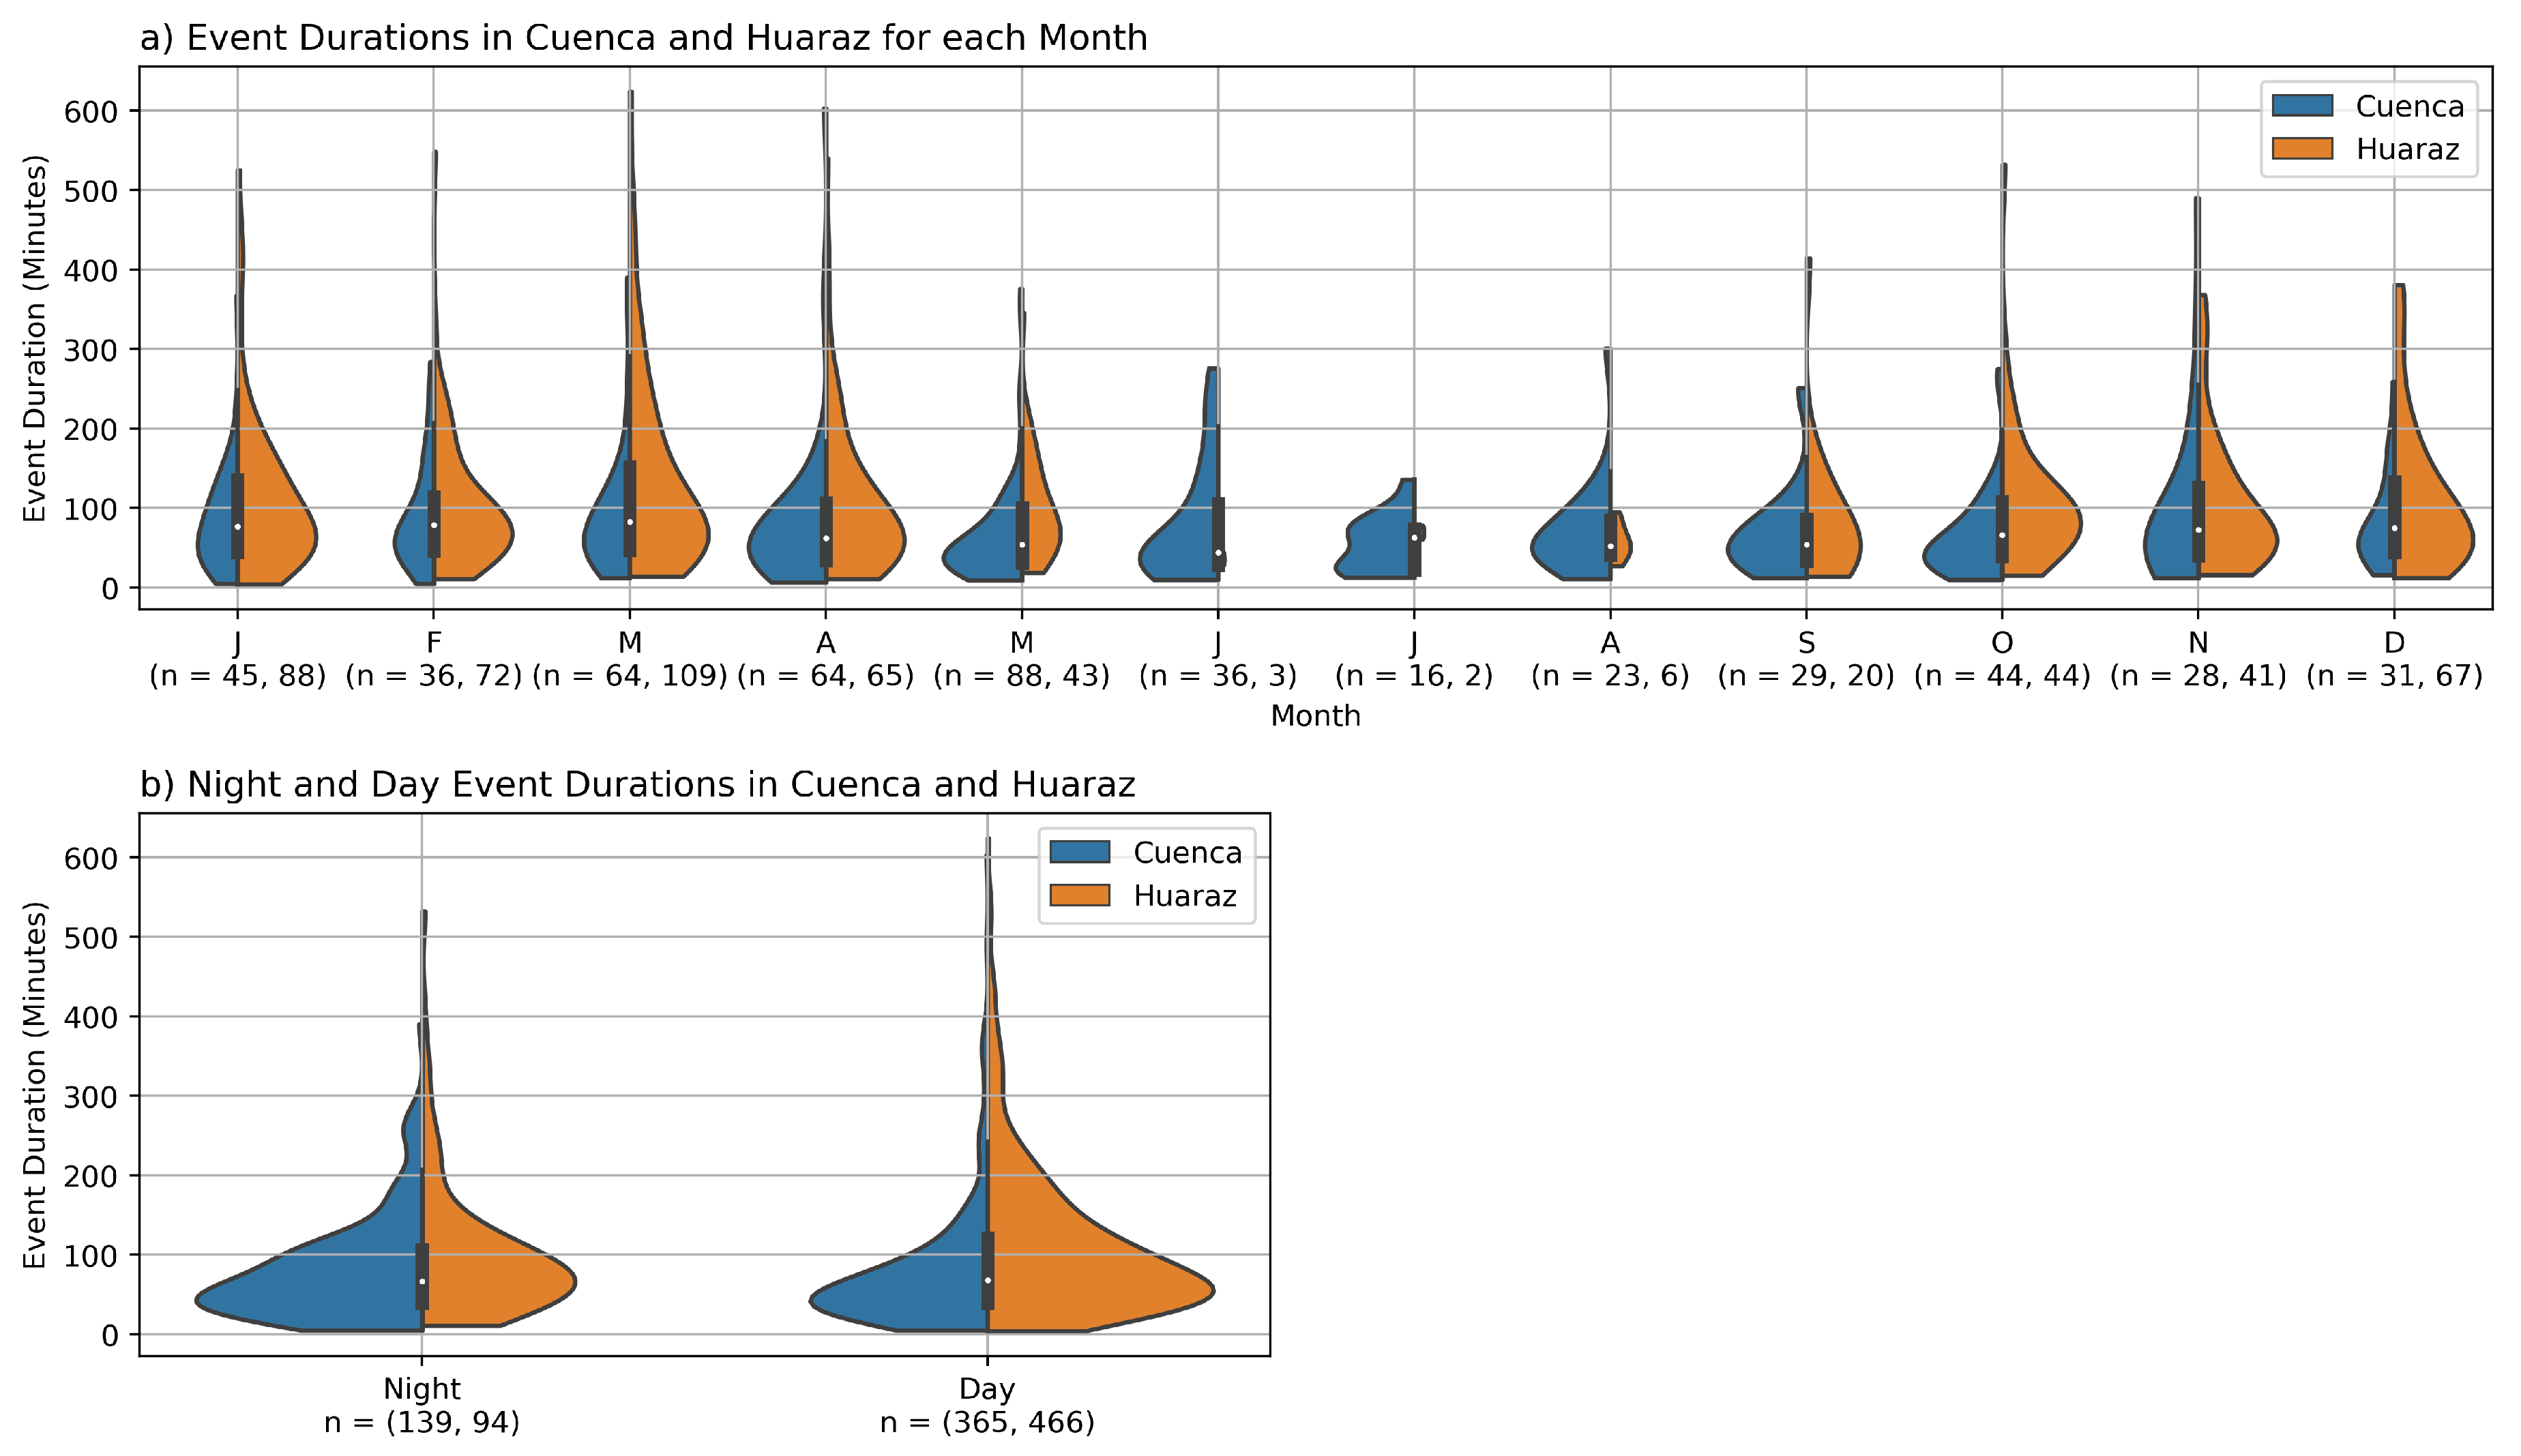
Our study shows that at both sites, the majority of rainfall events are of short duration and that temporally high resolution in situ data are necessary to characterize the properties of precipitation properly. This is also an important point to keep in mind when space borne remote sensing precipitation products (e.g., GPM IMERG [46]) are used to obtain information about precipitation in areas that lack sufficient ground observations, such as the Tropical Andes. Even though the spatial and temporal resolutions of such remote sensing products range down to 0.1 
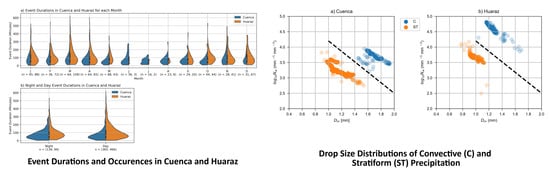
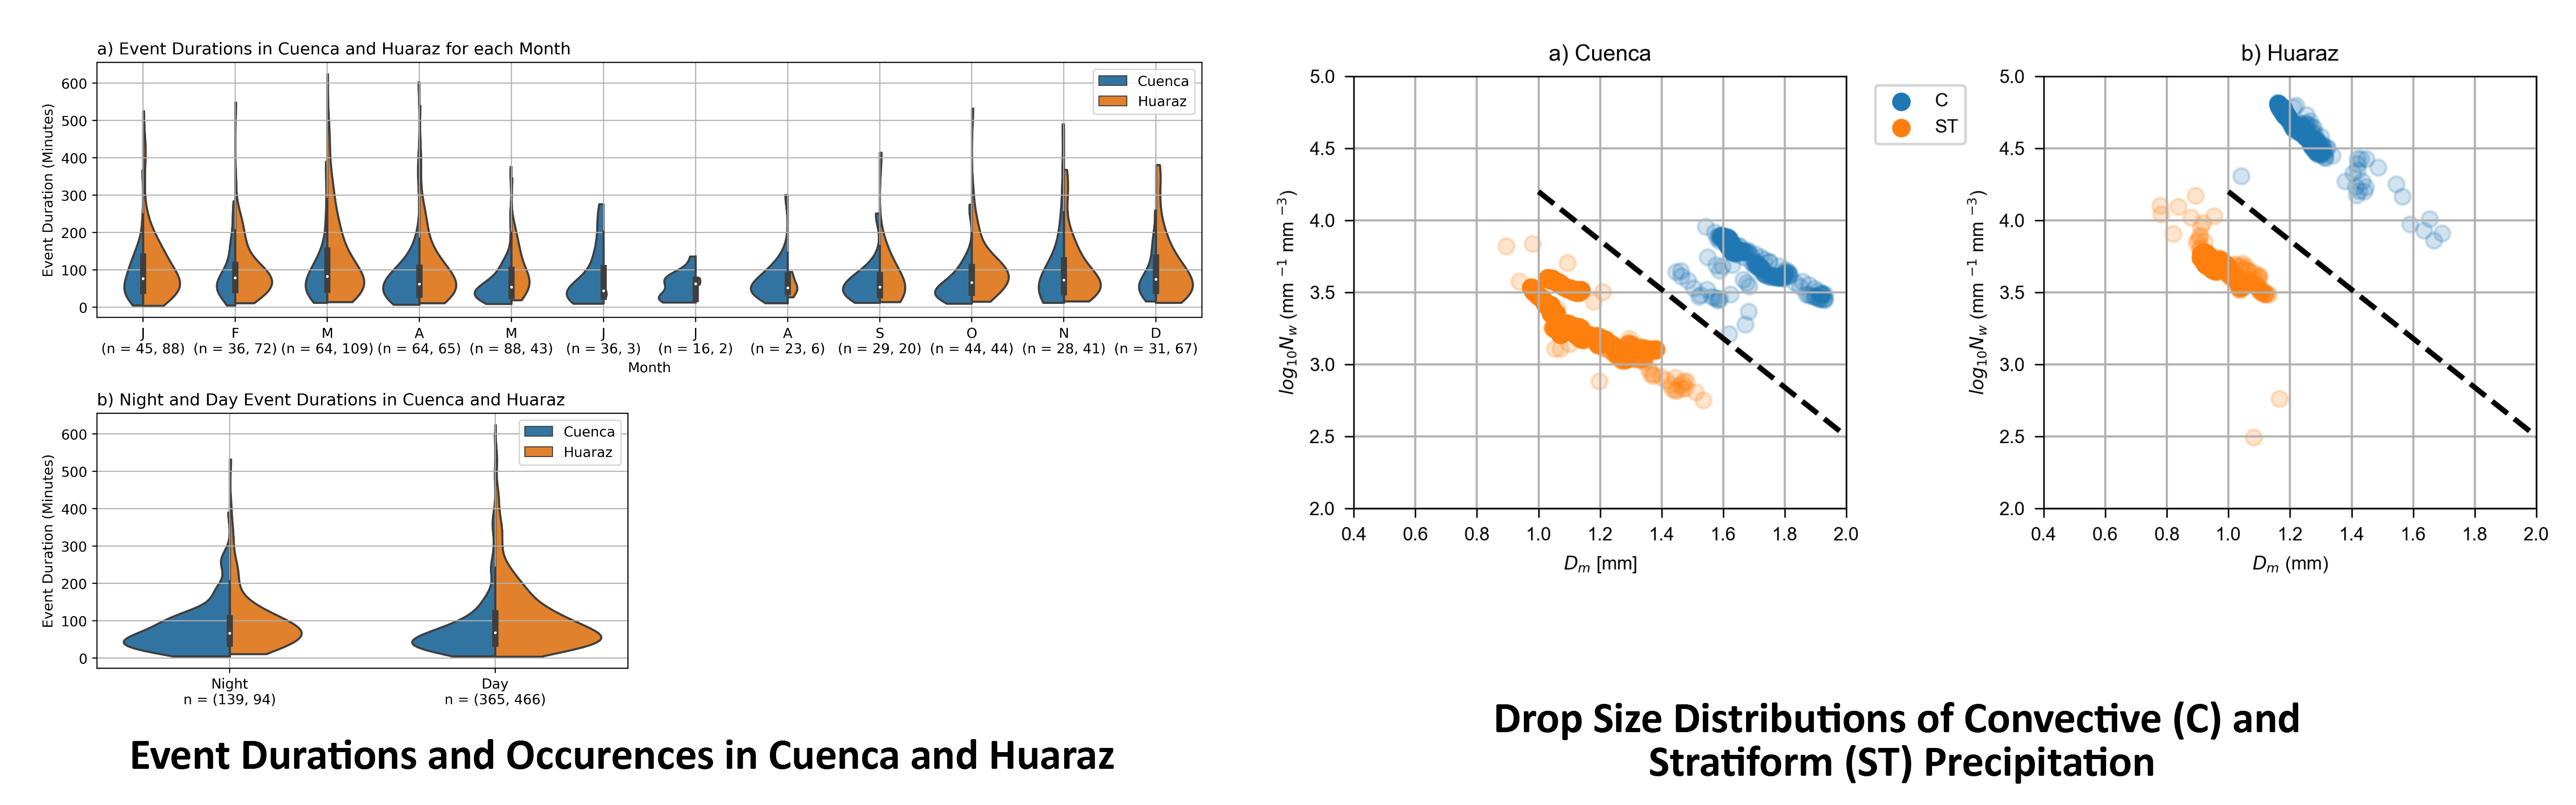
and 30 min respectively, it is likely that they will not fully capture the precipitation dynamics in complex terrain areas with a high spatio-temporal precipitation variability. With the two year MRR datasets from Cuenca and Huaraz, we were able to analyze the occurrence and duration of precipitation events, as well as the temporal evolution of precipitation with respect to rain rates, radar reflectivities, fall velocities, and drop size distributions. The number and durations of the events in Cuenca are consistent with the study from Orellana-Alvear et al. [
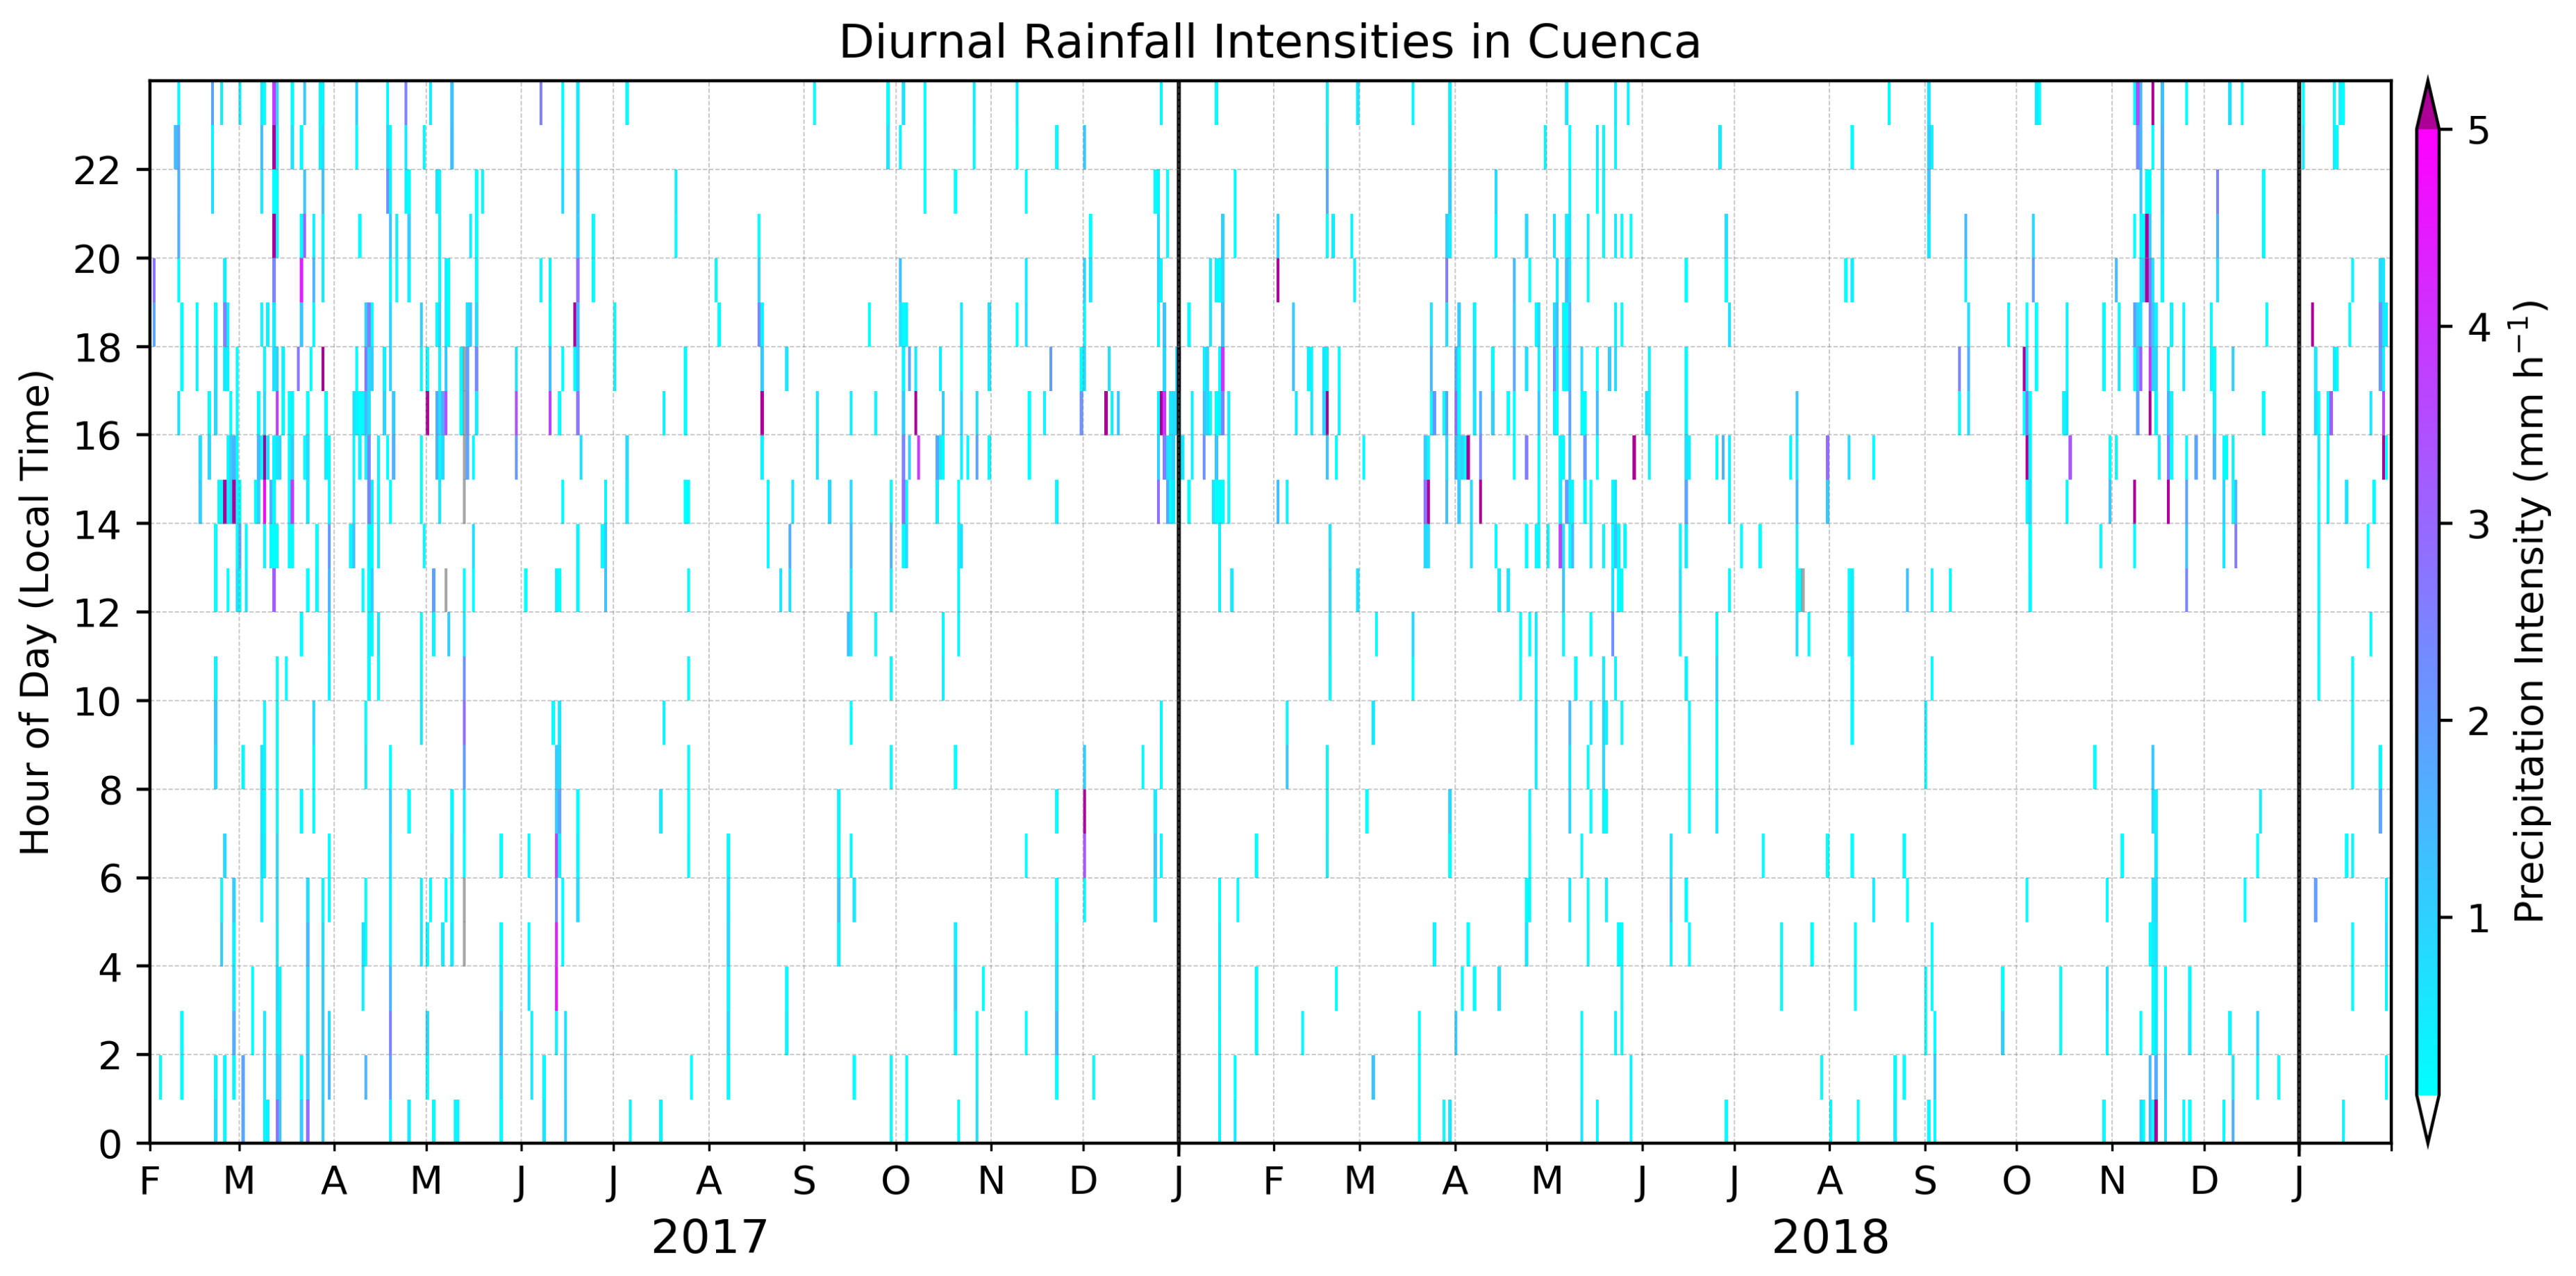
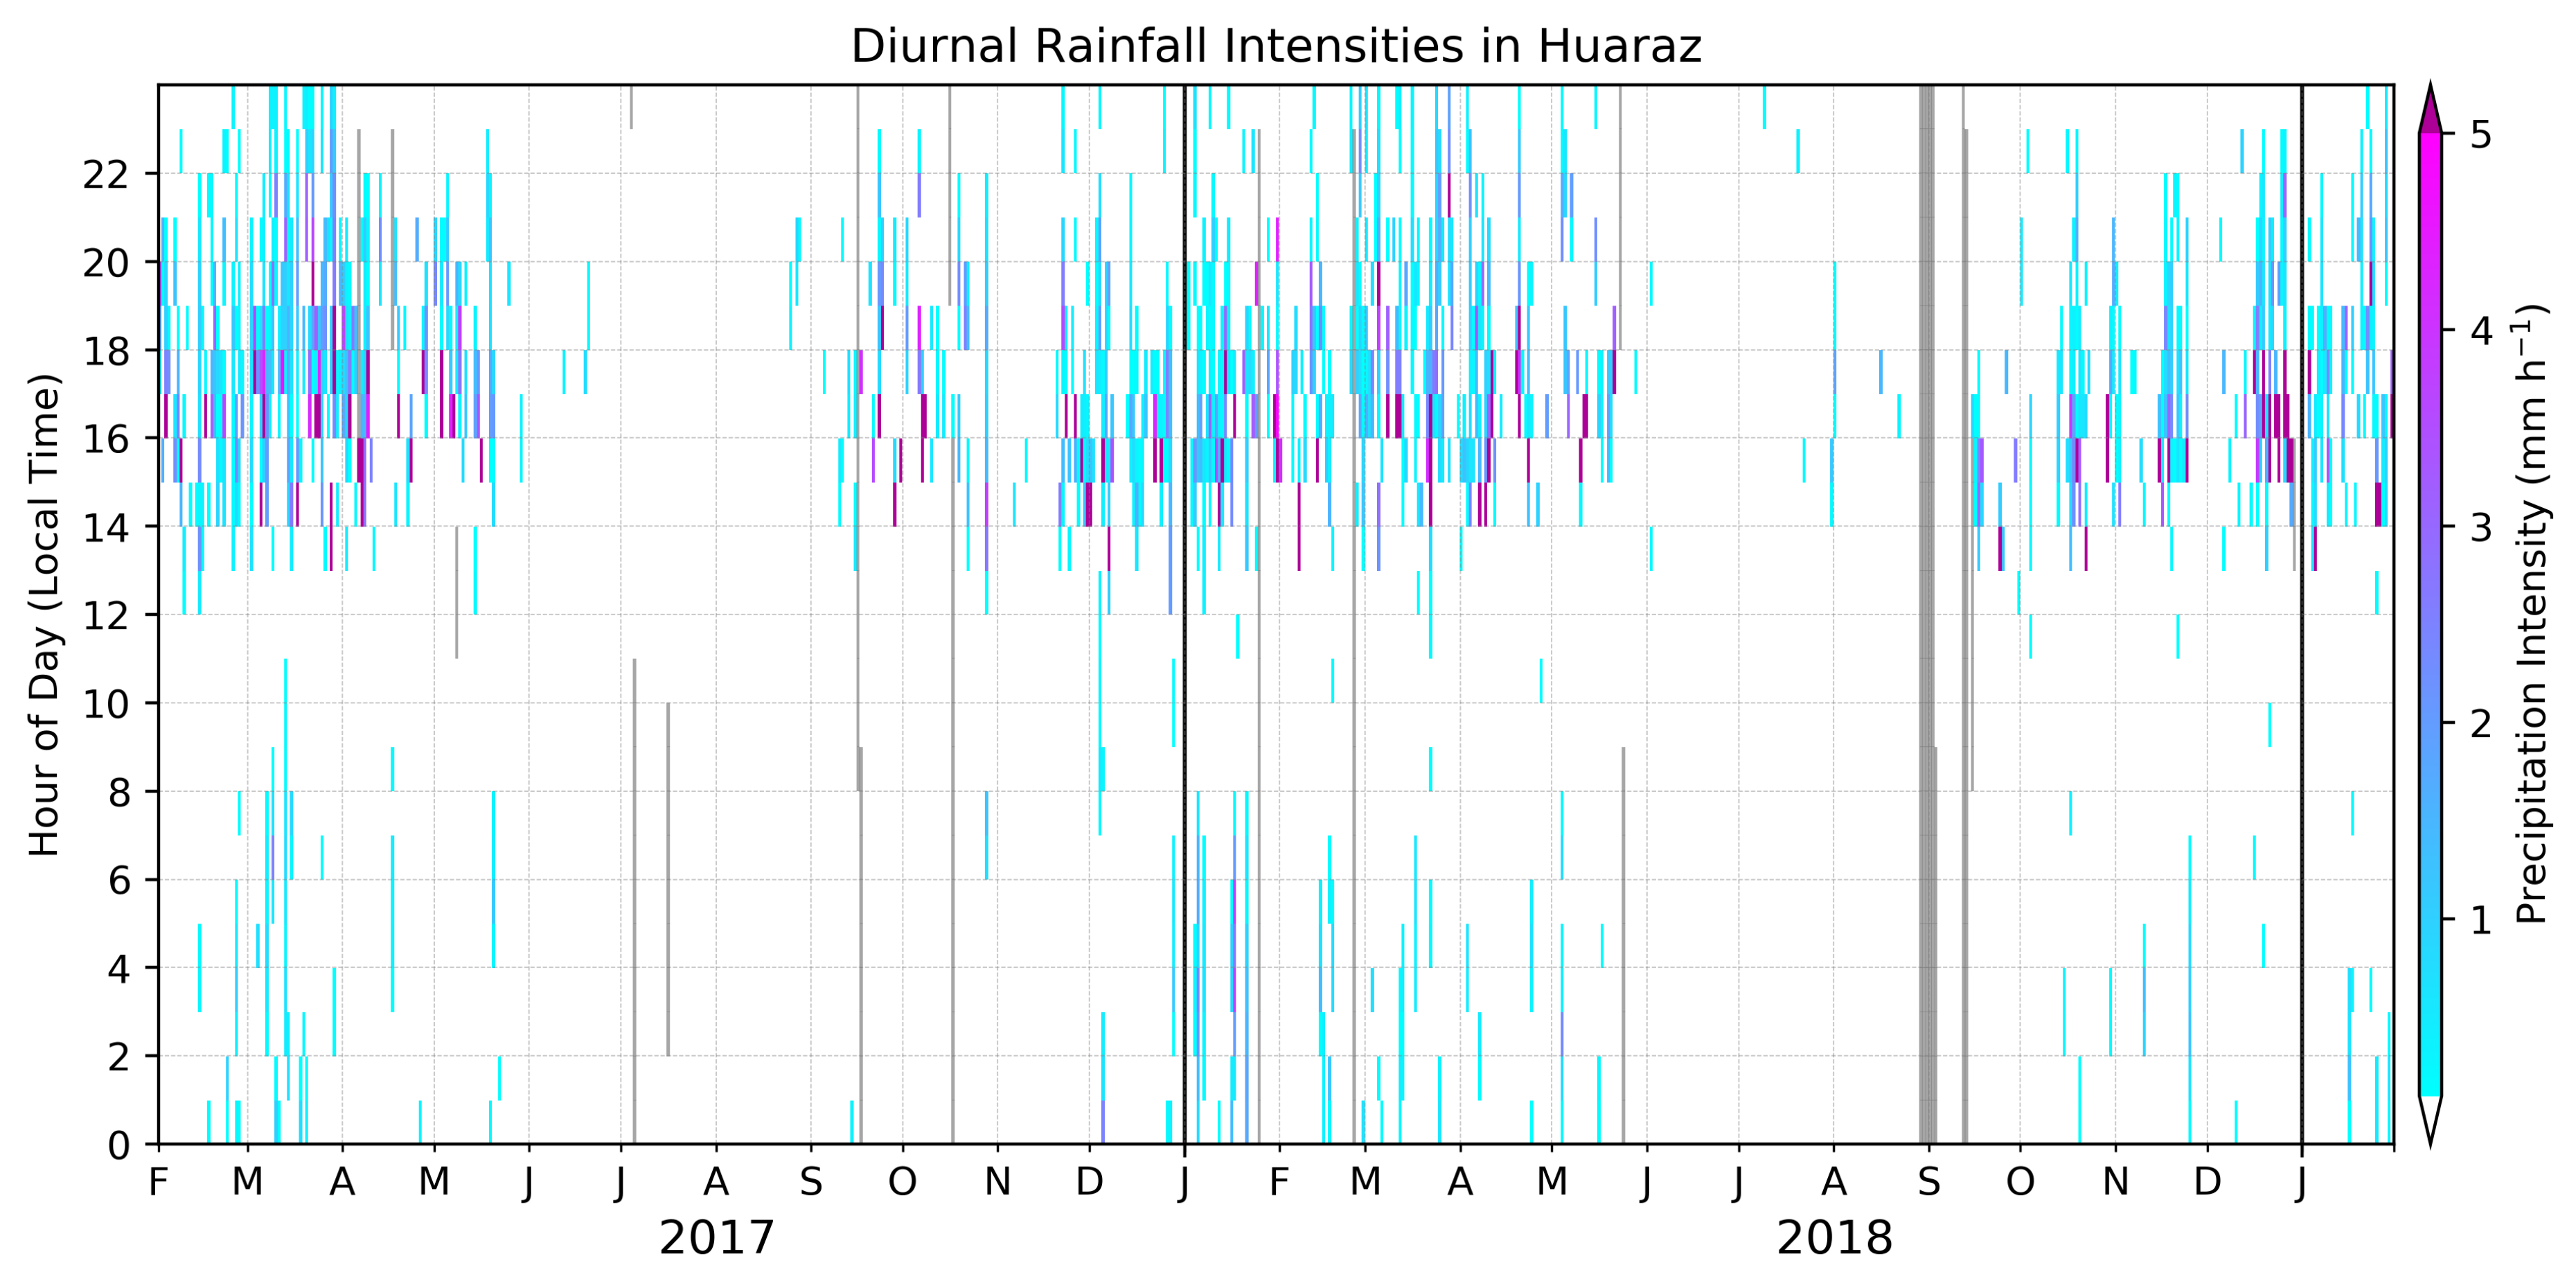
14], who analyzed these parameters using disdrometer data from March 2015 to August 2016. Our results also show that both sites have more events with higher precipitation intensity during the daytime. This was an interesting finding, since studies by Bendix et al. [11] and Endries et al. [8] observed a bimodal precipitation pattern in Ecuador and in Cusco, Peru. This feature was more pronounced in Huaraz than in Cuenca, which could be related to the regional topography of the two sites. Huaraz is located on the western fringes of the Andes, which have a larger east-west extension than in Cuenca, and therefore, the distance to the Amazon Basin is greater. Thus, deep convective activities are predominantly thermally induced and maintained by diabatic heating and local convergences due to the complex terrain, which enhances the formation of convective cells within an event. Nighttime events, on the other hand, are more frequent and have longer durations in Cuenca than in Huaraz. Cuenca is located closer to the Amazon Basin, where the mesoscale convective systems (MCS) frequently develop and move westwards with the trade winds, leading to nocturnal rainfall [12,26,47,48]. These MCS are likely to cause the occasional nighttime precipitation in Huaraz as well. Furthermore, the results from the study by Endries et al. [8] in Cusco, Peru, show a large number of overnight events with relatively high precipitation rates, which the authors relate to MCS in the Amazon Basin as well. Thus, at Cusco and La Paz, nighttime precipitation plays a major role, which contrasts with our findings, since higher rain rates were not observed after 22:00 LT at both sites in the current study. This was confirmed by the TBR data from Cuenca, where 70% of the measured rainfall was recorded during the daytime (9:00–21:00 LT) during the study period. Therefore, it remains an open question why nighttime precipitation contributes less at our study sites. This illustrates the very heterogeneous precipitation scheme in the Tropical Andes and the necessity for further studies.
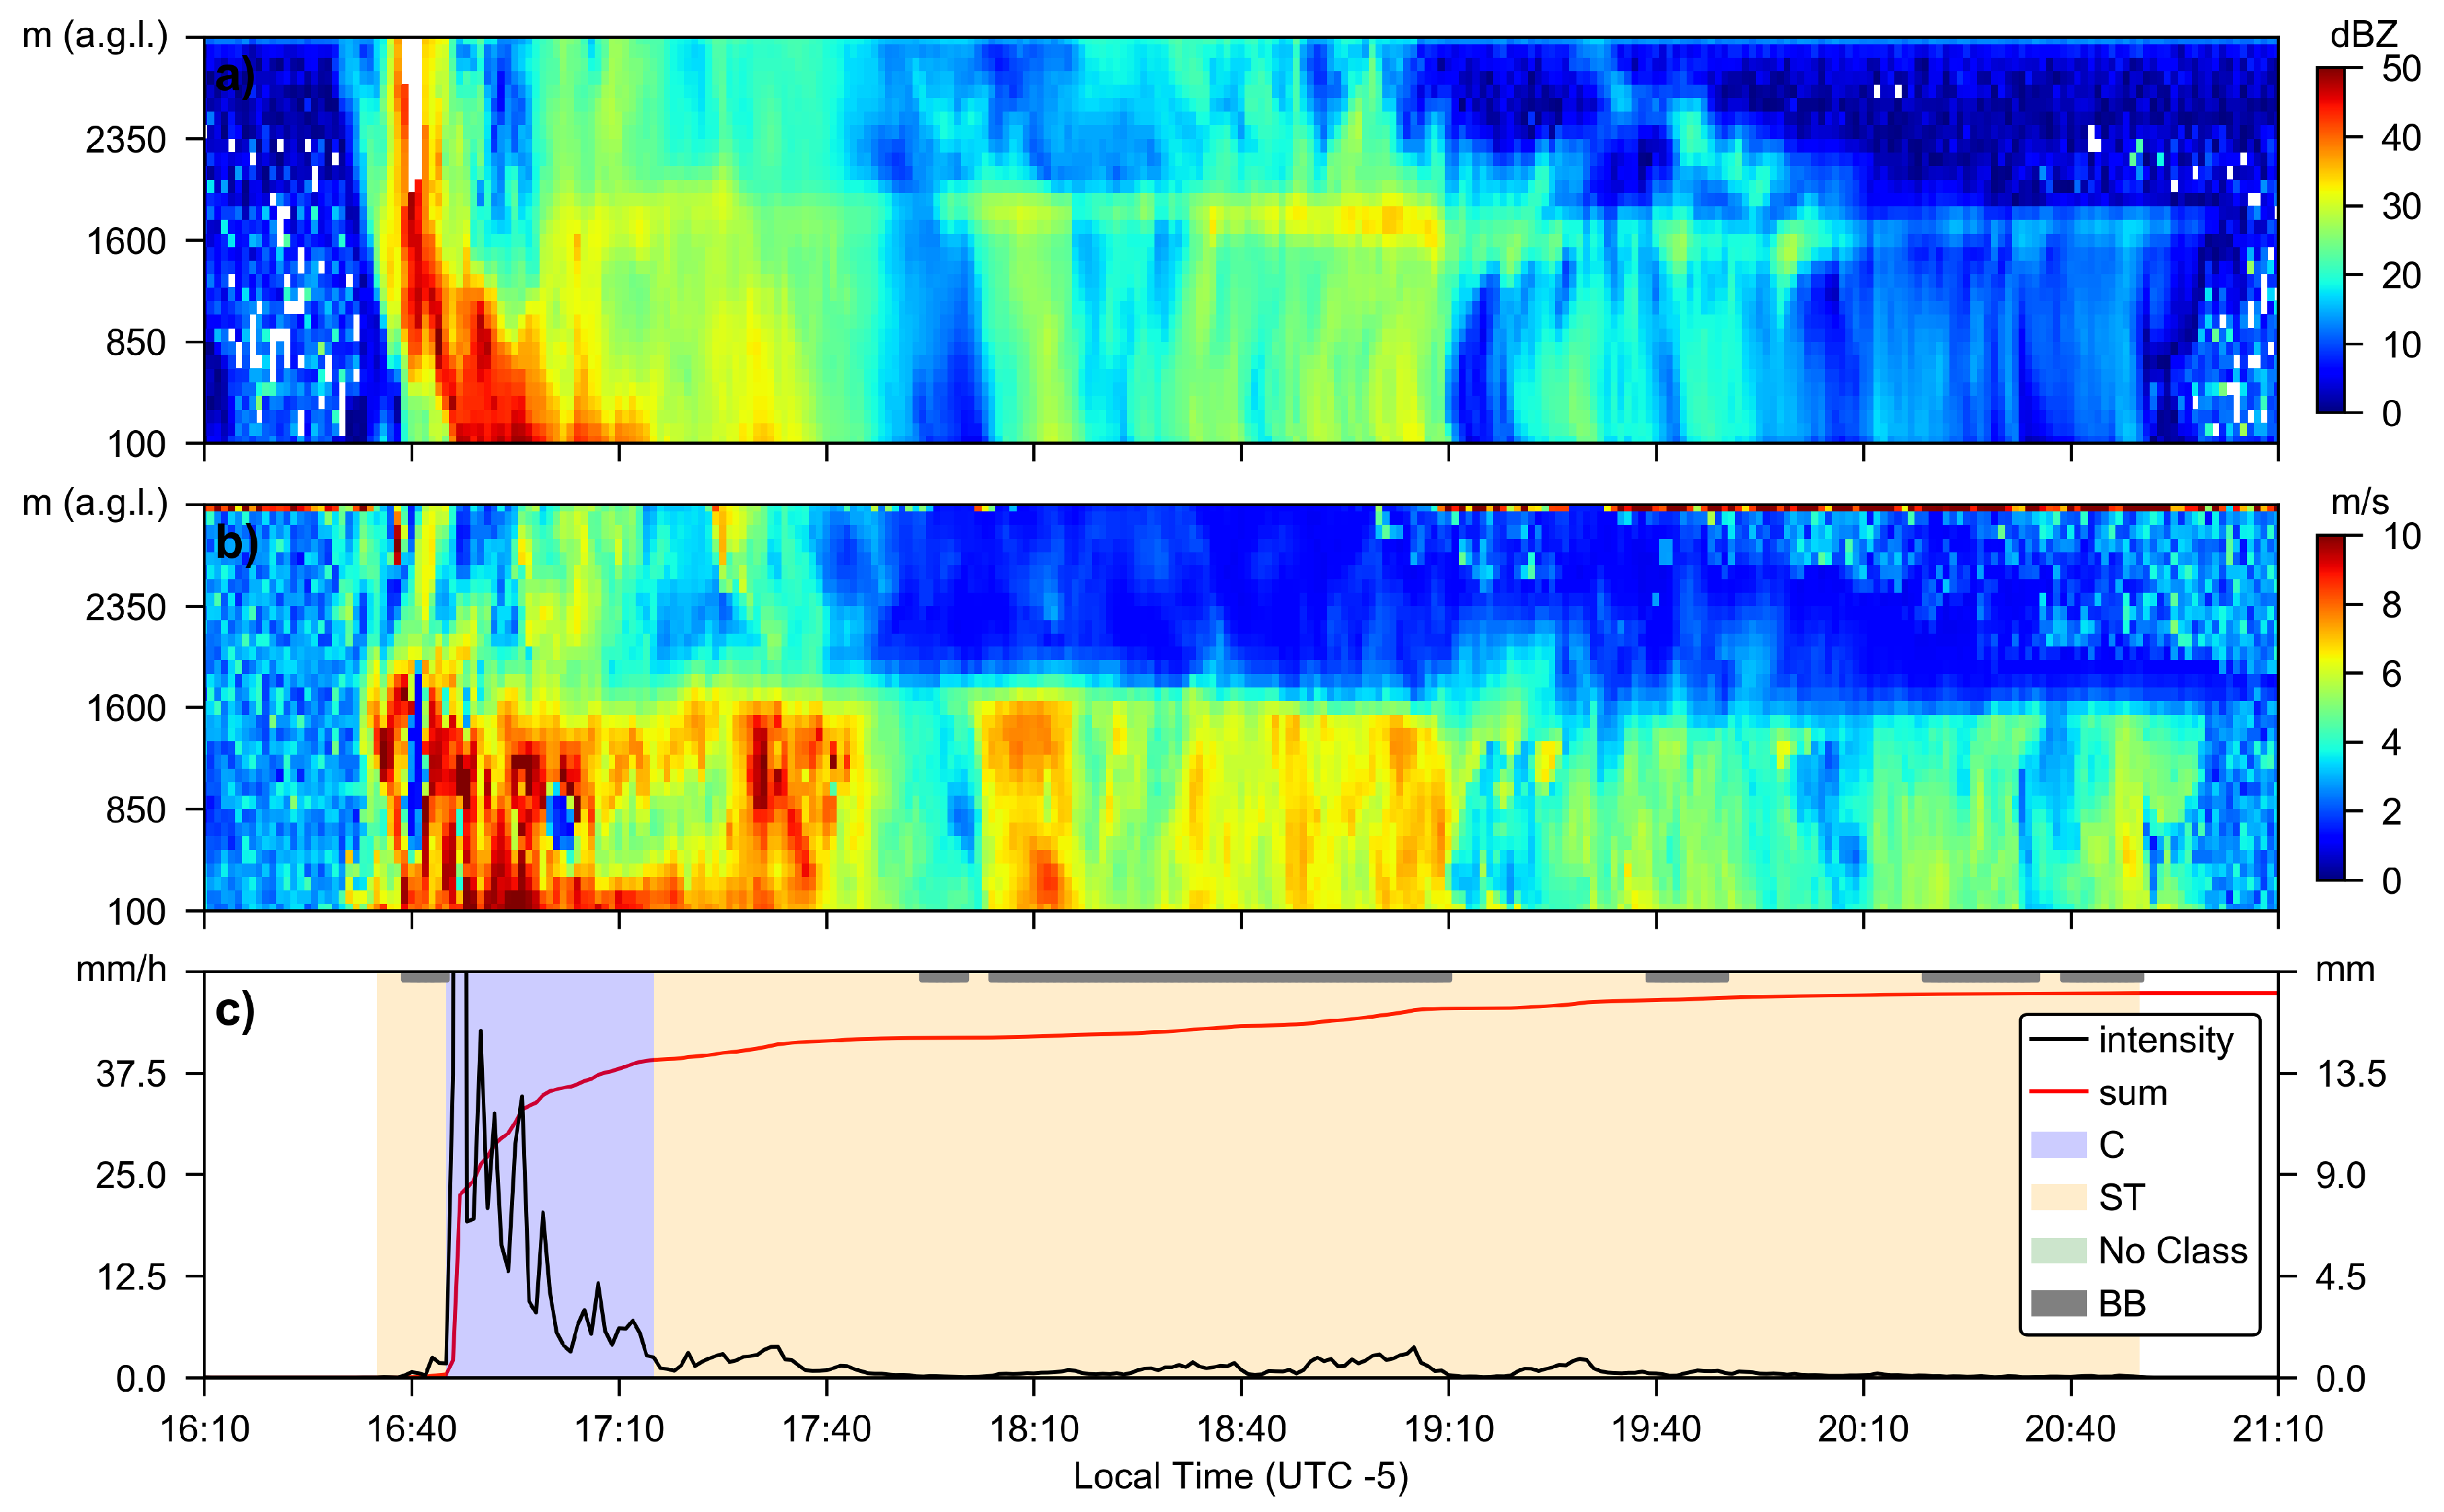
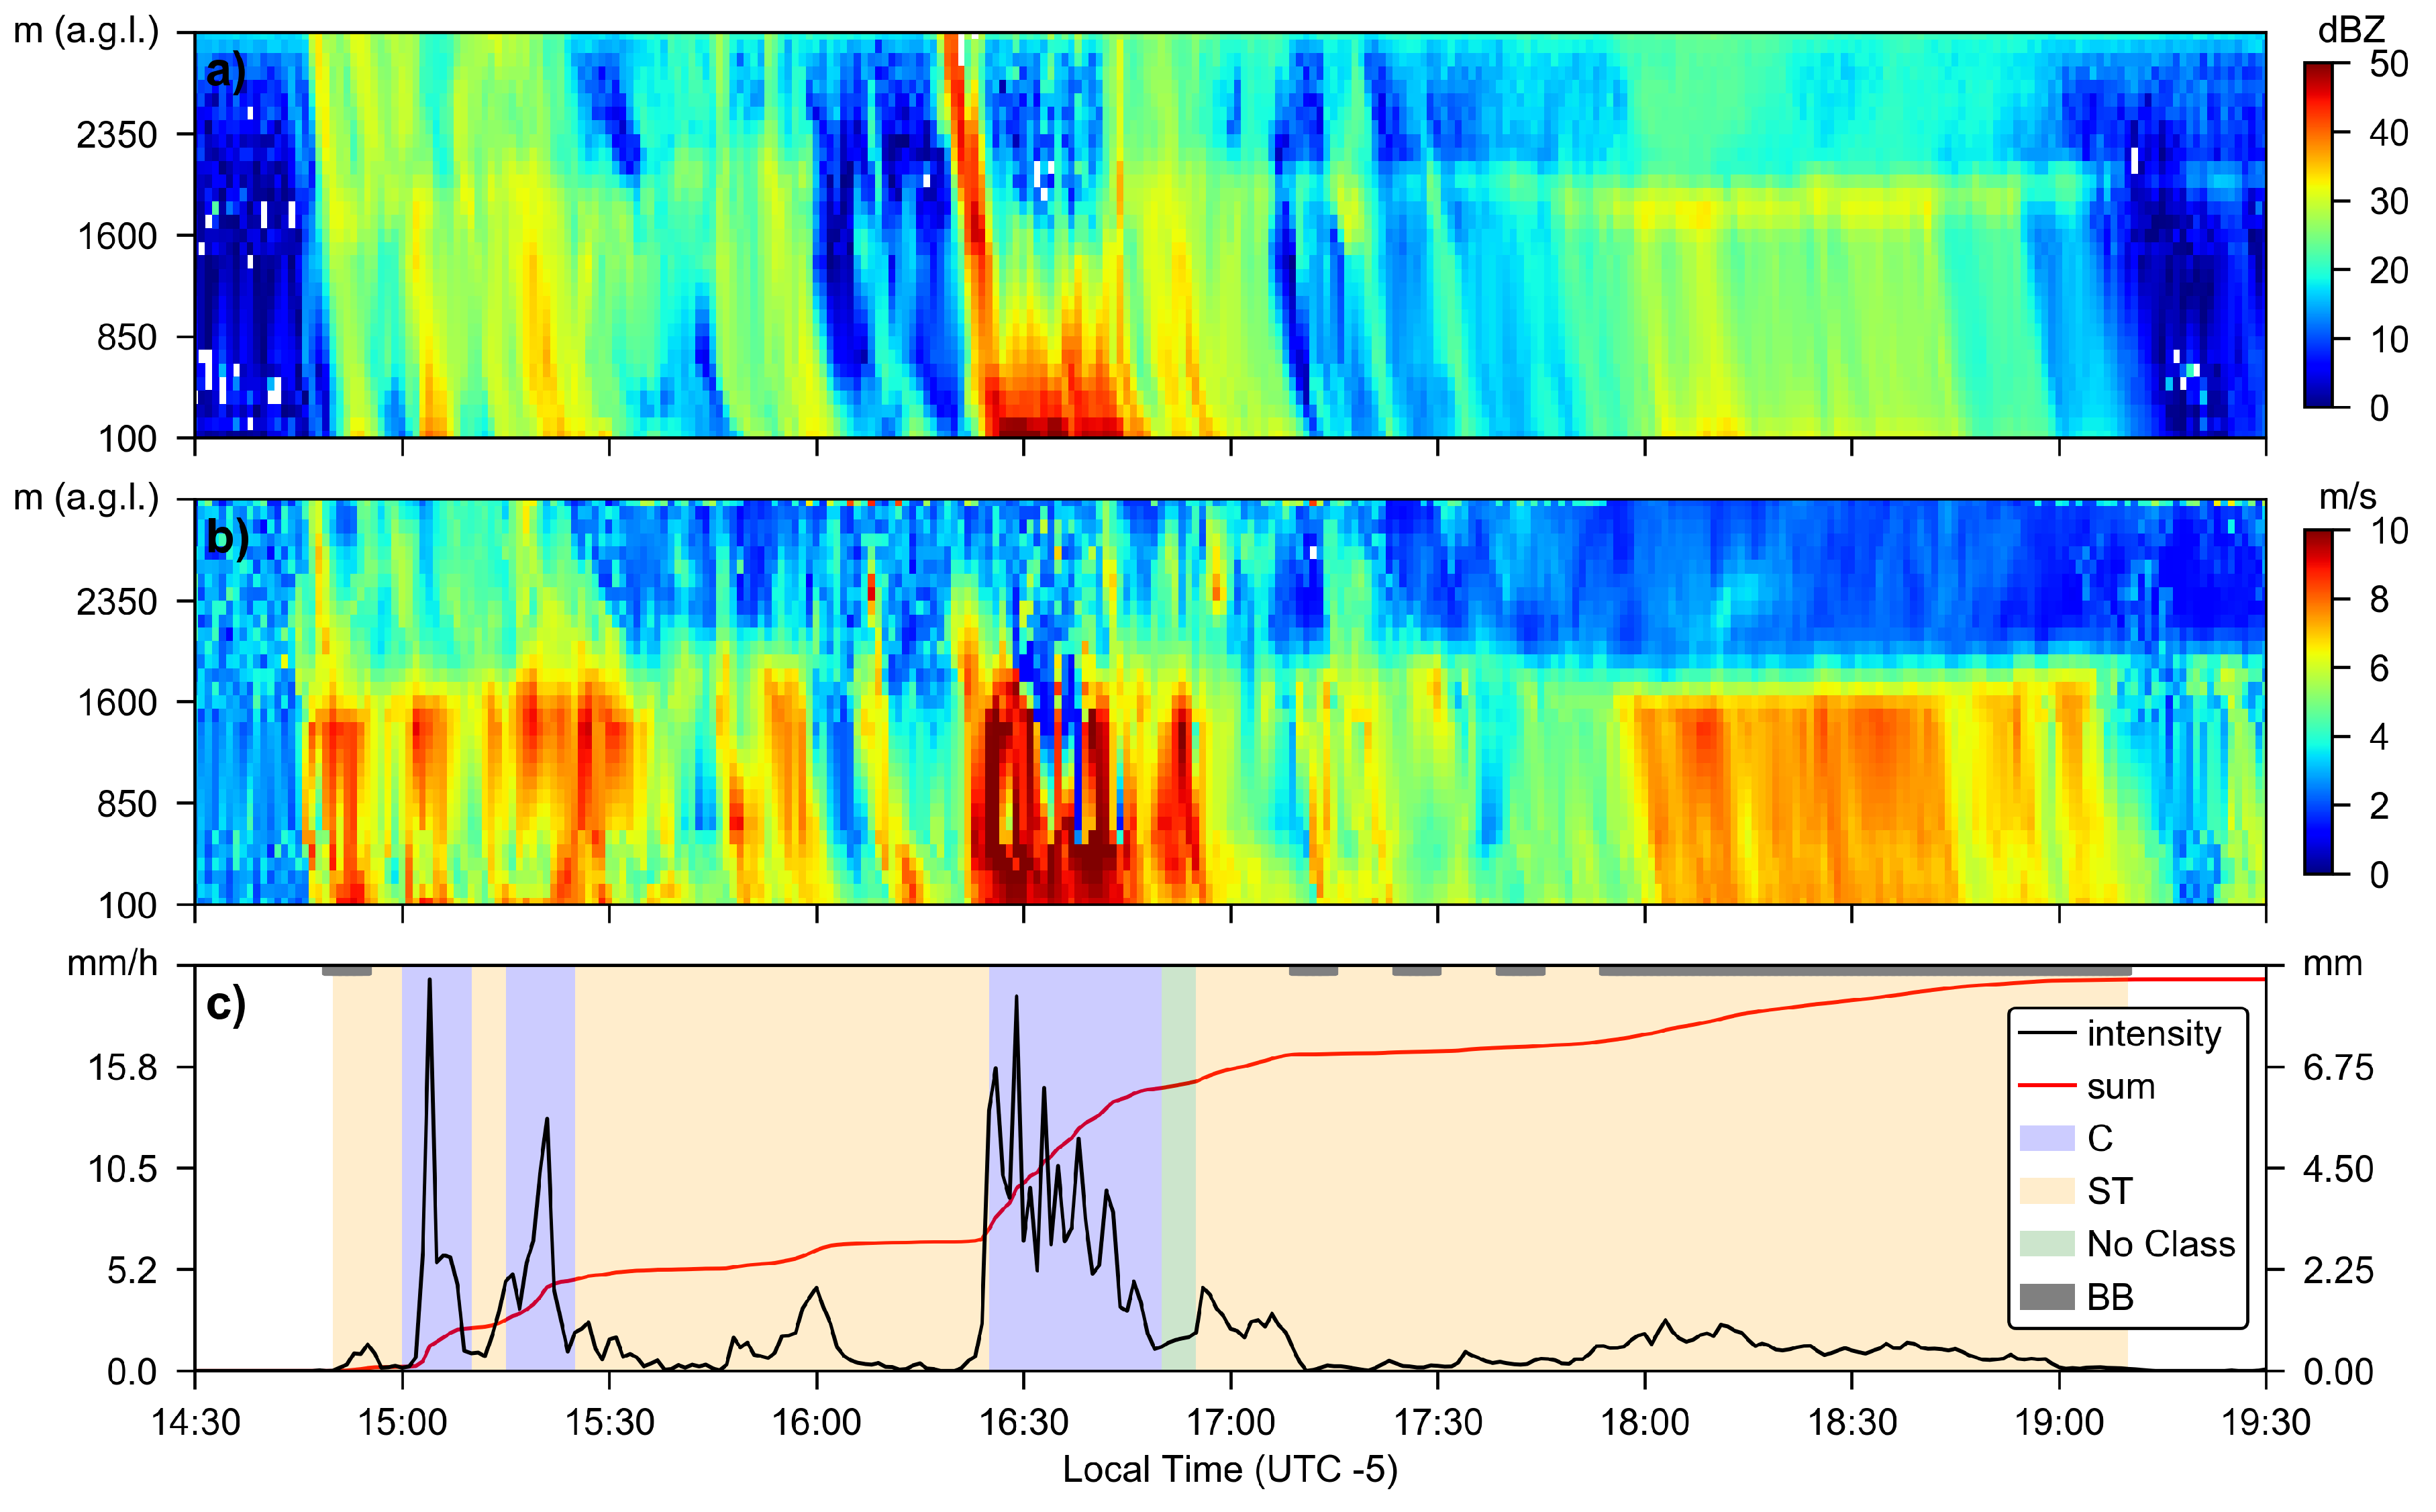
Further, we conducted a classification of convective and stratiform precipitation types using the information from the fall velocity profiles and an FRS, which provided reasonable results, although some misclassification occurred, e.g., nighttime deep convection in Huaraz. Furthermore, this approach showed occasional misclassification at the onset of convective events (cf. Figure 6), which can be related to boundary effects. When precipitation starts, falling hydrometeors are already detected by the MRR in the higher range gates, which subsequently arrive at the ground with a certain time delay. Thus, low fall velocities in the lower MRR gates are prevalent in these cases, which leads to a high DOF for stratiform rain in the FRS. The precipitation not classified by the FRS (i.e., where the DOFs of the fuzzy rules were zero) occured predominately during daytime stratiform events, which had high fall velocities below the bright band, but low to moderate rainfall rates. This was often the case during the transition from convective to stratiform precipitation, as shown in Figure 6.
In order to assess the robustness of the FRS approach, we additionally classified the precipitation following the concept of Bringi et al. [44]. While the FRS classifier is based the microphysical properties such as the fall velocity, Bringi et al. [44] use the standard deviation of the precipitation rates. This ensured a quasi-independence of the approaches. In both methods, a comparable result of the precipitation characteristics could be observed with generally > 92% stratiform precipitation (Table 3 and Table 4). Even the partitioning of daytime/nighttime occurrences reflected a comparable behavior at both locations. With respect to precipitation characteristics, our results show that the majority of daytime rainfall consist of mixed convective/stratiform precipitation as presented in the case studies (cf. Figure 6 and 
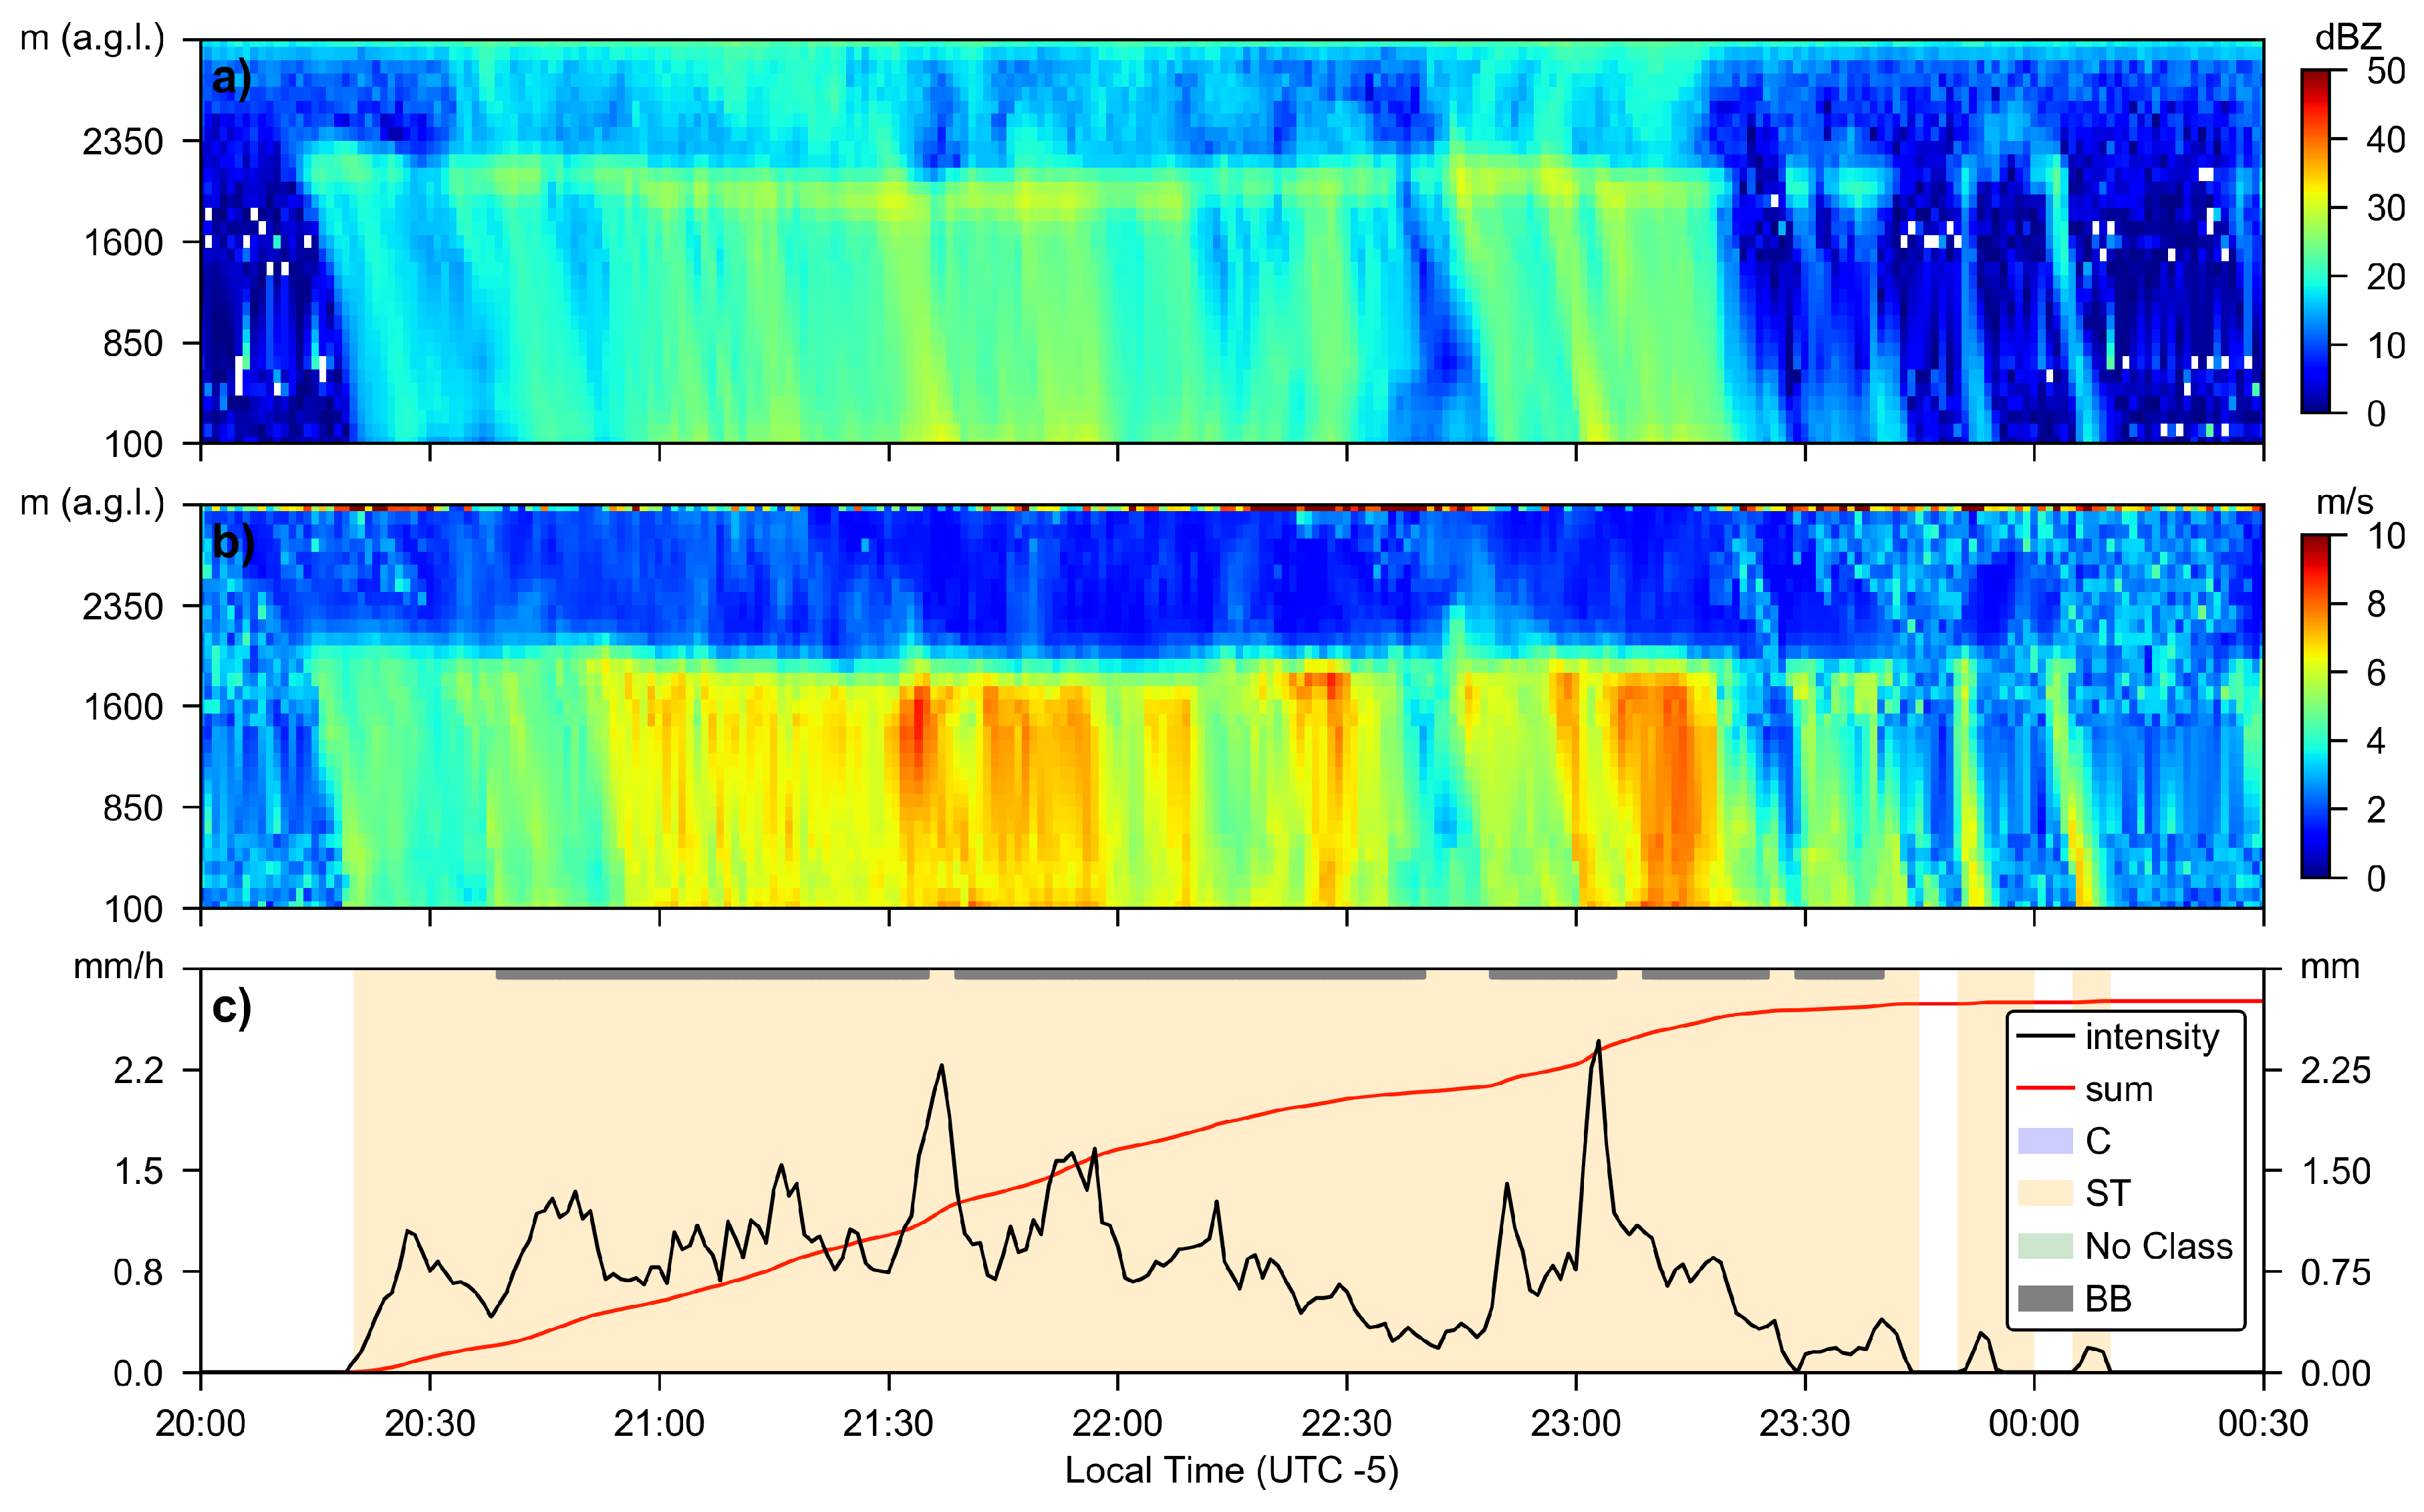
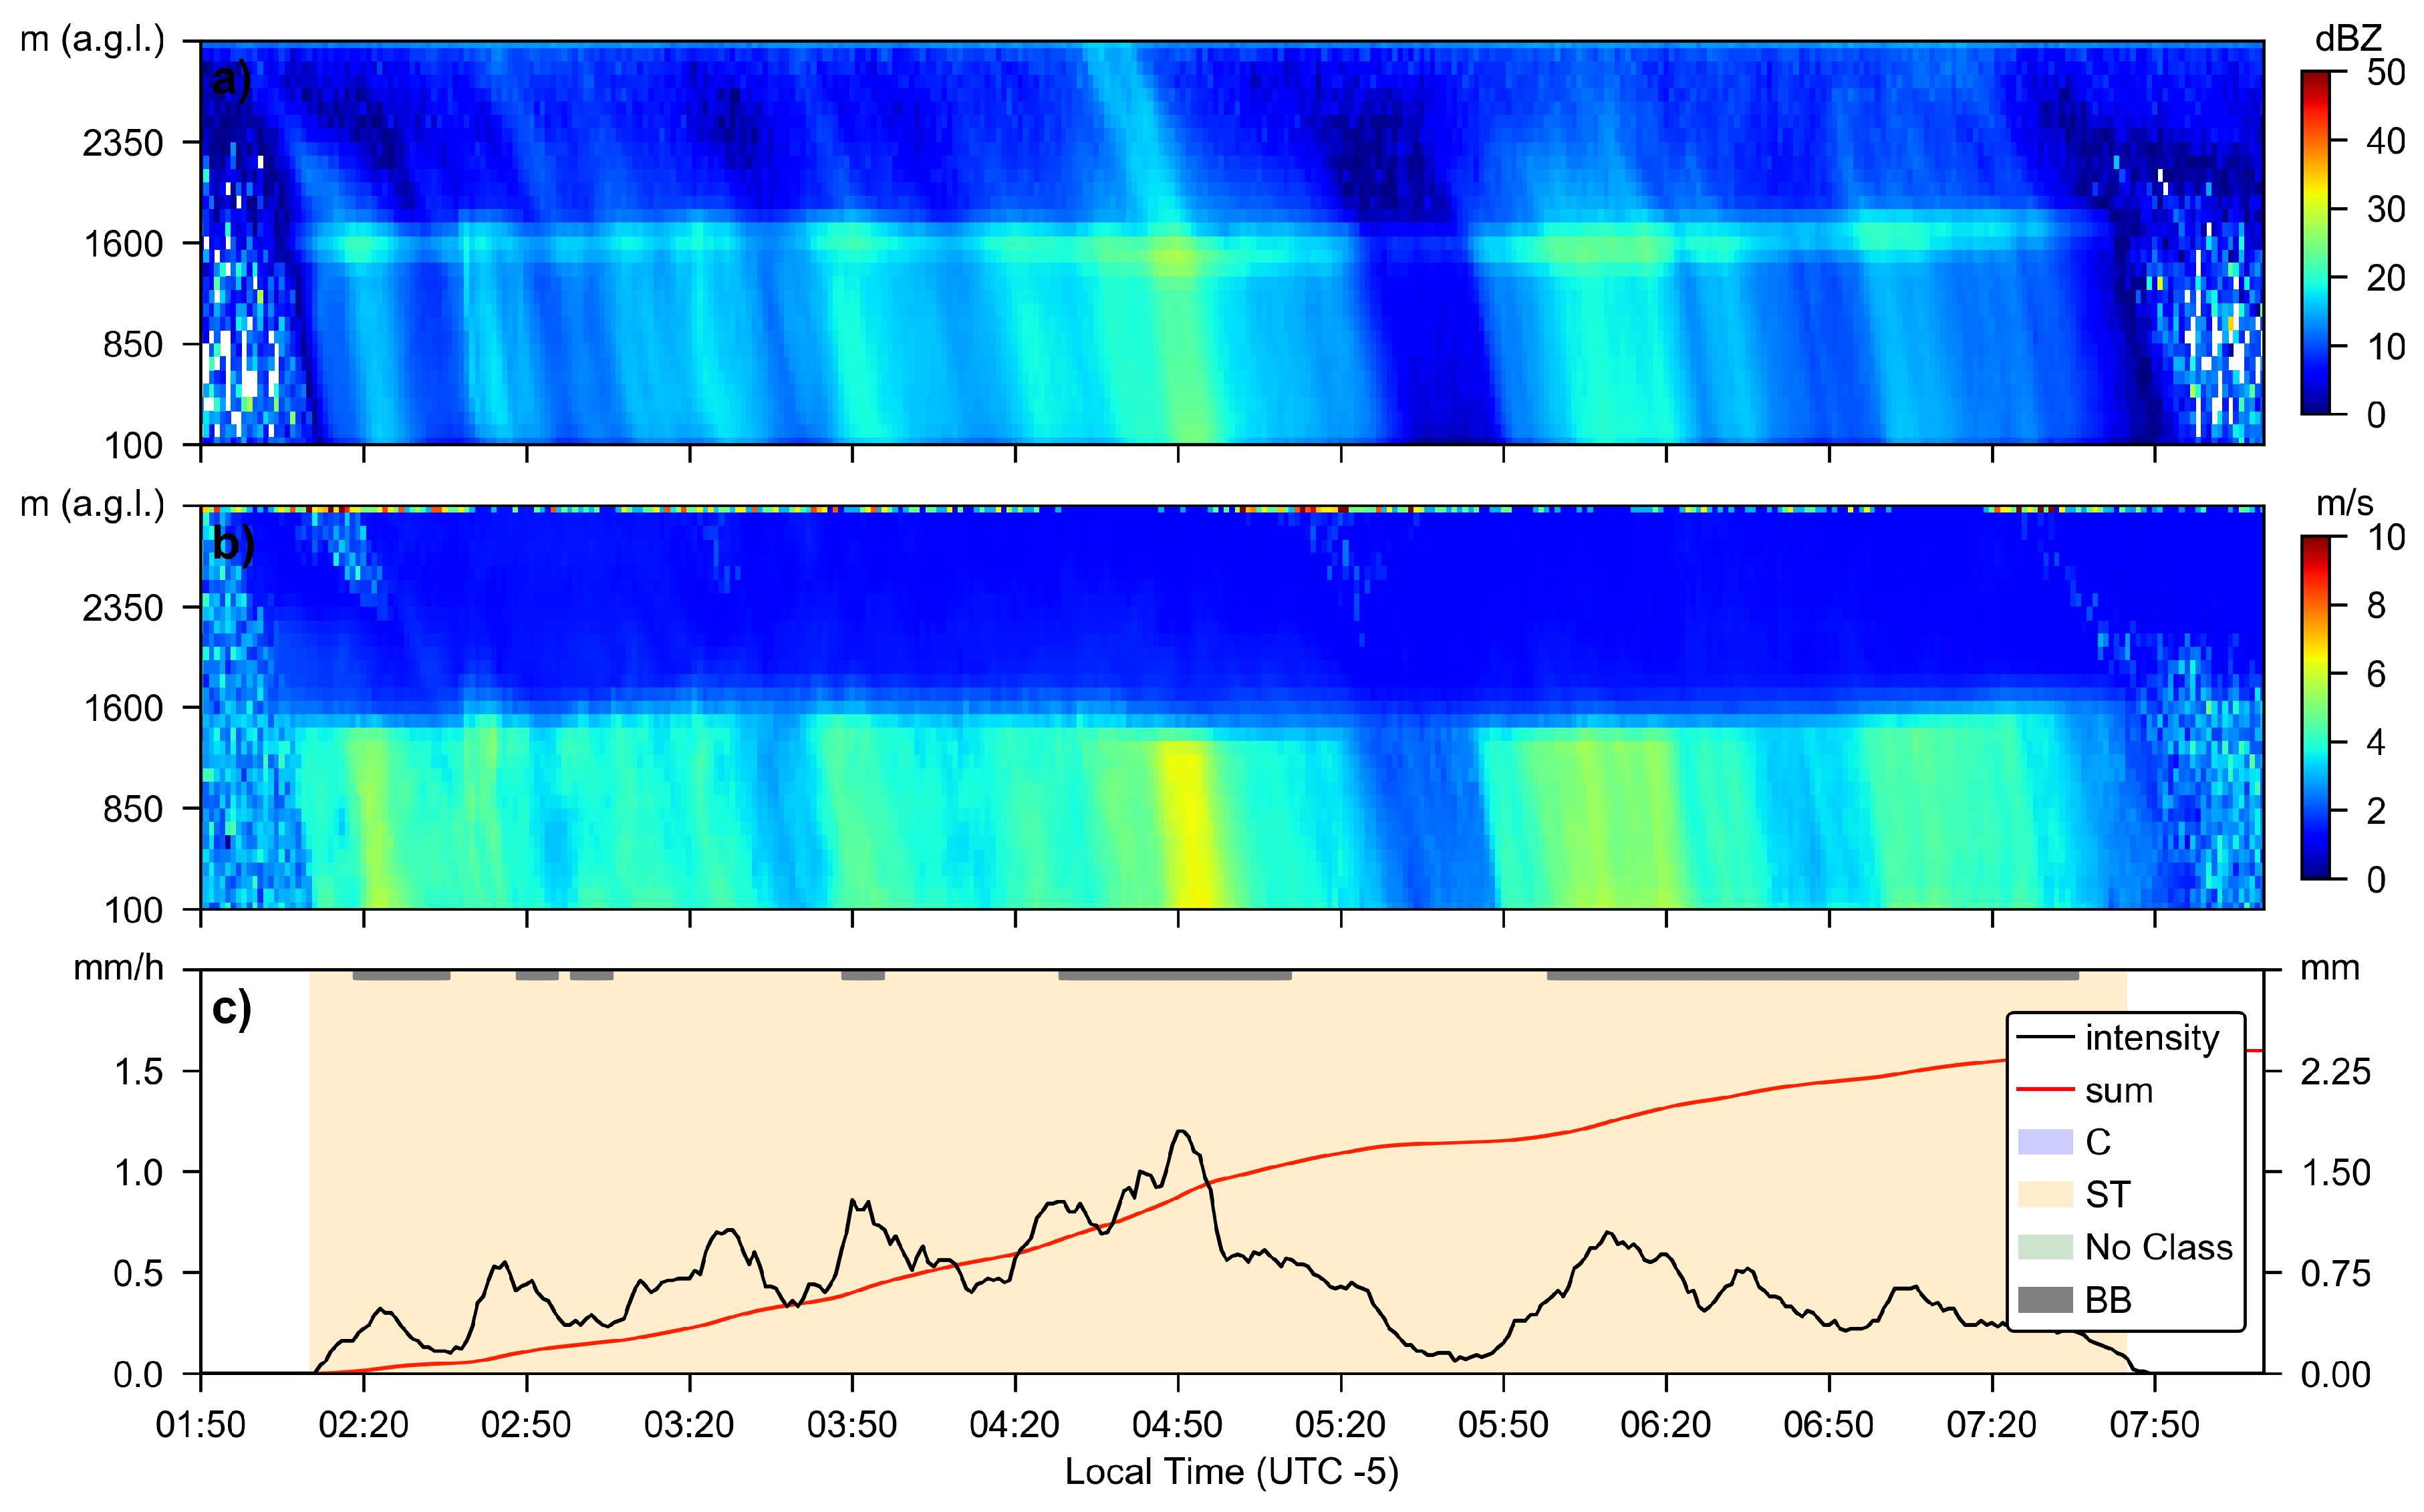
Figure 8). Afternoon precipitation events often have a convective onset with high rainfall intensities and then show a transition towards stratiform characteristics, which often have longer durations than the convective phase. This is also the reason for the high overall proportion of approximately 90% stratiform precipitation in our classification at both sites. Low intensity stratiform rainfall events without deep convection features occurred in the afternoon hours during the rainy season as well, but were less frequent. The nighttime events typically showed purely stratiform features.
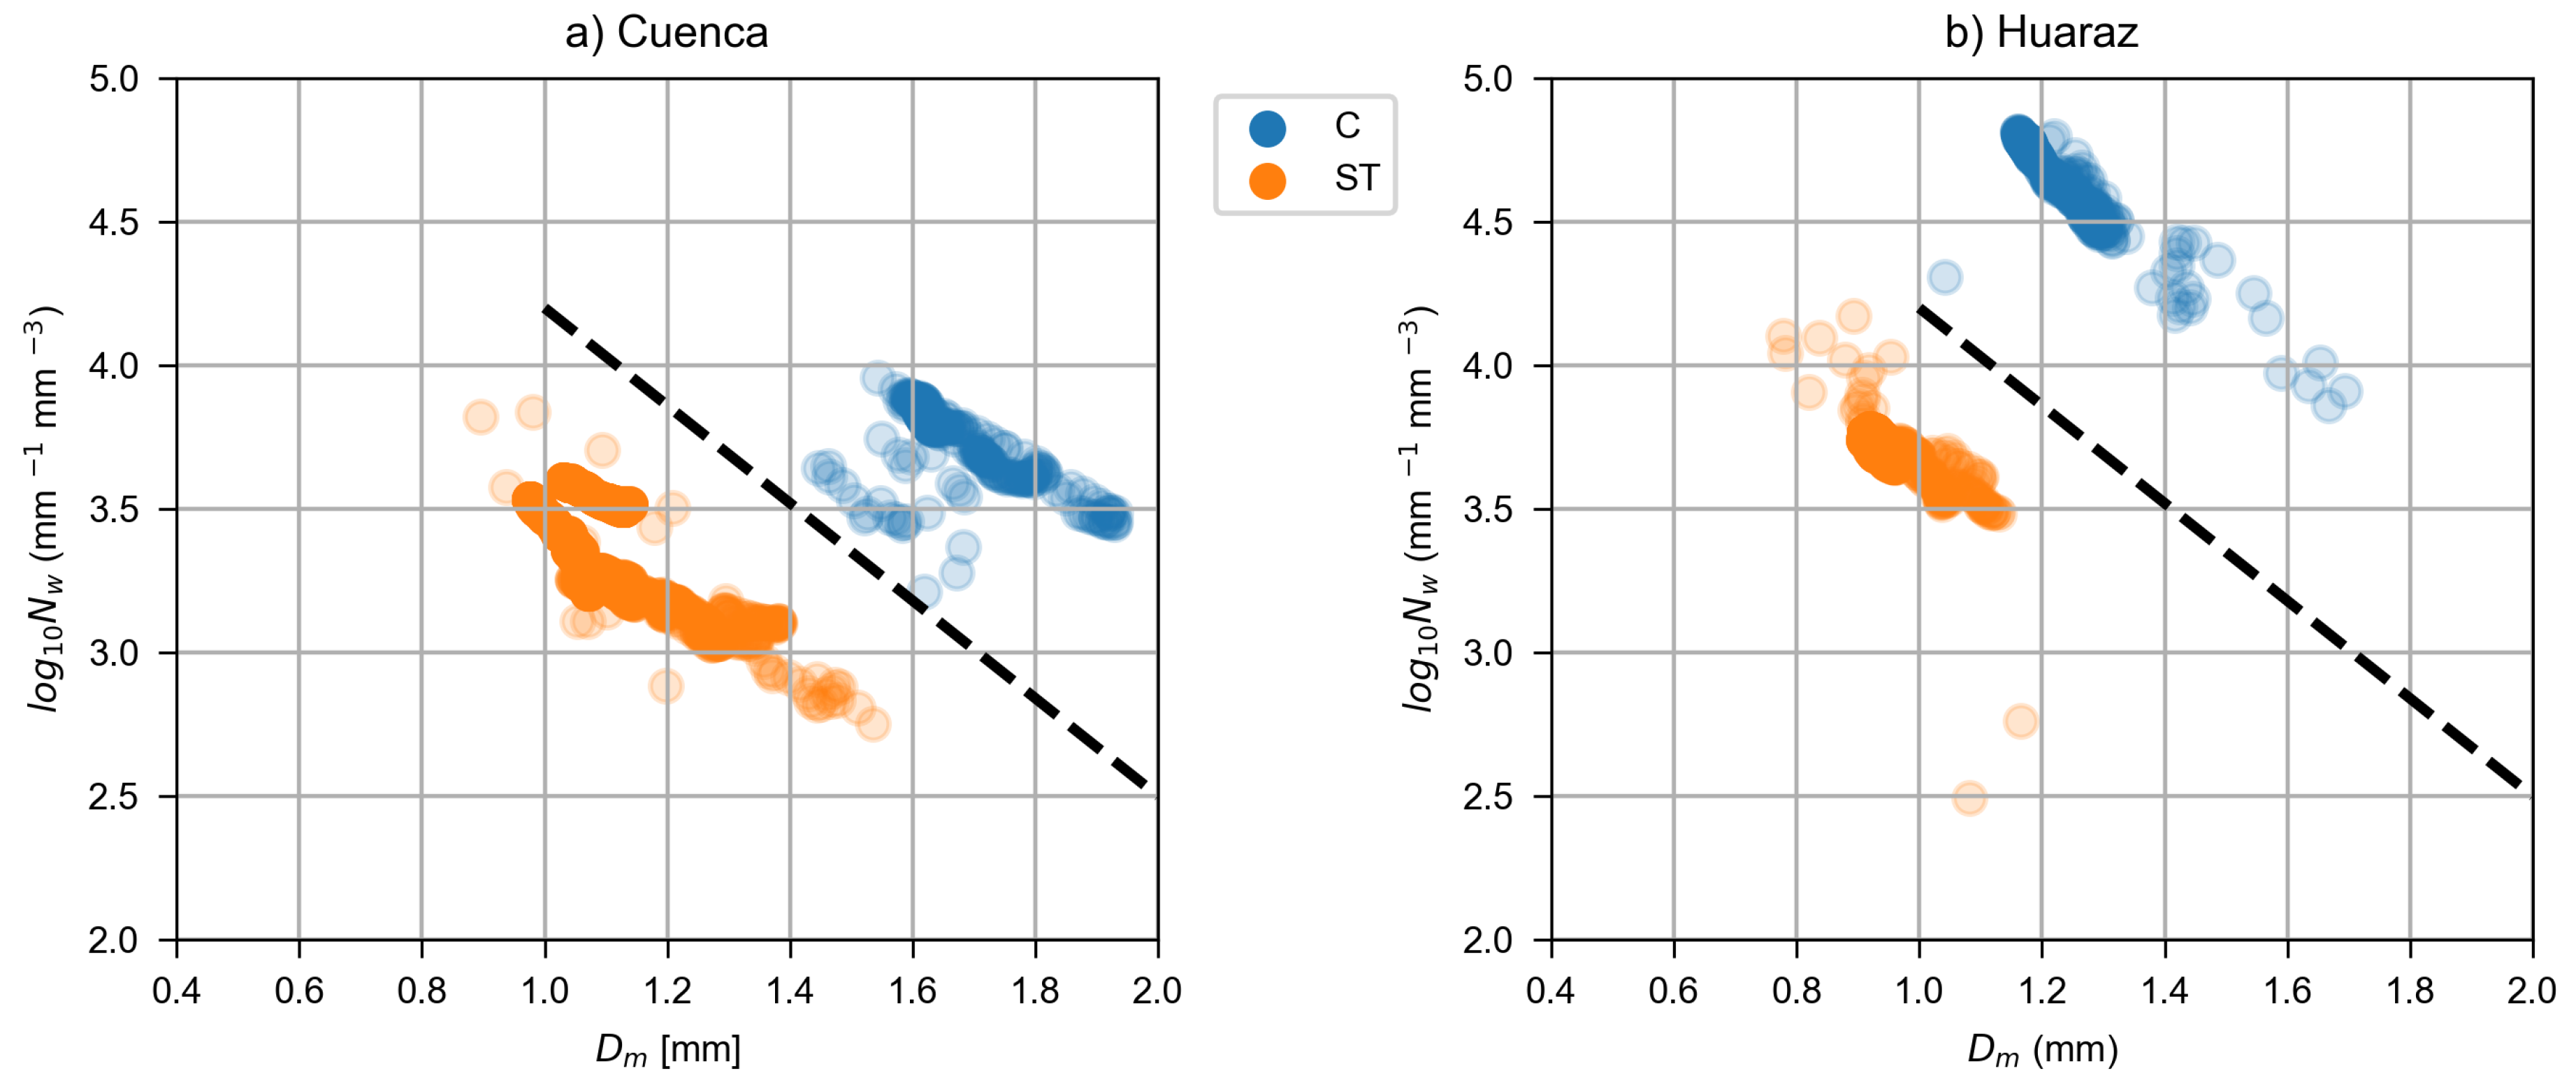
The analysis of the DSD in the D m / N w domain indicates that the two precipitation types that we classified according to the FRS showedefined clusters and can thus be distinguished well. Furthermore, these results are consistent with the study by Bringi et al. [44], who investigated drop size spectra in different climate zones. The DSD of stratiform precipitation at the sites in Cuenca and Huaraz are below the line that Bringi et al. [44] used to characterize and separate stratiform and convective precipitation based on their average D m and l o g 10 N w values. Thus, our results confirm the stratiform classification of the FRS. Likewise, drop spectra of convective precipitation have a larger average D m and a larger number of drops, although the differences between the two sites are more pronounced in this case. The reasons for these differences in the convective drop size spectra require further investigation.

6. Conclusions

Our study provides some first insights into the temporal and micro-physical precipitation characteristics in data scarce regions with complex topography, which holds especially for the site in Huaraz, Peru, where no detailed studies on precipitation had existed so far. The results from our study lead to a better understanding of precipitation dynamics in mountainous areas where ground observations are generally sparse. The added value of our study is the high temporal resolution. Many events are of a short duration and can therefore not be captured or resolved using remote sensing data products such as GPM IMERG.
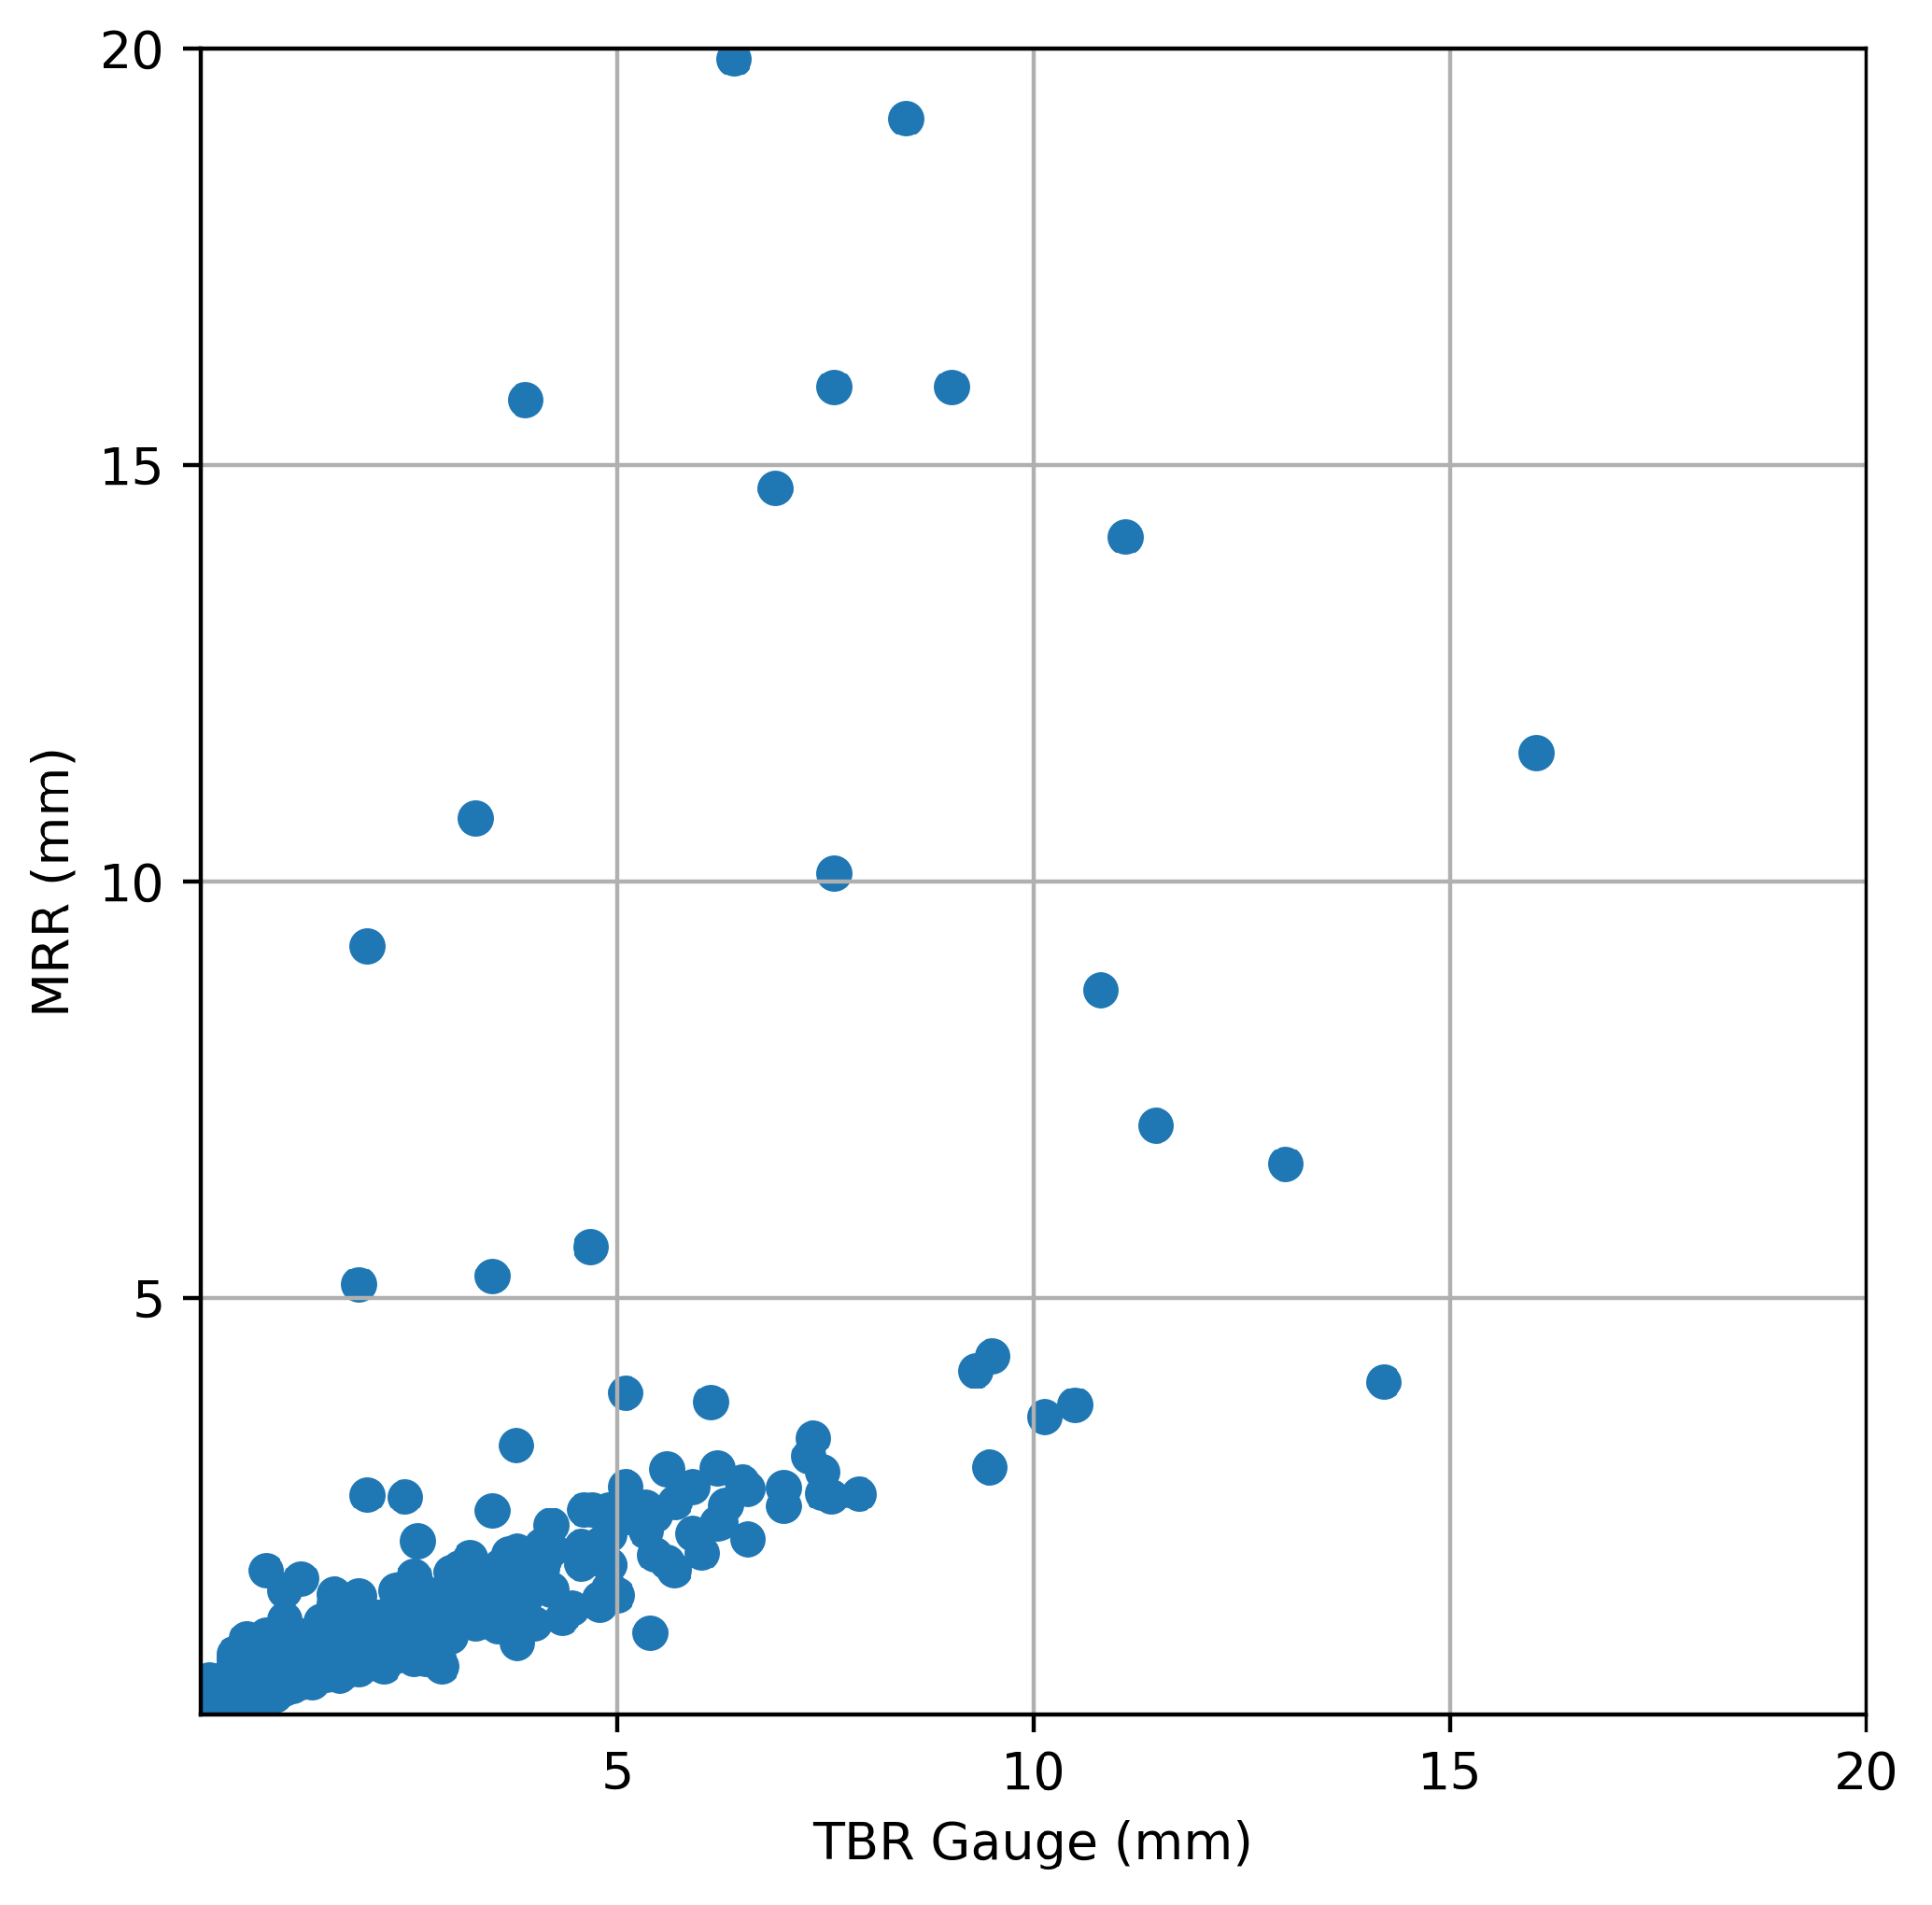
A remaining challenge is the quantification of rainfall amounts from the MRR, which is often associated with high uncertainties. A comparison of rainfall totals between the MRR and a collocated TBR gauge in Cuenca showed that the MRR has a tendency to underestimate precipitation totals at that site, even for low precipitation sums. Incorrect MRR retrievals can occur in cases of strong vertical air motion, which is common during strong convection and leads to an aliasing of the Doppler spectra, as described in Tridon et al. [49]. Updrafts/downdrafts during such events result in an over-/under-estimation of the MRR rain rates [33]. Post-processing of the MRR data as done, e.g., by Maahn and Kollias [50] could help to identify such erroneous MRR data retrievals and lead to an improvement of the MRR data quality. This would be a first step towards a better quantification of the MRR rain rates. On the other hand, the majority of precipitation was stratiform, where such effects as described above are unlikely to occur. A specific calibration of the MRR to a collocated rain gauge as suggested by Prat and Barros [51] could therefore be conducted. However, due to the absence of any reliable nearby in situ measurement, such a procedure is not (yet) possible for the Huaraz MRR.

Author Contributions

Conceptualization, methodology, and visualization, J.S. and K.T.; data curation, R.F., R.C., J.O.-A., and C.F.; writing, original draft preparation, J.S. and K.T.; writing, review and editing, J.S., K.T., J.O.-A., J.B., and C.H.; funding acquisition, J.S. and C.H.

Funding

The research in Peru was conducted within the joint Swiss-German research project “Integrated Water Resources Modeling: Future Risks and Adaptation Strategies - a Case Study in the Andes of Peru” funded by the Swiss National Science Foundation (SNF; 205121L166272) and the German Research Foundation (Deutsche Forschungsgemeinschaft (DFG); BA 1150/21-1). In Ecuador, the research was part of the project “Desarrollo de modelos para pronóstico hidrológico a partir de datos de radar meteorológico en Cuencas de montaña” funded by a grant from the Dirección de Investigación de la Universidad de Cuenca (DIUC) and the Empresa Pública Municipal de Telecomunicaciones, Agua Potable, Alcantarillado y Saneamiento de Cuenca (ETAPA-EP).

Acknowledgments

The authors would like to thank Danny Robles Sanchez and Dayana Lucero Acuña Valverde from the Universidad Nacional Santiago Antúnez de Mayolo in Huaraz for the maintenance of the MRR. Furthermore, we would like to thank the three anonymous reviewers whose comments helped to improve the manuscript.

Conflicts of Interest

The authors declare no conflict of interest.

References

  1. Bradley, R.S.; Vuille, M.; Diaz, H.F.; Vergara, W. Threats to Water Supplies in the Tropical Andes. Science 2006, 312, 1755–1756. [Google Scholar] [CrossRef] [PubMed]
  2. Drenkhan, F.; Carey, M.; Huggel, C.; Seidel, J.; Oré, M.T. The changing water cycle: climatic and socioeconomic drivers of water-related changes in the Andes of Peru. Wiley Interdiscip. Rev. Water 2015, 2, 715–733. [Google Scholar] [CrossRef]
  3. Andres, N.; Vegas Galdos, F.; Lavado Casimiro, W.S.; Zappa, M. Water resources and climate change impact modelling on a daily time scale in the Peruvian Andes. Hydrol. Sci. J. 2014, 59, 2043–2059. [Google Scholar] [CrossRef] [Green Version]
  4. Schauwecker, S.; Rohrer, M.; Acuña, D.; Cochachin, A.; Dávila, L.; Frey, H.; Giráldez, C.; Gómez, J.; Huggel, C.; Jacques-Coper, M.; et al. Climate trends and glacier retreat in the Cordillera Blanca, Peru, revisited. Glob. Planet. Change 2014, 119, 85–97. [Google Scholar] [CrossRef]
  5. Mark, B.G.; Bury, J.; McKenzie, J.M.; French, A.; Baraer, M. Climate change and tropical Andean glacier recession: evaluating hydrologic changes and livelihood vulnerability in the Cordillera Blanca, Peru. Ann. Assoc. Am. Geogr. 2010, 100, 794–805. [Google Scholar] [CrossRef]
  6. Vuille, M.; Francou, B.; Wagnon, P.; Juen, I.; Kaser, G.; Mark, B.G.; Bradley, R.S. Climate change and tropical Andean glaciers: Past, present and future. Earth-Sci. Rev. 2008, 89, 79–96. [Google Scholar] [CrossRef] [Green Version]
  7. Perry, L.B.; Seimon, A.; Kelly, G.M. Precipitation delivery in the tropical high Andes of southern Peru: New findings and paleoclimatic implications. Int. J. Climatol. 2014, 34, 197–215. [Google Scholar] [CrossRef]
  8. Endries, J.L.; Perry, L.B.; Yuter, S.E.; Seimon, A.; Andrade-Flores, M.; Winkelmann, R.; Quispe, N.; Rado, M.; Montoya, N.; Velarde, F.; et al. Radar-Observed Characteristics of Precipitation in the Tropical High Andes of Southern Peru and Bolivia. J. Appl. Meteorol. Climatol. 2018, 57, 1441–1458. [Google Scholar] [CrossRef]
  9. Hunziker, S.; Gubler, S.; Calle, J.; Moreno, I.; Andrade, M.; Velarde, F.; Ticona, L.; Carrasco, G.; Castellón, Y.; Oria, C.; et al. Identifying, attributing, and overcoming common data quality issues of manned station observations. Int. J. Climatol. 2017, 37, 4131–4145. [Google Scholar] [CrossRef]
  10. Schwarb, M.; Acuña, D.; Konzelmann, T.; Rohrer, M.; Salzmann, N.; Serpa Lopez, B.; Silvestre, E. A data portal for regional climatic trend analysis in a Peruvian High Andes region. Adv. Sci. Res. 2011, 6, 219–226. [Google Scholar] [CrossRef]
  11. Bendix, J.; Rollenbeck, R.; Reudenbach, C. Diurnal patterns of rainfall in a tropical Andean valley of southern Ecuador as seen by a vertically pointing K-band Doppler radar. Int. J. Climatol. 2006, 26, 829–846. [Google Scholar] [CrossRef]
  12. Trachte, K.; Rollenbeck, R.; Bendix, J. Nocturnal convective cloud formation under clear-sky conditions at the eastern Andes of south Ecuador. J. Geophys. Res. Atmos. (1984–2012) 2010, 115, D24. [Google Scholar] [CrossRef] [Green Version]
  13. Muñoz, P.; Célleri, R.; Feyen, J. Effect of the Resolution of Tipping-Bucket Rain Gauge and Calculation Method on Rainfall Intensities in an Andean Mountain Gradient. Water 2016, 8, 534. [Google Scholar] [CrossRef] [Green Version]
  14. Orellana-Alvear, J.; Célleri, R.; Rollenbeck, R.; Bendix, J. Analysis of Rain Types and Their Z–R Relationships at Different Locations in the High Andes of Southern Ecuador. J. Appl. Meteorol. Climatol. 2017, 56, 3065–3080. [Google Scholar] [CrossRef]
  15. Rollenbeck, R.; Bendix, J. Rainfall distribution in the Andes of southern Ecuador derived from blending weather radar data and meteorological field observations. Atmos. Res. 2011, 99, 277–289. [Google Scholar] [CrossRef]
  16. Bendix, J.; Fries, A.; Zárate, J.; Trachte, K.; Rollenbeck, R.; Pucha-Cofrep, F.; Paladines, R.; Palacios, I.; Orellana, J.; Oñate-Valdivieso, F.; et al. RadarNet-Sur First Weather Radar Network in Tropical High Mountains. Bull. Am. Meteorol. Soc. 2017, 98, 1235–1254. [Google Scholar] [CrossRef]
  17. Guallpa, M.; Orellana-Alvear, J.; Bendix, J. Tropical Andes Radar Precipitation Estimates Need High Temporal and Moderate Spatial Resolution. Water 2019, 11, 1038. [Google Scholar] [CrossRef] [Green Version]
  18. Orellana-Alvear, J.; Célleri, R.; Rollenbeck, R.; Bendix, J. Optimization of X-Band Radar Rainfall Retrieval in the Southern Andes of Ecuador Using a Random Forest Model. Remote Sens. 2019, 11, 1632. [Google Scholar] [CrossRef] [Green Version]
  19. Trachte, K.; Seidel, J.; Figueroa, R.; Otto, M.; Bendix, J. Cross-Scale Precipitation Variability in a Semiarid Catchment Area on the Western Slopes of the Central Andes. J. Appl. Meteorol. Climatol. 2018, 57, 675–694. [Google Scholar] [CrossRef]
  20. Mourre, L.; Condom, T.; Junquas, C.; Lebel, T.; Sicart, J.E.; Figueroa, R.; Cochachin, A. Spatio-temporal assessment of WRF, TRMM and in situ precipitation data in a tropical mountain environment (Cordillera Blanca, Peru). Hydrol. Earth Syst. Sci. 2016, 20, 125–141. [Google Scholar] [CrossRef] [Green Version]
  21. Silva Dias, P.L.; Schubert, W.H.; DeMaria, M. Large scale response of the tropical atmosphere to transient convection. J. Atmos. Sci. 1983, 40, 2689–2707. [Google Scholar] [CrossRef]
  22. Aceituno, P. On the functioning of the Southern Oscillation in the South American sector. Part I: Surface climate. Mon. Weather Rev. 1988, 116, 505–524. [Google Scholar] [CrossRef] [Green Version]
  23. Lenters, J.; Cook, K. On the origin of the Bolivian high and related circulation features of the South American climate. J. Atmos. Sci. 1997, 54, 656–678. [Google Scholar] [CrossRef]
  24. Vera, C.; Higgins, W.; Amador, J.; Ambrizzi, T.; Garreaud, R.; Gochis, D.; Gutzler, D.; Lettenmaier, D.; Marengo, J.; Mechoso, C.; et al. Toward a unified view of the American monsoon systems. J. Clim. 2006, 19, 4977–5000. [Google Scholar] [CrossRef]
  25. Poveda, G.; Waylen, P.R.; Pulwarty, R.S. Annual and inter-annual variability of the present climate in northern South America and southern Mesoamerica. Palaeogeogr. Palaeoclimatol. Palaeoecol. 2006, 234, 3–27. [Google Scholar] [CrossRef]
  26. Campozano, L.; Trachte, K.; Célleri, R.; Samaniego, E.; Bendix, J.; Albuja, C.; Mejia, J.F. Climatology and Teleconnections of Mesoscale Convective Systems in an Andean Basin in Southern Ecuador: The Case of the Paute Basin. Adv. Meteorol. 2018, 2018, 1–13. [Google Scholar] [CrossRef] [PubMed]
  27. Rodwell, M.J.; Hoskins, B.J. Subtropical Anticyclones and Summer Monsoons. J. Clim. 2001, 14, 3192–3211. [Google Scholar] [CrossRef] [Green Version]
  28. Garreaud, R.D. The Andes climate and weather. Adv. Geosci. 2009, 22, 3–11. [Google Scholar] [CrossRef] [Green Version]
  29. Córdova, M.; Célleri, R.; Shellito, C.J.; Orellana-Alvear, J.; Abril, A.; Carrillo-Rojas, G. Near-Surface Air Temperature Lapse Rate Over Complex Terrain in the Southern Ecuadorian Andes: Implications for Temperature Mapping. Arctic Antarct. Alpine Res. 2016, 48, 673–684. [Google Scholar] [CrossRef] [Green Version]
  30. SENAMHI. Available online: https://www.senamhi.gob.pe/ (accessed on 10 September 2019).
  31. Aybar, C.; Fernández, C.; Huerta, A.; Lavado, W.; Vega, F.; Felipe-Obando, O. Construction of a high-resolution gridded rainfall dataset for Peru from 1981 to the present day. Hydrol. Sci. J. 2019, 1–16. [Google Scholar] [CrossRef]
  32. Peters, G.; Fischer, B.; Münster, H.; Clemens, M.; Wagner, A. Profiles of raindrop size distributions as retrieved by microrain radars. J. Appl. Meteorol. 2005, 44, 1930–1949. [Google Scholar] [CrossRef]
  33. METEK. MRR Physical Basics, Valid for MRR Service Version 5.2.0.9; Technical Manual; METEK: Elmshorn, Germany, 2015. [Google Scholar]
  34. Llasat, M.C. An objective classification of rainfall events on the basis of their convective features: application to rainfall intensity in the northeast of spain. Int. J. Climatol. 2001, 21, 1385–1400. [Google Scholar] [CrossRef]
  35. Houze, R.A. (Ed.) Cloud Dynamics; International geophysics series, 53; Academic Press: San Diego, CA, USA, 1993. [Google Scholar]
  36. Biggerstaff, M.I.; Listemaa, S.A. An Improved Scheme for Convective/Stratiform Echo Classification Using Radar Reflectivity. J. Appl. Meteorol. 2000, 39, 2129–2150. [Google Scholar] [CrossRef]
  37. Tokay, A.; Short, D.A. Evidence from Tropical Raindrop Spectra of the Origin of Rain from Stratiform versus Convective Clouds. J. Appl. Meteorol. 1996, 35, 355–371. [Google Scholar] [CrossRef] [Green Version]
  38. Caracciolo, C.; Porcù, F.; Prodi, F. Precipitation classification at mid-latitudes in terms of drop size distribution parameters. Adv. Geosci. 2008, 16, 11–17. [Google Scholar] [CrossRef] [Green Version]
  39. Lam, H.Y.; Din, J.; Jong, S.L. Statistical and Physical Descriptions of Raindrop Size Distributions in Equatorial Malaysia from Disdrometer Observations. Adv. Meteorol. 2015, 2015, 1–14. [Google Scholar] [CrossRef]
  40. Thurai, M.; Gatlin, P.; Bringi, V. Separating stratiform and convective rain types based on the drop size distribution characteristics using 2D video disdrometer data. Atmos. Res. 2016, 169, 416–423. [Google Scholar] [CrossRef]
  41. White, A.B.; Neiman, P.J.; Ralph, F.M.; Kingsmill, D.E.; Persson, P.O.G. Coastal Orographic Rainfall Processes Observed by Radar during the California Land-Falling Jets Experiment. J. Hydrometeorol. 2003, 4, 264–282. [Google Scholar] [CrossRef]
  42. Das, S.; Shukla, A.K.; Maitra, A. Investigation of vertical profile of rain microstructure at Ahmedabad in Indian tropical region. Adv. Space Res. 2010, 45, 1235–1243. [Google Scholar] [CrossRef]
  43. Kunhikrishnan, P.K.; Sivaraman, M.R.; Kumar, N.V.P.K.; Alappatu, D. Rain Observations with Micro Rain Radar (MRR) over a Tropical Station. AIP Conf. Proc. 2007, 923, 143. [Google Scholar] [CrossRef]
  44. Bringi, V.N.; Chandrasekar, V.; Hubbert, J.; Gorgucci, E.; Randeu, W.L.; Schoenhuber, M. Raindrop Size Distribution in Different Climatic Regimes from Disdrometer and Dual-Polarized Radar Analysis. J. Atmos. Sci. 2003, 60, 354–365. [Google Scholar] [CrossRef]
  45. Trachte, K.; Nauss, T.; Bendix, J. The Impact of Different Terrain Configurations on the Formation and Dynamics of Katabatic Flows: Idealised Case Studies. Bound.-Layer Meteorol. 2009, 134, 307–325. [Google Scholar] [CrossRef] [Green Version]
  46. Huffman, G.J.; Stocker, E.F.; Bolvin, D.T.; Nelkin, E.J.; Jackson, T. GPM IMERG Final Precipitation L3 Half Hourly 0.1 degree x 0.1 degree V06, Greenbelt, MD, Goddard Earth Sciences Data and Information Services Center (GES DISC). Available online: https://0-doi-org.brum.beds.ac.uk/10.5067/GPM/IMERG/3B-HH/06 (accessed on 31 July 2019).
  47. Romatschke, U.; Houze, R.A. Extreme Summer Convection in South America. J. Clim. 2010, 23, 3761–3791. [Google Scholar] [CrossRef]
  48. Bendix, J.; Trachte, K.; Cermak, J.; Rollenbeck, R.; Nauß, T. Formation of convective clouds at the foothills of the tropical eastern Andes (south Ecuador). J. Appl. Meteorol. Climatol. 2009, 48, 1682–1695. [Google Scholar] [CrossRef]
  49. Tridon, F.; Van Baelen, J.; Pointin, Y. Aliasing in Micro Rain Radar data due to strong vertical winds. Geophys. Res. Lett. 2011, 38, L02804-1–L02804-4. [Google Scholar] [CrossRef]
  50. Maahn, M.; Kollias, P. Improved Micro Rain Radar snow measurements using Doppler spectra post-processing. Atmos. Meas. Tech. 2012, 5, 2661–2673. [Google Scholar] [CrossRef] [Green Version]
  51. Prat, O.P.; Barros, A.P. Ground observations to characterize the spatial gradients and vertical structure of orographic precipitation—Experiments in the inner region of the Great Smoky Mountains. J. Hydrol. 2010, 391, 141–156. [Google Scholar] [CrossRef]
Figure 1. Topography of the main study area in the Tropical Andes; the diamonds indicate the location of the Micro-Rain Radars (MRR) in Cuenca (Ecuador) and Huaraz (Peru), respectively. In the upper right corner, the schematic overview shows the terrain above the 800 m height level and the main large scale circulation patterns controlling the precipitation in Cuenca and Huaraz during December–February (DJF, blue) and June–August (JJA, red): Inter-Tropical Convergence Zone (ITCZ, dot-dot-dashed line), South Pacific High Pressure (SPH, dot-dashed line), Bolivian High (BH, solid line).
Remotesensing 11 02985 g001
Figure 2. Scatterplot between the hourly precipitation amounts recorded by the MRR and the collocated tipping bucket rain (TBR) gauge in Cuenca.
Remotesensing 11 02985 g002
Figure 3. Diurnal rain intensities (mm h 1 ) across the two year observational period for the Cuenca study site.
Remotesensing 11 02985 g003
Figure 4. As Figure 3, but for the Huaraz study site. The grey lines indicate data gaps.
Remotesensing 11 02985 g004
Figure 5. Occurrence and duration of identified precipitation events at Cuenca (blue) and Huaraz (orange) for the study period February 2017 to January 2019: (a) per month, (b) for nighttime and daytime events. n refers to the corresponding number of events at both sites.
Remotesensing 11 02985 g005
Figure 6. Event with convective (C) features at Huaraz during late afternoon on 3 February 2017: (a) vertical radar reflectivity (dBZ), (b) vertical fall velocity (m s 1 ), (c) precipitation intensity (mm h 1 , black line), cumulative precipitation sum (mm, red line), precipitation type classification based on the fuzzy rule system (FRS) (shaded colors). Additionally, the gray bars in panel (c) show detected bright bands (BB) from the gradient based approach by White et al. [41].
Remotesensing 11 02985 g006
Figure 7. As Figure 6, but for a mixed convective/stratiform event in Cuenca on 28 December 2017.
Remotesensing 11 02985 g007
Figure 8. As Figure 6, but for a stratiform precipitation event in Cuenca on 31 March 2018.
Remotesensing 11 02985 g008
Figure 9. As Figure 6, but for a stratiform precipitation at Huaraz during nighttime on 8 March 2017.
Remotesensing 11 02985 g009
Figure 10. Scatterplot showing the relation of the mass weighted mean diameter ( D m ) and the normalized intercept parameter ( N w ) of the drop size distributions for convective (C) and stratiform (ST) precipitation in Huaraz. The dashed line shows the fit for stratiform rain according to Bringi et al. [44].
Remotesensing 11 02985 g010
Table 1. Data gaps in the MRR rain rates before and after infilling.
Location% Gaps Original Data% Gaps after Infilling
Cuenca10.00.1
Huaraz1.41.3
Table 2. Fuzzy rule system for the trapezoidal (T) membership functions.
Rule i μ a , i μ b , i μ c , i
C ( 2 , 4 , 10 , 10 ) T ( 4 , 6 , 10 , 10 ) T ( 4 , 8 , , ) T
ST ( 0 , 0 , 4 , 6 ) T ( 0 , 0 , 4 , 8 ) T ( 0 , 0 , 4 , 8 ) T
Table 3. Occurrences (hours) of convective and stratiform precipitation in Huaraz and Cuenca based on the FRS. Daytime is defined from 9:00 to 21:00 local time (LT).
CuencaHuaraz
Precipitation TypeHours%DayNightHours%DayNight
C37.1 h3.4%96.2%3.8%68.8 h6.4%98.5%1.5%
ST606.8 h92.5%61.6%38.4%965.3 h90.2%72.7%27.3%
No Class12.0 h1.8%83.3%16.7%35.5 h3.3%88.7%11.3%
Table 4. As Table 3, but based on the classification using the standard deviation of rain rates.
CuencaHuaraz
Precipitation TypeHours%DayNightHours%DayNight
C36.6 h5.6%95.0%5.0%72.8 h6.8%98.5%1.5%
ST619.1 h94.4%62.1%37.9%996.8 h93.2%73.2%26.8%
Table 5. Comparison of the results FRS and the gradient based bright band detection algorithm.
CuencaHuaraz
Precipitation TypeNo BBBBNo BBBB
C29.3 h7.7 h61.5 h7.8 h
ST345.1 h204.6 h478.3 h496.7 h
No Class8.4 h3.0 h19.1 h16.5 h
Table 6. Mean D m and l o g 10 N w and the standard deviations for convective (C) and stratiform (ST) precipitation in Cuenca and Huaraz.
CuencaHuaraz
Event Type D m (mm) log 10 N w (mm 1 m 3 ) D m log 10 N w (mm 1 m 3 )
C1.66 ± 0.083.76 ± 0.121.21 ± 0.074.69 ± 0.14
ST1.07 ± 0.063.46 ± 0.130.93 ± 0.023.74 ± 0.03

